1. Introduction
A significant condition of environmental pollution is ambient air pollution which derives primarily from energy usage and the production of energy from the facilities [
1]. The first author of this article witnessed the higher number of motor vehicles in the urban environment as one of the primary reasons for increased air pollution during the day. Air pollution harms human health and well-being, "increasing mortality and shortening life expectancy" [
2,
3,
4]. Likewise, air pollution negatively affects other living bring in nature through various indirect and direct effects [
5]. Therefore, reducing air pollution is essential for all living being. One type of air pollution that causes the most significant health threat is ambient fine particulate matter (PM2.5) [
6]. "The PM2.5 concentration guidelines established by the World Health Organization (WHO) for humans" [
7] are overreached within many regions in the world, particularly within India, China, and Southeast Asia [
8]. These countries and regions are encountering the most rapid gains in PM2.5 concentrations as the population increases [
8].
PM2.5 can enter human and birds’ respiratory and cardiovascular systems [
9], impairing pulmonary function [
10]. Humans and birds in regions with high PM2.5 concentrations have superior "particle retention in their lungs, resulting in adverse effects across multiple tissue types" [
11]. Air pollution can generally cause illnesses such as respiratory distress in birds, leading to changes in behavior, enhancing immunosuppression, elevating stress levels, and lowering reproductive success [
12]. The effects of "inhalation exposure can scale up to affect species richness, diversity, and population density within bird communities" [
12]. "Most of the world’s migrating birds are nocturnal migrants" [
13], and "many of these species encounter artificial light at night (ALAN) during migration" [
14]. ALAN is the primary source and is densely populated with high-intensity lighting in the urban area [
15]. "The nocturnally migrating birds are attracted to urban areas during migratory flight through the influence of ALAN" [
16]. The first author of this article witnessed thousands of migrating birds in the City of Toronto, where the urban environment provides a welcome place for nocturnally migrating birds.
It is well-known that human activities are very high in urban areas than in rural areas at night. The higher number of Light sources in Urban areas with higher intensity light sources provide higher lighting levels than in rural areas [
17]. Higher lighting invites more people to urban areas and nocturnally migrating birds [
18,
19]. It is important to note that "Urban areas are also a significant source of air pollution" [
8], and "urban areas with larger populations tend to generate more ALAN" [
15] and have lower air quality [
20]. Many people and nocturnally migrating birds are attracted to urban Toronto by the influence of ALAN, potentially increasing their exposure to PM2.5 concentrations.
During birds’ nighttime migration, people can observe that the migrating birds’ density typically increases between 200 and 600 meters above ground level, with some birds resettling above 1,000 meters from ground level [
21,
22]. The PM2.5 concentrations are the highest close to ground level and decrease with increasing height from the ground level, especially at night, when the environment is more stable, with the highest concentrations typically occurring 1,000 meters below the ground level [
23,
24]. The first author witnessed that the City of Toronto metropolitan area, Canada, never sleeps. The people’s activities in the nocturnal urban area are usually higher than in rural areas, including the nighttime. The migrating birds may have their "breeding and non-breeding settings" during stopovers in urban areas and "spend most of the time at or near ground level, where PM2.5 concentrations are probably at their highest levels" [
25].
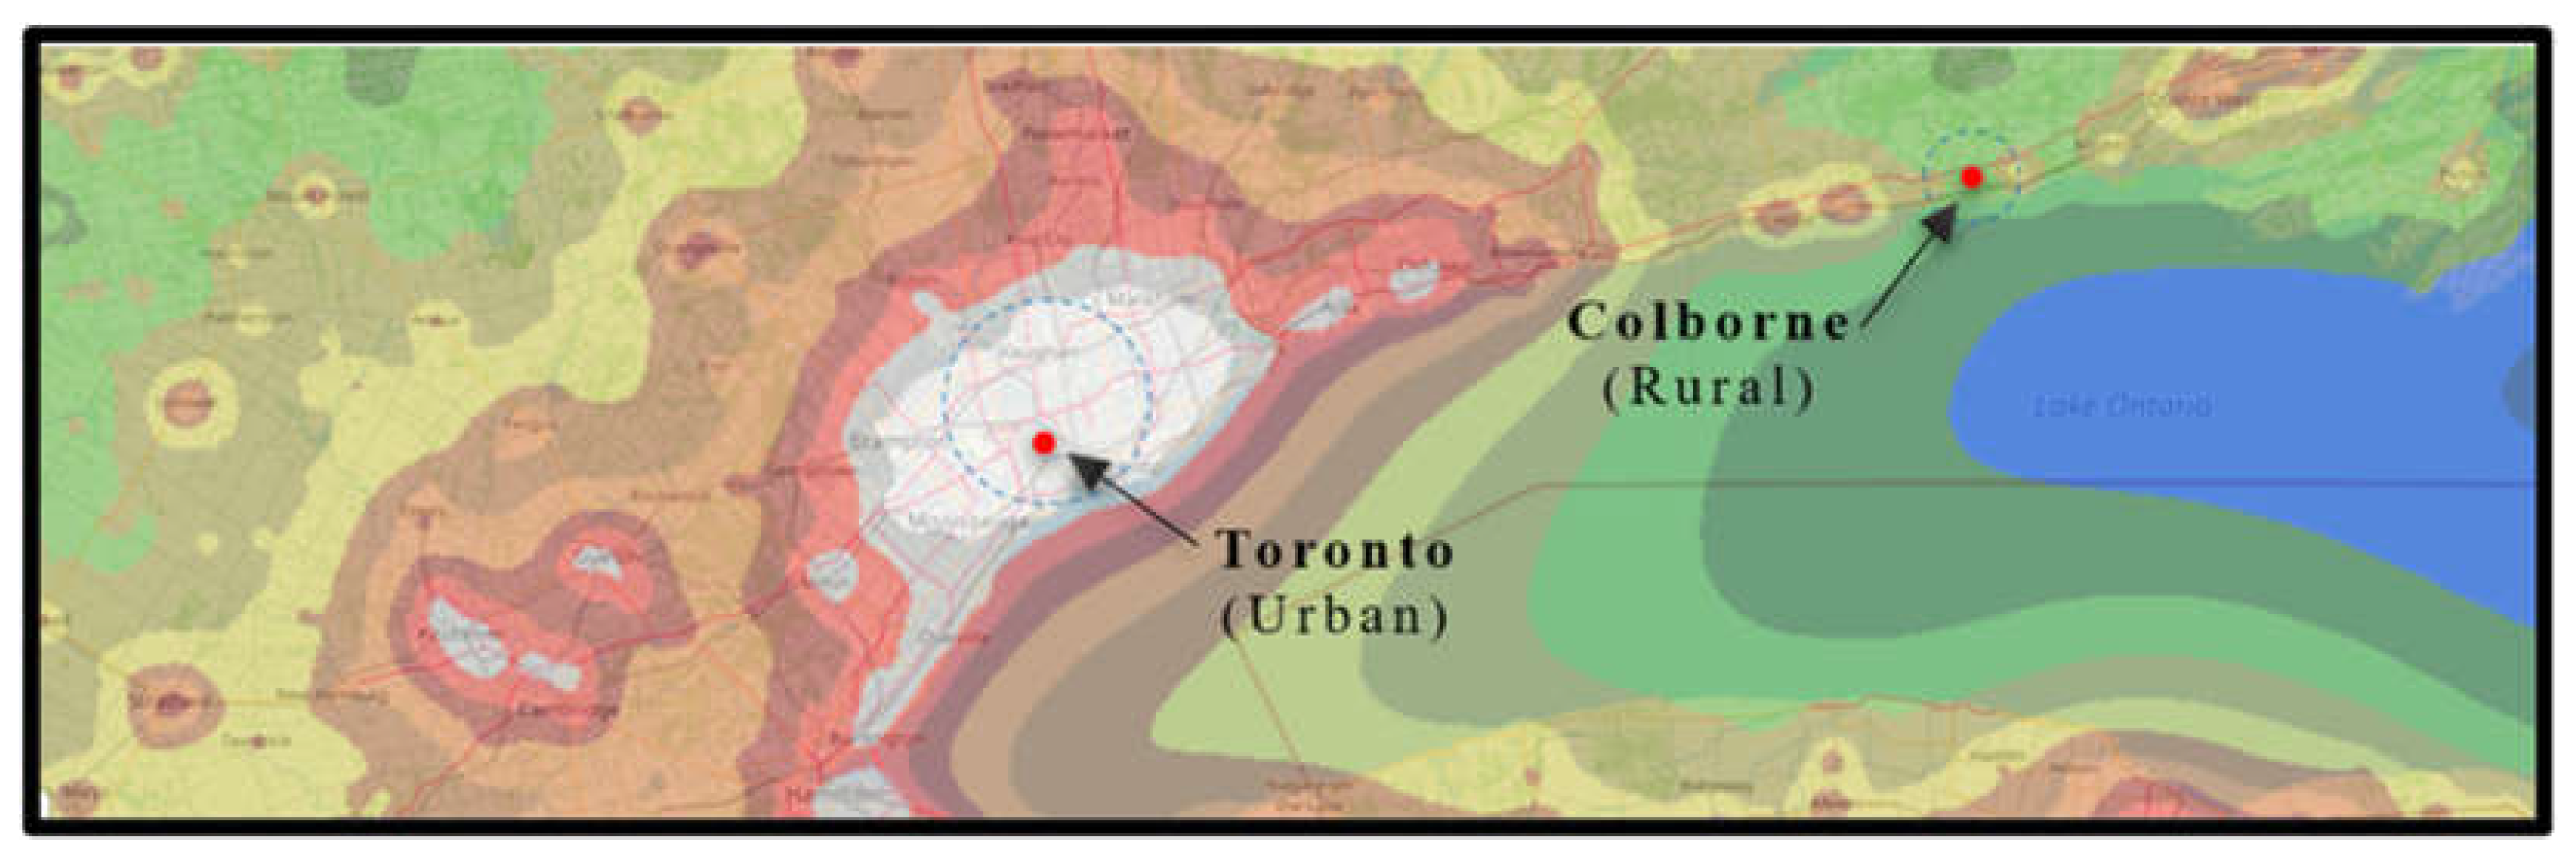
Figure 1 shows the light pollution map of urban Toronto and the rural township of Colborne, Ontario. These ideal locations were selected for the case study because downtown Toronto has higher light pollution, and the township of Colborne is a dark sky area with no artificial light, as indicated in the light pollution map [
25].
The first author anticipates that the correlation between ALAN and PM2.5 concentration is more powerful, and the amount of PM2.5 substance in the air is higher in an urban area near the ground level. By experimenting with these expectations, the authors aim to determine where the integrated threats of PM2.5 concentrations and ALAN are most significant for humans and migrating birds. These threats are potential to be rising or decline in severity. The reductions in ALAN may provide improved air quality at the ground level and may have the most significant benefits to humans and other living beings.
ALAN is a vital element of urban life, especially in the nocturnal environment. Well-designed nocturnal illumination provides safety and security, utilizes minimum energy, and minimizes the adverse effects on human and nocturnal animal life [
27]. Adequate lighting improves the quality of urban life for everyone [
26,
27]. ALAN has a prolonged threat to humans and migratory birds in the built environment. This hazard has grown with the rapid urbanization of the City of Toronto [
28,
29]. The migratory birds utilize a variety of cues for the direction of movement, including "the sun, moon, Earth’s magnetic field, patterns of stars," higher levels of ALAN, and topography [
28,
29]. The impact of ALAN on "nocturnally migrating birds has historically been noted through the effects of lighthouse beams." [
28]. Anyone can witness now (2023) extensively in urban Toronto with ALAN in the built environment [
28,
29]. Humans have a disturbance in sleep due to light and air pollution, including outdoor trespass lighting [
6,
27].
This research paper is arranged as follows:
Section 2 provides the materials and the methods used in this research article. The materials are a digital lux meter to measure ground light level, a sky quality meter to measure the light pollution level, and a particulate air detector for Testing PM2.5 concentration. The method is to measure PM2.5 levels in urban Toronto and rural Colborne areas at night.
Section 3 provides the average results of the data collected over the five days periods from the urban Toronto and rural Colborne areas and the differences.
Section 4 discusses the correlation between ANAN and PM2.5 concentrations and the atmospheric chemistry between urban Toronto and rural Colborne. Finally, section 5 provides the conclusion of these research findings and the necessary future actions.
This study aspires to find the effect of artificial light and the airborne fine PM2.5 levels in urban versus rural areas. The materials and measuring meters are necessary to measure light, skyglow, and PM2.5 levels. The following section provides the required materials and methods this research article employs.
2. Materials and Methods
The data collection locations were carefully chosen to have a high lighting level in an urban area and no rural lighting area without traffic disturbance and the public. Therefore, the data documented in this paper was collected same time with the assistance of a friend at Nathan Phillips Square, Toronto, and the intersection of Vernonville Road & County 2 Road, Colborne, Ontario (close to Highway 401 & Vermontville Road). The date and time of data collection are indicated in
Table 1 and
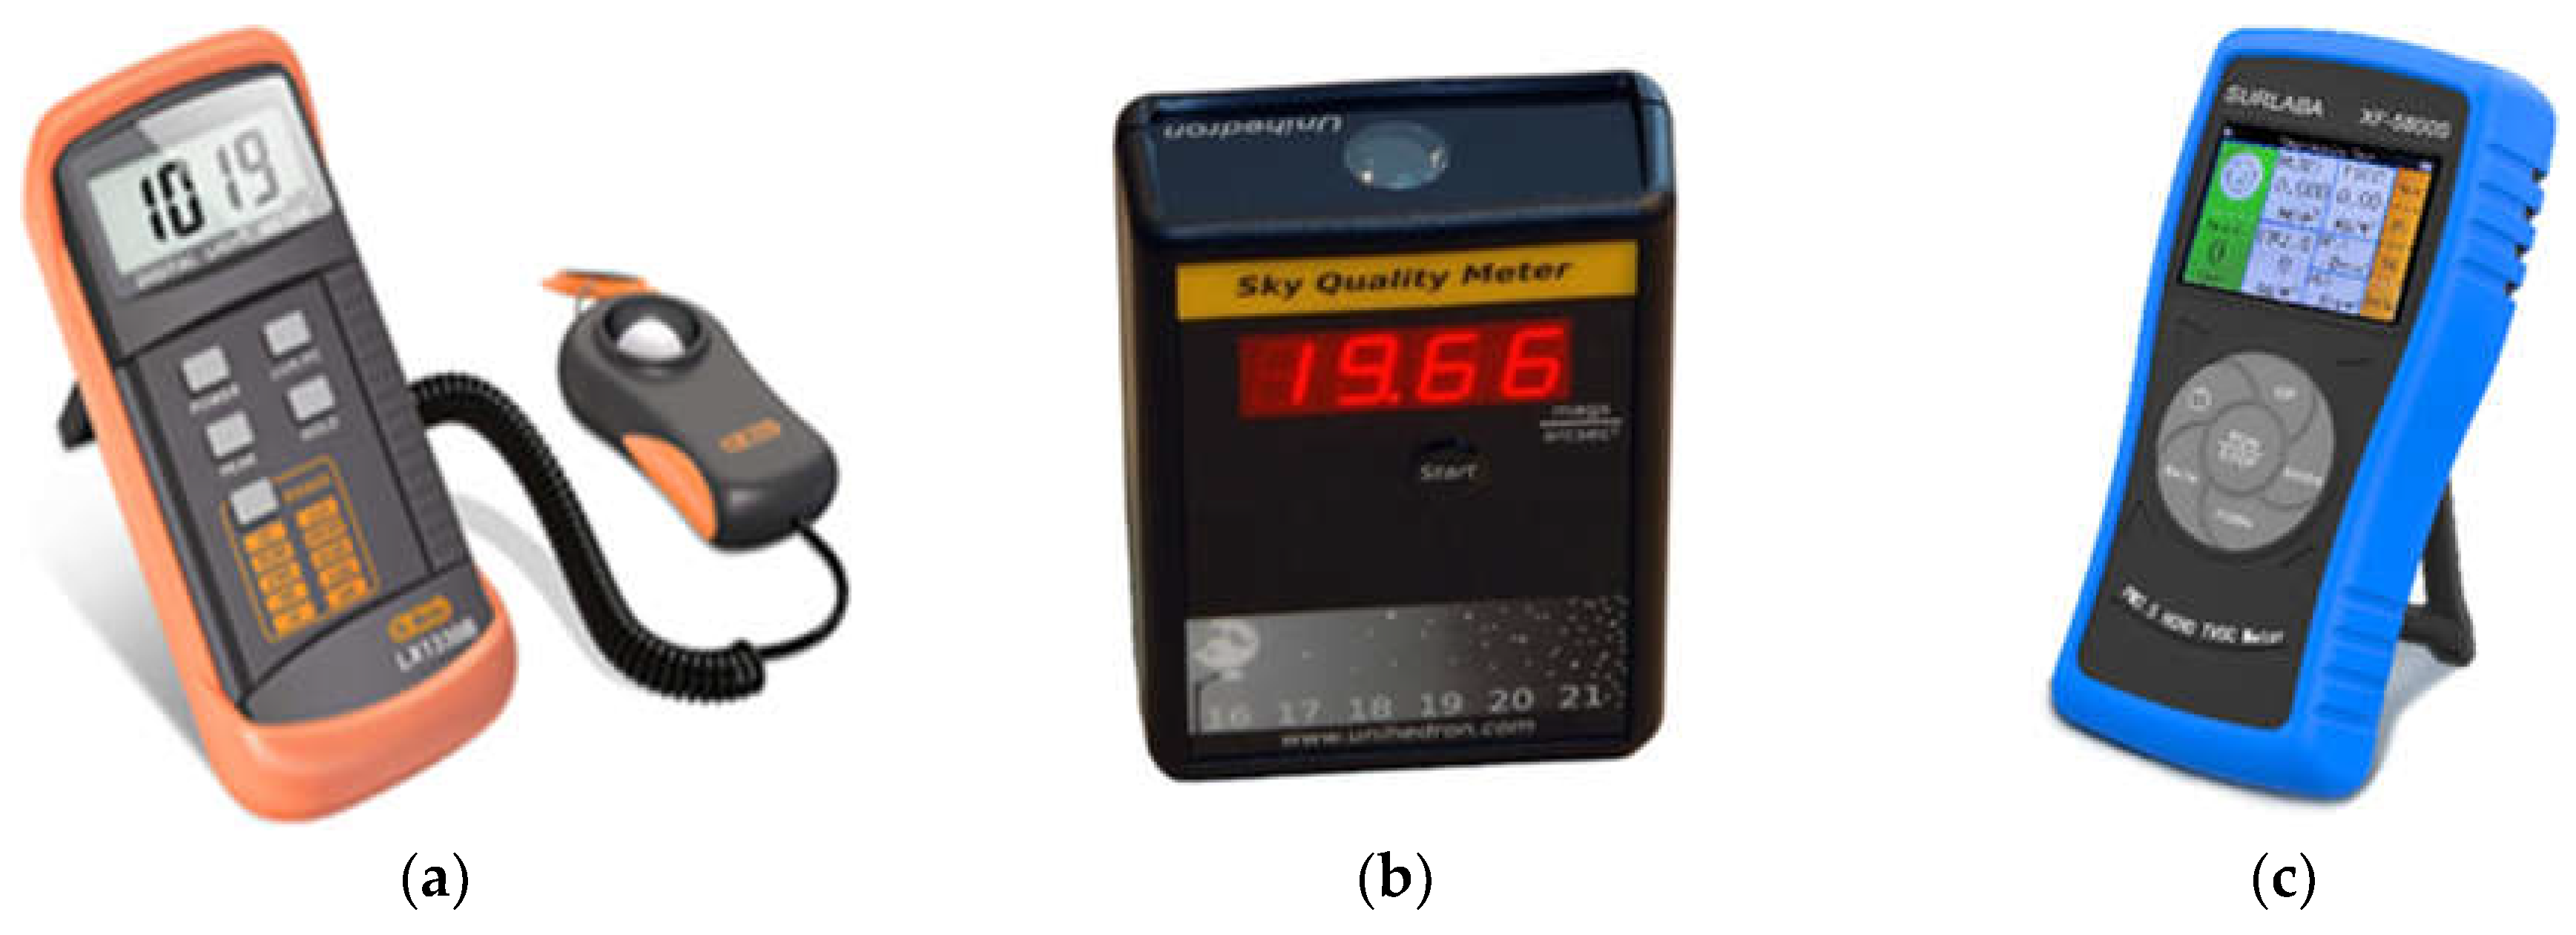
Table 2. The light falls on the ground and reflects into the sky. Therefore, the author decided to take the light level measurement on the ground level. The sky quality meter sensor faces the sky, and the air particulate detector sensor faces up. Consequently, both meters were mounted one meter above the ground on the tripods so that easy to record the measurement. All the data collection was taken in the same manner. At the beginning of the data collection (20.00), the light levels were at the ground level. Sky quality measurements were taken about one meter above ground before making PM2.5 measurements every 30 minutes. The light level was measured at the ground level using a lux meter LX1330B [
30], as shown in
Figure 2(a). Sky quality measurements were taken using a tripod with the "Unihedron sky quality meter (SQM) - L" [
31], as shown in
Figure 2(b). The fine Particulate matter (PM2.5) data were taken using Surlaba XF-5800S Air Particulate Detector [
32], as shown in
Figure 2(c), at the exact locations. Based on the first author’s research, this is the first comparative study of the impact of artificial light and PM2.5 concentration in urban versus rural areas. Therefore, this novel method is original but has yet to be replicated and can be considered an innovative method to identify the impact of artificial light and PM2.5 concentration in urban and rural areas.
Knowing how to determine the dark sky and the light-polluted sky from the sky quality meter readings is essential. A higher number reading (>20.5 mag/arcsec2) of the sky quality meter would indicate a very dark site (no ALAN or zero lux level), while a lower reading (<19 mag/arcsec2) would indicate a light-polluted sky [
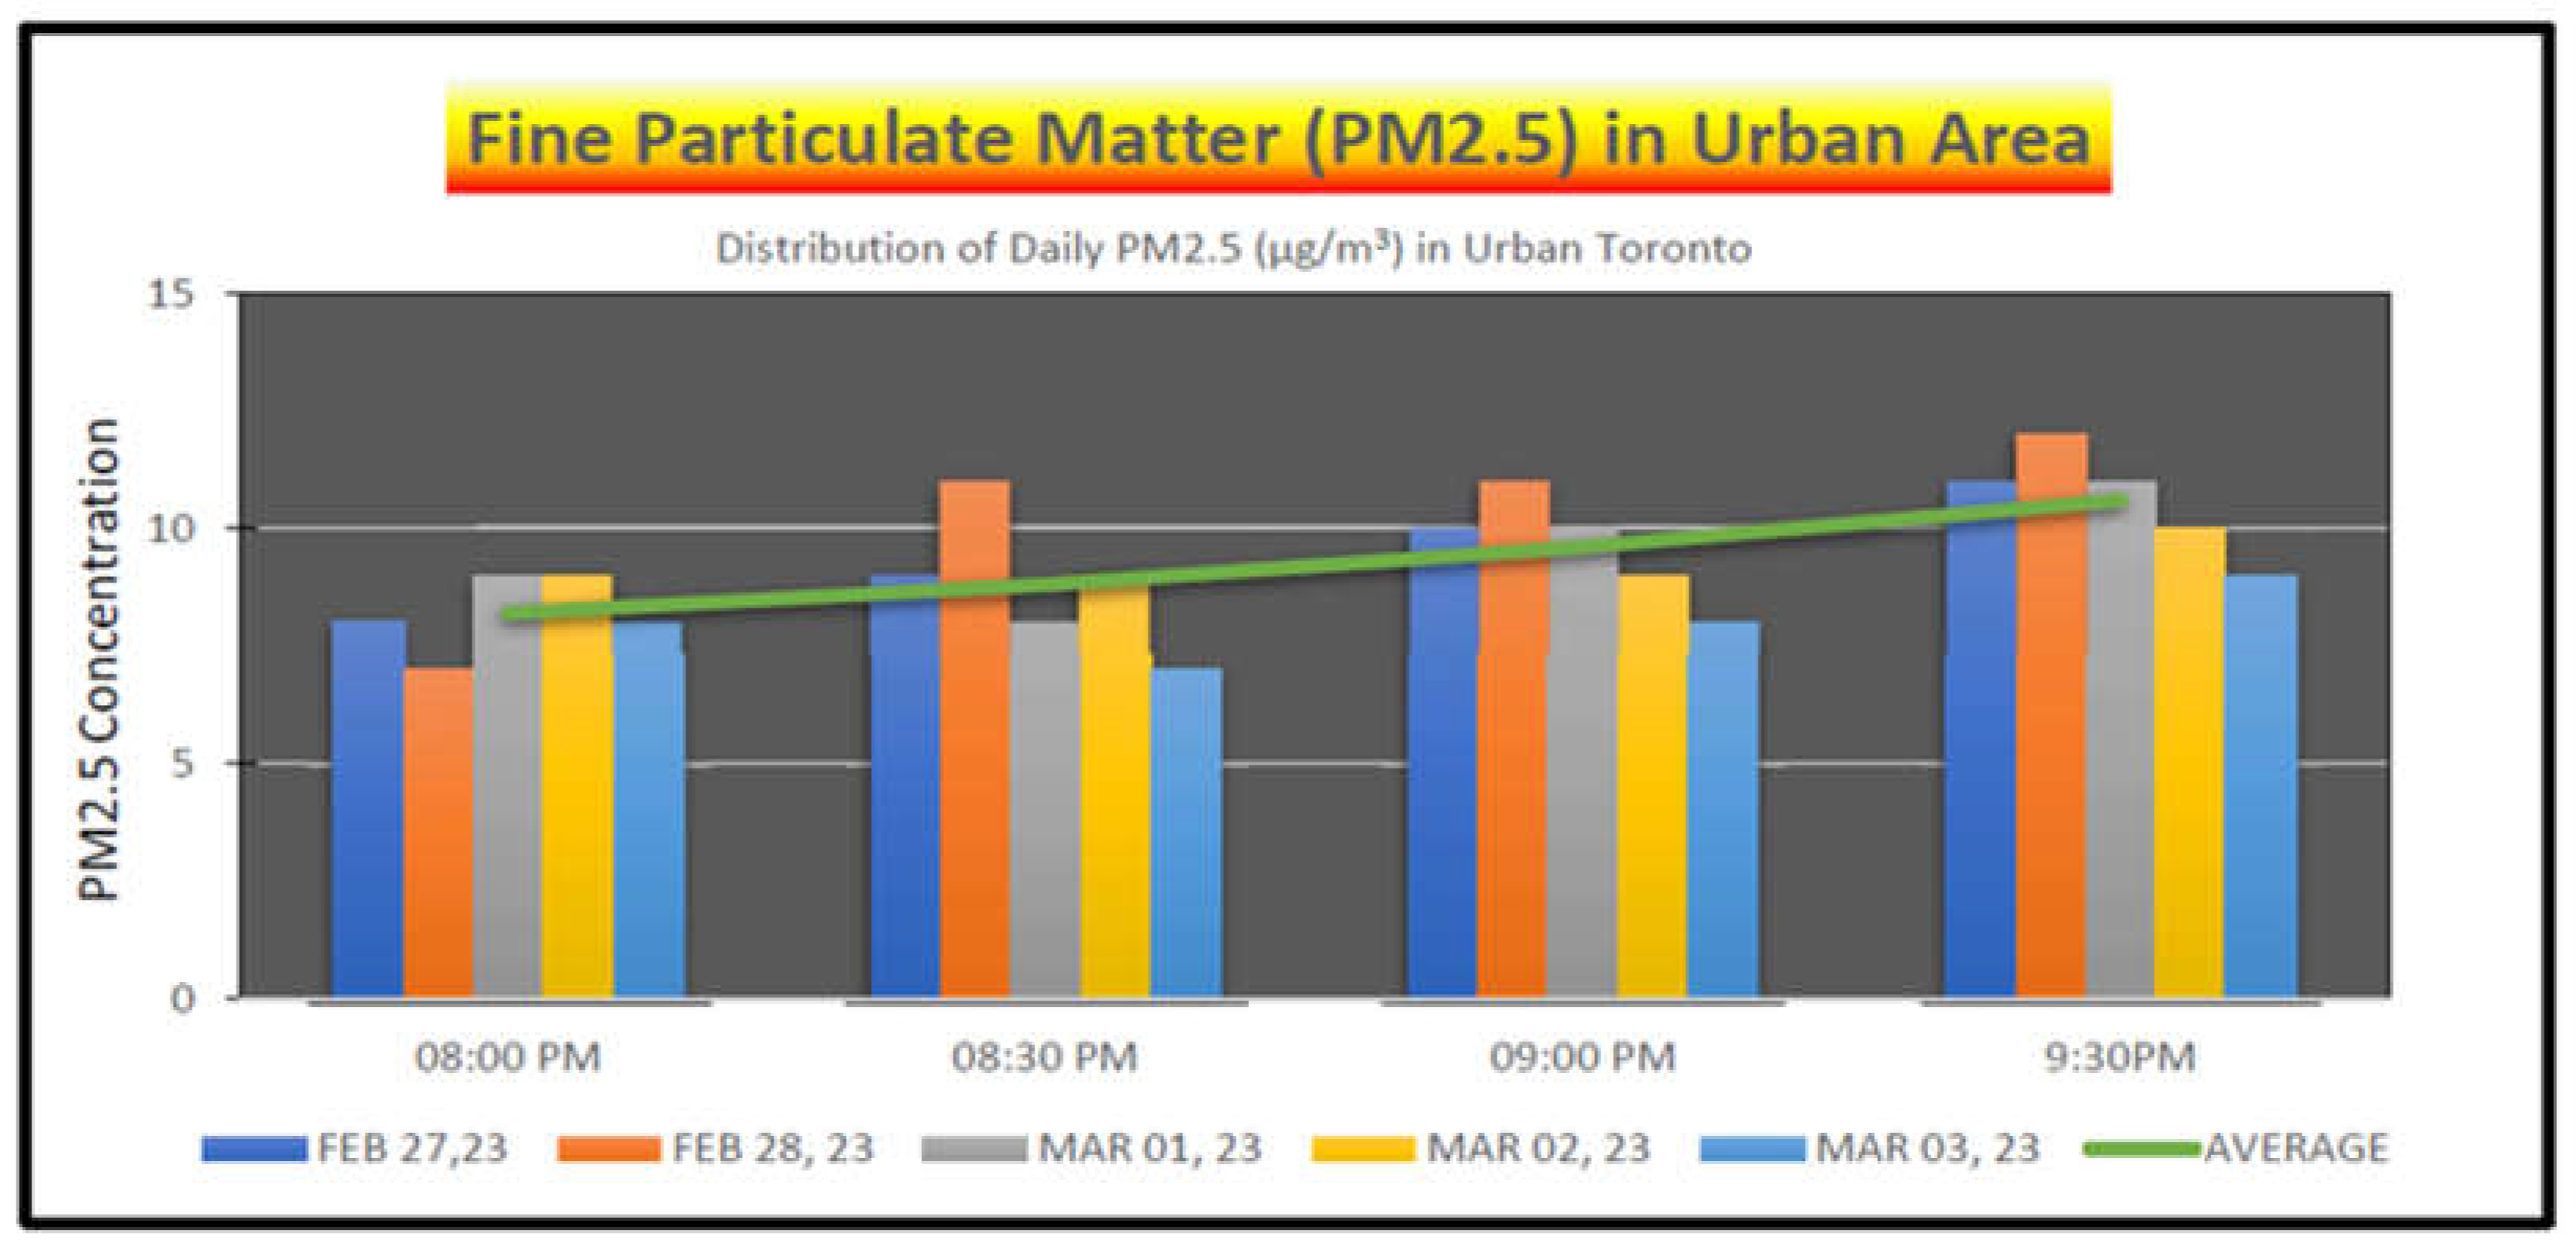
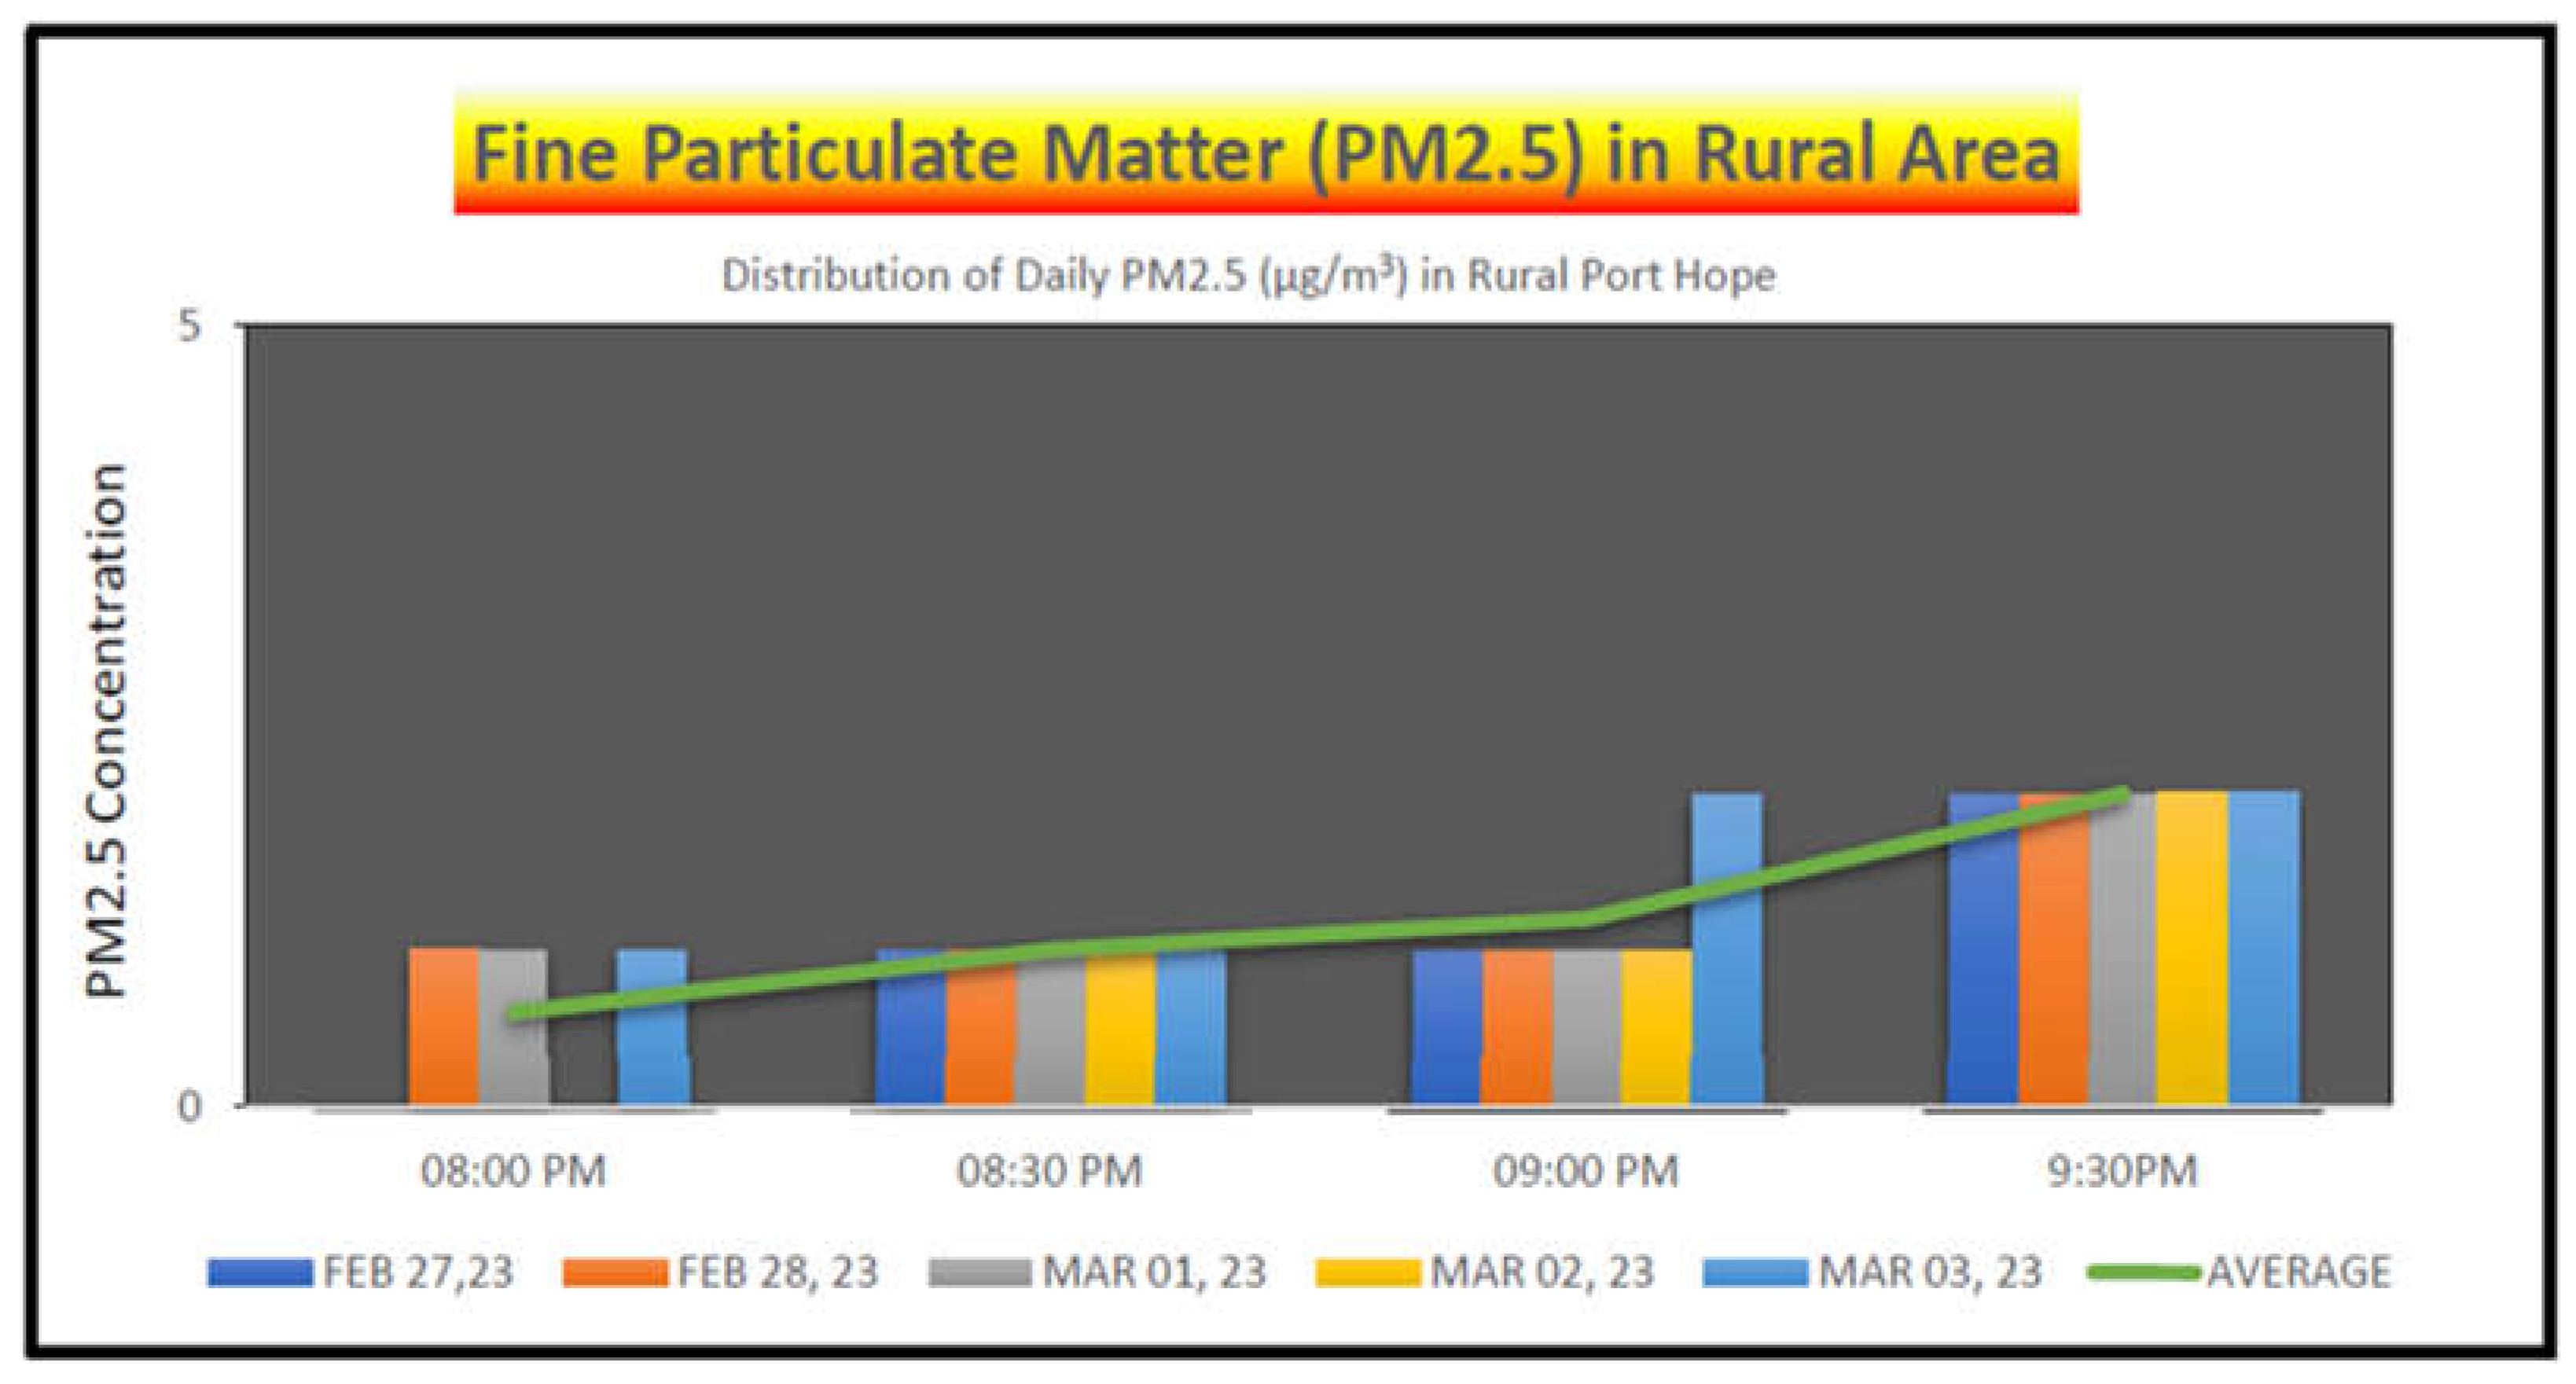
31]. The scope of this study is to uncover the PM2.5 levels in the urban Toronto and rural Colborne areas of Canada. Therefore, knowing the good and bad air quality levels is essential. The air quality at lower levels is always better, but it is good, between zero and 35 µg/m3. To quantitatively study the connection between air pollution (PM2.5) and ALAN, the study selects observation data between 8:00 pm and 9:30 pm every 30 minutes for five days to make the analysis, shown in
Table 1 and
Table 2 and
Figure 3 and
Figure 4. Therefore, the first author (author thereafter) took a one-time sky quality meter and Lux meter readings each day at the beginning of the PM2.5 measurement. The average of five days of data indicates zero lux level and 20.59 mags arcsec-2 at the rural Colborne site and 16 lux level and 13.68 mags arcsec-2 at Nathan Phillips Square, Toronto.
The author measured the ALAN level at the ground level in the urban and rural areas using the lux meter LX1330B and the Artificial night sky brightness and PM2.5 concentration one meter above the ground using the Unihedron sky quality meter (SQM) and Surlaba XF-5800S Air Particulate Detector for Testing PM 2.5 for urban and rural areas.
2.1. Fine Particulate matter (PM2.5)
The author acquired surface fine particulate matter (PM2.5) concentration (in micrograms per cubic meter) estimates from February 27 to March 3, 2023, using the XF-5800S Surlaba PM2.5 HCHO TVOC meter and summarized PM2.5 concentrations by averaging the estimates across a week.
Table 1 for urban Toronto and
Table 2 for rural Colborne below summarizes the data.
Notably, the nighttime measurements of PM2.5 are higher in the urban City of Toronto, and the reading increases over time. However, it is still within the threshold level.
Notably, the nighttime measurements of PM2.5 are lower in the rural township of Colborne, and the reading slightly increases over time but is still at excellent levels.
The author of this research used the above-noted method to prove the connection between ALAN and PM2.5 levels in urban Toronto and rural Colborne. The following section will provide the required results from the above-noted data.
3. Results
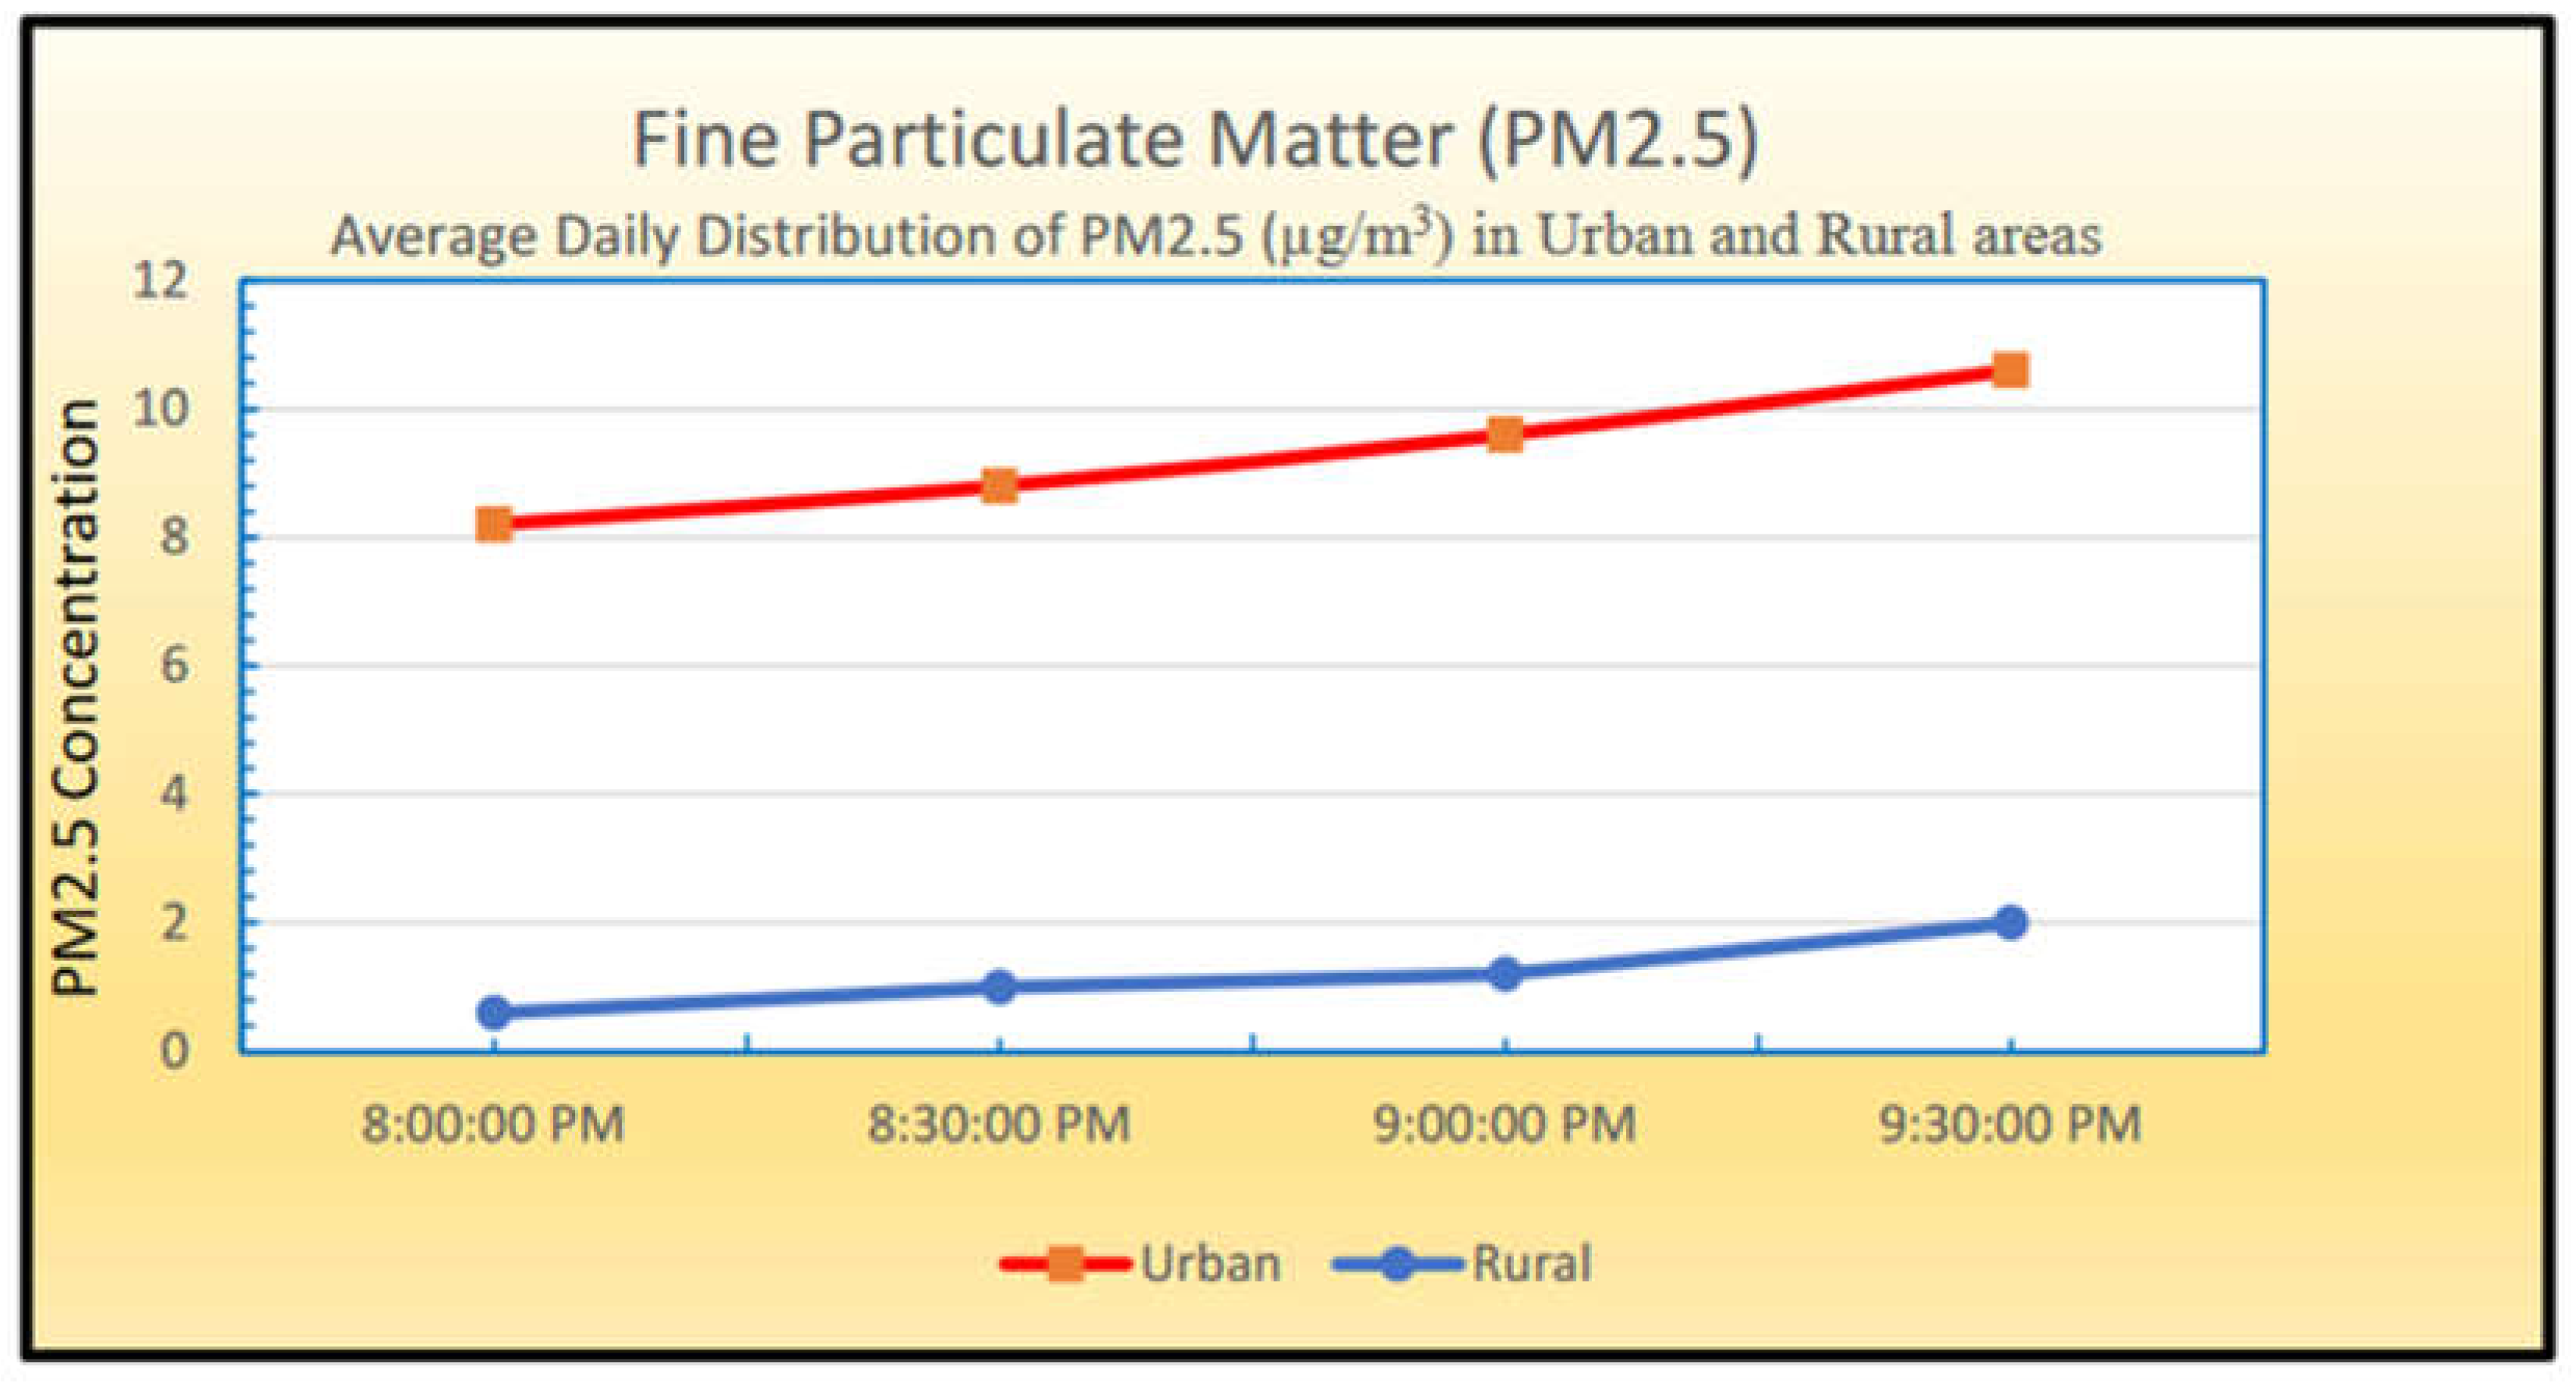
During the five days from February 27 to March 3, 2023, PM2.5 concentrations were highest on average within the Urban Toronto area compared to the rural Colborne area. The lowest PM2.5 trends occurred within the rural Colborne area.
The results of the data collected during the five days from February 27 to March 3, 2023, PM2.5 concentrations were highest within the Urban Toronto area and the lowest within the rural Colborne area.
Table 3 and
Figure 5 indicate that the PM2.5 concentration is very high in the urban area and shallow in the rural area at night.
The results indicate that the correlations between ALAN and PM2.5 for human activities and the nocturnally migrating bird species are higher in urban Toronto than in the rural Colborne area. ALAN pollution exerts the most prominent and severe impact on air pollution. ALAN pollution capacity can deepen air pollution and vice versa. This study’s results under this time range indicate light’s influence on metropolitan Toronto’s air pollution. The collected PM2.5 data for Toronto is not alarming but within the threshold level of 35 µg/m3. Therefore, the air quality is still in good condition, between zero and 35 µg/m3.
Based on these findings from the data collection and assessment results, further discussion is necessary for urban and rural atmospheric chemistry and its influence on air pollution. Therefore, the following section will discuss the urban and rural atmospheric chemistry disparity and possible recommendations for mitigating this mismatch for healthy living for people and biodiversity.
4. Discussion
The urban area had the strongest ALAN–PM2.5 correlations and PM2.5 concentrations. ALAN invites more human activities in the city and increases the migratory birds’ flying and stopovers. Therefore, humans and animals are increasing exposure to higher PM2.5 concentrations in downtown Toronto. These findings emphasize the integrated hazards posed by ALAN pollution and air pollution for nocturnal activities of humans and migrating birds in an urban area.
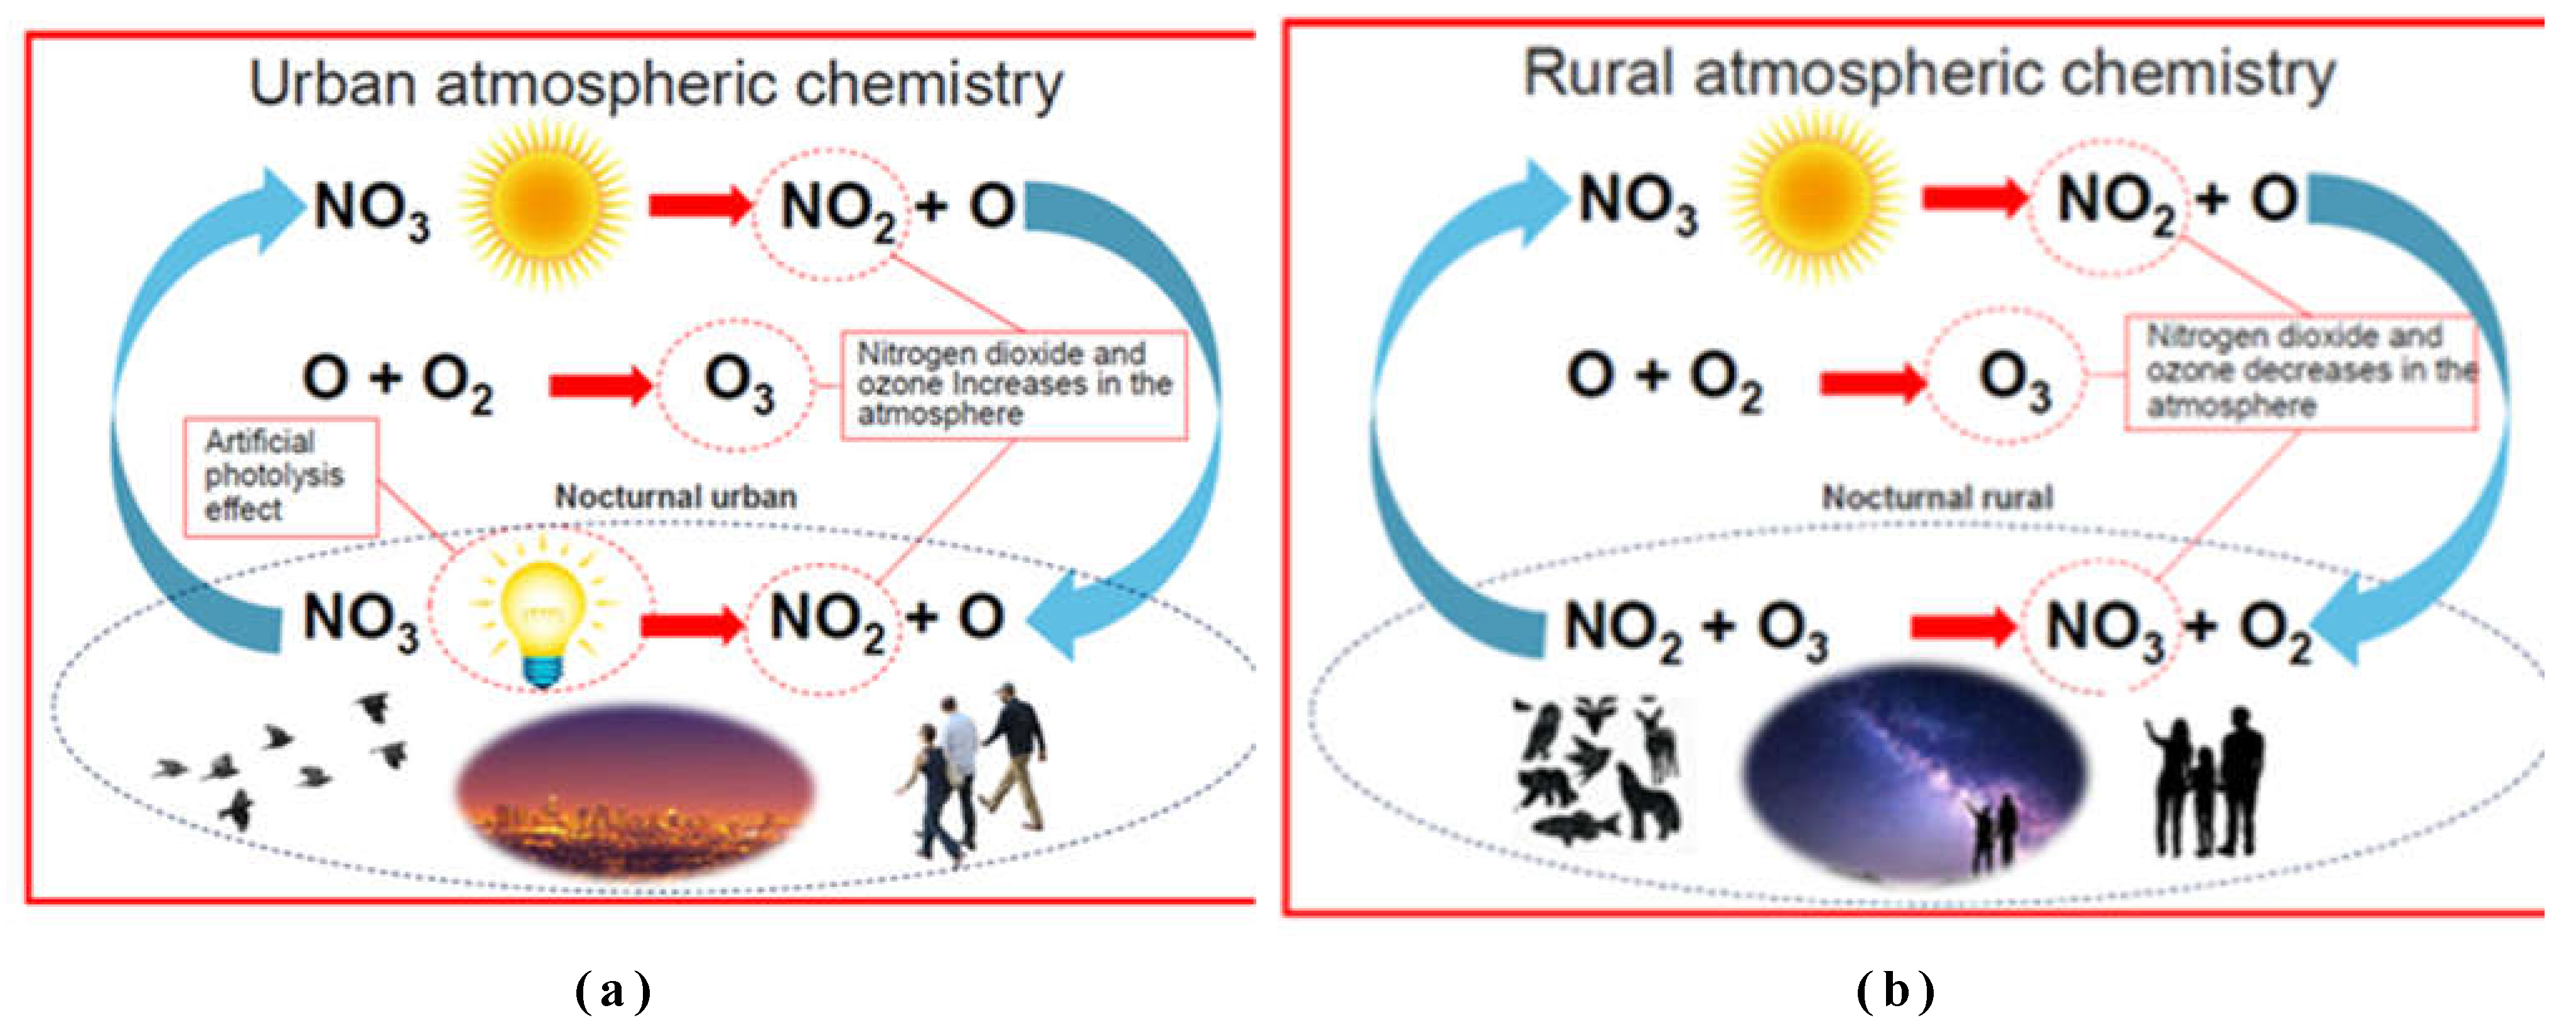
In the troposphere, nitrate radical provides nitrogen dioxide (NO
2) and oxygen (O) atoms for ozone (O
3) formation, and sunlight breaks down (Photolysis or light splitting) nitrate radicals into ‘NO
2’ and an ‘O’ atom during the daytime [
33,
34].
A single oxygen (’O’) atom integrates with an oxygen molecule (’O
2’) to produce ozone at the ground level.
The nitrate radical (NO
3) derives from the oxidation of nitrogen dioxide (NO
2) by ozone (O
3), and it arises mainly during the ALAN atmosphere [
33,
34].
The process that happened in the atmospheric chemistry represented the above results, but it had no net gain in ozone, and ALAN blocks the healing process. Therefore, the NO2 level increases in the atmosphere.
NO
2 concentrations were reduced, O
3 concentrations were increased, and the air quality index (AQI) improved during the Covid-19 lockdown period [
35]. The health effects attributed to ozone were identified as zero respiratory mortality [
36]. Therefore, NO
2 is a significant contributor to air pollution. The artificial light blocks oxidation, so NO
2 and O
3 concentrations in the urban troposphere increase pollution and block healing during the nighttime. The author defines this as the artificial photolysis or artificial light-splitting effect.
Figure 6a,b show the atmospheric chemistry for both urban and rural areas.
The author strongly indicates that the artificial photolysis or artificial light splitting effect increases the PM2.5 concentration in downtown Toronto. “Nitrogen dioxide is the third most potent greenhouse gas, trapping heat in the atmosphere and contributing to global climate change” [
37].
Evidence shows that "ALAN attracts nocturnal migrants into dense urban areas" [
16]. The poor air quality (PM2.5 level greater than 35 µg/m
3) is unlikely to counteract the attractive power of ALAN. However, evidence shows that "nocturnally migrating geese stop migrating or alter migration direction/altitude when they encounter high PM2.5 concentrations (greater than 161 µg/m3), suggesting that extreme conditions can deter migration in some situations" [
38]. It is essential to note that more research is necessary to determine how nocturnal migrants react when exposed to different levels of PM2.5 and how these exposure-response relationships change when artificial light is present in the urban area or absent in the rural area or vice versa.
Air pollution displays "seasonal variation in its vertical distributions and concentrations, driven by various atmospheric and anthropogenic mechanisms" [
20]. Seasons are marked by "colder temperatures, lower humidity, and precipitation, and milder winds are often associated with poorer air quality" [
20,
39,
40]. In addition to the correlation with PM2.5 levels, ALAN can positively correlate with other air pollution conditions. For example, "urban areas usually contain higher levels of O
3, NO
2, sulfur dioxide (SO
2), carbon monoxide (CO), and volatile organic compounds (VOCs)" [
41].
Determining how various sources and states of air pollution affect migrating birds during the nighttime at different times of year is essential and beneficial. It would be helpful to study and confirm how various living-being react to PM2.5 inhalation exposure during migration and how these results vary directly or indirectly when artificial light is present or absent at night. Finally, it would be helpful to evaluate how the migration of birds and their life-history documentation and processes concern the PM2.5-associated exposure and responses to different sources and conditions of air pollution. These questions and concerns can be addressed with more detail, range, and rigor when the "quality of bird occurrence data" [
42] is collected from other research at the ground levels and the satellite is improved. The air quality data can be enhanced [
43,
44] to reflect actual conditions.
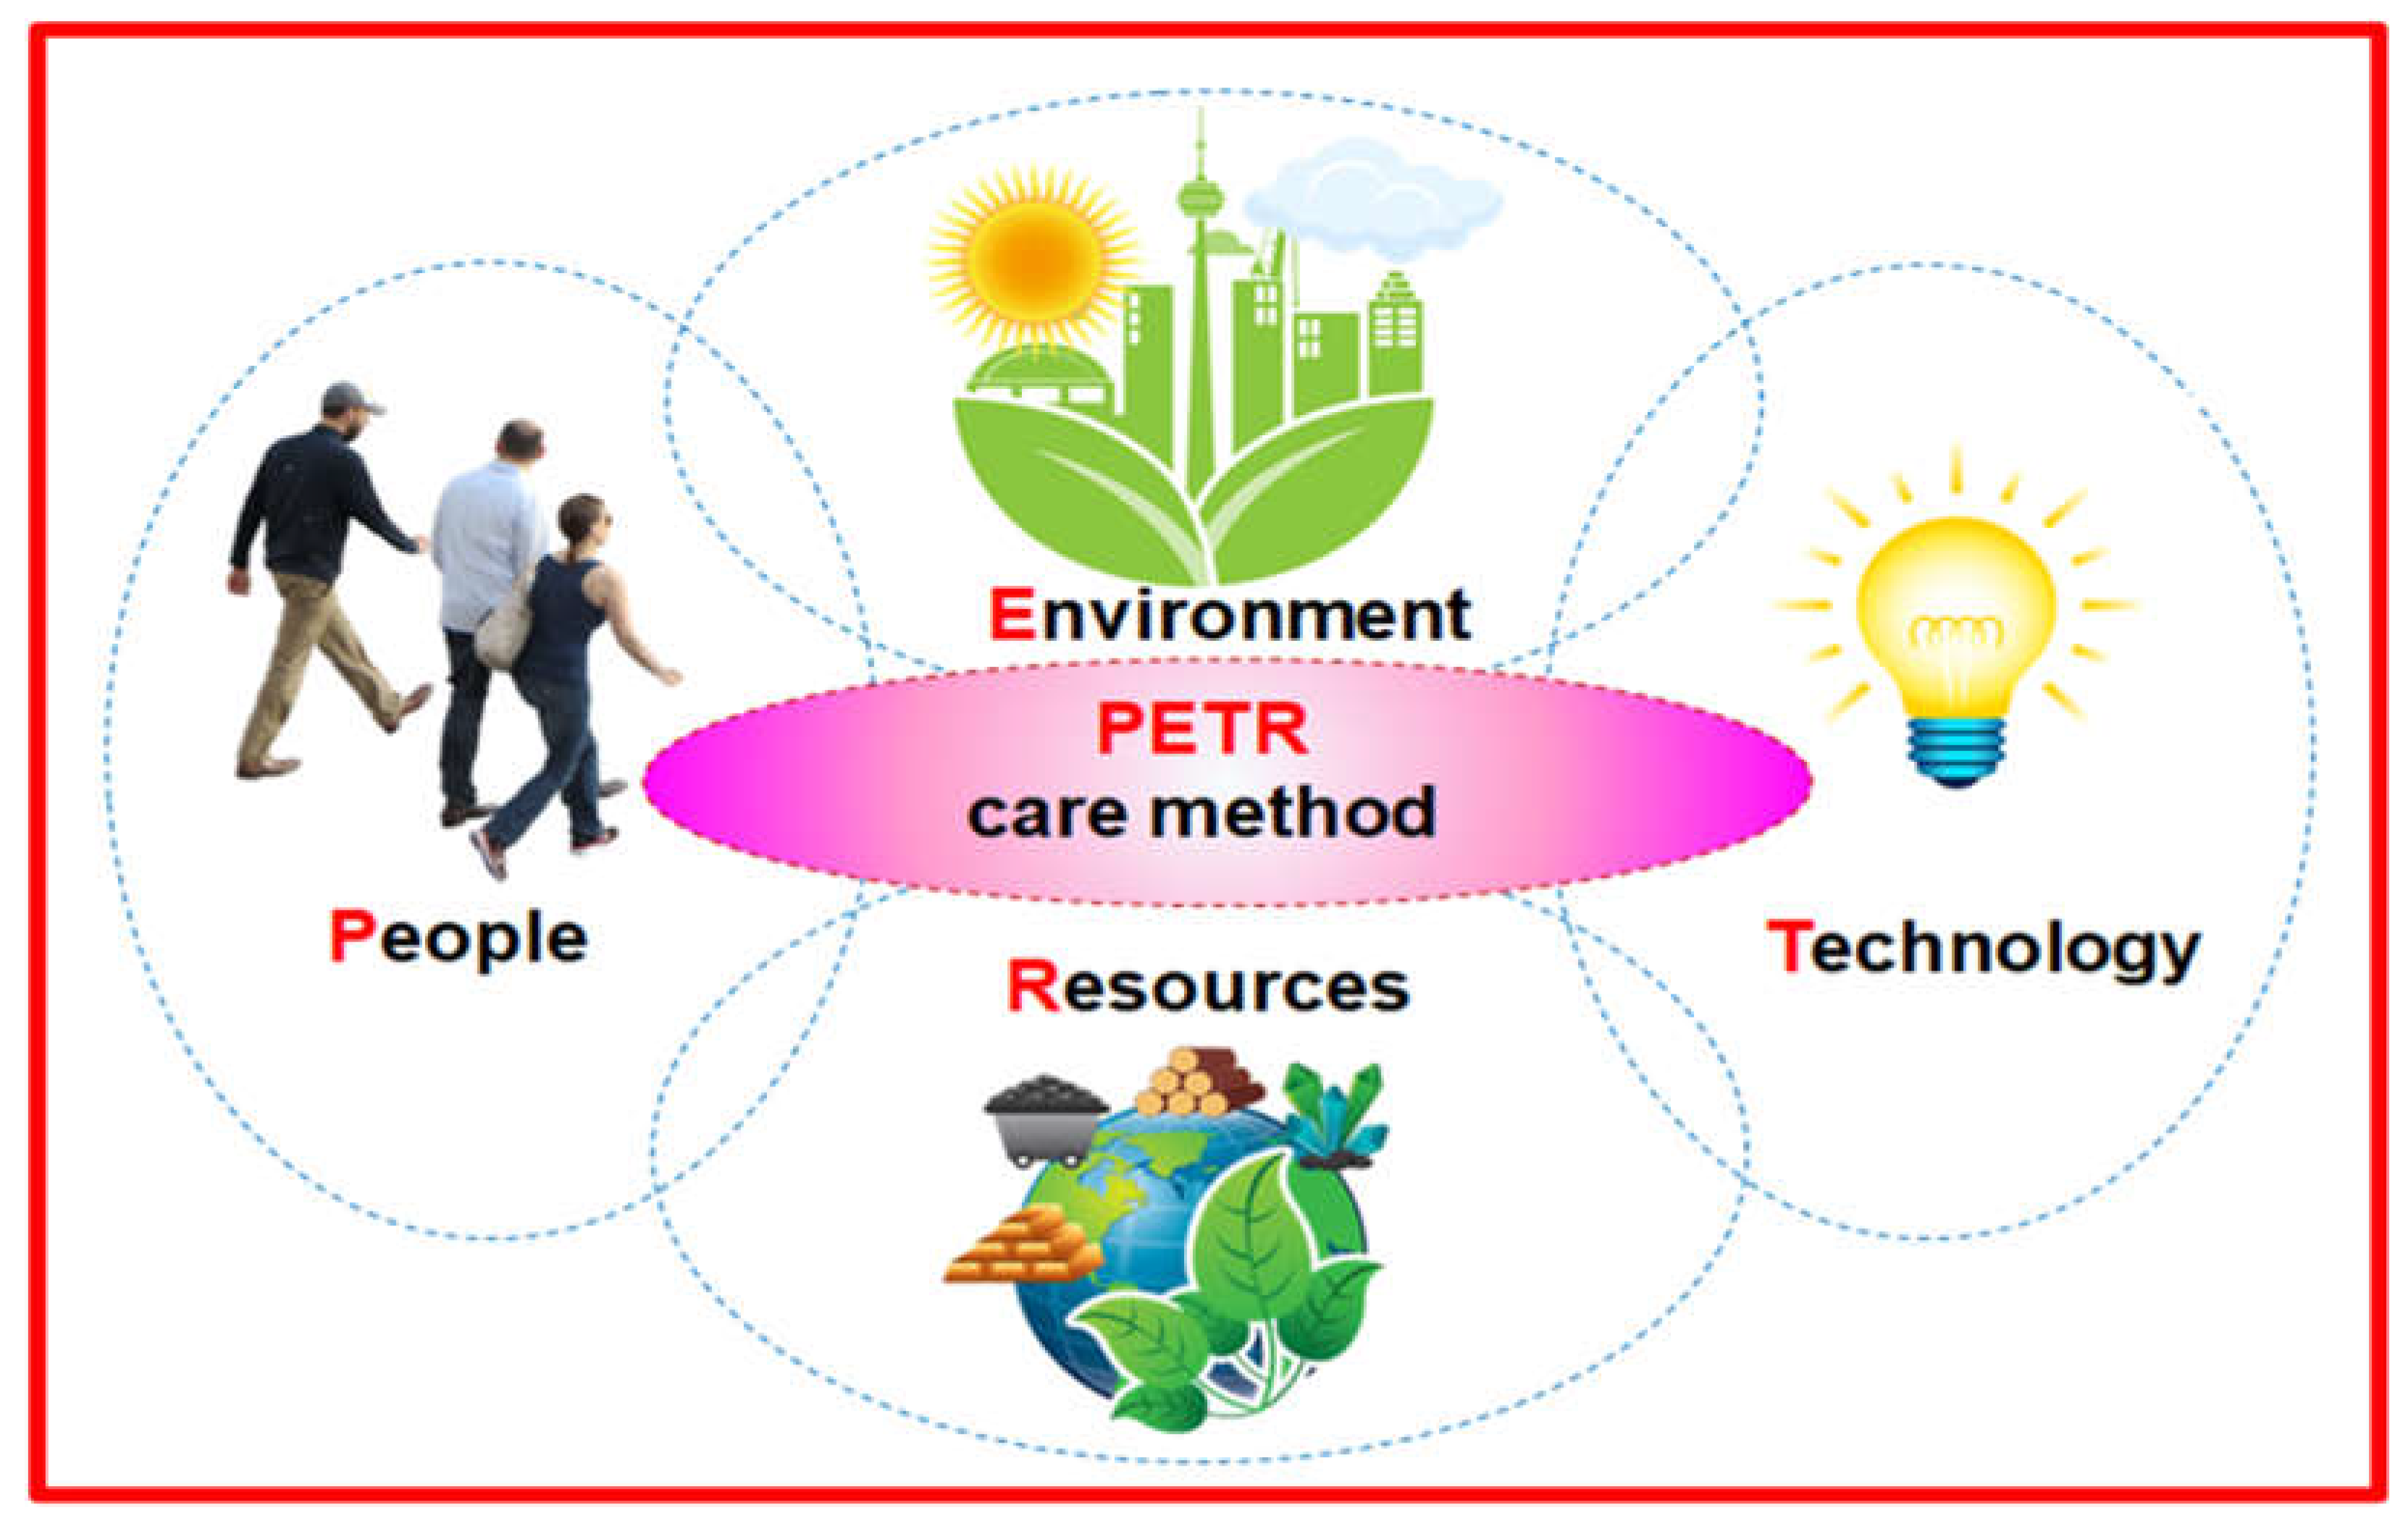
The people, environment, technology, and resources (PETR) must be considered to address this problem holistically. Therefore, this method can be called the PETR care method for managing light and air pollution, as shown in
Figure 7. Artificial light can use sustainable LED sources to reduce carbon emissions and energy savings [
45]. The new technology is available to direct the light where it needs, avoid light going directly into the sky or adjacent properties, and control the light using dim or turn it off when necessary [
45]. The results shown in this study indicate that everyone can thrive if the resources and technologies are used to care for people, biodiversity, and the environment.
The results indicate air and light pollution growth during the nighttime in urban Toronto. Nighttime human activities are less than daytime but increased PM2.5 shows the ALAN pollution influence in metropolitan Toronto. ALAN pollution mitigation can be investigated under different follow-up studies using the required light level (no overlighting) with appropriate warm light sources to reduce light scattering in the atmosphere. The PETR care method emphasizes the holistic approach to finding the increasing air and light pollution in urban areas. The first author of this research developed this method concurrent with other authors.
The urban and rural air quality is still in good condition and less than the threshold level. However, the metropolitan area is higher than the rural area. Therefore, designing artificial outdoor lighting need serious consideration. Based on the above-noted results and discussion, this research concludes with the next section.
5. Conclusions
The data indicate light pollution and PM2.5 growth during the nighttime in urban Toronto. Human activities, including motor vehicle traffic, are reduced at night in Urban Toronto but increased PM2.5 shows the ALAN influence in metropolitan Toronto. ALAN is very important for people to use in the urban nighttime environment for safety, security, and necessary human needs. ALAN also invites migratory birds to the nighttime environment. Therefore, it is essential to make responsible lighting designs to mitigate light pollution to reduce air pollution, especially PM2.5 concentration in the urban atmosphere.
The findings reveal the most substantial hazard to humans and the nocturnally migrating birds from the correlation between ALAN and air pollution, especially PM2.5 concentration. It is essential to mitigate or avoid light pollution to improve air quality. Reducing or dimming the light to the required level for each application and directing ALAN where needed would benefit the people and nocturnally migrating birds in urban Toronto. The findings in rural Colborne, Ontario, Canada, indicate no combined hazards of ALAN and air pollution since there is no artificial light at night and a very minimum sky glow from adjacent town lighting. This result proves that excellent air quality is available in the rural environment for nocturnal animals, birds, and people of Colborne will continue. The urban environment is highly polluted by light and air pollution. However, it is good to have further studies to determine where migratory birds and humans encounter combined light and air pollution risks. This will provide a better knowledge of the broader importance of global change.
This novel method to find the PM2.5 concentration in urban and rural areas is not repeated but original. It can be regarded as an innovative method to discover light pollution and the PM2.5 concentration in the nighttime urban and rural environments. The conclusions highlight the necessity to explore how various conditions and sources of ecological pollution combine to affect humans and nocturnally migrating birds. This knowledge will guide further research, inform policy and management, and improve the mitigation and protection initiatives applied to people and migrating birds worldwide.
Author Contributions
Conceptualization and methodology, U.T.; advised, J.L., G.K.; field investigation, resources, and data curation, U.T.; formal analysis of data and results, U.T.; wrote and revised paper, U.T.; review and editing, J.L., G.K.; project administration, U.T. All authors have read and agreed to the published version of the manuscript.
Funding
This research received no external funding.
Acknowledgments
The authors would like to acknowledge the two anonymous helpers who supported data collection during the field visits.
Conflicts of Interest
The authors declare no conflict of interest.
References
- Manisalidis, I.; Stavropoulou, E.; Stavropoulos, A.; Bezirtzoglou, E. Environmental and Health Impacts of Air Pollution: A Review. Front. Public Health 2020, 8, 505570. [Google Scholar] [CrossRef] [PubMed]
- Cohen, A.J.; Brauer, M.; Burnett, R.; Anderson, H.R.; Frostad, J.; Estep, K.; Balakrishnan, K.; Brunekreef, B.; Dandona, L.; Dandona, R.; et al. Estimates and 25-year trends of the global burden of disease attributable to ambient air pollution: An analysis of data from the Global Burden of Diseases Study 2015. Lancet 2017, 389, 1907–1918. [Google Scholar] [CrossRef] [PubMed]
- Vohra, K.; Vohra, K.; Vodonos, A.; Vodonos, A.; Schwartz, J.; Schwartz, J.; Marais, E.A.; Marais, E.A.; Sulprizio, M.P.; Sulprizio, M.P.; et al. Global mortality from outdoor fine particle pollution generated by fossil fuel combustion: Results from GEOS-Chem. Environ. Res. 2021, 195, 110754. [Google Scholar] [CrossRef] [PubMed]
- WHO. (2020). World health statistics 2020: Monitoring health for the SDGs, sustainable development goals. Available online: https://apps.who.int/iris/handle/10665/332070 (accessed on 28 February 2023).
- Newman, J. R., Schreiber, R. K., & Novakova, E. (1992). Air pollution effects on terrestrial and aquatic animals. In J. R. Barker, & D. T. Tingey (Eds.), Air pollution effects on biodiversity (pp. 177–233). Springer, US. Available online: https://pubs.er.usgs.gov/publication/95293 (accessed on 28 February 2023).
- Bo, Y.; Chang, L.-Y.; Guo, C.; Lin, C.; Lau, A.K.H.; Tam, T.; Yeoh, E.-K.; Lao, X.Q. Associations of Reduced Ambient PM2.5 Level With Lower Plasma Glucose Concentration and Decreased Risk of Type 2 Diabetes in Adults: A Longitudinal Cohort Study. Am. J. Epidemiology 2021, 190, 2148–2157. [Google Scholar] [CrossRef] [PubMed]
- WHO. (2006). WHO air quality guidelines for particulate matter, ozone, nitrogen dioxide and sulfur dioxide: Global update 2005: Summary of risk assessment. World Health Organization. Available online: https://apps.who.int/iris/handle/10665/69477 (accessed on 28 February 2023).
- Hammer, M.S.; van Donkelaar, A.; Li, C.; Lyapustin, A.; Sayer, A.M.; Hsu, N.C.; Levy, R.C.; Garay, M.J.; Kalashnikova, O.V.; Kahn, R.A.; et al. Global Estimates and Long-Term Trends of Fine Particulate Matter Concentrations (1998–2018). Environ. Sci. Technol. 2020, 54, 7879–7890. [Google Scholar] [CrossRef] [PubMed]
- Mutua, M.P.; Muya, S.; Gicheru, M.M. Protective roles of free avian respiratory macrophages in captive birds. Biol. Res. 2016, 49, 1–5. [Google Scholar] [CrossRef]
- Llacuna, S.; Gorriz, A.; Durfort, M.; Nadal, J. Effects of air pollution on passerine birds and small mammals. Arch. Environ. Contam. Toxicol. 1993, 24, 59–66. [Google Scholar] [CrossRef]
- Li, M.; Nabi, G.; Sun, Y.; Wang, Y.; Wang, L.; Jiang, C.; Cao, P.; Wu, Y.; Li, D. The effect of air pollution on immunological, antioxidative and hematological parameters, and body condition of Eurasian tree sparrows. Ecotoxicol. Environ. Saf. 2020, 208, 111755. [Google Scholar] [CrossRef]
- Sanderfoot, O.V.; Holloway, T. Air pollution impacts on avian species via inhalation exposure and associated outcomes. Environ. Res. Lett. 2017, 12, 083002. [Google Scholar] [CrossRef]
- Newton, I. (2023). The migration ecology of birds. 2nd Edition - June 1, 2023. Available online: https://www.elsevier.com/books/the-migration-ecology-of-birds/newton/978-0-12-823751-9 (accessed on 28 February 2023).
- Cabrera-Cruz, S.A.; Smolinsky, J.A.; Buler, J.J. Light pollution is greatest within migration passage areas for nocturnally-migrating birds around the world. Sci. Rep. 2018, 8, 3261. [Google Scholar] [CrossRef]
- Falchi, F.; Cinzano, P.; Duriscoe, D.; Kyba, C.C.M.; Elvidge, C.D.; Baugh, K.; Portnov, B.A.; Rybnikova, N.A.; Furgoni, R. The new world atlas of artificial night sky brightness. Sci. Adv. 2016, 2, e1600377. [Google Scholar] [CrossRef] [PubMed]
- Van Doren, B.M.; Horton, K.G.; Dokter, A.M.; Klinck, H.; Elbin, S.B.; Farnsworth, A. High-intensity urban light installation dramatically alters nocturnal bird migration. Proc. Natl. Acad. Sci. 2017, 114, 11175–11180. [Google Scholar] [CrossRef] [PubMed]
- McLaren, J.D.; Buler, J.J.; Schreckengost, T.; Smolinsky, J.A.; Boone, M.; Emiel van Loon, E.; Dawson, D.K.; Walters, E.L. Artificial light at night confounds broad-scale habitat use by migrating birds. Ecol. Lett. 2018, 21, 356–364. [Google Scholar] [CrossRef] [PubMed]
- La Sorte, F.A.; Fink, D.; Buler, J.J.; Farnsworth, A.; Cabrera-Cruz, S.A. Seasonal associations with urban light pollution for nocturnally migrating bird populations. Glob. Chang. Biol. 2017, 23, 4609–4619. [Google Scholar] [CrossRef] [PubMed]
- La Sorte, F.A.; Horton, K.G. Seasonal variation in the effects of artificial light at night on the occurrence of nocturnally migrating birds in urban areas. Environ. Pollut. 2020, 270, 116085. [Google Scholar] [CrossRef] [PubMed]
- Liu, Y.; Wu, J.; Yu, D.; Ma, Q. The relationship between urban form and air pollution depends on seasonality and city size. Environ. Sci. Pollut. Res. 2018, 25, 15554–15567. [Google Scholar] [CrossRef]
- Bruderer, B.; Peter, D.; Korner-Nievergelt, F. Vertical distribution of bird migration between the Baltic Sea and the Sahara. J. Ornithol. 2018, 159, 315–336. [Google Scholar] [CrossRef]
- Cabrera-Cruz, S.A.; Smolinsky, J.A.; McCarthy, K.P.; Buler, J.J. Urban areas affect flight altitudes of nocturnally migrating birds. J. Anim. Ecol. 2019, 88, 1873–1887. [Google Scholar] [CrossRef]
- Li, X.; Ma, Y.; Wang, Y.; Wei, W.; Zhang, Y.; Liu, N.; Hong, Y. Vertical Distribution of Particulate Matter and its Relationship with Planetary Boundary Layer Structure in Shenyang, Northeast China. Aerosol Air Qual. Res. 2019, 19, 2464–2476. [Google Scholar] [CrossRef]
- Samad, A.; Vogt, U.; Panta, A.; Uprety, D. Vertical distribution of particulate matter, black carbon and ultra-fine particles in Stuttgart, Germany. Atmospheric Pollut. Res. 2020, 11, 1441–1450. [Google Scholar] [CrossRef]
- David Lorenz’s Light Pollution Atlas (2020) Light Pollution Map. Available online: https://www.cleardarksky.com/maps/lp/large_light_pollution_map.html (accessed on 28 February 2023).
- Toronto (2017) Best Practices for Effective Lighting. Available online: https://www.toronto.ca/wp-content/uploads/2018/03/8ff6-city-planning-bird-effective-lighting.pdf (accessed on 28 February 2023).
- Thurairajah, U.; Littlewood, J.R.; Karani, G. A Novel Approach to Controlling Outdoor Light Pollution by Adopting Smart Science and Technology to Improve Residents Quality of Life in the Built Environment.CONFERENCE NAME, LOCATION OF CONFERENCE, COUNTRYDATE OF CONFERENCE; pp. 369–380.
- Toronto (2016) Bird Friendly Best Practices Glass. Available online: https://www.toronto.ca/wp-content/uploads/2017/08/8d1c-Bird-Friendly-Best-Practices-Glass.pdf (accessed on 28 February 2023).
- La Sorte, F.A.; Aronson, M.F.J.; Lepczyk, C.A.; Horton, K.G. Assessing the combined threats of artificial light at night and air pollution for the world’s nocturnally migrating birds. Glob. Ecol. Biogeogr. 2022, 31, 912–924. [Google Scholar] [CrossRef]
- Dr. meter (2023) Digital Light Meter LX1330B. Available online: https://drmeter.com/products/lx1330b-digital-illuminance-light-meter (accessed on 28 February 2023).
- Unihedron (2023) Sky Quality Meter –, L. Unihedron (2023) Sky Quality Meter – L. Available online: http://unihedron.com/projects/sqm-l/ (accessed on 28 February 2023).
- Surlaba (2023) Surlaba XF-5800S Air Particulate Detector for Testing PM 2.5. Available online: https://www.amazon.ca/Quality-Pollution-Detector-Particulate-Analyzer/dp/B09N7BG36W (accessed on 28 February 2023).
- Wayne, R.P., Barnes, I., Biggs, P., Burrows, J.P., Canosa-Mas, C.E., Hjorth, J., Le Bras, G., Moortgat, G.K., Perner, D., Poulet, G., Restelli, G., Sidebottom, H., (1991) The nitrate radical: Physics, chemistry, and the atmosphere. Available online: https://www.sciencedirect.com/science/article/abs/pii/096016869190192A?via%3Dihub (accessed on 28 February 2023).
- Brown, S. and Stutz, J. (2012) Nighttime radical observations and chemistry. Available online: https://pubs.rsc.org/en/content/articlelanding/2012/cs/c2cs35181a/unauth (accessed on 28 February 2023).
- Hashim, B.M; Al-Naseri, S.K; Al-Maliki, A; Al-Ansari N. (2021) Impact of COVID-19 lockdown on NO2, O3, PM2.5 and PM10 concentrations and assessing air quality changes in Baghdad, Iraq. Available online: https://www.sciencedirect.com/science/article/pii/S0048969720355078 (accessed on 28 February 2023).
- Naghan, D.J., Neisi, A., Goudarzi, G., Dastoorpoor, M., Fadaei, A., Angali K.A., (2022) Estimation of the effects PM2.5, NO2, O3 pollutants on the health of Shahrekord residents based on AirQ+ software during (2012–2018). Available online: https://www.sciencedirect.com/science/article/pii/S2214750022000725 (accessed on 28 February 2023).
- Restrepo, C.E. Nitrogen Dioxide, Greenhouse Gas Emissions and Transportation in Urban Areas: Lessons From the Covid-19 Pandemic. Front. Environ. Sci. 2021, 9. [Google Scholar] [CrossRef]
- Kumar, M.S. , Krishna, V. M. Experimental investigation on performance of hybrid PCM’s on addition of nano particles in thermal energy storage. Mater Today Proc. 2019, 17, 271–276, https://doi org/101016/jmatpr201906430. [Google Scholar]
- Guttikunda, S.K.; Gurjar, B.R. Role of meteorology in seasonality of air pollution in megacity Delhi, India. Environ. Monit. Assess. 2011, 184, 3199–3211. [Google Scholar] [CrossRef] [PubMed]
- Kassomenos, P.; Vardoulakis, S.; Chaloulakou, A.; Grivas, G.; Borge, R.; Lumbreras, J. Levels, sources and seasonality of coarse particles (PM10–PM2.5) in three European capitals – Implications for particulate pollution control. Atmospheric Environ. 2012, 54, 337–347. [Google Scholar] [CrossRef]
- Mayer, H. Air pollution in cities. Atmospheric Environ. 1999, 33, 4029–4037. [Google Scholar] [CrossRef]
- Sullivan, B.L.; Aycrigg, J.L.; Barry, J.H.; Bonney, R.E.; Bruns, N.; Cooper, C.B.; Damoulas, T.; Dhondt, A.A.; Dietterich, T.; Farnsworth, A.; et al. The eBird enterprise: An integrated approach to development and application of citizen science. Biol. Conserv. 2014, 169, 31–40. [Google Scholar] [CrossRef]
- Diao, M.; Holloway, T.; Choi, S.; O’neill, S.M.; Al-Hamdan, M.Z.; Van Donkelaar, A.; Martin, R.V.; Jin, X.; Fiore, A.M.; Henze, D.K.; et al. Methods, availability, and applications of PM2.5 exposure estimates derived from ground measurements, satellite, and atmospheric models. J. Air Waste Manag. Assoc. 2019, 69, 1391–1414. [Google Scholar] [CrossRef]
- van Donkelaar, A.; Hammer, M.S.; Bindle, L.; Brauer, M.; Brook, J.R.; Garay, M.J.; Hsu, N.C.; Kalashnikova, O.V.; Kahn, R.A.; Lee, C.; et al. Monthly Global Estimates of Fine Particulate Matter and Their Uncertainty. Environ. Sci. Technol. 2021, 55, 15287–15300. [Google Scholar] [CrossRef]
- Thurairajah, U.; Littlewood, J.R.; Karani, G. A Proposed Method to Pre-qualify Sustainable Energy-Saving LED Luminaires for Outdoor Urban Lighting Applications.CONFERENCE NAME, LOCATION OF CONFERENCE, COUNTRYDATE OF CONFERENCE; pp. 357–367.
|
Disclaimer/Publisher’s Note: The statements, opinions and data contained in all publications are solely those of the individual author(s) and contributor(s) and not of MDPI and/or the editor(s). MDPI and/or the editor(s) disclaim responsibility for any injury to people or property resulting from any ideas, methods, instructions or products referred to in the content. |
© 2024 by the authors. Licensee MDPI, Basel, Switzerland. This article is an open access article distributed under the terms and conditions of the Creative Commons Attribution (CC BY) license (https://creativecommons.org/licenses/by/4.0/).
