1. Introduction
Variations in load demand have always made it vital for power transmission networks to be able to adapt to changing conditions. Regrettably, this has led to voltage oscillations that exceed the permissible variation range at a number of buses, in addition to power losses [
1]. As a consequence of this, the appropriate location and scale of EV are required in order to enhance the voltage profile and decrease electrical power losses. Research indicates that annual growth in global consumption will average 1.6 percent between now and 2025 [
2]. This growth is expected to continue until 2025. As a consequence of this, electric vehicles (EVs) are likely going to play a more significant role in the power systems of the future. Electric vehicles are currently seeing increased adoption in the electrical transmission network sector as a result of the generally positive effects they have on power systems. Electric vehicle (EV) systems are essential to the development of smart grid technology and form the infrastructure of intelligent electrical networks [
3].
It is essential to do study into the ways in which EVs will alter the technological landscape of electrical networks in order to prepare for these changes. It will take some time before an accurate assessment of the influence that electric vehicles have on the technical side of power networks can be performed [
4]. When EVs are integrated into electrical transmission networks, it is necessary to link the EVs in such a way as to ensure that there are no power losses and no alterations to the voltage profile. Fault currents, voltage oscillations, voltage management interference, etc. can cause these issues. Because installing EV units in power systems is difficult, considerable consideration must be paid to their siting and sizing to minimize losses and maximize voltage profile. This is necessary in order to achieve these two goals. Currently, a number of different optimization strategies for the positioning of electric vehicles within the electrical transmission network are being developed with the intention of reducing the amount of power that is lost and enhancing the voltage profile [
5].
1.1. Context, Background, and Motivation
New competitors entered the market in the early 1990s when many countries implemented open-energy markets and liberalized electricity generation. Traditional generators generate carbon dioxide, contributing to global warming. Solar and wind energy lower emissions compared to fossil fuels like coal, gas, and oil. Government incentives encourage IPPs to employ renewable energy. Power system design did not initially address EV-integrated transmission system redial design. EVs must be ideally placed and sized to fulfill system technical and economic demands. Optimal allocation and sizing are mostly used in decision-making algorithms.
1.2. Problem Statement
Reconfiguring the electrical transmission network and strategically placing EVs helped optimize power loss and voltage profile. HGAIPSO is an AI-based technique that preferentially arranges particles; it is used to restructure electric transmission networks in this research. In order to regulate reactive power and prevent power outages, this research establishes how EVs should be transmitted and injected into electrical grids. Algorithms like PSO, IPSO, and GA are explained. Needs analysis for electric vehicle charging stations. It will take some time for energy systems to learn to deal with the technical ramifications of EVs. Connecting EVs to electrical transmission networks is necessary to mitigate power losses and voltage variations,
Bus assignment for electric vehicles in a power system is affected by load characteristics such as the reactive power control limit and the power loss sensitivity.
For EV placement and sizing, a hybrid GA-IPSO solution solves the load flow problem with restrictions. To test the algorithm's performance, the IEEE-30-bus test system is employed.
1.3. Research Aims and Objectives
An improved optimization technique for the upgrade of electrical power networks is proposed in this research. Minimum real power loss, maximum reactive power, and steady voltage amplitude are just few of the requirements that are considered by the algorithm at each iteration.
HGAIPSO algorithm for efficient EV allocation in electrical transmission networks.
Optimal sizing and placement of EVs minimizes power losses and smoothest out voltage profiles.
1.5. Paper Structure
The study has five sections. The introduction covers electrical transmission network basics. This section also covers power system losses, voltage profiles, and how EVs effect power system performance. In
Section 2, we will discuss the many methods used to optimize power systems, as well as the elements that affect these methods, the equation for the multi objective function, and the constraints that must be adhered to. In the third section, "Methodology," we go over the thought processes that led to the selection of the suggested optimization algorithm, and we describe in depth the analysis of each optimization plan, including its parameters, steps in implementation, flow charts, and techniques.
Section 3 details the algorithm and flowchart.
Section 4 discusses results tables and graphs.
Section 5 concludes.
2. Literature Review
2.1. Configurations of EVs
EVs have the ability to run solely on electric propulsion or in conjunction with an internal combustion engine (ICE). The simplest sort of EV relies just on batteries as its source of energy; however, there are many variants that make use of a variety of other types of energy sources. These automobiles are hybrid electric models (HEVs) [
6]. The Technical Committee 69 Electric Road Vehicles (ERV) of the International Electrical Technical Commission proposed that cars with two or more forms of energy source, storage, or converters can be classified as HEVs as long as at least one of them provides electrical energy. This recommendation was made in response to a question posed by the Technical Committee 69 ERV of the International Electrical Technical Commission. This specification makes it possible to combine ICE and batteries, batteries and flywheels, batteries and capacitors, batteries and etc. [
7]. in a number of hybrid electric vehicle configurations. As a result, regular people and industry professionals started referring to hybrid electric cars (HEVs), ultra-capacitor-assisted electric vehicles (FCEVs), and fuel cell electric vehicles (FCEVs) to describe automobiles that have both an internal combustion engine and an electric motor. These terminologies have garnered a significant amount of support, and on the basis of this standard, EVs can be categorized as follows [
8]:
Electric Battery Vehicle (BEV)
Hybrid Electric Vehicle (HEV)
Plug-in Electric Hybrid Vehicle (PHEV)
2.1.1. Batteries Electric Vehicles (BEVs)
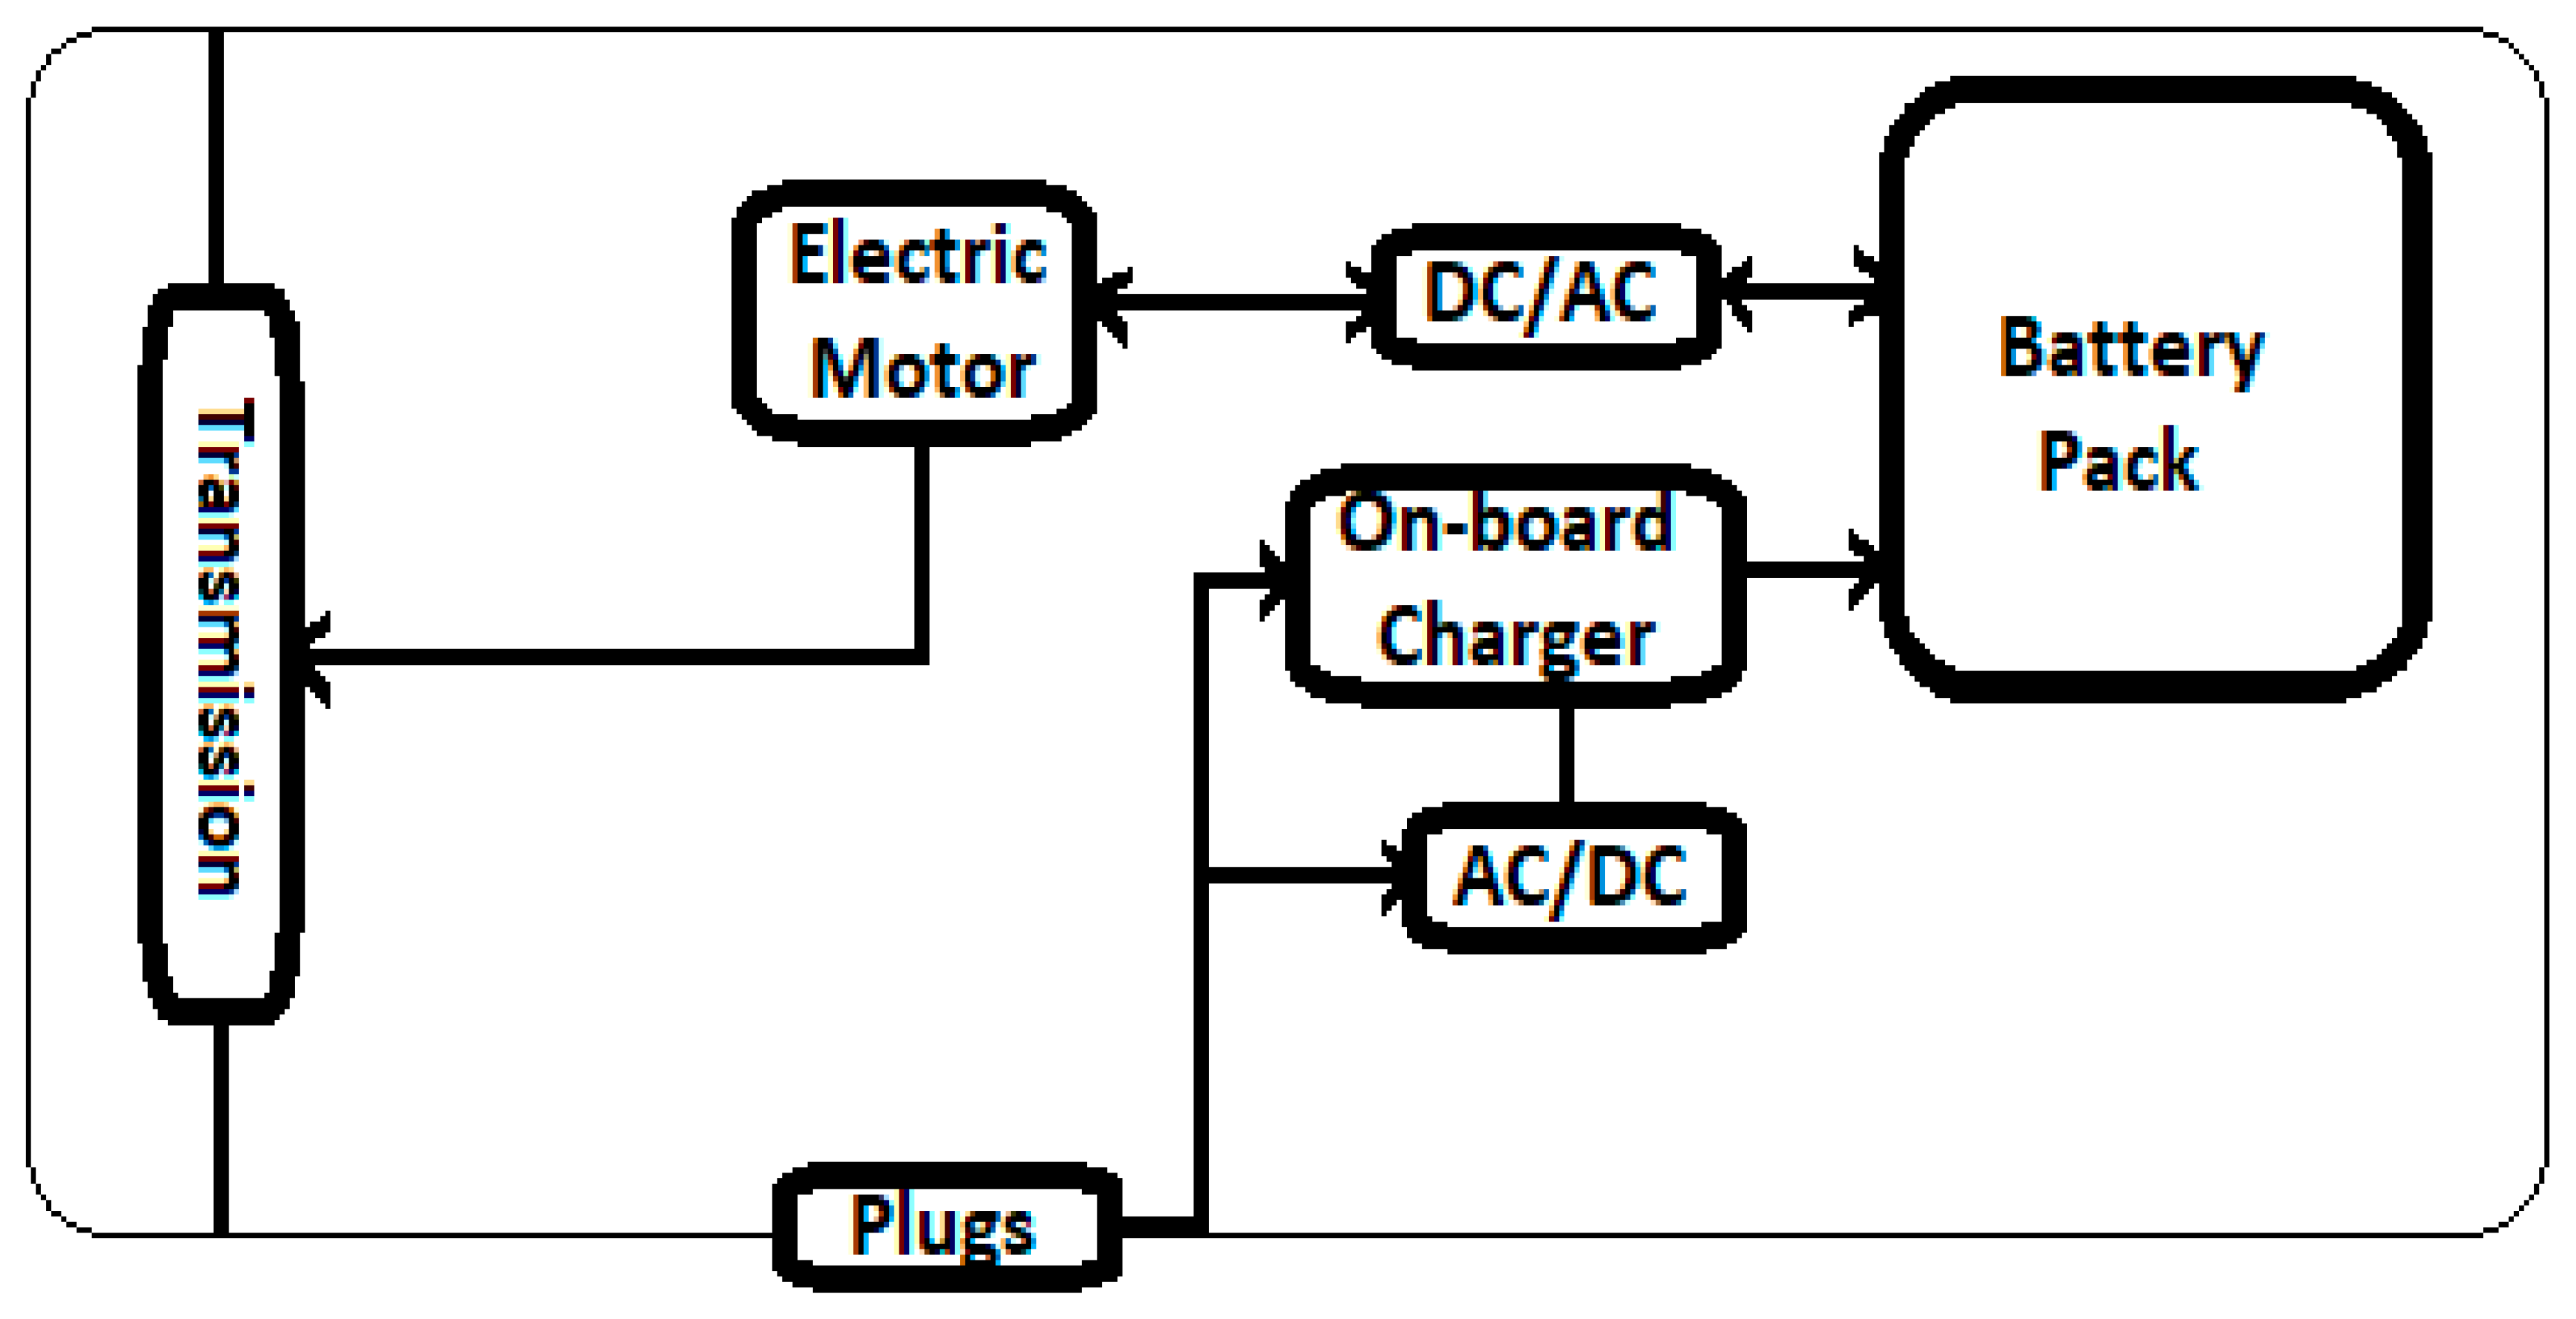
Given that a battery is the only source of energy for the powertrain of a BEV
Figure 1, the range that may be achieved by such a vehicle is directly proportional to the capacity of the battery [
9]. A BEV is completely carbon dioxide (CO
2) emission free because it does not have a tailpipe or other source of exhaust emissions. BEVs have the potential to go between 100 and 250 kilometers on a single charge, while using 15 to 20 kWh for every 100 kilometers driven. This range is determined by the characteristics of the vehicle. There is a range of between 300 and 500 kilometers for battery electric vehicle models that have larger battery packs [
10]. However, battery electric vehicles (BEVs), in comparison to other types of EVs, have a substantial disadvantage due to their significantly reduced driving range and dramatically increased charging periods. The most effective way to address this issue would be to design and implement an EMS that is suitable for BEVs.
Compared to three previous braking techniques, this one increased range to 20 km/kWh. This innovative braking technique could increase range by 4.16 km/kWh compared to mechanical braking alone. One technique to expand the range of battery electric vehicles (BEVs) is to increase the battery pack's capacity. However, it is possible that a battery pack with a large capacity is not useful because it requires a significant amount of space and significantly increases the weight of the vehicle [
11]. This has a direct impact on the vehicle's performance as well as its fuel economy, and it also raises the total cost of the vehicle. An electric three-wheel vehicle that is fully loaded (300 kg) and has a lithium-ion battery pack (LIB) that is 16 kWh has a range that is approximately 12.5% less than it would have with a half-load (150 kg) (from 200 to 175 km) [
12].
Examining different driving styles is another method that can be used to extend the range of a battery-electric vehicle (BEV) without having to increase the capacity of the battery. Controlling the flow of energy and power is one way that one might put this method into action when driving. Runtime power management was developed by in [] order to extend the range of battery electric vehicles [
13]. An algorithm was proposed to cut down on journey time and the amount of gasoline used. The fact that this technique is based on a multi-objective algorithm enables it to produce results that are superior to those produced by other algorithms that have been examined. In [
14] a study suggested a velocity profile optimization-based optimal control method to reduce energy consumption. The proposed algorithm was able to cut energy consumption by between 8 and 10%, thanks to its management of driving duration and speed. These citations provide a workable answer to the problem of lowering battery capacity while maintaining a lower overall energy consumption [
15].
2.1.2. Hybrid Electric Cars (HEVs)
In accordance with the standards set forth by Technical Committee 69 (Electric Road Vehicles) of the International Electro-Technical Commission, a hybrid electric vehicle (HEV) is a motor vehicle that utilizes two or more energy sources, storage devices, or converters, at least one of which creates electricity. Unlike conventional vehicles, HEVs use several energy sources, storage, and/or converters [
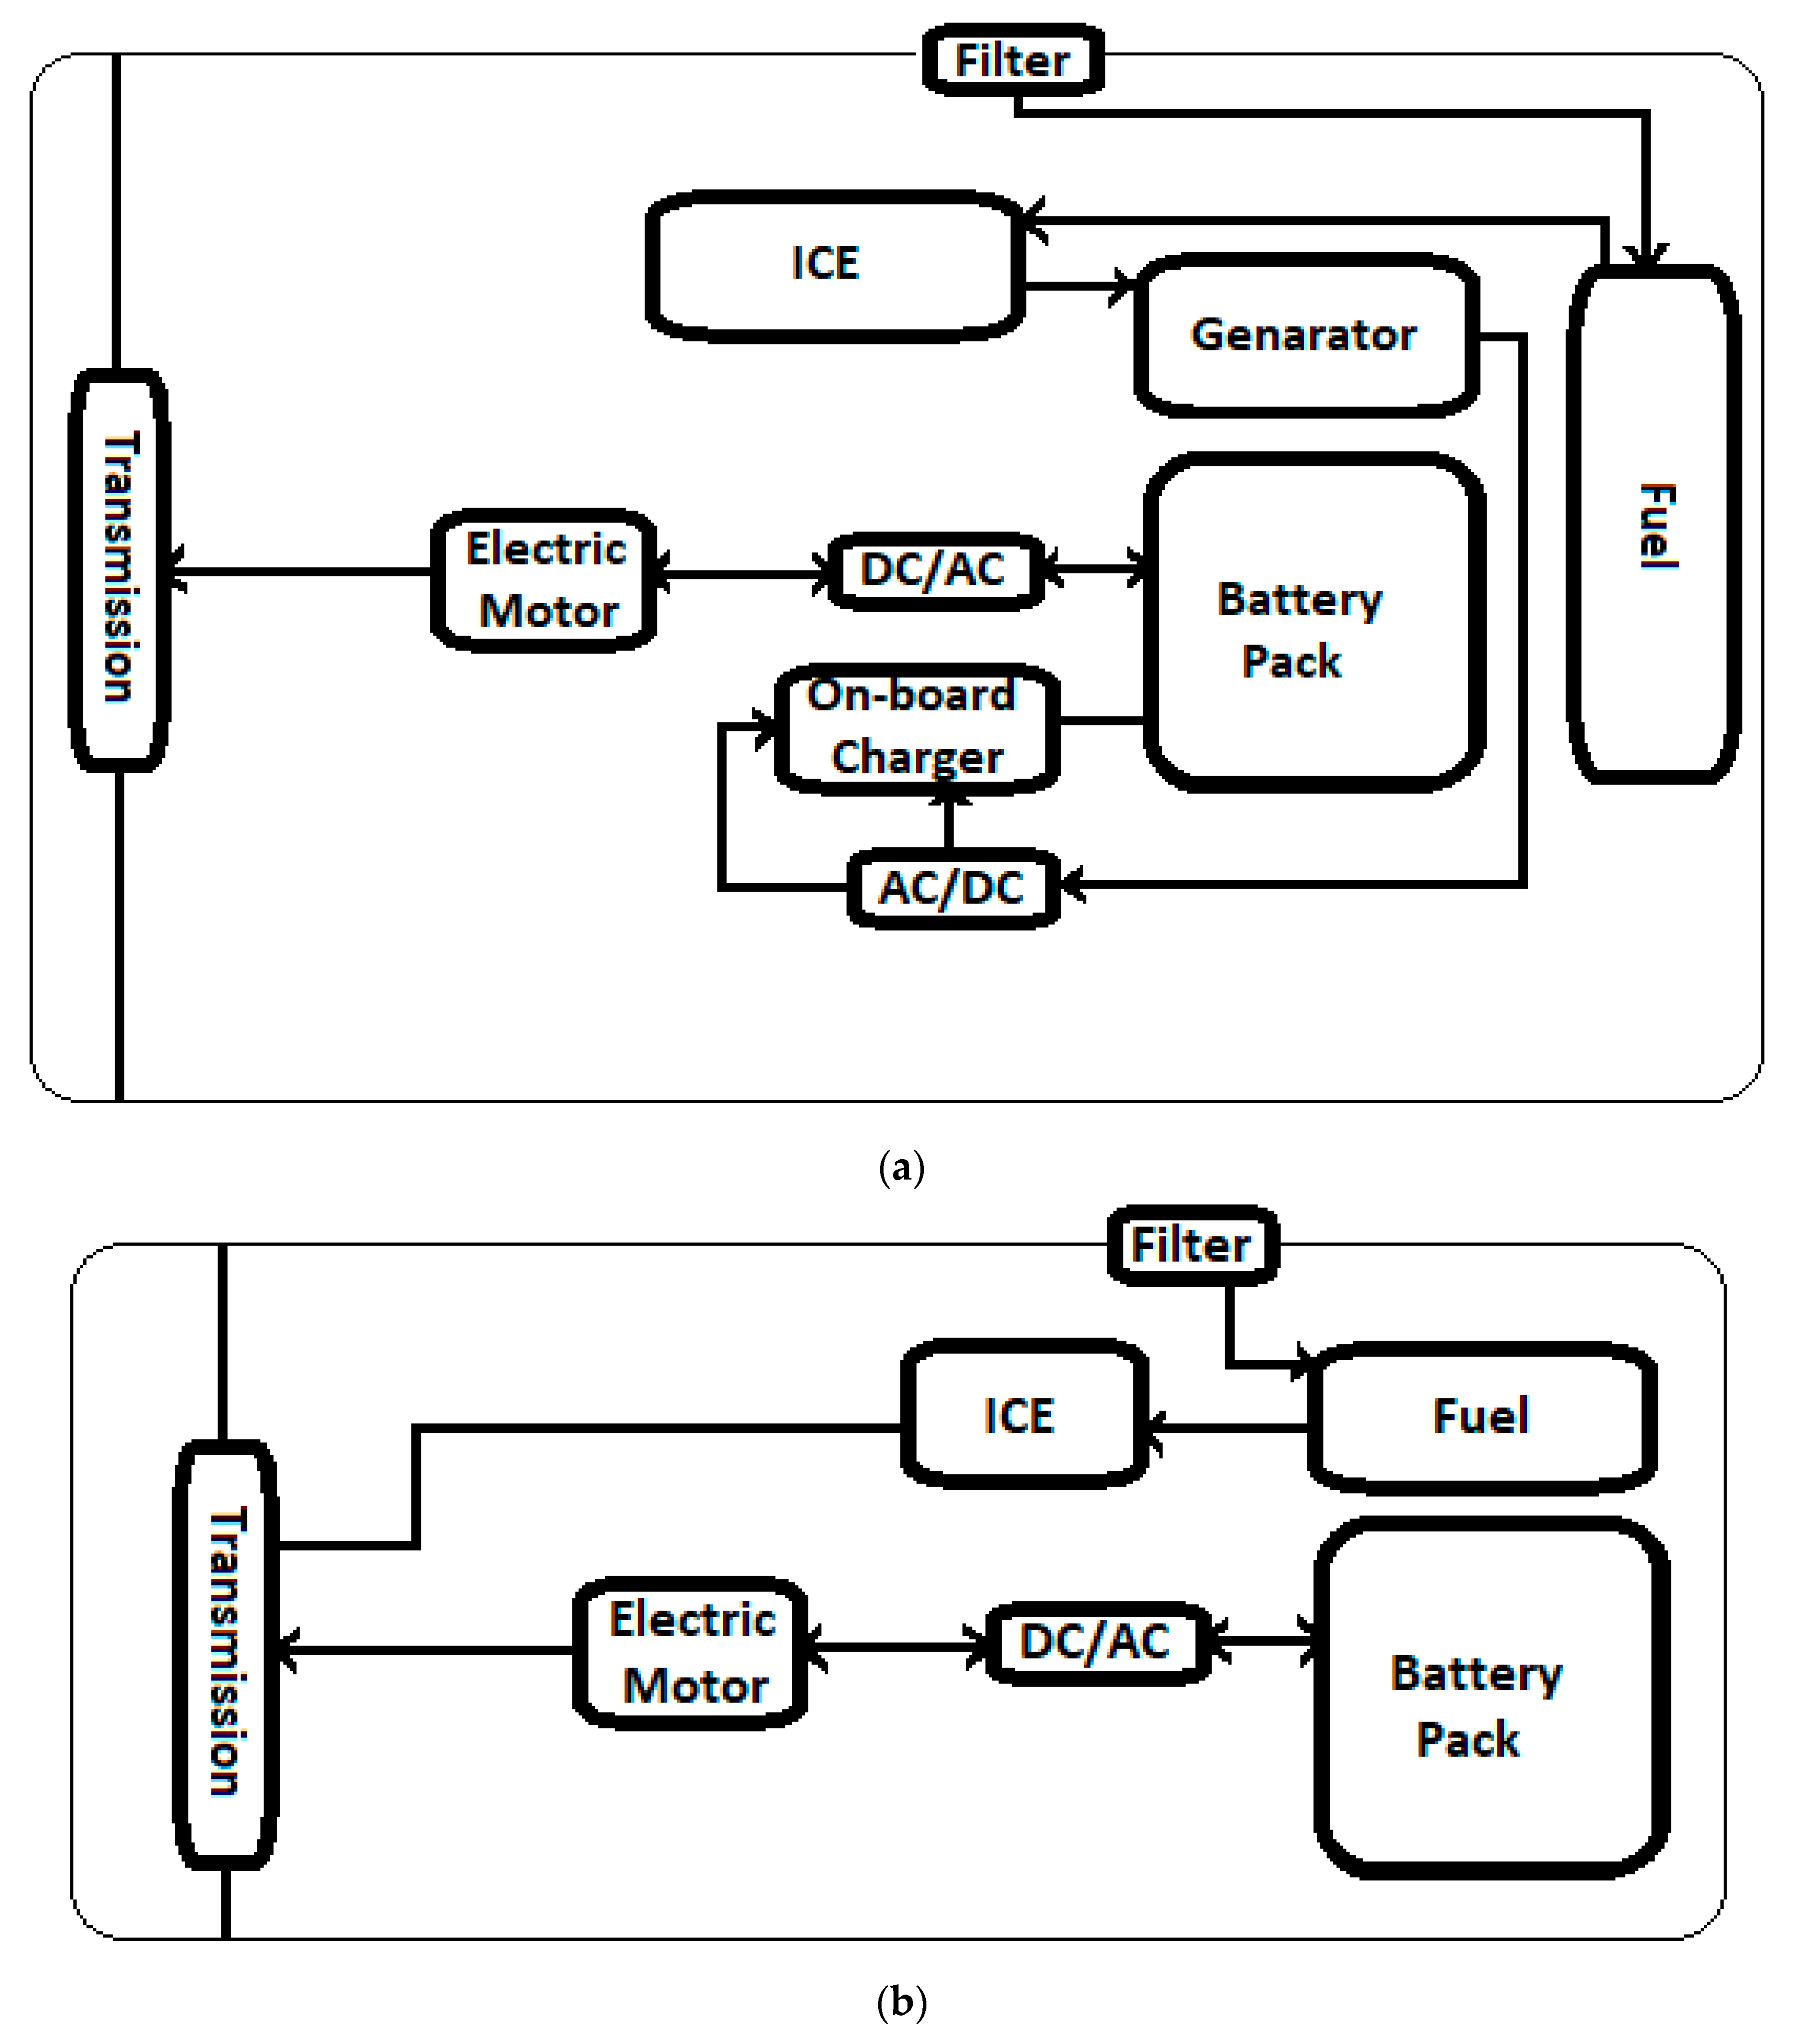
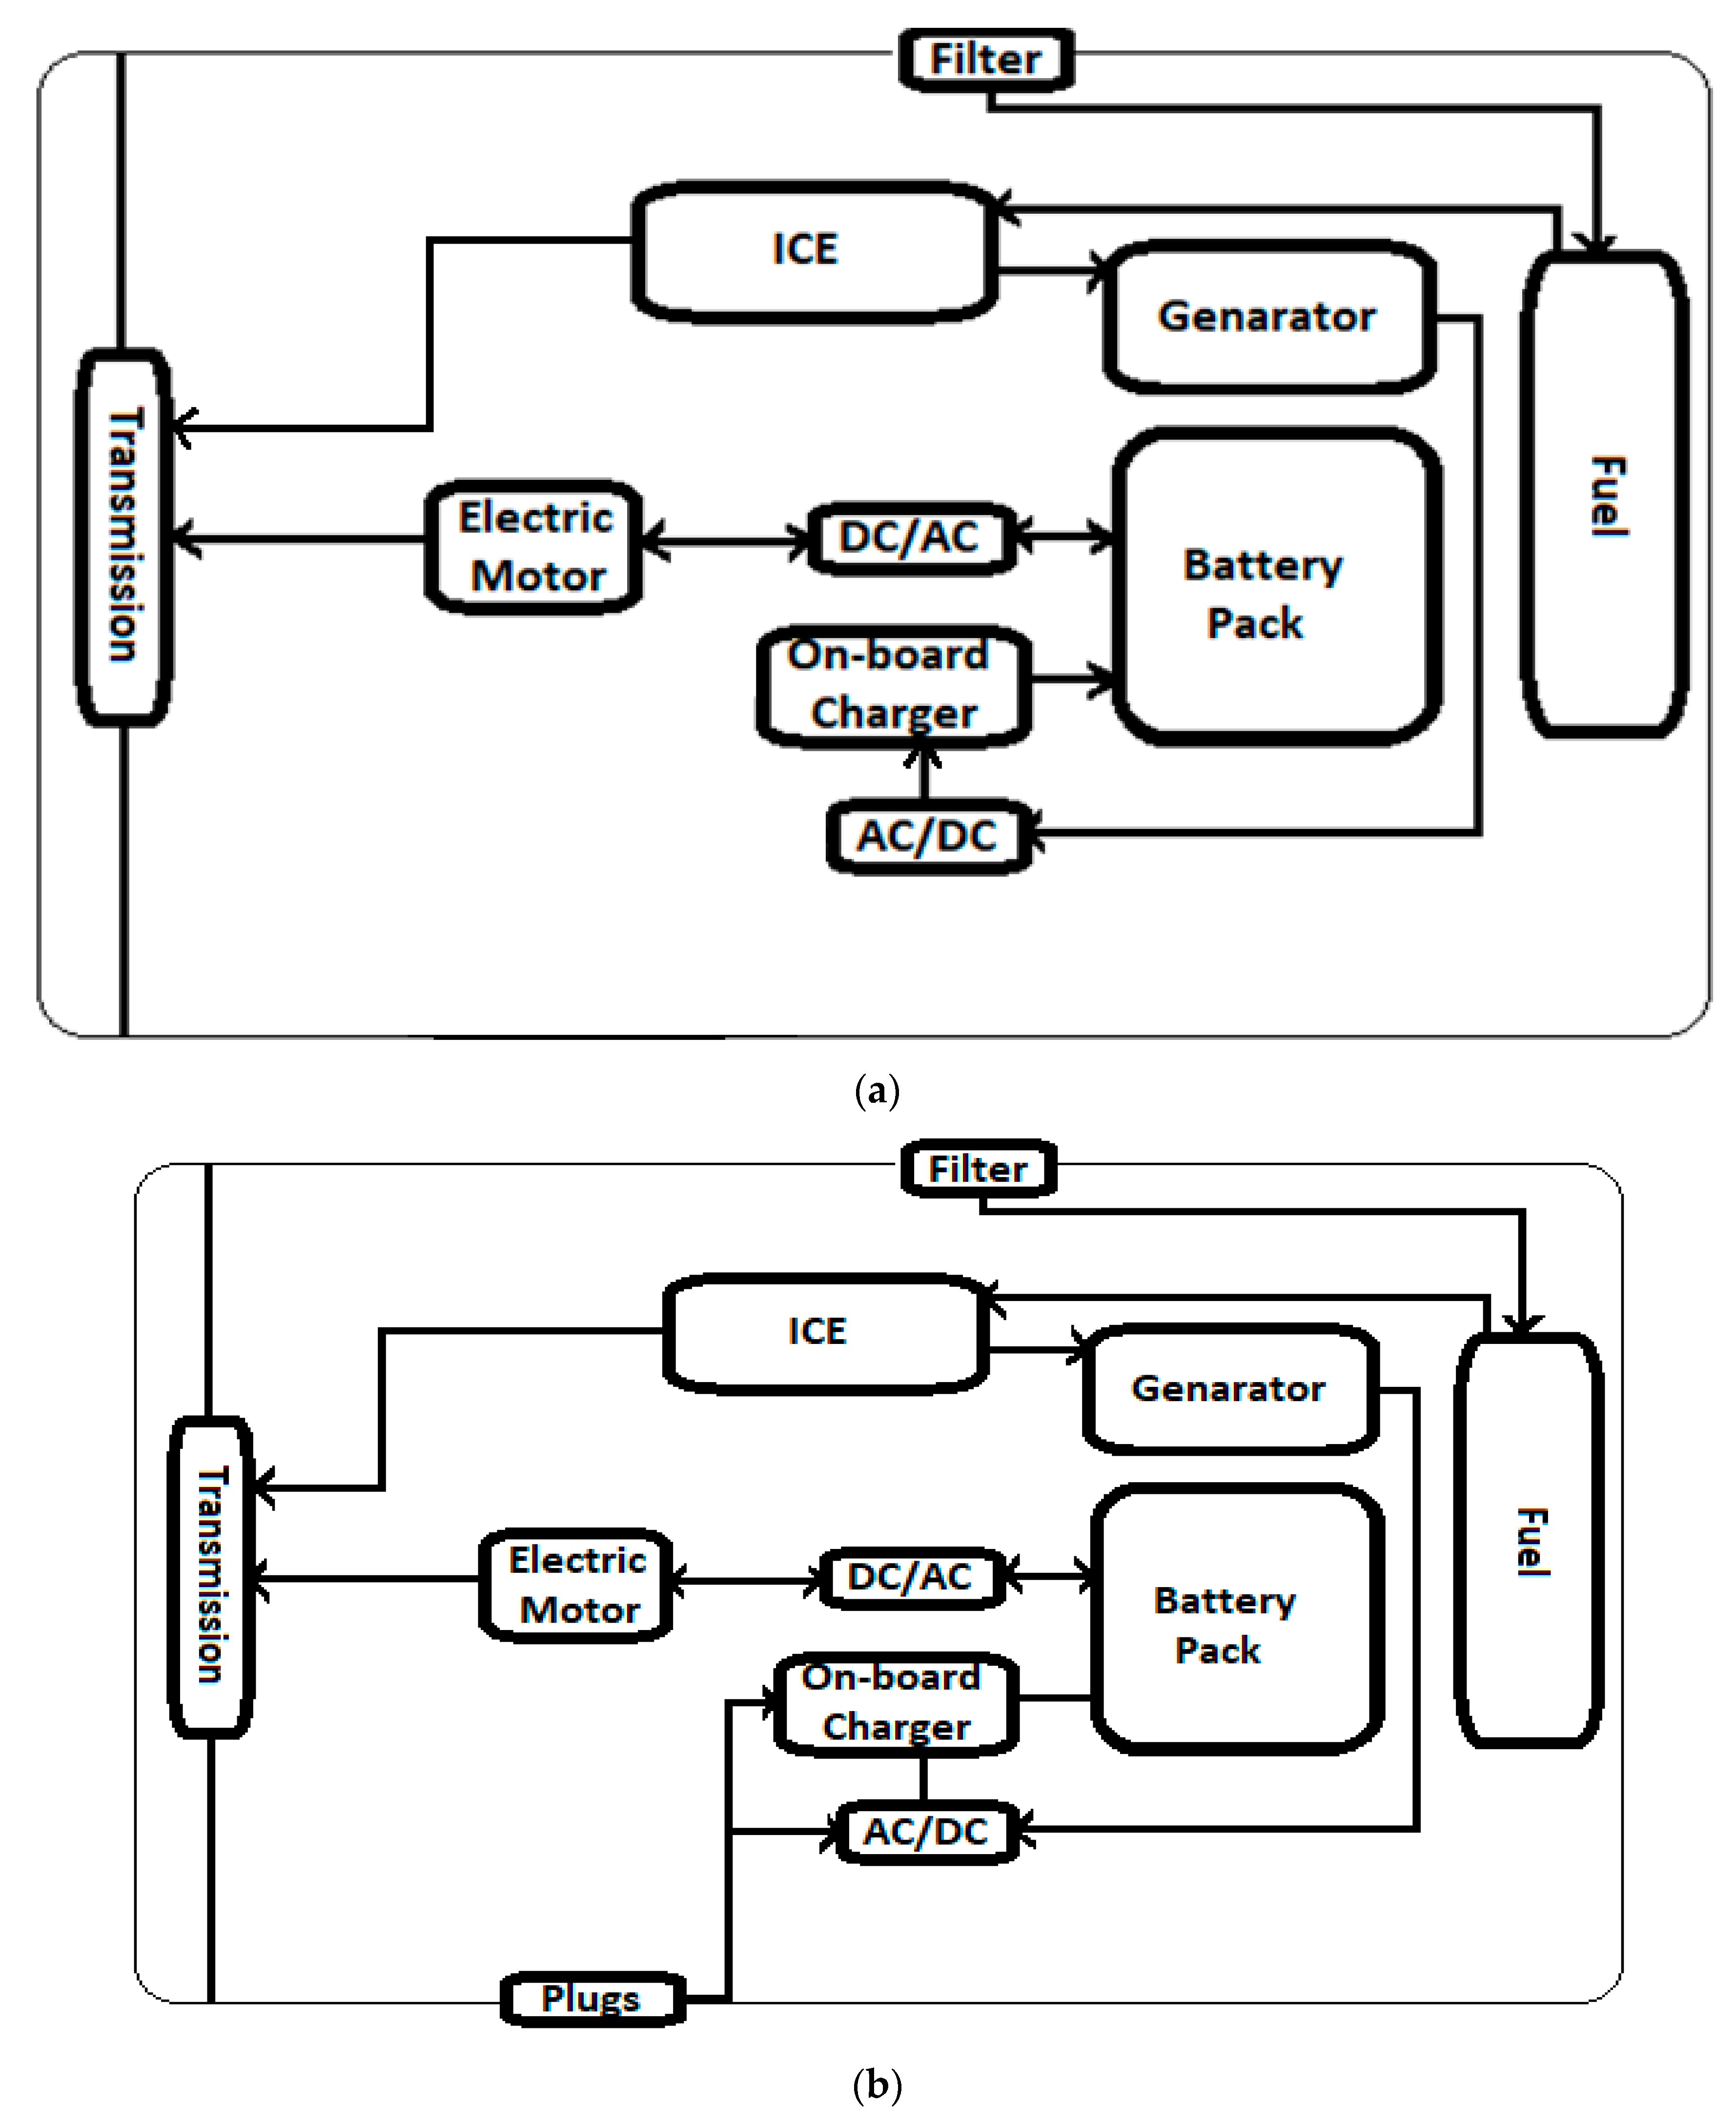
16]. Because BEVs have a limited driving range, hybrid electric vehicles (HEVs), which combine a traditional internal combustion engine (ICE) with a battery system, have become an appealing option. An electric motor is the only source of propulsion for a series hybrid electric vehicle, as shown in
Figure 2a. In contrast, both an internal combustion engine (ICE) and an electric motor are connected to the gearbox of a parallel hybrid electric vehicle (HEV), which transmits power to the wheels simultaneously (see
Figure 2b). Many studies have been conducted to determine the amount of fuel that parallel and series hybrid electric vehicles consume as well as how efficiently they use their fuel (HEVs). In [
17] for instance, compared the amount of gasoline that was consumed by series and parallel HEV road sweeper trucks while keeping the same amount of power and traveling the same amount of distance.
Based on the findings of the comparison, the series hybrid design (3.8 L/h) had a lower fuel consumption rate than the parallel hybrid design (6.2 L/h). When the vehicle was operating in the series hybrid mode, the internal combustion engine (ICE) kept its speed constant throughout the transport mode. Due to the fact that there are three different conversions that take (place mechanical, electric, and mechanical), parallel HEVs are theoretically considered to have smaller power conversion losses than series HEVs do. When the power splitting mode is engaged, it is possible to cut losses in the drive train, the engine, and the braking system [
19]. This could lead to a gain in fuel economy that ranges from 0.3 to 36.7%. In addition to this, the fuel efficiency of parallel HEVs can be up to 68 percent better than that of a traditional automobile. This substantial improvement in fuel efficiency was made possible, in part, by the implementation of regenerative braking, which refers to the recuperation of energy that would have otherwise been lost. As a consequence of these studies, series hybrid electric vehicles (HEVs) have been successfully deployed in transportation mode [
20].
Mild hybrid electric cars, also known as MHEVs, are another form of hybrid electric vehicle (HEV) that are equipped with an electric motor and a battery that has a capacity that is on the lower end of the spectrum (10–20 kW) [
21]. Although the hardware components of this form of EV and other types of HEVs are identical, the control algorithms used by each of these categories of vehicles are very different. Because the internal combustion engine is responsible for the majority of the production of the vehicle's propulsion energy, a gasoline-powered hybrid electric vehicle (MHEV) is distinguished from other types of HEVs by having a lower hybridization power approximately 15% and smaller driving electric components. This is due to the fact that the internal combustion engine is responsible for the majority of the production of the vehicle's propulsion energy [
22]. When it comes to energy management, the most difficult obstacle for HEVs to overcome is likely going to be the combination of many energy sources and optimization. In order to determine a pattern of a driving cycle's energy consumption, a comprehensive modeling system, data from test runs, and simulator software that has been approved for commercial use are required. In addition, the data from the test runs are necessary in order to obtain the energy consumption [
23].
2.1.3. Plug-In Electric Hybrid Cars (PHEVs)
The range of HEVs may be increased, which led to the development of PHEVs. Like HEVs, plug-in hybrid electric vehicles (PHEVs) have an internal combustion engine (ICE), an electric motor, a generator, and a battery. Regenerative braking can be replaced with utility grid charging. PHEVs are BEV/HEV hybrids [
24].
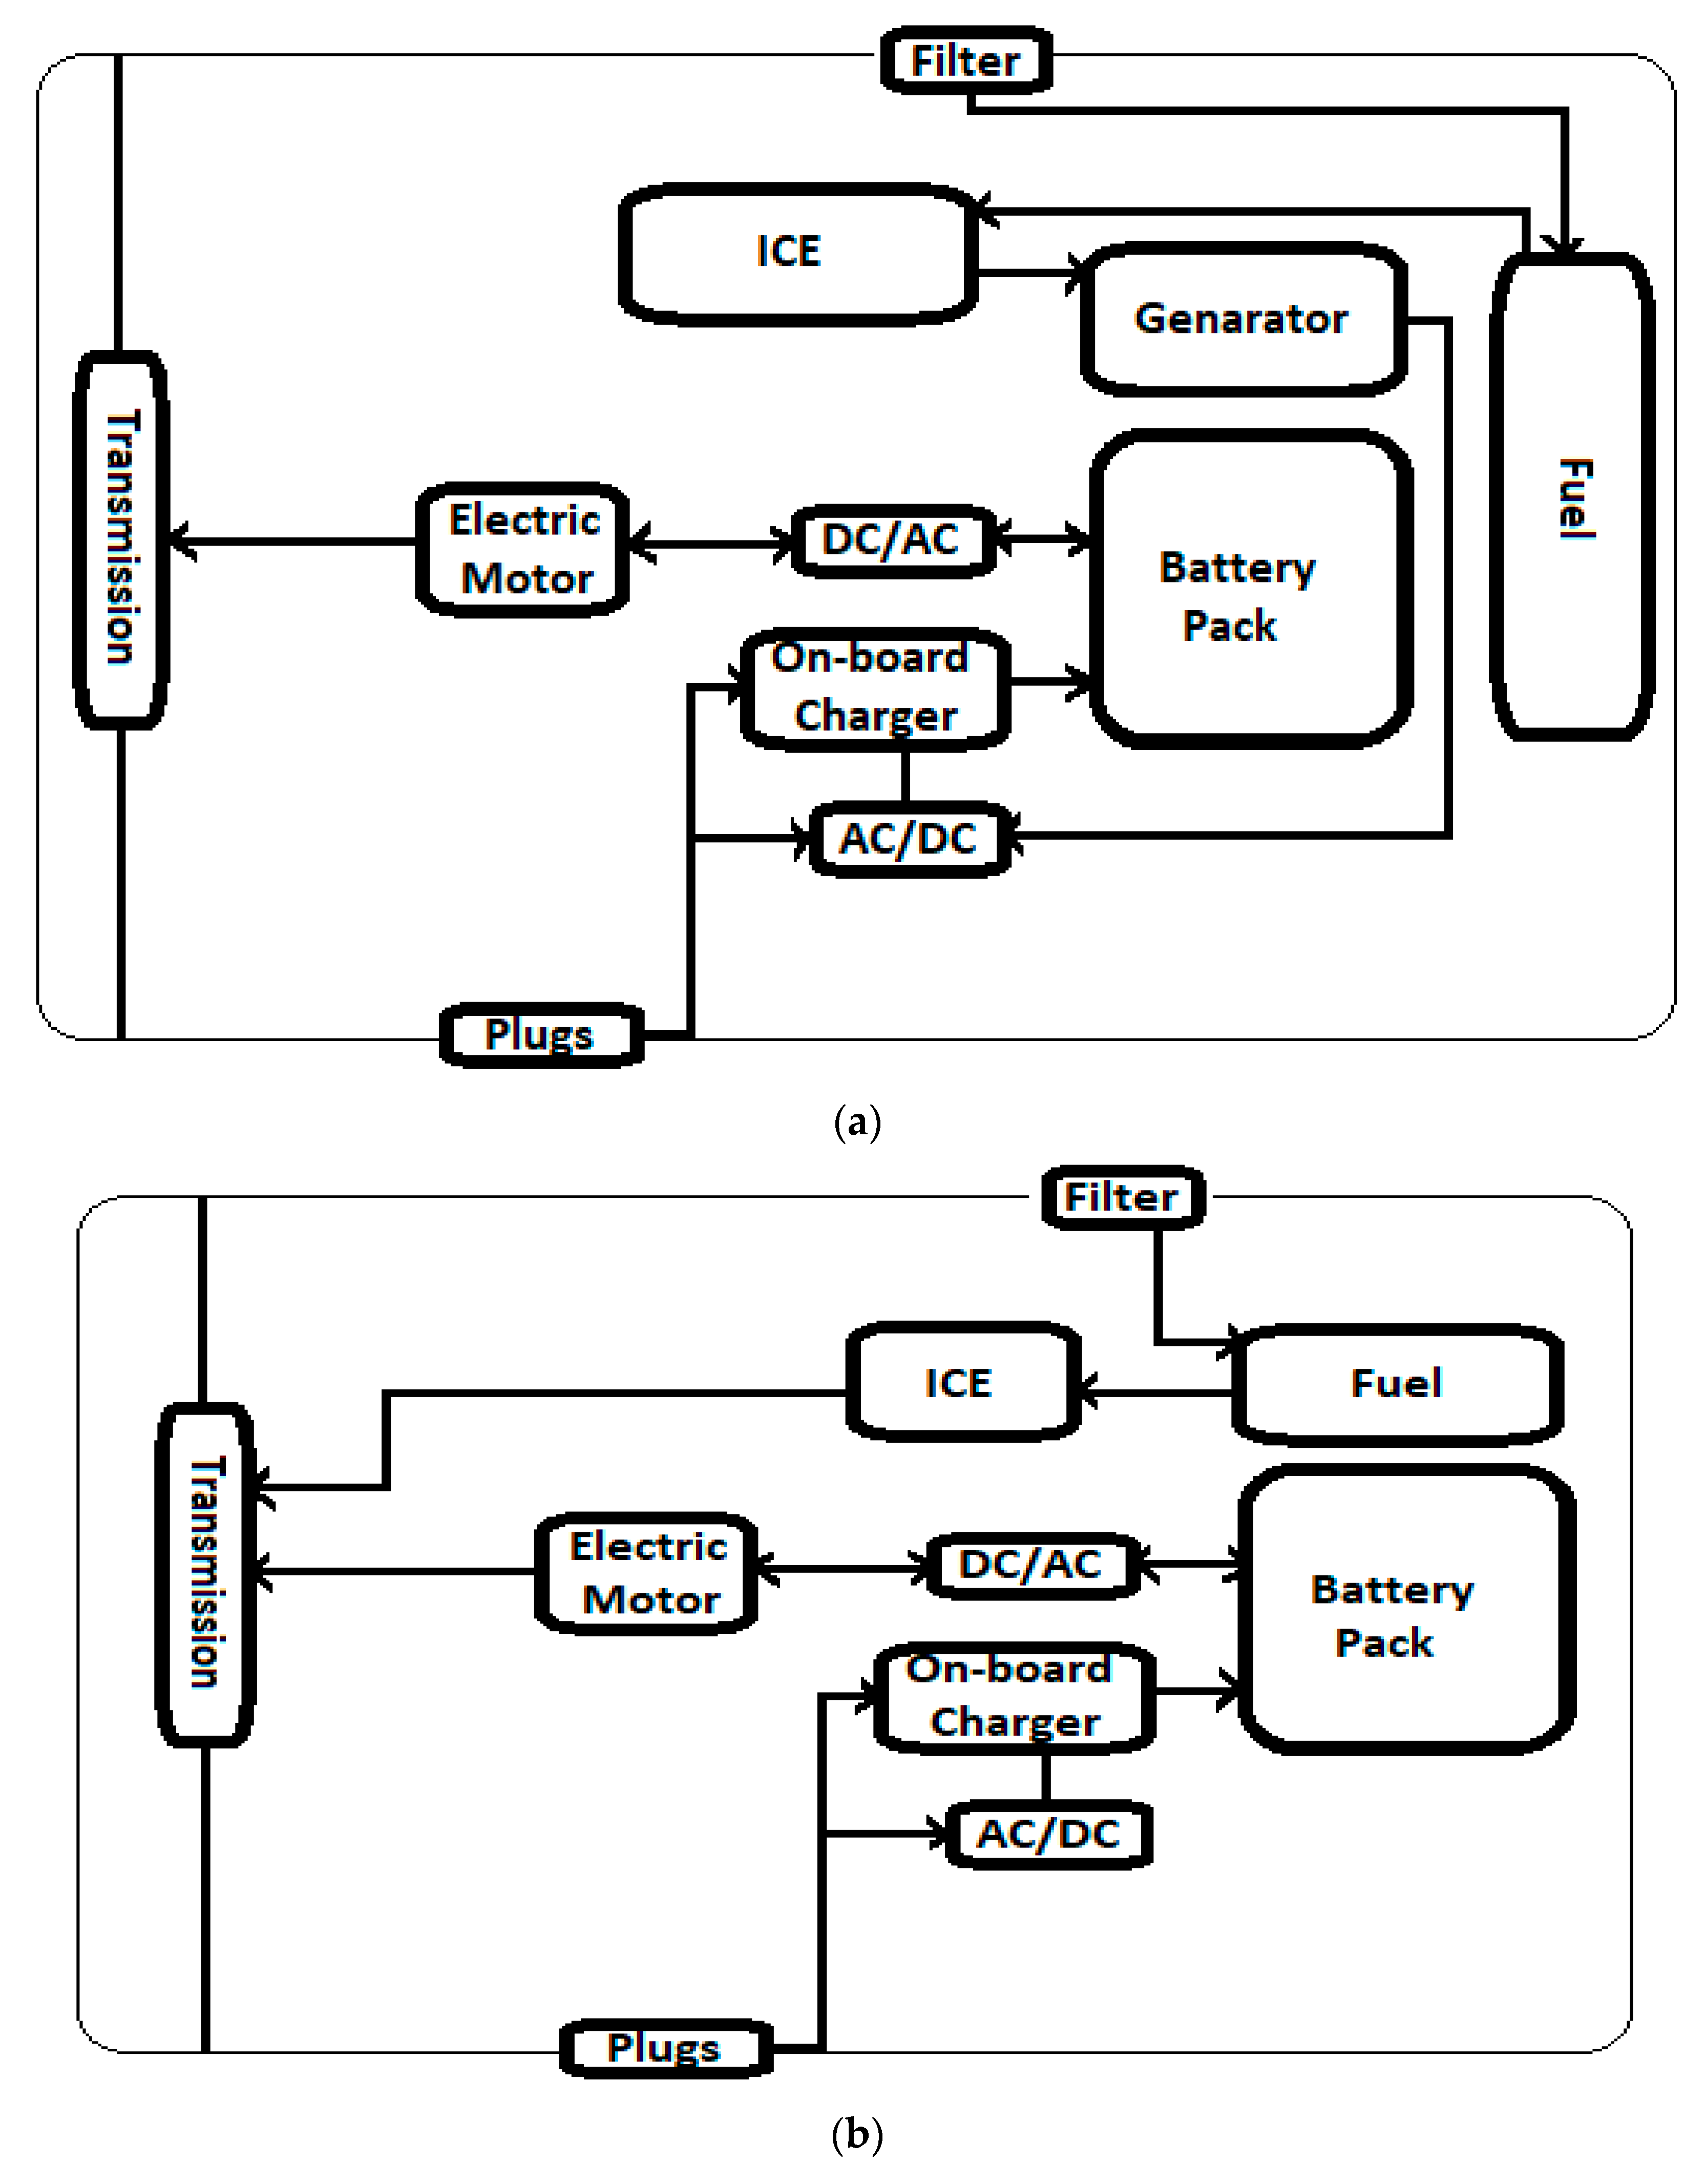
Figure 3a,b show different plug-in hybrid electric automobiles (PHEVs). Hybrid electric vehicles use "series" or "parallel" ICEs to charge the battery or provide traction (HEVs).
Larger battery packs are necessary for PHEVs because they can potentially charge off the grid, unlike HEVs. The maximum state-of-charge (SOC) that a hybrid electric vehicle (HEV)'s battery is allowed to hold is limited by the charge sustenance mode (CS). Depending on the driver's preference, a plug-in hybrid electric vehicle (PHEV) can switch between charge depletion (CD) mode (which prioritizes the electric motor over the internal combustion engine) and pure electric (EB) mode [
25]. Reduce fuel consumption in parallel PHEVs with this research on charge depletion mode. The urban dynamometer driving schedule (UDDS) reduced parallel PHEV fuel consumption by 7.1% over 64 km, 6.3% over 48 km, and 5.6% over 32 km. This study found that the PHEV's CD control technique effectiveness increased proportionally with the test distance.
In the same way as with BEVs, when the battery capacity of PHEVs increases, the primary issue shifts to the charging time; as a result, charging strategies are required to maintain the vehicle's performance. A fast charger can give a higher DC current capacity for car charging. Both standards support quick charging. In [
26] a study developed, implemented, and tested the V2G system. A vehicle with a fully functional CHAdeMO inter-face (VCI) at the physical and protocol levels was able to control communication and electrical transfer between the car and charger. The VCI was fully implemented at both the physical and protocol standards. Plug-in hybrid electric vehicles and battery electric vehicles could shape the future of transportation by storing energy from the grid in their batteries and feeding it back into the transmission network when needed [
27].
It was possible to achieve optimal charging timing for plug-in hybrid electric vehicles (PHEVs) by synchronizing a number of plug-in hybrid electric vehicles (PHEVs) inside a smart grid system. The findings revealed that it had an adequate level of robustness and provided values with a standard deviation that was less than 1 (= 0.8425).
Figure 1 illustrates the configuration of the powertrain used in series-parallel hybrid electric vehicles and plug-in hybrid electric vehicles [
28]. HEVs and PHEVs that run in a series-parallel mode are able to take use of all of the benefits that are associated with running in either the series or the parallel mode. These benefits include increased fuel economy, increased range, and increased efficiency. A study on the efficiency of fuel usage in series-parallel plug-in hybrid electric vehicles was carried out by Zhao and Burke.
Their research showed that a series-parallel PHEV using the UDDS (city driving) method had a fuel economy that was 18.1 km/l lower than a similar series shaft PHEV, which averaged 20.4 km/l. This information was derived from comparing the two types of PHEVs using the same driving strategy. As a result of energy allocation and power management in a drive system, it provided a real-world example of the control method for series-parallel plug-in hybrid electric vehicle (PHEV) power management. This was possible since it was based on a drive system. The result brought the overall system's efficiency up by 27.50 percentage points, from 19.3 to 24.6 km/L. Nonetheless, this type of vehicle is heavier, has a less sophisticated look, and carries a higher price tag [
29].
Another type of plug-in hybrid electric car is an extended-range electric vehicle (EREV). In contrast to other types of PHEVs, the electric motor always powers the wheels, and the internal combustion engine doubles as a generator to keep the vehicle's battery charged whenever it runs low or when the vehicle is in motion [
30]. It's possible that the decreased consumption of mineral resources is due to the vehicle's smaller size and the fact that there are fewer components overall. It is possible to achieve minimal fuel consumption since the gasoline is only required to run the generator. The fact that the generator is the solitary component that is used in the process of providing electricity to the vehicle makes this outcome conceivable. The generator's speed and torque can both be adjusted to achieve the highest possible levels of energy efficiency in order to cut down on the amount of money spent on fuel [
31]. Because of the range ex-tender, EREVs are able to travel further than BEVs; nevertheless, in order to compete with BEVs in terms of energy efficiency, they need to be much more compact.
2.2. Battery Engineering
The battery is the primary source of energy for electric vehicles, other sources of energy include the energy produced by regenerative braking, the energy produced by fuels, and the energy produced by various power storages such as a super capacitor. The battery features a versatile architecture that allows it to be assembled in either series, parallel, or series-parallel configurations, depending on the required amount of voltage and current. In addition, the battery incorporates the three standard forms of electric vehicle cells, which are cylindrical, pouch, and prismatic cells [
32]. While shopping for battery-powered equipment, be sure to give equal consideration to the product's expected lifespan, power density, energy density, capacity, and state-of-charge (SOC). The most potent power sources for EVs are rechargeable batteries like lithium-ion. Compared to the other two batteries, the LIB had a higher specific energy and energy density. Rechargeable batteries were developed as a result [
33].
Lead-acid batteries have a specific gravimetric energy density of 30–50 Wh/kg, making them the least efficient. The lifespan of a lead-acid battery is 500–1000 cycles. To go two hundred kilometers, a lead-acid battery that weighs at least five hundred kilo-grams is needed to generate one kilo-watt-hour (kWh) of electricity. Low-performance, tiny cars can use lead-acid batteries. Since their invention, lead-acid batteries have been recycled. As usual. This battery's recycling rate is close to 100% in Western countries and elsewhere. Lead-acid batteries use 85% of the world's lead, and 60% of it is recycled. Lead-acid batteries are easily damaged; thus their components can fall out of their plastic containers with their acid. The main drawbacks of this battery technology are its poor cold performance and memory effects [
34]. Another issue is the battery's long recharge time and high self-discharge rate when idle. The battery's poor charge and discharge efficiency is the biggest issue.
Ni-Cd batteries need high charge and discharge rates and are memory-prone. The substance is toxic and possesses 60–80 Wh/kg specific energy density. Recharging nickel-hydrogen (Ni-H) batteries was studied by Chen and colleagues. It was difficult to develop a low-cost grid storage material with a longer battery cycle and calendar lifespan. Material needs more cycles [
35]. This paper proposed a 10,000-cycle manga-nese-hydrogen battery for grid energy storage. Mn2+/MnO2 redox cathodes and H+/H2 gas anodes comprise the battery. The battery's areal capacity loading was projected to improve tenfold to 35 mAh/cm2 by replacing the Mn2+/MnO2 redox with a nickel-based cathode. In place of an expensive platinum catalyst, a less expensive nickel-molybdenum-cobalt alloy was used to catalyze the evolution of hydrogen into oxygen in alkaline electrolytes for the anode.
The sodium-nickel chloride (Na-NiCL2) batteries, also known as the Zero Emissions Batteries Research Activity (ZEBRA) batteries, are regarded as safe and inexpensive. Additionally, they are able to have nearly all of their capacity depleted without having a negative impact on the amount of time they will last. In addition, the energy that is contained within the battery [
36]. a value that is around 150 Wh/kg. Because a ZEBRA battery may operate at temperatures ranging from 245 to 350 degrees Celsius, the thermal management and safety challenges associated with this battery are under a significant amount of strain. As a storage source, ZEBRA batteries are a good example. Due to the cell's chemical reactions' intrinsic safety, multiple tests, including immersion in 900 liters of saltwater with a 5% salt content, seismic and vibratory testing, and a 30-minute external fire expo-sure test that did not harm the modules or cells, showed that fire risk is low. So, it's suitable for stationary energy storage. This technique is good for load leveling, voltage management, time shifting, and renewable energy power swing reduction due to its three-hour rate discharge length [
37].
The latest battery technology is lithium. Its energy, light weight, low cost, non-toxicity, and rapid charging make them the most promising batteries. Anode electrodes in lithium-ion batteries are typically made of silicon nanoparticles (SiNPs) due to the high energy density of this material. Lithium batteries have the lowest equivalent mass and maximum electrochemical potential. It's also efficient and durable. However, it costs over 700 USD per kWh and can cause fires and property damage if overheated. Mass transport constraints in the electrolyte and electrodes will cause severe polarization in lithium batteries with improved performance [
38]. Polarization is affected differently by each activity due to the dynamic and kinetic properties of the material, as well as the design of the battery and the mechanism for charging and discharging it. To reduce solid phase diffusion polarization, Chen and colleagues reduced the active material's particles. If half of the active material particles were present, LIB concentration may be significantly reduced. When the active material particles were twice as large, the Li-ion concentration difference was much greater.
Several lithium-ion batteries (LIBs) have been made worldwide. LTO, LCO, LMO, NMC, and LFP are some of them (LFP). LIBs employ a different electrolyte than lithium-polymer batteries (Li-Po). The LIB, in contrast to the LB, possesses a higher energy density, a cheaper cost, and does not have a memory effect. LIBs are cheaper and memory-free. In contrast, the Li-Po battery features a structure that is both flexible and adaptable, as well as a low profile and a reduced chance of electrolyte leakage. Because doing so improves the efficiency of packaging, it is typically cut into multiple different sizes. On the other hand, Li-Po batteries have a lower energy density, a shorter lifespan, and a manufacture cost that is significantly higher than average [
39]. The characteristics of electric vehicle batteries that are now in use are outlined in
Table 1, which may be found here.
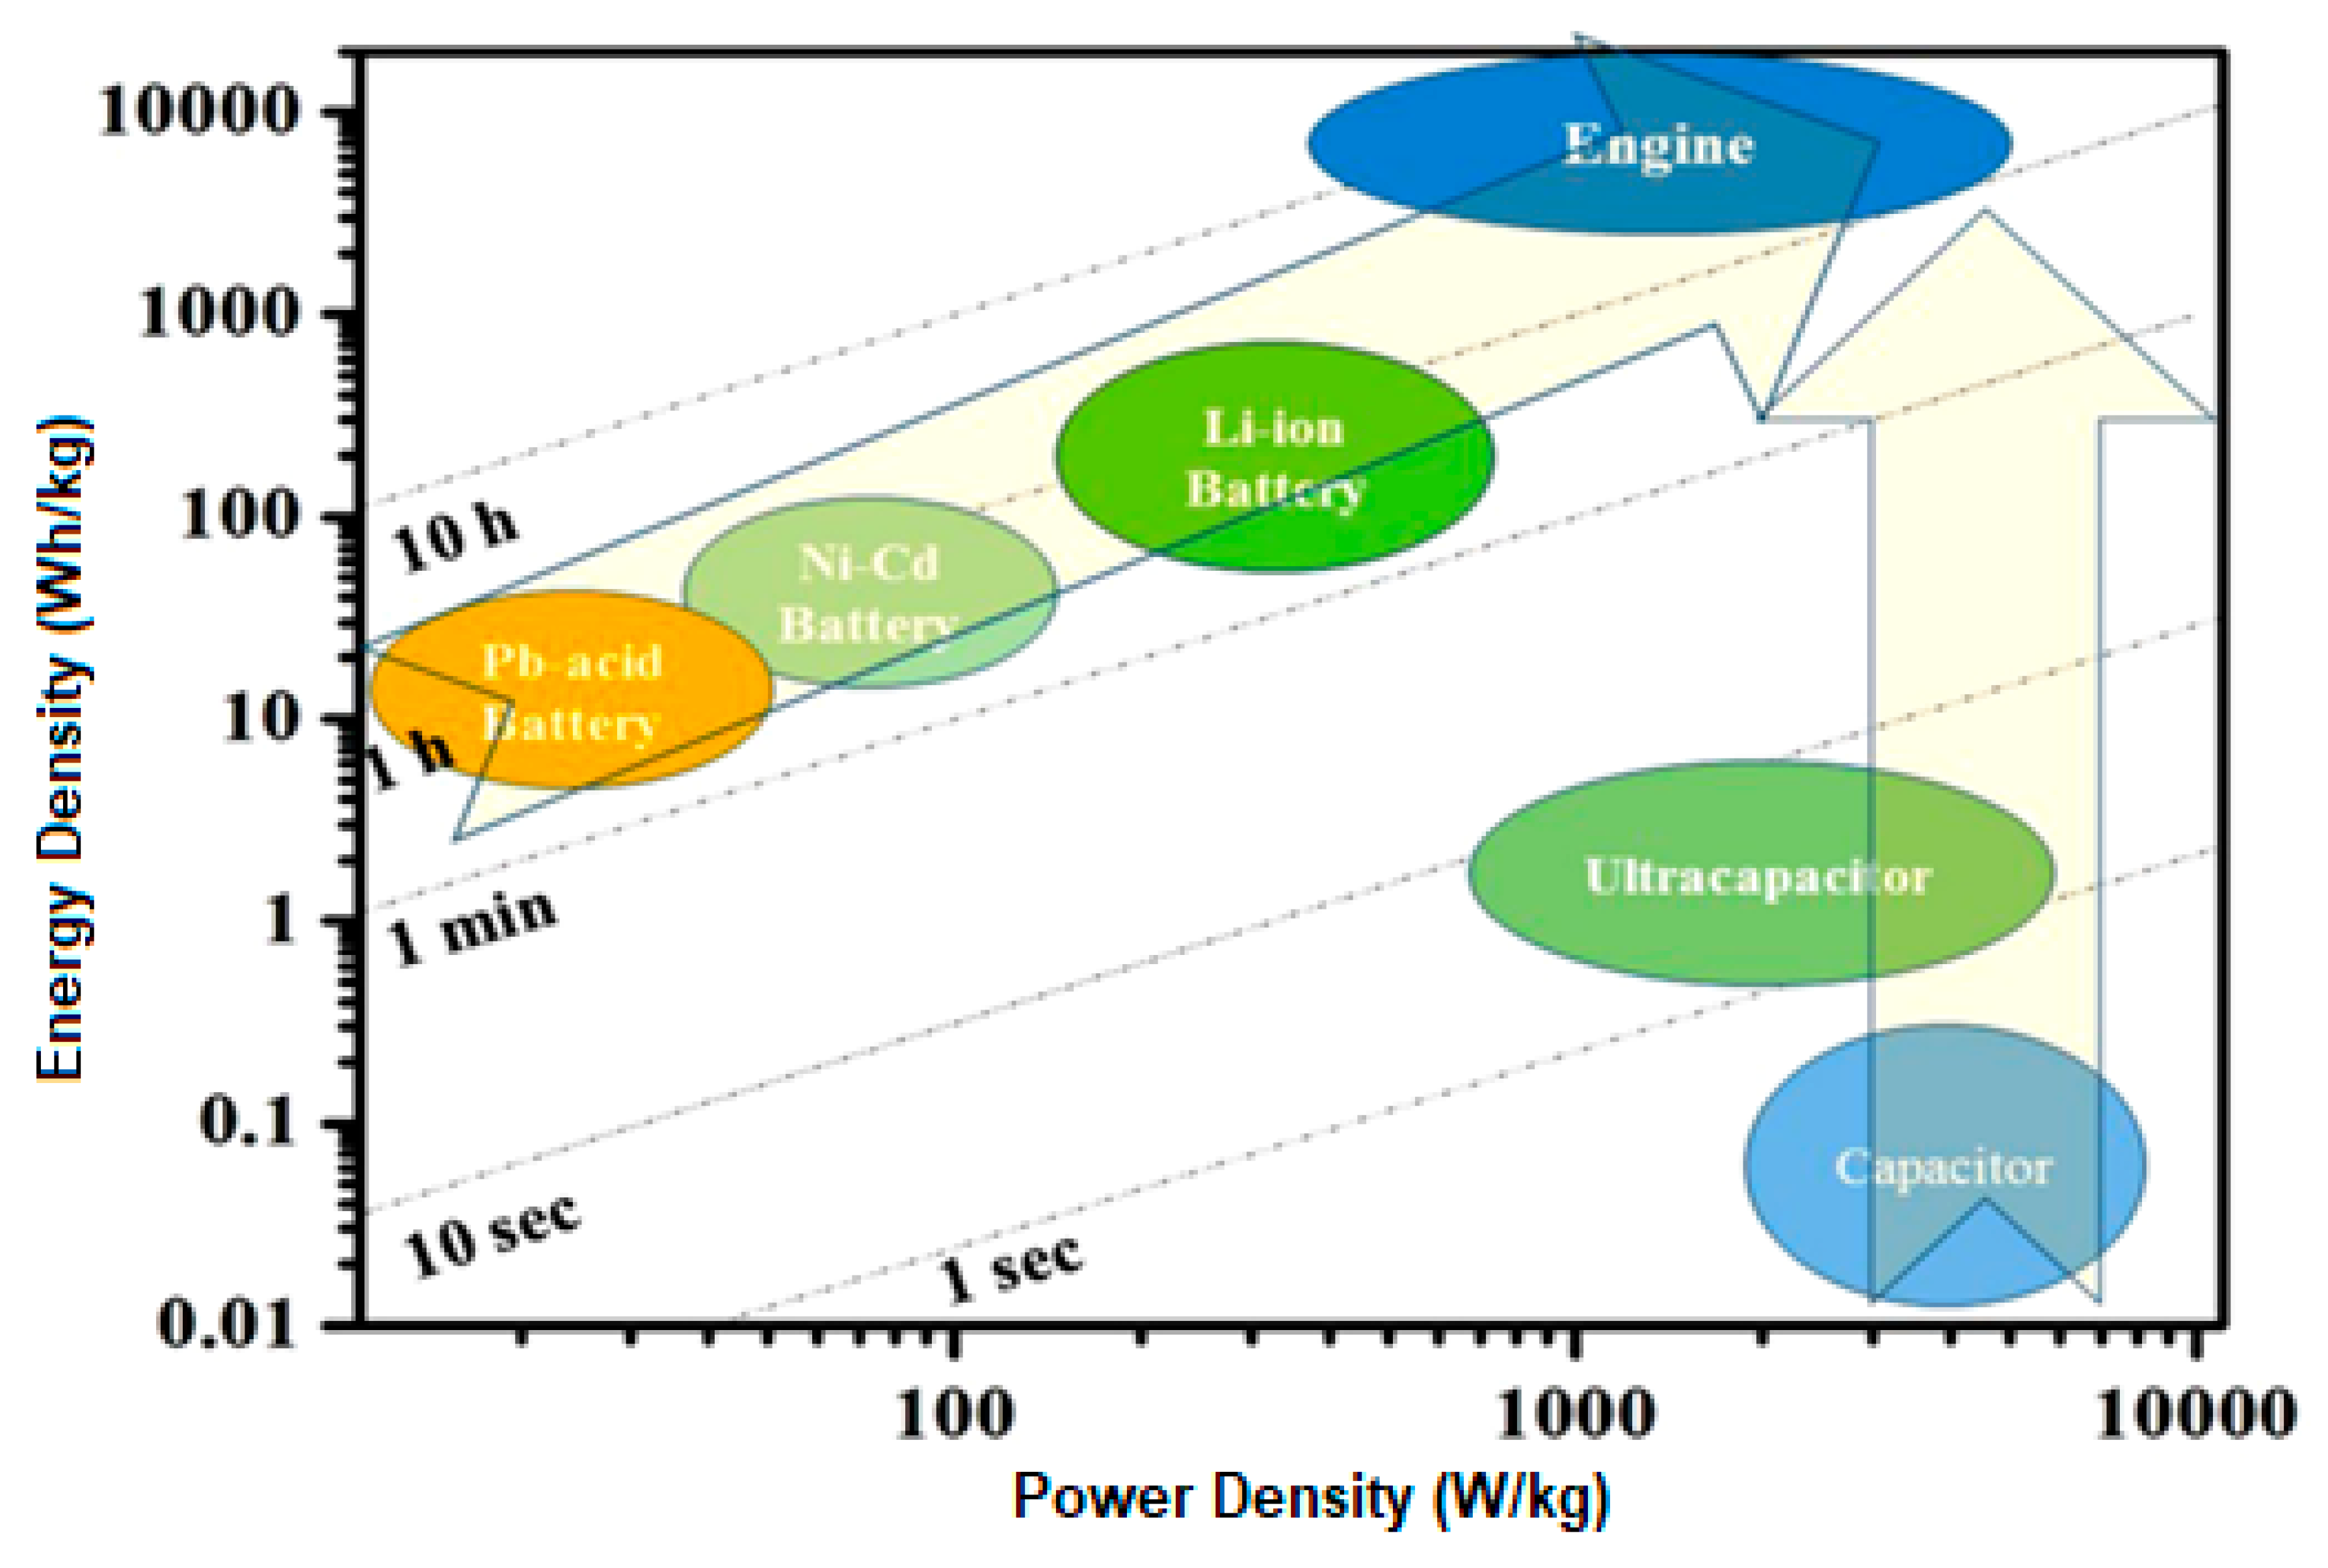
Figure 5 also illustrates a correlation between the batteries' specific power and specific energy levels.
2.3. Electric Motor Engineering
Induction Motor (IM) is well-known for its effectiveness, starting torque, power, simplicity, inexpensiveness, roughness, and little amount of required maintenance. IMs can operate in any hazardous environment without speed limits. The IM's complex control system struggles with power density. Iron, copper, commutation, and stray losses in the magnetic circuit, windings, converter, and mechanical components affect this motor's energy efficiency. IM motor losses were examined [
40]. In order to determine the effectiveness of an IM motor, they utilized a finite element research to map out the losses. According to the findings of the study, the motor's efficiency map was decided by each loss map. To improve the performance of the IM motor, one researcher advises reducing the spins of the stators by one-half 0.75,2.25, and 3.7 kW IM motors were employed. So, the new motor control is more efficient than the previous one, which led to an increase in motor performance. The 0.75 kW motor changed from having a power output of 78% to 85.39%, the 2.25 kW motor went from having an output of 83.23% to having an output of 86.22%, and the 3.7 kW motor went from having an output of 86.25% to having an output of 87.62% [
41].
PM-SM allows its customers to maintain a constant torque while also maximizing efficiency, power density, and minimizing power consumption. PM-SM assures dependable performance and electrical equilibrium by increasing motor efficiency by 10%. When compared to earlier iterations, the PM-SM mechanical packages are noticeably more compact. Because there are no coils or brushes in a PM-SM rotor, it operates at a much lower temperature [
42]. With its high permeability permanent magnets and conductive materials, PM-highly SM is perfect for battery-powered and hybrid vehicles. However, this engine is costlier to acquire initially due to its permanent magnet design, since PM materials are in short supply and thus pricey. There is still no answer for the issue of energy loss during the conversion from PM to SM. This study found that energy was lost least at a 94% efficiency.
Another form of motor, known as PM-BLDC, is one that is started by rectangular AC and features significant pulsing in its torque output. This motor might be able to deliver the highest torque in the constant-torque area because it keeps the flux angle between the stator and the rotor relatively close to 90 degrees [
42]. Maintaining constant power can be accomplished through careful manipulation of the phase-advance angle. High power density, efficiency, and heat dissipation characterize the PM-BLDC motor. This motor's traits are these. The PM-BLDC motor's initial cost is considerable due to the magnet in the rotor, and the device's field-weakening capability is limited by the permanent magnetic field. This method was applied to the two motors that show the most promise for usage in hybrid electric vehicles (HEVs) by means of a sophisticated software application that simulates vehicles (IM and PM-BLDC). The fuel usage of each motor was 11.8 liters per 100 kilometers; the PMBLDC used 11.7 liters, and the IM used 11.9 liters. In addition, PM-BLDC had fewer overall pollutant emissions than IM did, which came up at 2.68 g/km compared to 2.72 g/km for IM. According to the findings, the PM-BLDC motor is more suitable for application in hybrid EVs than the IM motor is.
The SRM is the most recent innovation in electric vehicle motor technology. Compared to the alternatives, this setup is the simplest. It's made up of a movable rotor and a stationary stator, with the windings located solely on the latter. Because they don't require a permanent magnet, SRM motors are less expensive to produce than PM motors. Further, SRM is fault-tolerant, therefore malfunctions in one phase will not influence the operation of the others [
43]. The reliability of SRM 10/8 (SRM 5 phases) drives for EVs was tested under abnormal situations including open- and short-circuit failures in a study published in [83]. The SRM is built with fault resistance and exceptional dynamic reactivity in mind. Electric vehicles driven by SRMs were evaluated based on their top speeds, torque outputs, and battery charges. SRM could reach the reference velocity under typical conditions in 1.23 seconds. Torque was maintained at 485.3 Nm despite a 0.04% decline in SOC 1.26 seconds into a 1-phase short circuit situation.
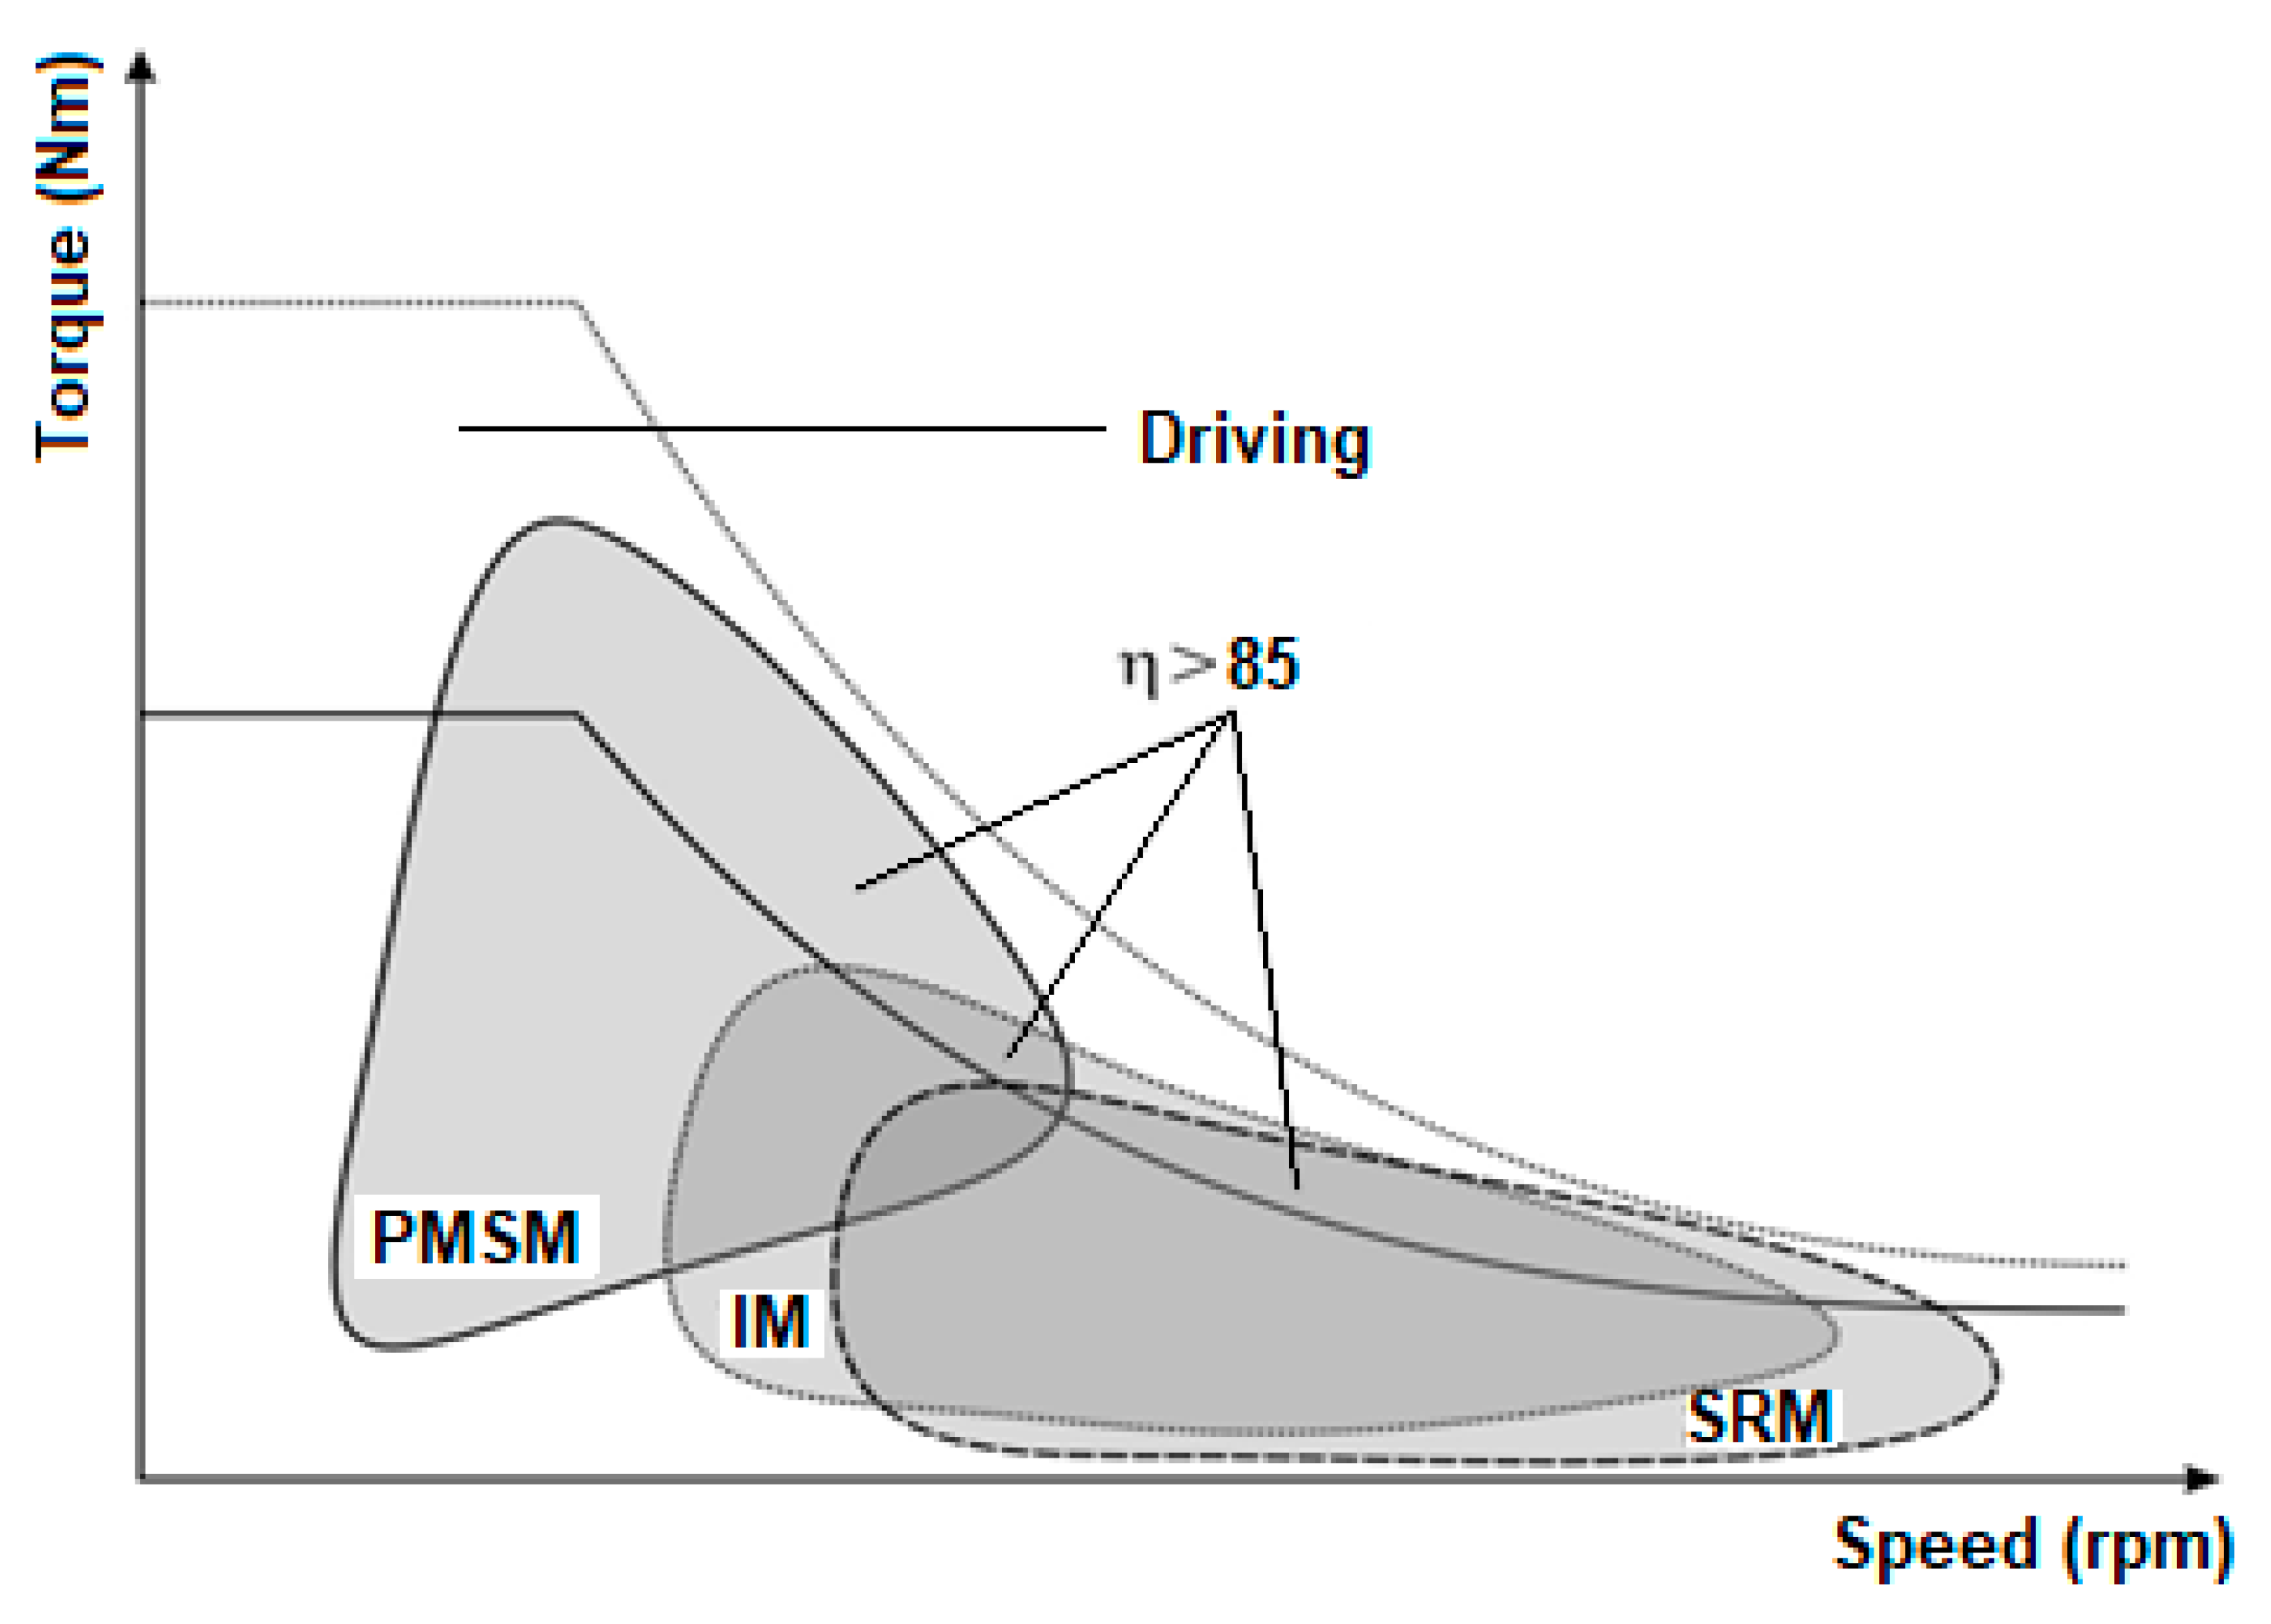
As can be seen in
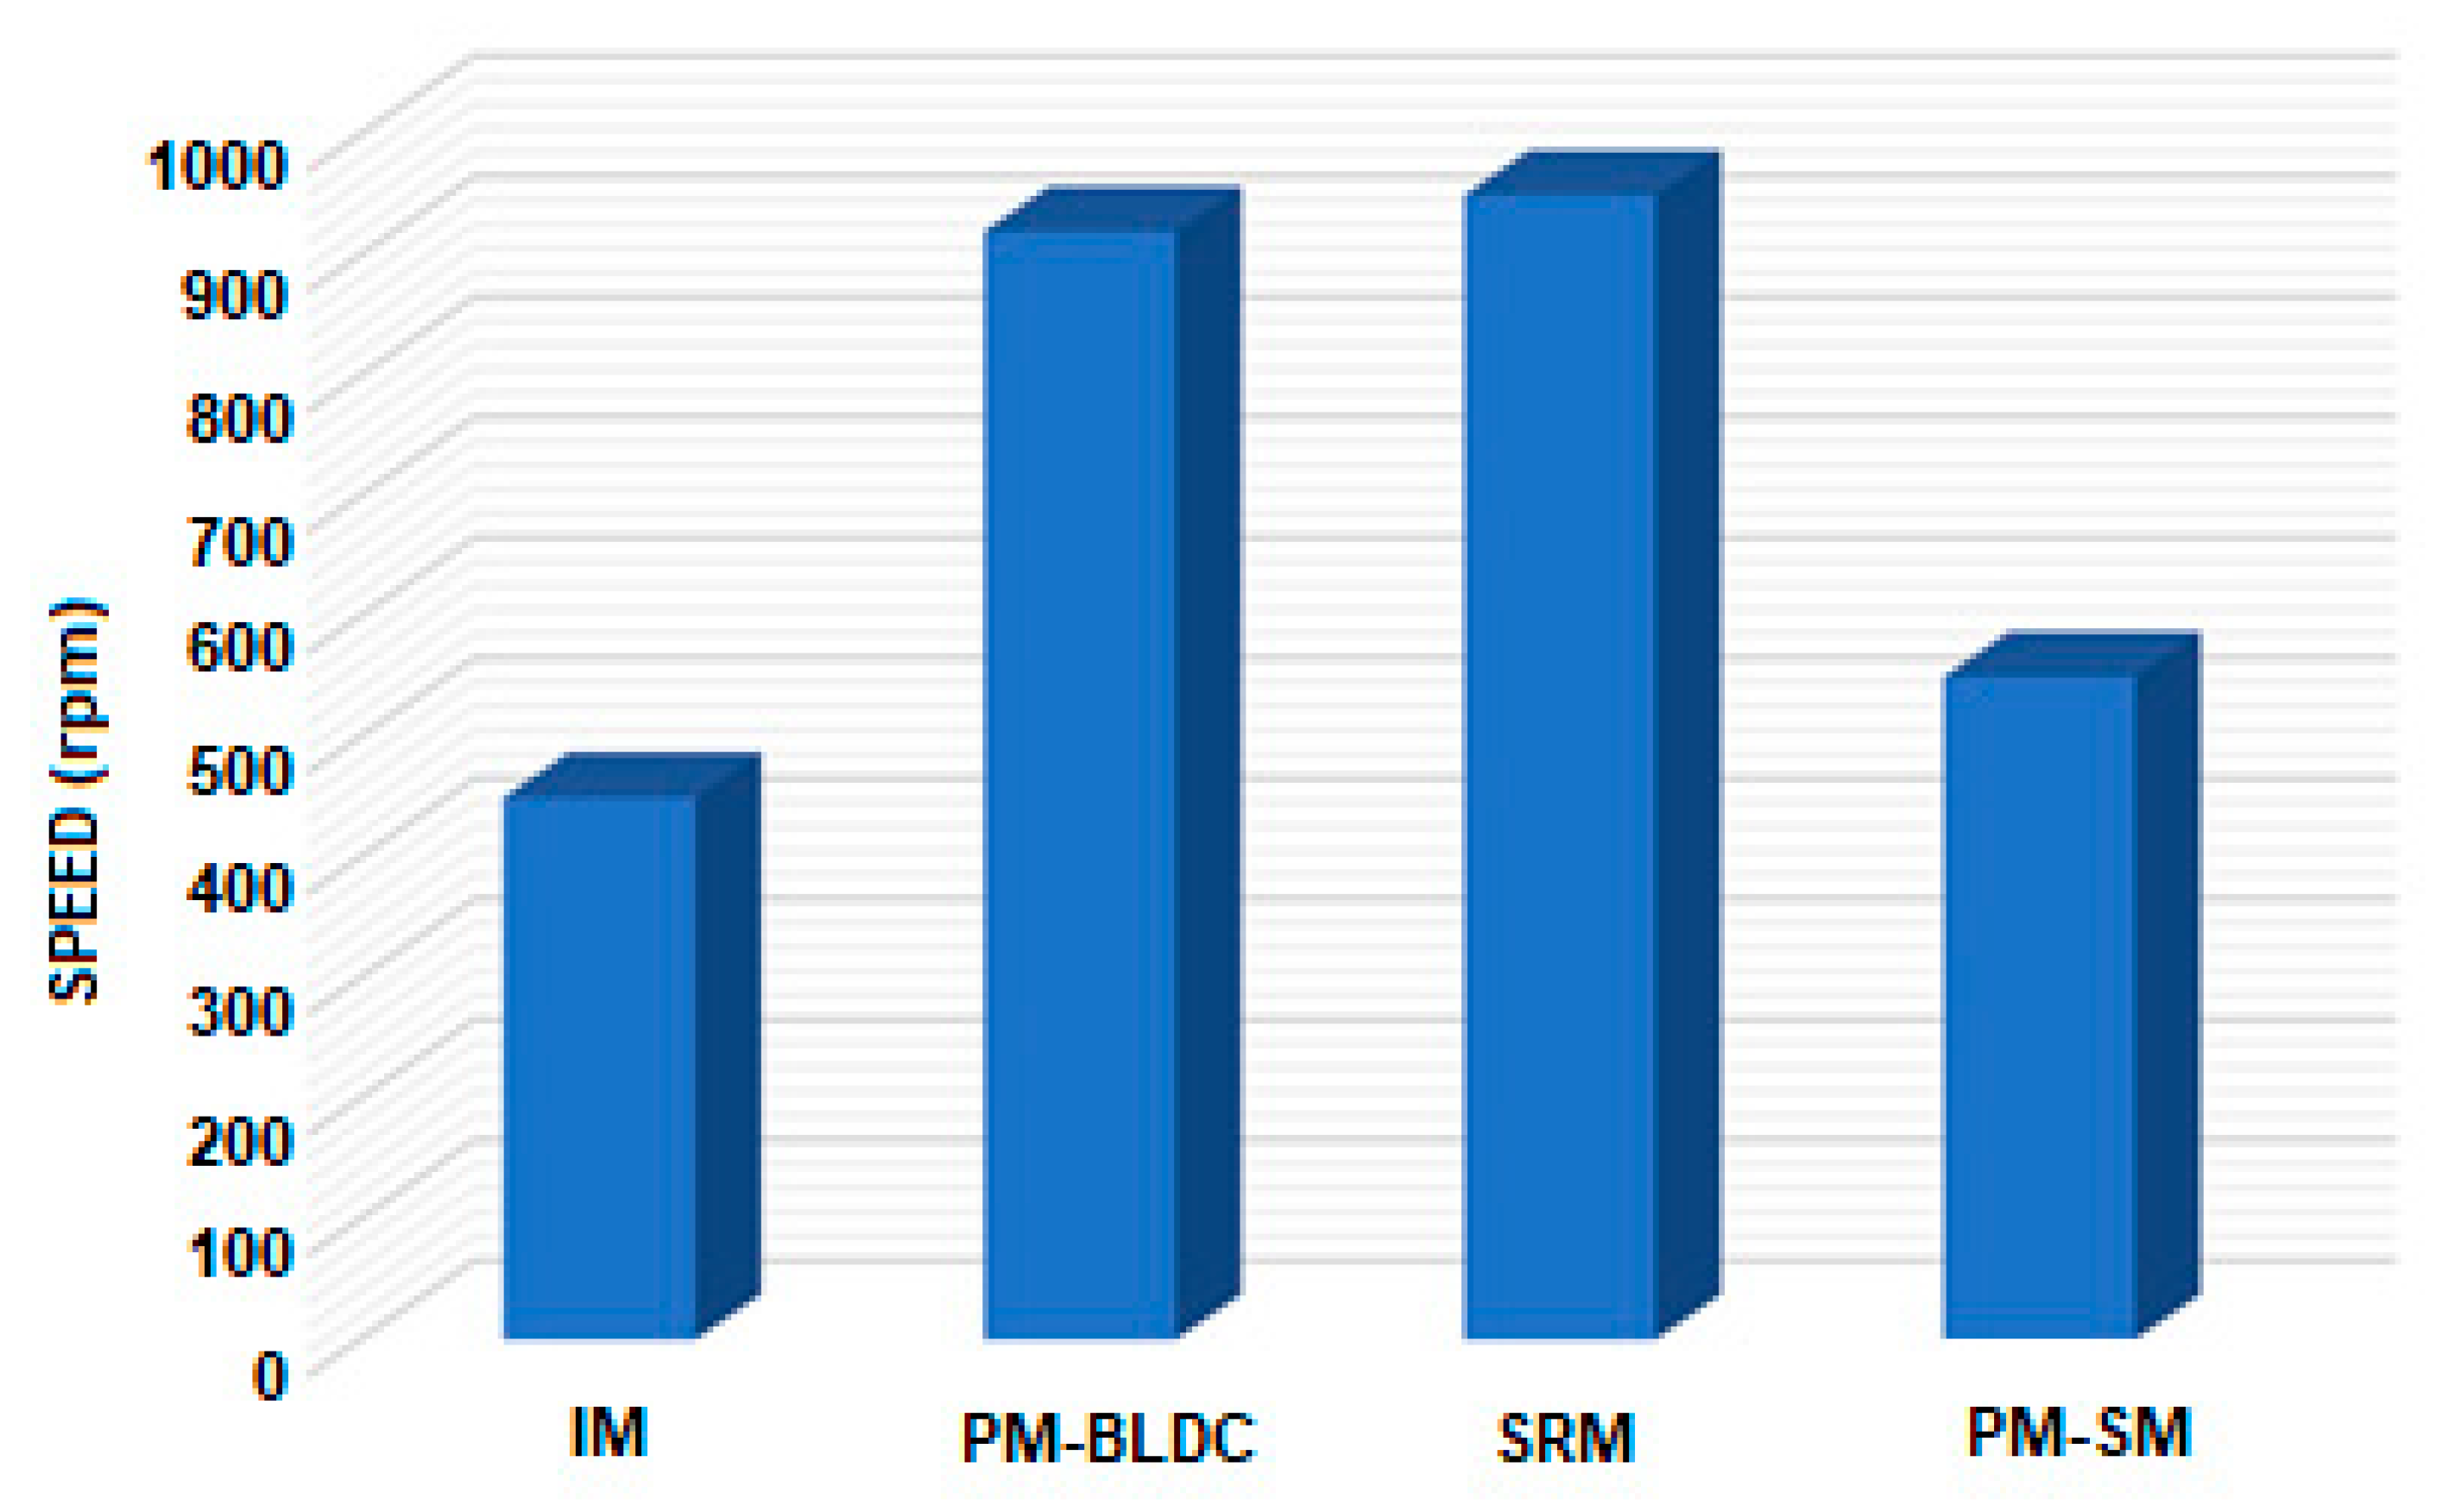
Figure 6, each electric motor has its own optimal operating and braking ranges. A study analyzed the different types of electric vehicle (EV) motors and drives in terms of their effectiveness, maximum speed, relative cost, and level of dependability (IM, PM-BLDC, PM-SM, SRM). The PM-BLDC motor was the most efficient type of motor, while the SRM motor had the highest possible speed
Figure 7. Although induction motors and brushless DC motors saw the most use, the latter was preferred due to their lower prices [
44].
Table 3 provides an overview of the model specifications of EVs (EVs) that are currently for sale on the market. These specifications include the types of EVs, the capacity of their batteries, the electric motors that are employed, the rating of the motors, and the total distance traveled.
2.4. Genetic Algorthm
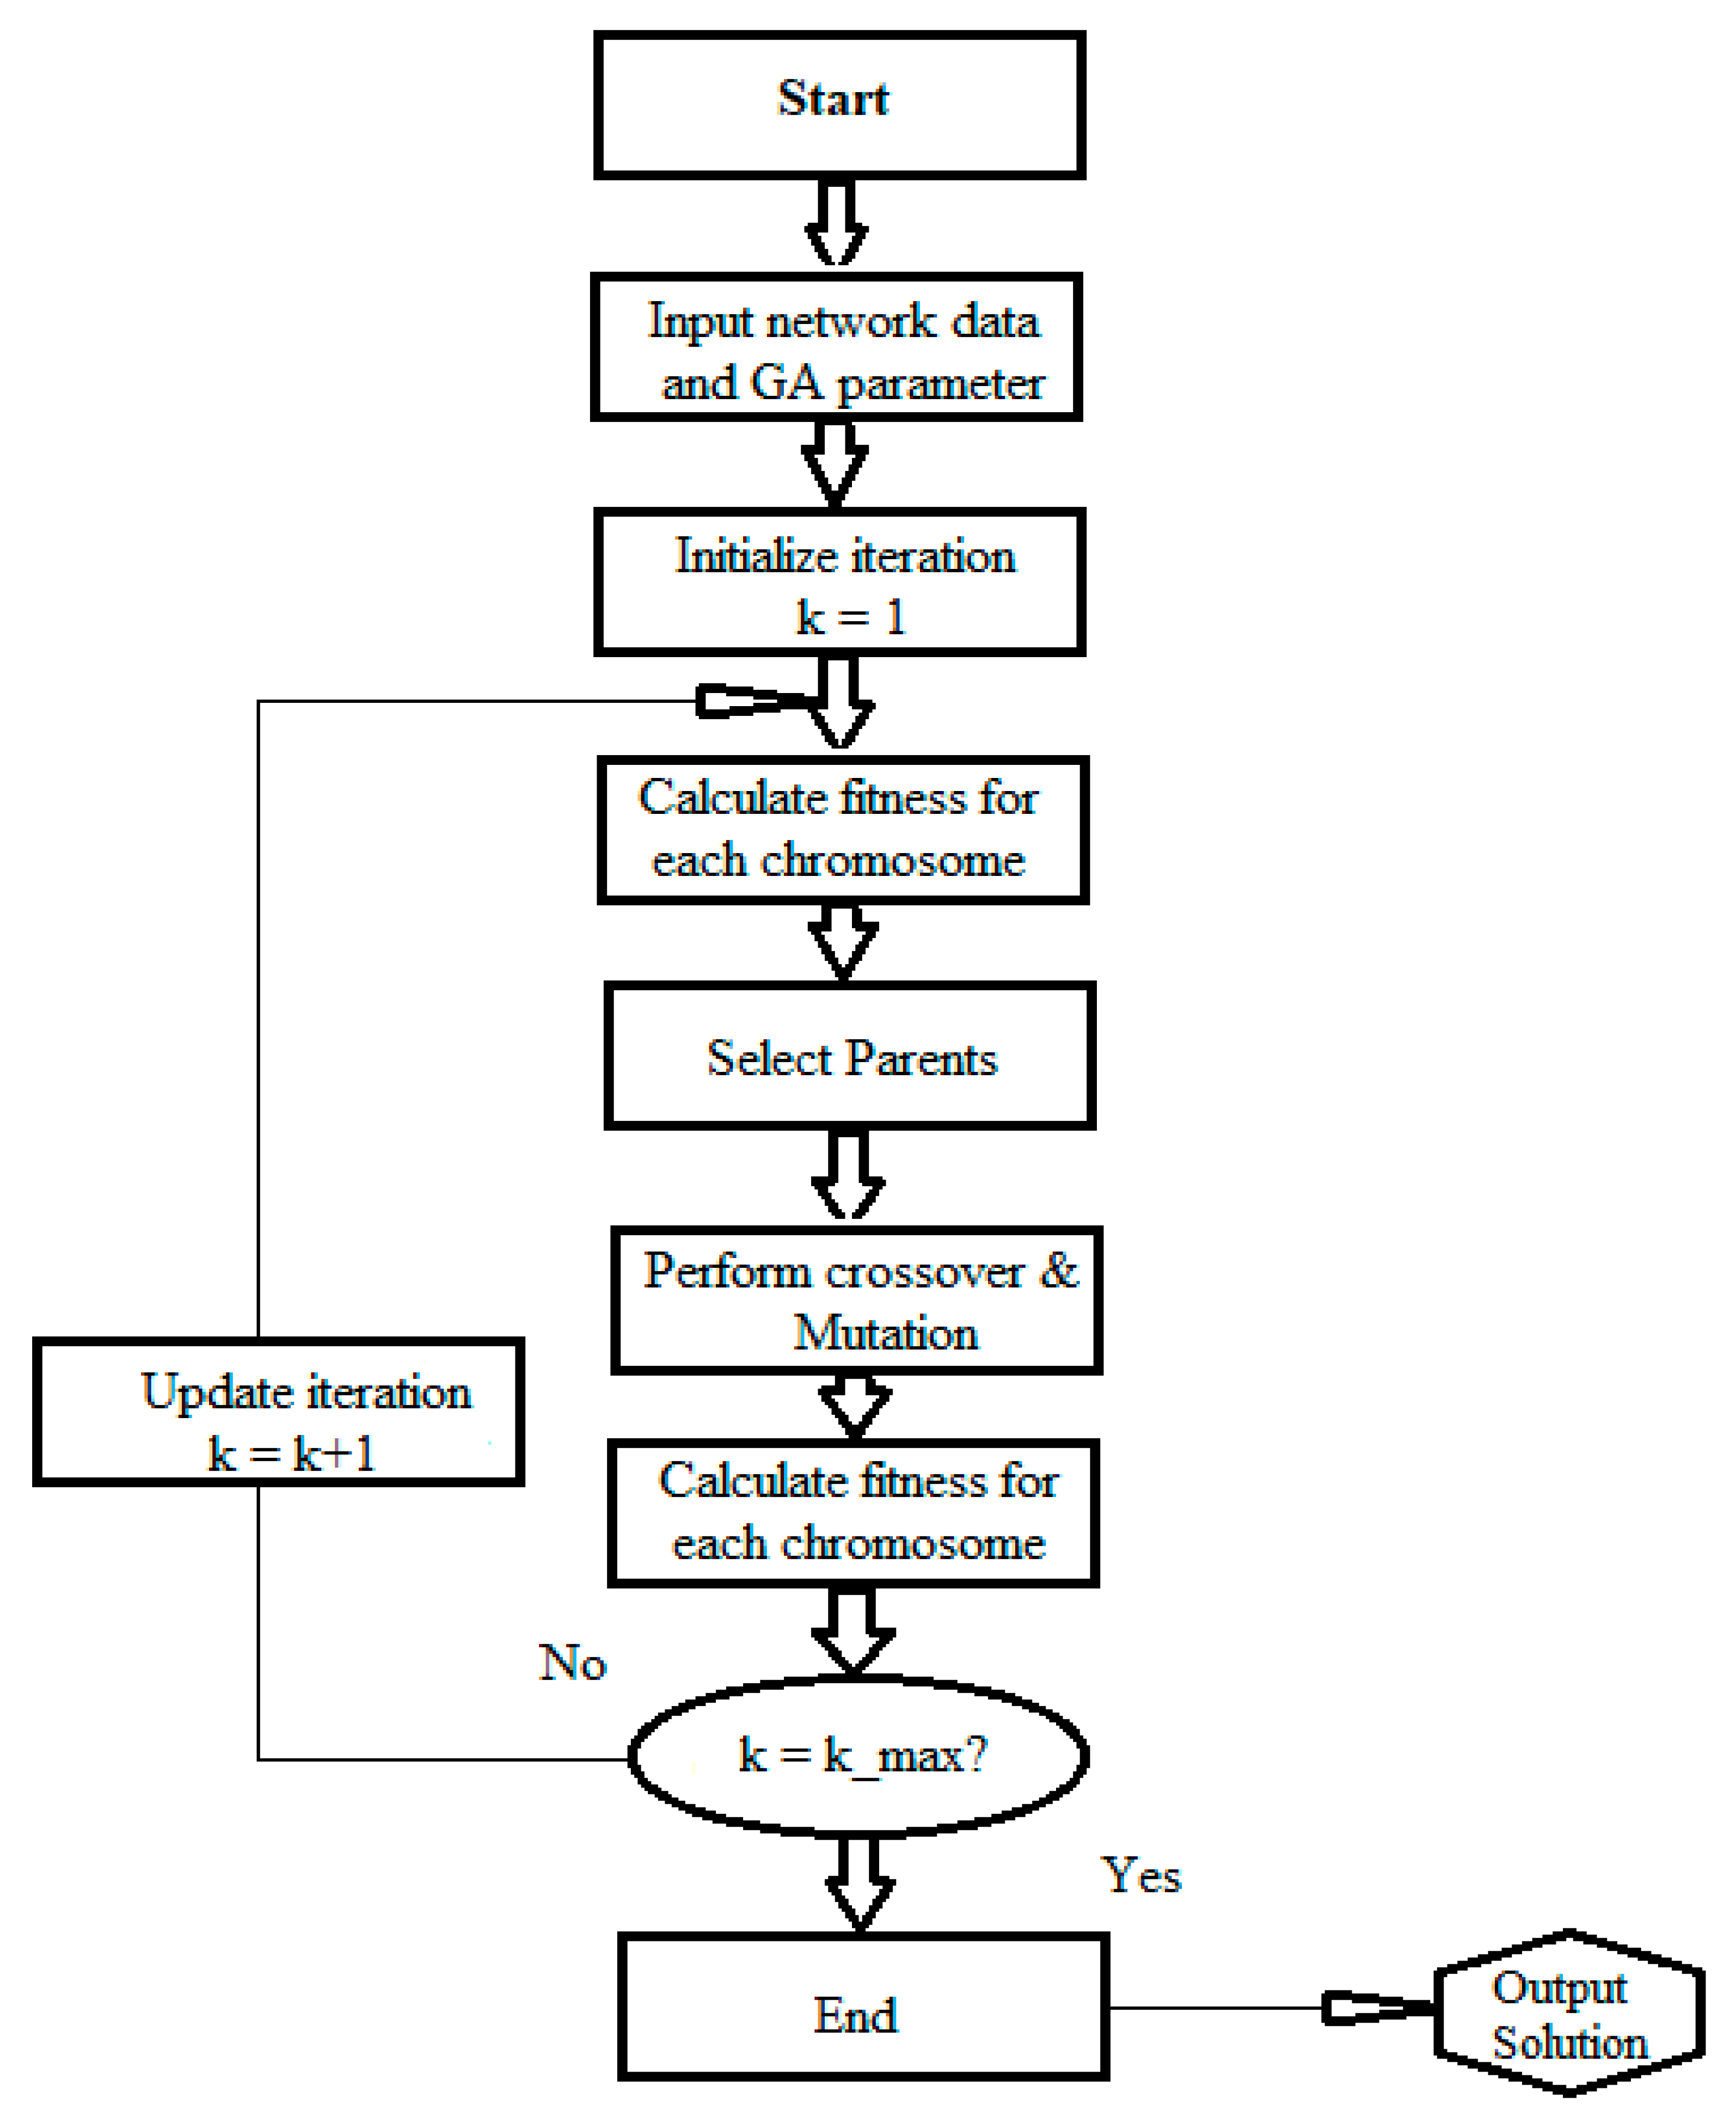
Using genetic algorithms and unconstrained optimization approaches, GA simulates the concept of evolutionary adaptation, allowing a population's offspring to better adapt to their surroundings over time. The "evolutionary adaptation principle," as it is now known, was initially proposed by Charles Darwin. This is achieved by breaking down the problem at hand into a collection of N-dimensional sub problems, each of which can be optimized independently of the others [
45]. The GA's building blocks are genes and chromosomes, and their parameters for the usual sort of optimization are expressed as strings of binary code. DNA is organized into chromosomes by combining what are basically binary codes, called GA genes, with one another. Based on the n chromosomes, which reflect the m optimized parameters, the population in GA is a fair representation of the space of feasible solutions. A generalized approach to solving engineering problems is shown in
Figure 8. Using the steps of a genetic algorithm, a flowchart was created to represent the procedure.
In order to determine the size and location of EV units, Auglt, R. Hooshmand, and M. Ataei employed GA. The ideal solution can be found using cost-function-based methods, however they are time-consuming and resource-intensive to compute. They resolved the cost issue, but cost-function analyses could raise doubts about the adequacy of EV unit sizes in some areas. In [
46], Rahmat-Allah Hooshmand used an RCGA to find the best location for a bank of capacitors in a network that was not perfectly balanced. The switching and fixed capacitors in the transmission system lowered the power losses and maintained the voltage.
We found the best capacitor rate by simulating loads of several intensities with off-the-shelf capacitors. Reactive power injection was used by Mehrdad Movahed to smooth off voltage profiles in end busses that were otherwise very steep in [
47]. The best reactive power injection parameters were found with the help of genetic algorithms. Thus, the voltage profile was improved, and losses were cut down. Radial transmission networks, as stated by Carpinelli in [
48], should locate EVs so as to incur least system losses. Using both equality and inequality constraints, a GA was able to find a solution to an optimization problem with the objective of minimizing real power loss. The location of the active power loss is dependent on the amount of real power injected by the EV. They proved that more sites within economically viable regions yield better results. Only the passive power loss was included in this formula [
49]. Saeed Amin Hajizadeh and Ehsan Hajizadeh Poor [
8] found that using genetic algorithms lowered power loss and the voltage profile in radial transmission systems. It was found by the authors that voltage profile losses can be minimized by strategically deploying distributed generating units and capacitors. Shunt capacitors are most effective in transmission centers situated close to the load.
2.5. PSO Algorthm
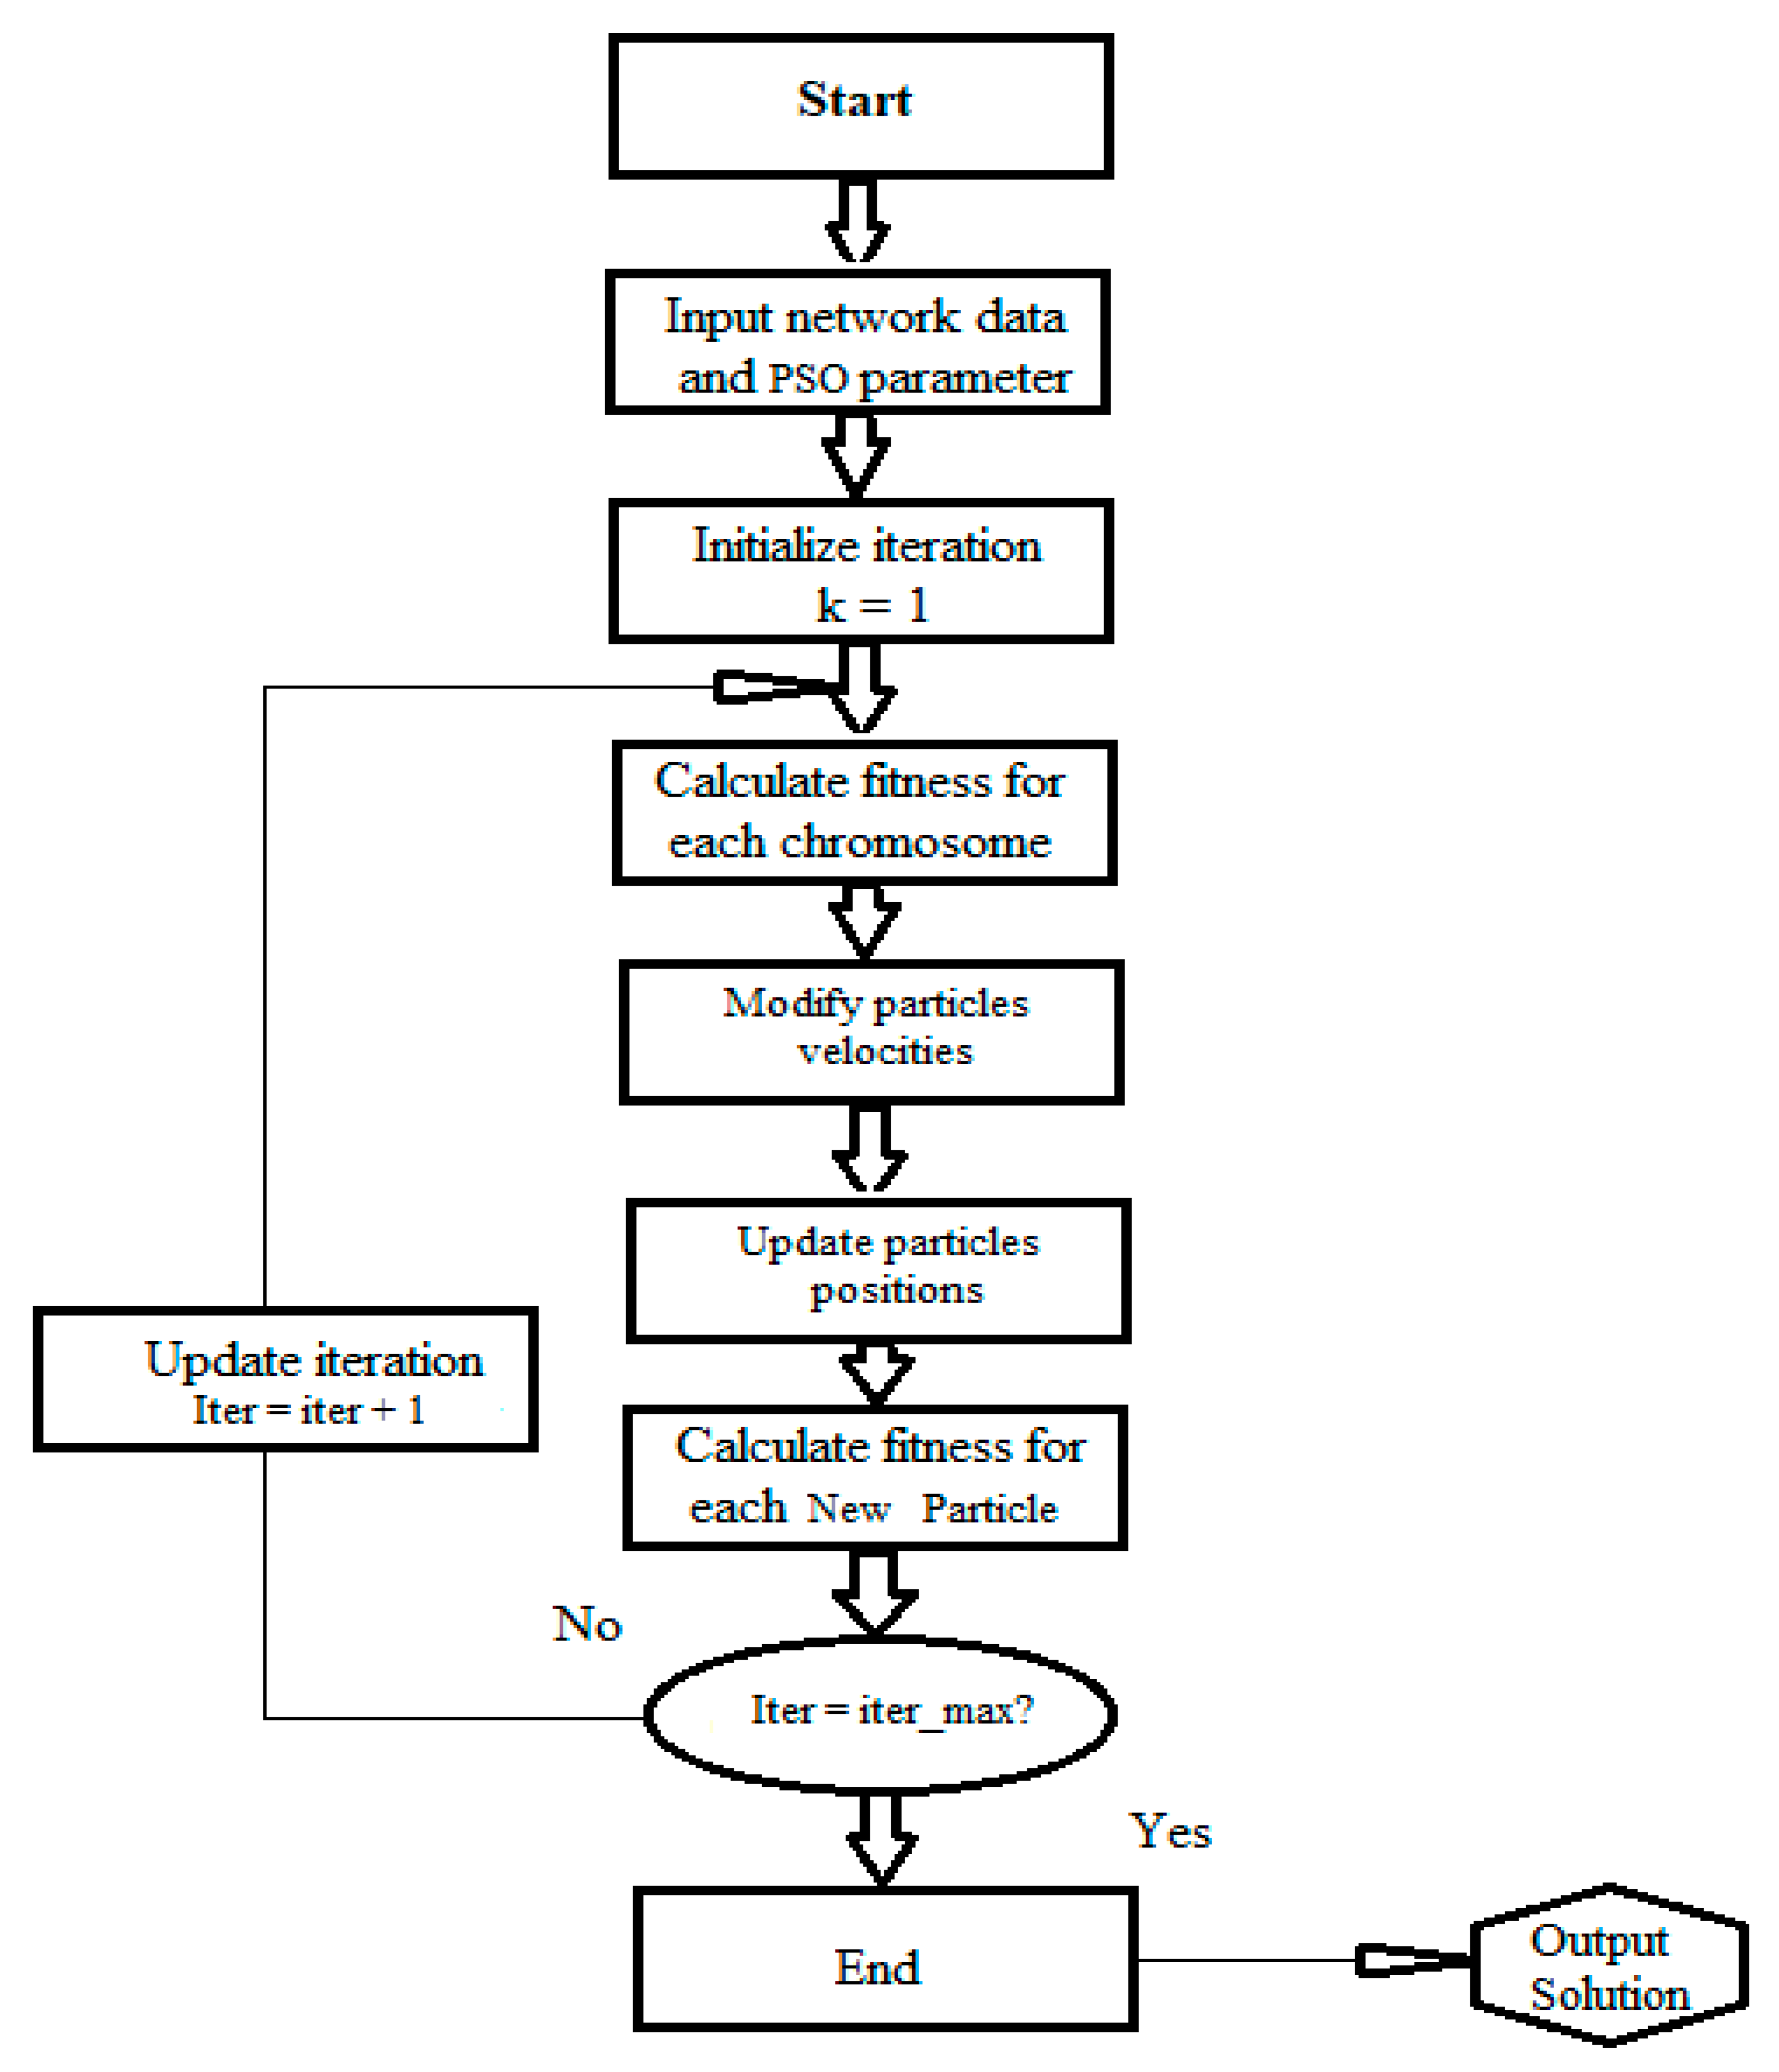
PSO is an optimization technique that takes its cues from natural phenomena like bird flocking and fish schools. Particle swarm optimization (PSO) generates a population of particles and scatters them across the search space (see
Figure 9). Particles' fitness scores are used for optimization purposes. When particles have experienced their optimum position and solution, they will arrive at their optimal position. Based on their past ve-locity, their optimal position, and the optimal position of the swarm, particles' present velocities are calculated. According to Amin and Ehsan Hajizadeh [
50], PSO-based transmission planning is the way to go. They came up with a multi-objective method to figure out the best configuration of decentralized power plants to reduce transmission losses. These expenditures and the PSO and diet strategy were more evenly matched. Finding the optimal locations for shunt capacitors and EV units was the goal of the study [
51] by Kai Zou and A. P. Agalgaonkar.
Their strategy used analytics and statistics to pin down ideal voltage ranges, effectively reducing the search area. Transmission line losses can be minimized and voltage profiles can be enhanced by implementing a strategy proposed by I. Ziari et al. [
52]. When compared to the genetic algorithm and nonlinear programming, the proposed method performed better. The accuracy and convergence of the PSO algorithm was compared to the GA method, and the authors, Khanjanzadeh et al. [
53], looked at the impact of EV location and capacity on boosting steady voltage in radial distributed systems. The convergence rate of GA was lower than that of PSO. In [
53], Varesi suggested a PSO-based technique for optimizing EV unit allocation within a power system. Using a load flow algorithm and PSO, we determined the best mix of EV units in terms of quantity, size, placement, and kind. The study looked at two different EVs. The multi-objective PSO method developed by Moham-med M. and M. A. Nasab [
54] improved EV size and placement. The study used a dual-metric objective function that measured both power savings and reliability gains. Research into electricity losses in action.
Using the Novel Binary Particle Swarm Optimization (NBPSO) method, N. Mancer, B. Mahdad, and K. Srairi enhanced the overall voltage profile in power transmission systems by incorporating optimal placement of shunt capacitors subject to limitations [
55]. Through a process of near-global optimization, the NBPSO technique established the optimum values for and placement of capacitors. Incorporating shunt capacitors into the sizing and positioning of capacitors was done. In a recent paper, [
56], Mehdi Nafar employed discrete particle swarm optimization (DPSO) to improve the voltage profiles of a DG&C system and lower the total harmonic distortion (THD). Capacitor reactance and system reactance were not allowed to resonate in a harmonic fashion thanks to a term in the objective function. Voltage, total harmonic distortion, and the size and number of capacitors and generators were all constraints. The suggested algorithm was put through its paces using a modified version of IEEE's 33-bus test system.
2.6. IPSO Algorrthm
IPSOs were modeled taking into account only real power losses, with the goal of lowering losses while keeping the voltage profile and stability margin constant. The optimal placement and sizing of several EVs was optimized by N. Singh and S.C. Srivastava using IPSO, as described in [
57]. The study's authors showed that when applied to the placement of a single EV, the strategy outperformed both classical and analytical approaches. Umapathi Reddy et al.'s IPSO-based approach to loss reduction in imbalanced radial transmission networks is implemented in [
58]. In addition, a technique for identifying buses is detailed that makes use of power loss indices (PLI) analysis to pinpoint where precisely capacitors should be installed. Each of the IPSO algorithm's n particles represents a different candidate solution, and each particle is an m-dimensional real value vector with m optimized parameters. These values are the problem space's dimensions. The IPSO procedure entails a number of stages. Each unique optimization problem requires a unique implementation of the IPSO algorithm. [
59].
3. Methodology
3.1. IEEE-30 Bus Electrical Network
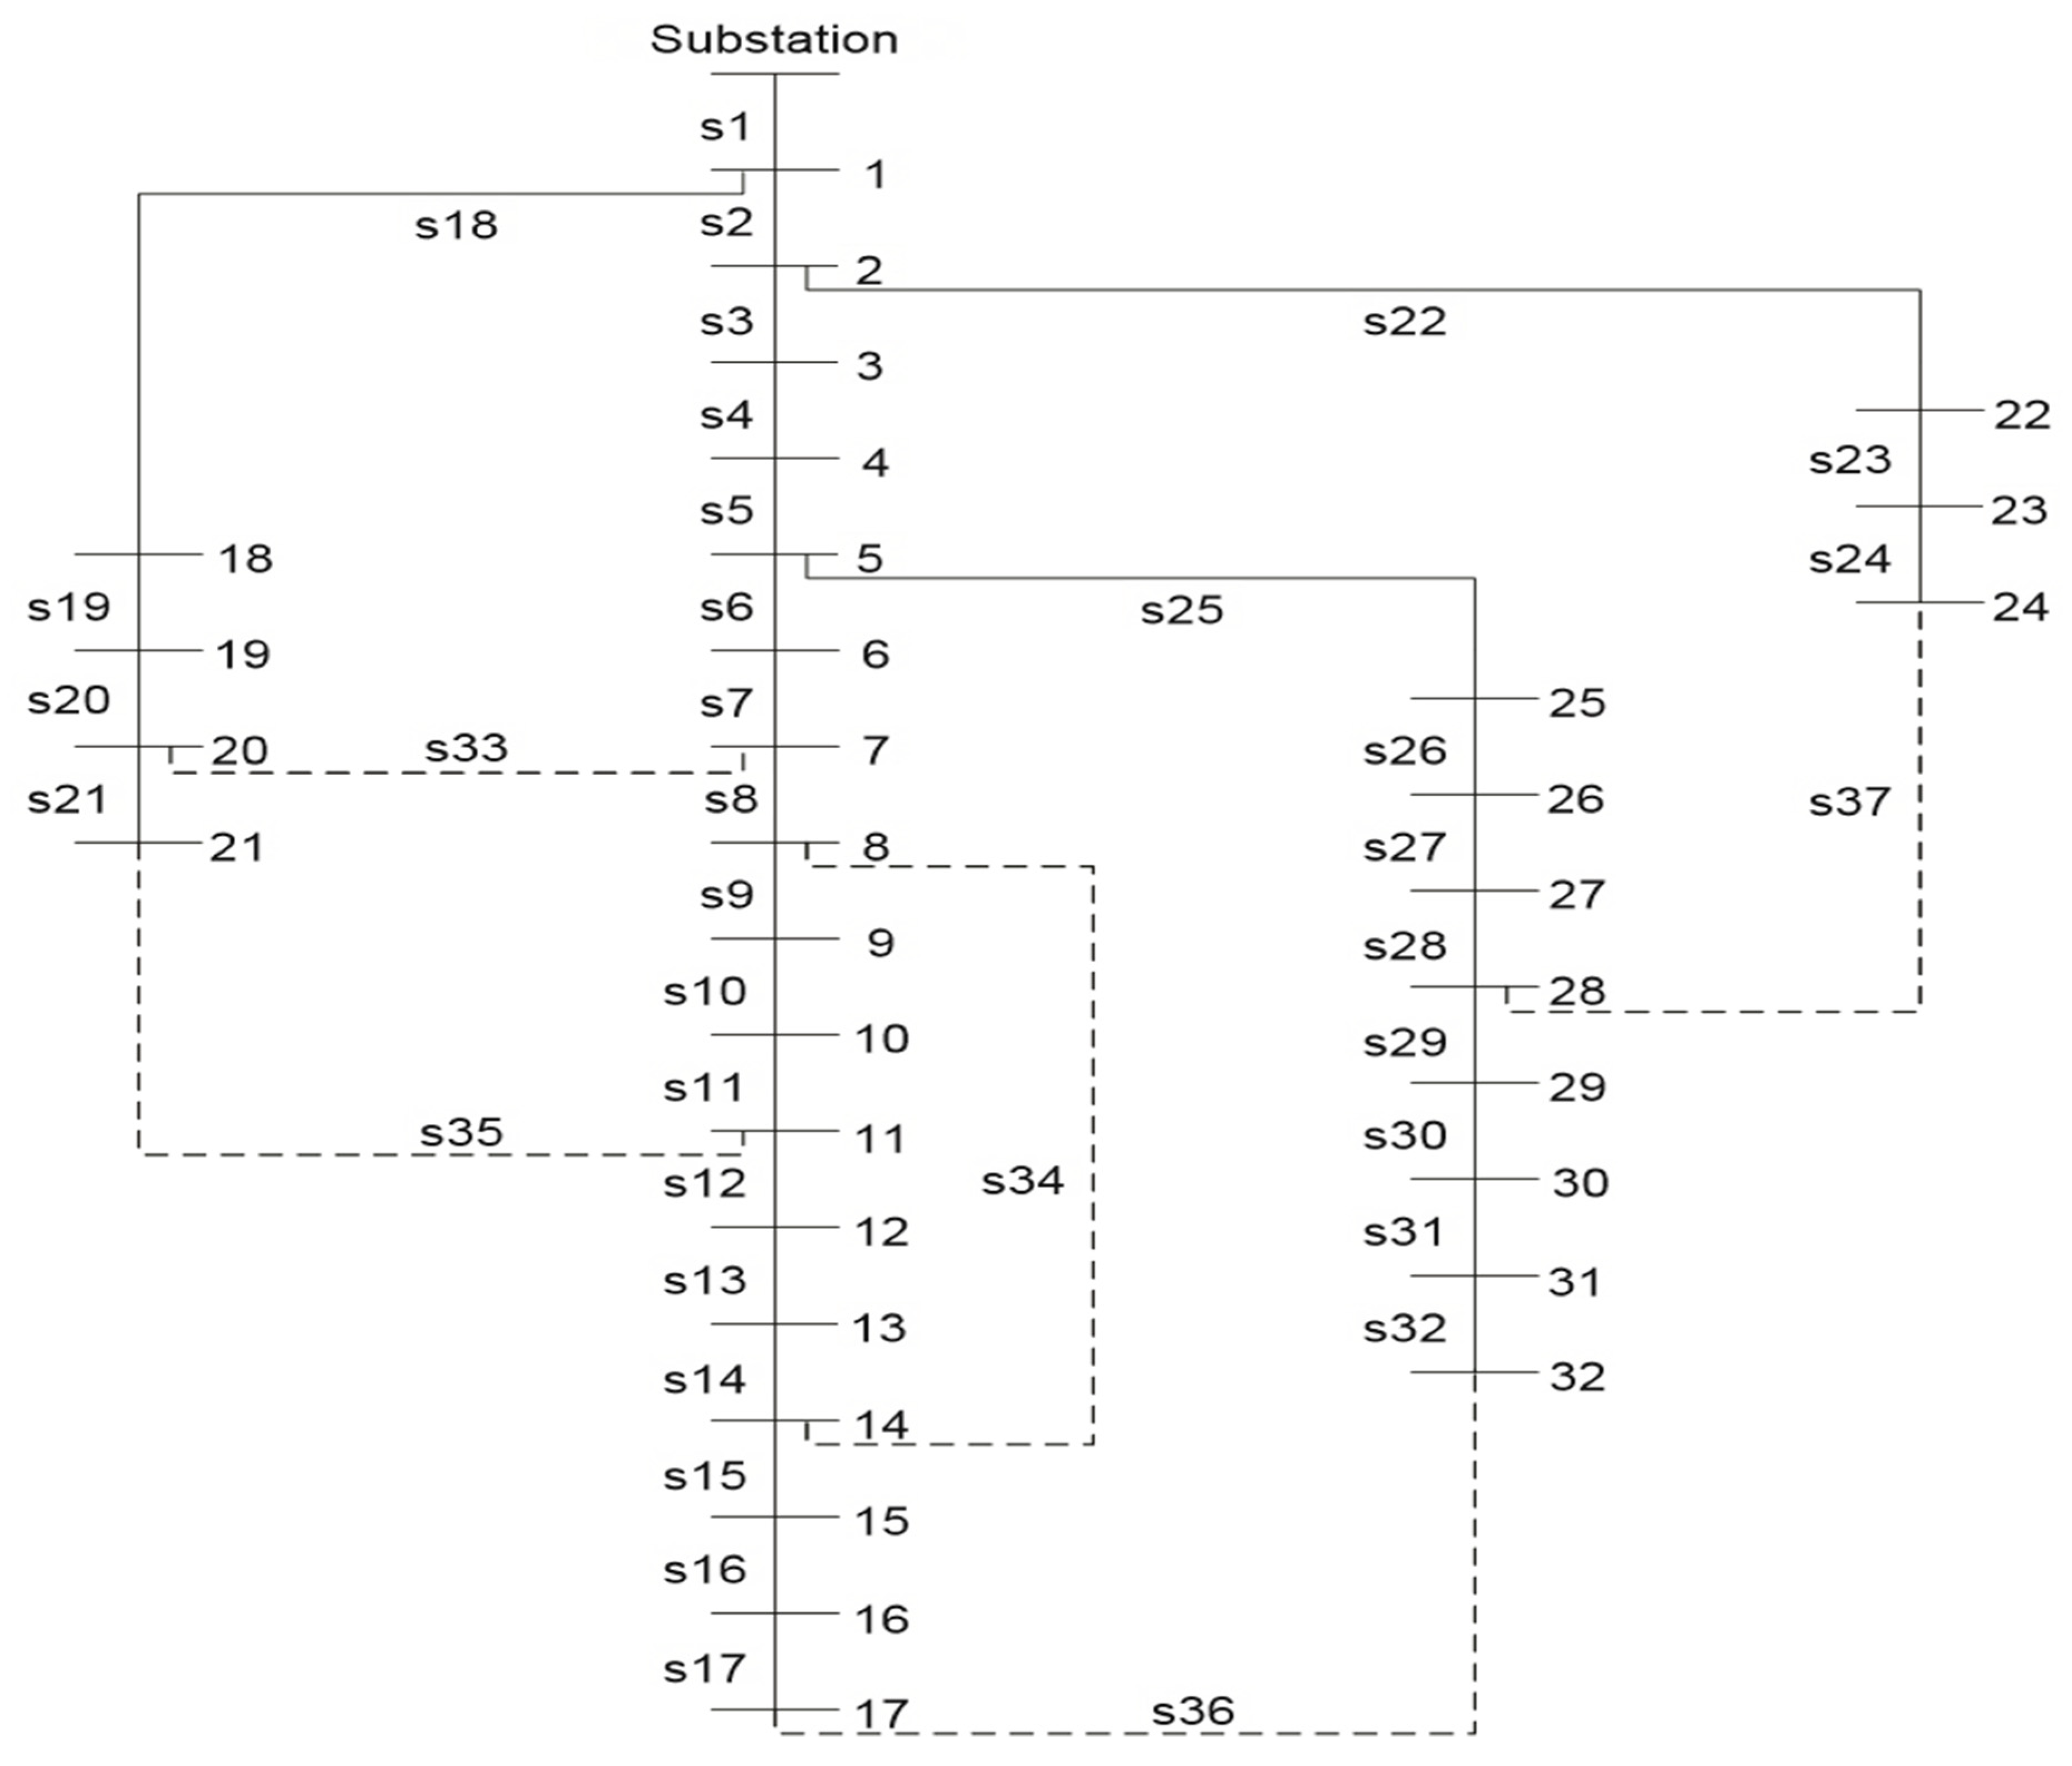
The IEEE-30 bus test is meant to simulate the electrical infrastructure in the central United States, representing a subset of the larger American Electric Power System. These buses' potential model voltage ranges from 33 to 132 kilovolts. No attention is paid to line restrictions during the IEEE-30 bus test. The line diagram of the test system is shown in
Figure 10, and the bus load injection of the IEEE-30 bus test system is shown in
Table 3 and Table 31. The IEEE website features both of these schematics [
60].
Table 3.
Injection bus load table for test system.
Table 3.
Injection bus load table for test system.
| Bus |
Load (MW) |
Bus |
Load (MW) |
| 1 |
0.0 |
16 |
3.5 |
| 2 |
21.7 |
17 |
9.0 |
| 3 |
2.4 |
18 |
3.2 |
| 4 |
67.6 |
19 |
9.5 |
| 5 |
34.2 |
20 |
2.2 |
| 6 |
0.0 |
21 |
17.5 |
| 7 |
22.8 |
22 |
0.0 |
| 8 |
30.0 |
23 |
3.2 |
| 9 |
0.0 |
24 |
8.7 |
| 10 |
5.8 |
25 |
0.0 |
| 11 |
0.0 |
26 |
3.5 |
| 12 |
11.2 |
27 |
0.0 |
| 13 |
0.0 |
28 |
0.0 |
| 14 |
6.2 |
29 |
2.4 |
| 15 |
8.2 |
30 |
10.6 |
3.2. Types of EVs and Number of EVs Used
This research aims to optimize the placement and size of three distinct classes of electric vehicles (EVs) under the condition that EVs are functioning in any of the three scenarios outlined below.
In Scenario 1, Type A EV injects active electricity, with the number of EVs to be employed decided by the suggested algorithm and one EV installed every selected bus.
Scenario 2: Type B EV that injects both active and reactive power; the quantity of EVs to be employed is decided by the proposed method, and one EV is installed per chosen bus.
Third scenario, the Type C EV injects active power and absorbs reactive power; the number of EVs to be employed is calculated by the proposed algorithm, and one EV is installed for each chosen bus.
3.3. Development of HGAIPSO Algorithm
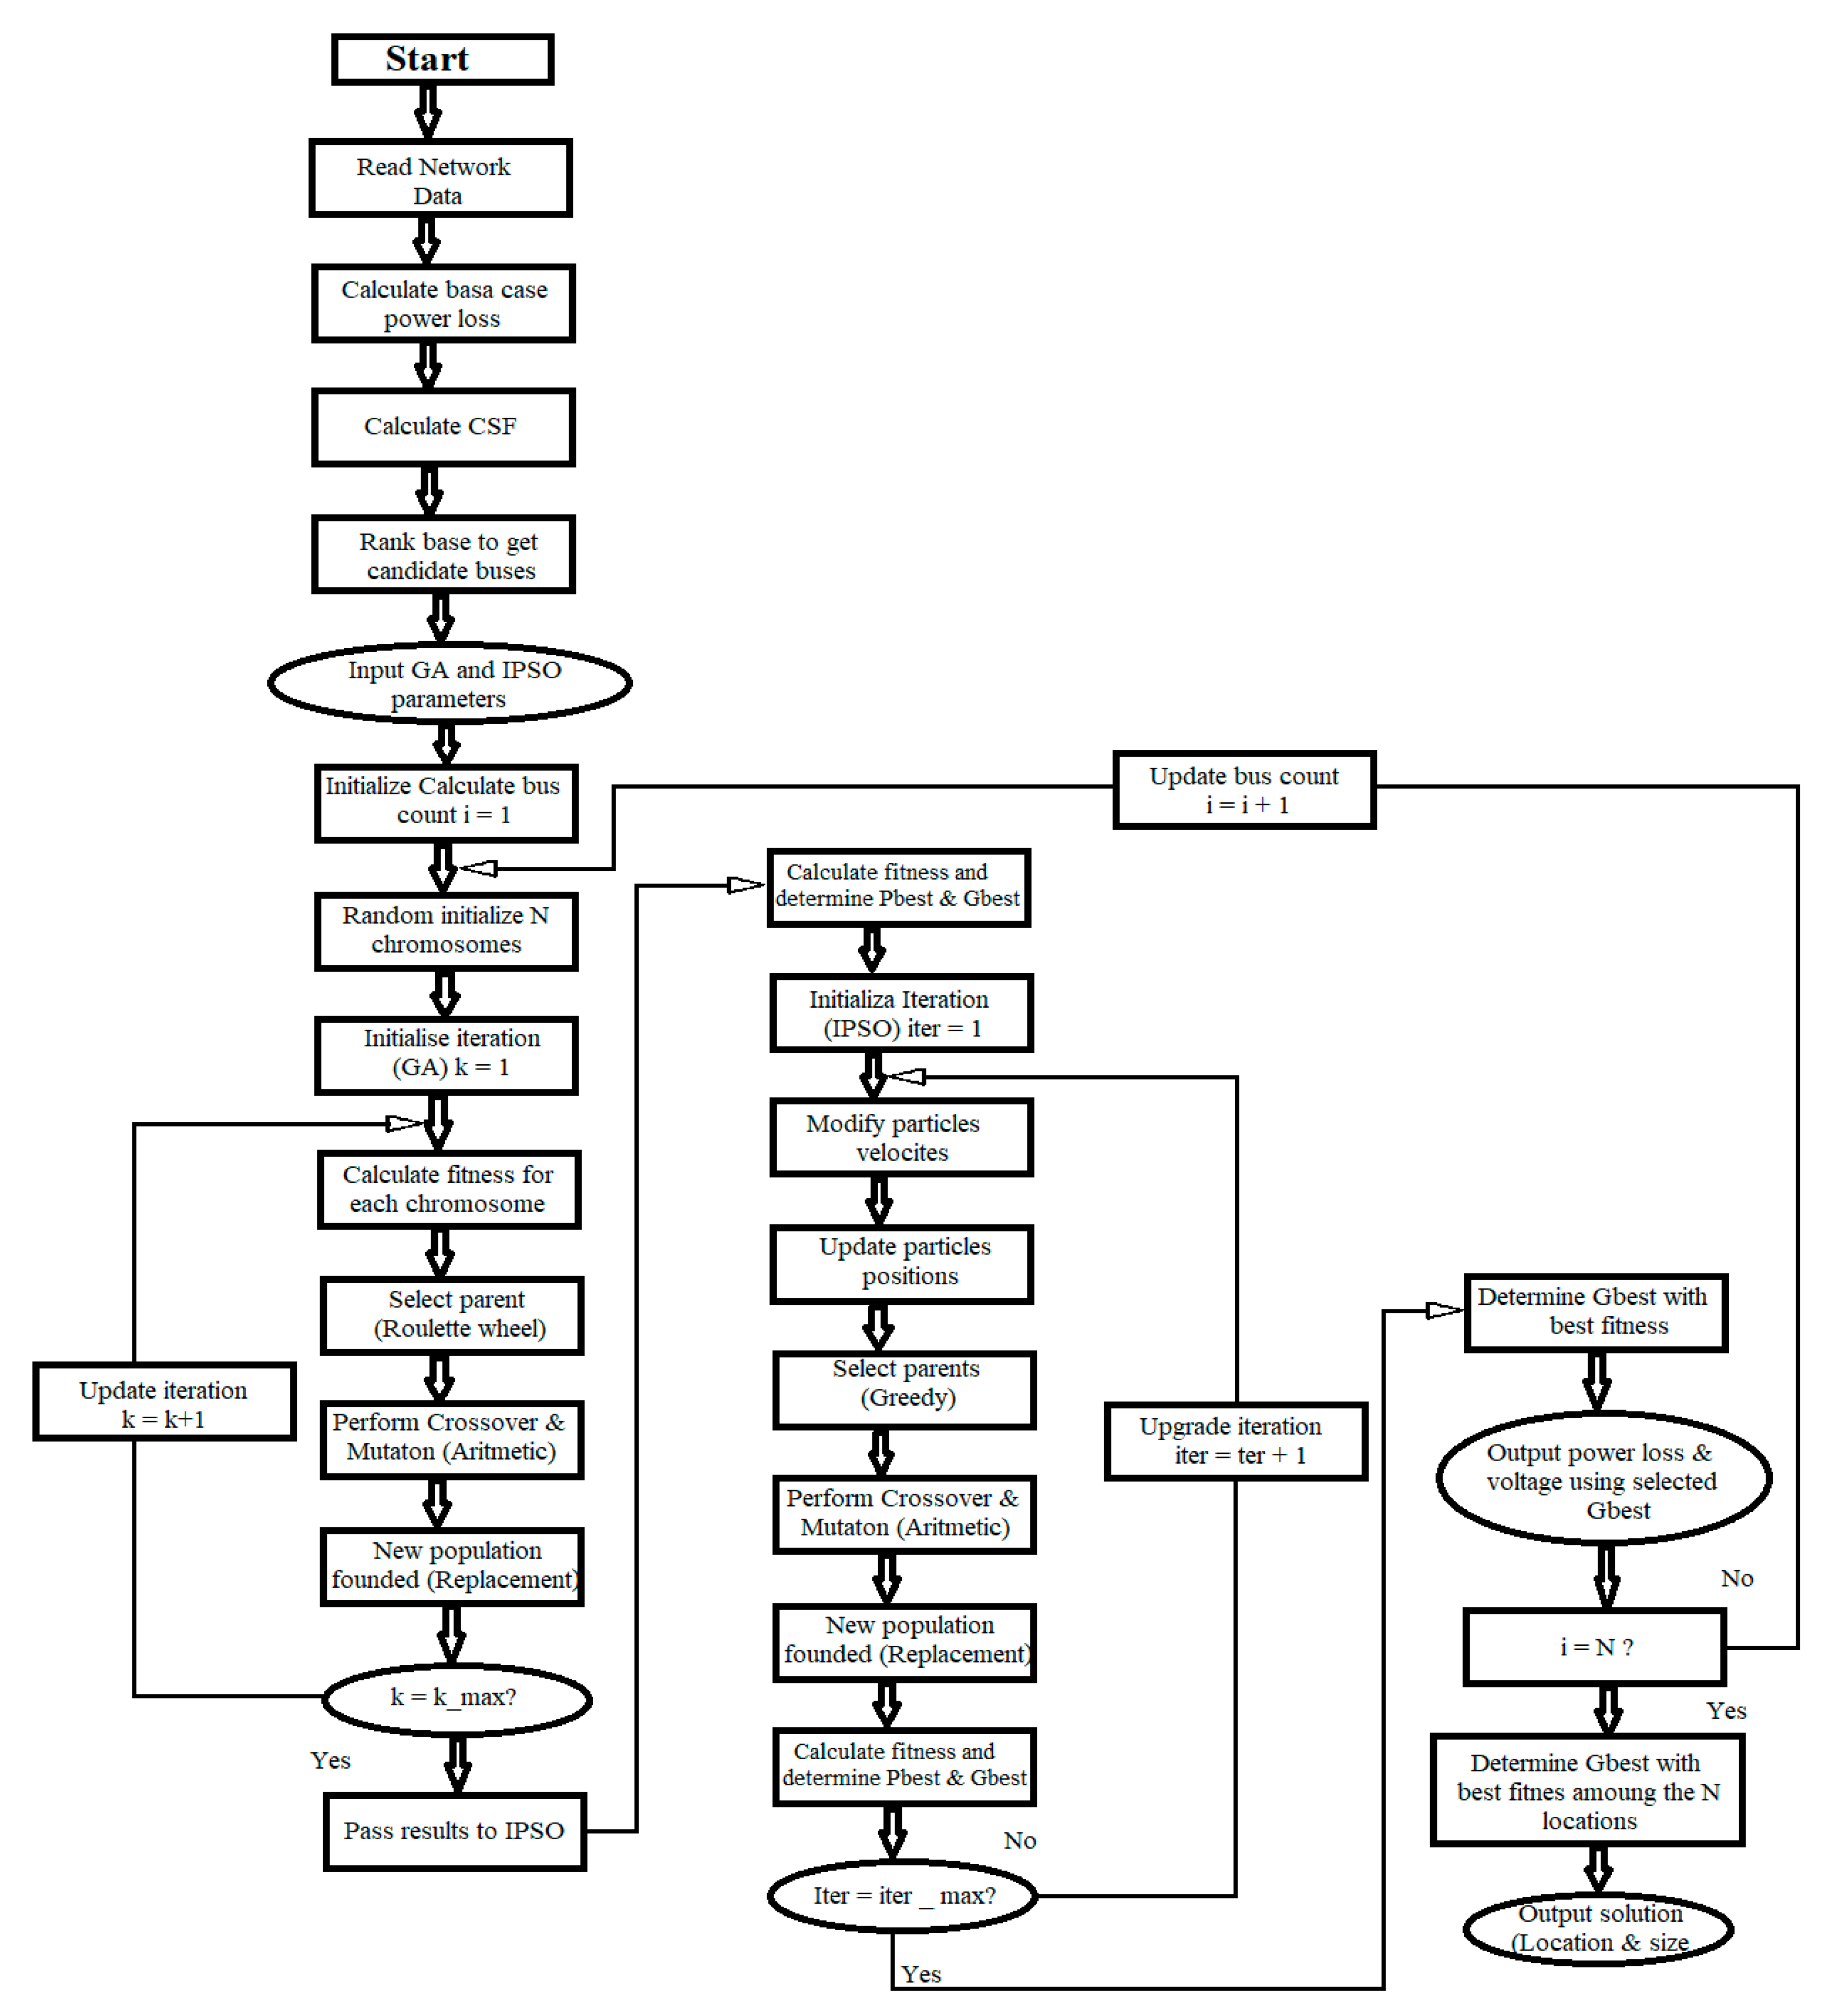
Using this GAIPSO hybrid, EV transmission is maximized. Having electric vehicles on some transmission system buses helps cut down on power losses and boost the voltage profile. Buses are sensitive to power loss and power flow, both of which determine where EVs go. For rapid picking, HGAIPSO requires fewer iterations. Parameters of sensitivity aid HGAIPSO in its search for the EV. The IPSO receives the GA output that details the EV positions and sizes for a given solution. In IPSO, the first batch of particles comes from the GA. The convergence time of IPSO is reduced. Results from IPSO genetic algorithms tend to be very successful.
Figure 11 below details the procedures followed in practice to optimally distribute EV units across the transmission network via HGAIPSO.
3.4. Formulation of System Power Flow Sensitivity Factors
Change in Reactive Power Flow Analysis
If second and higher order terms are ignored, and Taylor series approximation is used, the change in real line flow is expressed as [
61]:
As may be seen in the following illustration, the coefficients in the earlier equation are determined by applying the partial derivatives of the real power flow with respect to and V:
where:
b_ij = nodal voltage of bus I
v_i is the nodal voltage of bus j
is the conductance of the line g and I
δ_ij is the difference between buses I and j in the phase angle.
nL stands for the number of lines in the network.
Formulating the Power Loss Sensitivity Factors
When determining the real power flow sensitivity factors, one considers how the active power injected at any other bus-n affects the real power flow along transmission or transmission lines connected between bus-i and bus-j. Reactive power flow sensitivity factors allow one to quantify how reactive power flows through transmission or transmission lines connecting buses I and j change in response to changes in reactive power injected at any other bus. The matrix form of the equations used to represent changes in line flow is [
62]:
Using the Newton Raphson approach, the variables ∆δ and ∆V may be extracted from the load flow solution as shown below:
Jacobian matrix of the full N-R load expressed as;
Thus, the variables ∆P and ∆Q were obtained from this equation as follows:
Once the derived equation is substituted for the variables ∆P and ∆Q in the equation for the change in line flows, the following results:
The equation 3.47, provides the change in power in both real and reactive terms, can be used to compute both the reactive and real power flow sensitivity factors. Following is a representation of the actual power flow sensitivity factors [68]:
The following is a representation of the reactive power flow sensitivity factors:
where
J = The Jacobian matrix of power flow and the superscript T denotes the transpose;
F (P-P) = The real power flow sensitivity related to the real power injection;
F (P-Q) = The active flow sensitivity related to the reactive power injection;
F (Q-P) = The reactive power flow sensitivity related to the active power injection; and
F (Q-Q) = The reactive power flow sensitivity related to the reactive power injection.
The four sensitivities in this instance are column vectors with dimensions equal to the number of system buses.
3.4.3. Methods for Selecting Weights in Multi-Objective Optimization
In a multi-objective function, the designer might assign different weights to different objectives. The authors of this study highlight the importance of reducing actual power loss because doing so can reduce total operating costs and increase power network efficiency [
63]. Since the other two factors are also crucial, a study was conducted to determine the best weights combination for the multi-objective function by examining the impact of the weights on fitness. In this analysis, we assumed that weight values were positive and within the following range, W1 was in the range of 0.6-0.80, whereas W2 and W3 were constrained to the range of 0.1-0.30.
This was done to place greater weight on the index for reducing real power loss, while all three indices were still taken into account as part of the multi-objective function. Note that in every case, the equation |W1| + |W2| + |W3| = 1 must hold true. Table 4: Weights and Measurements.
The value of 68.81 MVAR was obtained through an estimation of the reactive power in the base case by utilizing the Newton Raphson methodology. This value was utilized for valid comparisons. The number of EVs in both the optimization work and the comparative work was the same. There is a 0-12 MW actual power limit for A, B, and C EVs, a 0-3 MVAR reactive power limit, and a 3-0 MVAR reactive power restriction, respectively.
4. Results, Analysis, and Discussion
After selecting four distinct EV sizes and locations, the Newton-Raphson technique was applied to calculate power losses and voltage levels. Power loss calculations were compared with those made using alternative methods.
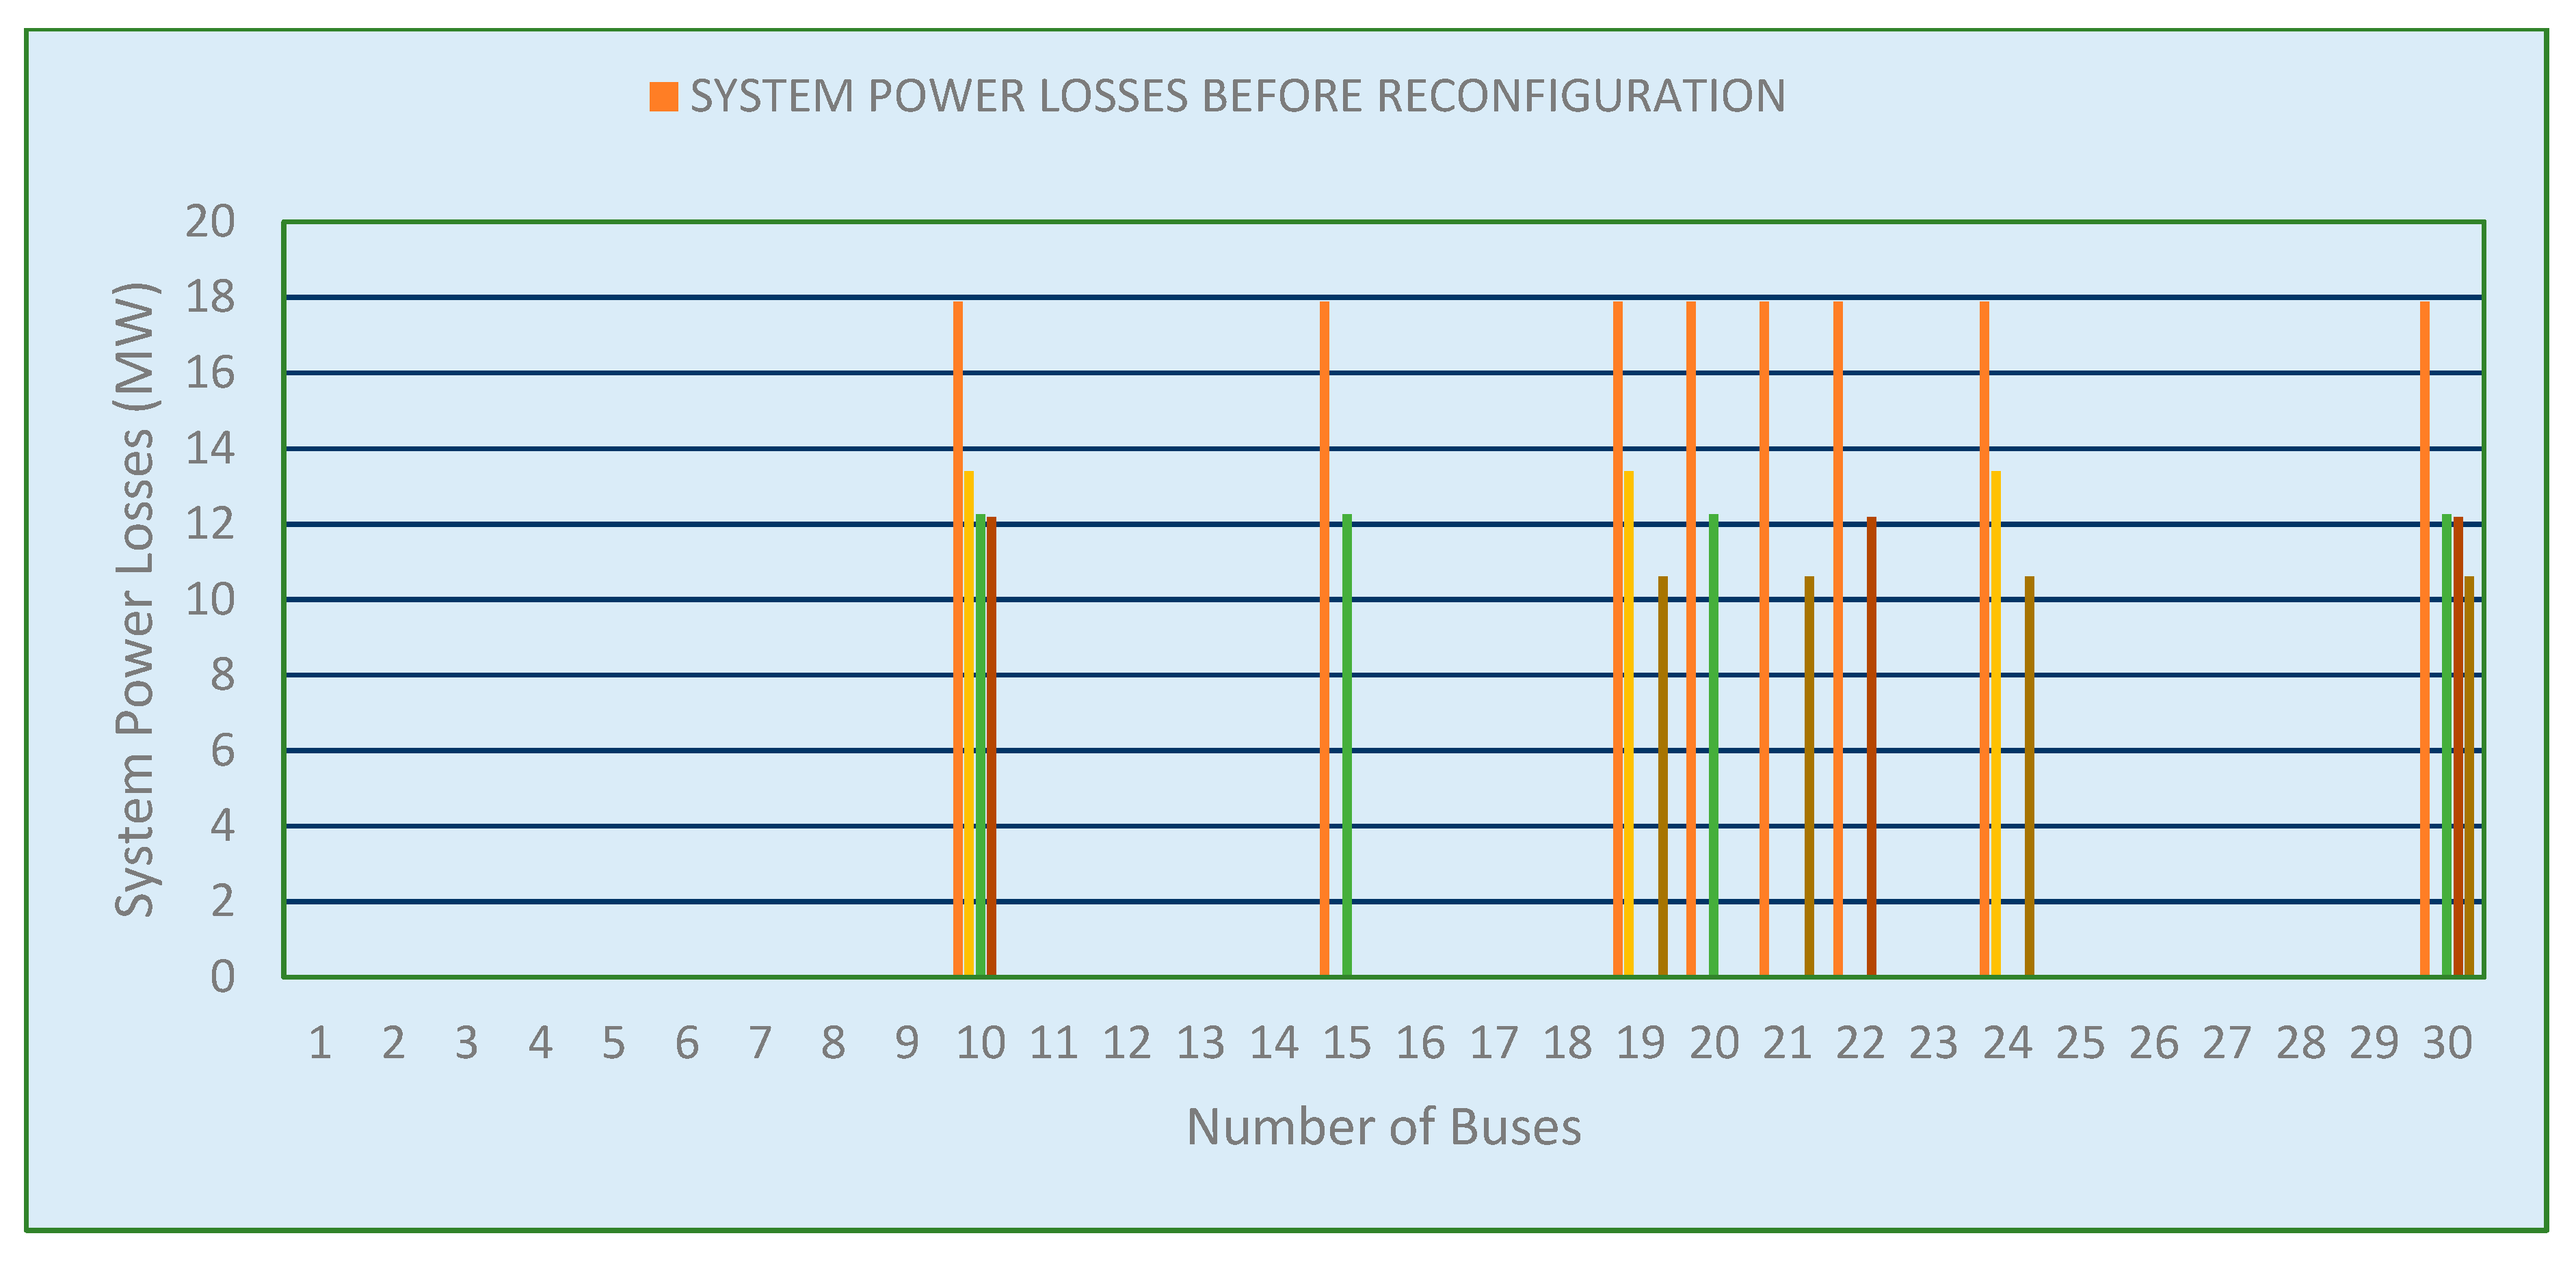
Table 5 and
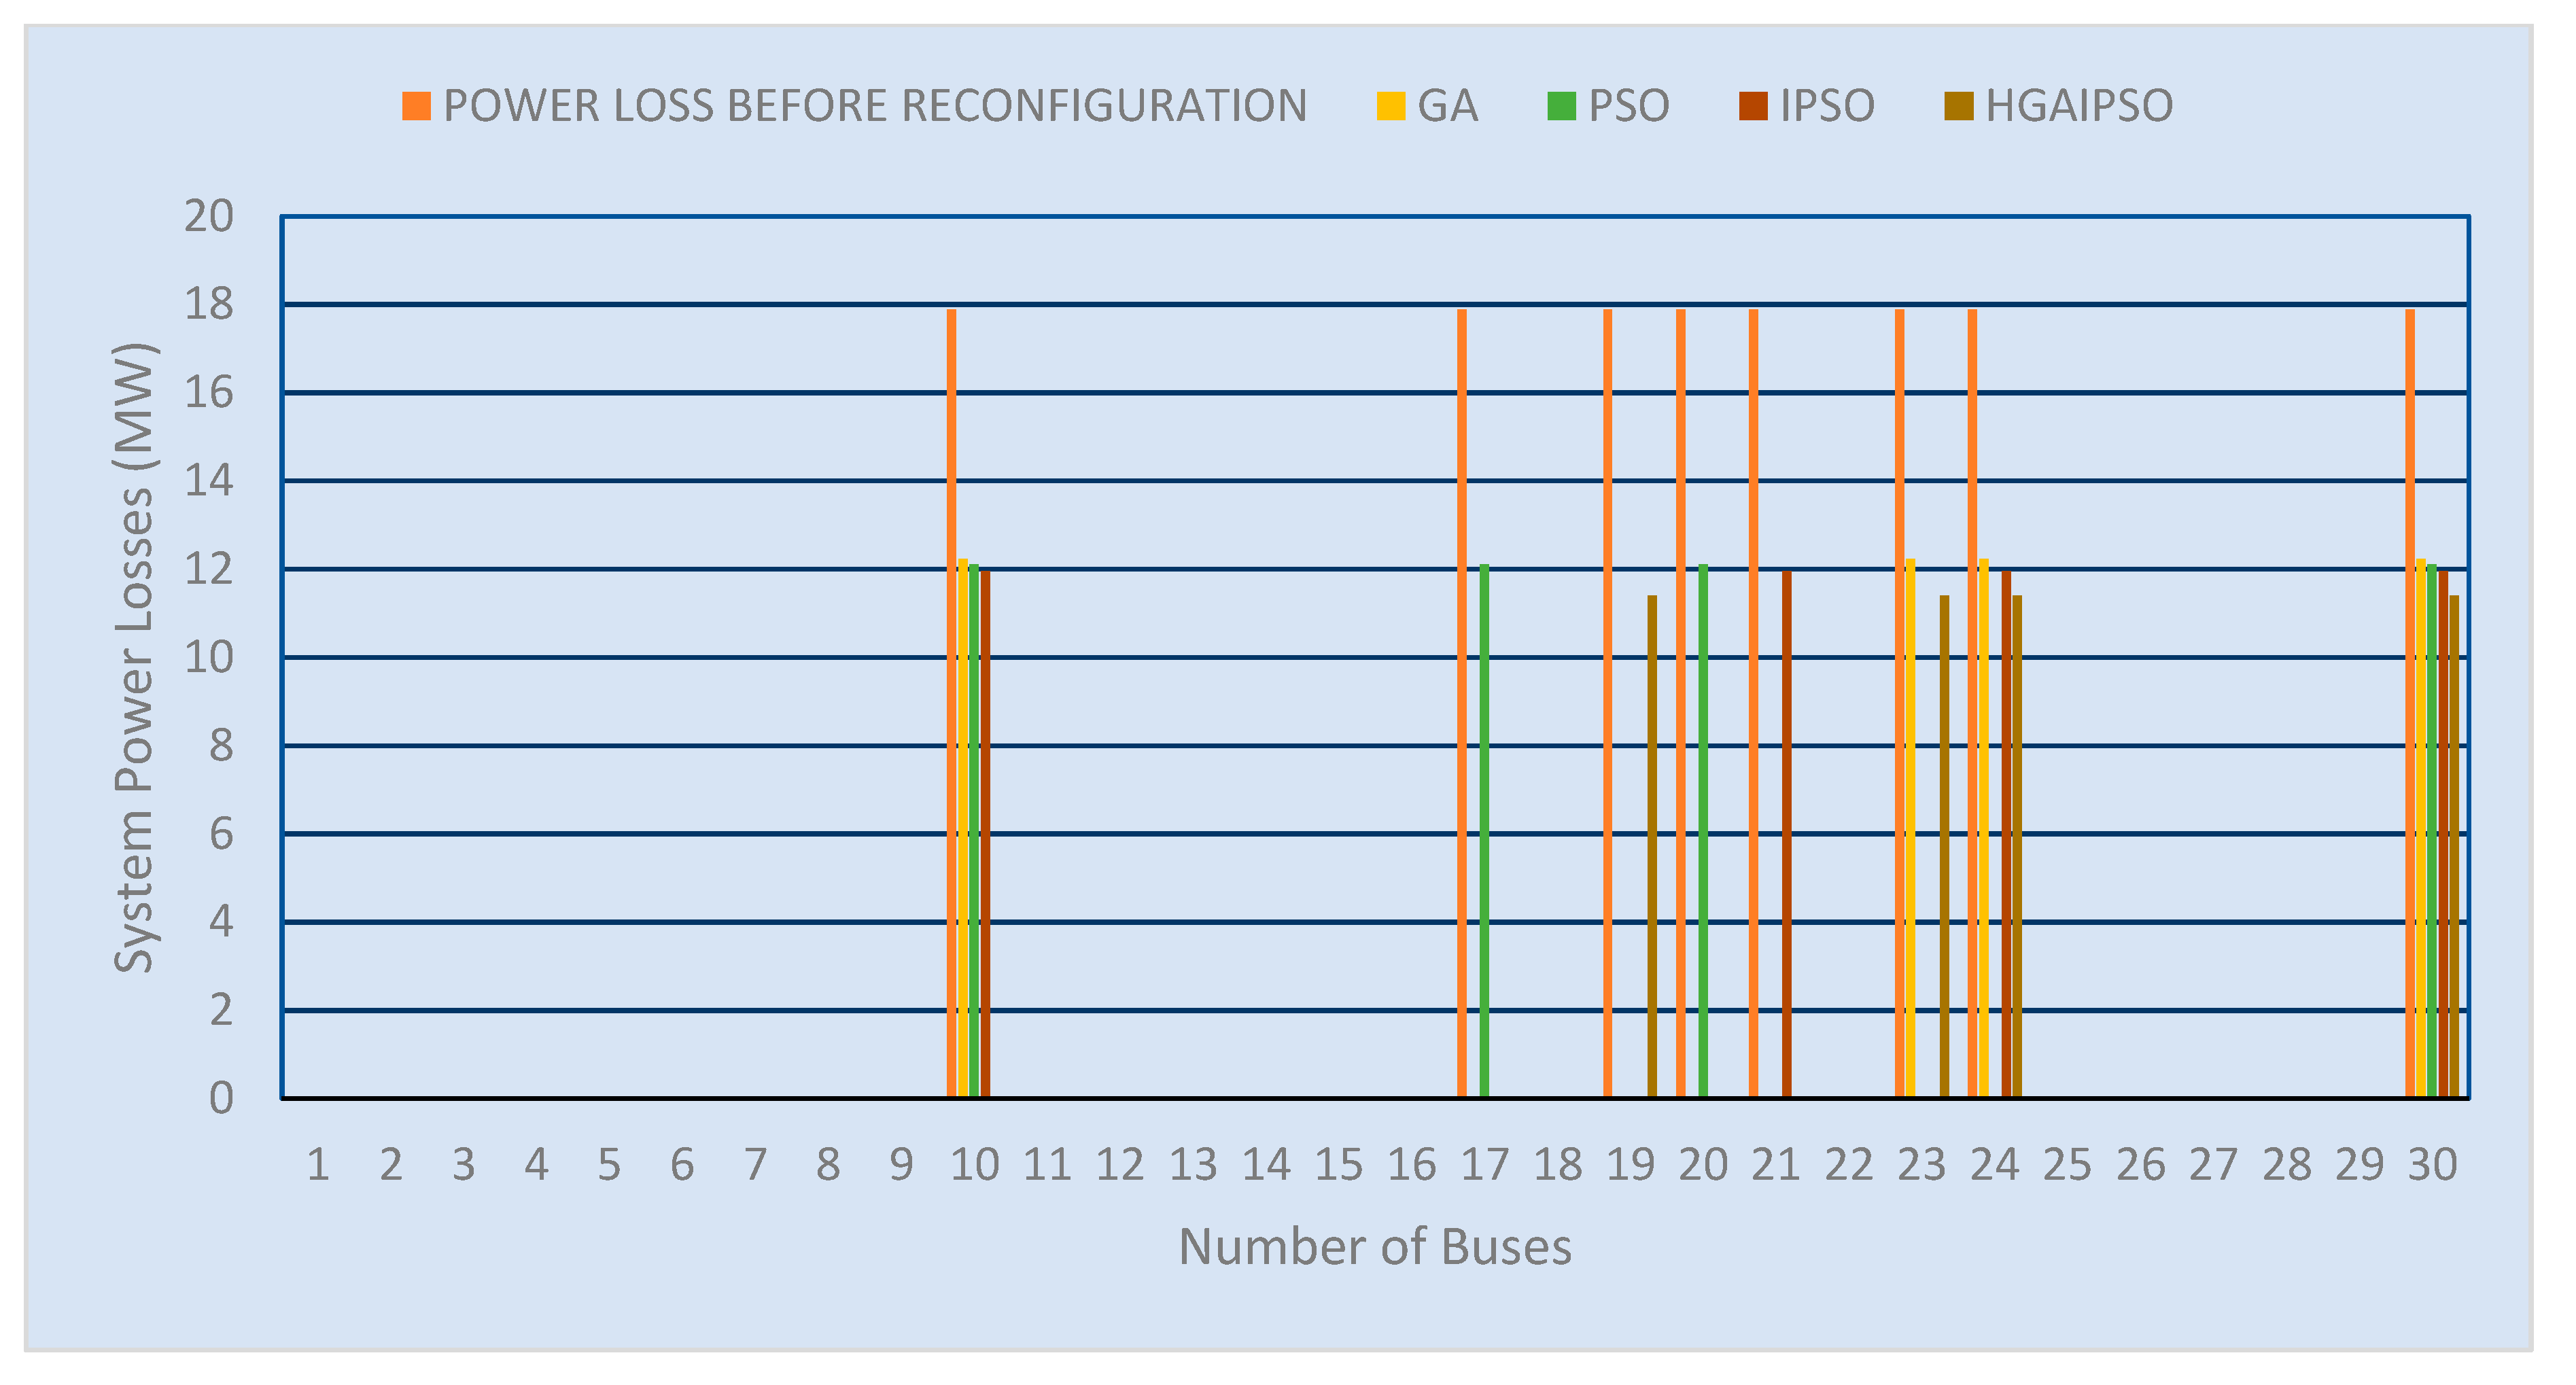
Figure 11 show that, for type A EV, the HGAIPSO methodology reduced real power loss by 40.7040%, which was much higher than the reductions achieved by GA (25.1002%), PSO (31.4187%), or IPSO (31.849%). When comparing the EV obtained using the proposed technique to the EV obtained using other methods, the EV obtained using the proposed way showed good results with EV allocations for loss reduction. The HGAIPSO method outperforms the GA, PSO, and IPSO approaches when it comes to choosing the best location and size for a type A EV to minimize power loss across the electrical transmission system.
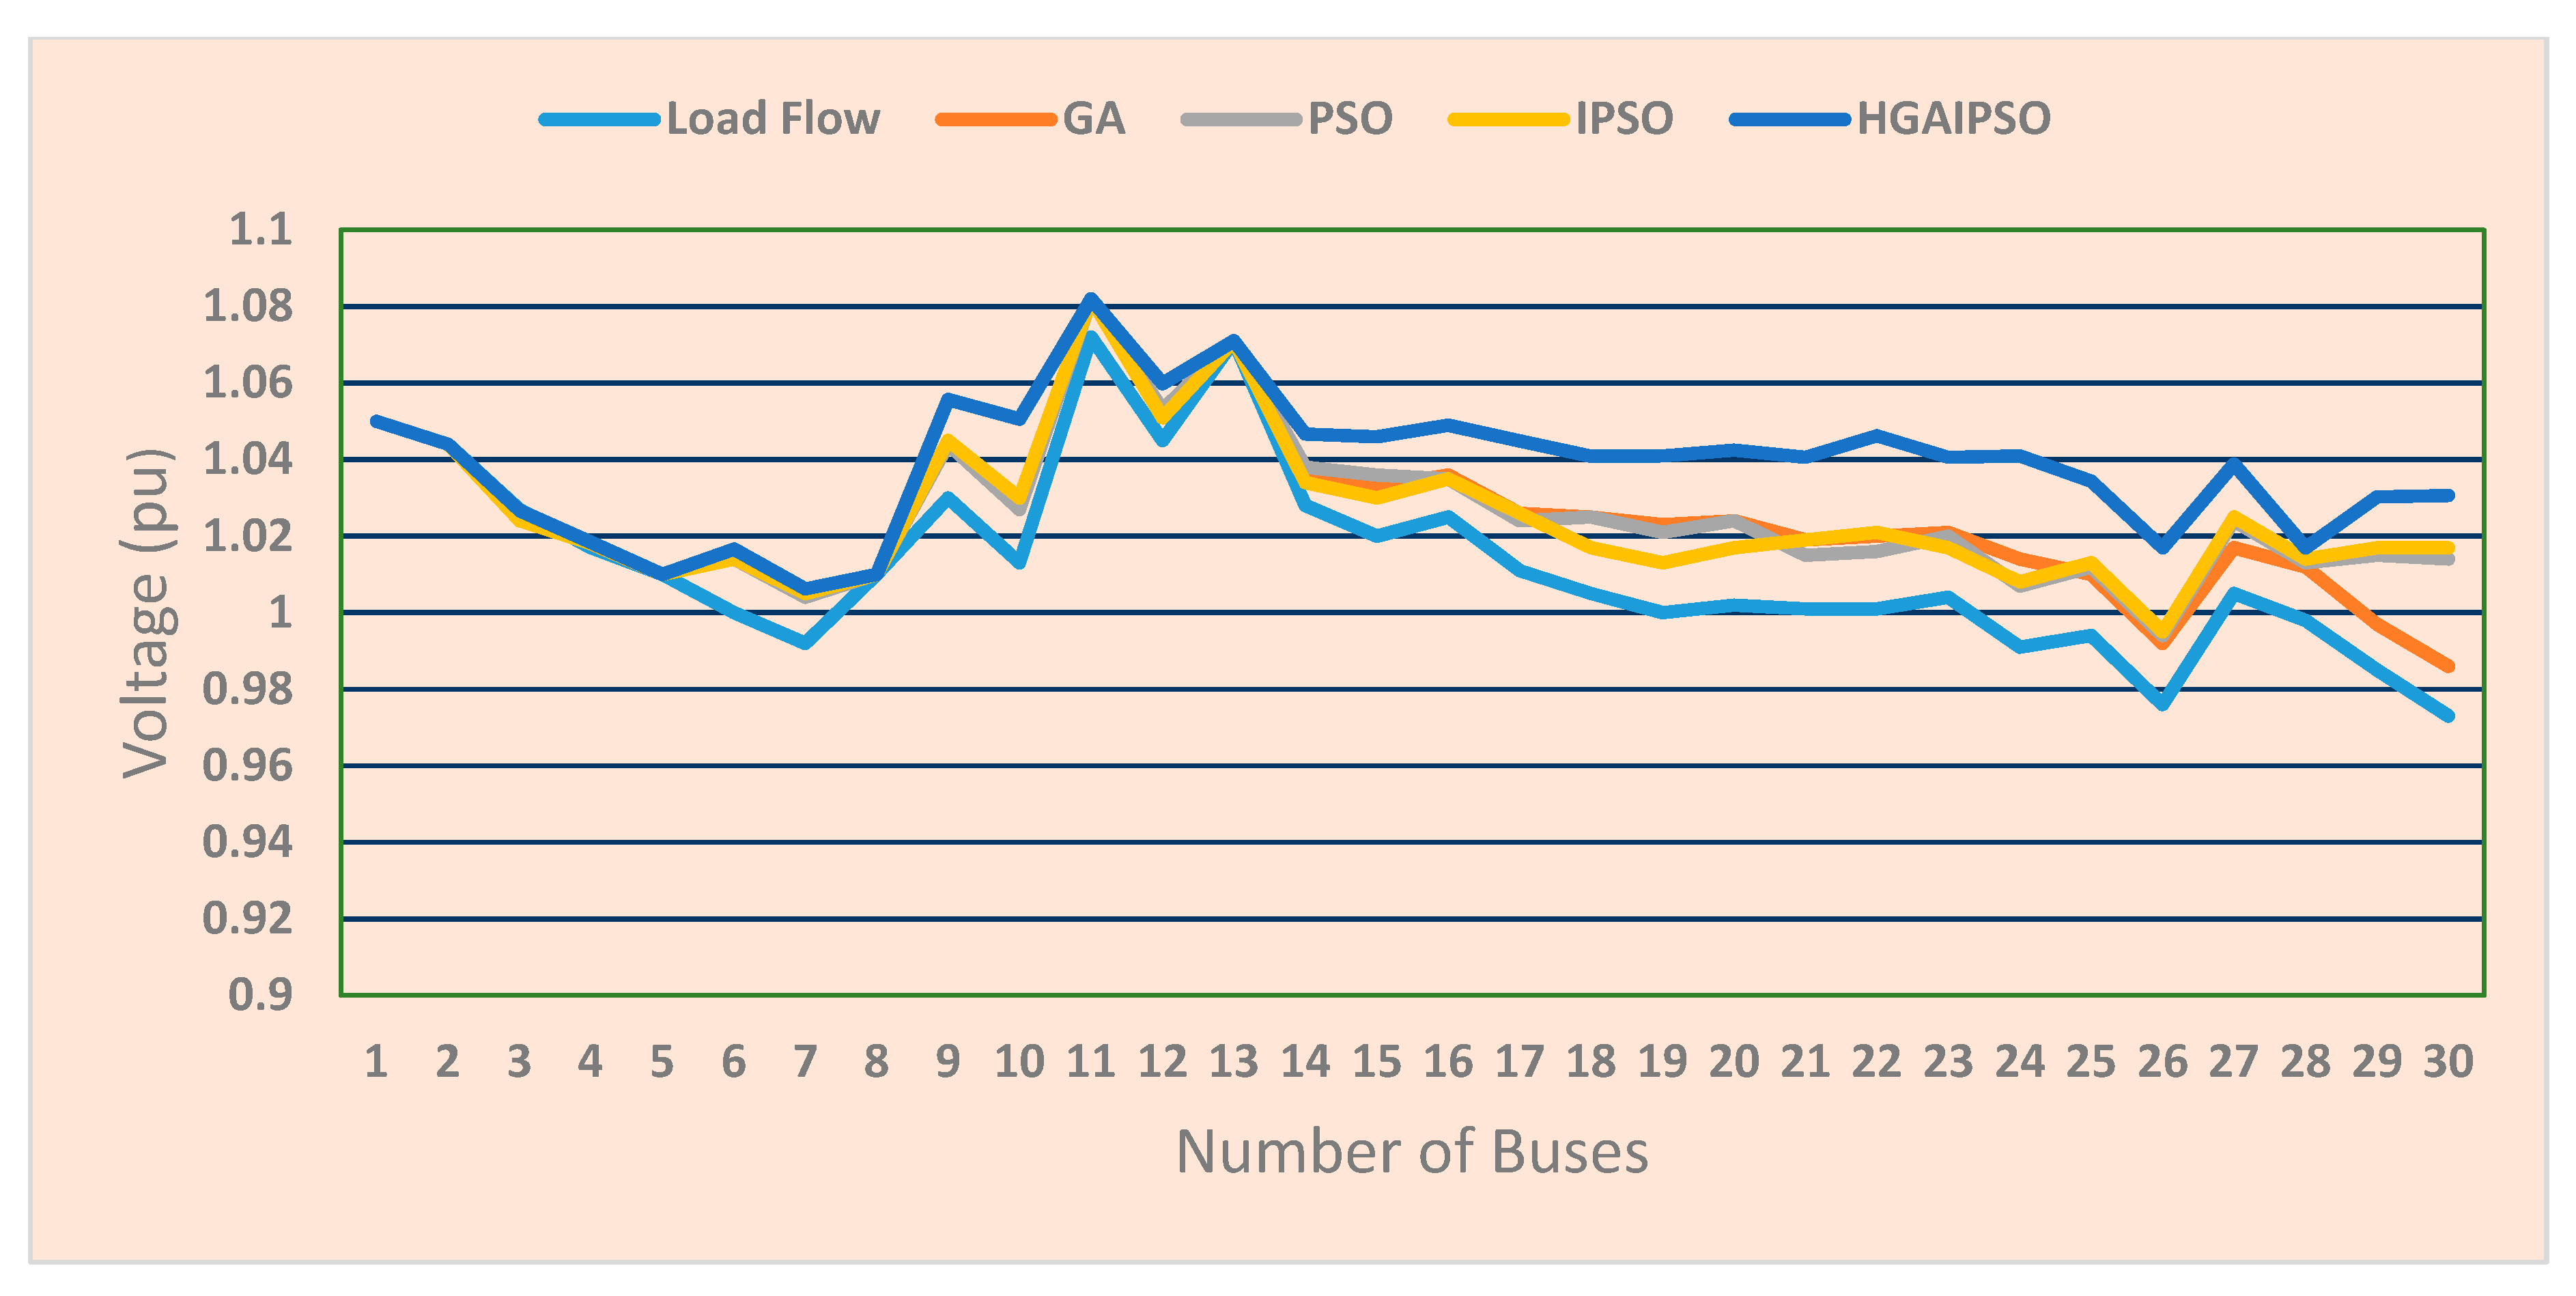
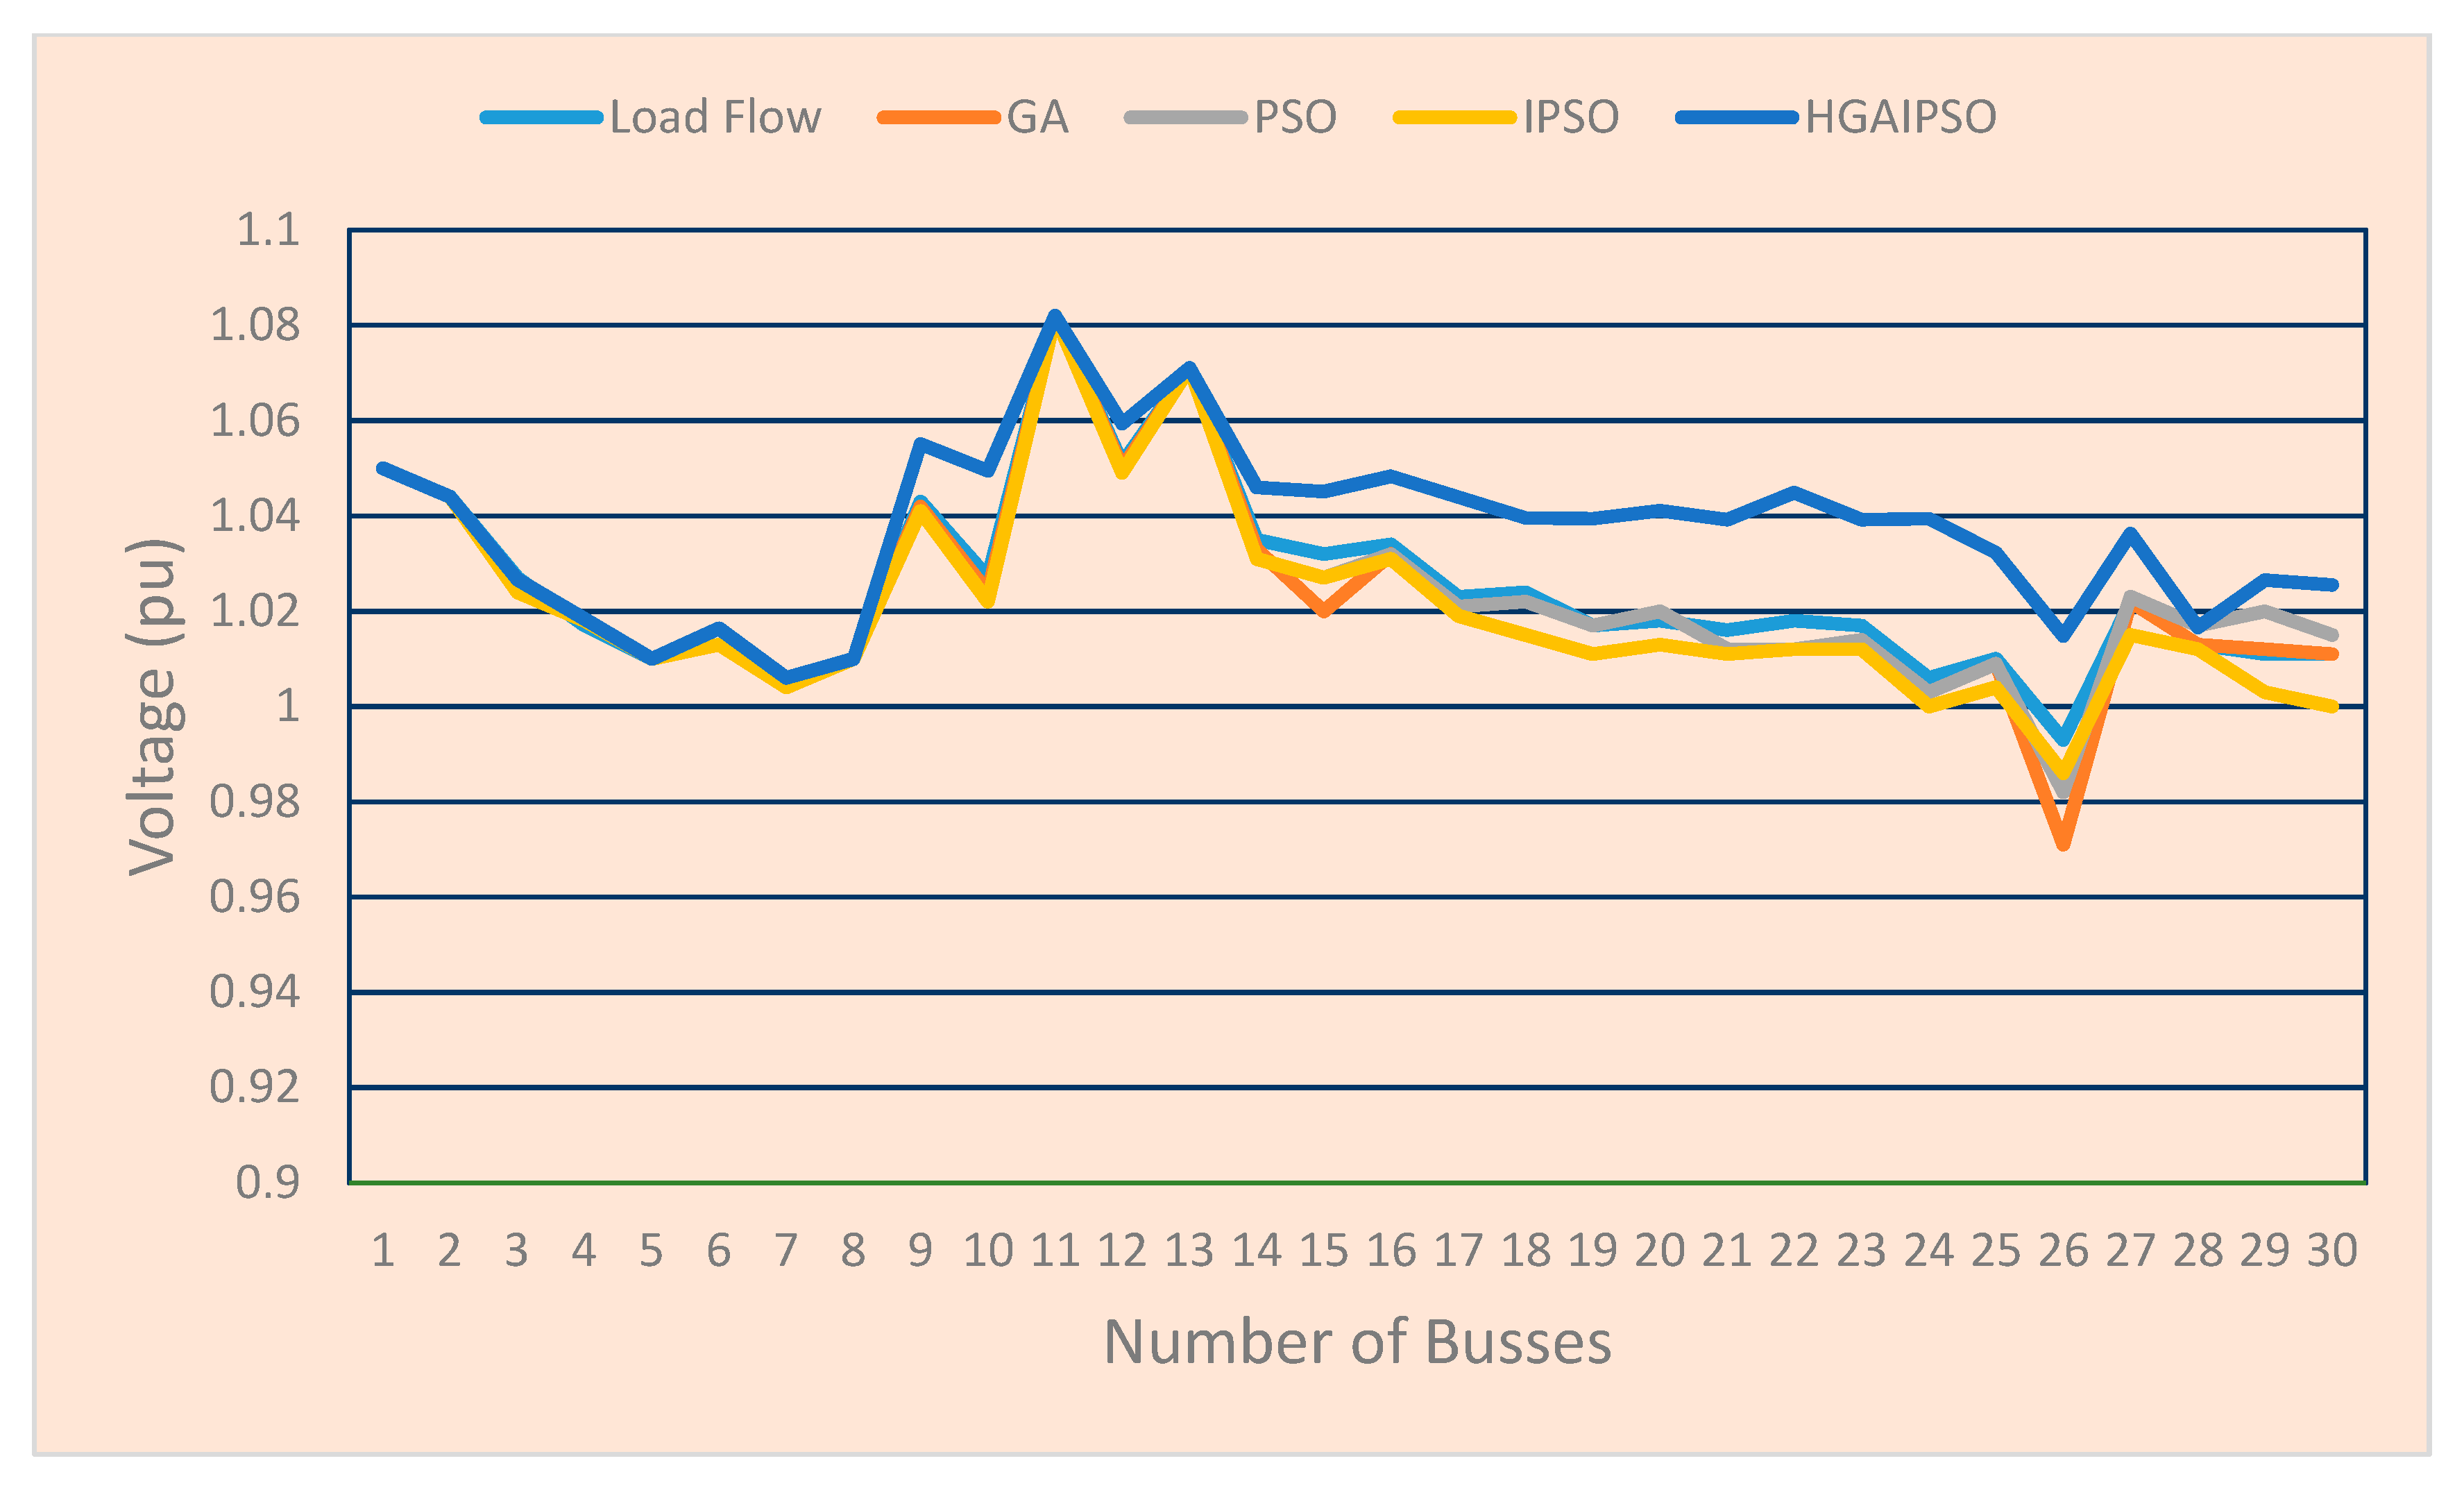
Figure 13 compares the voltages for the no EVs scenario with the ideal EV placement and sizing scenario using GA, PSO, IPSO, and HGAIPSO. The voltages in an IEEE-30 bus system are allowed to range from 0.95 pu to 1.1 pu, however an EV could still affect the system's voltage stability. The addition of EVs does not cause voltage levels to rise above or fall below the allowable range, as seen clearly in
Figure 11. All the busses' voltages were clearly within the allowed range of 0.95 pu to 1.1 pu. With the HGAIPSO method, the bus's voltage has been increased from below the minimum required to at least the allowed 1.01 pu. No cases of excessive voltage have been identified.
Figure 12.
Using Type, A EVs, we compare the power loss data.
Figure 12.
Using Type, A EVs, we compare the power loss data.
4.2. Scenario 2, Type B EV
Table 6's columns on fitness and EV size guided our selection of the four best locations for type B EVs and their matching optimal sizes. These areas just offered the barest minimum when it came to fitness values and the corresponding EV sizes. Here are the four most advantageous places, in order of increasing success, along with the corresponding optimal EV sizes:
EVs on buses 19 and 23 produce 11.7872 megawatts and 2.9609 megavolt-amperes of electricity, respectively; EVs on bus 24 produce 12.0001 megawatts and 1.3702 megavolt-amperes of electricity.
Table 7 and
Figure 14 show that real power losses can be reduced by 36.2403% by using the HGAIPSO method to optimize the placement and size of this type of EV. This result is far better than the outcomes obtained by using GA (32.2923% reduction), PSO (31.5890% reduction), or IPSO (33.1638% reduction). We chose these methods for sizing and allocating the EVs to reduce power loss, and the resulting sizes are comparable to those found by alternative methods.
Voltage Profile
After deciding where to put the type B EVs and how big they should be, researchers looked at the IEEE-30 bus system's voltage profile. Below is a picture that has been labeled
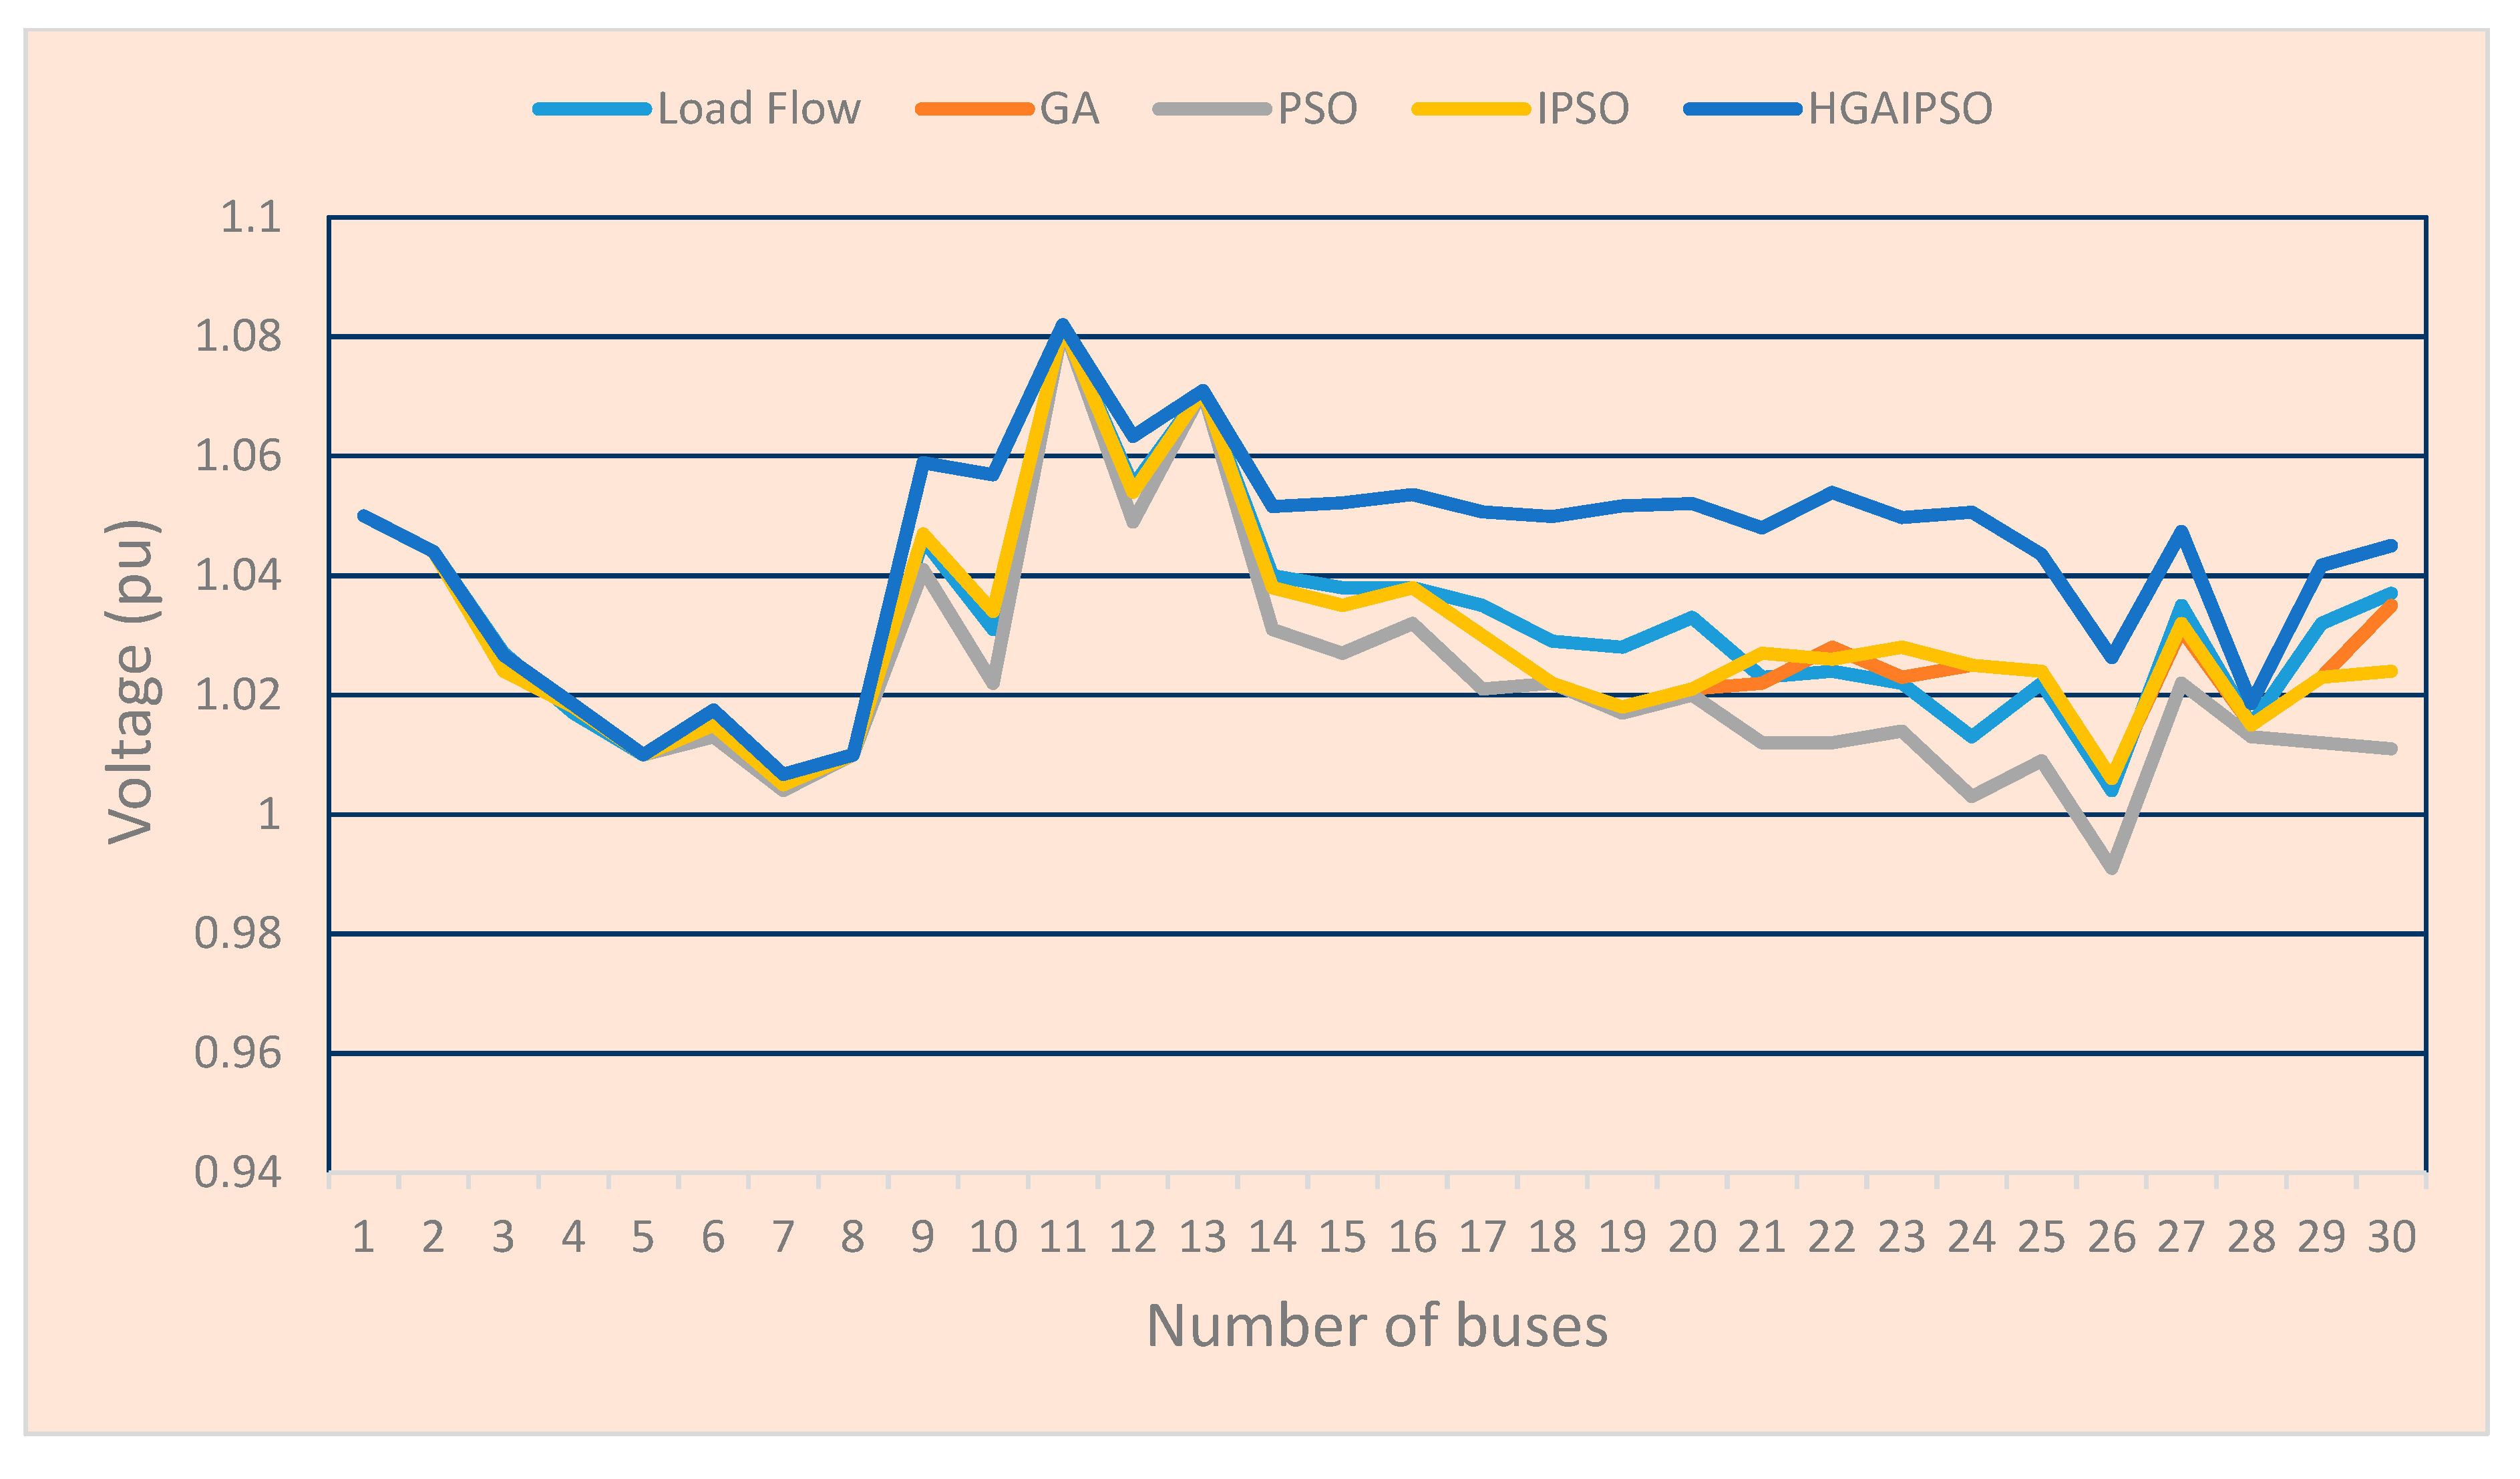
Figure 13, which depicts the findings from the study of the bus voltage levels. This scenario is contrasted with another in which electric vehicles (EVs) were parked in various locations and their performance was evaluated using a range of metrics, as well as with a third scenario in which no EVs were present.
In
Figure 15, we see a contrast between the voltages in a world without EVs and those in a world where EVs have been optimally placed and scaled using GA, PSO, IPSO, and HGAIPSO. The bottom of the figure features this comparison. An EV may be able to disturb the stability of voltages in an IEEE-30 bus system even when the voltages are within the allowed limits of 0.95 pu to 1.1 pu. The range of legal values is from 0.95 pu to 1.1 pu.
Figure 15 shows that illegally high voltage levels were not the result of the introduction of EVs. There is evidence to back up this conclusion. As far as can be told, all of the bus voltages stayed within the specified range of 0.95 pu to 1.1 pu throughout the whole experiment. The HGAIPSO plan worked to reduce the bus's voltage, and as a result, no bus voltages were found to have exceeded the allowable limit.
4.3. Scenario 3, Type C EV
Four optimal locations for type B EVs and their corresponding optimal sizes were selected based on the columns in
Table 8 that indicate fitness and EV size. These areas only provide the most fundamental information regarding fitness levels and associated EV sizes. According to their relative success, the top four sites and the corresponding ideal EV sizes are as follows:
Bus 19's EV generates 12.0010 MW and uses 0.4882 MVar of electricity.
The electric vehicle (EV) on bus 24 produces 11.9470 MW and consumes 0.5042 MVar of energy.
The electric vehicle on bus 21 produces 11.9179 MW and consumes 0.0692 MVar of energy.
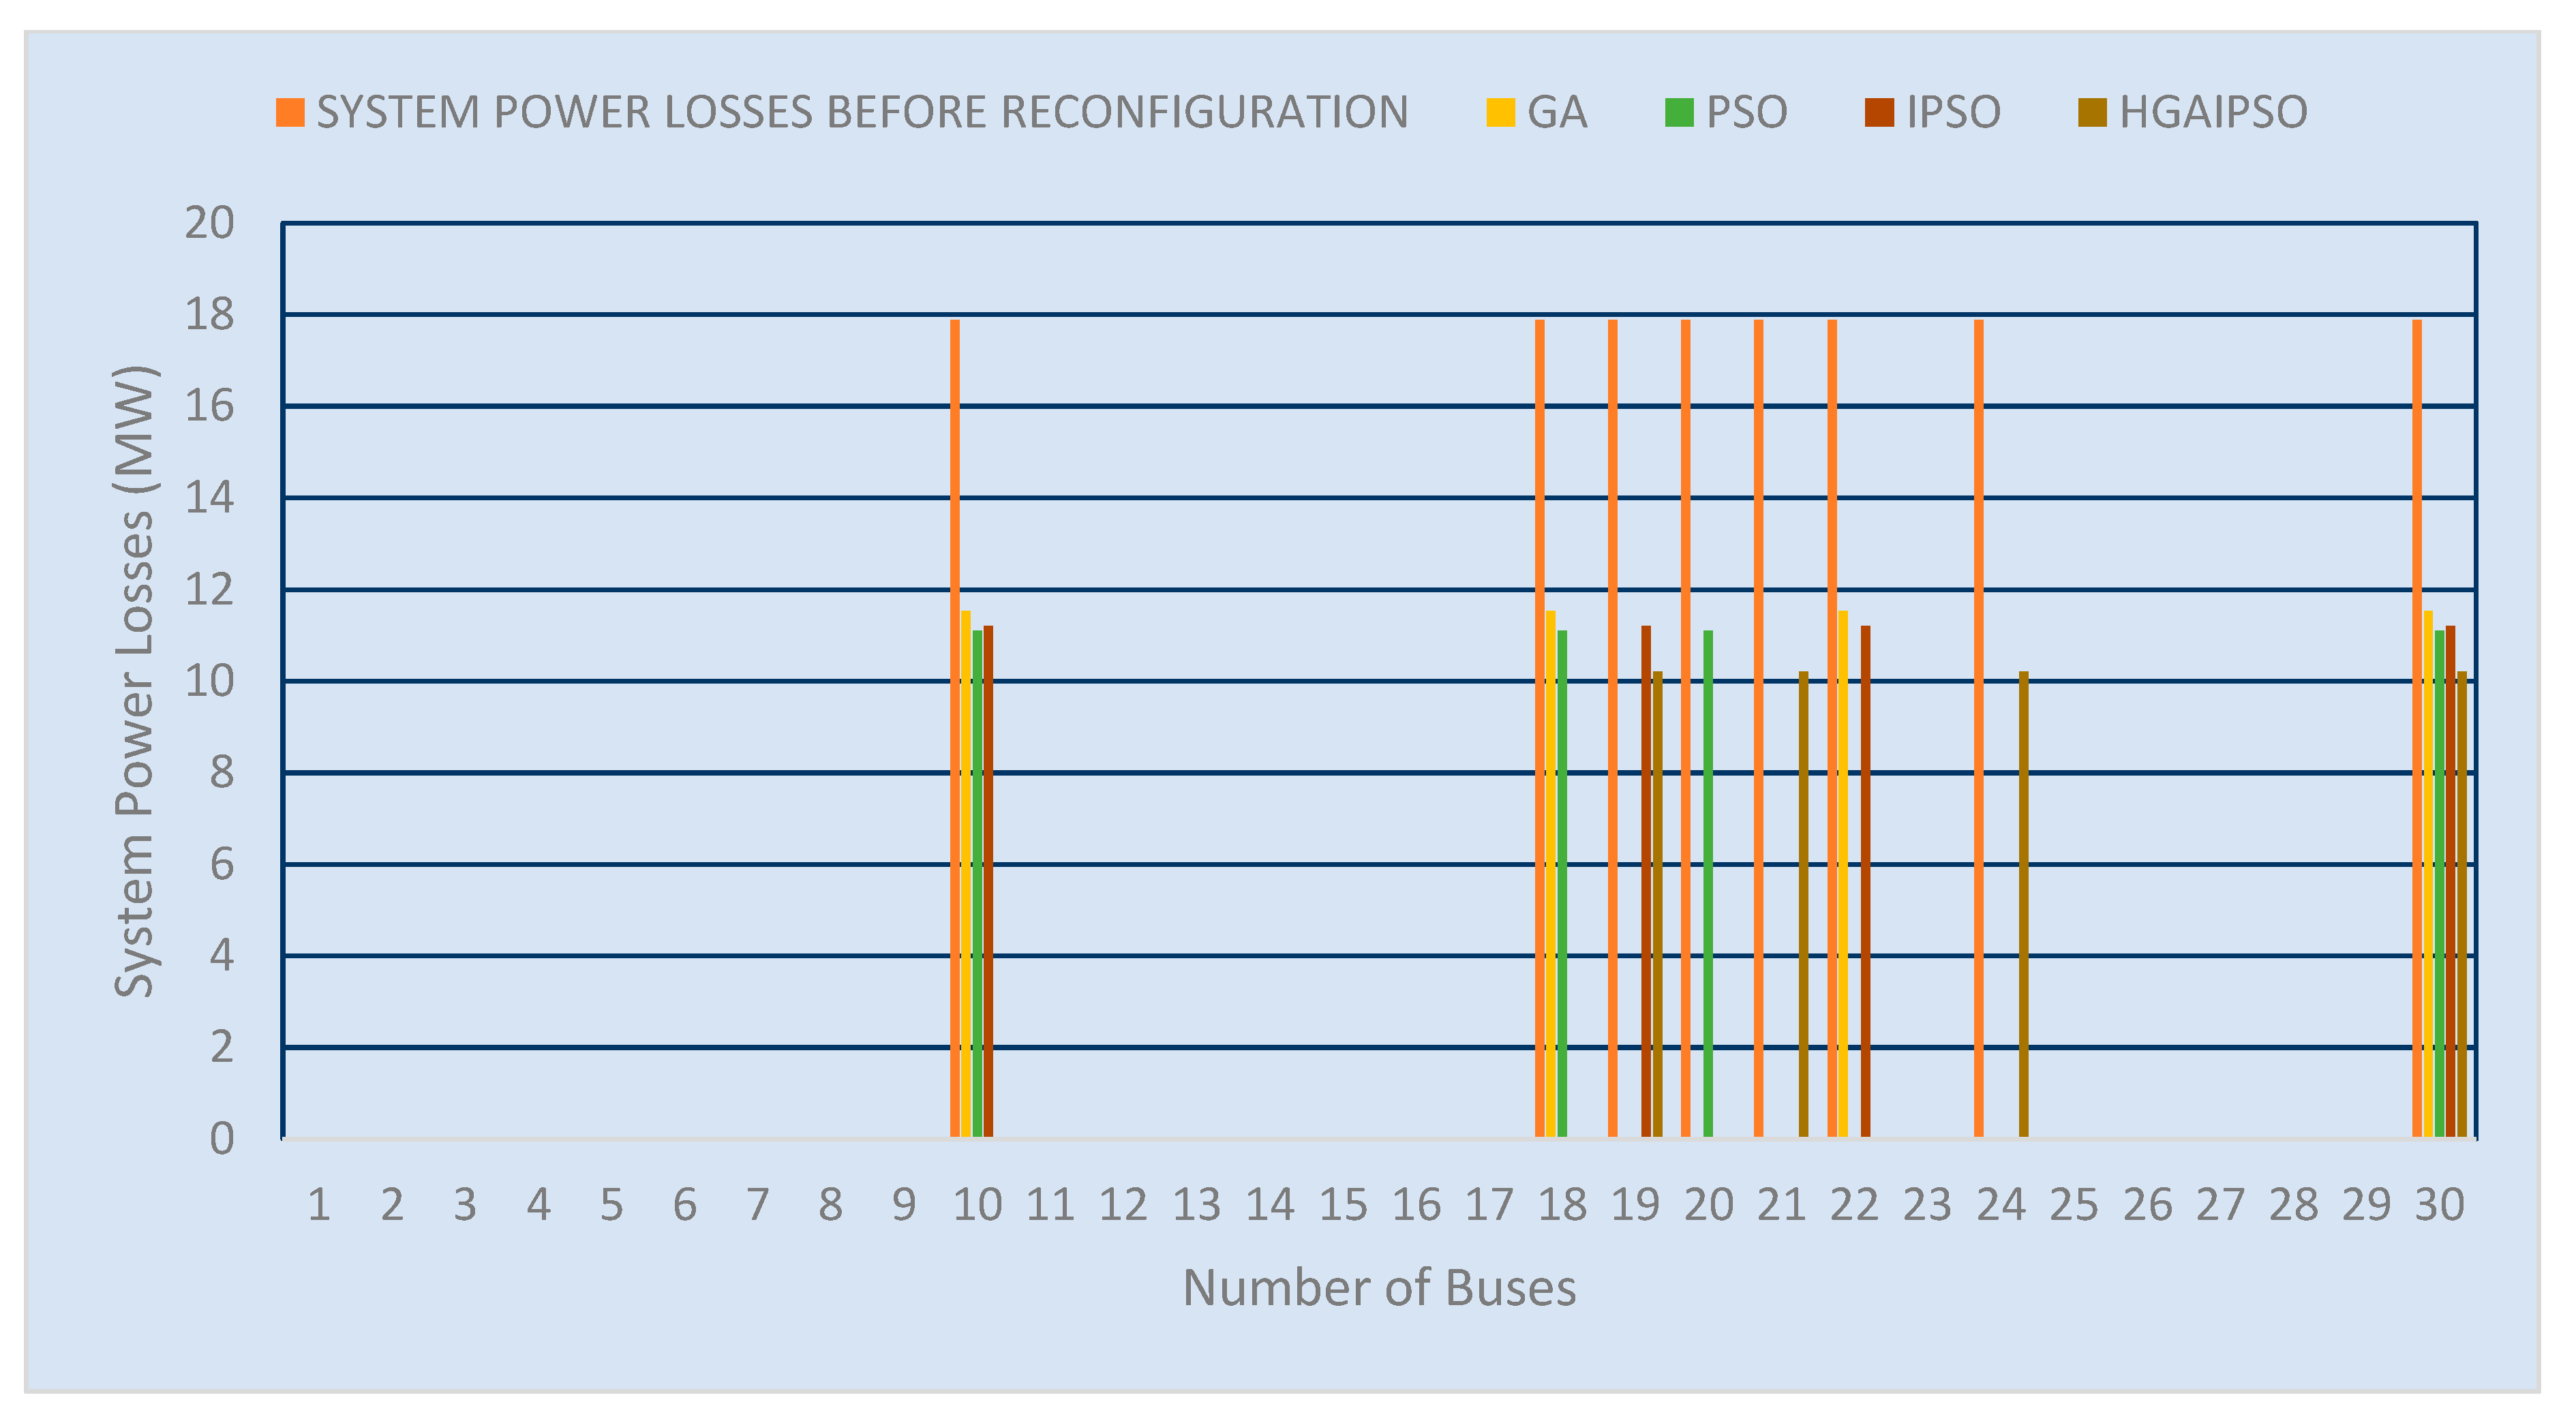
Table 8 and
Figure 16 show a comparison of the power loss results as a function of the different methods. These findings are presented alongside the power losses that resulted from them. The power loss is reduced by 42.9406 percentage points greater with the HGAIPSO method than either the PSO or IPSO approaches. When compared to GA (35.6967%), PSO (37.12887%), and IPSO (37.301%), the results produced with the proposed technique were much better.
Figure 17 clearly demonstrates that the bus voltage was greatly increased when the HGAIPSO approach was applied. This indicates that the placement and size of the electric cars were optimized as a result of their incorporation. By making strategic adjustments to the number and size of type C EVs, we were able to increase the bus voltage from 0.973 to 1.01 pu. Type C EV placement and size optimization allowed for this to happen. This would indicate that the value of 1.095 pu was selected as the limit. The bus voltage profile was subsequently boosted as a direct result of these occurrences, which can be seen as a good thing.
5. Conclusions
After discovering that optimizing the placement and size of EVs would reduce power losses and improve voltage profiles, the problem of power losses in systems could be solved. In this paper, we present HGAIPSO, a hybridized algorithm designed to enhance voltage profiles while decreasing system power losses. By combining the sensitivity factors with the test run on the IEEE-30 bus test system, the number of algorithm iterations was successfully decreased. Fourteen buses were selected as suitable EV locations for the IEEE-30 bus test. The HGAIPSO method was shown to be more effective at reducing it than the GA, PSO, and IPSO approaches in three distinct types of EVs connected via the IEEE-30 bus. When using electric vehicles of types, A, B, and C, the actual power loss was reduced by 40.7040 percent, 36.2403 percent, and 42.9406 percent, respectively. The greatest bus voltage, 1.01 pu, was generated in each of the three scenarios, proving that the voltage profile was improved overall.
This shows that HGAIPSO is superior to GA, PSO, and IPSO when it comes to optimizing the value of this parameter, as it decreased the losses experienced by the IEEE-30 bus test system and had the potential to improve the voltage profile of the system. Using the HGAIPSO algorithm, the effect of transmission generation on power loss and volt-age profile was made crystal clear; specifically, the addition of Electric Vehicles to the power system resulted in a decrease in system power losses, up to a maximum ideal number of total Electric Vehicles in operation. It is expected that if the number of EVs is increased beyond the optimal number, the voltage profile will shift in a way that reduces bus voltages while still being within acceptable limits. The objectives of the study were accomplished, and the HGAIPSO optimization approach was found to be superior to GA, PSO, and IPSO in reducing transmission losses in power grids through optimal placement and sizing of electric vehicles (EVs).
In this research, the transmission network modification problem was approached using a GA and PSO hybrid technique, which proved to be both efficient and accurate. In order to preserve the unique characteristics of each individual, this plan uses a combination of methods. In addition, the system employs a mending strategy to meet the radial requirements for each GA chromosome or PSO particle, drastically cutting down on the total amount of solution space. The suggested method can find the globally optimal solution, and it converges quickly without ever becoming stuck in a local minimum. The newly proposed hybrid method concurrently finds optimal solutions for a large number of run iterations while using less computing time on average and having a lower standard deviation in losses than earlier methods. The suggested method can find the globally optimal solution, and it converges quickly without ever becoming stuck in a local minimum. The newly proposed hybrid method concurrently finds optimal solutions for a large number of run iterations while using less computing time on average and having a lower standard deviation in losses than earlier methods.
References
- Kumar, R.; Saxena, R. Simulation and Analysis of Switched Reluctance Motor Drives for Electric Vehicle Applications using MATLAB. In Proceedings of the 2019 4th International Conference on Electrical, Electronics, Communication, Computer Technologies and Optimization Techniques (ICEECCOT), Mysuru, India, 13–14 December 2019; pp. 23–28. [Google Scholar]
- Chang, H.C.; Jheng, Y.M.; Kuo, C.C.; Hsueh, Y.M. Induction motors condition monitoring system with fault diagnosis using a hybrid approach. Energies 2019, 12, 1471. [Google Scholar] [CrossRef]
- Ganesan, S.; David, P.W.; Balachandran, P.K.; Samithas, D. Intelligent Starting Current-Based Fault Identification of an Induction Motor Operating under Various Power Quality Issues. Energies 2021, 14, 304. [Google Scholar] [CrossRef]
- Pindoriya, R.M.; Rajpurohit, B.S.; Kumar, R.; Srivastava, K.N. Comparative analysis of permanent magnet motors and switched reluctance motors capabilities for electric and hybrid electric vehicles. In Proceedings of the 2020 IEEMA Engineer Infinite Conference (eTechNxT), New Delhi, India, 13–14 March 2020; pp. 1–5. [Google Scholar] [CrossRef]
- Rahman, M.S.; Lukman, G.F.; Hieu, P.T.; Jeong, K.-I.; Ahn, J.-W. Optimization and Characteristics Analysis of High Torque Density 12/8 Switched Reluctance Motor Using Metaheuristic Gray Wolf Optimization Algorithm. Energies 2021, 14, 2013. [Google Scholar] [CrossRef]
- Ronanki, D.; Kelkar, A.; Williamson, S.S. Extreme fast charging technology—Prospects to enhance sustainable electric transportation. Energies 2019, 12, 3721. [Google Scholar] [CrossRef]
- Faizal, M.; Feng, S.; Zureel, M.; Sinidol, B.; Wong, D.; Jian, K. A review on challenges and opportunities of electric vehicles (evs). J. Mech. Eng. Res. Dev. JMERD 2019, 42, 130–137. [Google Scholar] [CrossRef]
- Suarez, C.; Martinez, W. Fast and Ultra-Fast Charging for Battery Electric Vehicles—A Review. In Proceedings of the 2019 IEEE Energy Conversion Congress and Exposition (ECCE), Baltimore, MD, USA, 29 September–3 October 2019; pp. 569–575. [Google Scholar]
- Mansour, M.B.M.; Said, A.; Ahmed, N.E.; Sallam, S. Autonomous parallel car parking. In Proceedings of the 2020 Fourth World Conference on Smart Trends in Systems, Security and Sustainability (WorldS4), London, UK, 27–28 July 2020; pp. 392–397. [Google Scholar]
- Wang, Y.; Sun, W.; Lu, Y. Research on application in intelligent vehicle automatic control system. J. Phys. Conf. Ser. 2021, 1828, 012046. [Google Scholar] [CrossRef]
- Aref, A. Optimal Sizing and Sitting in Radial Standard System using PSO. Am. J. Sci. Res. 2012, 67, 50–58. [Google Scholar]
- S.A. Gholamian, “Optimal Placement and Sizing of Capacitor and Distributed Generation with Harmonic and Resonance Considerations Using Discrete Particle Swarm Optimization”, I.J. Intelligent Systems and Applications, 07, pp.42-49, 2013.
- M. Padma, N. Sinarami and V.C Veera, “Optimal Dg Placement for Maximum Loss Reduction in Radial Transmission System Using ABC Algorithm”, International Journal of Reviews in Computing, © 2011-2012 ISSN, pp.2076-3328, 2012.
- M.A. Taghikhani, “DG Allocation and Sizing in Transmission Network using Modified Fuzzy Logic Algorithm”, International Journal of Automation and Power Engineering, Vol.1, pp 10-19, 2019.
- M.M. Ataei, “Real-Coded Genetic Algorithm Applied to Optimal Placement of Capacitor Banks for Unbalanced Transmission Systems with Meshed/Radial Configurations”, International Energy Journal, Vol.8 pp 51-62, 2014.
- Volkanovski and M, Borut M, “Optimization of reactive power compensation in Transmission network”, Elektrotehniški vestnik 76(1-2): 57-62, Electrotechnical Review: Ljubljana, Slovenija, Vol.13, pp.48-98, 2016.
- H.F. Razavi, “Voltage Profile Modification using Genetic Algorithm in Transmission Systems”, Proceedings of the World Congress on Engineering and Computer Science WCECS, pp.24-26, Vol.20, 2016.
- Mehrdad Movahed, “Evaluation of Power Loss Reduction with the place of Shunt Capacitors and Distributed Generation Power Plant in the Radial Transmission Systems using Genetic Algorithms”, American Journal of Advanced Scientific Research Vol. 1 Issue. 6, pp. 278- 283, 2013.
- A. Russo "Distributed generation siting and sizing under uncertainty", in Proc. 2014 IEEE Porto Power Tech Conf, Vol 2, pp.456-564, 2014.
- Amin Hajizadeh and M.M Ehsan, “PSO-Based Planning of Transmission Systems with Distributed Generations”, International Journal of Electrical and Electronics Engineering, Vol.2, pp 33-38, 2011.
- Mohammad Karimi, Hossein Shayeghi, Tohid Banki, Payam Farhadi and Noradin Ghadimi, “Solving Optimal Capacitor Allocation Problem using DE Algorithm in Practical Transmission Networks”, Przegląd Elektrotechniczny (Electrical Review), ISSN 0033-2097, R. 88 NR 7a, pp 90-93, 2012.
- Morteza Shirdel, “Applying BCO Algorithm to Solve the Optimal DG Placement and Sizing Problem”, Electrical and Electronic Engineering, Vol.2(2): pp.31-37, 2012.
- Amin Hajizadeh, “PSO-Based Planning of Transmission Systems with Distributed Generations”, World Academy of Science, Engineering and Technology, Vol.45, pp 598-603, 2017.
- S. Perera, “Voltage Support by Distributed Generation Units and Shunt Capacitors in Transmission Systems”, ©2016 IEEE, Vol.6, pp.3781-4241, 2016.
- I. Ziari, “A New Method for Improving Reliability and Line Loss in Transmission Networks”, (AUPEC 2010), Vol.10, pp.5-8, December 2019.
- M. Sedighizadeh and A. Rezazadeh, “Distributed Generation Allocation to Improve Steady State Voltage Stability of Transmission Networks Using Particle, Vol.4, pp.213-245, 2018.
- Noh, B.; Park, H.; Yeo, H. Analyzing vehicle-pedestrian interactions: Combining data cube structure and predictive collision risk estimation mode. Accid. Anal. Prev. 2021, 152, 105970. [Google Scholar] [CrossRef] [PubMed]
- Elma, O.; Adham, M.I.; Gabbar, H.A. Effects of Ultra-Fast Charging System for Battery Size of Public Electric Bus. In Proceedings of the IEEE 8th International Conference on Smart Energy Grid Engineering (SEGE), Oshawa, ON, Canada, 12–14 August 2020. [Google Scholar]
- Brenna, M.; Foiadelli, F.; Leone, C.; Longo, M. Electric Vehicles Charging Technology Review and Optimal Size Estimation. J. Electr. Eng. Technol. 2020, 15, 2539–2552. [Google Scholar] [CrossRef]
- Das, H.S.; Rahman, M.M.; Li, S.; Tan, C.W. Electric vehicles standards, charging infrastructure, and impact on grid integration: A technological review. Renew. Sustain. Energy Rev. 2020, 120, 109618. [Google Scholar] [CrossRef]
- Wang, M.; Zhong, J. A Novel Method for Distributed Generation and Capacitor Optimal Placement considering Voltage Profiles. In Proceedings of the IEEE Power Engineering Society Summer Meeting, Denver, Colorado, 17–21 July 2022; Volume 3. [Google Scholar]
- Kansal, S.; Sai, B.B.R.; Tyagi, B.; Kumar, V. Optimal placement of distributed generation in transmission net-works. Int. J. Eng. Sci. Technol. 2011, 3, 47–55. [Google Scholar] [CrossRef]
- Ackermann, T.; Anderson, G.; Soder, L. Distributed Generation in the power network. Electr. Power Syst. Res. 2018, 5, 195–204. [Google Scholar]
- Soroudi, A.; Ehsan, M. Multi objective distributed generation planning in liberized electricity market. IEEE Proc. 2011, 8, 1–7. [Google Scholar]
- Reddy, S.C.; Prasad, P.V.N.; Laxmi, A.J. Power Quality Improvement of Transmission System by Op-timal Placement and Power Generation of EVs using GA and ANN. Eur. J. Sci. Res. 2012, 69, 326–336. [Google Scholar]
- Graham, W.; James, A.; Mc-Donald, R. 2011 Optimal placement of distributed generation sources in power systems. IEEE Trans. Power Sys. 2013, 9, 127–131. [Google Scholar]
- EI-hattam, W.; Salma, M.M.A. Distributed generation technologies, definitions and benefits. Electric. Power Sys. Res. 2014, 7, 115–1275. [Google Scholar]
- Iyer, H.; Ray, S.; Ramakumar, R. Voltage Profile Improvement with Distributed Generation. Eur. J. Sci. Res. 2015, 9, 23–39. [Google Scholar]
- Issicaba, D.; Bettiol, A.L.; Coelho, J.; Alcantara, M.V.P. A New Aroach for Optimal Capacitor Placement in Distribu-tion Systems. In Proceedings of the 6th WSEAS International Conference on Power Systems, Lisbon, Portugal, 15–21 September2017; Volume 5. [Google Scholar]
- Mohammad, M.; Nasab, M.A. PSO Based Multiobjective Aroach for Optimal Sizing and Placement of Distributed Generation. IEEE Syst. 2011, 2, 832–837. [Google Scholar]
- Thakur, T. Study and Characterization of PoweTransmission 40 Proceedings of the SustainableResearch and Innovation Conference, JKUAT Main Campus, Kenya 2–4 Network Reconfiguration. 2011, pp 2–6.
- Anis Ibrahim, W.R.; Morcos, M.M. Artificial intelligence and advanced mathematical tools for power quality allocations. Power Deliv. IEEE Trans. 2016, 17, 668–673. [Google Scholar] [CrossRef]
- Esmailian, H.; Fadaeinedjad, R. Energy loss minimization in transmission systems utilizing an enhanced reconfiguration method integrating distributed generation. IEEE Syst. J. 2014, 9, 1–10. [Google Scholar] [CrossRef]
- Rahmat-Allah Hooshmand and Mohammad Ataei, “Optimal capacitor placement in actual configuration and operational conditions of Transmission systems using RCGA”, Journal of Electrical Engineering, Vol. 58, pp.189–199, 2019.
- Yustra, Mochamad Ashari and Adi Soeprijanto, “Optimal Distributed Generation (DG) Allocation for Losses Reduction Using Improved Particle Swarm Optimization (IPSO) Method”, J. Basic. Appl. Sci. Res., Vol.2(7), pp 7016-7023, 2012.
- M. Vatankhah, “PSO based voltage profile improvement by optimizing the size and location of DGs”, IJTPE, issue 11, Vol.4, pages 135-139, February 2012.
- H. A. Bakar, and H. Mokhlis, “Optimum Simultaneous DG and Capacitor Placement on the Basis of Minimization of Power Losses”, International Journal of Computer and Electrical Engineering, Vol.5, No.5, October 2013.
- Nasim Ali Khan, S. Ghosh, S. P. Ghoshal, “Optimal siting and sizing of shunt capacitors in radial Transmission systems using Novel BPSO algorithm”, International Journal of Emerging Technology and Advanced Engineering, Vol.3, Issue 2, February 2013.
- Shenava Jlili, “Optimal Sizing and Sitting in Radial Standard System using PSO”, American Journal of Scientific Research ISSN 2301-2005 Issue 67, pp. 50-58, February 2012.
- S.M. Hosseini, “Optimal Placement and Sizing of Capacitor and Distributed Generation with Harmonic and Resonance Considerations Using Discrete Particle Swarm Optimization”, I.J. Intelligent Systems and Applications, 07, pp.42-49, 2013.
- N. Sinarami and V.C Veera, “Optimal Dg Placement for Maximum Loss Reduction in Radial Transmission System Using ABC Algorithm”, International Journal of Reviews in Computing, © 2011-2012 ISSN, pp.2076-3328, 2012.
- Y. Taghikhani, “DG Allocation and Sizing in Transmission Network using Modified Fuzzy Logic Algorithm”, International Journal of Automation and Power Engineering, Vol.1, pp 10-19, 2019.
- R.M. Ataei, “Real-Coded Genetic Algorithm Applied to Optimal Placement of Capacitor Banks for Unbalanced Transmission Systems with Meshed/Radial Configurations”, International Energy Journal, Vol.8 pp 51-62, 2014.
- A. M, Borut M, “Optimization of reactive power compensation in Transmission network”, Elektrotehniški vestnik 76(1-2): 57-62, Electrotechnical Review: Ljubljana, Slovenija, Vol.13, pp.48-98, 2016.
- H. Hosseinian, “Voltage Profile Modification using Genetic Algorithm in Transmission Systems”, Proceedings of the World Congress on Engineering and Computer Science WCECS, pp.24-26, Vol.20, 2016.
- Saeed Boyerahmadi, “Evaluation of Power Loss Reduction with the place of Shunt Capacitors and Distributed Generation Power Plant in the Radial Transmission Systems using Genetic Algorithms”, American Journal of Advanced Scientific Research Vol. 1 Issue. 6, pp. 278- 283, 2013.
- Pilo, F "Distributed generation siting and sizing under uncertainty", in Proc. 2014 IEEE Porto Power Tech Conf, Vol 2, pp.456-564, 2014.
- Ehsan Hajizadeh, “PSO-Based Planning of Transmission Systems with Distributed Generations”, International Journal of Electrical and Electronics Engineering, Vol.2, pp 33-38, 2011.
- Payam Farhadi and Noradin Ghadimi, “Solving Optimal Capacitor Allocation Problem using DE Algorithm in Practical Transmission Networks”, Przegląd Elektrotechniczny (Electrical Review), ISSN 0033-2097, R. 88 NR 7a, pp 90-93, 2012.
- Mohammad Falahi Sohi, “Applying BCO Algorithm to Solve the Optimal DG Placement and Sizing Problem”, Electrical and Electronic Engineering, Vol.2(2): pp.31-37, 2012.
- Hajizadeh Hajizadeh, “PSO-Based Planning of Transmission Systems with Distributed Generations”, World Academy of Science, Engineering and Technology, Vol.45, pp 598-603, 2017.
- K. M. Muttaqi, “Voltage Support by Distributed Generation Units and Shunt Capacitors in Transmission Systems”, ©2016 IEEE, Vol.6, pp.3781-4241, 2016.
- G. Platt, “A New Method for Improving Reliability and Line Loss in Transmission Networks”, (AUPEC 2010), Vol.10, pp.5-8, December 2019.
Figure 1.
The structure of BEV circuit.
Figure 1.
The structure of BEV circuit.
Figure 2.
(a) The structure of series HEV circuit and (b) The structure of parallel HEV circuit.
Figure 2.
(a) The structure of series HEV circuit and (b) The structure of parallel HEV circuit.
Figure 3.
(a) The structure of series PHEV circuit (b) The structure of parallel PHEV circuit.
Figure 3.
(a) The structure of series PHEV circuit (b) The structure of parallel PHEV circuit.
Figure 4.
Hybrid EV Series-Parallel Circuit Layout: (a) Series-Parallel HEV series-parallel plug-in hybrid electric vehicle (b).
Figure 4.
Hybrid EV Series-Parallel Circuit Layout: (a) Series-Parallel HEV series-parallel plug-in hybrid electric vehicle (b).
Figure 5.
Graphs showing the power output versus the energy output of a given battery storage device.
Figure 5.
Graphs showing the power output versus the energy output of a given battery storage device.
Figure 6.
The effectiveness of electric motors and its components.
Figure 6.
The effectiveness of electric motors and its components.
Figure 7.
Comparative analysis of the speeds of several motors.
Figure 7.
Comparative analysis of the speeds of several motors.
Figure 8.
Procedures for Introducing a Genetic Algorithm.
Figure 8.
Procedures for Introducing a Genetic Algorithm.
Figure 9.
Methodology diagram for PSO.
Figure 9.
Methodology diagram for PSO.
Figure 10.
IEEE-30 bus test system.
Figure 10.
IEEE-30 bus test system.
Figure 11.
A flow diagram for the proposed algorithm HGAIPSO.
Figure 11.
A flow diagram for the proposed algorithm HGAIPSO.
Figure 13.
Bus voltage results for profile comparison using Type A EV.
Figure 13.
Bus voltage results for profile comparison using Type A EV.
Figure 14.
Using Type B EVs, we compare the power loss data.
Figure 14.
Using Type B EVs, we compare the power loss data.
Figure 15.
Bus voltage profile comparison using Type B EV.
Figure 15.
Bus voltage profile comparison using Type B EV.
Figure 16.
Using Type C EVs, we compare the power loss data.
Figure 16.
Using Type C EVs, we compare the power loss data.
Figure 17.
Type C EV voltage profile comparison on the bus.
Figure 17.
Type C EV voltage profile comparison on the bus.
Table 1.
A comparison of the energy storage capacities of the various batteries found in EVs.
Table 1.
A comparison of the energy storage capacities of the various batteries found in EVs.
| SPECIFICATION |
LEAD-ACID BATTERY |
NI-MH BATTERY |
NA-NICL2 BATTERY |
LIBS |
| Nominal voltage (V) |
2.00 |
1.20 |
2.40 |
3.60 |
| Energy efficiency (%) |
>80 |
70 |
80 |
>95 |
| Volumetric energy density (Wh/L) |
100 |
180–220 |
160 |
200–400 |
| Gravimetric energy density (Wh/kg) |
30–50 |
40–110 |
150 |
118–250 |
| Lifecycle |
500–1000 |
<3000 |
>1200 |
2000 |
| Cost (USD/kWh) |
100.00 |
853–1700 |
482–1000 |
700.00 |
Table 5.
A comparison of results obtained using Type A EV.
Table 5.
A comparison of results obtained using Type A EV.
| Method |
Bus Number |
EV Size |
Power Losses |
Power Loss
Reduction |
%Power Loss
Reduction |
| MW |
MW |
MVar |
MW |
MVar |
%MW |
%MVar |
| Without EV |
|
|
17.8798 |
|
|
|
|
|
| GA |
10 |
11.472 |
13.3919 |
- |
4.4879 |
- |
25.1002 |
- |
| 10 |
11.904 |
| 19 |
11.052 |
| 24 |
11.772 |
| PSO |
10 |
11.694 |
12.2622 |
- |
5.6176 |
- |
31.4187 |
- |
| 15 |
11.394 |
| 20 |
11.378 |
| 30 |
10.577 |
| IPSO |
10 |
11.625 |
12.1851 |
- |
5.6947 |
- |
31.8499 |
- |
| 10 |
11.956 |
| 22 |
11.995 |
| 30 |
11.986 |
| HGAIPSO |
19 |
11.7099 |
10.6020 |
- |
6.2778 |
- |
40.7040 |
- |
| 21 |
11.9937 |
| 24 |
11.9960 |
| 30 |
11.7061 |
Table 7.
Comparison of bus voltage using Type B EV.
Table 7.
Comparison of bus voltage using Type B EV.
| Method. |
Bus Number |
EV Size |
Power Losses |
Power Loss Reduction |
%Power Loss Reduction |
| MW |
MW |
MVar |
MW |
MVar |
%MW |
%MVar |
| Without EV |
|
|
17.8798 |
|
|
|
|
|
| GA |
10 |
11.35 + j1.22 |
12.2260 |
- |
5.6538 |
- |
31.5890 |
- |
| 23 |
11.47 + j1.17 |
| 24 |
11.92 + j2.04 |
| 30 |
11.816 + j1.468 |
| PSO |
10 |
11.474 + j2.159 |
12.1060 |
- |
5.7738 |
- |
32.2923 |
- |
| 17 |
11.981 + j0.919 |
| 20 |
11.67 + j2.309 |
| 30 |
11.349 + j3 |
| IPSO |
10 |
11.83 + j0.001 |
11.9500 |
- |
5.9298 |
- |
33.1648 |
- |
| 21 |
11.433 + j3 |
| 24 |
11.739 + j3 |
| 30 |
11.995 + j0.001 |
| HGAIPSO |
19 |
11.7872 + j2.9609 |
11.4001 |
- |
6.4797 |
- |
36.2403 |
24.2585 |
| 23 |
11.7548 + j3.0002 |
| 24 |
12 + j1.3702 |
| 30 |
11.8308 + j1.5817 |
Table 8.
Analyzing the Variability of Type C EV Results.
Table 8.
Analyzing the Variability of Type C EV Results.
| Method |
Bus Number |
EV Size |
Power Losses |
Power Loss Reduction |
%Power Loss Reduction |
| MW |
MW |
MVar |
MW |
MVar |
%MW |
%MVar |
| Without EV |
|
|
17.8798 |
|
|
|
|
|
| GA |
10 |
9.0384 − j0.0882 |
11.5265 |
- |
6.3533 |
- |
35.6967 |
- |
| 18 |
11.1120 − j0.7150 |
| 22 |
11.7480 − j0.5891 |
| 30 |
10.0081 − j0.4870 |
| PSO |
10 |
11.885 − j0.7970 |
11.1056 |
- |
6.7742 |
- |
37.8874 |
- |
| 18 |
10.8811 − j0.3215 |
| 20 |
11.5631 − j0.8990 |
| 30 |
11.5310 − j0.3831 |
| IPSO |
10 |
12.0215 − j0.5260 |
11.2099 |
- |
6.6699 |
- |
37.3041 |
- |
| 19 |
10.8610 − j0.3002 |
| 22 |
11.9170 − j0.8370 |
| 30 |
11.9560 − j0.5260 |
| HGAIPSO |
19 |
12.0010 − j0.4882 |
10.2021 |
- |
7.6777 |
- |
42.9406 |
24.212 |
| 21 |
11.9470 − j0.5042 |
| 24 |
11.9179 − j0.0692 |
| 30 |
11.3651 − j0.5807 |
|
Disclaimer/Publisher’s Note: The statements, opinions and data contained in all publications are solely those of the individual author(s) and contributor(s) and not of MDPI and/or the editor(s). MDPI and/or the editor(s) disclaim responsibility for any injury to people or property resulting from any ideas, methods, instructions or products referred to in the content. |
© 2023 by the authors. Licensee MDPI, Basel, Switzerland. This article is an open access article distributed under the terms and conditions of the Creative Commons Attribution (CC BY) license (http://creativecommons.org/licenses/by/4.0/).
