Submitted:
18 May 2023
Posted:
19 May 2023
You are already at the latest version
Abstract
Keywords:
1. Introduction
2. Materials and Methods
2.1. Materials
2.2. Synthesis and Characterization
2.2.1. Synthesis of Eu3+/Gd3+ Co-doped Hydroxyapatite (HA-Eu(2%)-Gd(1%))
2.2.2. Synthesis of MSN/HA-Eu(2%)-Gd(1%) system
2.2.3. Synthesis of the Hybrid System: MSN/HA/Eu(2%)-Gd(1%)-/P(MAA)
2.2.4. Characterization of Materials
2.2.5. Doxorubicin Incorporation and Releasing Assays
3. Results and Discussion
3.1. X-ray Diffraction (XRD)
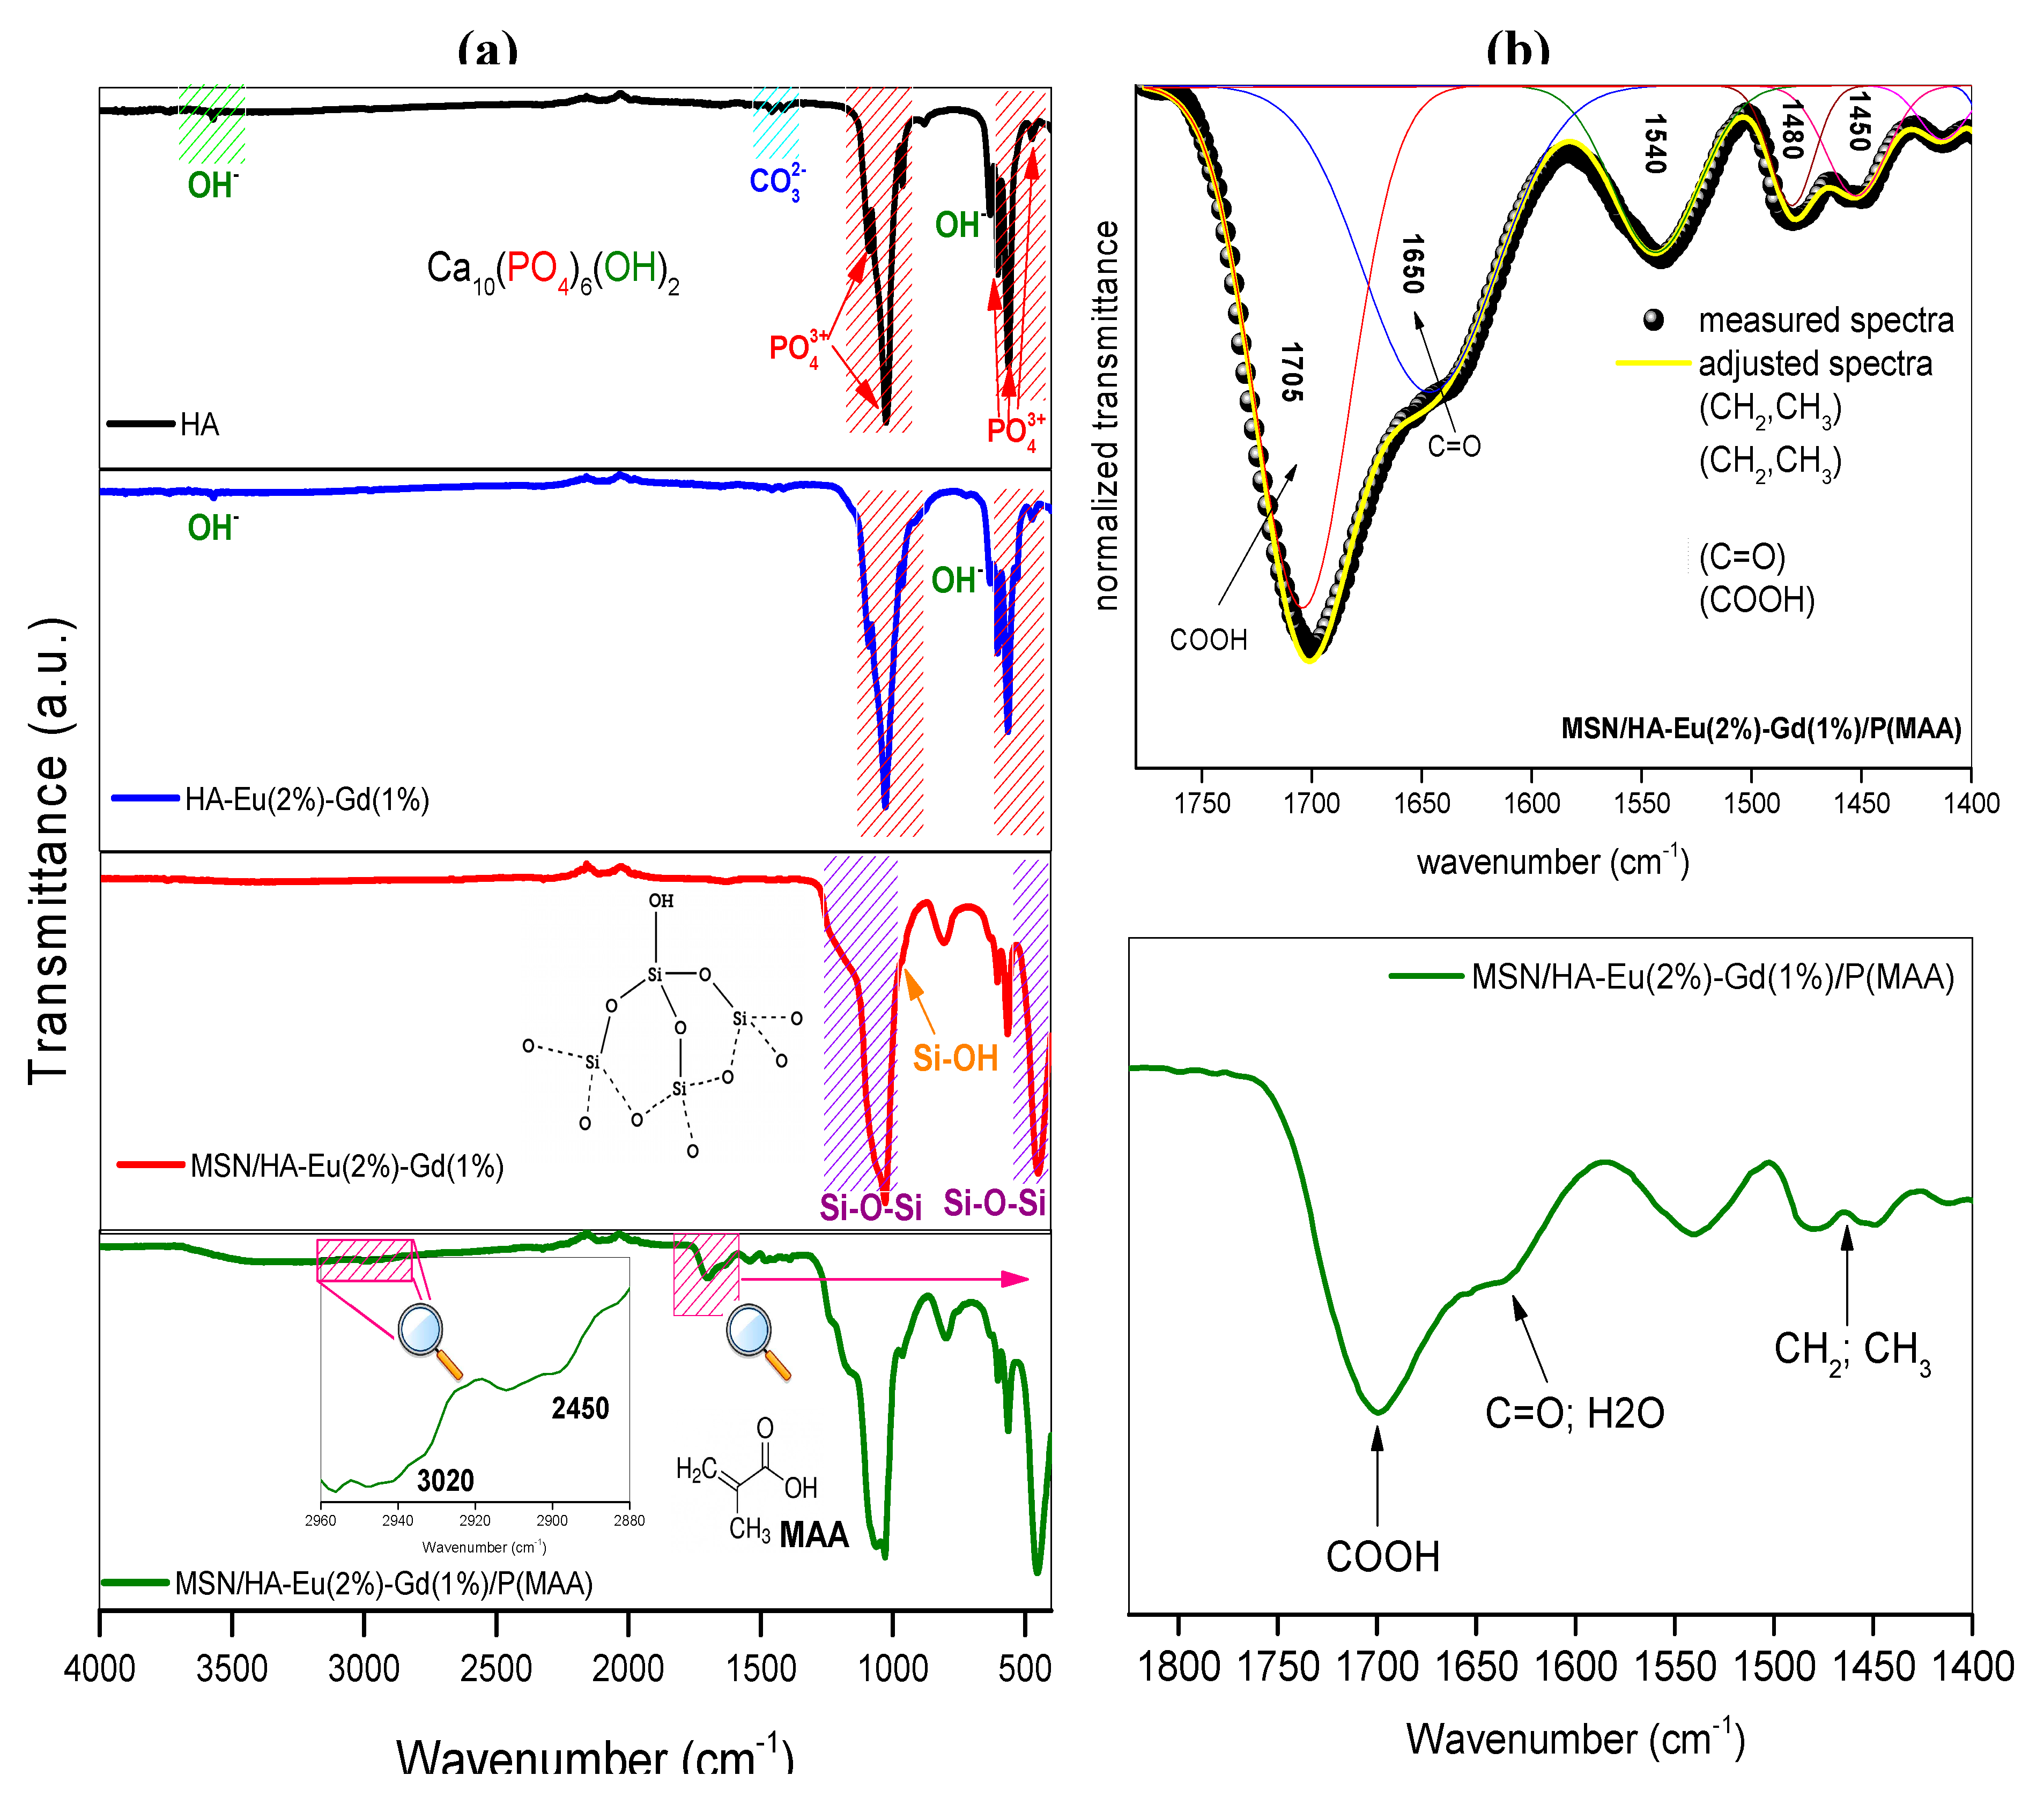
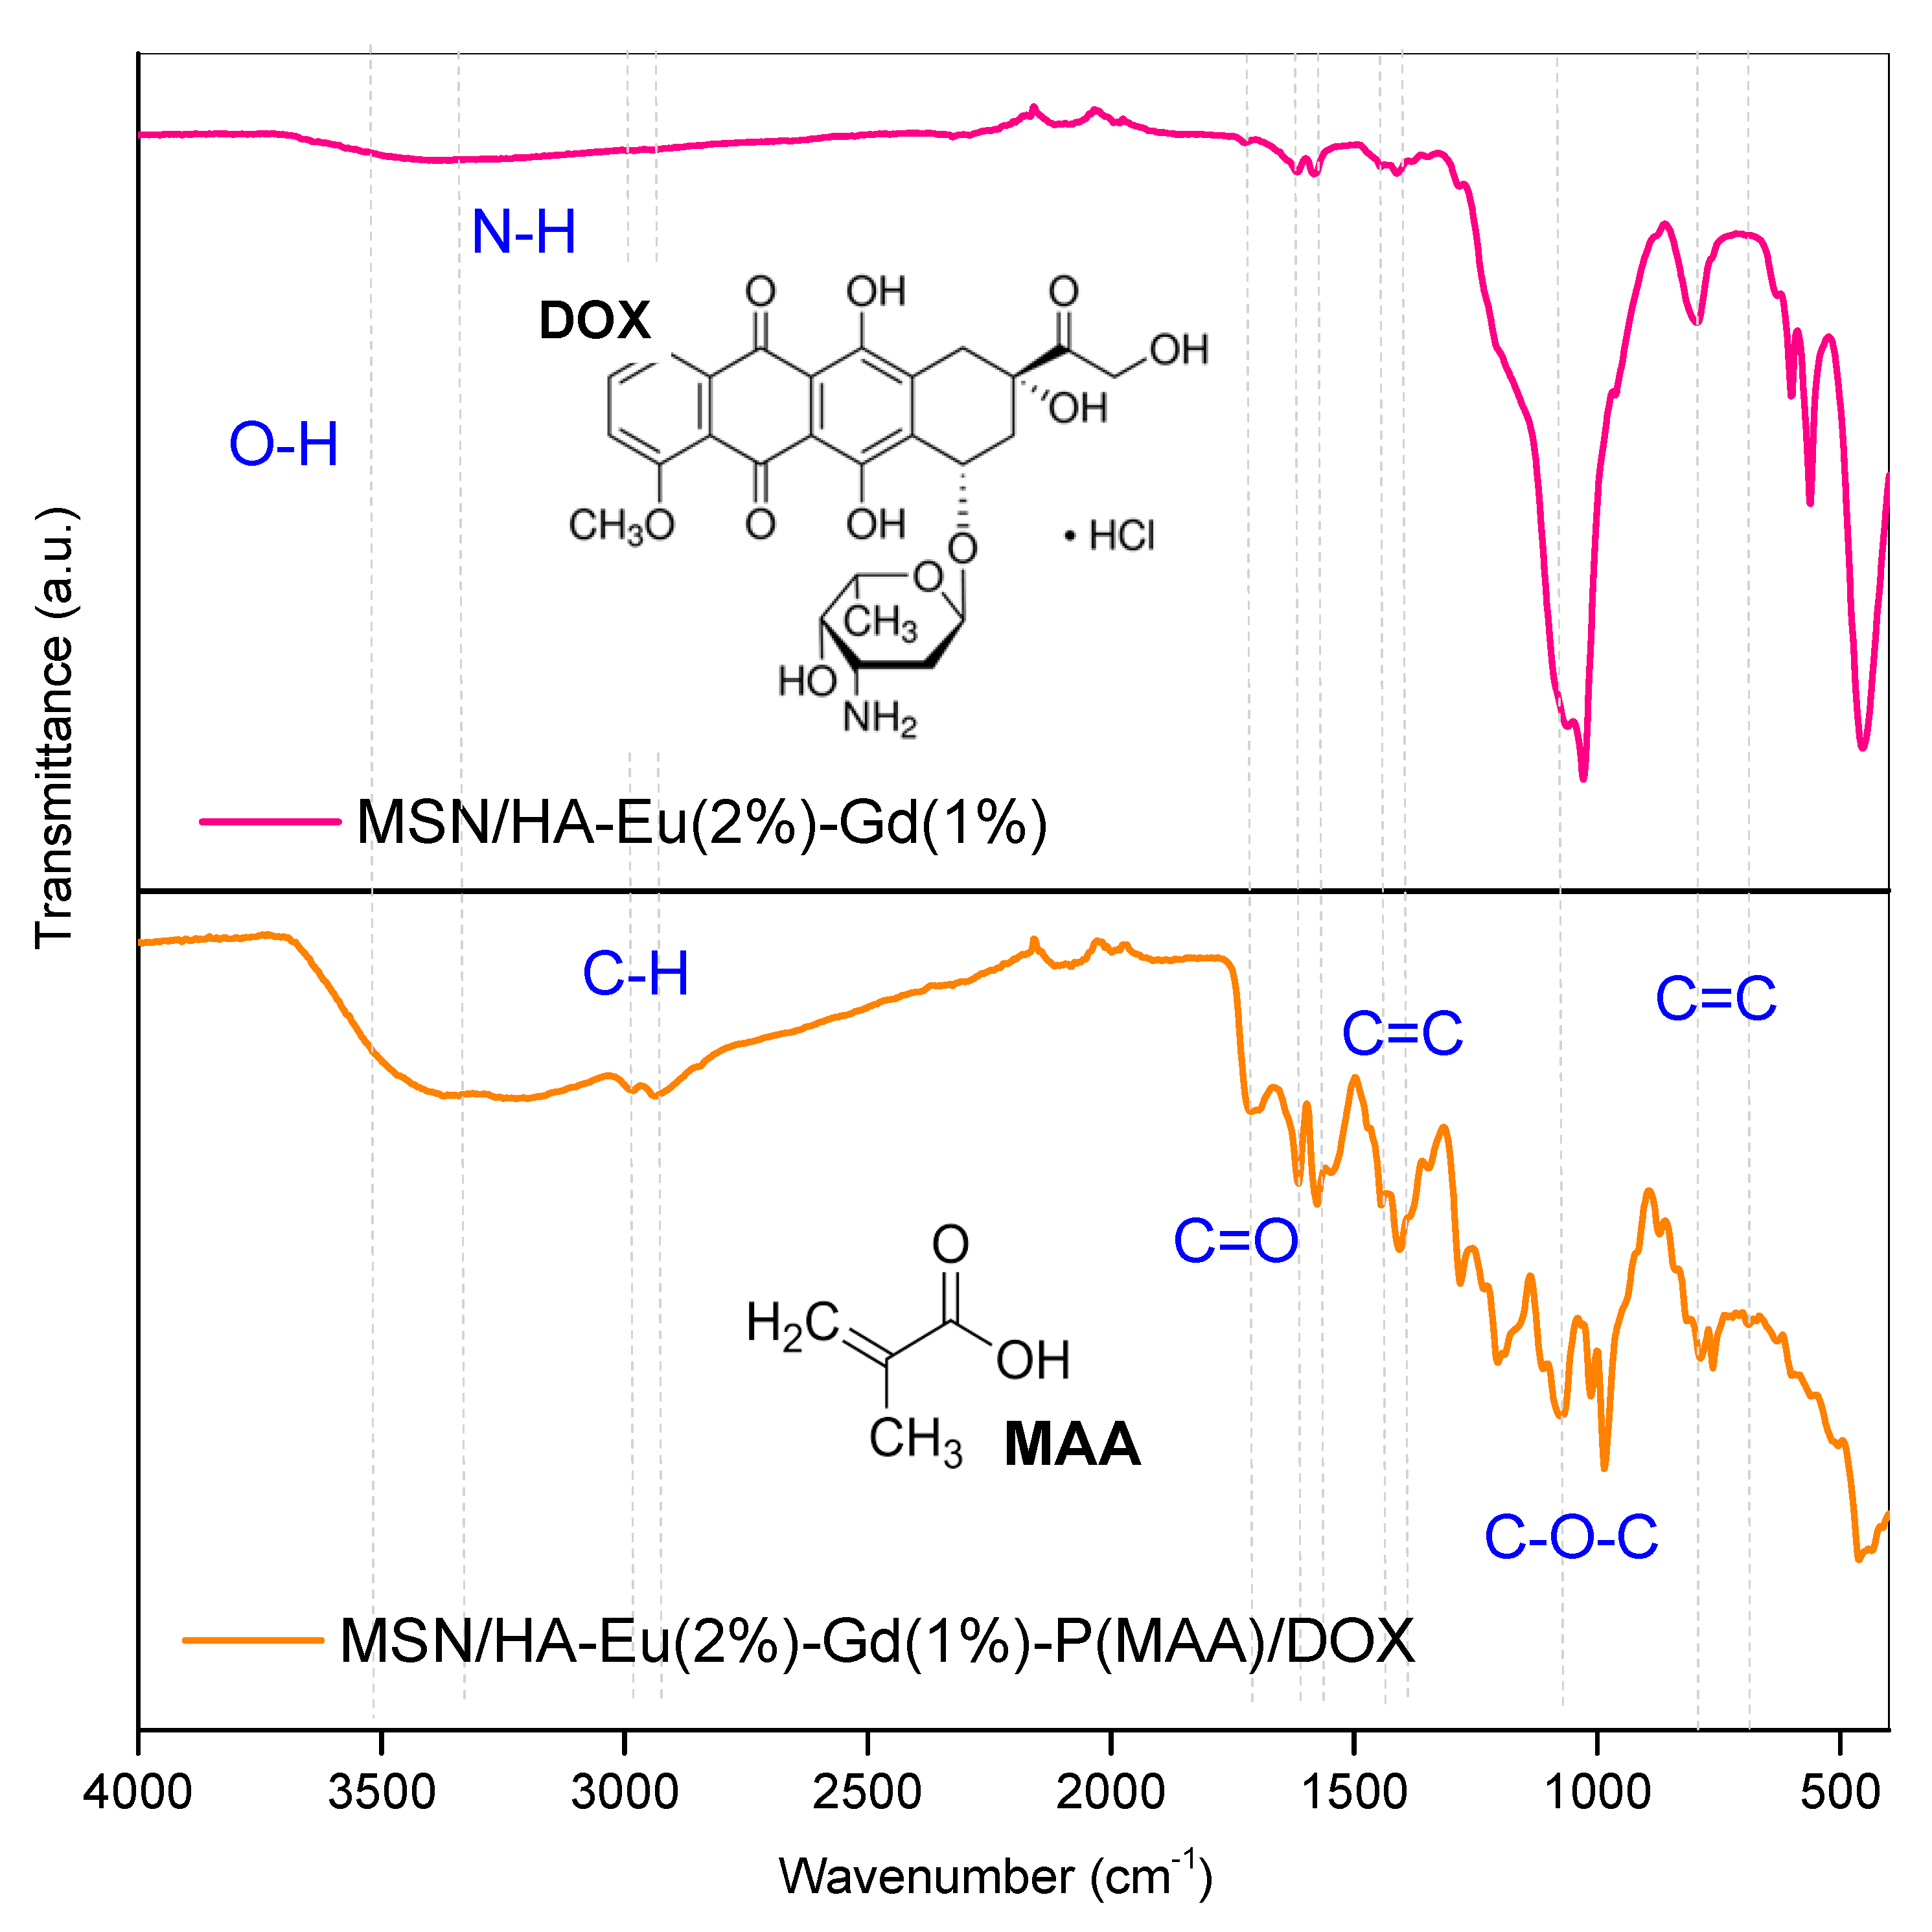
3.2. Fourier Transform Infrared Spectroscopy (FTIR)
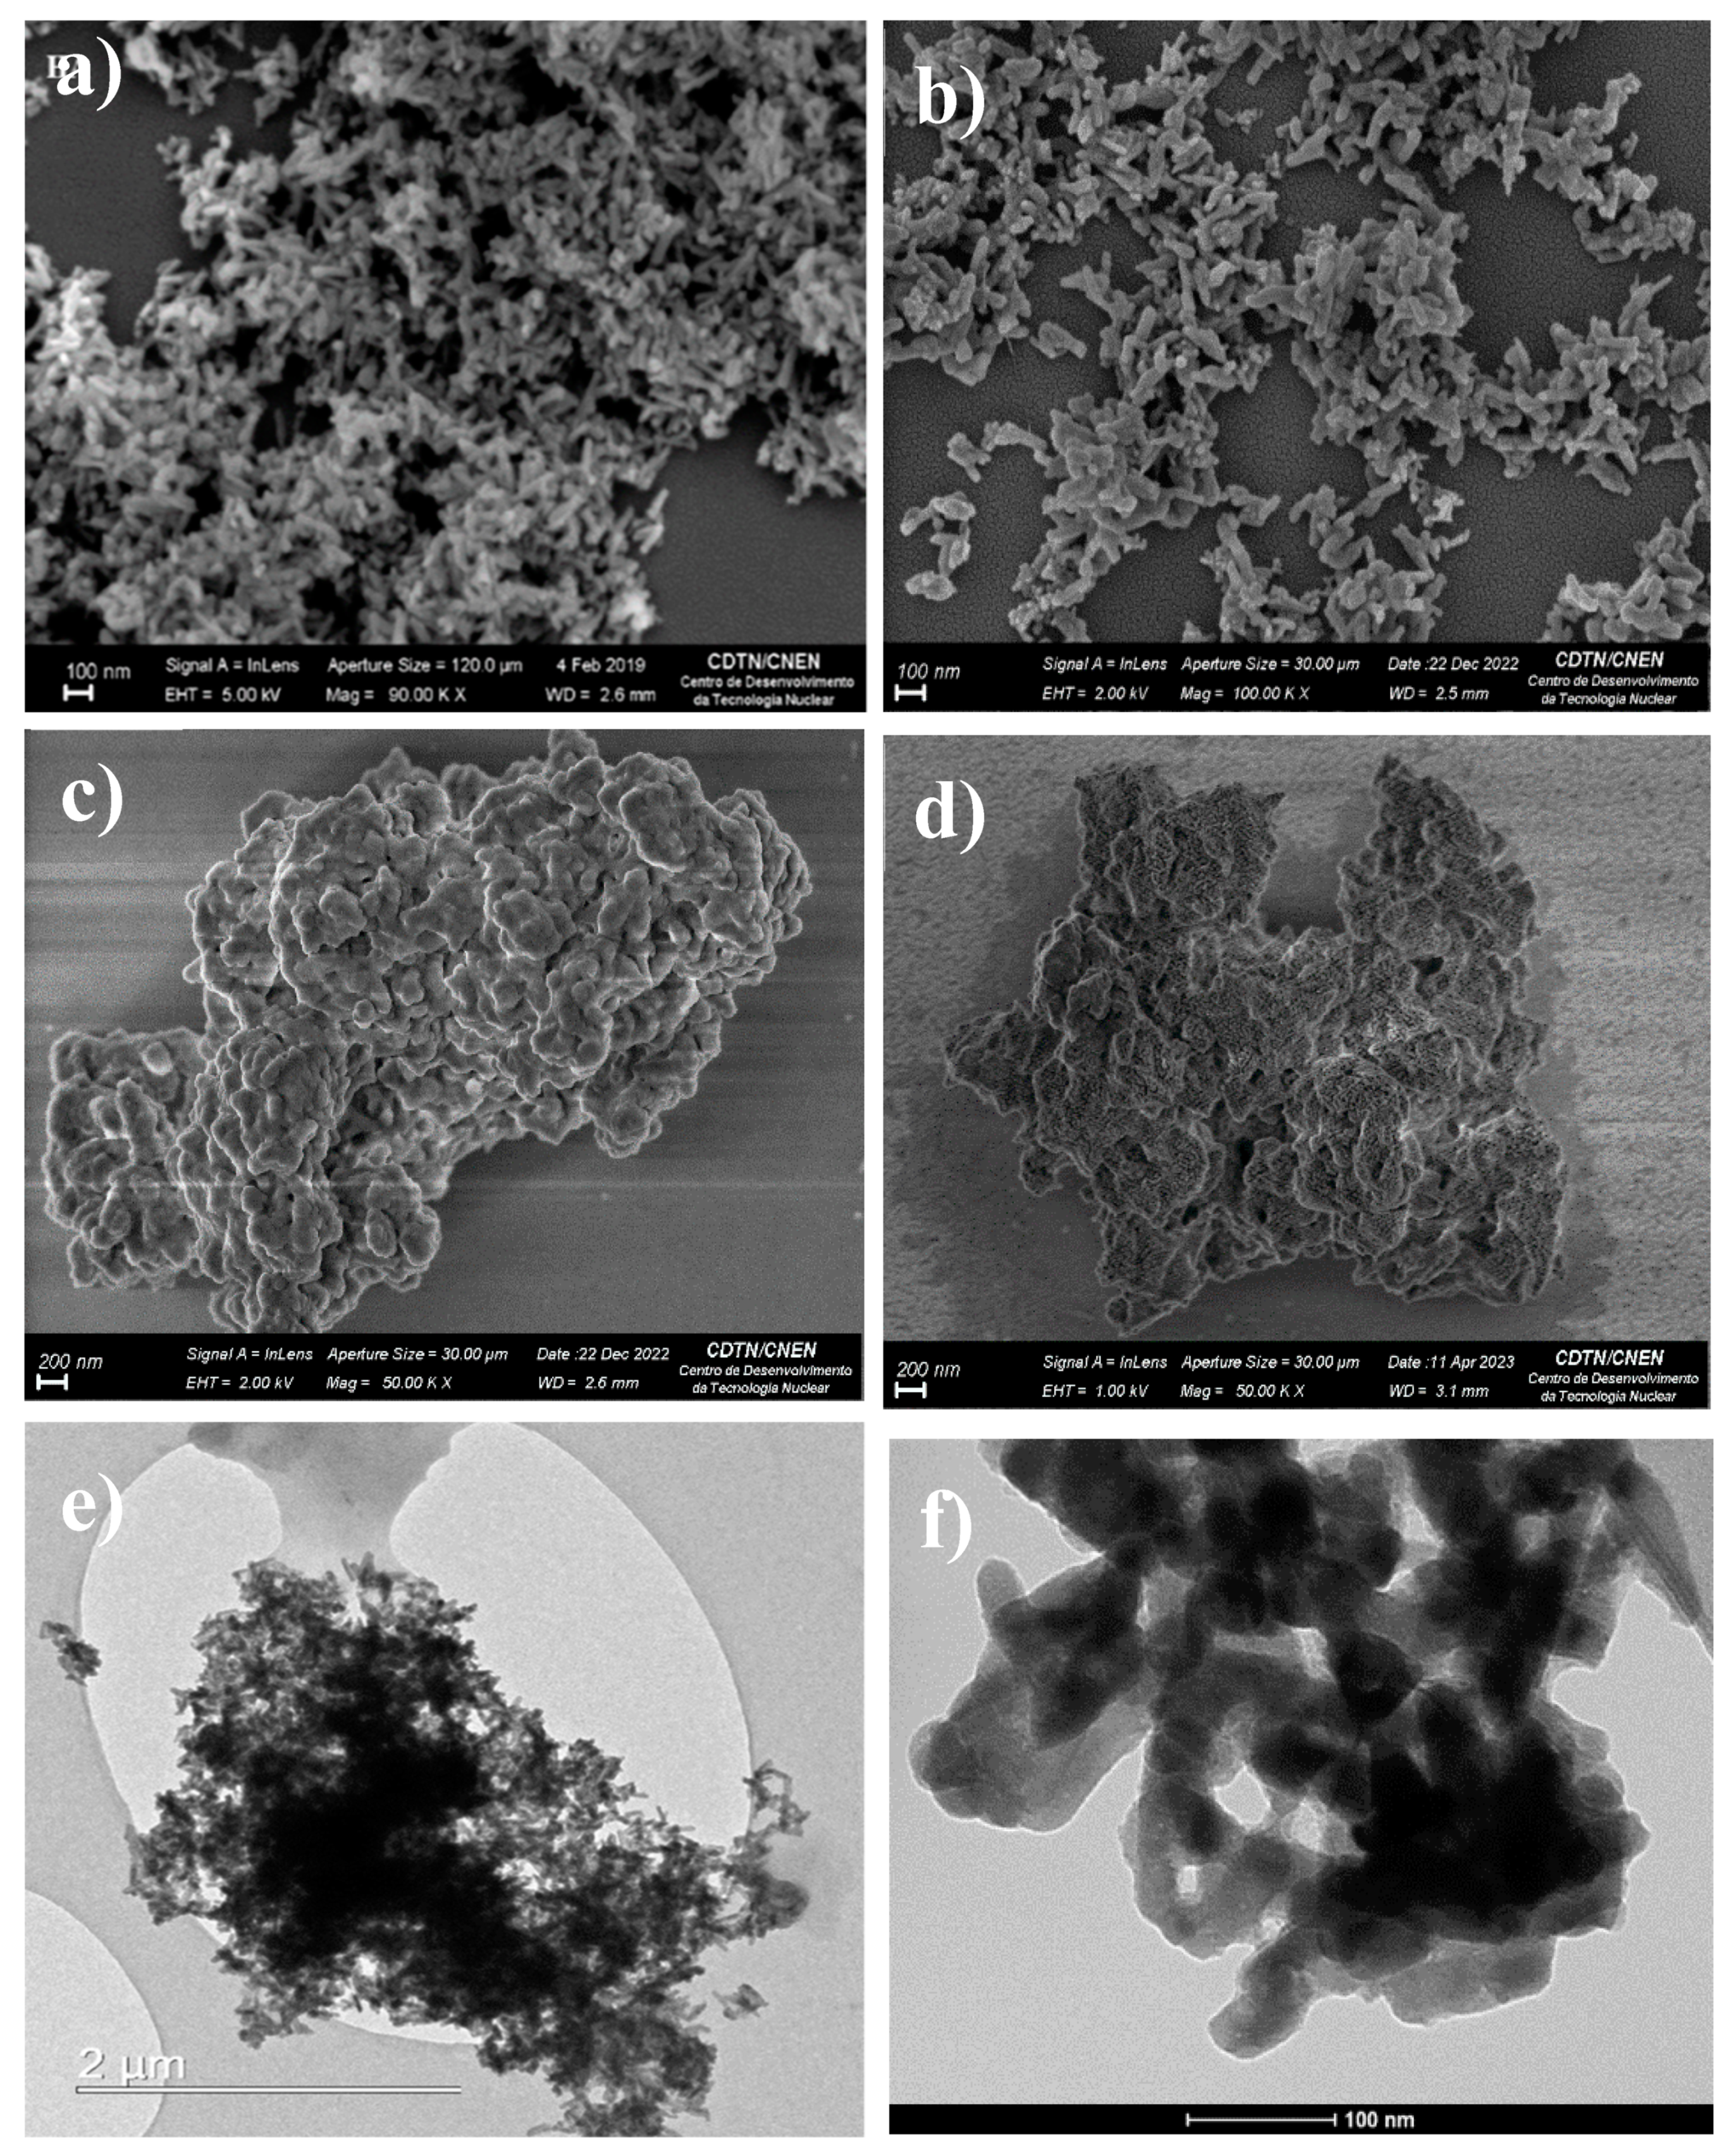
3.3. Scanning Electron Microscopy (SEM) and Transmission Electron Microscopy (TEM)
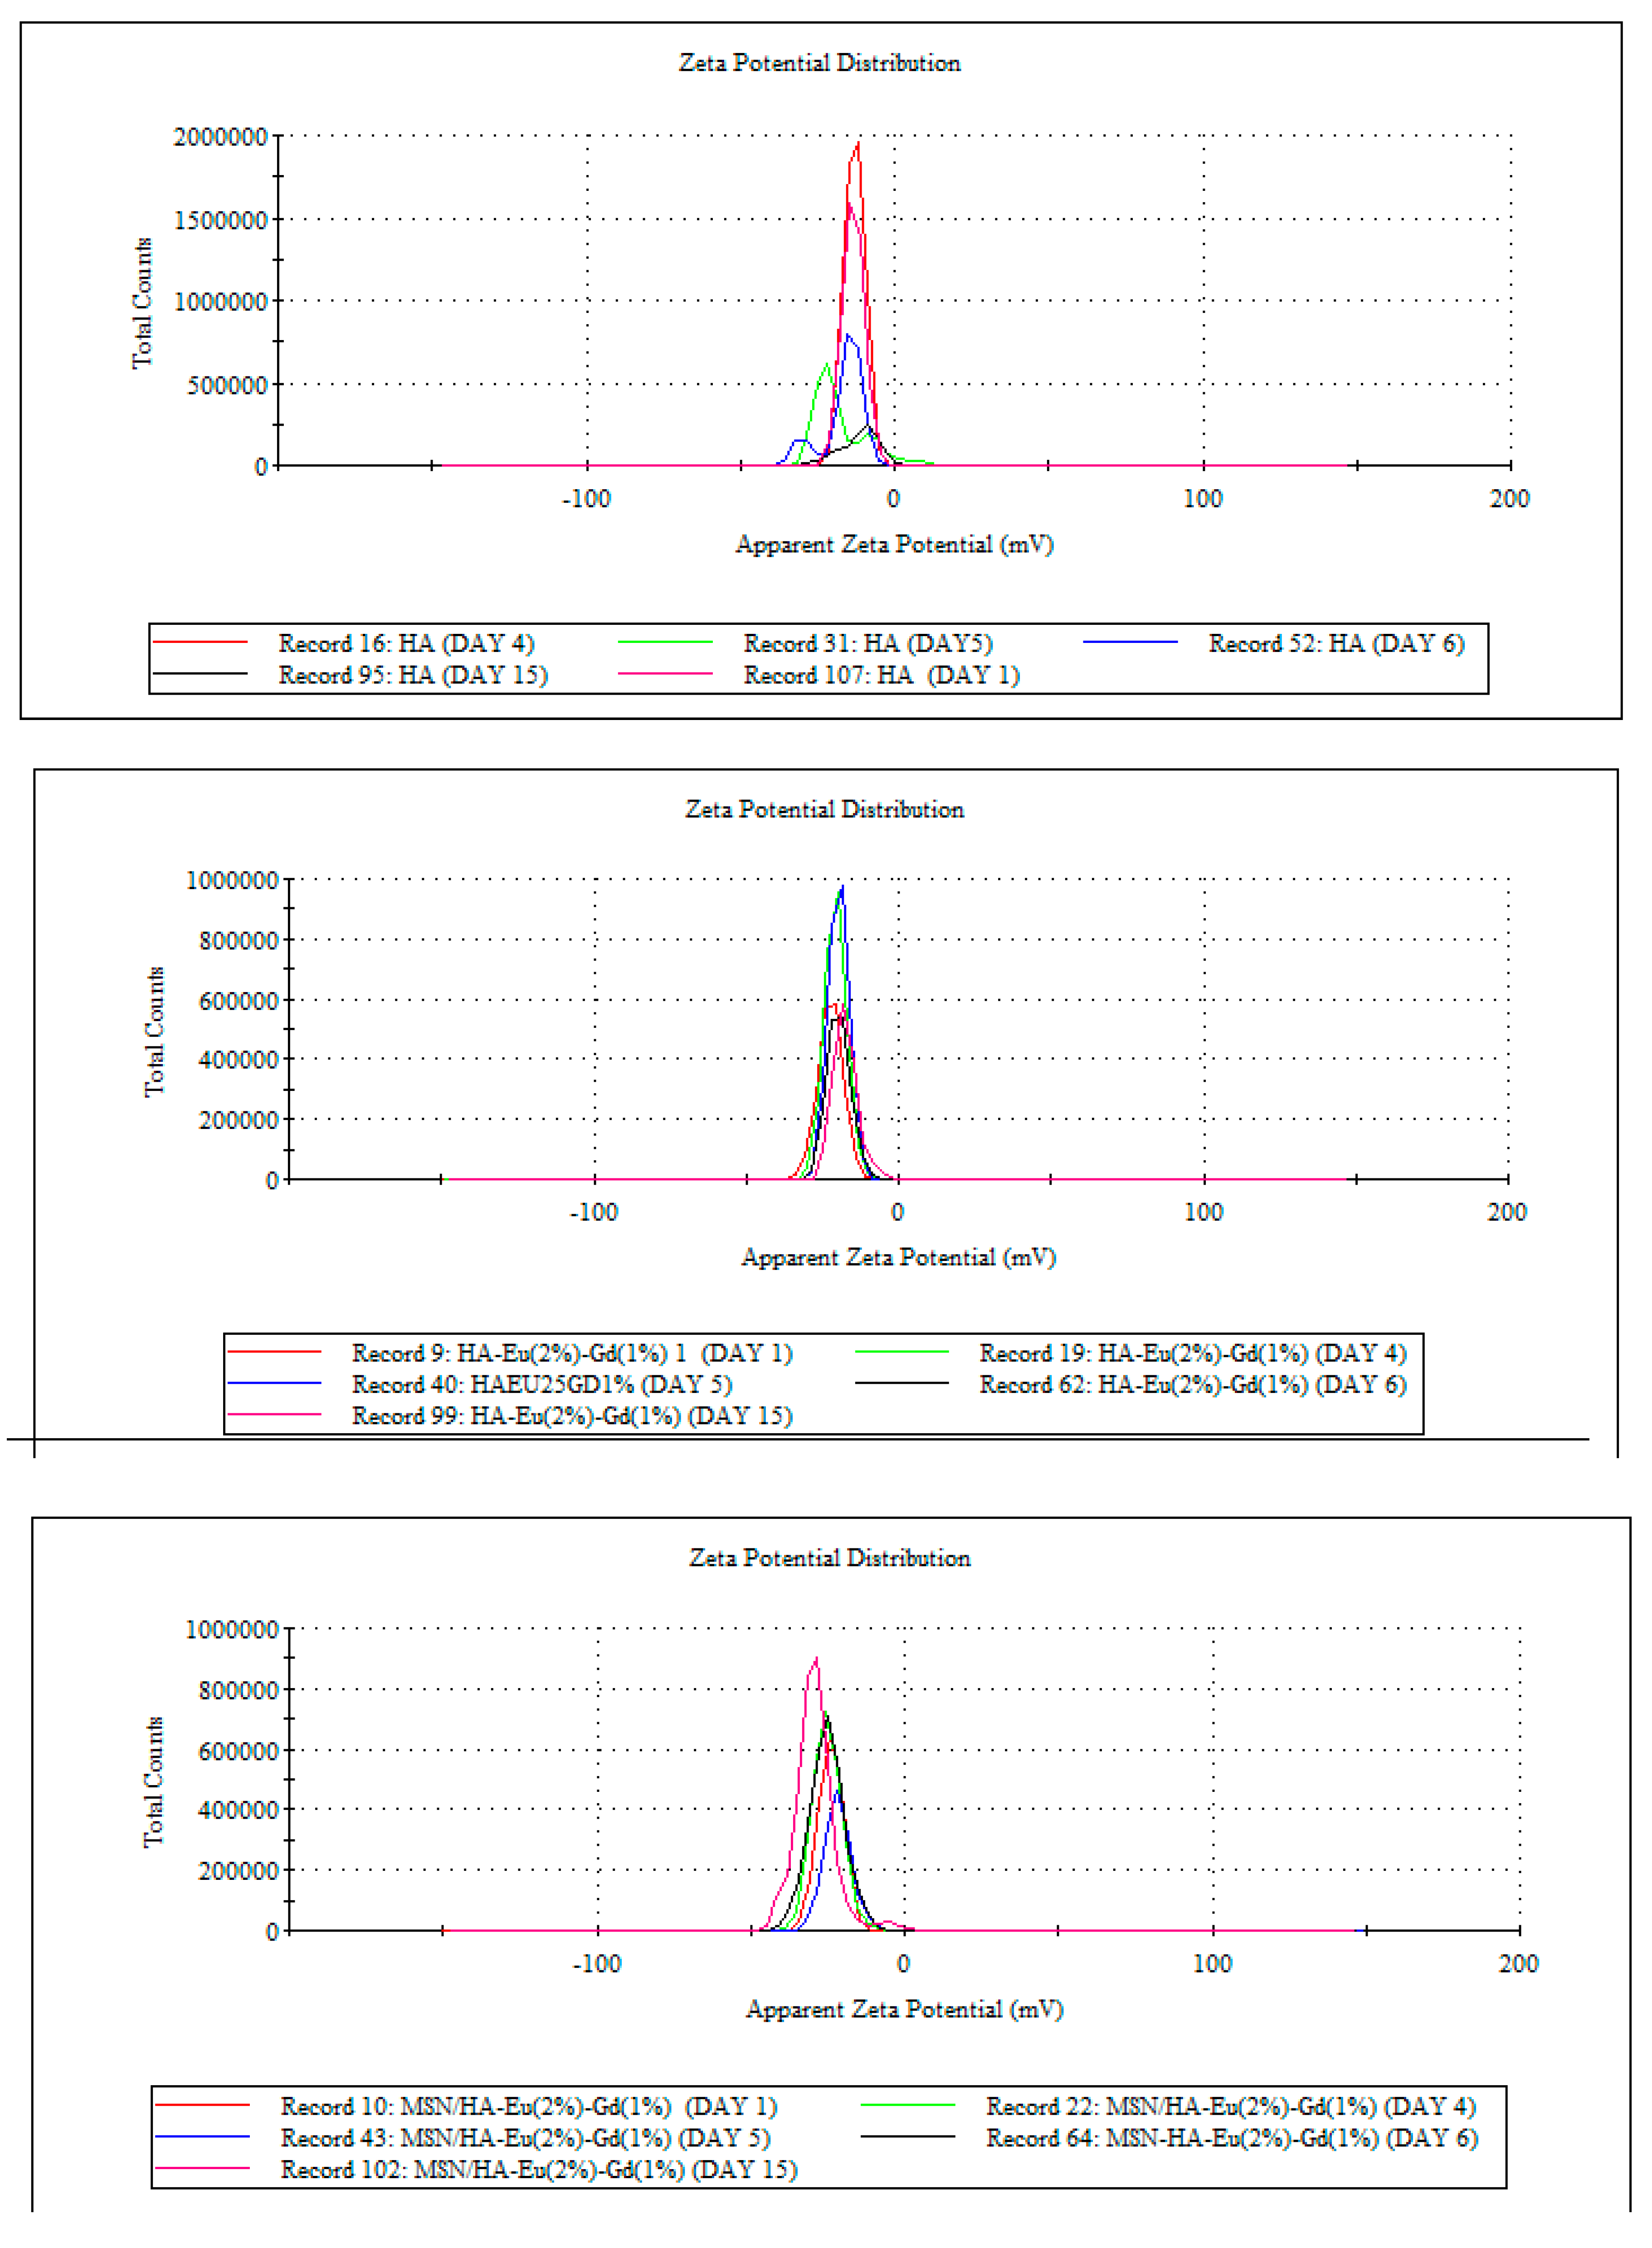
3.4. Potential Zeta (ζ)
3.5. CHN Elemental Analyses
3.6. N2 Adsorption
3.7. Photoluminescence Analysis
3.8. Vibrant Sample Magnetometry (VSM)
3.9. Drug Loading and Releasing Results
4. Conclusions
Author Contributions
Funding
Data Availability
Acknowledgments
References
- Sarbaz, M.; Manouchehri Monazah, F.; Eslami, S.; Kimiafar, K.; Mousavi Baigi, S.F. Effect of Mobile Health Interventions for Side Effects Management in Patients Undergoing Chemotherapy: A Systematic Review. Heal. Policy Technol. 2022, 11, 100680. [Google Scholar] [CrossRef]
- Vyas, M.; Simbo, D.A.; Mursalin, M.; Mishra, V.; Bashary, R.; Khatik, G.L. Drug Delivery Approaches for Doxorubicin in the Management of Cancers. Curr. Cancer Ther. Rev. 2019, 16, 320–331. [Google Scholar] [CrossRef]
- Chatterjee, S.; Ghosal, K.; Kumar, M.; Mahmood, S.; Thomas, S. A Detailed Discussion on Interpenetrating Polymer Network (IPN) Based Drug Delivery System for the Advancement of Health Care System. J. Drug Deliv. Sci. Technol. 2023, 79, 104095. [Google Scholar] [CrossRef]
- Ibrahim-hashim, A.; Estrella, V. Acidosis and Cancer : From Mechanism to Neutralization. 2019, 149–155.
- Bhattacharya, S.; Prajapati, B.G.; Singh, S. Jo u Rn a l P. Crit. Rev. Oncol. / Hematol. 2023, 103961. [CrossRef]
- Ahmadi, M.; Madrakian, T.; Ghoorchian, A.; Kamalabadi, M.; Afkhami, A. Stimuli-Sensitive Drug Delivery Systems; Elsevier Ltd., 2020; ISBN 9780081029855.
- Saadat, M.; Mostafaei, F.; Mahdinloo, S.; Abdi, M.; Zahednezhad, F.; Zakeri-Milani, P.; Valizadeh, H. Drug Delivery of PH-Sensitive Nanoparticles into the Liver Cancer Cells. J. Drug Deliv. Sci. Technol. 2021, 63, 102557. [Google Scholar] [CrossRef]
- Khan, S.; Vahdani, Y.; Hussain, A.; Haghighat, S.; Heidari, F.; Nouri, M.; Haj Bloukh, S.; Edis, Z.; Mahdi Nejadi Babadaei, M.; Ale-Ebrahim, M.; et al. Polymeric Micelles Functionalized with Cell Penetrating Peptides as Potential PH-Sensitive Platforms in Drug Delivery for Cancer Therapy: A Review. Arab. J. Chem. 2021, 14, 103264. [Google Scholar] [CrossRef]
- Xie, A.J.; Yin, H.S.; Liu, H.M.; Zhu, C.Y.; Yang, Y.J. Chinese Quince Seed Gum and Poly (N,N-Diethylacryl Amide-Co-Methacrylic Acid) Based PH-Sensitive Hydrogel for Use in Drug Delivery. Carbohydr. Polym. 2018, 185, 96–104. [Google Scholar] [CrossRef]
- Silva, W.M. da; Monteiro, G.A.A.; Gastelois, P.L.; Sousa, R.G. de; Macedo, W.A. de A.; Sousa, E.M.B. Efficient Sensitive Polymer-Grafted Boron Nitride Nanotubes by Microwave-Assisted Process. Nano-Structures and Nano-Objects 2018, 15, 186–196. [Google Scholar] [CrossRef]
- Baptista, L.; Freitas, D.O.; Melo, L. De; Sousa, B. De Multifunctional Mesoporous Silica Nanoparticles for Cancer-Targeted, Controlled Drug Delivery and Imaging. Microporous Mesoporous Mater. 2017, 242, 271–283. [Google Scholar] [CrossRef]
- Guha, A.; Biswas, N.; Bhattacharjee, K.; Sahoo, N.; Kuotsu, K. PH Responsive Cylindrical MSN for Oral Delivery of Insulin-Design, Fabrication and Evaluation. Drug Deliv. 2016, 23, 3552–3561. [Google Scholar] [CrossRef]
- Rawat, P.; Ahmad, I.; Thomas, S.C.; Pandey, S.; Vohora, D.; Gupta, S.; Ahmad, F.J.; Talegaonkar, S. Revisiting Bone Targeting Potential of Novel Hydroxyapatite Based Surface Modified PLGA Nanoparticles of Risedronate: Pharmacokinetic and Biochemical Assessment. Int. J. Pharm. 2016, 506, 253–261. [Google Scholar] [CrossRef]
- Sistanipour, E.; Meshkini, A.; Oveisi, H. Catechin-Conjugated Mesoporous Hydroxyapatite Nanoparticle: A Novel Nano-Antioxidant with Enhanced Osteogenic Property. Colloids Surfaces B Biointerfaces 2018, 169, 329–339. [Google Scholar] [CrossRef]
- Lin, L.; Chow, K.L.; Leng, Y. Study of Hydroxyapatite Osteoinductivity with an Osteogenic Differentiation of Mesenchymal Stem Cells. J. Biomed. Mater. Res. Part A 2009, 89A, 326–335. [Google Scholar] [CrossRef]
- Ge, J.; Zhang, Q.; Zeng, J.; Gu, Z.; Gao, M. Radiolabeling Nanomaterials for Multimodality Imaging: New Insights into Nuclear Medicine and Cancer Diagnosis. Biomaterials 2020, 228. [Google Scholar] [CrossRef]
- Zhang, M.; Yilmaz, T.; Boztas, A.O.; Karakuzu, O.; Bang, W.Y.; Yegin, Y.; Luo, Z.; Lenox, M.; Cisneros-Zevallos, L.; Akbulut, M. A Multifunctional Nanoparticulate Theranostic System with Simultaneous Chemotherapeutic, Photothermal Therapeutic, and MRI Contrast Capabilities. RSC Adv. 2016, 6, 27798–27806. [Google Scholar] [CrossRef]
- Yu, Z.; Eich, C.; Cruz, L.J. Recent Advances in Rare-Earth-Doped Nanoparticles for NIR-II Imaging and Cancer Theranostics. Front. Chem. 2020, 8, 1–10. [Google Scholar] [CrossRef]
- dos Apostolos, R.C.R.; Cipreste, M.F.; de Sousa, R.G.; de Sousa, E.M.B. Multifunctional Hybrid Nanosystems Based on Mesoporous Silica and Hydroxyapatite Nanoparticles Applied as Potential Nanocarriers for Theranostic Applications. J. Nanoparticle Res. 2020, 22. [Google Scholar] [CrossRef]
- Xie, Y.; He, W.; Li, F.; Shalika, T.; Perera, H. Luminescence Enhanced Co-Doped Hydroxyapatite Nanocrystals as Imaging Agents In Vitro and In Vivo. 2016. [CrossRef]
- Cipreste, M.F.; Rezende, M.R. de; Hneda, M.L.; Peres, A.M.; Cotta, A.A.C.; Teixeira, V. de C.; Macedo, W.A. de A.; Sousa, E.M.B. de Functionalized-Radiolabeled Hydroxyapatite/Tenorite Nanoparticles as Theranostic Agents for Osteosarcoma. Ceram. Int. 2018, 44, 17800–17811. [Google Scholar] [CrossRef]
- Sousa, A.; Souza, K.C.; Sousa, E.M.B. Mesoporous Silica/Apatite Nanocomposite: Special Synthesis Route to Control Local Drug Delivery. Acta Biomater. 2008, 4, 671–679. [Google Scholar] [CrossRef]
- Rietveld, H.M. A Profile Refinement Method for Nuclear and Magnetic Structures. J. Appl. Crystallogr. 1969, 2, 65–71. [Google Scholar] [CrossRef]
- Roisnel, T.; Rodríquez-Carvajal, J. WinPLOTR: A Windows Tool for Powder Diffraction Pattern Analysis. Mater. Sci. Forum 2001, 378, 118–123. [Google Scholar] [CrossRef]
- Verma, G.; Barick, K.C.; Manoj, N.; Sahu, A.K.; Hassan, P.A. Rod-like Micelle Templated Synthesis of Porous Hydroxyapatite. Ceram. Int. 2013, 39, 8995–9002. [Google Scholar] [CrossRef]
- Marinho, J.P.N.; Gastelois, P.L.; Macedo, W.A. de A.; Cipreste, M.F.; Sousa, E.M.B. Nanostructured System Based on Hydroxyapatite and Curcumin: A Promising Candidate for Osteosarcoma Therapy. 5ht Int. Caparica Symp. nanoparticles/nanomaterials Appl. 2022, 5., 2022, Caparica, Port. 2023. [CrossRef]
- Aldén, K.-I.; Lindqvist, I. X-Ray Studies of Some Apatites. Zeitschrift für Anorg. und Allg. Chemie 1964, 328, 219–222. [Google Scholar] [CrossRef]
- Brasseur, H. Considerations Nouvelles Sur La Constitution Possible de Phosphate Tricalcique Hydrate. Cl. Sci. 1958, 44, 507–513. [Google Scholar]
- Song, X.; Liu, X.; Ma, Y.; Zhu, Q.; Bi, M. Synthesis of Ce/Gd@HA/PLGA Scaffolds Contributing to Bone Repair and MRI Enhancement. Front. Bioeng. Biotechnol. 2022, 10, 1–16. [Google Scholar] [CrossRef]
- Ignjatović, N.L.; Mančić, L.; Vuković, M.; Stojanović, Z.; Nikolić, M.G.; Škapin, S.; Jovanović, S.; Veselinović, L.; Uskoković, V.; Lazić, S.; et al. Rare-Earth (Gd3+,Yb3+/Tm3+, Eu3+) Co-Doped Hydroxyapatite as Magnetic, up-Conversion and down-Conversion Materials for Multimodal Imaging. Sci. Rep. 2019, 9, 16305. [Google Scholar] [CrossRef] [PubMed]
- Get’man, E.I.; Loboda, S.N.; Tkachenko, T. V.; Yablochkova, N. V.; Chebyshev, K.A. Isomorphous Substitution of Samarium and Gadolinium for Calcium in Hydroxyapatite Structure. Russ. J. Inorg. Chem. 2010, 55, 333–338. [Google Scholar] [CrossRef]
- Vieira, L.A.F.; Meireles, I.B. da C.J.; Sousa, E.M.B. Boron Nitride Nanostructures Reinforced Nanohydroxyapatite: Bifunctional Nanocomposite for Potential Orthopedical Use and Ciprofloxacin Controlled Delivery. J. Ceram. Process. Res. 2022, 23, 725–736. [Google Scholar] [CrossRef]
- Zhao, X.S.; Lu, G.Q.; Whittaker, a K.; Millar, G.J.; Zhu, H.Y. Comprehensive Study of Surface Chemistry of MCM-41 Using Si-29 CP/MAS NMR, FTIR, Pyridine-TPD, and TGA. J. Phys. Chem. B 1997, 101, 6525–6531. [CrossRef]
- Zholobenko, V.L.; Holmes, S.M.; Cundy, C.S.; Dwyer, J. Synthesis of MCM-41 Materials: An in Situ FTIR Study. Microporous Mater. 1997, 11, 83–86. [Google Scholar] [CrossRef]
- Chen, J.; Li, Q.; Xu, R.; Xiao, F. Distinguishing the Silanol Groups in the Mesoporous Molecular Sieve MCM-41. Angew. Chemie Int. Ed. English 1996, 34, 2694–2696. [Google Scholar] [CrossRef]
- Shi, J.Y.; Yao, Q.Z.; Li, X.M.; Zhou, G.T.; Fu, S.Q. Controlled Morphogenesis of Amorphous Silica and Its Relevance to Biosilicification. Am. Mineral. 2012, 97, 1381–1393. [Google Scholar] [CrossRef]
- Apostolos, R.C.R.; Andrade, G.F.; Silva, W.M.; Assis Gomes, D.; Miranda, M.C.; Sousa, E.M.B. Hybrid Polymeric Systems of Mesoporous Silica/Hydroxyapatite Nanoparticles Applied as Antitumor Drug Delivery Platform. Int. J. Appl. Ceram. Technol. 2019, 16, 1836–1849. [Google Scholar] [CrossRef]
- Sousa, A. de Híbridos de Gel Polimérico Em Sílica Mesoporosa Estruturalmente Ordenada Para Liberação Controlada de Fármacos, Universidade Federal de Minas Gerais, 2009.
- Baghaei, B.; Jafari, S.H.; Khonakdar, H.A.; Wagenknecht, U.; Heinrich, G. Novel Thermosensitive Hydrogel Composites Based on Poly( D,L -Lactide- Co -Glycolide) Nanoparticles Embedded in Poly(n -Isopropyl Acrylamide) with Sustained Drug-Release Behavior. J. Appl. Polym. Sci. 2014, 131, n. [Google Scholar] [CrossRef]
- Silva, W.M. da; Monteiro, G.A.A.; Gastelois, P.L.; Sousa, R.G. de; Macedo, W.A. de A.; Sousa, E.M.B. Efficient Sensitive Polymer-Grafted Boron Nitride Nanotubes by Microwave-Assisted Process. Nano-Structures & Nano-Objects 2018, 15, 186–196. [Google Scholar] [CrossRef]
- Victor, S.P.; Paul, W.; Jayabalan, M.; Sharma, C.P. Supramolecular Hydroxyapatite Complexes as Theranostic Near-Infrared Luminescent Drug Carriers. CrystEngComm 2014, 16, 9033–9042. [Google Scholar] [CrossRef]
- Bansal, R.; Singh, R.; Kaur, K. Quantitative Analysis of Doxorubicin Hydrochloride and Arterolane Maleate by Mid IR Spectroscopy Using Transmission and Reflectance Modes. BMC Chem. 2021, 15, 1–11. [Google Scholar] [CrossRef] [PubMed]
- Ignjatović, N.L.; Mančić, L.; Vuković, M.; Stojanović, Z.; Nikolić, M.G.; Škapin, S.; Jovanović, S.; Veselinović, L.; Uskoković, V.; Lazić, S.; et al. Rare-Earth (Gd3+,Yb3+/Tm3+, Eu3+) Co-Doped Hydroxyapatite as Magnetic, up-Conversion and down-Conversion Materials for Multimodal Imaging. Sci. Rep. 2019, 9, 16305. [Google Scholar] [CrossRef] [PubMed]
- Narayan, R.; Nayak, U.; Raichur, A.; Garg, S. Mesoporous Silica Nanoparticles: A Comprehensive Review on Synthesis and Recent Advances. Pharmaceutics 2018, 10, 118. [Google Scholar] [CrossRef]
- Ngoune, R.; Peters, A.; von Elverfeldt, D.; Winkler, K.; Pütz, G. Accumulating Nanoparticles by EPR: A Route of No Return. J. Control. Release 2016, 238, 58–70. [Google Scholar] [CrossRef]
- Lopes, M.A.; Monteiro, F.J.; Santos, J.D.; Serro, A.P.; Saramago, B. Hydrophobicity, Surface Tension, and Zeta Potential Measurements of Glass-Reinforced Hydroxyapatite Composites. J. Biomed. Mater. Res. 1999, 45, 370–375. [Google Scholar] [CrossRef]
- Suzuki, T.; Nishizawa, K.; Yokogawa, Y.; Nagata, F.; Kawamoto, Y.; Kameyama, T. Time-Dependent Variation of the Surface Structure of Bioceramics in Tissue Culture Medium and the Effect on Adhesiveness of Cells. J. Ferment. Bioeng. 1996, 81, 226–232. [Google Scholar] [CrossRef]
- Liberman, A.; Mendez, N.; Trogler, W.C.; Kummel, A.C. Synthesis and Surface Functionalization of Silica Nanoparticles for Nanomedicine. Surf. Sci. Rep. 2014, 69, 132–158. [Google Scholar] [CrossRef]
- Sing, K.S.W. Reporting Physisorption Data for Gas/Solid Systems with Special Reference to the Determination of Surface Area and Porosity (Recommendations 1984). Pure Appl. Chem. 1985, 57, 603–619. [Google Scholar] [CrossRef]
- Yousefpour, M.; Taherian, Z. The Effects of Ageing Time on the Microstructure and Properties of Mesoporous Silica-Hydroxyapatite Nanocomposite. Superlattices Microstruct. 2013, 54, 78–86. [Google Scholar] [CrossRef]
- Park, M.; Komarneni, S. Stepwise Functionalization of Mesoporous Crystalline Silica Materials. Microporous Mesoporous Mater. 1998, 25, 75–80. [Google Scholar] [CrossRef]
- Van Uitert, L.G. Characterization of Energy Transfer Interactions between Rare Earth Ions. J. Electrochem. Soc. 1967, 114, 1048. [Google Scholar] [CrossRef]
- Nakazawa, K.; Shionoya, S. Energy Transfer between Trivalent Rare-Earth Ions in Inorganic Solids. J. Chem. Phys. 1967, 47, 3267–3270. [Google Scholar] [CrossRef]
- Honma, T.; Toda, K.; Ye, Z.G.; Sato, M. Concentration Quenching of the Eu3+-Activated Luminescence in Some Layered Perovskites with Two-Dimensional Arrangement. J. Phys. Chem. Solids 1998, 59, 1187–1193. [Google Scholar] [CrossRef]
- Xie, Y.; He, W.; Li, F.; Perera, T.S.H.; Gan, L.; Han, Y.; Wang, X.; Li, S.; Dai, H. Luminescence Enhanced Eu3+/Gd3+ Co-Doped Hydroxyapatite Nanocrystals as Imaging Agents in Vitro and in Vivo. ACS Appl. Mater. Interfaces 2016, 8, 10212–10219. [Google Scholar] [CrossRef]
- Binnemans, K. Interpretation of Europium(III) Spectra. Coord. Chem. Rev. 2015, 295, 1–45. [Google Scholar] [CrossRef]
- Ashokan, A.; Menon, D.; Nair, S.; Koyakutty, M. A Molecular Receptor Targeted, Hydroxyapatite Nanocrystal Based Multi-Modal Contrast Agent. Biomaterials 2010, 31, 2606–2616. [Google Scholar] [CrossRef] [PubMed]
- Cipreste, M.F.; Peres, A.M.; Cotta, A.A.C.; Aragón, F.H.; Antunes, A.D.M.; Leal, A.S.; Macedo, W.A.A.; de Sousa, E.M.B. Synthesis and Characterization of 159 Gd-Doped Hydroxyapatite Nanorods for Bioapplications as Theranostic Systems. Mater. Chem. Phys. 2016, 181, 301–311. [Google Scholar] [CrossRef]
- Salehi, R.; Irani, M.; Eskandani, M.; Nowruzi, K.; Davaran, S.; Haririan, I. Interaction, Controlled Release, and Antitumor Activity of Doxorubicin Hydrochloride From PH-Sensitive P(NIPAAm-MAA-VP) Nanofibrous Scaffolds Prepared by Green Electrospinning. Int. J. Polym. Mater. Polym. Biomater. 2014, 63, 609–619. [Google Scholar] [CrossRef]
- Salehi, R.; Rasouli, S.; Hamishehkar, H. Smart Thermo/PH Responsive Magnetic Nanogels for the Simultaneous Delivery of Doxorubicin and Methotrexate. Int. J. Pharm. 2015, 487, 274–284. [Google Scholar] [CrossRef] [PubMed]
- Khare, A.R.; Peppas, N.A. Swelling/Deswelling of Anionic Copolymer Gels. Biomaterials 1995, 16, 559–567. [Google Scholar] [CrossRef] [PubMed]
- Ritger, P.L.; Peppas, N.A. A Simple Equation for Description of Solute Release I. Fickian and Non-Fickian Release from Non-Swellable Devices in the Form of Slabs, Spheres, Cylinders or Discs. J. Control. Release 1987, 5, 23–36. [Google Scholar] [CrossRef]
- Ritger, P.L.; Peppas, N.A. A Simple Equation for Description of Solute Release II. Fickian and Anomalous Release from Swellable Devices. J. Control. Release 1987, 5, 37–42. [Google Scholar] [CrossRef]
- Korsmeyer, R.W.; Gurny, R.; Doelker, E.; Buri, P.; Peppas, N.A. Mechanisms of Solute Release from Porous Hydrophilic Polymers. Int. J. Pharm. 1983, 15, 25–35. [Google Scholar] [CrossRef]
- Peppas Pharmaceutical Acta Helvetiae. 1985, pp. 110–111.
- Liu, L.; Zeng, J.; Zhao, X.; Tian, K.; Liu, P. Independent Temperature and PH Dual-Responsive PMAA/PNIPAM Microgels as Drug Delivery System: Effect of Swelling Behavior of the Core and Shell Materials in Fabrication Process. Colloids Surfaces A Physicochem. Eng. Asp. 2017, 526, 48–55. [Google Scholar] [CrossRef]
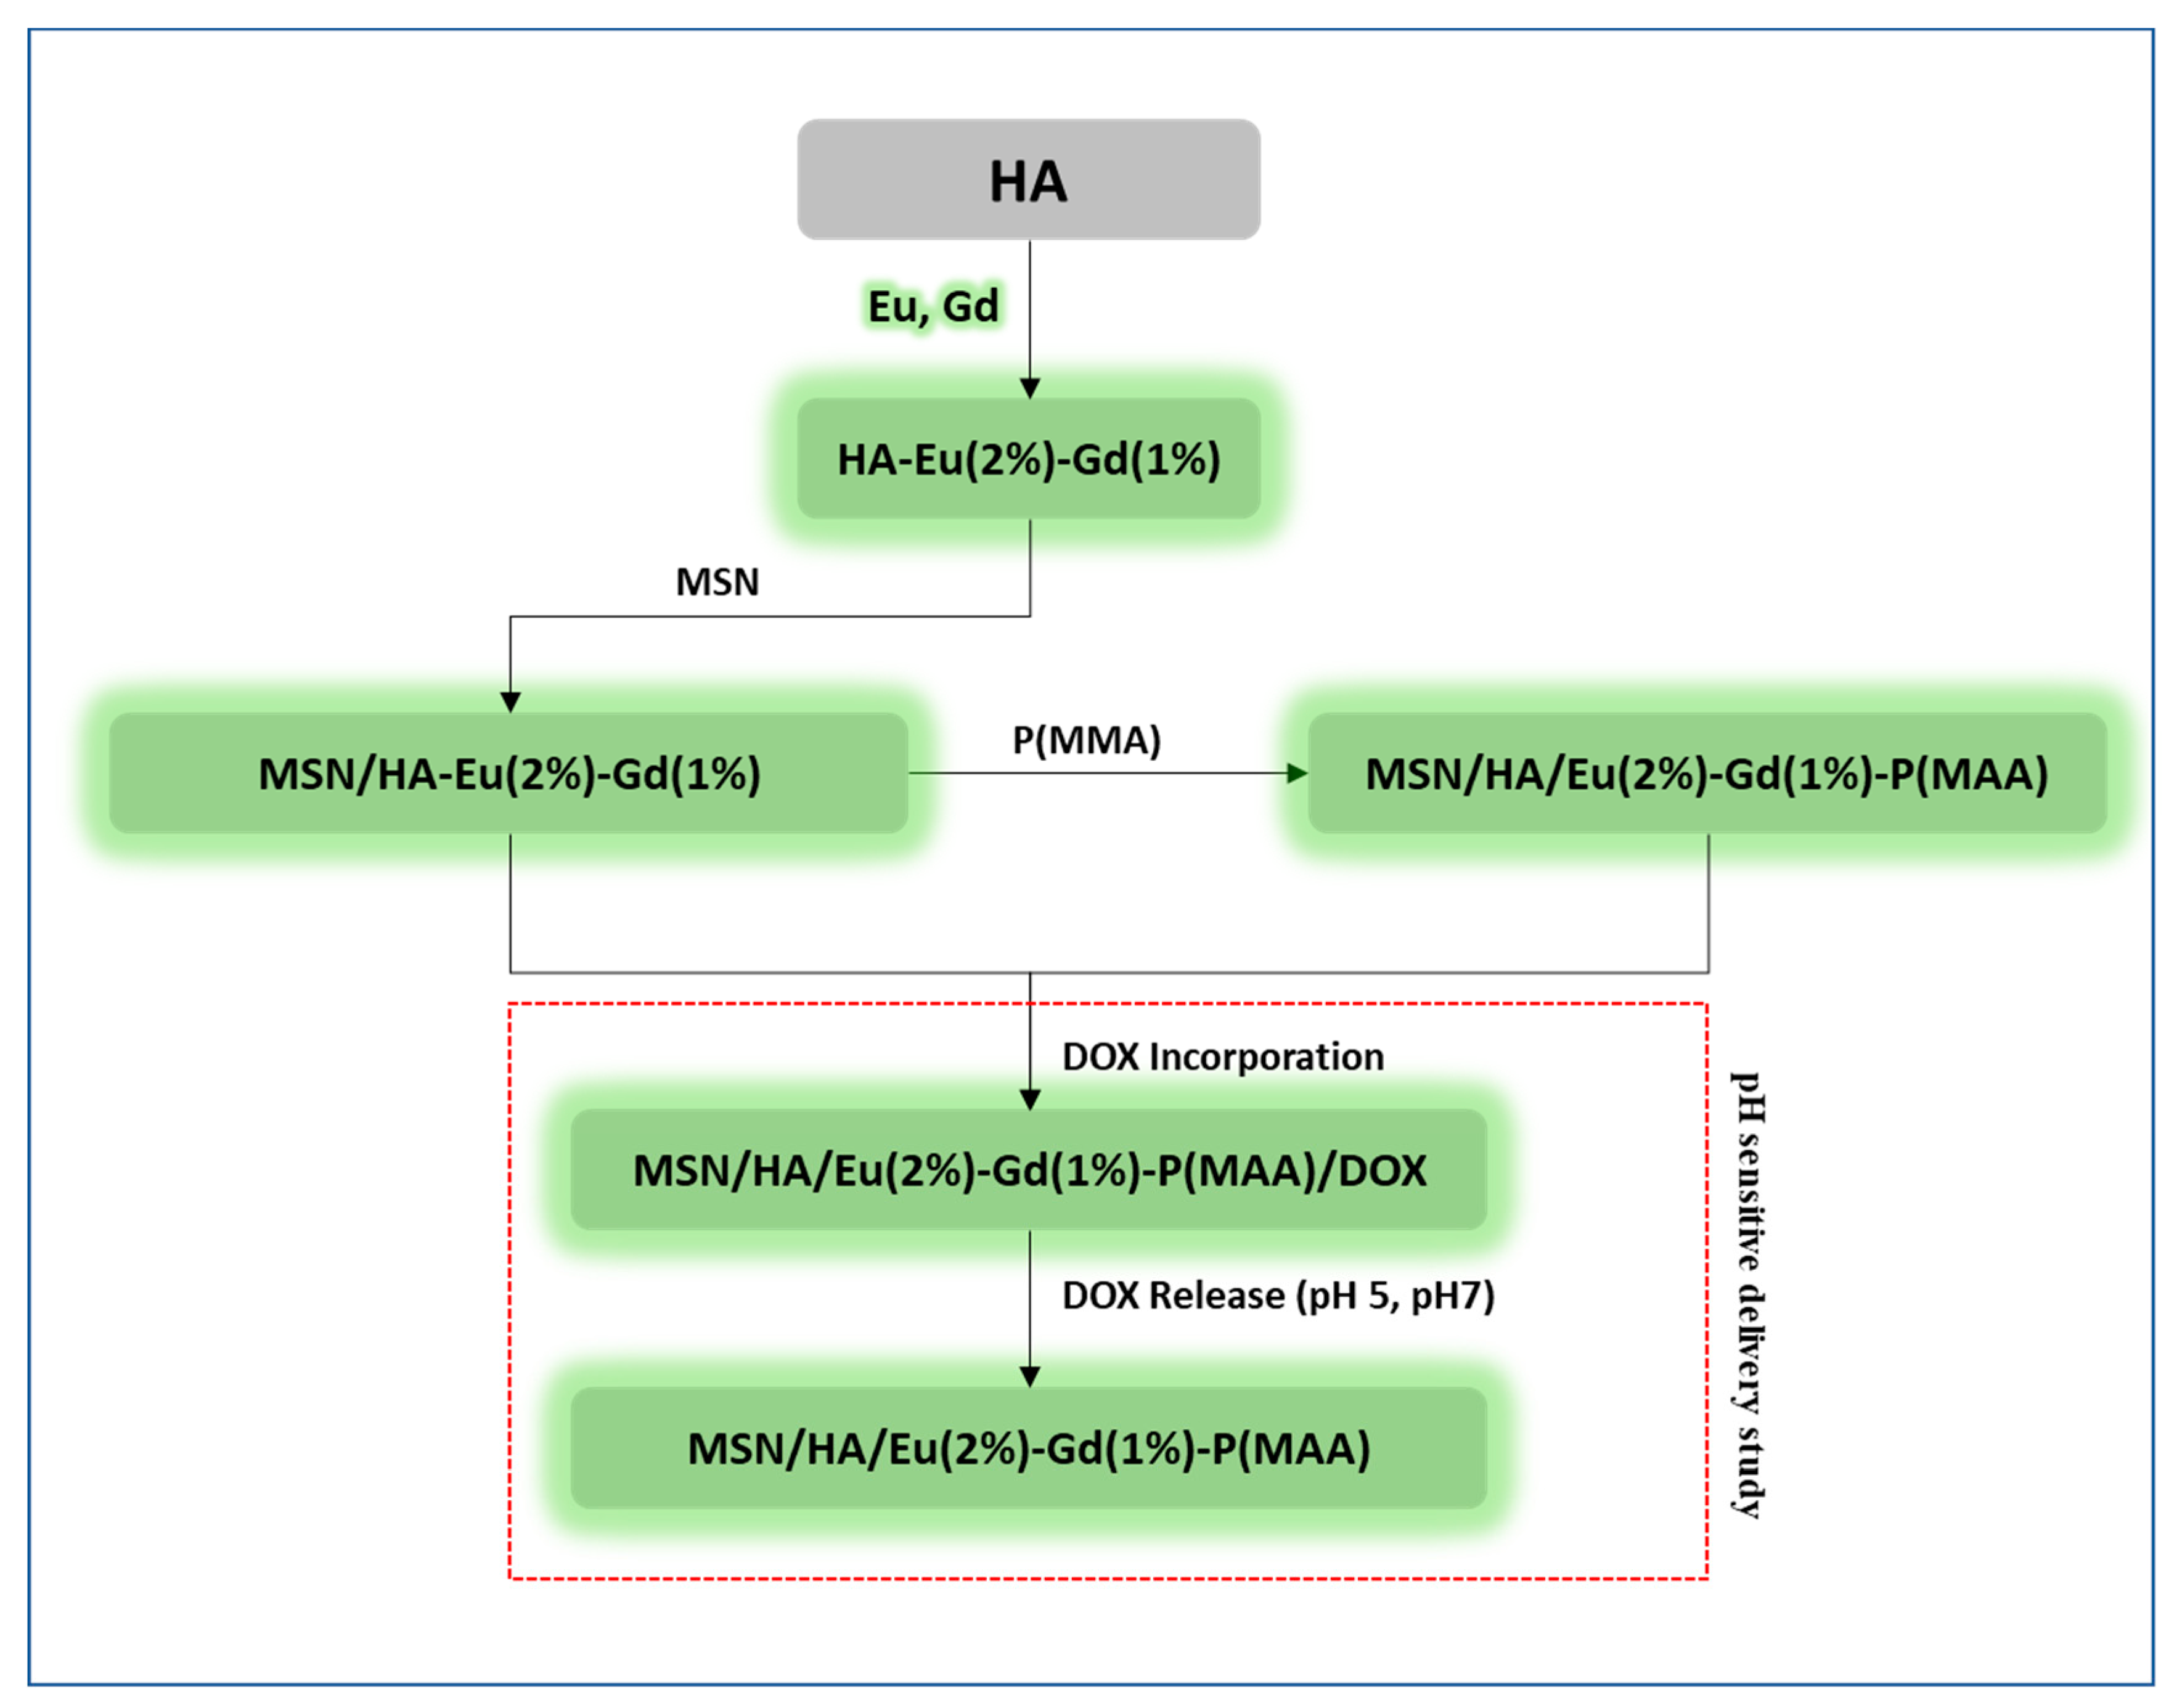
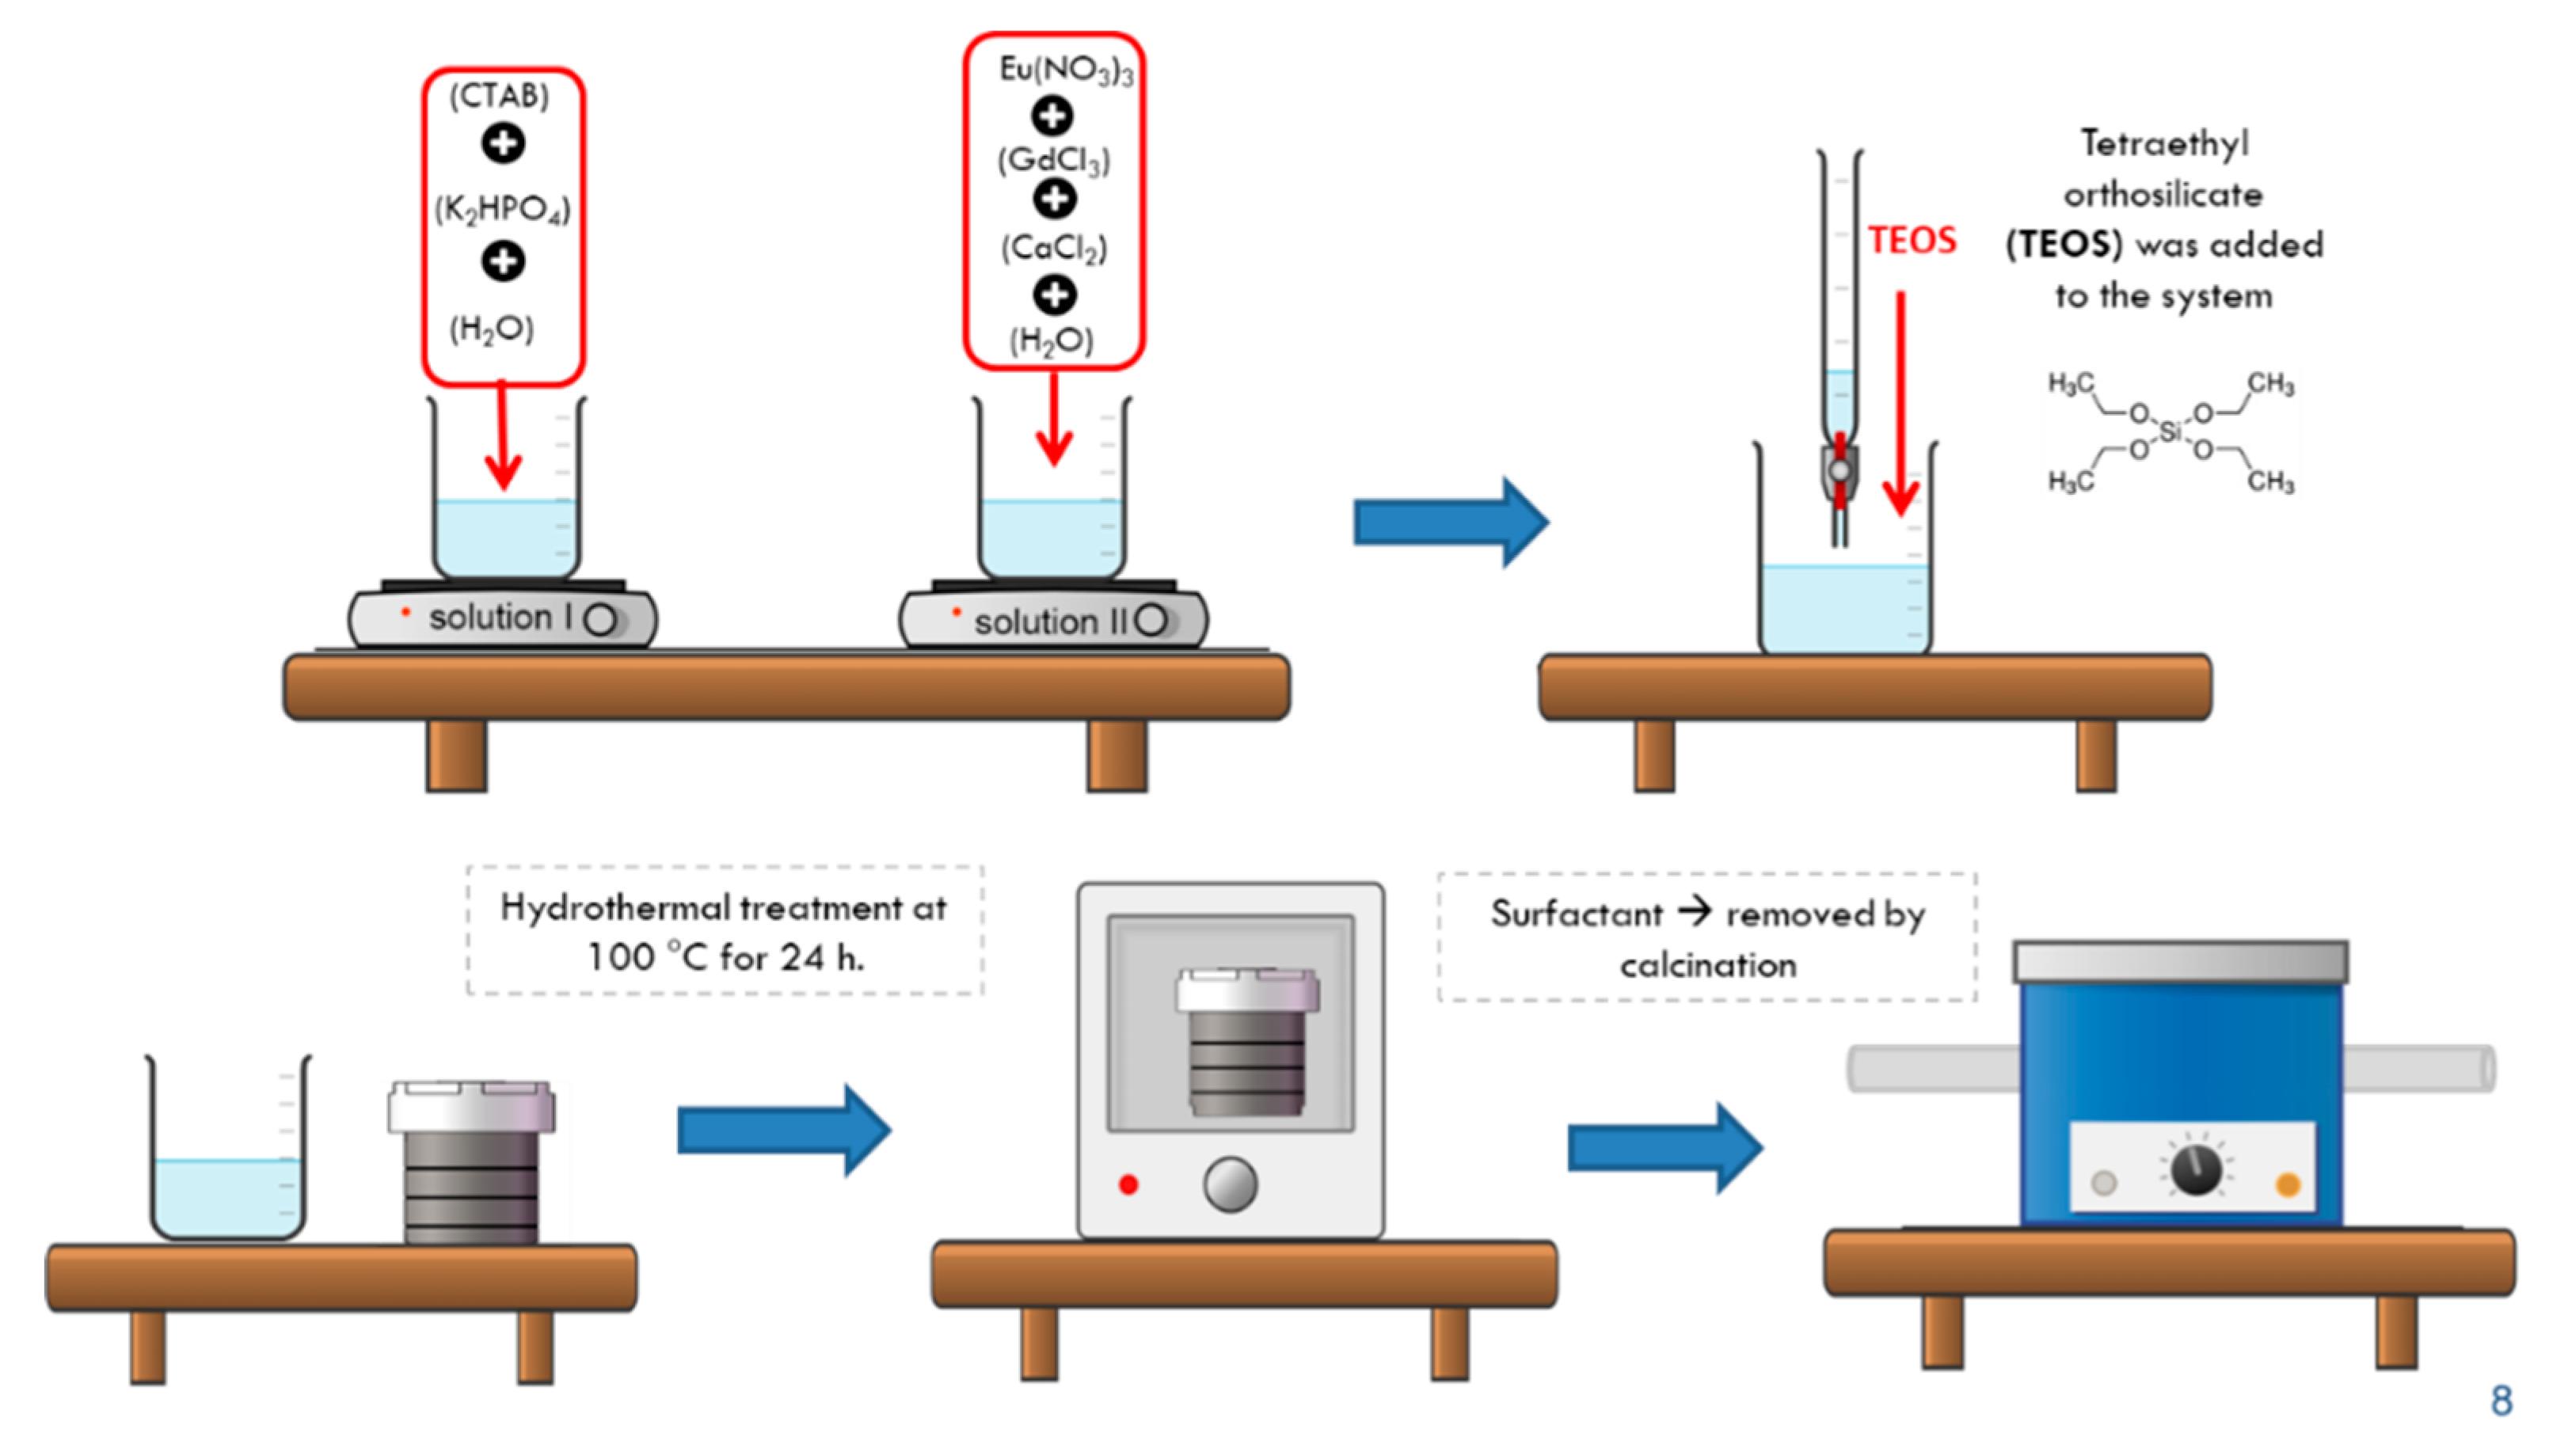
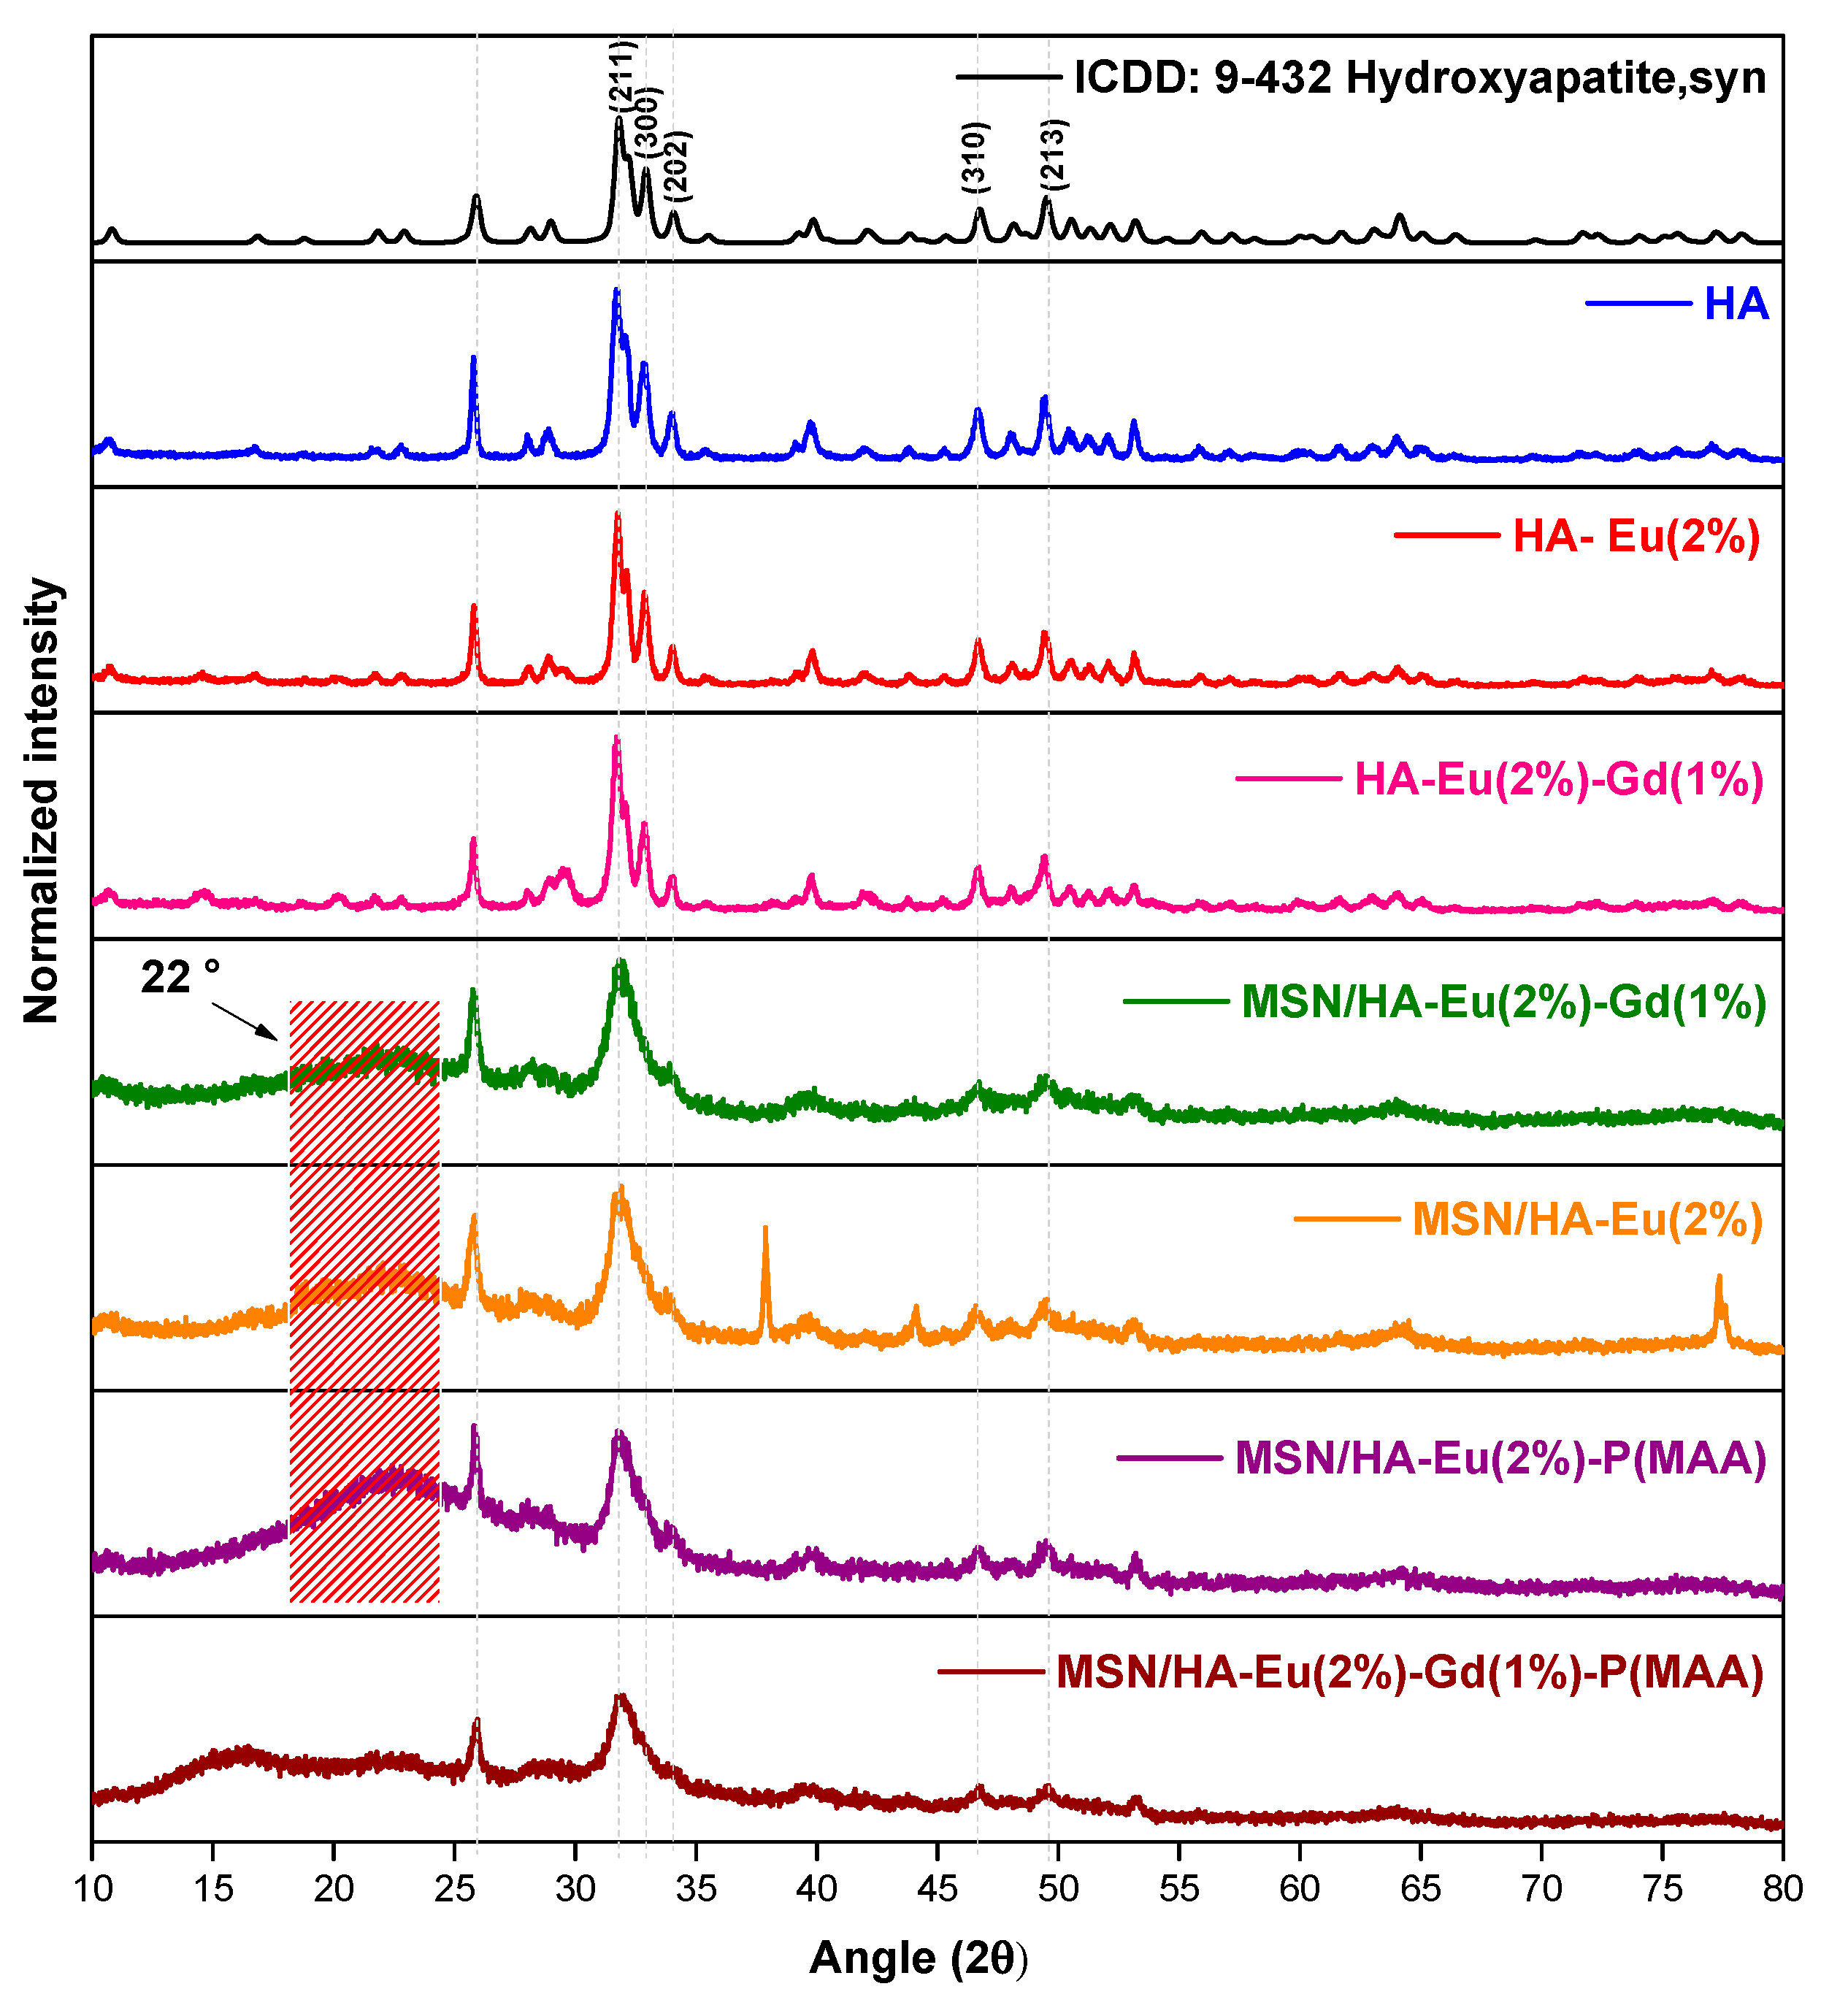
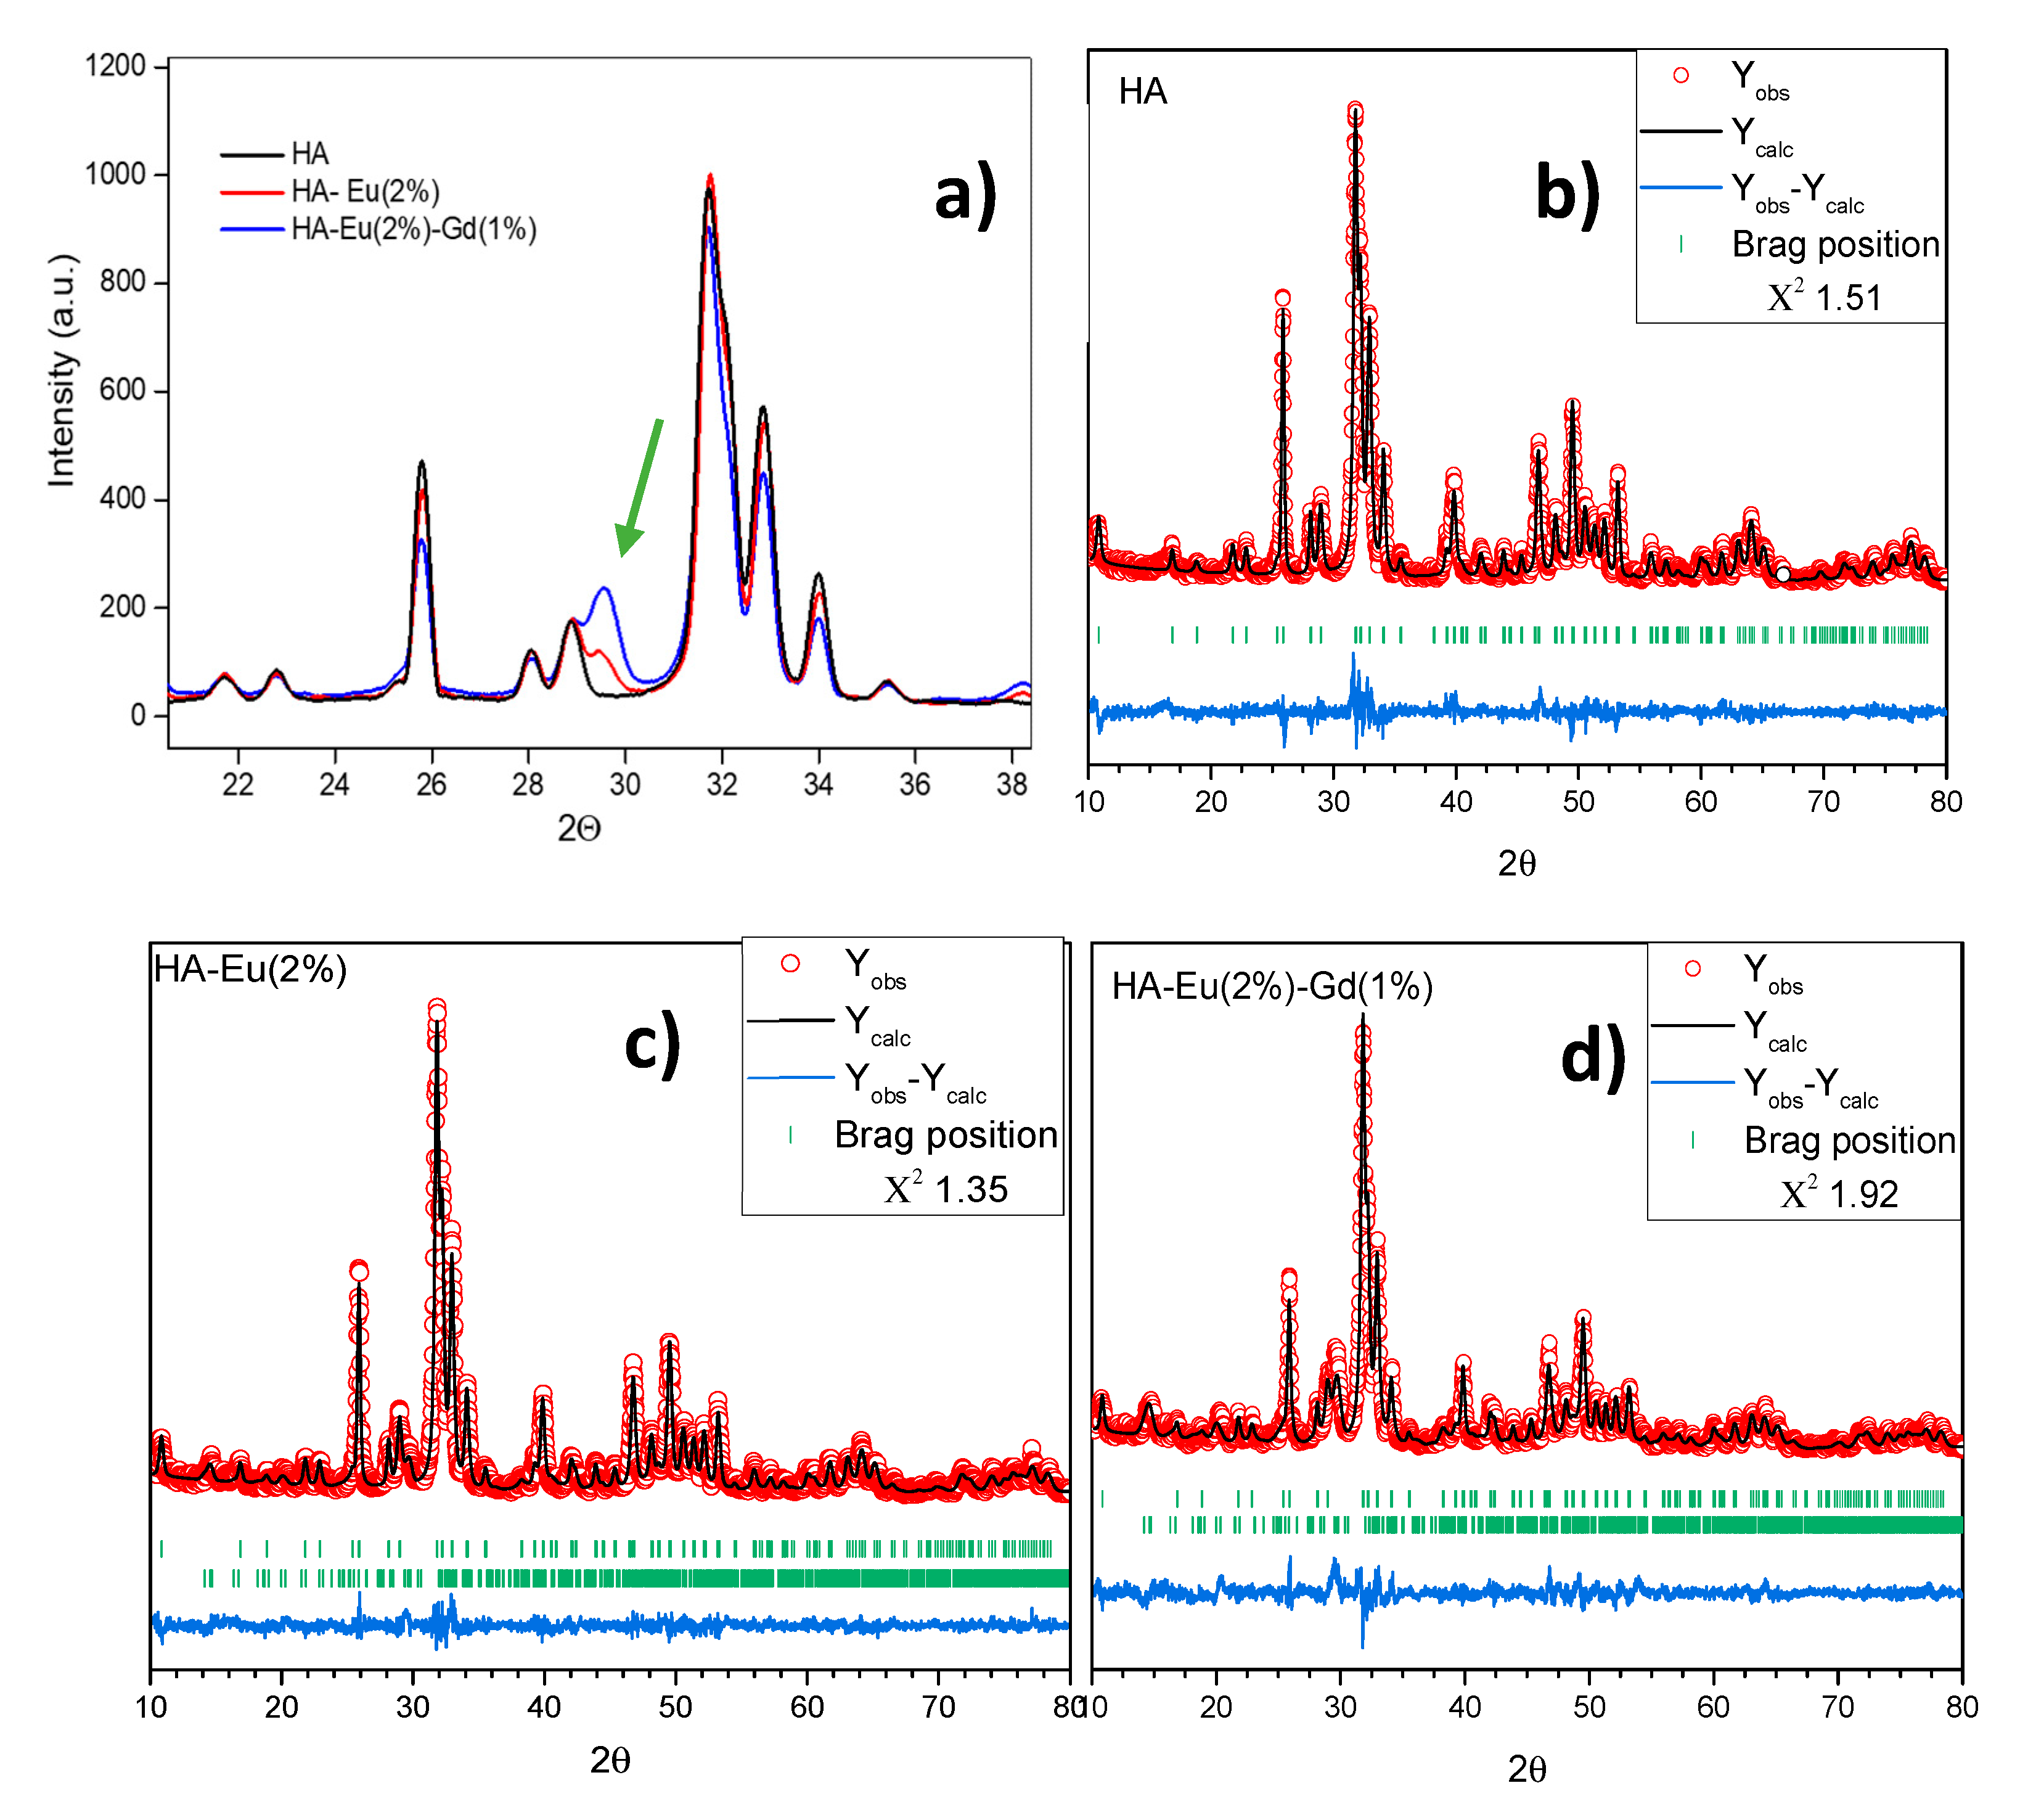
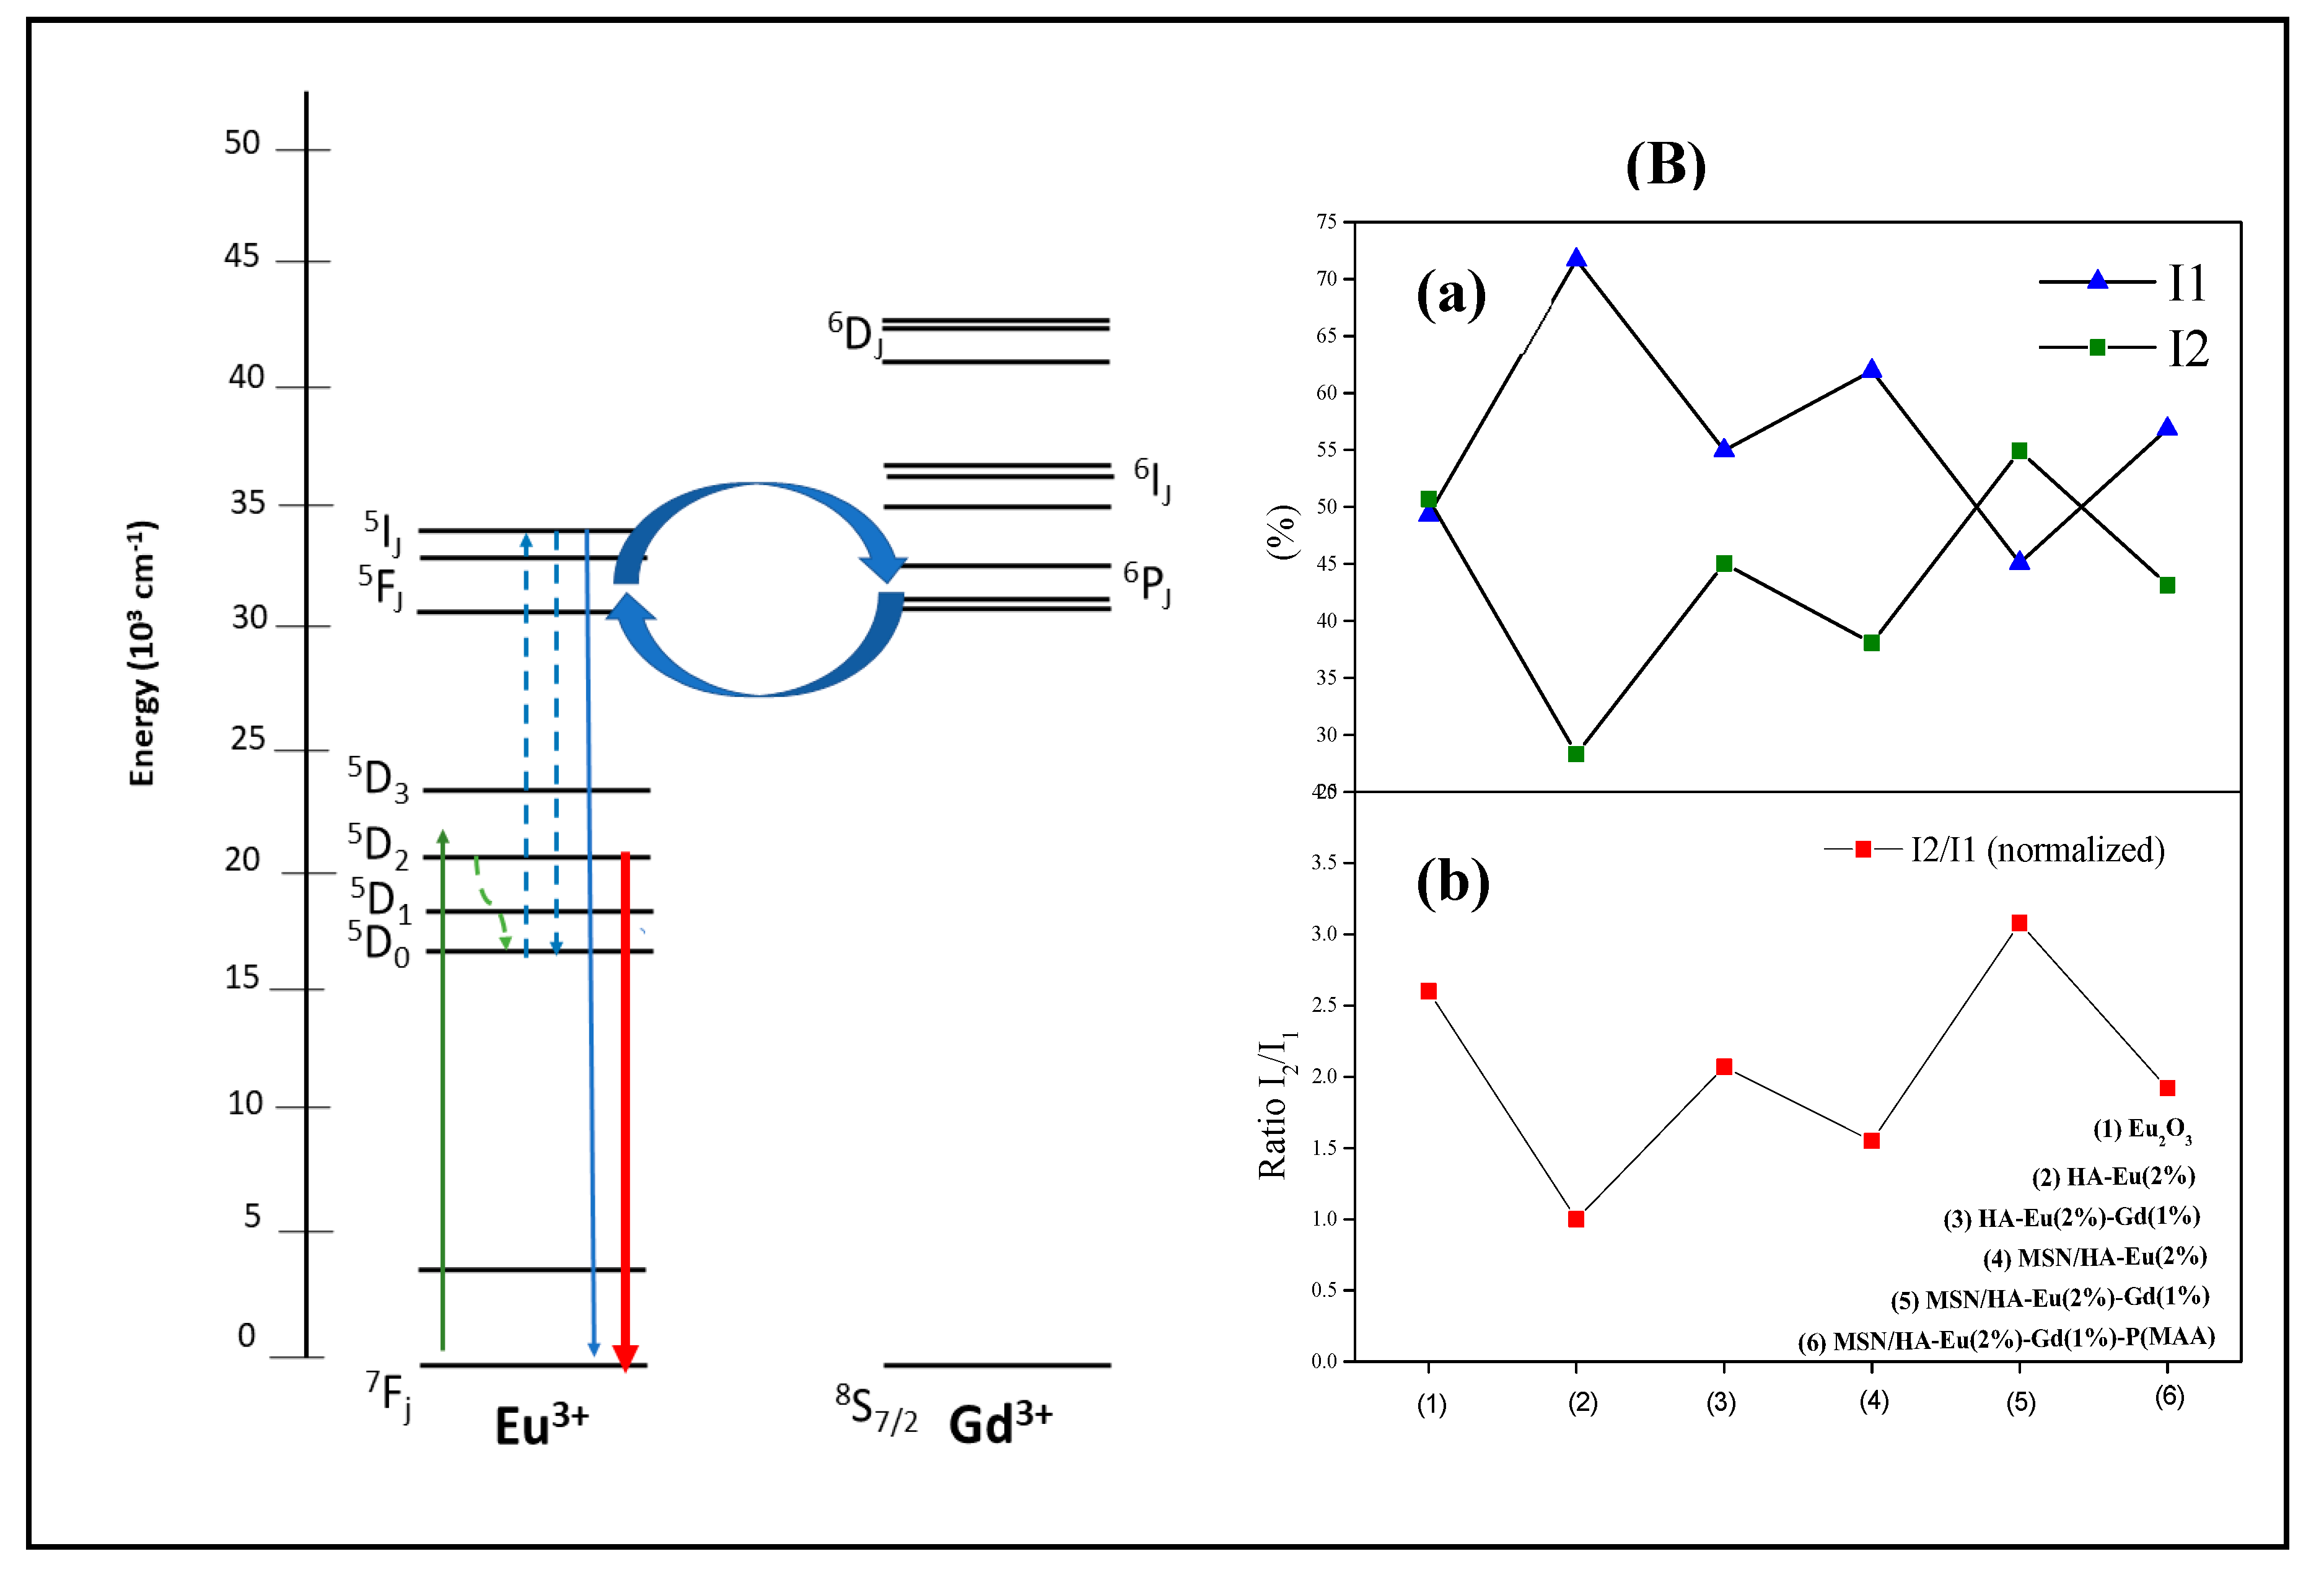
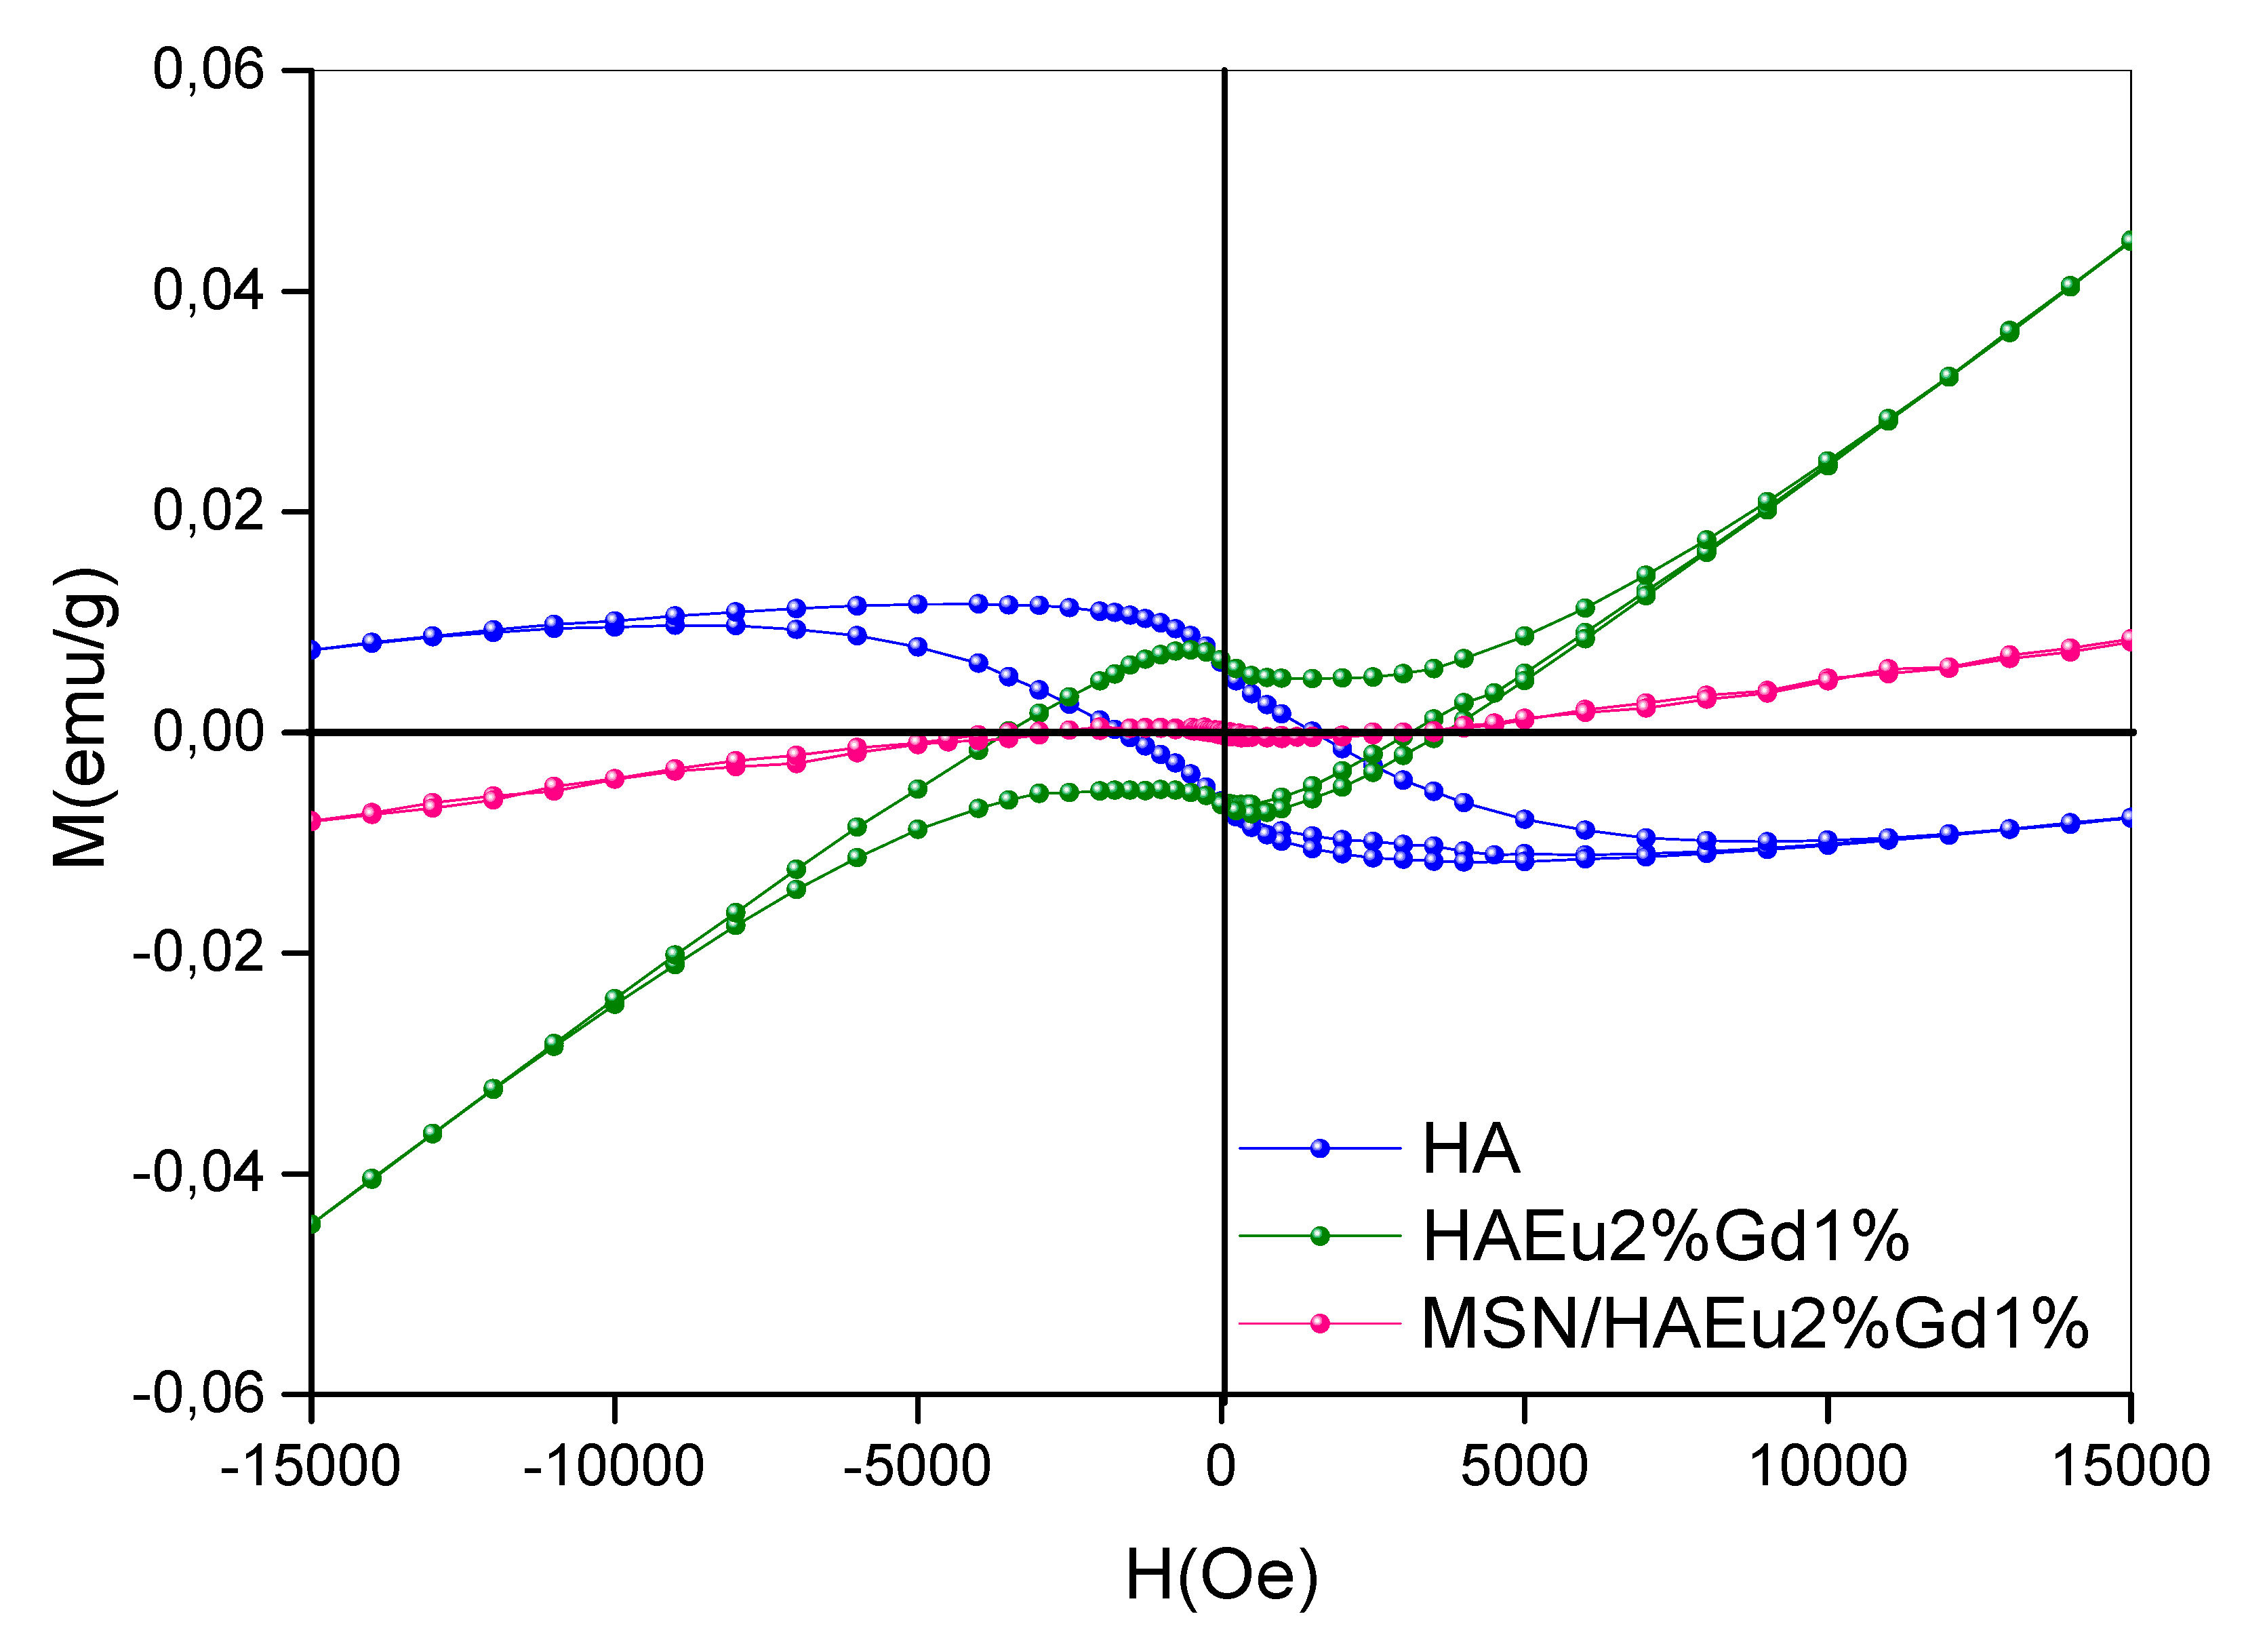
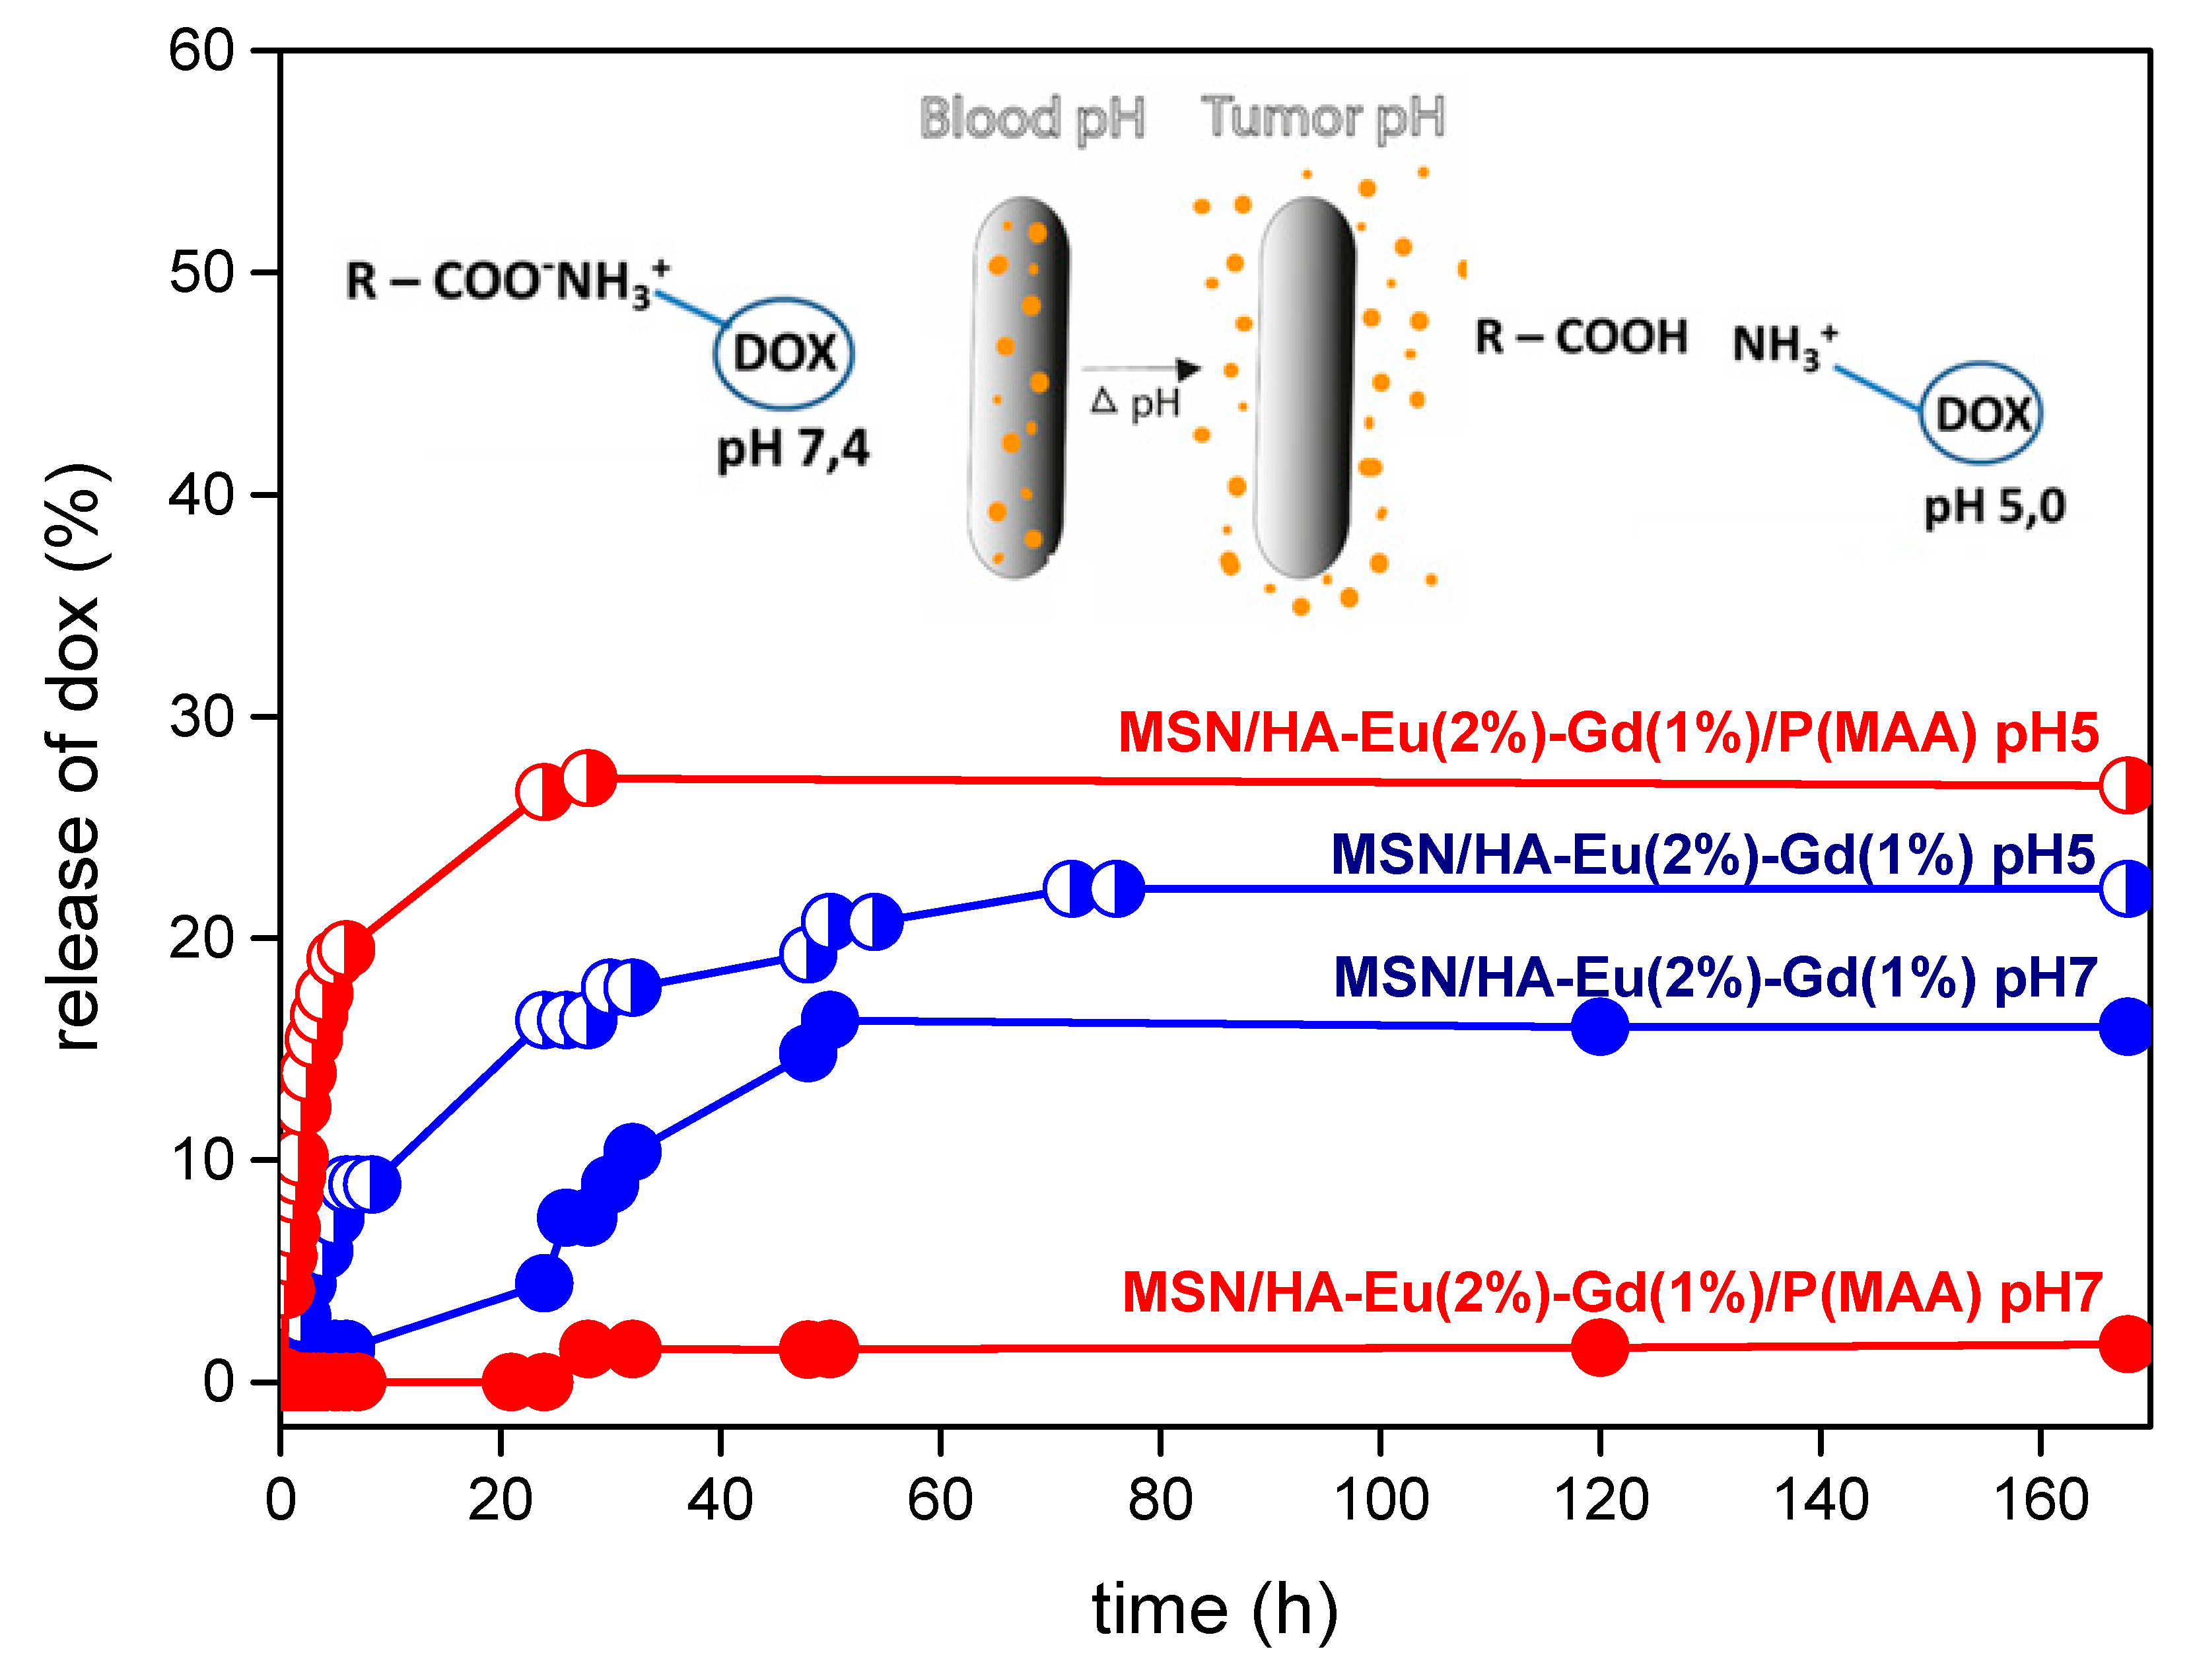
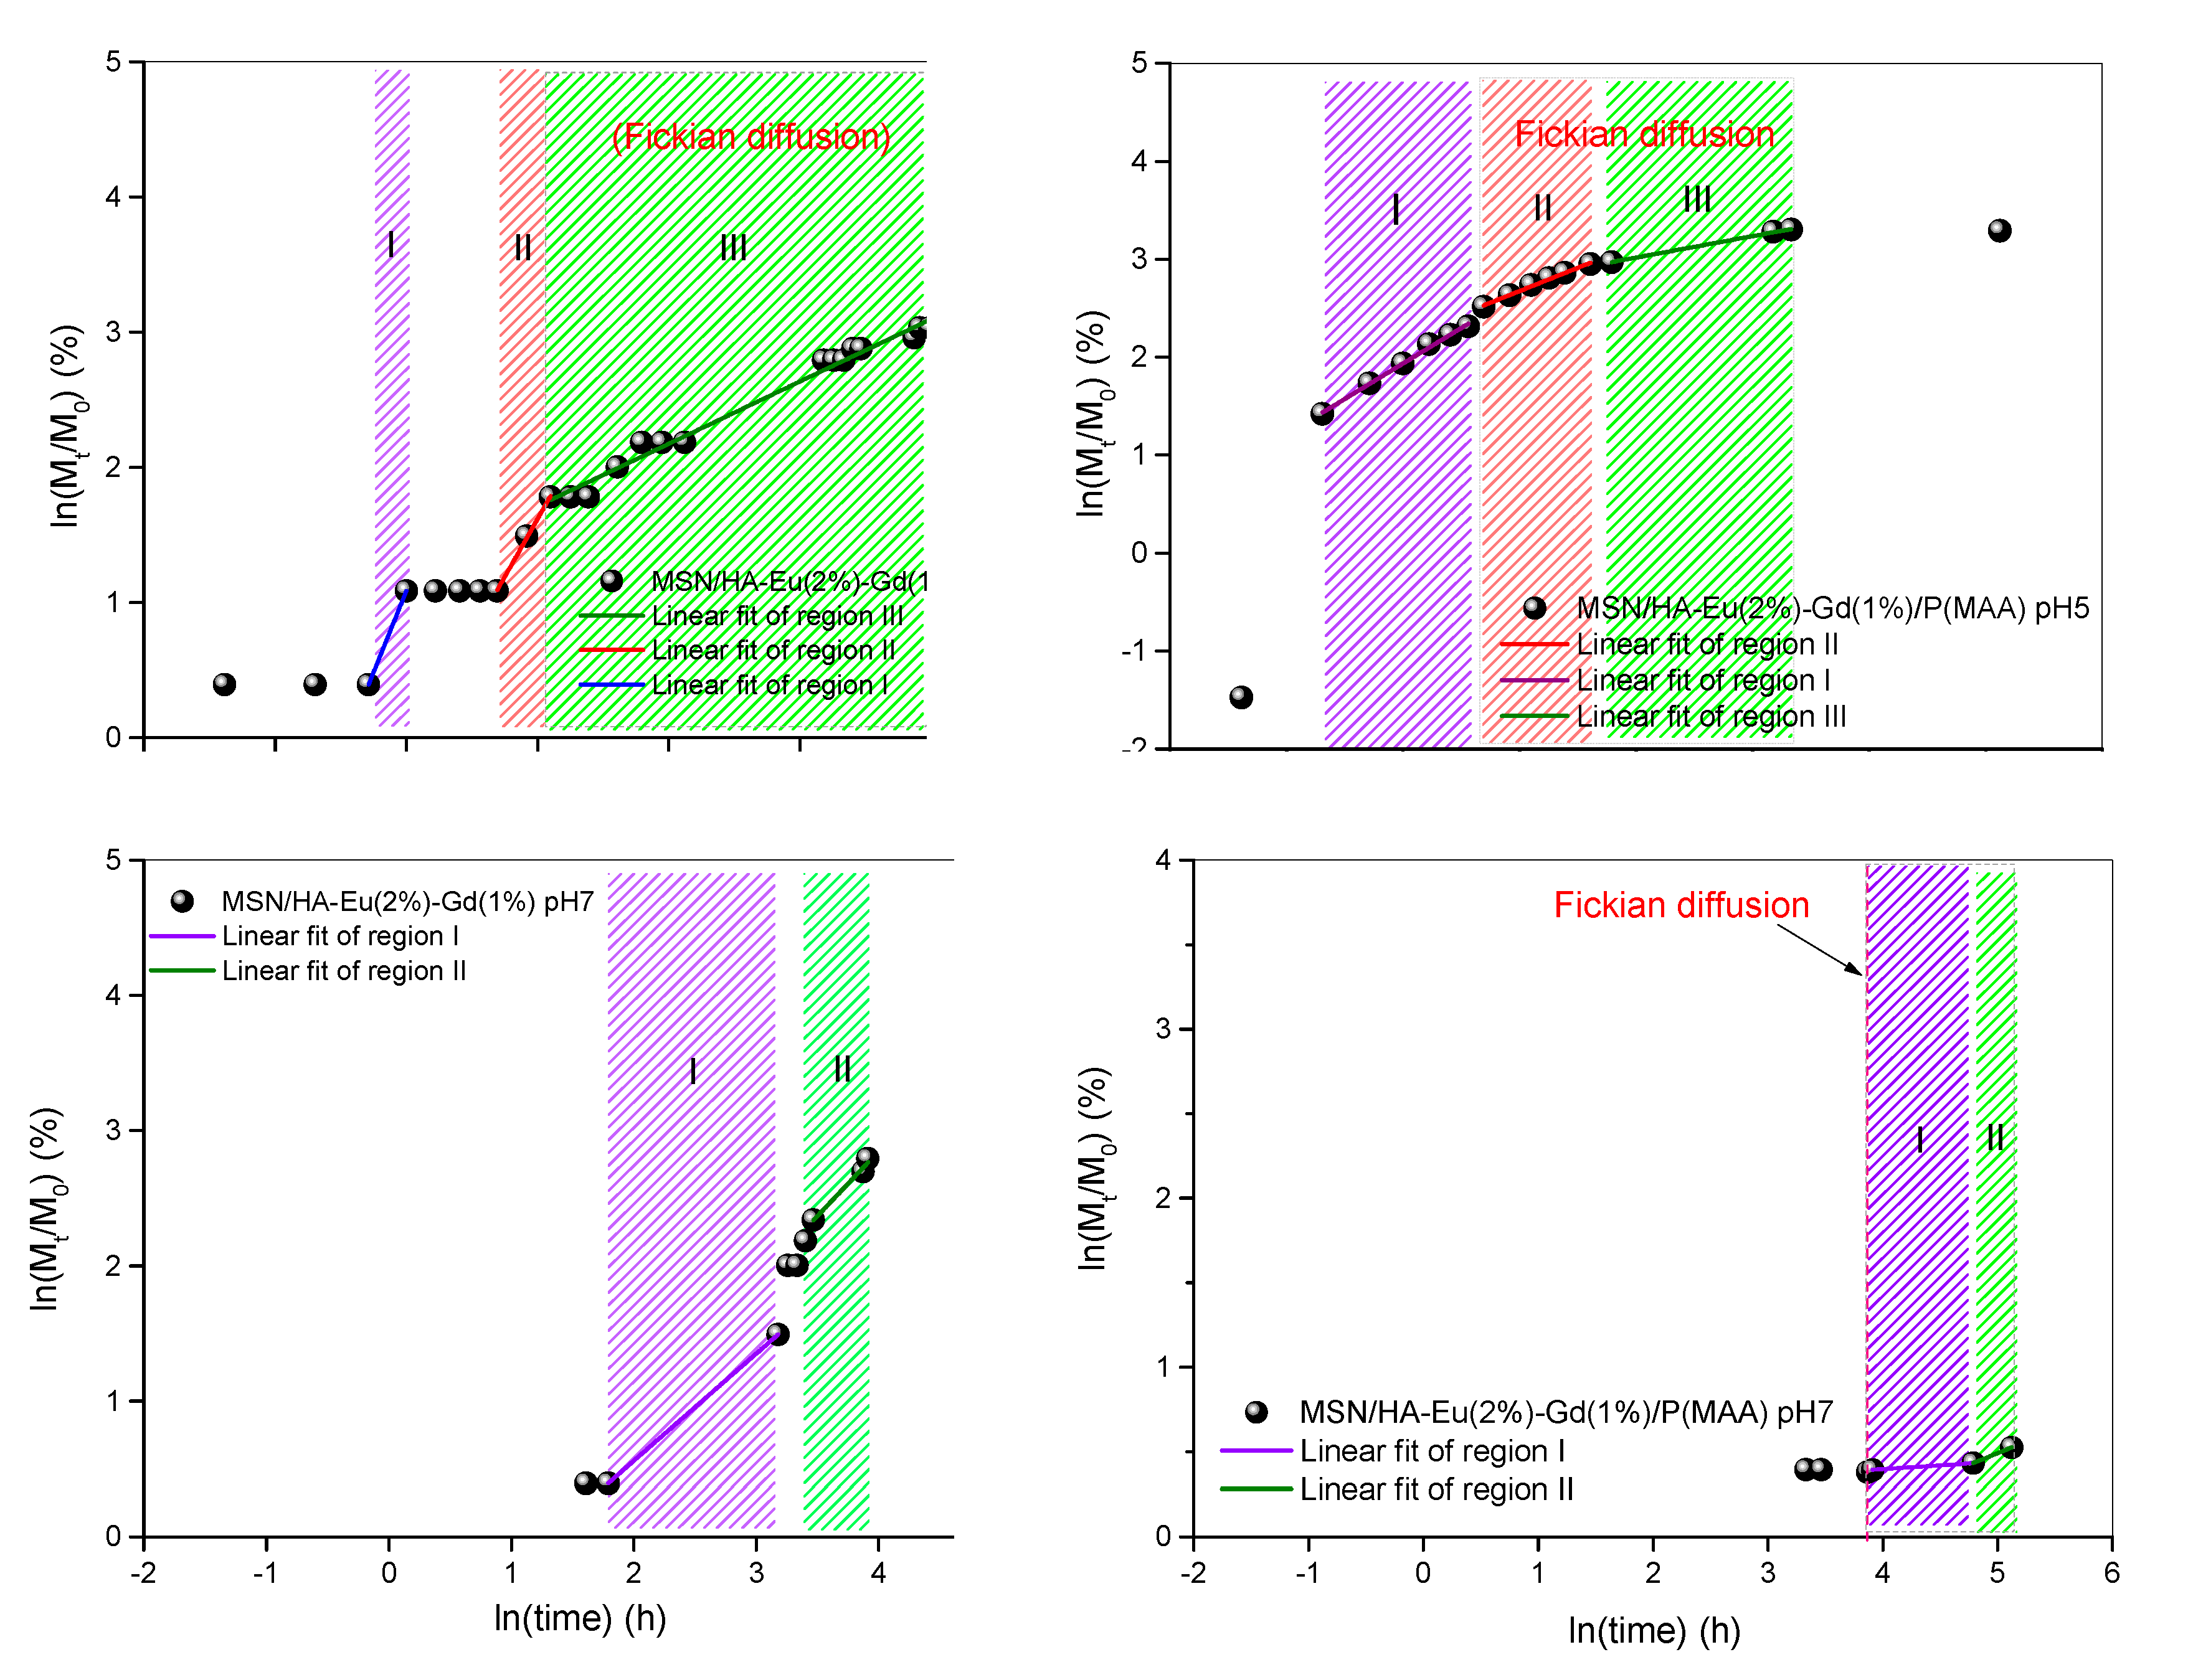
| Sample | Cell parameters | ||||||||
|---|---|---|---|---|---|---|---|---|---|
| a (Å) | b (Å) | c (Å) | V (Å3) | Space group | <D> (nm) |
Phase content (%) |
S | ||
|
Standard (ICSD) 16742 |
HA | 9.43200 | 9.43200 | 6.88100 | 530.1 | P63/m | ---- | ||
| HA | HA | 9.4222 (1) | 9.4222 (1) | 6.8854 (1) | 529.3 (1) | P63/m | 28.4 (8.4) | 100 (0) | 1.23 |
| HA-Eu(2%) | HA | 9.4125 (1) | 9.4125 (1) | 6. 8820 (1) | 528.0 (1) | P63/m | 22.6 (0.2) | 91.7 (0.5) | 1.16 |
| Ca2P2O7 | 11.7711 (1) | 7.7763 (1) | 10.8376 (1) | 893.2 (1) | P 21/c | 8.3 (0.2) | |||
| HA-Eu(2%)-Gd(1%) | HA | 9.4169 (1) | 9.4169 (3) | 6.8866 (1) | 528.9 (1) | P63/m | 22.2 (6.1) | 76.0 (0.5) | 1.38 |
| Ca2P2O7 | 11.7914 (1) | 7.6631 (1) | 10.9040 (1) | 887.2 (1) | P 21/c | 24.0 (0.3) | |||
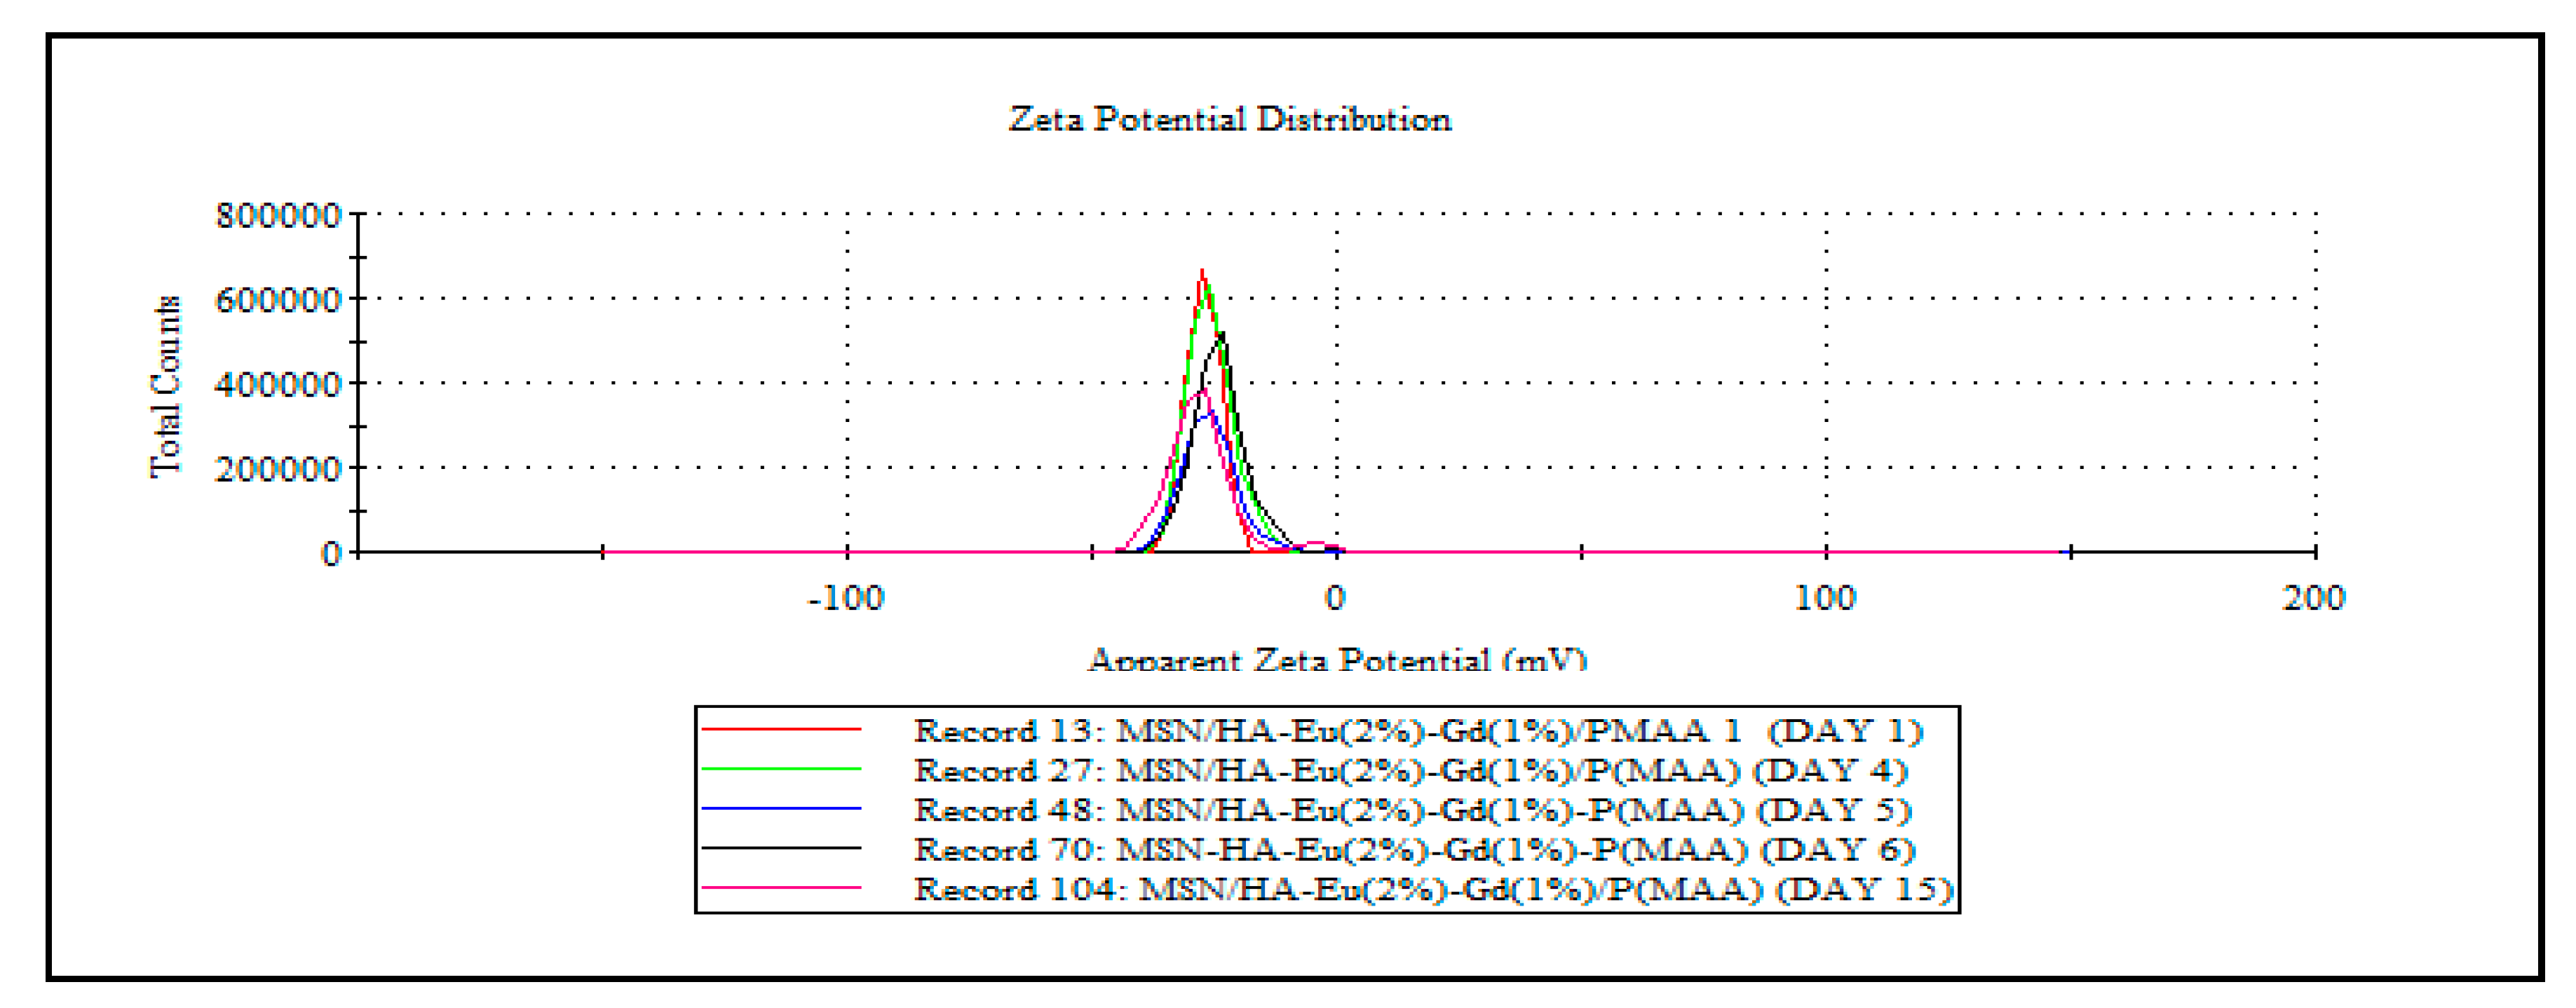
| Samples | Zeta Potencial ± SD (mV) |
|---|---|
| HA | -16.8 ± 0.23 |
| HA/Eu (2%)-Gd(1%) | -15.0 ± 0.55 |
| MSN/HA/Eu(2%)-Gd(1%) | -23.2 ± 0.23 |
| MSN/HA/Eu (2%)-Gd(1%)/P(MAA) | -27.2 ± 0.80 |
| MSN/HA/Eu(2%)-Gd(1%)-DOX | -17.8 ± 0.56 |
| MSN/HA/Eu (2%)-Gd(1%)/P(MAA)/DOX | -21.0 ± 0.23 |
| Sample | C (%) | H (%) | N (%) |
|---|---|---|---|
| MSN/HA-Eu(2%)-Gd(1%) | 0.33 | 0.59 | 0.33 |
| MSN/HA-Eu(2%)-Gd(1%)/P(MAA) | 24.10 | 4.05 | 1.05 |
| MSN/HA-Eu(2%)-Gd(1%)/DOX | 17.20 | 2.13 | 1.15 |
| MSN/HA-Eu(2%)-Gd(1%)/P(MAA)/DOX | 31.93 | 4.19 | 1.53 |
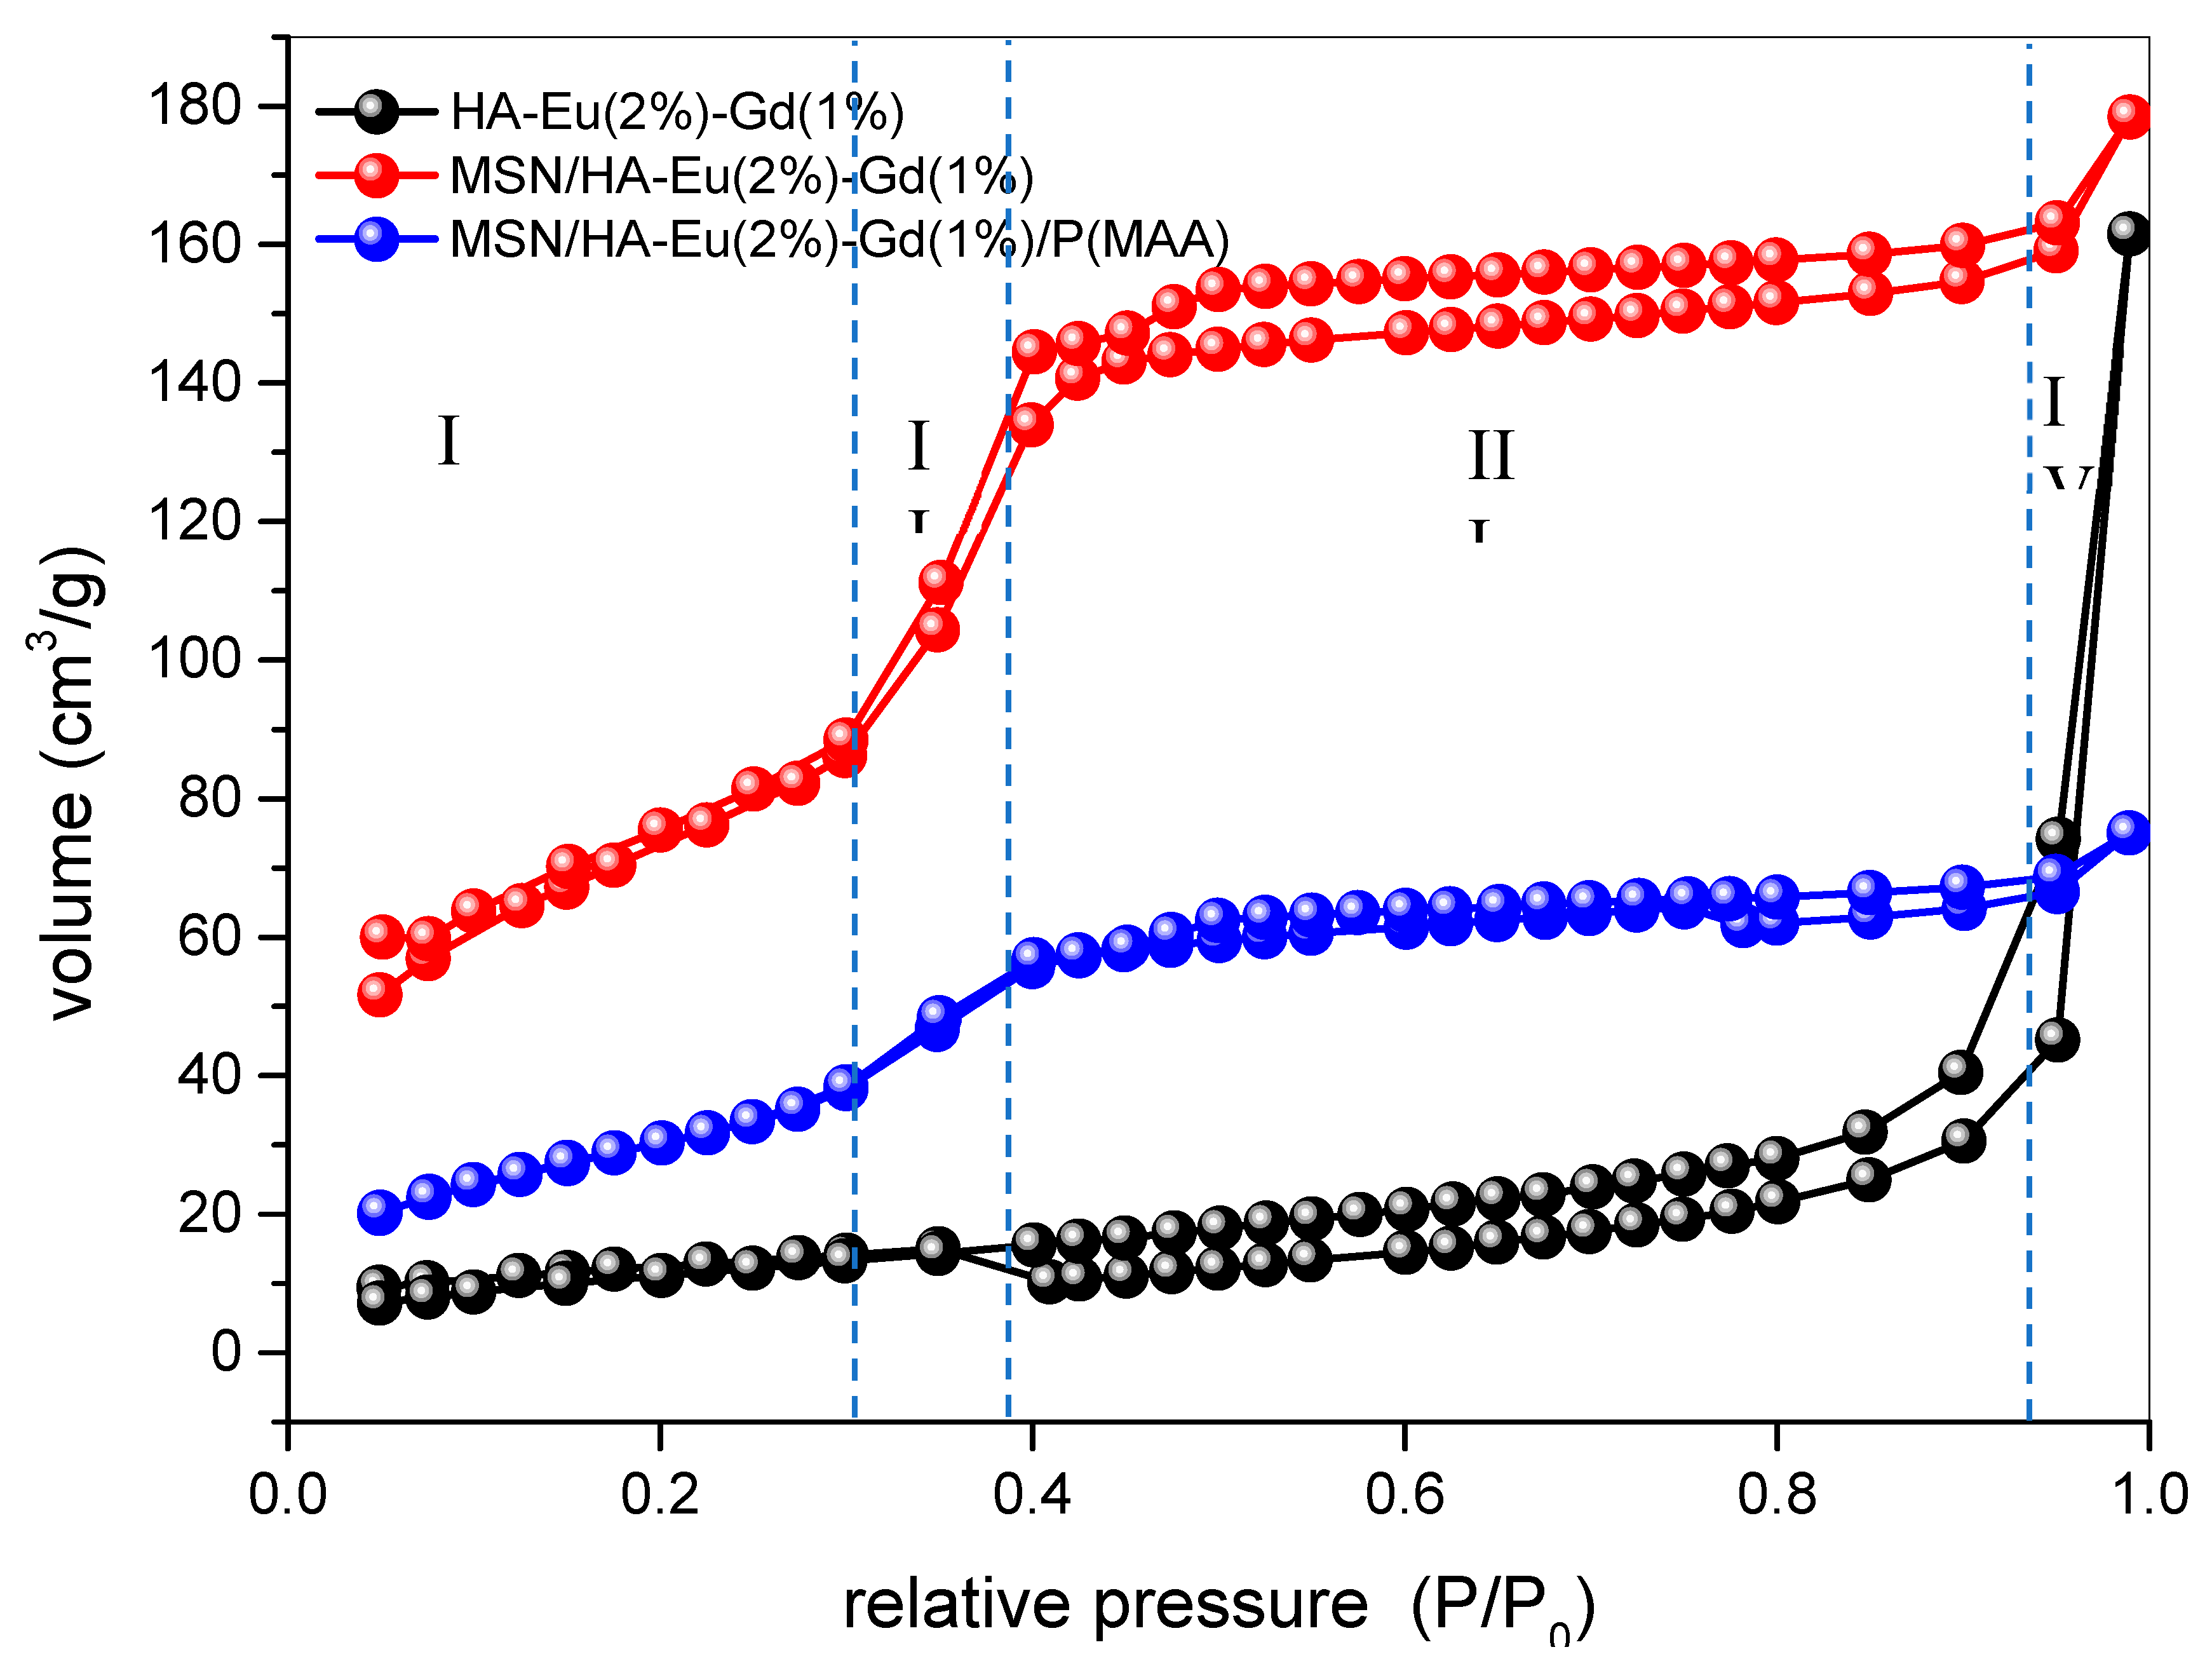
| Sample | SBET (m2.g−1) | Vp (cc3.g−1) | Dp (nm) |
|---|---|---|---|
| HA-Eu(2%)-Gd(1%) | 43 | 0.106 | 3.7 |
| MSN/HA-Eu(2%)-Gd(1%) | 289 | 0.167 | 3.1 |
| MSN/HA-Eu(2%)-Gd(1%)/P(MAA) | 120 | 0.060 | 3.1 |
| Samples | Region | n | k | R2 | release mechanism | |
|---|---|---|---|---|---|---|
| pH 5 | MSN/HA-Eu(2%)-Gd(1%)/DOX | (I) | 2.41 | 2.96 | 1 | Super-Case II |
| (II) | 1.71 | 0.91 | 0.996 | Super-Case II | ||
| (III) | 0.46 | 3.50 | 0.984 | Fickian diffusion | ||
| MSN/HA-Eu(2%) Gd(1%)/P(MAA)/DOX | (I) | 0.72 | 6.93 | 0.995 | non-fickian diffusion | |
| (II) | 0.47 | 9.02 | 0.991 | Fickian diffusion | ||
| (III) | 0.22 | 13.2 | 0.999 | Fickian diffusion | ||
| pH 7 | MSN/HA-Eu(2%)-Gd(1%)/DOX | (I) | 0.79 | 0.36 | 1 | non-fickian diffusion |
| (II) | 0.96 | 0.37 | 0.972 | non-fickian diffusion | ||
| MSN/HA-Eu(2%) Gd(1%)/P(MAA)/DOX | (I) | 0.04 | 1.24 | 1 | Fickian diffusion | |
| (II) | 0.28 | 0.41 | 1 | Fickian diffusion | ||
Disclaimer/Publisher’s Note: The statements, opinions and data contained in all publications are solely those of the individual author(s) and contributor(s) and not of MDPI and/or the editor(s). MDPI and/or the editor(s) disclaim responsibility for any injury to people or property resulting from any ideas, methods, instructions or products referred to in the content. |
© 2023 by the authors. Licensee MDPI, Basel, Switzerland. This article is an open access article distributed under the terms and conditions of the Creative Commons Attribution (CC BY) license (http://creativecommons.org/licenses/by/4.0/).


