1. Introduction
High-efficiency organic luminescent materials have been widely used in many fields, such as electronic devices1-3, chemical sensing4-6, phototherapy7-9, bioimaging10-13. However, these conventional efficient organic luminescent materials are usually prepared by C-C coupling, C-N coupling or other reactions between aromatic units, which not only require expensive noble metal catalysts, but also harsh synthesis conditions14. In addition to the high biotoxicity of aromatic compounds, fused ring aromatic compounds may endanger human health and pollute the environment15. In recent years, organic luminescent materials without aromatic units with good biosafety that exhibit bright emission in the aggregated state or at high concentrations have attracted increasing attentions16-22, known as clustering-triggered emission (CTE), and currently reported materials with CTE characteristics are cellulose23, 24, poly(amido) poly(amidoamine) (PAMAM) dendrimers25, hyperbranched and linear polyethylenimines26, hyperbranched poly(amido), polyacrylonitrile27, poly-L-aspartic acid28, non-aromatic amino acids19, hyperbranched polysiloxanes29-31, cyanoacetic acid32, etc., which are rich in hydroxyl, amino, carboxyl, carbonyl and heteroatoms in their chemical structures. The CTE mechanism assumes that the intramolecular or intermolecular short interactions of nonconventional luminophores in high concentration or solid states make the electron cloud more evenly distributed in the whole system to form space conjugation effect, which expands the degree of conjugation of the system and realizes the CTE phenomenon.17
However, many reported nonconventional luminescent materials (NLMs) show bright luminescence only at high concentrations or in solid-states, and high concentration will make cells lose water and die in cell imaging, and limit their further applications. Thus, it is urgent to develop novel NLMs compounds with high photoluminescence efficiency (Φ) in dilute solutions. Up to now, few papers have sporadically reported the phenomenon of effective luminescence of NLMs in dilute solutions, and their studies rely on quantum chemical principles based on static isolated systems, which do not truly reflect the real state of the solution system. In addition, quantum chemistry can only study isolated systems of one or two hundred atoms, and it is not able to study all atoms for polymeric systems.
According to the CTE mechanism, strengthening intramolecular through-space conjugation effect by intramolecular or intermolecular interactions can achieve significant fluorescence or phosphorescence emission of NLMs at high concentration or solid-states. Therefore, there are two ways to improve the luminescence efficiency of NLMs in the solution states. First, enhancing the intramolecular or intermolecular interactions, and this method can achieve a luminescence efficiency of 59.8% for NLMs in dilute solutions (2 × 10⁻⁵ mol/L)33. However, enhancing the strength of hydrogen bonds in dilute solutions is difficult, in addition to choosing a reasonable functional group of NLMs, the interactions between the functional groups of NLMs in solution should be considered. The second approach is to increase the number of hydrogen bond and other short interaction (≤ 3.5 Å). The hydrogen bonds strength for the first approach can be calculated using quantum chemical methods, while the number of short interaction and hydrogen bond in second approach can be obtained quickly using molecular dynamics (MD) calculations.
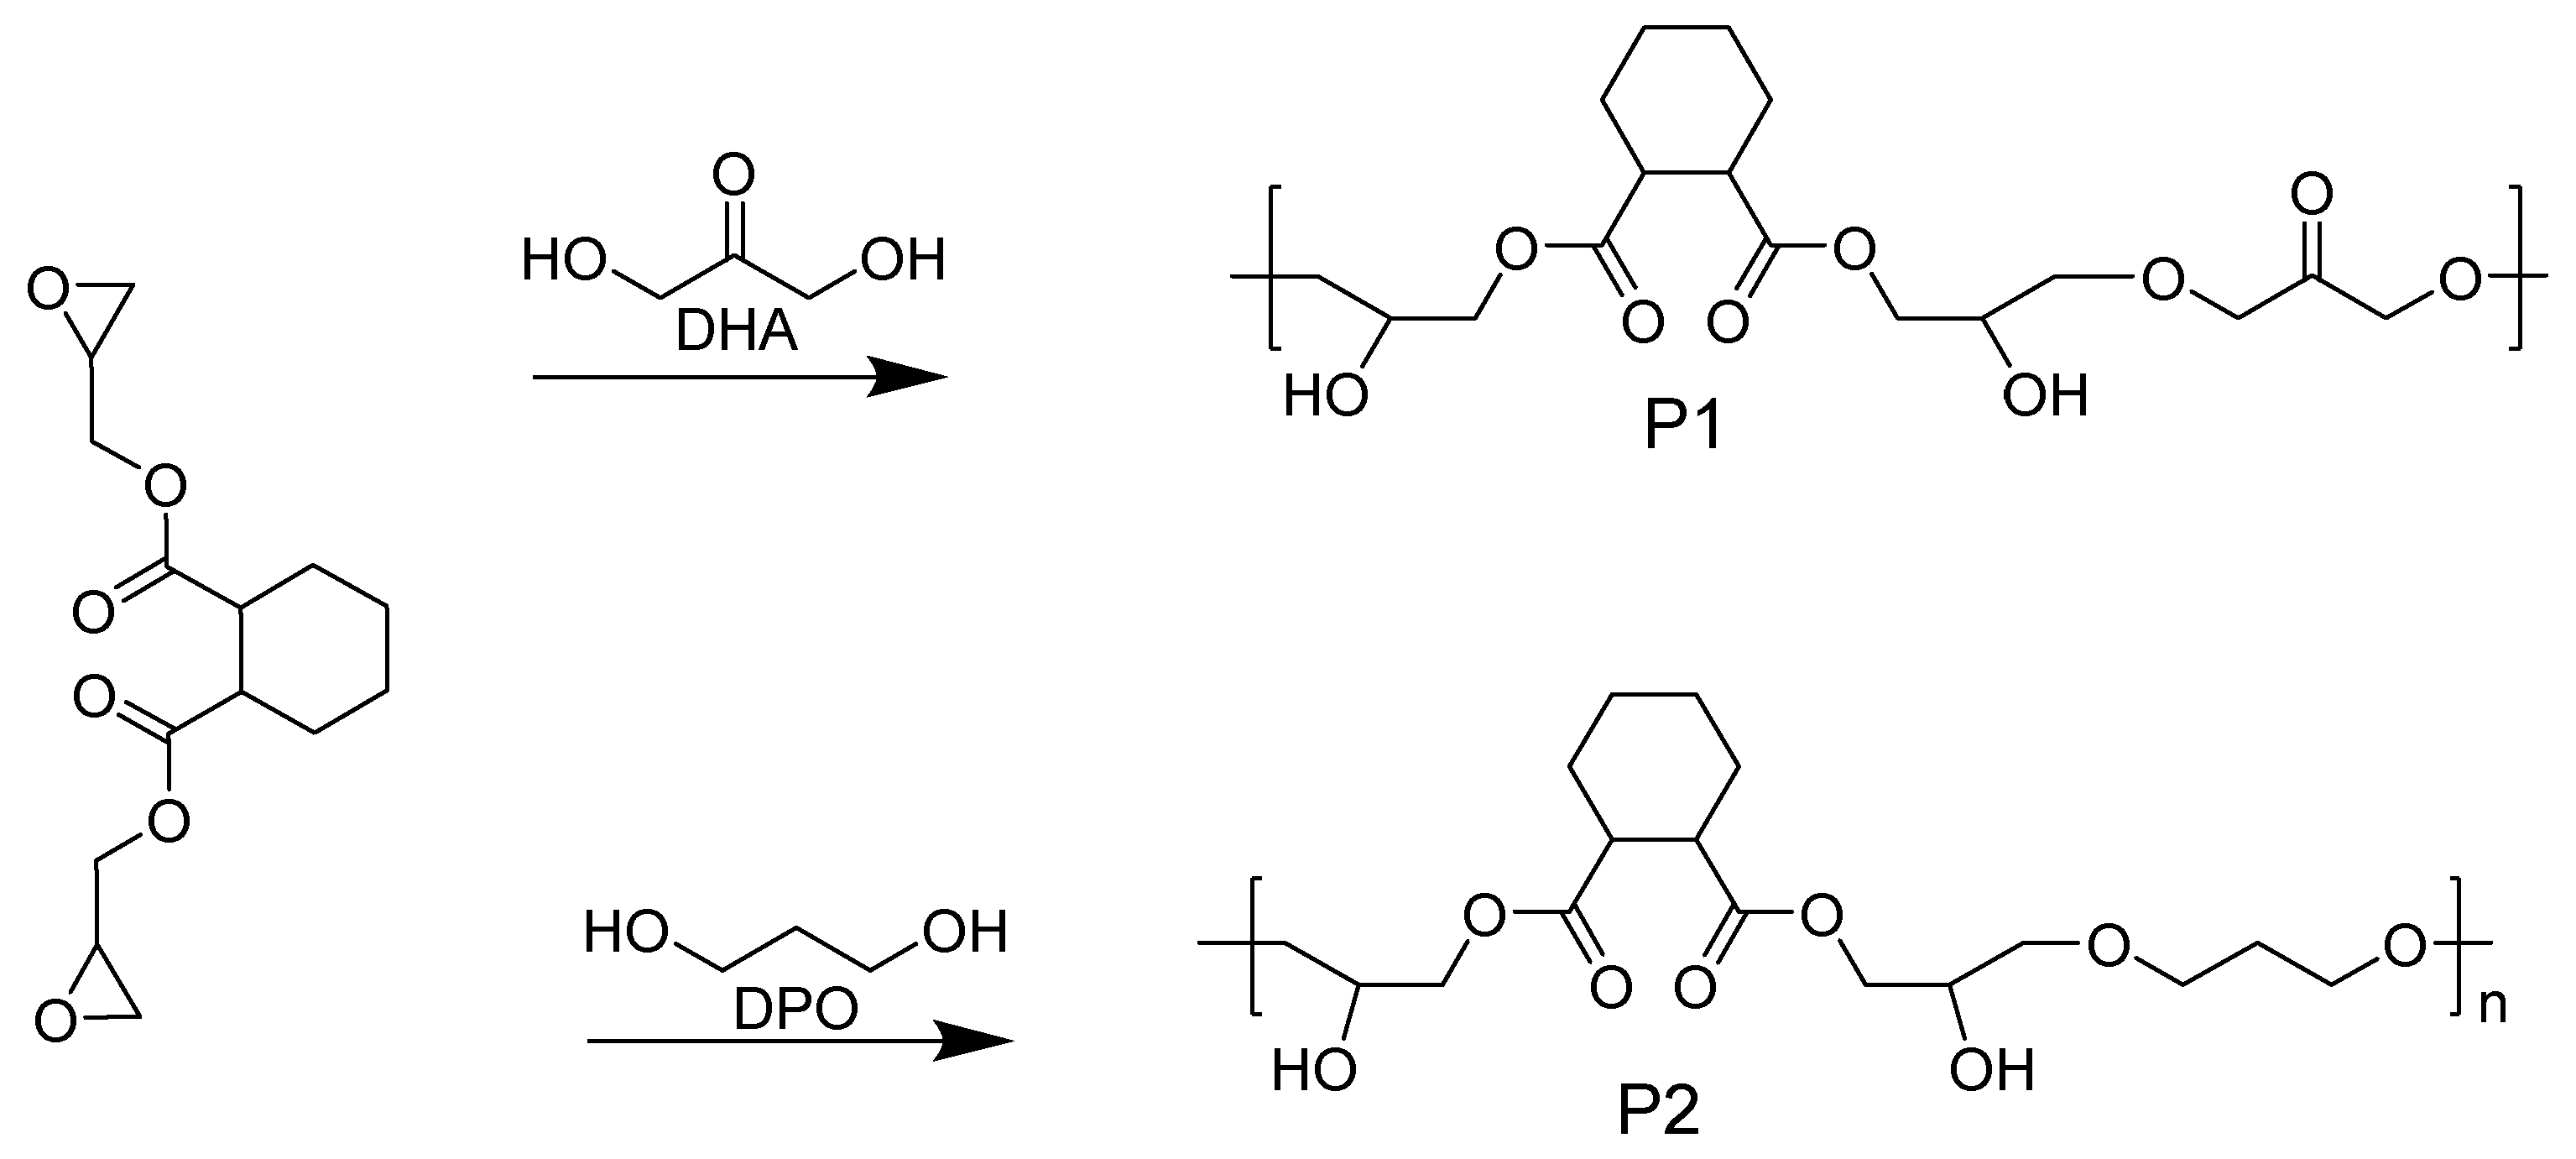
In order to gain insight into the experimental phenomenon of enhanced luminous intensity for NLMs with increasing concentration in solution, and verify whether dynamic hydrogen bonds engineering can construct NLMs with efficient properties in dilute solutions, diglycidyl 1,2-cyclohexanedicarboxylate (DCD) was used to synthesize polymers P1 and P2 by ring-opening reactions with 1,3-dihydroxyacetone (DHA) and 1,3-Propanediol (PDO), respectively (
Figure 1). The effects of the concentration, the number of hydrogen bond donors/acceptors and short interaction on their optical properties in dilutes solutions were investigated by experiments and MD simulations. The results showed that the fluorescence emission/excitation wavelengths of P1 and P2 were 480/400 nm and 420/350 nm, respectively, and the fluorescence quantum yield of P1 polymer reached 8.9% at the concentration of 0.1 mg/mL solution, while P2 was essentially non-emissive at the same concentration. MD simulations show that P1 has more intra- or intermolecular hydrogen bonds donors/acceptors and short interactions than P2 for the same number of polymers repeating units; furthermore, increasing the concentration can enhance the number of hydrogen bonds donors/acceptors and short interactions in the system. This work demonstrates that dynamic hydrogen bonds engineering can be used as a semi-empirical method to design more and more novel NLMs that emit efficiently in dilute solutions.
2. Results
2.1. Molecular Dynamics Simulation
In terms of chemical structure, polymer P1 has more typical hydrogen bond acceptors (carbonyl groups) compared with polymer P2. The inconsistency of the hydrogen bond donor/acceptor leads to a significant change in the number of hydrogen bonds and short interactions. MD simulations in water solution at 298.15 K using the Gromacs package34 with the general AMBER force field (GAFF)35 generated by Sobtop36 were performed to elucidate the dynamic hydrogen bonds of both P1 and P2 in solution.
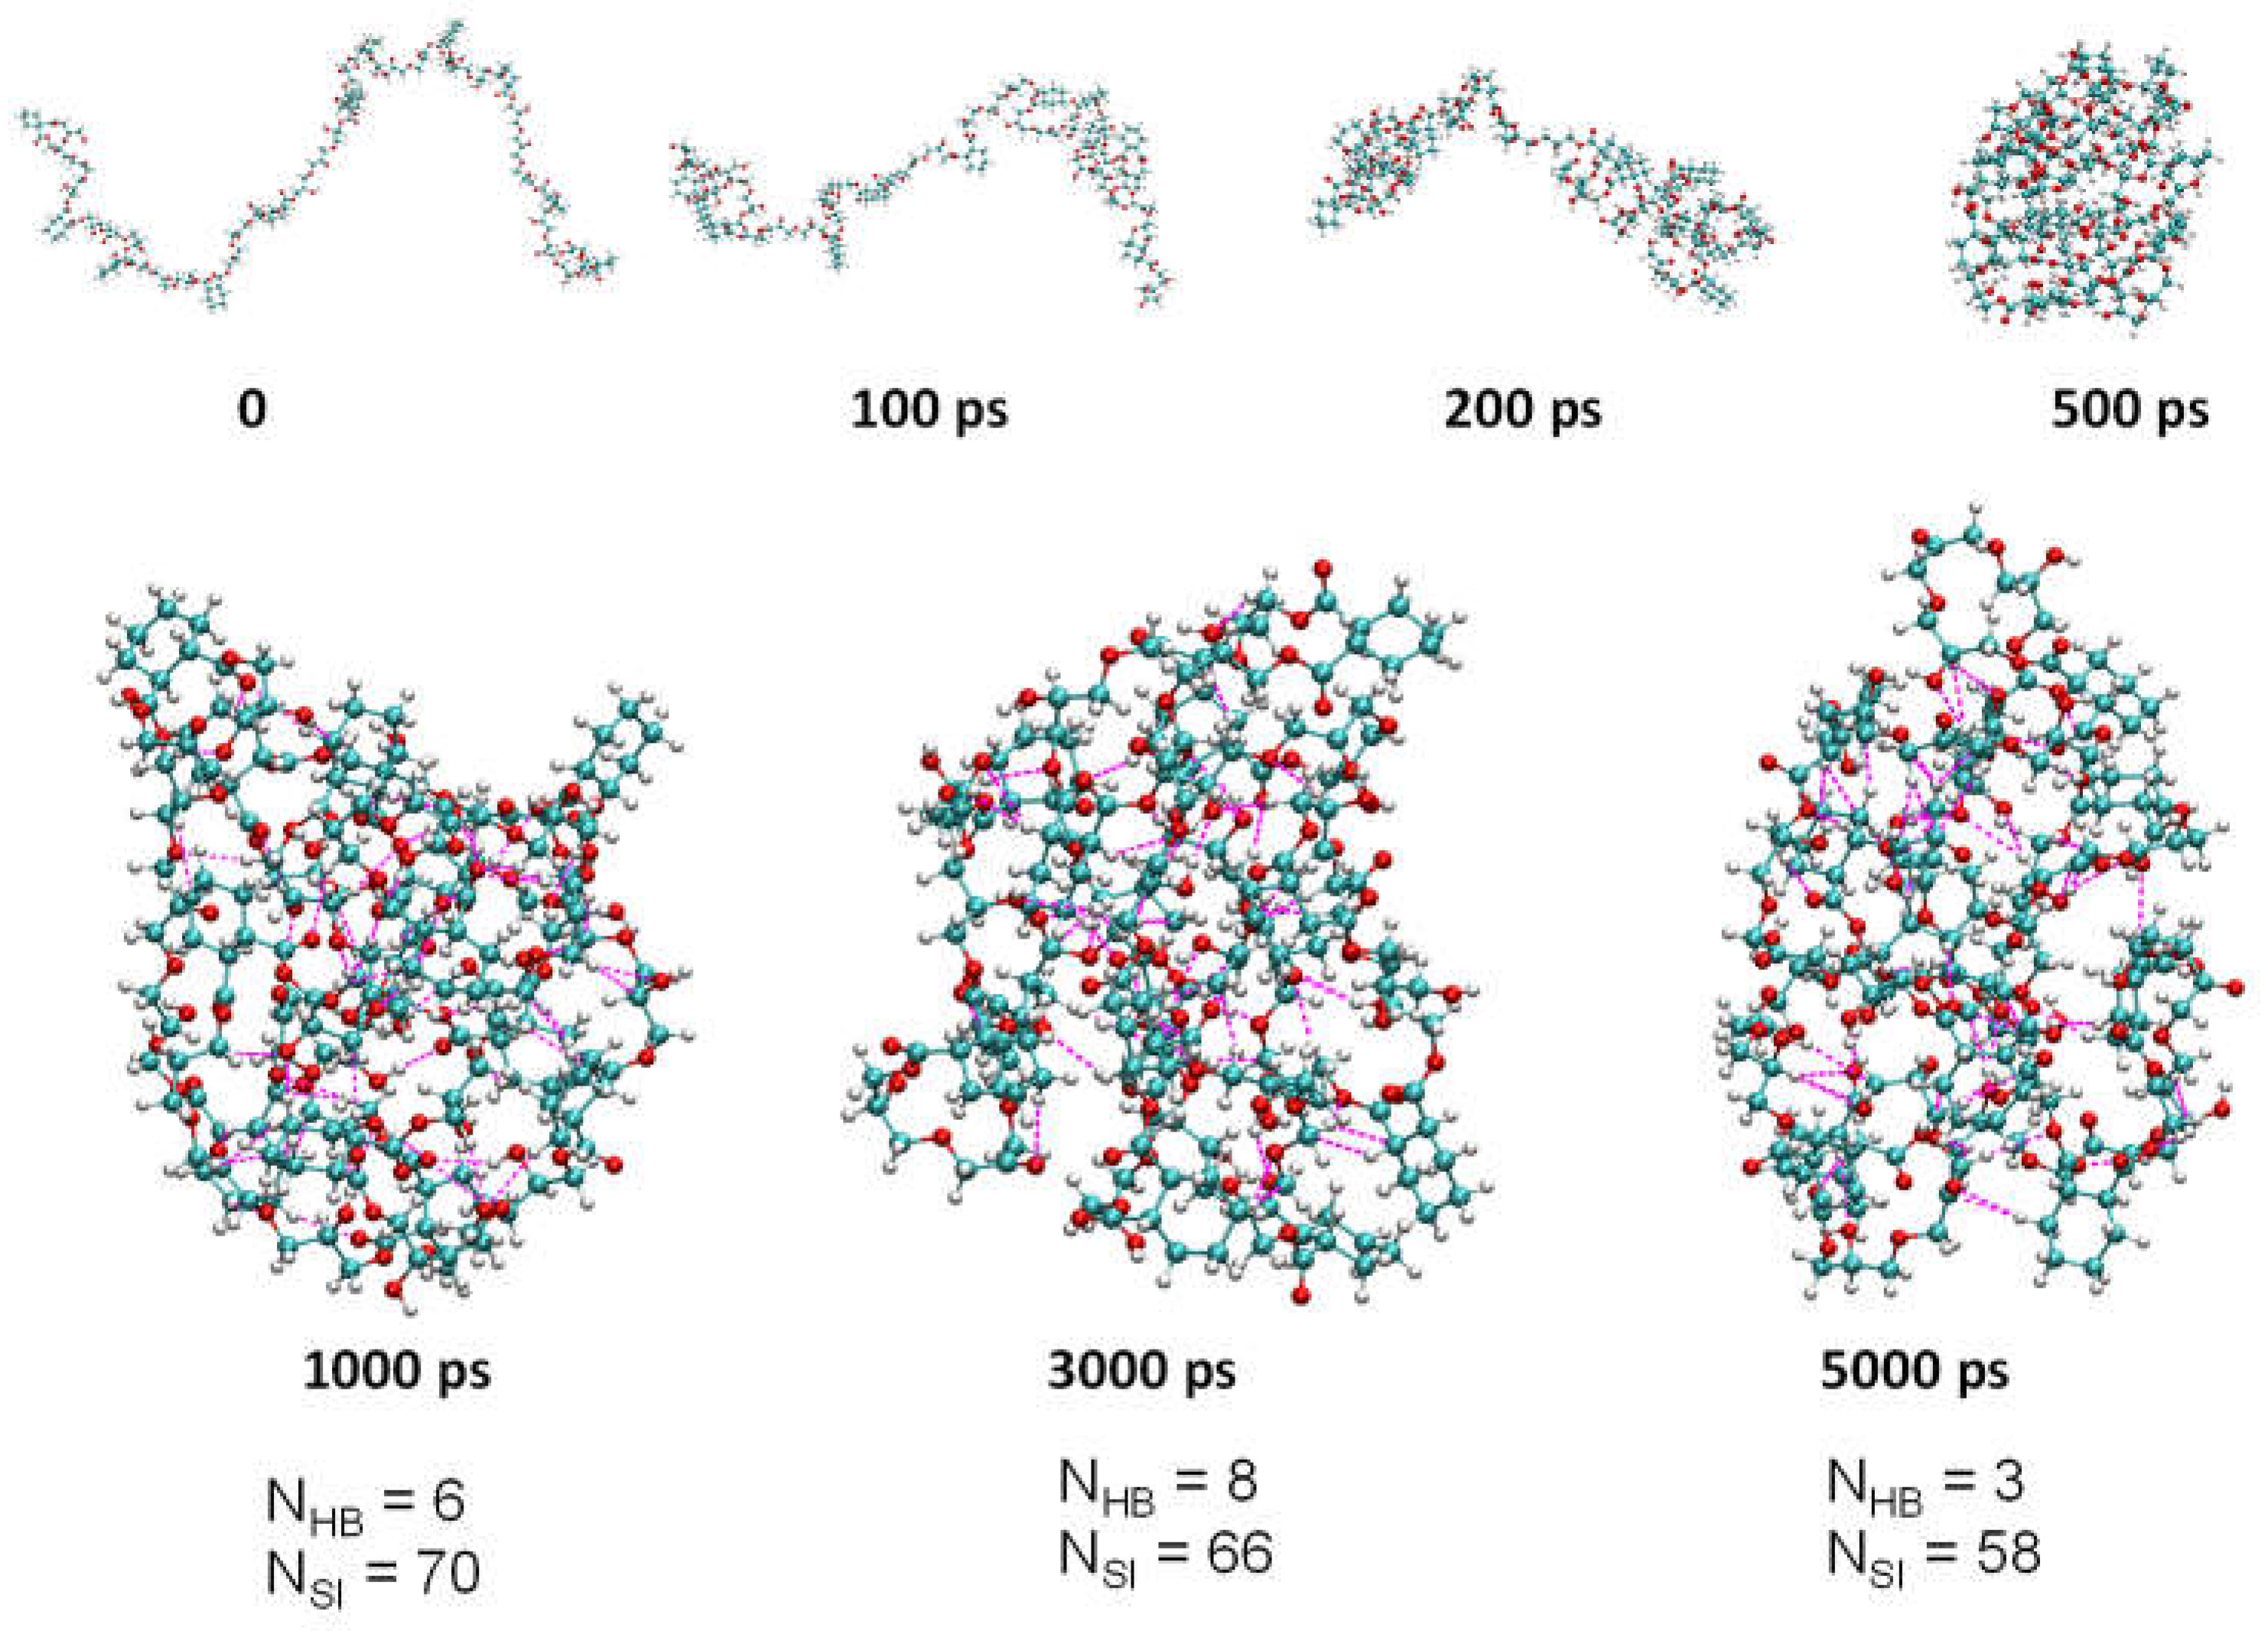
The model polymers were constructed with 11 repeat units for both P1 and P2. MD simulations were performed in a 10 nm × 10 nm ×10 nm cubic water box with 5 ns simulation time. As can be seen from
Figure 1 and
Figure S1, chain-like P1 and P2 forms nanoaggregates in aqueous solution with increasing time, which were stabilized in the aggregated state after 500 ps. Furthermore, the number of hydrogen bonds (N
HB) and short interactions (N
SI) within P1 in aqueous solution varies dynamically at different times (
Figure 2). Therefore, it is not sufficient to study NMLs materials just according to the type of hydrogen bonds and the strength of the hydrogen bonds to, and it is necessary to examine the dynamics of hydrogen bonds (including short interactions). It is worth noting that as the polymer content (amount) increases, the polymer is able to form large aggregates in the solution as shown in
Figure S2, which is consistent with many experimental phenomena reported in the literatures where the particle size of NLMs increases with the increasing concentration.
The lifetime of a hydrogen bond (τ
HB) is one of the most important parameters for the dynamic hydrogen bonds, which is the time from initial formation to complete rupture of a hydrogen bond under specific conditions and can be attributed to the formation and rupture of hydrogen bonds, which can be calculated by averaging the autocorrelation functions (either 0 or 1) of all H-bonds according to the previous literatures
37. The τ
HB for P1 and P2 in water solution are 1.5 and 1.6 ps, respectively; the almost identical values of the lifetimes indicate that they are influenced by the type of hydrogen bond donors and hydrogen bond acceptors. The number of donors
/ acceptors of hydrogen bonds is closely related to the chemical structure of the polymer, which are 24/100, and 24/89 for P1 and P2, respectively. The P1 of polymer repeat unit has a typical hydrogen bond acceptor (C=O) compared with the P2 polymer repeat unit. Thus, P1 have more hydrogen bond acceptors than P2. As shown in
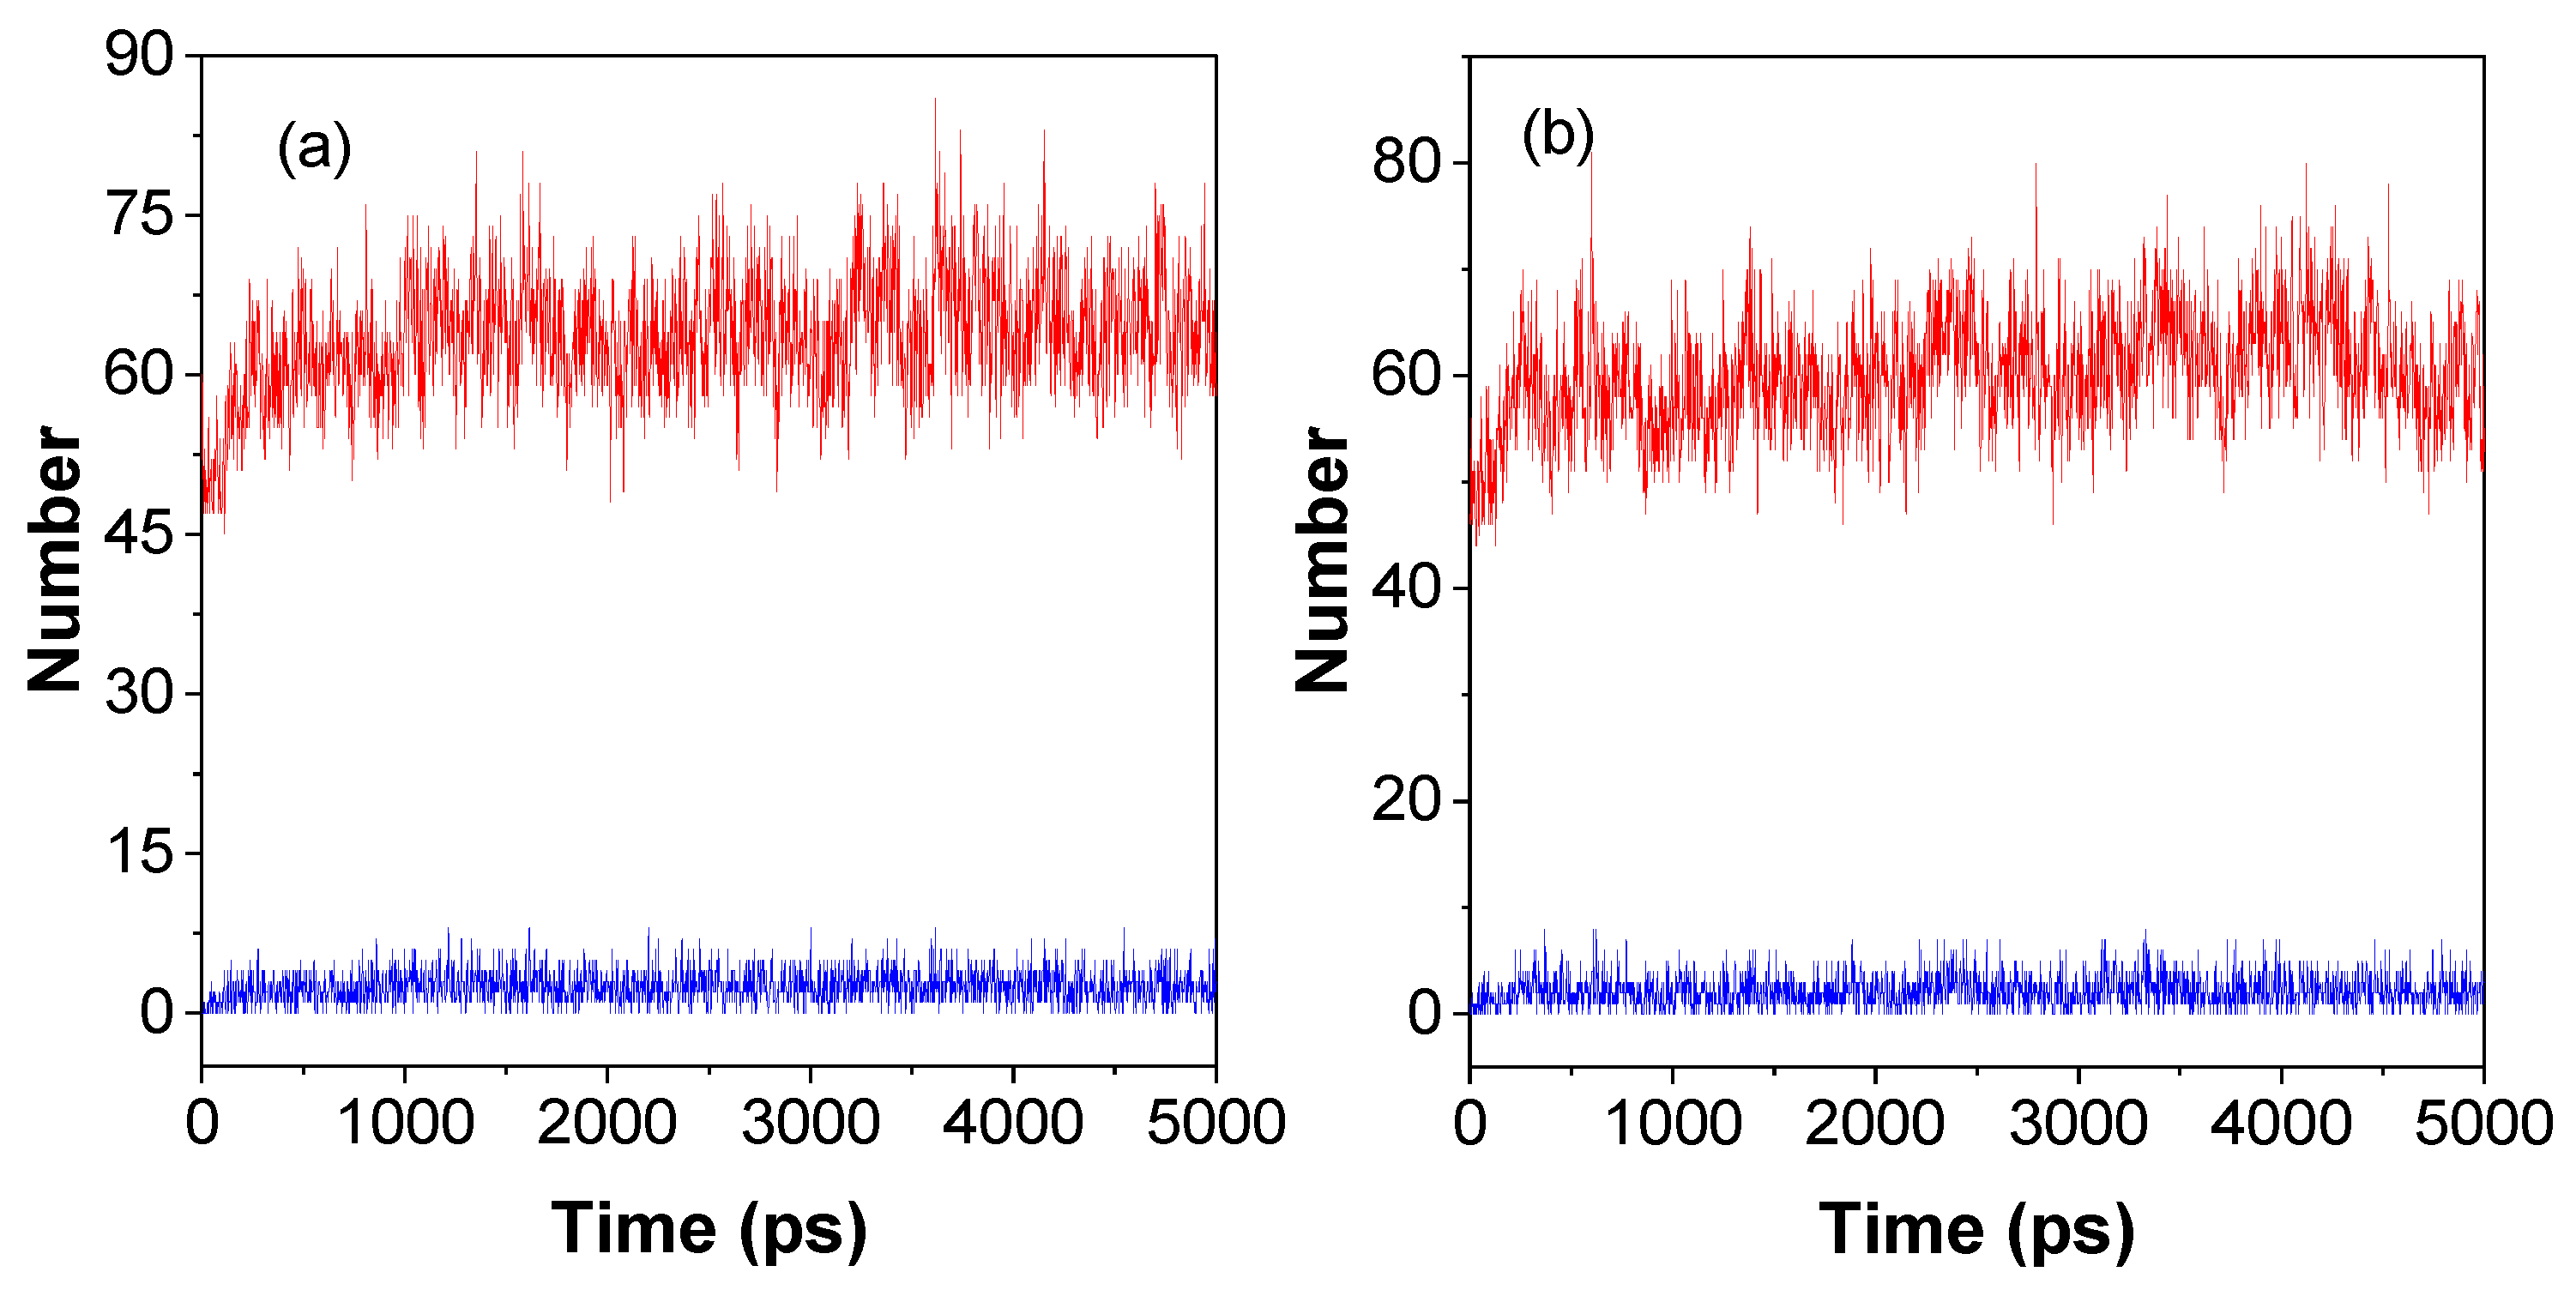
Figure 3, the number of hydrogen bonds and the number of short interactions increase with time from 0 to 500 ps due to the gradual aggregation of the polymer from chains to nanoclusters (
Figure 2). Then the number of hydrogen bonds and short interactions change dynamically with time. The average number of intra-molecular hydrogen bonds / short interactions (N
HB/N
SI) within a molecule from 1000 ps to 5000 ps for P1 and P2 is 3/65 and 2/61, respectively. These results indicated that P1 can form more hydrogen bonds and short interactions than P2 in the solution state, which suggests that P1 is more conducive to restrict molecular motion, reduce non-radiative transitions, and enhance luminescence compared with P2. Moreover, according to the mechanism of cluster-trigged emission, more hydrogen bonds and short interactions can enhance the through space conjugation effect and enable NLMs to luminesce effectively in solution.
2.2. Synthesis
MD simulations show that P1 has a higher number of intra/intermolecular hydrogen bonds and shorter interactions compared with P2 in a 1000 nm
3 water box. To examine the effect of dynamic hydrogen bonds on optical properties of NLMs, polymers P1 and P2 were successfully synthesized and their optical properties were studied. First, P1 and P2 were characterized by fourier transform infrared (FTIR) spectroscopy, gel permeation chromatography (GPC),and nuclear magnetic resonance (NMR). As shown in the FTIR spectra (
Figures S2-S5), the main absorbance bands around 3403 cm
-1 and 2940 cm
-1 can be assigned to asymmetrical stretching vibration of OH and stretching vibrations of C-H, respectively. Besides, the characteristic peak at 1731 cm
-1 correspond to the stretching vibration of -C=O and the characteristic peak at 1126 cm
-1 correspond to the stretching vibration of C-O-C can be obviously observed. The weight average molecular weight (Mw)/number averaged molecular weight (Mn) of P1and P2 are 3755/1715 and 1984/1145 daltons, respectively (
Table S1). The polydispersity index (PDI) is 2.2 and 1.7 respectively. The above results indicate that the molecular weight broadness is in normal range.
2.3. Optical Properties of P1 and P2 in Solution
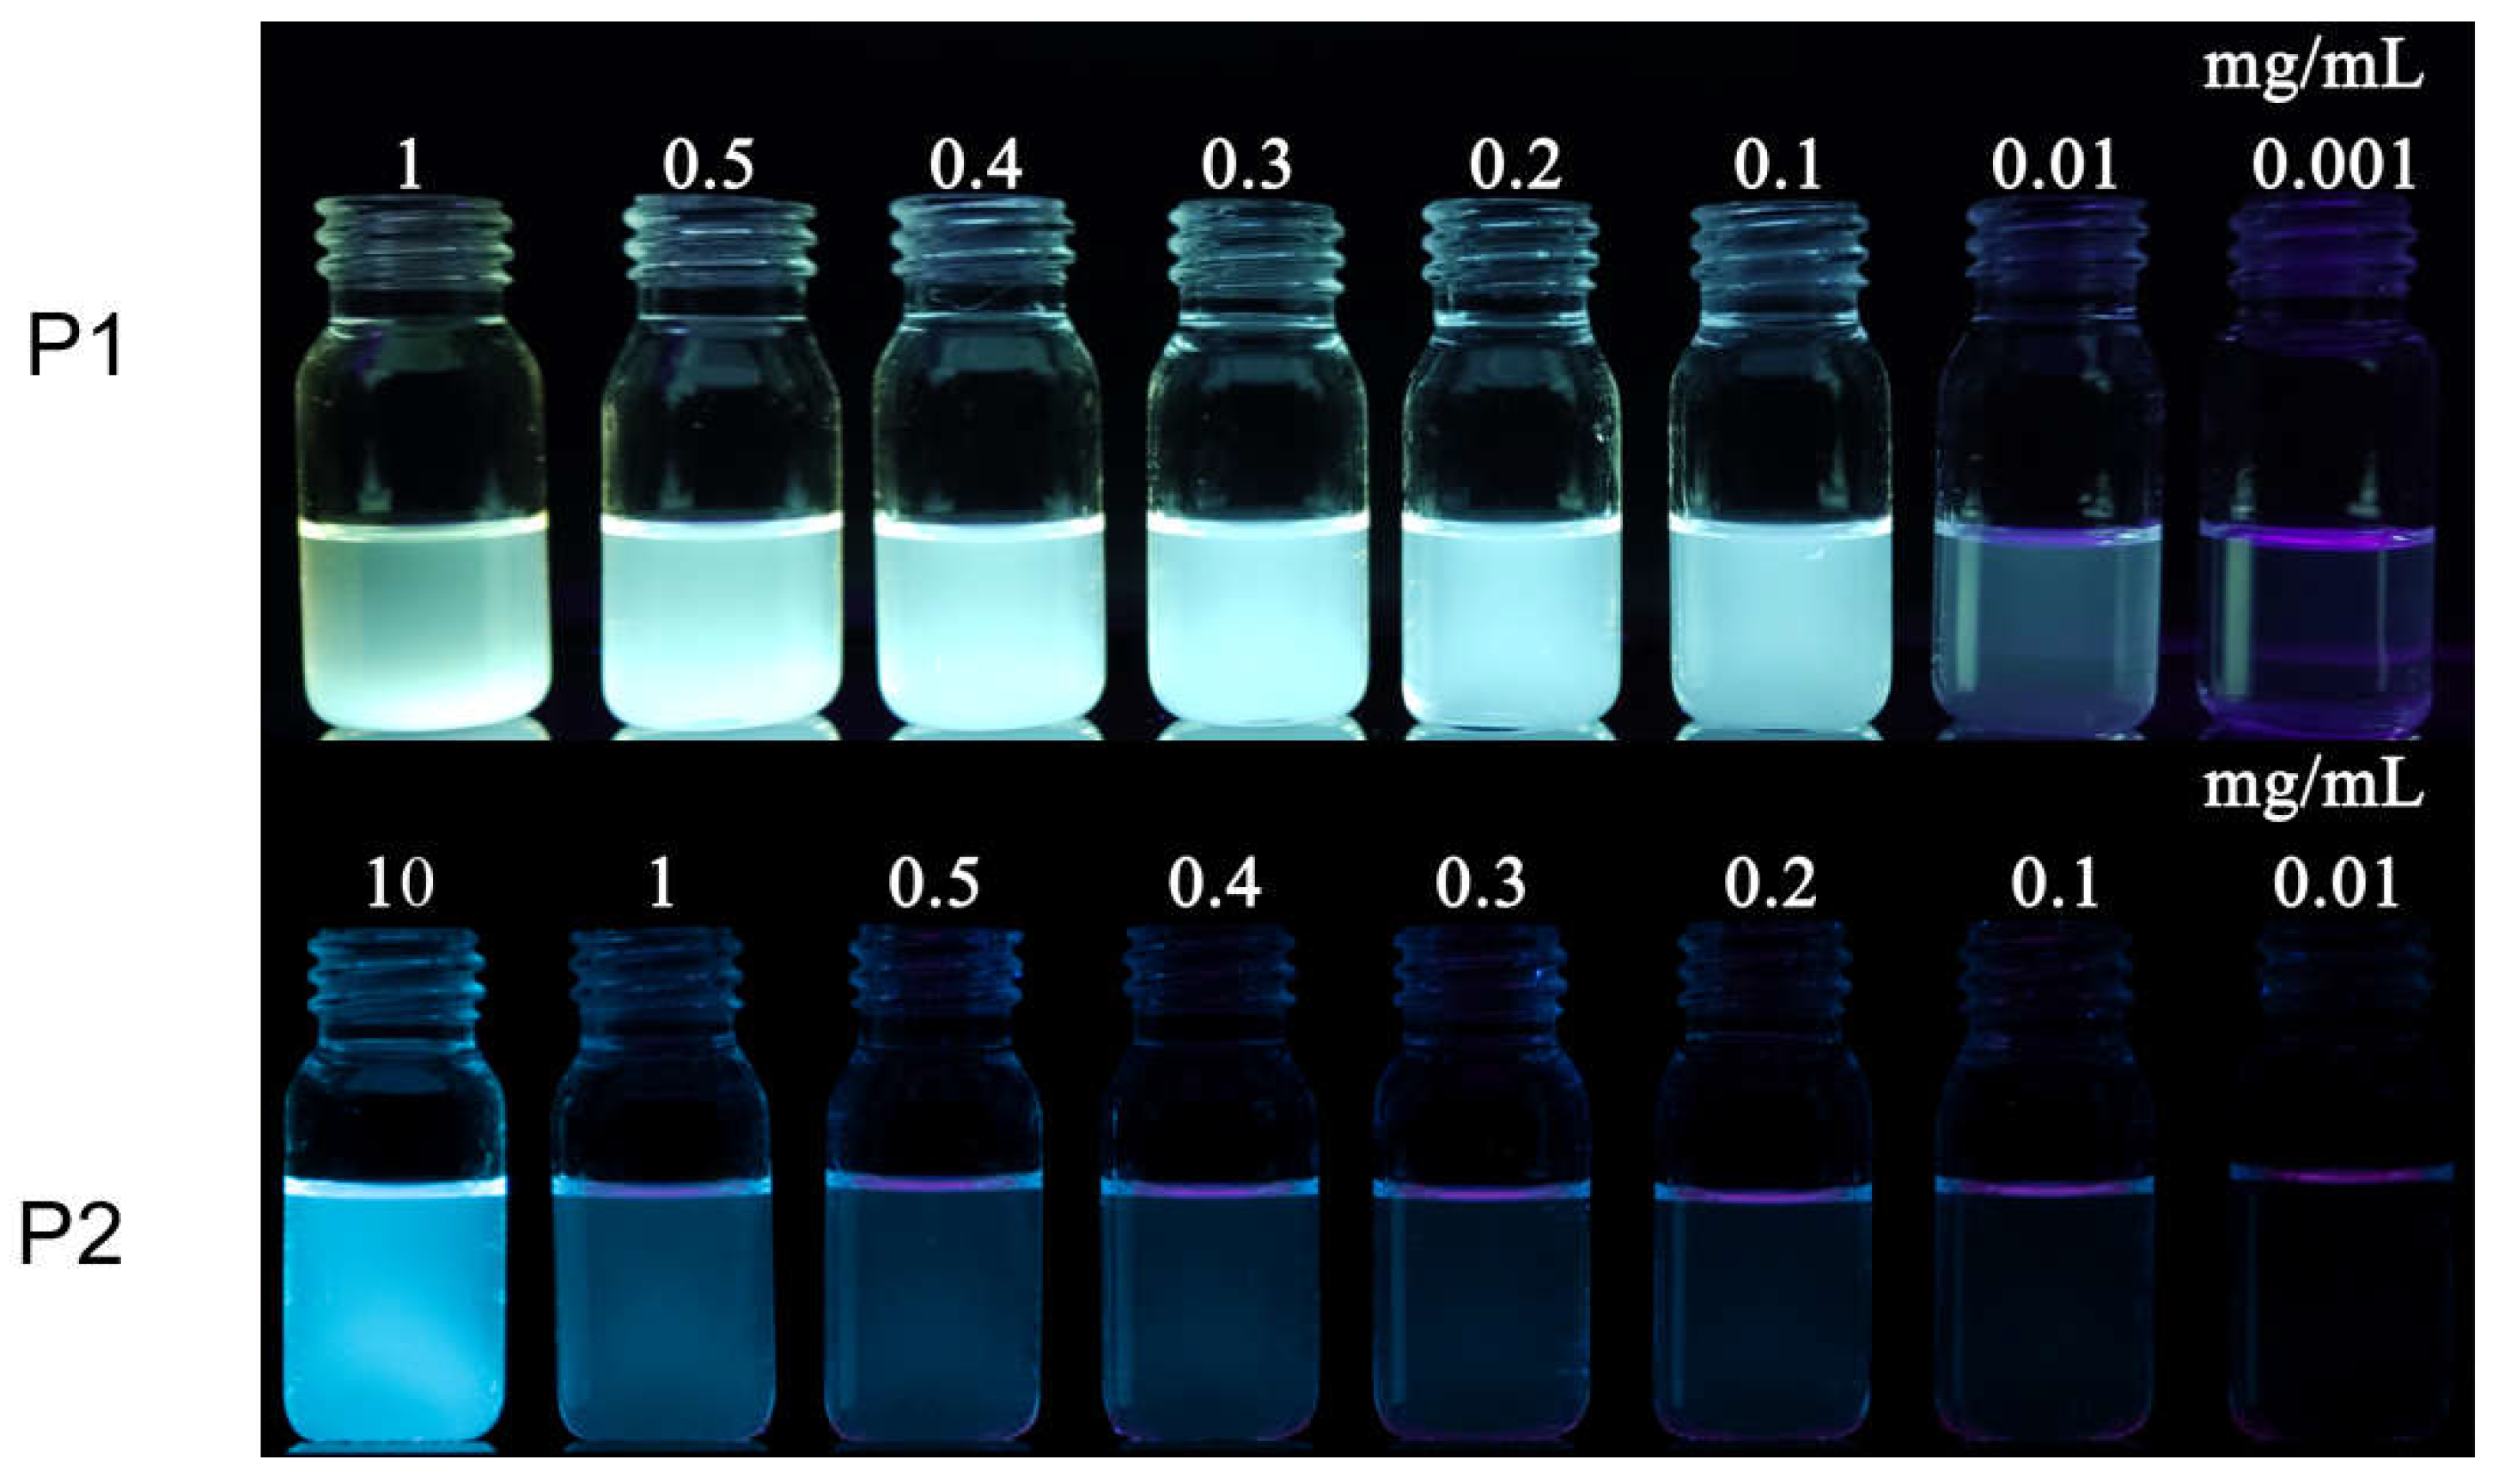
According to many previous reports, NLMs without aromatic conjugated units can only emit light in high-concentrated solutions, while they hardly emit in dilute solutions. As shown in
Figure 4, it was quite unexpected to observe bright blue-green fluorescence emission in dilute solutions (0.1 mg/mL) for P1 under the irradiation of 365 nm UV lamp. However, the solution of P2 emits essentially no fluorescence at the concentration of ≤1.0 mg/mL. Subtle differences in chemical structure exhibit completely different optical properties, so it is worthwhile to investigate the photophysical properties of both P1 and P2 in depth.
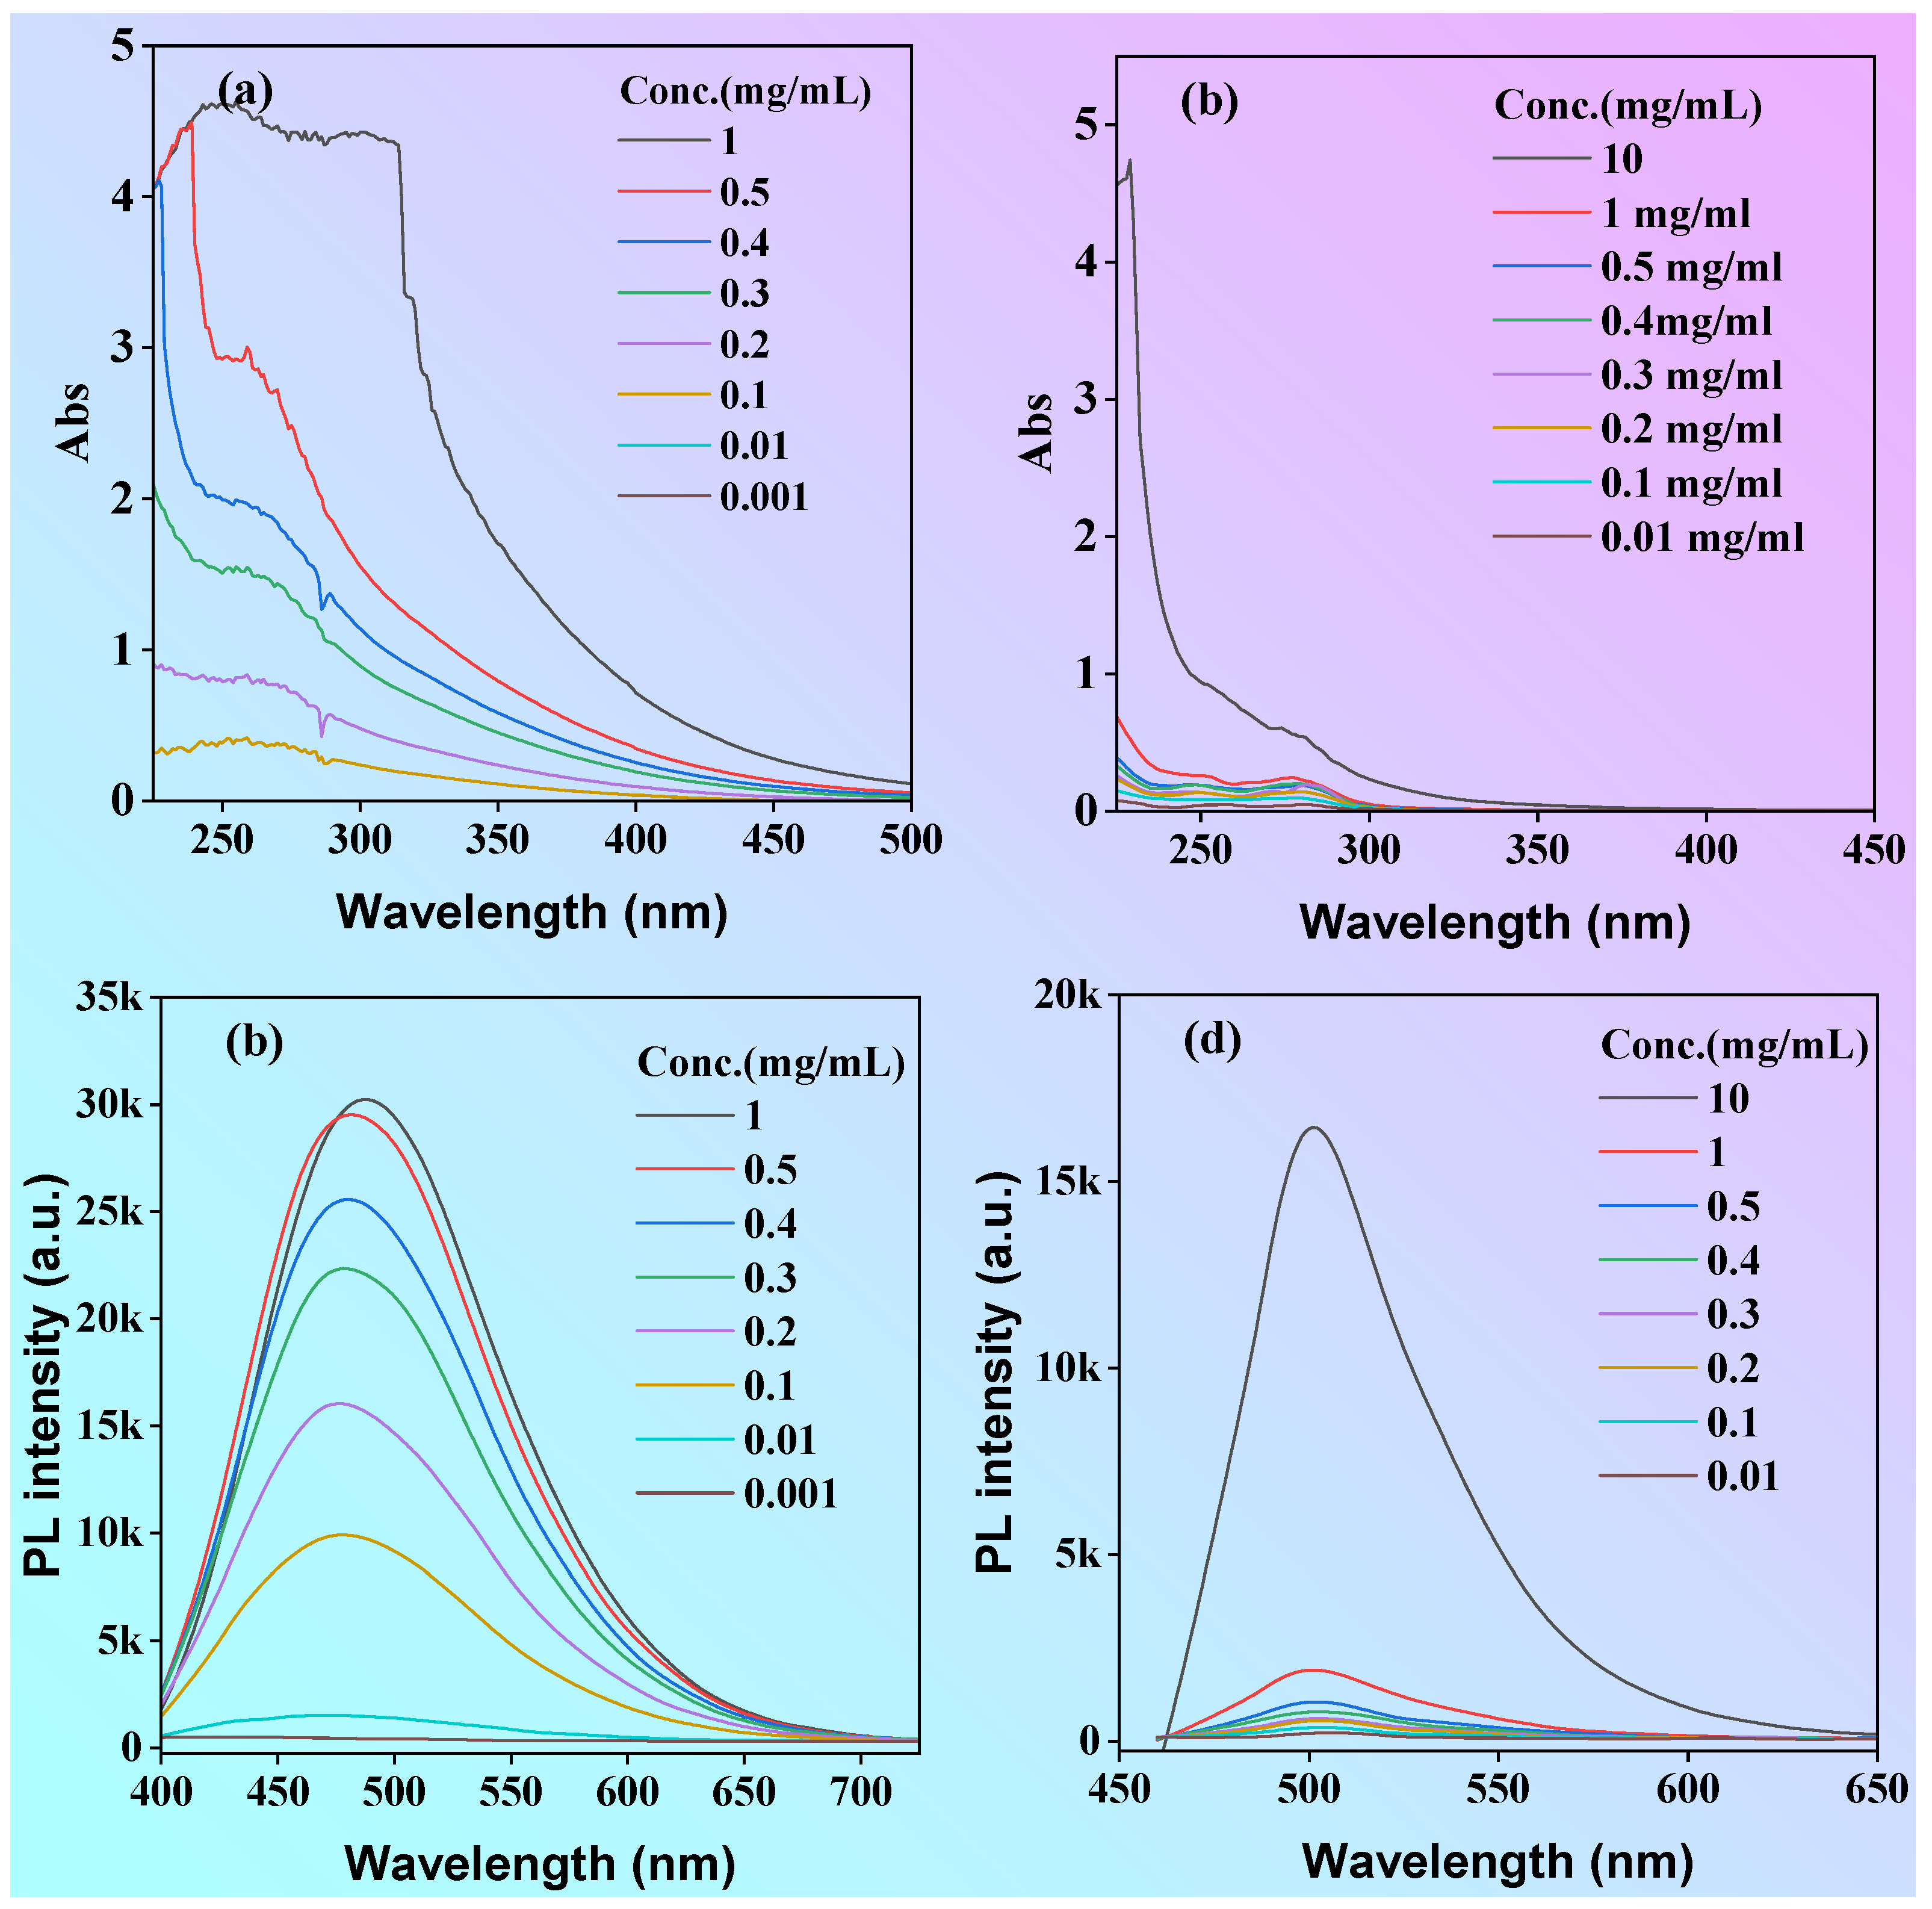
To acquire more insights into the photophysical properties, the absorption and emission sprectra of both P1 and P2 in ethanol solution with different concentrations were investigated as shown in
Figure 5. The absorbance intensity of P1 solution increased significantly with the increase of concentration (
Figure 5a, b), but the absorbance intensity of polymer P2 changed little along with the increase of concentration at <1 mg/mL, but increased significantly when the concentration was up to 10 mg/mL. Due to the polydispersity of the molecular weight of the polymers, we used the mass extinction absorption (L·g
-1·cm
-1) to investigate the magnitude of their light absorption capacity. The mass extinction coefficients for P1 and P2 solutions at a concentration of 1 mg/mL were 4.41 and 0.05 L·g
-1·cm
-1 at the peak of 300 nm, respectively. The mass extinction coefficient of P1 is much greater than that of P2. According to the semi-empirical Equation (1), the (molar) extinction absorption of the solution is proportional to the luminescence efficiency. Therefore, it can be tentatively concluded that P1 has a highluminescence efficiency than P2, which is consistent with the phenomenon shown in the luminescence photographs of P1 and P2 solutions under the UV light (
Figure 2).
where Φ, and εmax are photoluminescence efficiency, and maximum molar extinction coefficient, respectively. In order to qualitatively study the luminescence in solution, the emission spectra of P1 and P2 in solution were examined. As shown in
Figure 5c, the fluorescence emission curve appears to be parallel to the x-axis at concentrations below 0.1 mg/mL, whereas the fluorescence intensity of P1 solution increases significantly when the concentration is above 0.1 mg/mL. Different from P1, the luminescence intensity of P2 is very weak at concentrations less than or equal to 1 mg/mL, and the fluorescence intensity significantly increased until concentrations is greater than 10 mg/mL (
Figure 5d). The relationship between fluorescence intensity and concentration is similar to that of the absorption spectra. The fluorescent quantum yield of P1 and P2 at the concentration of 0.1 mg/mL solutions was 8.9 and 0.6% respectively. According to the results of molecular dynamics studies, compared with P2, the more effective luminescence of P1 in dilute solutions can be attributed to more hydrogen bonds and other short interactions in solution. On the one hand, these interactions can significantly restrict molecular motion to reduce non-radiative transitions and enhance luminescence; on the other hand, expand the degree of conjugation and achieve cluster-triggered visible light emission by through-space conjugation. This result indicates that P1 is a promising candidate for application in cellular imaging.
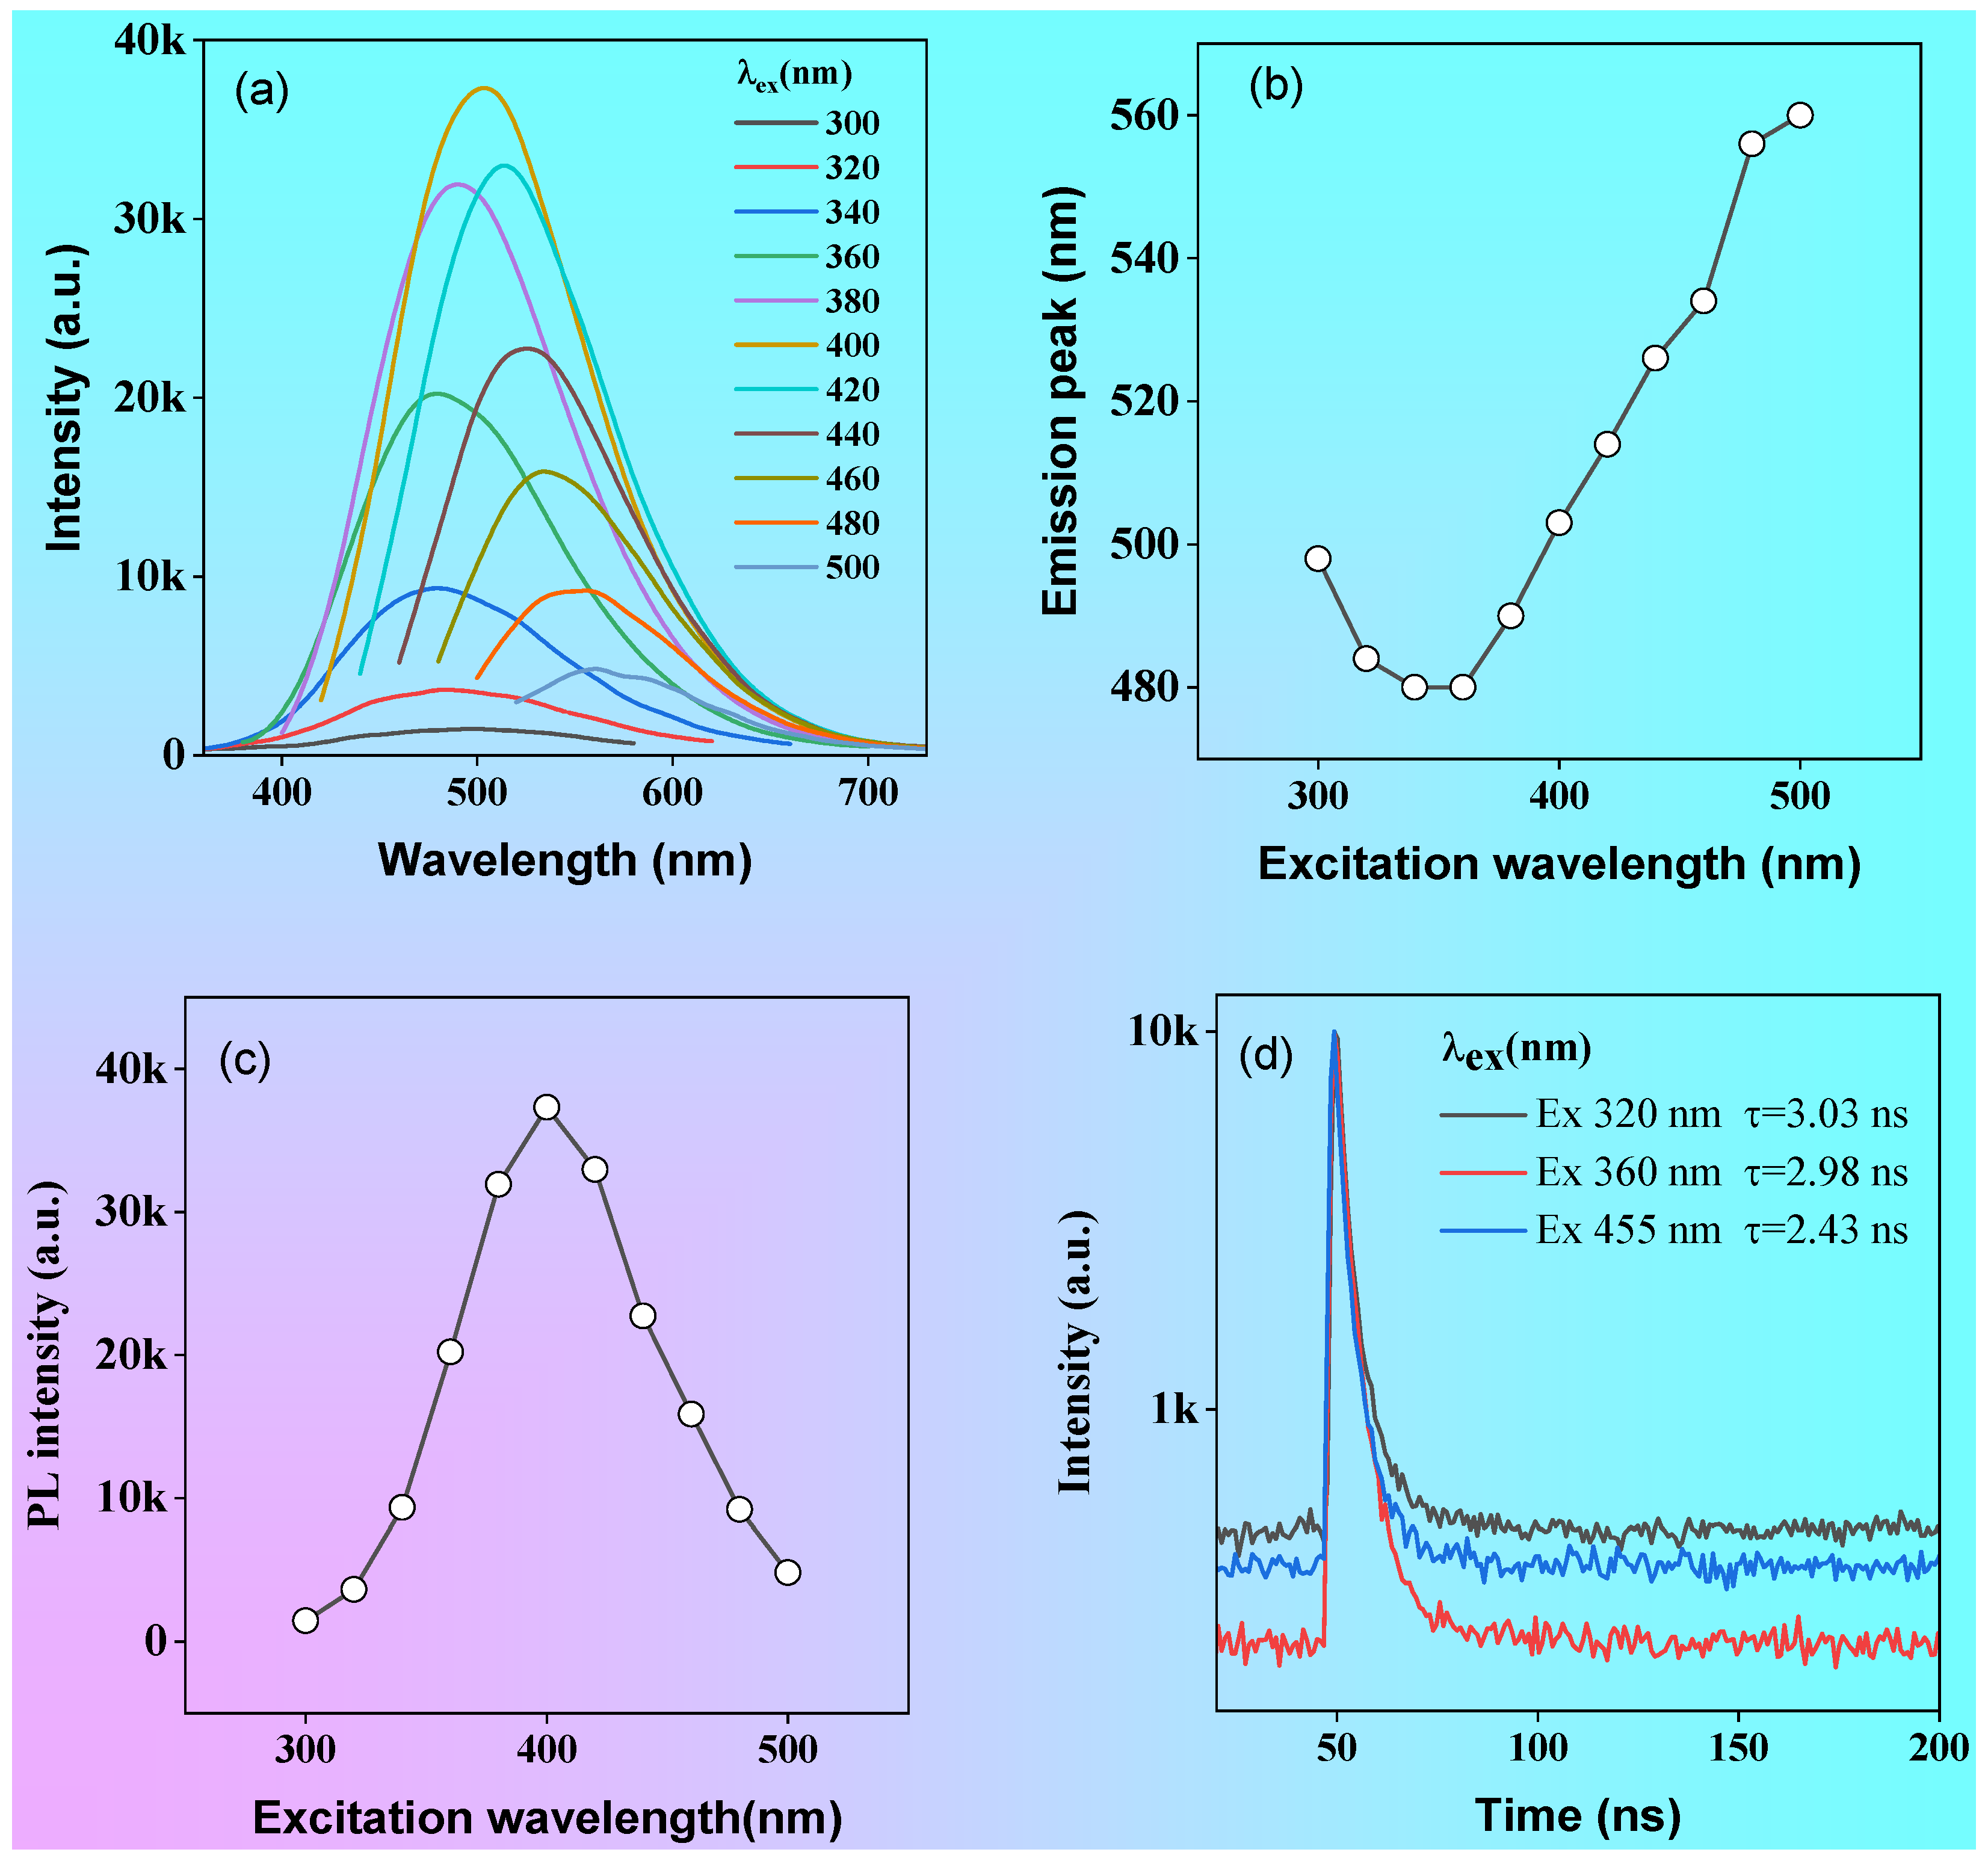
The emission spectra of P1 solution under different excitation wavelength are shown in
Figure 4a. As the excitation wavelength changed from 300 to 340 nm, the fluorescence emission peak showed blue-shift from 520 to 509 nm, but when excitation wavelength was greater than 360 nm, the fluorescence emission peak exhibited gradually red-shift as the excitation wavelength increased (
Figure 6b). In addition, the fluorescence emission intensity exhibited excitation wavelength-dependent properties (
Figure 6c).
The fluorescence intensity increases with the increase of the excitation wavelength when the excitation wavelength is less than 400 nm, but gradually decreases with the increase of the excitation wavelength when the excitation wavelength is greater than 400 nm (
Figure 6c). Furthermore, the fluorescence lifetimes of P1 vary obviously at different excitation wavelengths (
Figure 6d), which are 3.03, 2.98 and 2.43 ns for 320, 360 and 455 nm picosec laser excitation, respectively. The diversity of fluorescence intensity, emission peak and fluorescence lifetime for polymer P1 at different excitation wavelengths indicated an excitation wavelength dependence of their optical properties, which can be attributed to the formation of different excitons in solution.
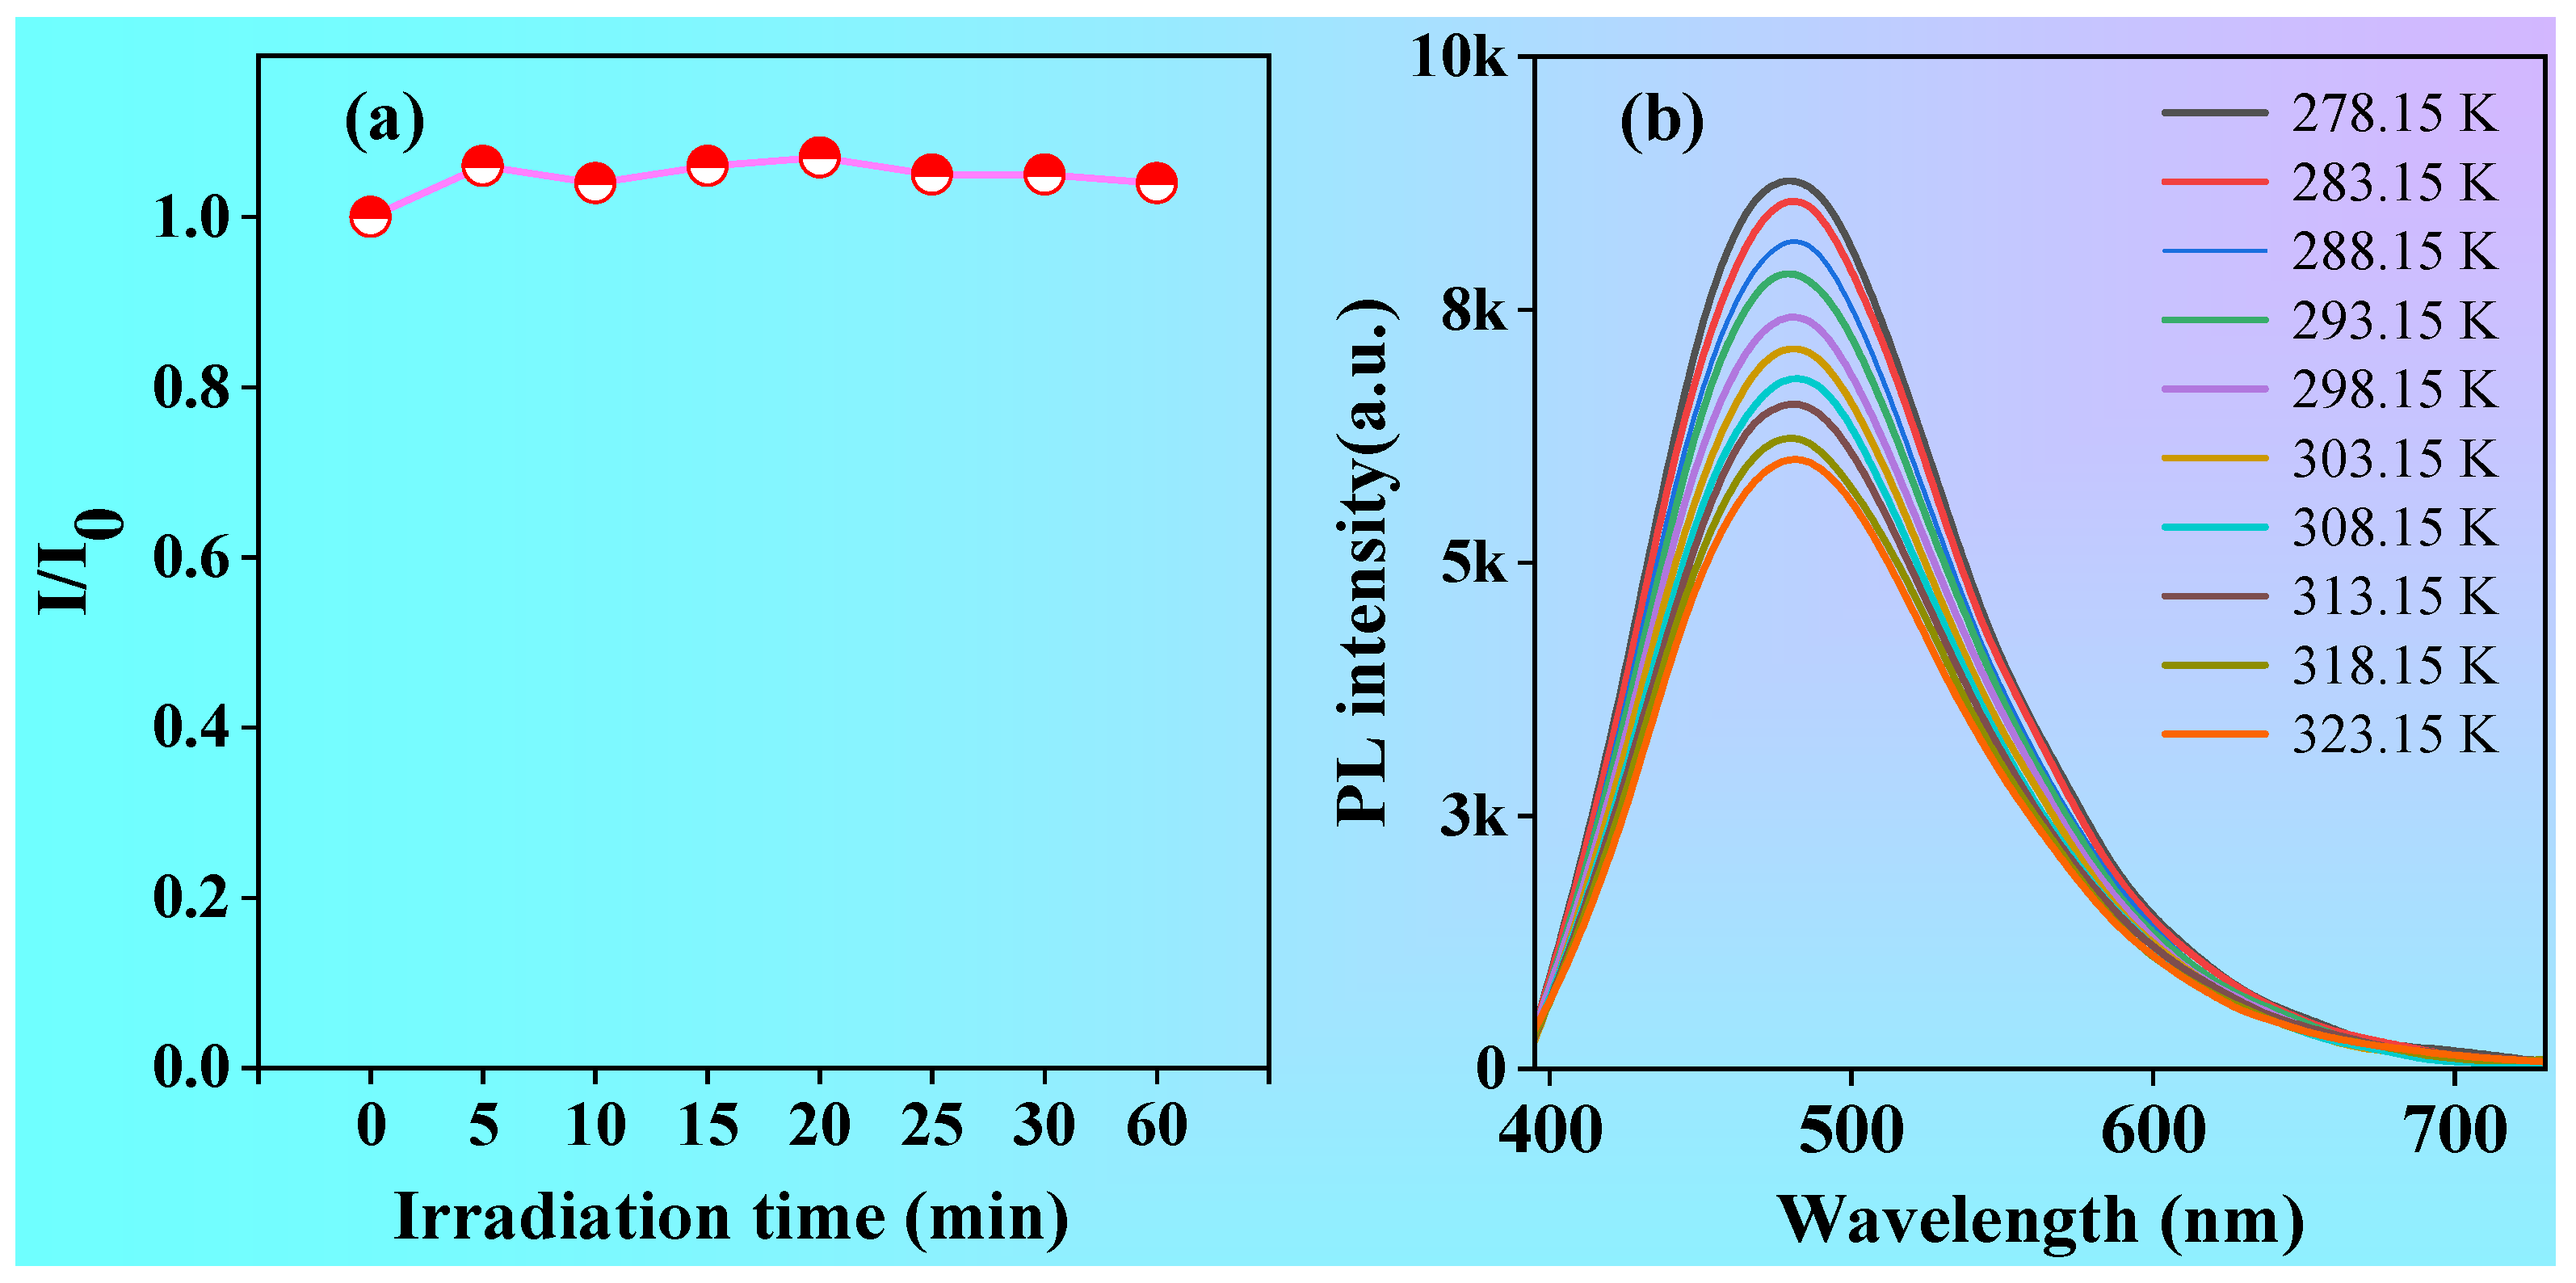
As we all know, photostability or resistance to photobleaching is an important parameter for organic luminescent materials, especially in the application of cellular laser confocal imaging. In order to study the photostability of polymer P1, a diluted ethanol-water solution of P1 at 1.0 mg/mL was continuously irradiated with a UV lamp at 365 nm while its fluorescence intensity was recorded. As shown in
Figure 7a, the fluorescent intensity of P1 showed little change when being continuously irradiated under 365 nm UV light, suggesting its good photostability, which will be beneficial for its potential application, such as cell imaging. In addition, temperature has a significant influence on the optical properties for organic luminescent materials. which can affect intramolecular and intermolecular interactions. To investigate the effect of temperature on the optical properties of polymer P1, the emission spectra of P1 in solutions were investigated from 278.15 to 323.15 K. As shown in
Figure 7b, the intensity of the emission peak of P1 gradually decreased with the increase of temperature. which is primarily due to the fact that as the temperature rises, the viscosity of the system reduced, and then the thermal motion of the molecules increased, thus leading to the enhanced rate of non-radiative transitions and the reduced luminescent intensity. At low temperature, the intermolecular movement of the polymer is difficult and restricted, which lead to the rate of non-radiative transition reduced and the intensity of luminescence increased. The linear decrease of fluorescence intensity with increasing temperature means that
P1 can be used for temperature sensing
38.
2.4. Polymer P1 for Iron Ion Detection
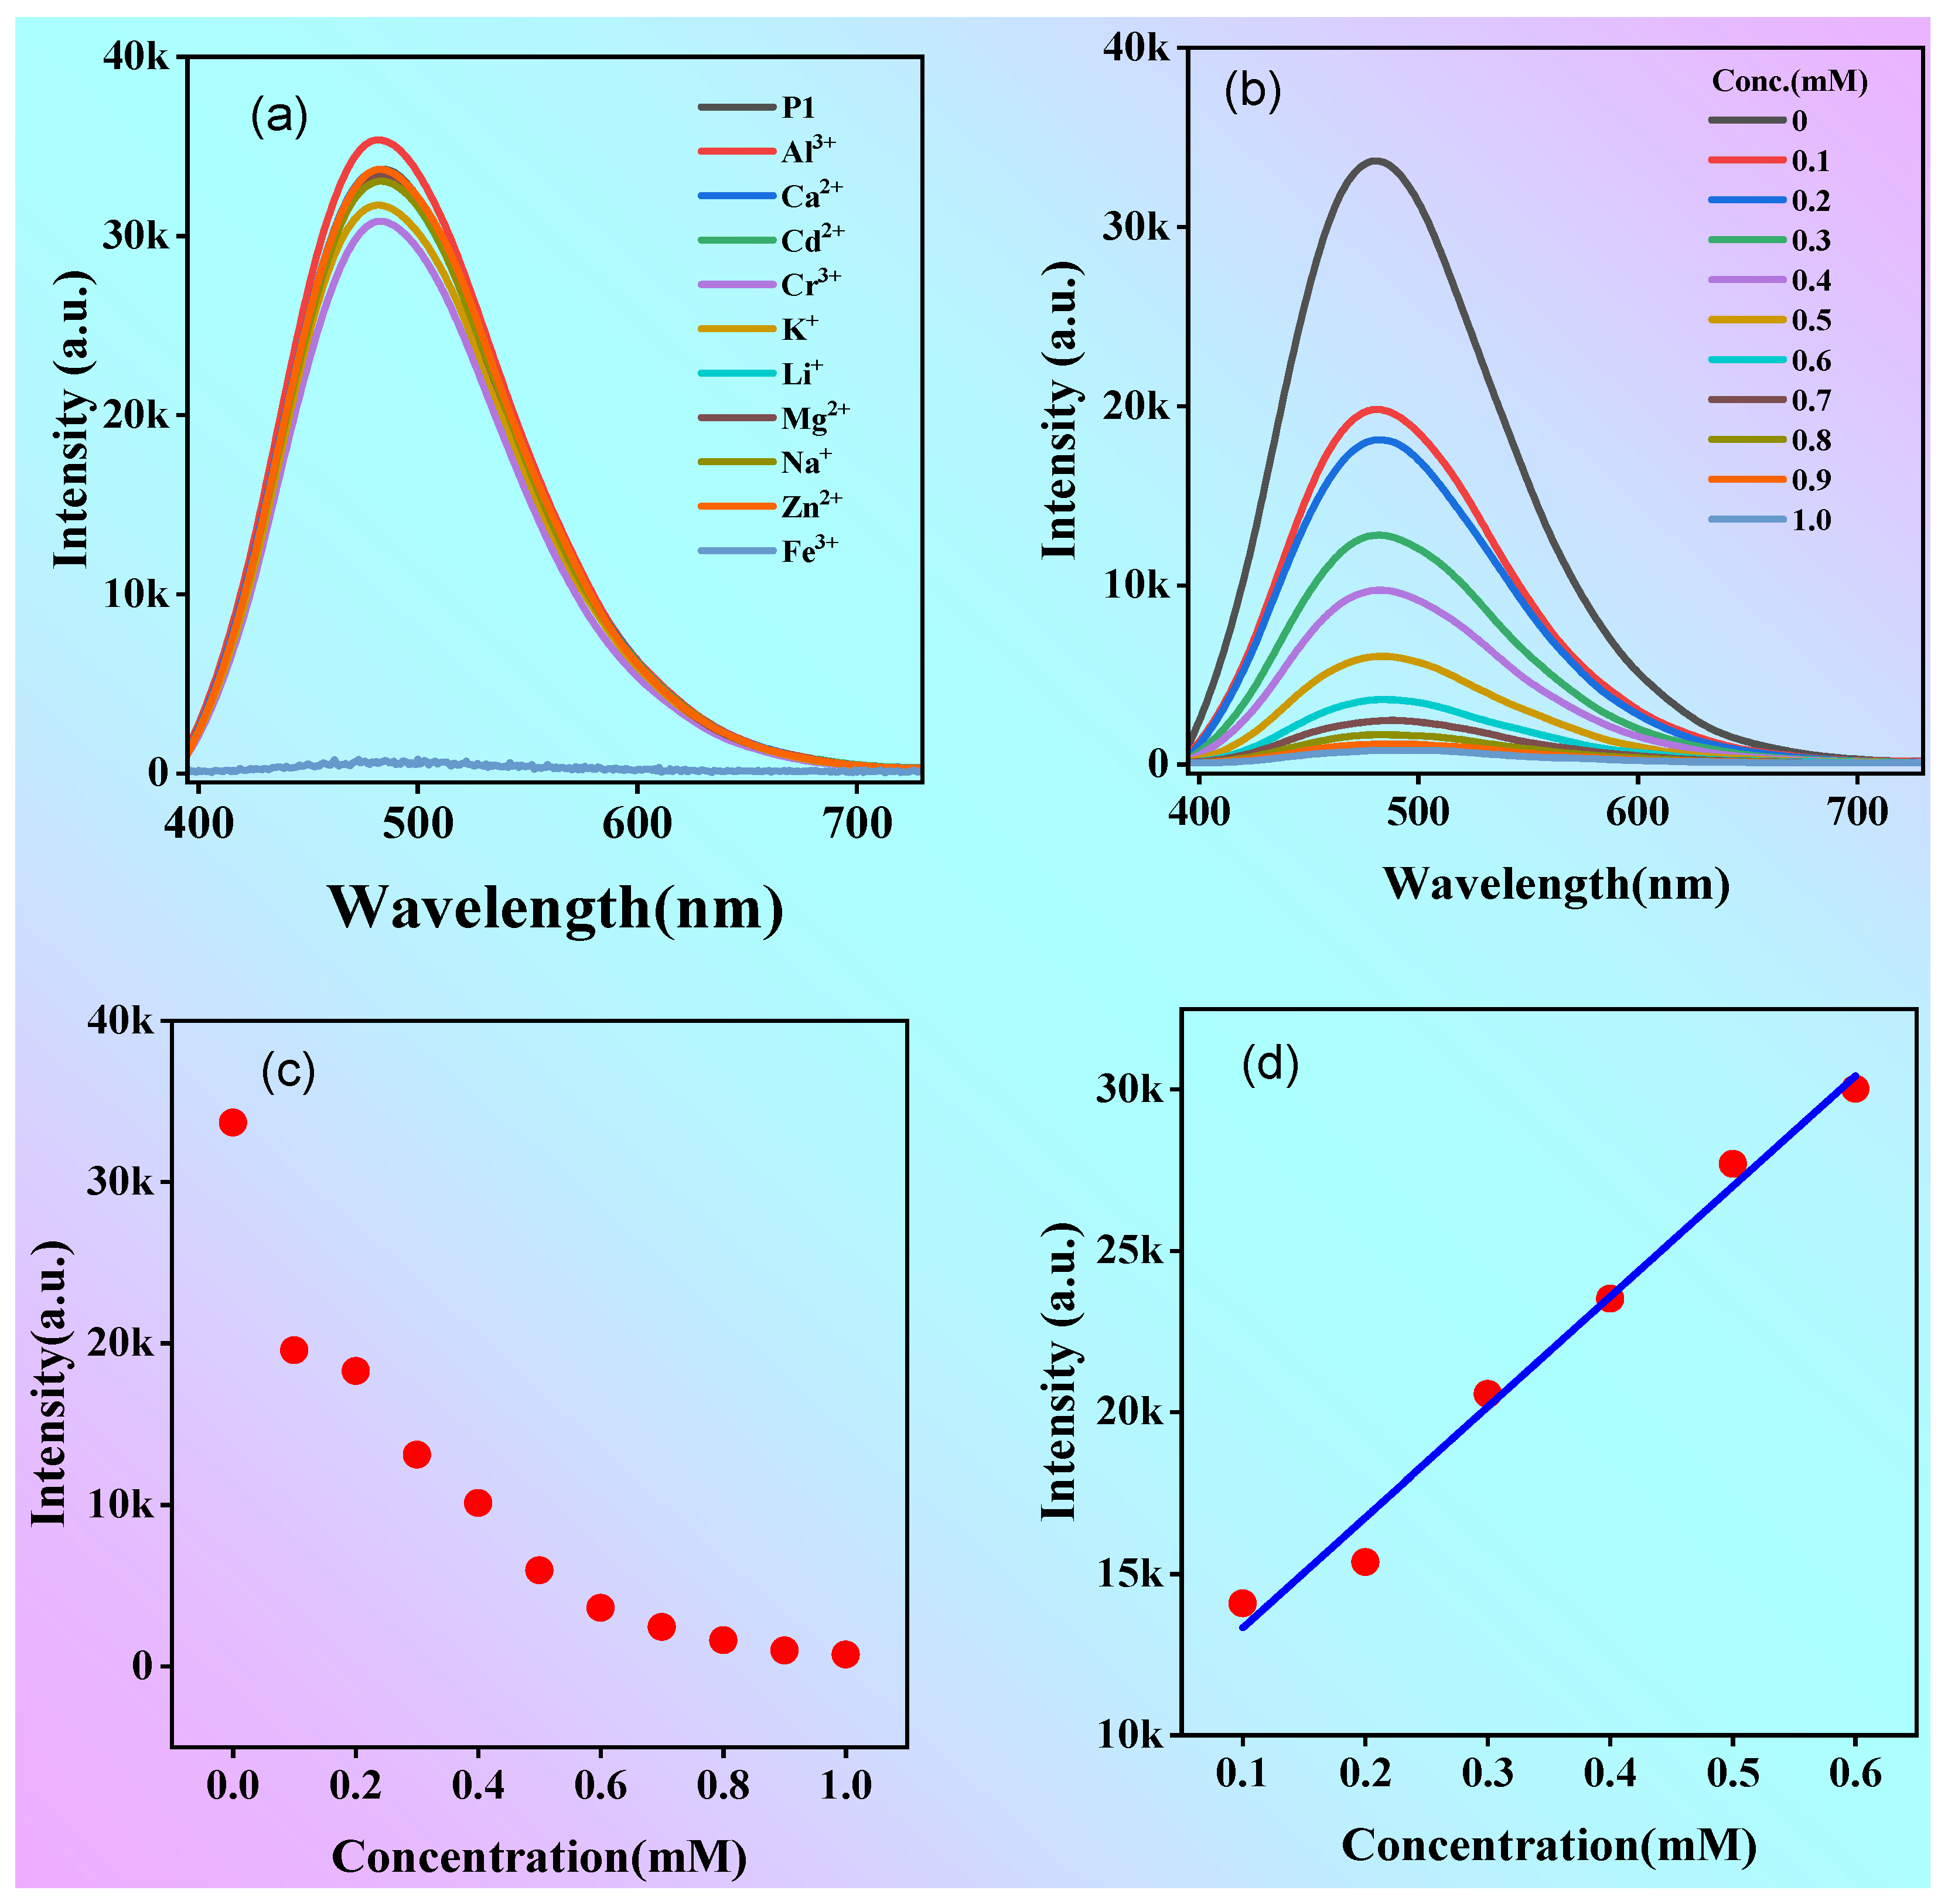
As P1 contains a large number of hydroxyl and carboxyl groups and shows efficient emission in dilute solutions, it is possible that it can form complexes with metal ions and show a unique ionic recognition effect. To test whether the polymer could be used to detect metal ions, the fluorescence of P1 solution (1 mg/mL) containing 10 metal ions was measured as shown in
Figure 8a. Impressively, the fluorescence intensity is almost parallel to the x-axis when Fe
3+ is added into the solution, however, the addition of other metal ions to P1 solution had almost no effect on the fluorescence intensity. The above results suggested the excellent selective quenching effect of iron ions (Fe
3+) for P1.
Fe
3+ is one of the essential trace elements for human growth and development. At the same time, it is closely related to a series of diseases such as diabetes, liver and kidney damage, and anemia
39-43. In other words, the detection of Fe
3+ is important for the early identification and diagnosis of diseases caused by abnormal Fe
3+ concentration in human body. Then, the detection limit of P1 for Fe
3+ was determined. When different concentrations of Fe
3+ solutions were added into the P1 solution, the maximum emission peak is always at 480 nm when the excitation wavelength was 375 nm, but the intensity of the emission peak decreased continuously (
Figure 8b, c). The limit of detection (LOD) was 33.67 μM according to the reported 3S/K calculation method
44 (S in
Figure 8d is the standard deviation from blank and K is the slope of the linear curve). The results indicate that polymer P1 has good sensitivity to Fe
3+ and thus possessing great potential as a probe for Fe
3+.
2.5. Cell Imaging Studies
NLMs without aromatic groups showing CTE properties are often used for cell imaging due to their low toxicity
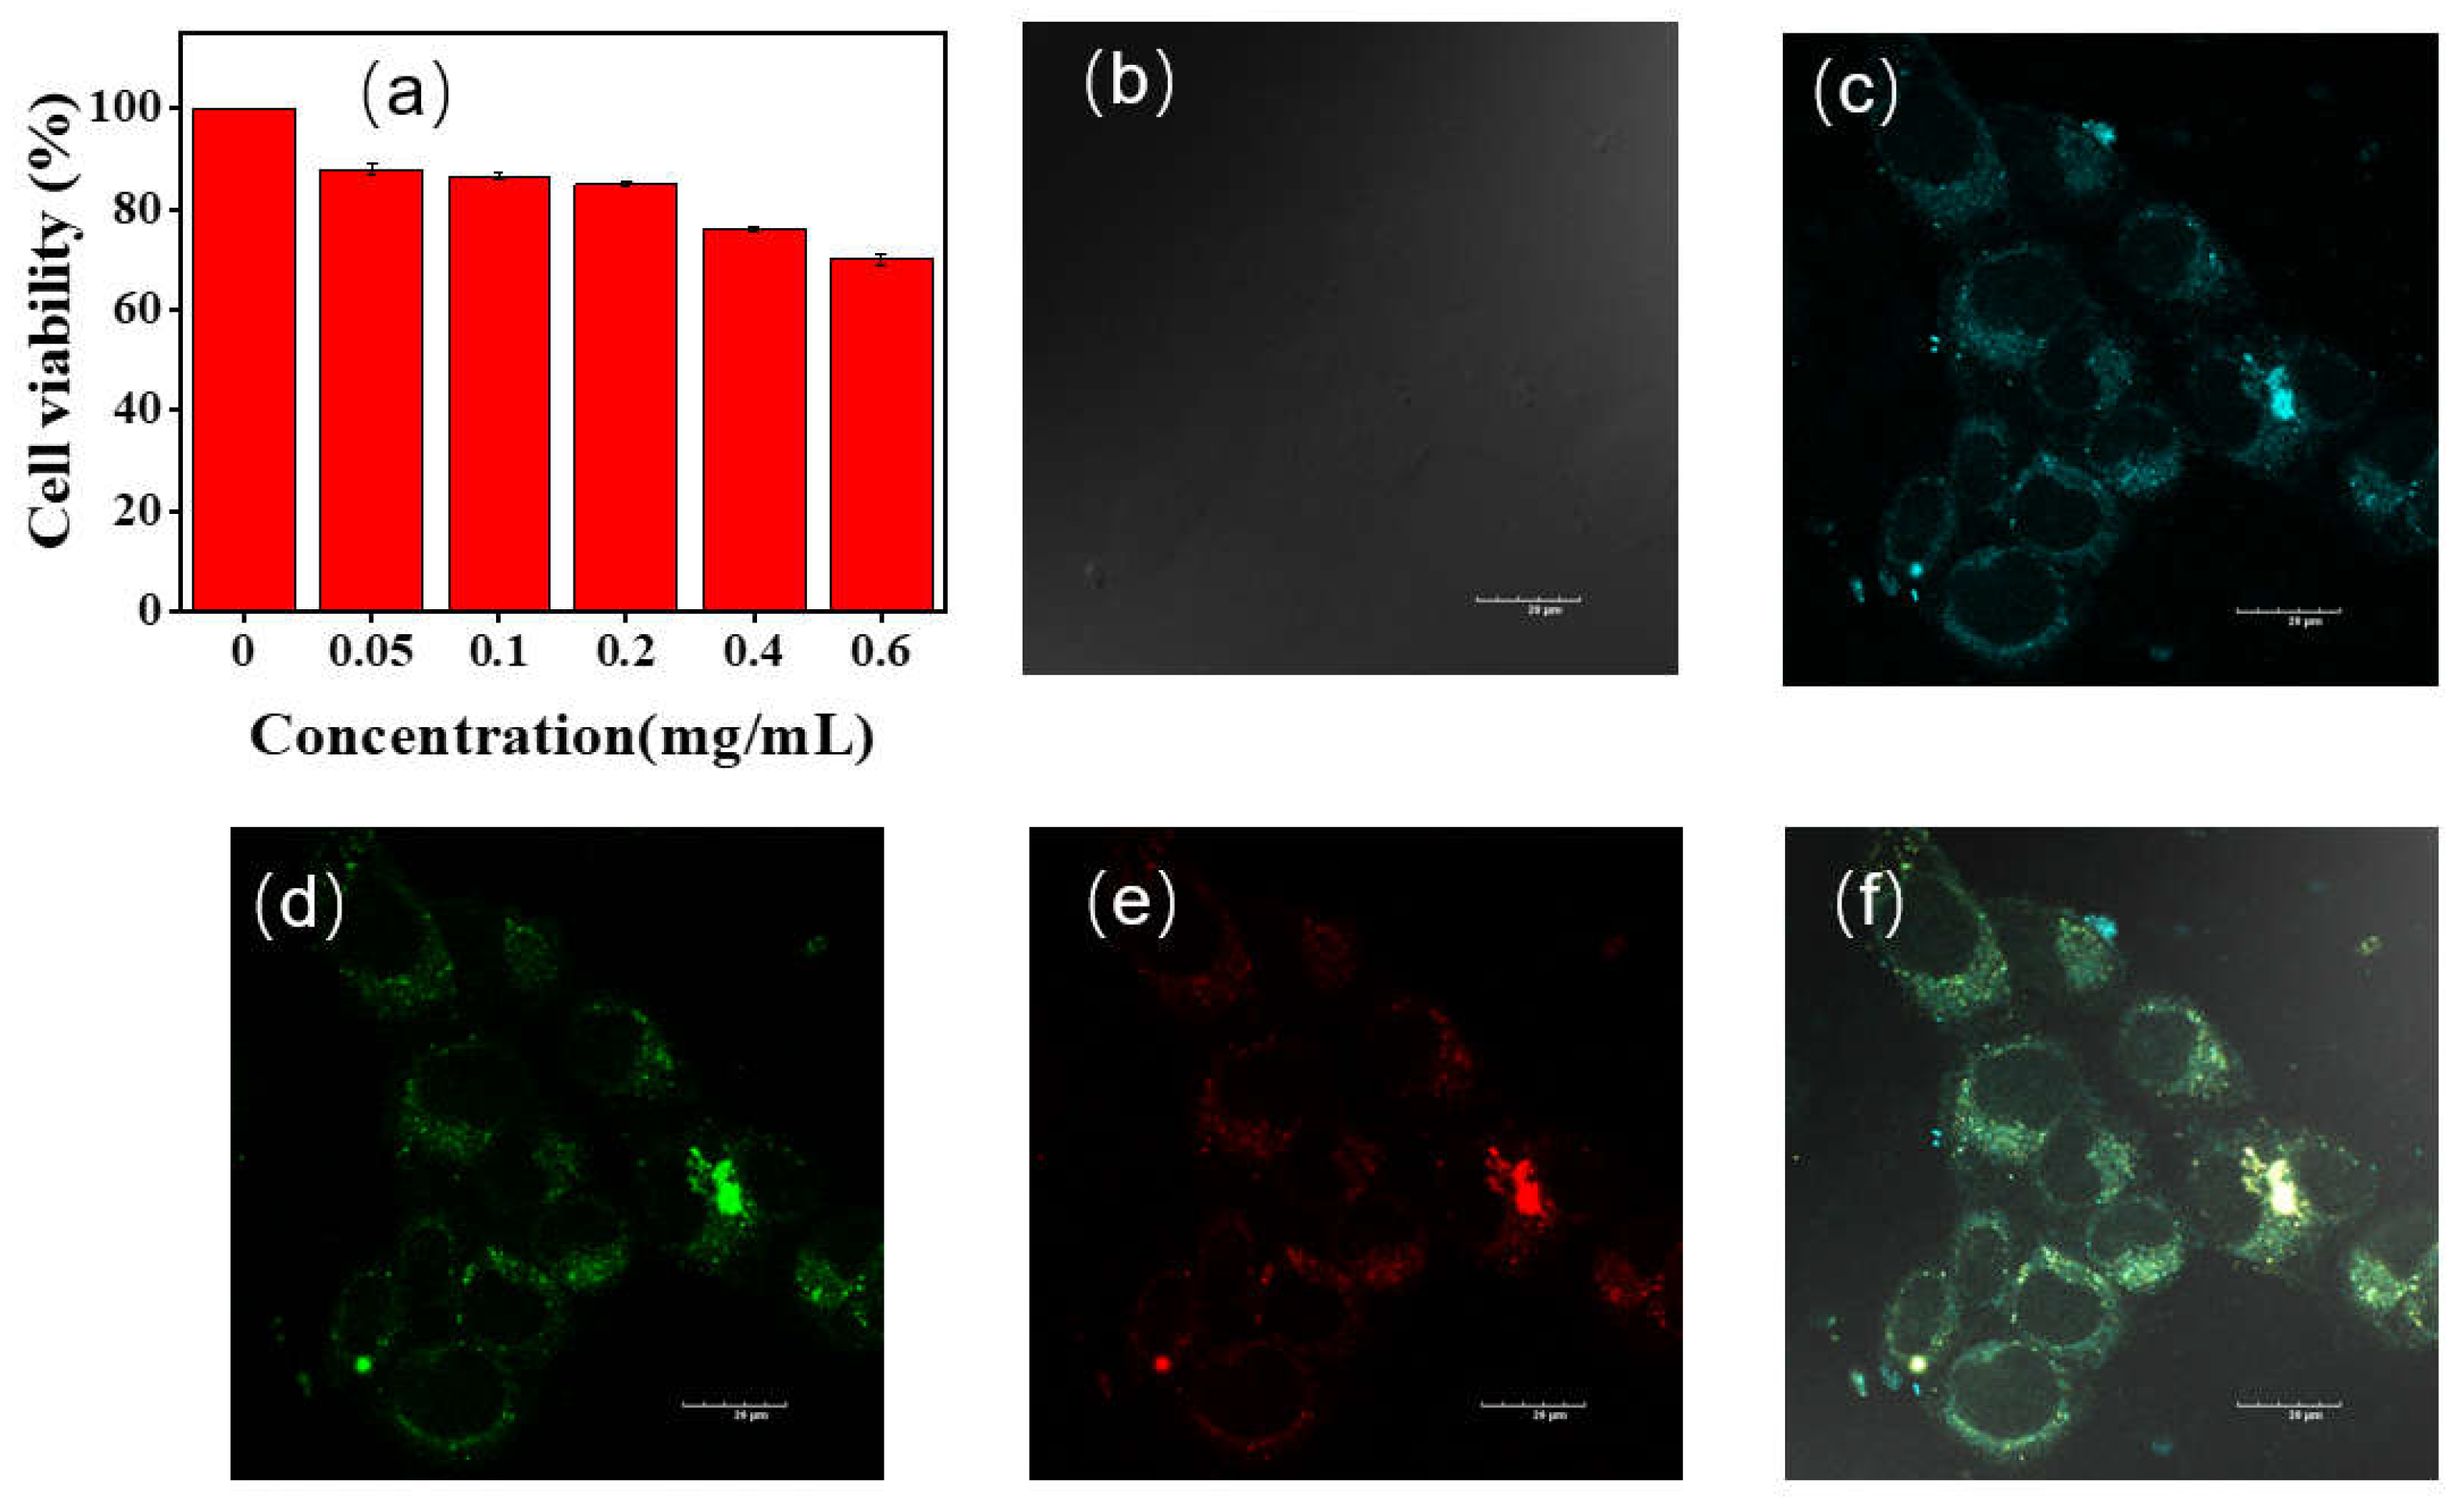
45-48. To validate the potential of P1 for cell imaging and labelling applications, we used standard methylthiazolyl diphenyltetrazolium bromide (MTT) assays to evaluate the cytotoxicity of P1 at different concentrations on HeLa cells. As shown in
Figure 9a, cell viability exceeded 85% when the concentration of P1 was less than 0.2 mg/mL. The cell viability decreased to 70% when the concentration of polymer P1 reached 0.6 mg/mL, suggesting low cytotoxicity and great potential of P1 for biological imaging applications.
Then, HeLa cells incubated with polymer P1 (0.5 mg/mL) for 1 h were analyzed by confocal laser microscopy (
Figure 9b-f). Due to the excitation wavelength dependence of P1, the emission from blue, green and red channels was collected in three different channels to obtain cell images. As can be seen from the bright field in
Figure 7b, the morphology of all HeLa cells remained normal. The cytoplasm of HeLa cells showed blue, green and red fluorescence emission when excited at 405, 488 nm and 561 nm, respectively. The results indicate that polymer P1 is capable of bioimaging at the cellular level with multi-color imaging.
3. Conclusions
In summary, the dynamic hydrogen bonds and other short interactions in solution of model polymers P1 and P2 with the same number of repeating units were first investigated by means of MD. It was found that polymer P1 has more intra- or intermolecular hydrogen bonds and other short interactions in solution than P2, and which can be effectively modulated by controlling the number of hydrogen bond acceptors of the polymer monomers. To further validate the results of the MD study, polymers P1 and P2 were prepared, and their photophysical properties were investigated. It was found that mass extinction values at 300 nm for 1 mg/mL solutions of P1 and P2 are 4.45 and 0.05 L/mol/cm, respectively, and luminescence quantum efficiency for 0.1 mg/mL solutions of P1 and P2 are 8.9 and 0.6%, respectively. The excellent photophysical properties of P1 can be attributed to its rich intra- or intermolecular hydrogen bonds and other short interactions in dilute solutions, which allows it to increase the degree of system conjugation, restrict molecular motion and decrease non-radiative transitions, thereby leading to effective luminescence. In addition, P1 exhibits clustering induced luminescence, excitation wavelength dependent and concentration dependent fluorescence properties, excellent photobleaching resistance, and selective recognition of Fe3+. Although the relationship between dynamic hydrogen bonds and optical properties has yet to be investigated in a large-scale in-depth, this work is a preliminary study of the luminescence properties of NLMs in dilute solutions using molecular dynamics to study dynamic hydrogen bonds, which can be used as a semi-empirical method to design and construct more and more novel NLMs.
Supplementary Materials
The following supporting information can be downloaded at the website of this paper posted on Preprints.org.
Author Contributions
XT performed the experiment, BJ and YJ conducted Cell experiments, XT wrote the manuscript, HX and JH edit the manuscript, LY, SG and YG conceived the entire project.
Funding
This work was financially supported by the National Natural Science Foundation of China (52163017); Project of Guangxi Natural Science Foundation (2021GXNSFAA220047, 2020GXNSFBA297098, 2022GXNSFAA035474), Basic Ability Improvement Project for Young and Middle-aged Teachers (Scientific Research) of Guangxi Universities (2022KY0257).
Conflicts of Interest
The authors declare no conflict of interest.
References
- M.-C. Tang, M.-Y. Chan and V. W.-W. Yam, Chem. Rev., 2021, 121, 7249.
- M. A. Bryden and E. Zysman-Colman, Chem. Soc. Rev., 2021, 50, 7587.
- M. A. Baldo, D. F. O'Brien, Y. You, A. Shoustikov, S. Sibley, M. E. Thompson and S. R. Forrest, Nature, 1998, 395, 151.
- Y. Liu, X. Guan and Q. Fang, Aggregate, 2021, 2, e34.
- D. D. La, S. V. Bhosale, L. A. Jones and S. V. Bhosale, ACS Appl. Mater. Interfaces, 2017, 10, 12189.
- G. Jiang, X. Liu, Q. Chen, G. Zeng, Y. Wu, X. Dong, G. Zhang, Y. Li, X. Fan and J. Wang, Sens. Actuators B Chem., 2017, 252, 712.
- S. Cao, J. Shao, H. Wu, S. Song, M. T. De Martino, I. A. Pijpers, H. Friedrich, L. K. Abdelmohsen, D. S. Williams and J. C. van Hest, Nat. Commun., 2021, 12, 2077.
- W. Zhu, M. Kang, Q. Wu, Z. Zhang, Y. Wu, C. Li, K. Li, L. Wang, D. Wang and B. Z. Tang, Adv. Funct. Mater., 2021, 31, 2007026.
- L. Feng, C. Li, L. Liu, Z. Wang, Z. Chen, J. Yu, W. Ji, G. Jiang, P. Zhang and J. Wang, ACS nano, 2022, 16, 4162.
- Y. Xu, R. Xu, Z. Wang, Y. Zhou, Q. Shen, W. Ji, D. Dang, L. Meng and B. Z. Tang, Chem. Soc. Rev., 2021, 50, 667.
- A. Steinegger, O. S. Wolfbeis and S. M. Borisov, Chem. Rev., 2020, 120, 12357.
- X. Liu, Y. Su, H. Tian, L. Yang, H. Zhang, X. Song and J. W. Foley, Anal. Chem., 2017, 89, 7038.
- L. Zou, S. Guo, H. Lv, F. Chen, L. Wei, Y. Gong, Y. Liu and C. Wei, Dyes Pigm., 2022, 198, 109958.
- C. C. C. Johansson Seechurn, M. O. Kitching, T. J. Colacot and V. Snieckus, Angew. Chem. Int. Ed., 2012, 51, 5062.
- R. Patel, P. Zaveri, A. Mukherjee, P. K. Agarwal, P. More and N. S. Munshi, Ecotoxicol. Environ. Saf., 2019, 182, 109450.
- H. Zhang, Z. Zhao, P. R. McGonigal, R. Ye, S. Liu, J. W. Y. Lam, R. T. K. Kwok, W. Z. Yuan, J. Xie, A. L. Rogach and B. Z. Tang, Mater. Today, 2020, 32, 275.
- S. Tang, T. Yang, Z. Zhao, T. Zhu, Q. Zhang, W. Hou and W. Z. Yuan, Chem. Soc. Rev., 2021, 50, 12616.
- D. A. Tomalia, B. Klajnert-Maculewicz, K. A. M. Johnson, H. F. Brinkman, A. Janaszewska and D. M. Hedstrand, Prog. Polym. Sci., 2019, 90, 35.
- X. Chen, W. Luo, H. Ma, Q. Peng, W. Z. Yuan and Y. Zhang, Sci. China Chem., 2018, 61, 351.
- P. Liao, J. Huang, Y. Yan and B. Z. Tang, Mater. Chem. Front., 2021, 5, 6693.
- W. Zhang Yuan and Y. Zhang, J. Polym. Sci., Part A: Polym. Chem., 2017, 55, 560.
- K. Bauri, B. Saha, A. Banerjee and P. De, Polym. Chem., 2020, 11, 7293.
- L.-L. Du, B.-L. Jiang, X.-H. Chen, Y.-Z. Wang, L.-M. Zou, Y.-L. Liu, Y.-Y. Gong, C. Wei and W.-Z. Yuan, Chin. J. Polym. Sci., 2019, 37, 409.
- Y. Gong, Y. Tan, J. Mei, Y. Zhang, W. Yuan, Y. Zhang, J. Sun and B. Z. Tang, Sci. China Chem., 2013, 56, 1178.
- M. Studzian, Ł. Pułaski, D. A. Tomalia and B. Klajnert-Maculewicz, J. Phys. Chem. C, 2019, 123, 18007.
- L. Pastor-Pérez, Y. Chen, Z. Shen, A. Lahoz and S.-E. Stiriba, Macromol. Rapid Commun., 2007, 28, 1404.
- Q. Zhou, B. Cao, C. Zhu, S. Xu, Y. Gong, W. Z. Yuan and Y. Zhang, Small, 2016, 12, 6586.
- F. Chen, Y. Jin, J. Luo, L. Wei, B. Jiang, S. Guo, C. Wei and Y. Gong, Int. J. Biol. Macromol., 2023, 226, 1387.
- Y. Feng, H. Yan, F. Ding, T. Bai, Y. Nie, Y. Zhao, W. Feng and B. Z. Tang, Mater. Chem. Front., 2020, 4, 1375.
- S. Niu, H. Yan, S. Li, P. Xu, X. Zhi and T. Li, Macromol. Chem. Phys., 2016, 217, 1185.
- L. Bai, Y. Zhang, H. Yan and X. Liu, Biomacromolecules, 2022, 23, 4617.
- M. Fang, J. Yang, X. Xiang, Y. Xie, Y. Dong, Q. Peng, Q. Li and Z. Li, Mater. Chem. Front., 2018, 2, 2124.
- J. Luo, S. Guo, F. Chen, B. Jiang, L. Wei, Y. Gong, B. Zhang, Y. Liu, C. Wei and B. Z. Tang, Chem. Eng. J., 2023, 454, 140469.
- Lindahl, Erik, Abraham, Hess and v. d. Spoel, GROMACS 2020.6 Source code. [CrossRef]
- R. Galindo-Murillo, J. C. Robertson, M. Zgarbová, J. Šponer, M. Otyepka, P. Jurečka and T. E. Cheatham, III, J. Chem. Theory Comput., 2016, 12, 4114.
- T. Lu, Sobtop 1.0 (dev3.1), http://sobereva.com/soft/Sobtop.
- D. van der Spoel, P. J. van Maaren, P. Larsson and N. Tîmneanu, J. Phy. Chem. B, 2006, 110, 4393.
- B. Saha, B. Ruidas, S. Mete, C. D. Mukhopadhyay, K. Bauri and P. De, Chem. Sci., 2020, 11, 141.
- C. Sun, X. Jiang, B. Li, S. Li and X. Z. Kong, ACS Sustain. Chem. Eng., 2021, 9, 5166.
- W. Luo, H. Yu, Z. Liu, R. Ou, C. Guo and J. Zhang, J Mater. Res. Technol., 2022, 19, 1699.
- L. Bai, H. Yan, L. Wang, T. Bai, L. Yuan, Y. Zhao and W. Feng, Macromol. Mater. Eng., 2020, 305, 2000126.
- X. Jiang, Q. Wang, B. Li, S. Li and X. Z. Kong, Chin. J. Polym. Sci., 2023, 41, 129.
- X. Qin, S. Wang, L. Luo, G. He, H. Sun, Y. Gong, B. Jiang and C. Wei, RSC Adv., 2018, 8, 31231.
- A. Shrivastava and V. B. Gupta, Chron. Young Sci, 2011, 2, 21.
- Y. Zuo, X. Wang and W. Lin, Sens. Actuators B Chem., 2021, 331, 129462.
- Q. Wang, B. Li, H. Cao, X. Jiang and X. Z. Kong, Chem. Eng. J., 2020, 388, 124182.
- Q. Jiang, H. Zhang, L. Shi, S. Guan, W. Huang, X. Xue, H. Yang, L. Jiang and B. Jiang, Eur. J. Org. Chem., 2023, 26, e202201419.
- L. Xu, S. Zhong, Y. Gao and X. Cui, Dyes Pigm., 2021, 196, 109768.
Figure 1.
Synthesis pathways and chemical structures of target polymers P1 and P2.
Figure 1.
Synthesis pathways and chemical structures of target polymers P1 and P2.
Figure 2.
The aggregation state of P1 in 10 nm × 10 nm ×10 nm cubic water box at different times, and the number of hydrogen bonds (NHB) and short interactions (NSI) of the molecules at different times, the magenta dashed lines represent partial hydrogen bonds and short interactions.
Figure 2.
The aggregation state of P1 in 10 nm × 10 nm ×10 nm cubic water box at different times, and the number of hydrogen bonds (NHB) and short interactions (NSI) of the molecules at different times, the magenta dashed lines represent partial hydrogen bonds and short interactions.
Figure 3.
Molecular dynamics simulations of intramolecular dynamics of hydrogen bonding and short interactions between P1 (a) and P2 (b) in a 10 nm × 10 nm ×10 nm cubic water box. The red and blue lines indicate the number of hydrogen bonds and short interactions respectively.
Figure 3.
Molecular dynamics simulations of intramolecular dynamics of hydrogen bonding and short interactions between P1 (a) and P2 (b) in a 10 nm × 10 nm ×10 nm cubic water box. The red and blue lines indicate the number of hydrogen bonds and short interactions respectively.
Figure 4.
Photographs of ethanol solutions of P1 and P2 at different concentrations under 365 nm UV light.
Figure 4.
Photographs of ethanol solutions of P1 and P2 at different concentrations under 365 nm UV light.
Figure 5.
(a) Absorption (a, b) and fluorescence emission (c, d) spectra of P1 (a, c)and P2 (b, d) in ethanol solution, λex=375 nm.
Figure 5.
(a) Absorption (a, b) and fluorescence emission (c, d) spectra of P1 (a, c)and P2 (b, d) in ethanol solution, λex=375 nm.
Figure 6.
Emission spectra of P1 solution (1 mg/mL) at different excitation wavelengths (a), the change of emission peaks with different excitation wavelengths (b), the change of intensity for the maximum emission peak with different excitation wavelengths (c), the fluorescence lifetime at 400, and 435 nm tested with 320, 360 and 455 nm picosecond lasers (d), respectively.
Figure 7.
(a) The changes of emission peaks of P1 solution upon white light irradiation with different time. (b) Fluorescence emission spectra of P1 solution with different temperatures, Cocentration:1 mg/mL, λex=375 nm.
Figure 7.
(a) The changes of emission peaks of P1 solution upon white light irradiation with different time. (b) Fluorescence emission spectra of P1 solution with different temperatures, Cocentration:1 mg/mL, λex=375 nm.
Figure 8.
(a) Fluorescence spectra of P1 solution after adding different metal ions (concetration:1 mM); (b) Fluorescence spectra of P1 solution after adding different concentrations of Fe3+; (d) The change of fluorescence intensity △I= I0-I under different Fe3+ concentration (Concentration of P1 solution: 1 mg/mL,λex=375 nm).
Figure 9.
(a) Cell viability of HeLa cells incubated with different concentrations of P1 for 24 h; confocal microscopy images of HeLa cells incubated with P1 (b– f); c, d, e and (f) are bright field, blue, green, red, and merged channel images, respectively; scale =20 μm, concentration: 0.5 mg/mL.
Figure 9.
(a) Cell viability of HeLa cells incubated with different concentrations of P1 for 24 h; confocal microscopy images of HeLa cells incubated with P1 (b– f); c, d, e and (f) are bright field, blue, green, red, and merged channel images, respectively; scale =20 μm, concentration: 0.5 mg/mL.
|
Disclaimer/Publisher’s Note: The statements, opinions and data contained in all publications are solely those of the individual author(s) and contributor(s) and not of MDPI and/or the editor(s). MDPI and/or the editor(s) disclaim responsibility for any injury to people or property resulting from any ideas, methods, instructions or products referred to in the content. |
© 2023 by the authors. Licensee MDPI, Basel, Switzerland. This article is an open access article distributed under the terms and conditions of the Creative Commons Attribution (CC BY) license (http://creativecommons.org/licenses/by/4.0/).
