1. Introduction
The demand for fresh Water has steadily escalated as the population increases exponentially. It has resulted in a marked increase in industrial and agricultural sector activities. Nearly 70 billion people across 43 countries face water scarcity and stress
(Hameeteman, 2013
). Wastewater is "used water from any combination of domestic, industrial, commercial or agricultural activities, surface runoff or stormwater, and any sewer inflow or sewer infiltration" (Tilley
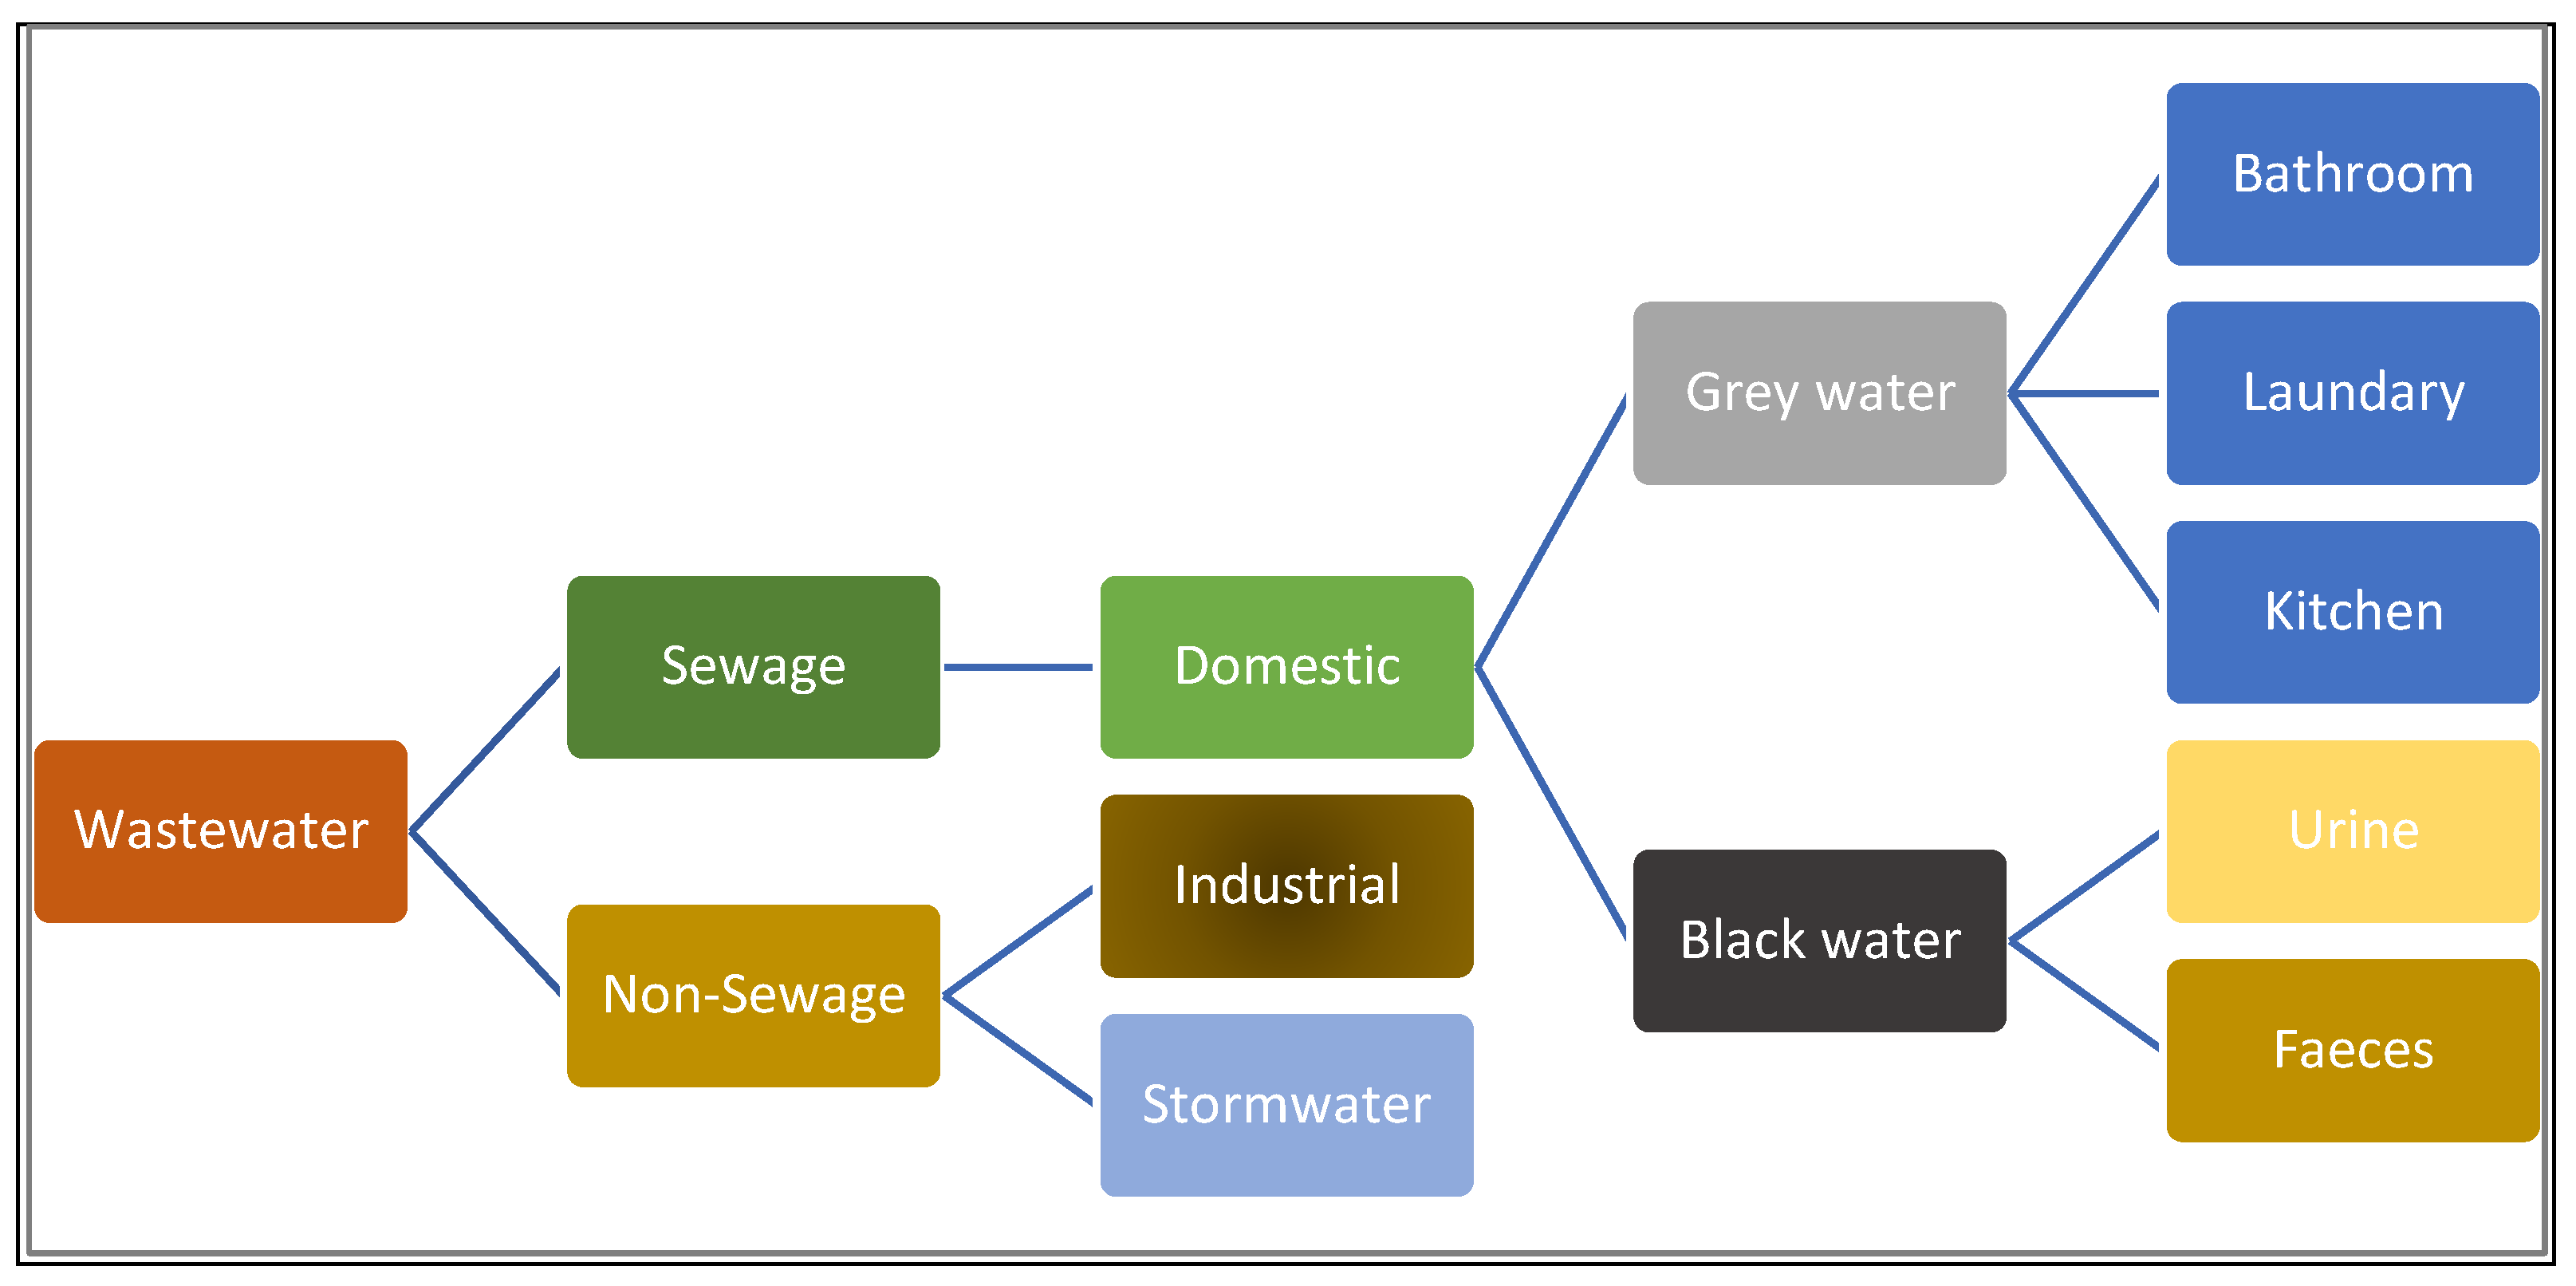
et al., 2014). Various anthropogenic activities such as domestic, commercial, industrial and agriculture lead to wastewater production. Wastewater contains various types of pollutants and characteristics based on its source. The broad classification of wastewater is shown in
Figure 1.
Various megacities in Asia face as well as impose enormous environmental challenges. Ironically, among various challenges, the problem of drainage and wastewater treatment expands as access to Water and water-borne toilets increases, resulting in increased per capita water consumption and high water pollution. Holding nearly 4% of the world's renewable water resources, India bears the burden of about 18% of the global population (C.S.E., 2017). Delhi, Uttar Pradesh, Haryana and Madhya Pradesh meet their water requirement from the Yamuna River. This dependence has turned it into a sewerage drain with untreated sewage from all the sources ending up in it and making it one of the country's most polluted water bodies, with Delhi finding itself among the most polluted cities in the world. Yamuna River covers a 580-km long stretch between the Wazirabad Barrage (Delhi) and its conflux with the Chambal River near Panchnada village, of which the river is exceedingly polluted. The river flows through 54 km of Delhi territory from Palla to Badarpur. The stretch between Wazirabad and Okhla, extending over 22 km, which is less than 2% of the total length of the 1370 km long river from its headspring at Yamunotri to its discharge point at Allahabad, accounts for about 76% of the pollution in the river (Yamuna Monitoring Committee Report, 2020).
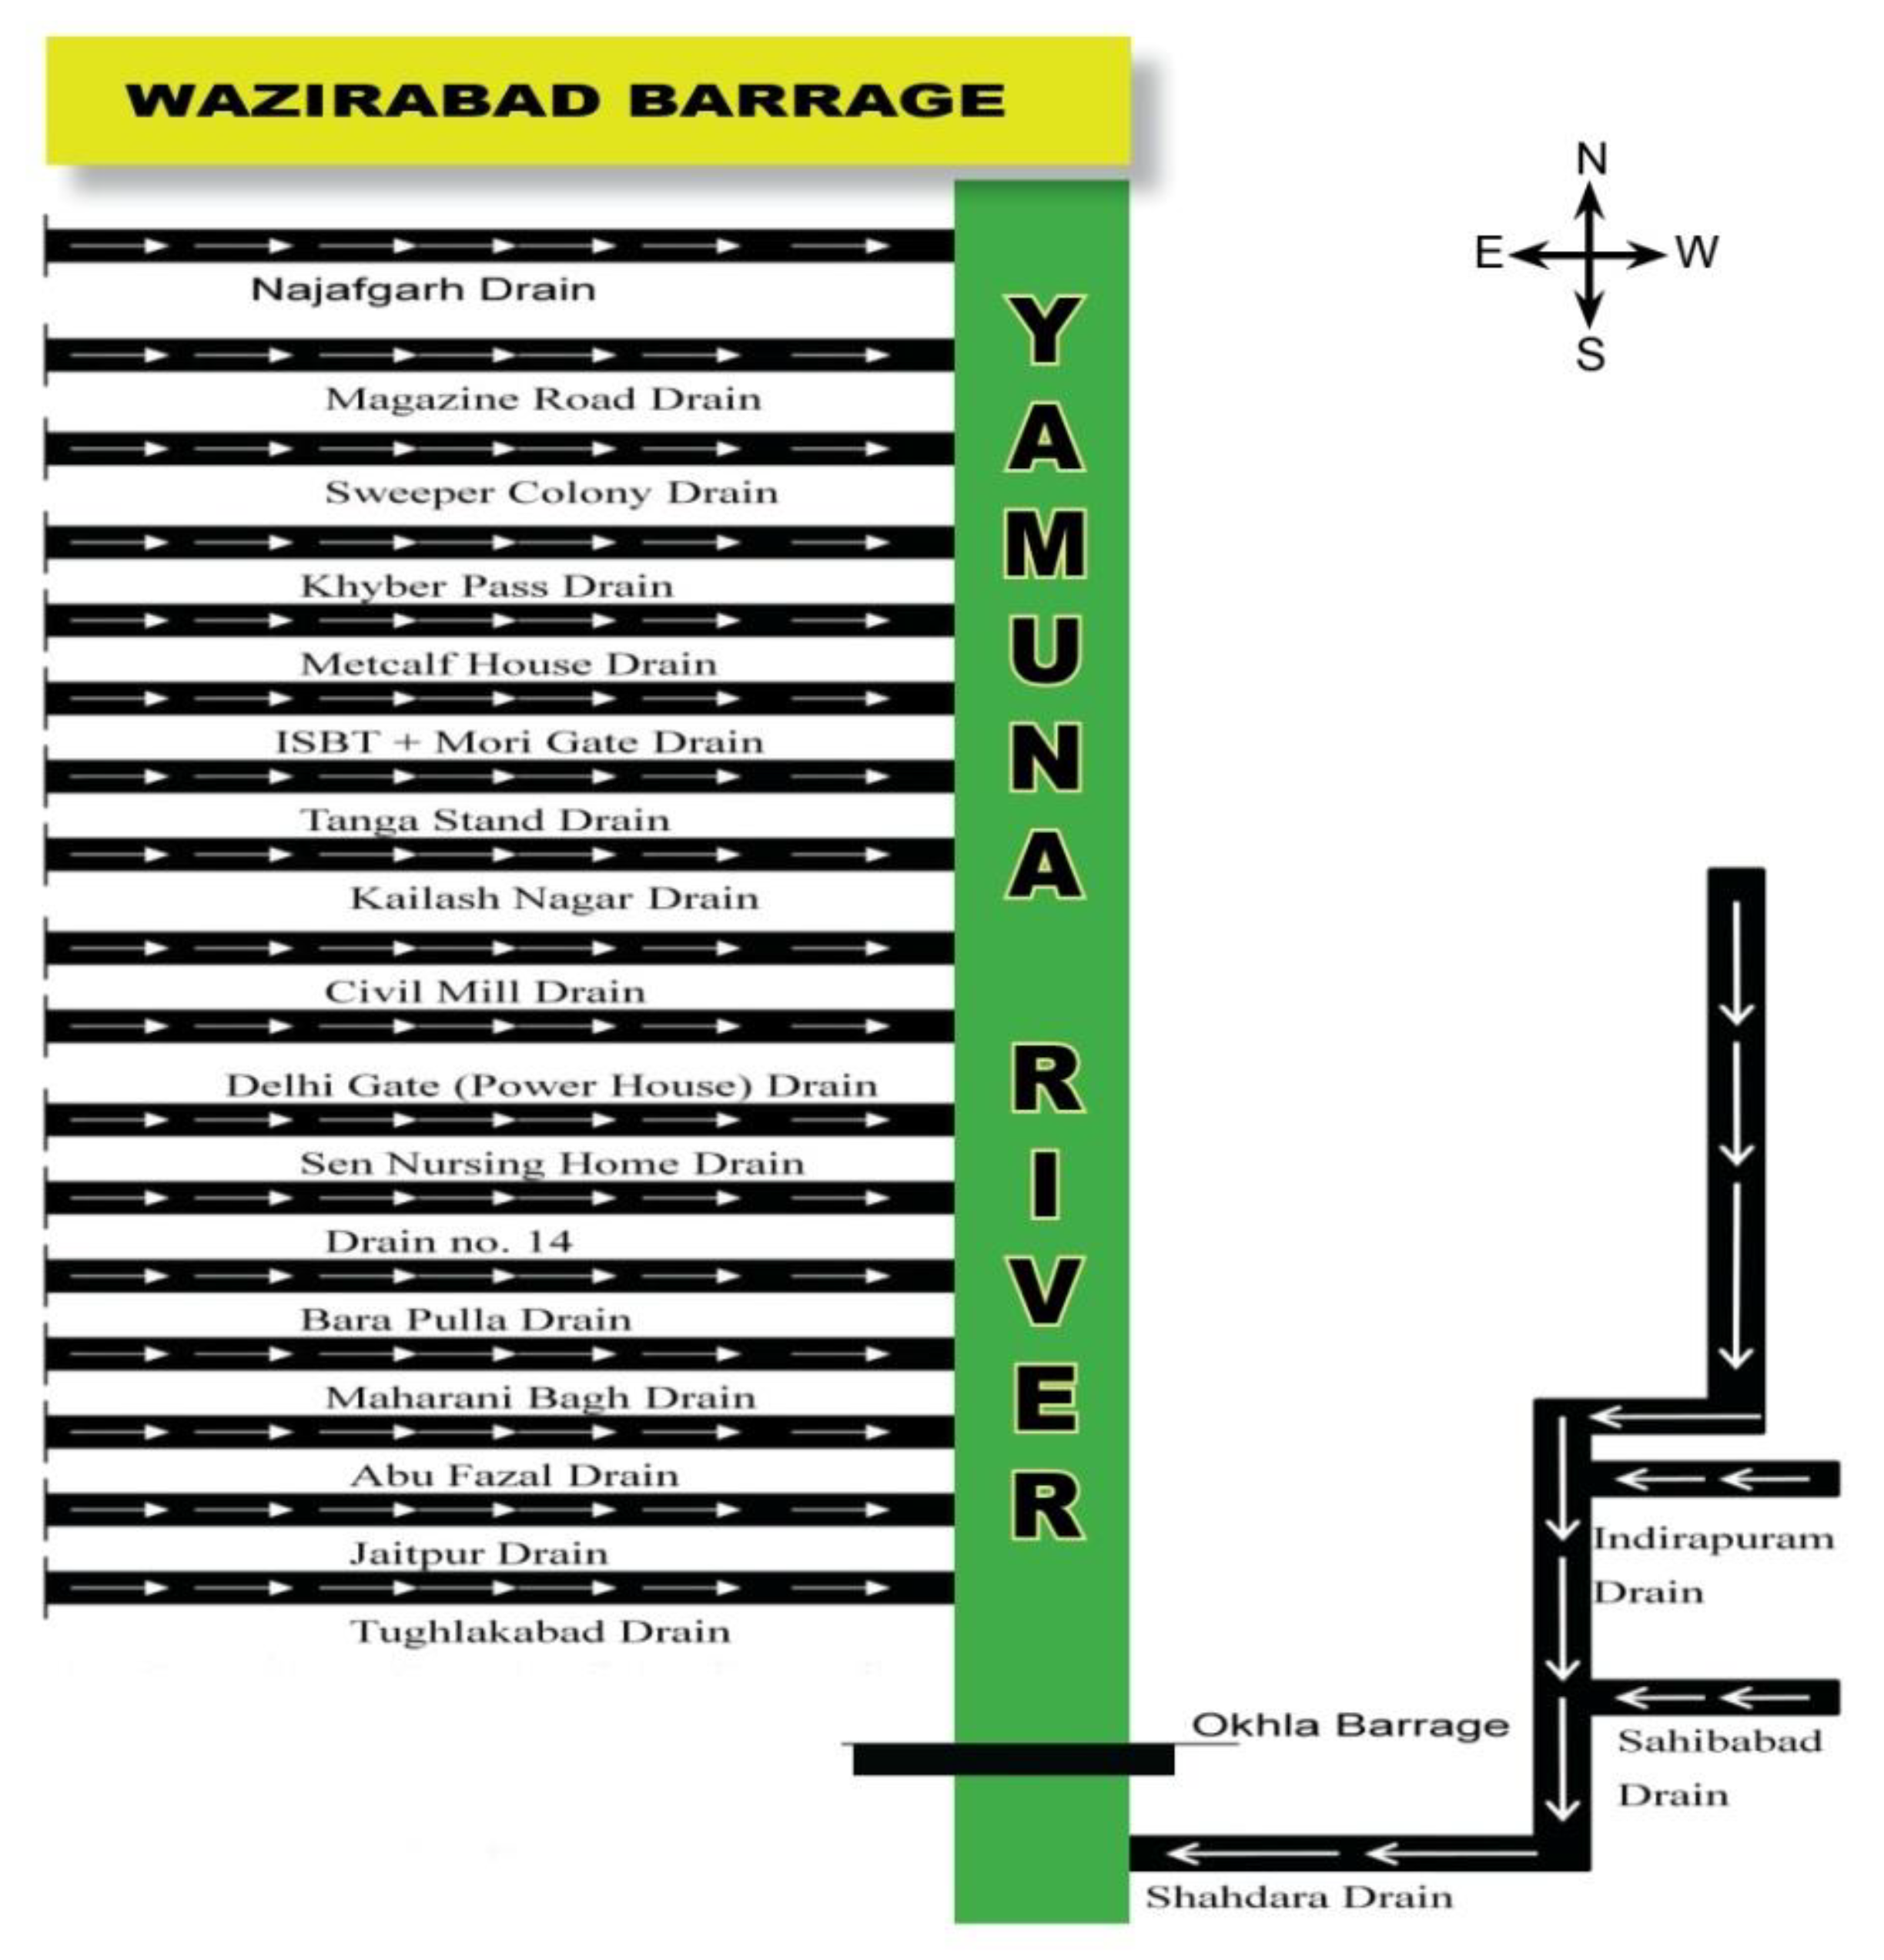
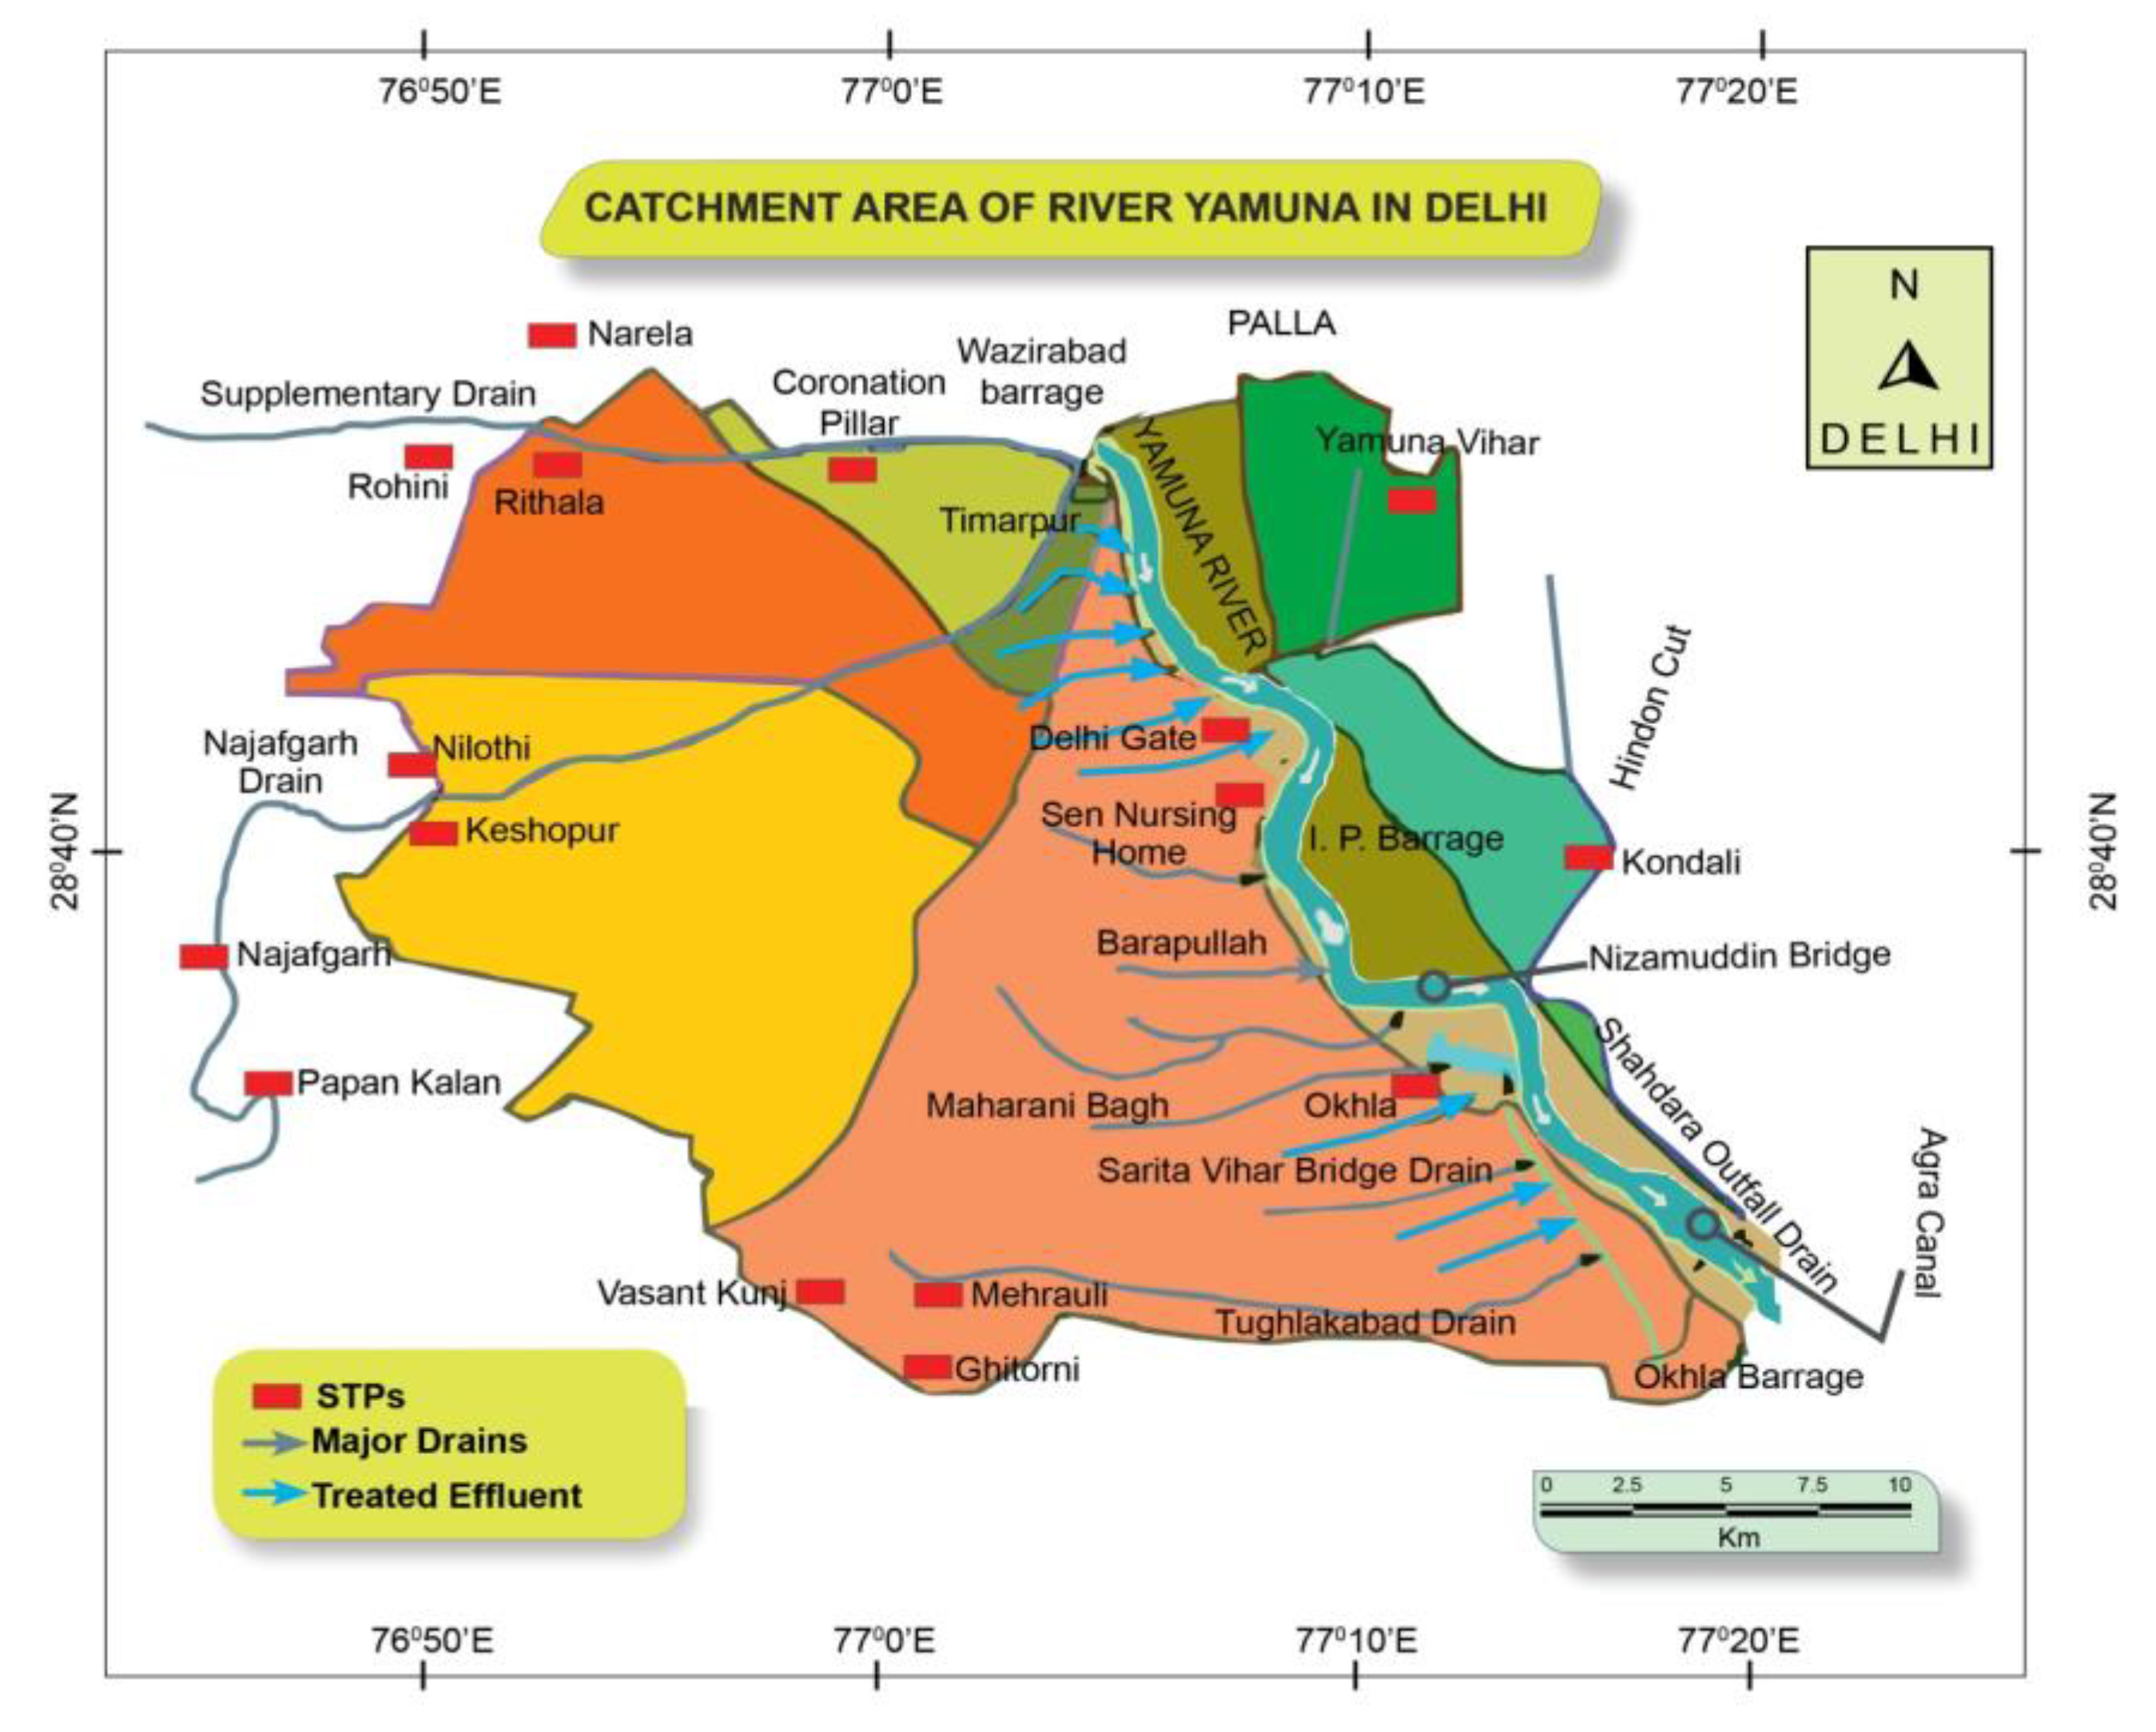
There are several sources of pollution in Yamuna at different locations and in numerous natures. The major source includes sewage from the domestic sector, including unauthorized human settlement/commercial centres, which contribute more than 80% of total wastewater discharge into the river. A considerably high number of legal and illegal small-scale/tiny service industries present in Delhi generate industrial waste. Augmentation of urban population and enhanced domestic water supply coverage and sewage produces huge amounts of municipal wastewater. Pollutants are different, like organic matter, suspended solids, detergents, oil & grease, etc. Cattle wading, dairy waste and open defecation in unauthorized settlements all along the Yamuna bank, including rural areas, adds Dumping of solid waste, including puja material, is prominent at places like Wazirabad, I.S.B.T., Loha Bridge, I.T.O., Nizamuddin and Okhla. Hotels, restaurants, banquet halls, dhabas, eating house establishments, hospitals and healthcare establishments also add to commercial and mixed land use areas. Even two decades ago, the pollution contributed by catchment areas in Delhi was high. Delhi alone drains approximately 3296 MLD (Million Litres per day) of sewerage into Yamuna. The 18 major drains outfall into River Yamuna with about 3026 MLD of wastewater discharge into the river (Economic Survey of Delhi, 2019-20) (
Figure 2 and
Figure 3).
The augmentation of industrial growth has greatly impacted the COD (Chemical Oxygen Demand) level (industrial waste). Water quality in the upper reaches is good (Class 1), while in the lower sections, from Delhi, the quality deteriorates and reaches Class IV. Quality improves again downstream of Delhi. The construction of Common Effluent Treatment Plants (CETPs) through the government's efforts has been partially effective. As a result, it is pertinent to move polluting industries to other places and take effective steps to reduce industrial pollution. The COD levels have been incessantly rising at Nizamuddin Bridge. The reasons for this increase are:
- i)
Deficit of CETPs catering to industrial wastage.
- ii)
Unauthorized industrialization in dwelling areas.
- iii)
Primary attention is given to the fulfilment of water requirements than to wastewater management and cleaning of the Yamuna River.
- iv)
The COD level at Wazirabad Barrage has been steady, which shows that the negative effect of industrialization is notable in Delhi only.
The various urban centres on the Yamuna River banks use the river's fresh Water for their activities. In return, they drain the entire wastewater back into the river, which causes the depletion of Yamuna from Delhi's urban agglomeration to the Chambal River Confluence. Delhi's drinking water sources are limited, with Yamuna and the depleting groundwater being its major water source. About 40% leakage loss due to an ageing water supply system leads to further reduced water availability to the users. Hyper-urbanization, increasing informality and planning failures, absence of monitoring tools and information systems, ambiguous and fragmented institutional responsibilities, institutional corruption, multiple authorities in charge, fragile financial base, lack of accountability, lack of sustained political will and absence of coordinating body are major hindrances hitting at unsustainability of Delhi wastewater management practices. Urban agglomerations at NCT Delhi, followed by Agra and Mathura, are the primary contributors to water pollution in the river. Domestic sources contribute to 85% of the river's total pollution. Extraction of a significant amount of river water leads to further deterioration as no fresh water is left, which is an important factor in maintaining the assimilation capacity of the river.
As per the Central Pollution Control Board, the water quality of River Yamuna lies in the category "E", which renders it unfit for any possibility of underwater life and fit for only industrial cooling and recreational purposes. As per the data available on the water quality of water bodies and groundwater locations, Yamuna ranks seventh on the list of rivers with the highest BOD (Biological Oxygen Demand).
As per NGT (National Green Tribunal), till July 2018, there were 41 STPs at 22 locations, out of which 6 STPs were closed, mostly for up-gradation, 20 STPs were receiving wastewater (sewage) below the installed capacity, 5 (as per the DJB test reports) to 9 (as per DPCC's test report) were not meeting the design parameters. According to Delhi Pollution Control Committee's (DPCC) 2019 report, 14 STPs out of 35 functional STPs were non-compliant on one or the other parameter. Continuous performance monitoring of all the STPs and CETPs is necessary to ensure that the treated effluent of the STPs and CETPs conform to the discharge standards prescribed in the Environment Protection Rules, 1986 (Yamuna Monitoring Committee Report, 2020). To fulfil the requirement as per Sewerage Master Plan- SMP 2031, the land allocation issues at various locations are to be prioritized with stakeholders like Delhi Jal Board (DJB) and Delhi Development Authority (DDA), Gram Sabha and private land. The population living in unauthorized colonies and jhuggi clusters also add to the difficulty in managing sewage treatment plans.
DJB produces 935 MGD of fresh Water (including nearly 9% of this as borewell water). Taking 80% of Water as sewage generated, the total sewage generated is 748 MGD, supplied to various STPs, in
Figure 4. Treatment of 540 MGD of sewage is currently being done with a total sewage treatment capacity of 597 MGD. It is nearly 90% of the total capacity. The plan is to extend the capacity to 707 MGD till mid-2023 with 100% capacity utilization. The largest STP in India shall be constructed at Okhla, costing about Rs. 1161 crore, and will likely be accomplished by June 2022 (The Hindu). An interceptor sewer project is an integrated approach, as per the DJB, aiming towards zero sewage flow into the drains and, subsequently, the river. The project includes laying 115 km interceptor sewers which will collect sewerage from 135 sub-drains which today are discharging wastewater into the three major drains of Barapulla, Shahdara and Najafgarh and then their diversion into the nearest STPs. The three drains are collectively responsible for 70% of the total pollution in Yamuna. The project was planned for commissioning by June 2014, but against 242 MGD, only 99 MGD of sewage was trapped and treated by 2018. Also, there are nearly 28 industrial clusters in Delhi, out of which 17 industrial clusters have Water consuming industries and are connected to 13 CETPs. The rest of the 11 clusters have only dry industries and do not generate significant effluent. 7 of the 13 CETPs do not meet prescribed standards. After the enforcement action, Water inflow to CETPs through the conveyance system has increased considerably, indicating reduced discharge of waste water/ industrial effluents by industrial units in drains/ other systems.
1.1. Objectıves of the study
The study has been carried out with the following specific objectives:
Analyze the status of drains in the Delhi region.
To study the status of water quality parameters at nine major monitoring locations in Delhi.
The correlation analysis to find out the relationship among factors contributing to water pollution of River Yamuna in various locations and develop a water quality correlation matrix.
1.2. Literature Review
In the past, various authors have worked to study the river's water quality. Sharma et al. (2017) analyzed the water quality of Yamuna from 1999 to 2009 before a systematic restoration plan. The QUAL2Kw, a river quality model, has been used to combine The model was applied to simulate total coliform, BOD, DO and total nitrogen at four monitoring stations in Delhi. Sensitivity analysis highlighted that DO, TN, CBODf and TC predictions are significantly responsive to point source flow and headwater flow and quality. Mandal et al. (2010) studied Yamuna River pollution concerning a few parameters in five locations. Seasonal and geographical variations of pollutants during 2000–2005 were studied for 6 years. His study results divulged that the lowest pollution levels are observed during monsoon season. Statistical analysis shot shows
Various approaches have been used to study the environmental flows assessment (EFA), such as perspective and interactive approach, bottom-up and top-down approach, etc. Various authors have contributed to the development and evaluation of these assessment methodologies, such as Tharme (2003), Dyson et al. (2003), King & Brown (2003), Acreman & Dunbar (2004), Jha et al. (2008), Arthington (2012), Hatfield et al. (2015), Linnansaari et al. (2012). The methodologies are further strengthened by Hydrological Methods, Habitat Simulation Methods, Hydraulic Rating Methods, Holistic Methodologies, etc., from time to time. Jain & Kumar (2014) have provided an account of various e-flow assessments in Indian rivers. NGT assessed the environmental flows for the Yamuna River using the HEC-RAS model (Husain et al., 2018). Yamuna Monitoring Committee, 2020 proposed the approach for e-flow assessment used before for the Ganga basin. Various parameters are used to assess the water quality time by time. Of late, the water quality of the Yamuna in Delhi is being tracked by the DPCC. The main parameters monitored are – (potential of Hydrogen) pH, (Total Suspended Solids) TSS, (Biological Oxygen Demand) BOD, (Dissolved Oxygen) DO, Chemical Oxygen Demand) COD, ammonical nitrogen and phosphates, along with other quality checks. This paper focuses on the most distinguished pollution-causing factors of the Yamuna River and the feasible measures to avoid further degradation and enhance water quality.
2. Materials and Methods
Secondary data sources are used for analysis. The major interpretations in this paper are based on the data sourced from Delhi Pollution Control Board, Delhi Jal Board (DJB), Central Pollution Control Board (CPCB) and Central Public Health and Environmental Engineering Organization (CPHEEO).
The paper utilizes secondary data analysis of the parameters impacting the river's water quality. Tabular analysis, graphical presentation, trend analysis and correlation analysis have been used to determine the relationship among different factors contributing to water pollution in the River Yamuna. Correlation is performed for nine different locations in the Delhi region for River Yamuna for the study parameters COD- BOD. The correlation coefficient is expected to be significantly high for these locations to reflect a positive association. These locations include – Palla, Surghat, KhajoriPaltoon Pool, Kudesia Ghat, Nizamuddin Bridge, ITO Bridge, Okhla Barrage (Downstream), Agra Canal Jaitpur and Agra Canal Okhla. The water quality correlation matrix of river Yamuna at different locations in Delhi is also presented and analyzed.
3. Results and Discussion
Delhi, the capital of India, is a small territory and a largely urbanized city-state with a huge and growing population concentration, which requires services with a regular water supply and efficient sewage treatment. Around half of the Delhi population resides in informal settlements plagued by precarious sewerage, sanitation issues and many water and wastewater-related problems. Of the total water availability in Delhi from all resources (937 MGD (Million Gallons per Day)), nearly 63% is used for domestic purposes, followed by institutional (19%) and industry and commerce (18%) (NIUA-UNESCO, 2021). Delhi drains an estimated 1800 million litres of untreated wastewater daily into the Yamuna, posing a huge problem (Zimmer, 2015). Delhi's population generates wastewater of over 3,987 million litres per day. Out of this generated waste, only 47% is treated, utilizing just 63% of the total treatment capacity. There are 28 approved industrial areas, 22 redevelopment areas and non-conforming areas that come up with pollutants like organic matter, inorganic matter including heavy metals, suspended solids, oil & grease, etc., wherein the latter part contributes around 20% of the total wastewater discharge (RRC, 2019).
Over the years, about Rs. 7,000 crores have been spent cleaning Yamuna through Yamuna Action Plans. But the examination of the river's water quality over the years reveals that despite all the efforts, there has been minimal to zero effect on the water quality standards of Yamuna in its Delhi stretch (CPCB, 2017). Through the Interceptor Sewer Project, the target was set in 2008 to achieve BOD level of 12 mg L-1. However, since its inception a decade ago, by 2016, the BOD levels in the Water have just reduced from 55 mg L-1 to 47 mg L-1. It is still far from the perceived target.
The Delhi Jal Board, a state agency, is authorized with waste management and treatment of sewage in Delhi. However, over 25 percent of the existing capacity is underutilized due to the unavailability of land, inefficient sewage conveyance and inaccurate population projections in the catchment area of an STP. Moreover, the overall capacity available is less than the required. Additionally, about 30 percent of the operative capacities don't meet the basic water quality standards. Reasons such as dumping municipal waste via stormwater drain that carries untreated wastewater, poor quality of treated Water and the lack of dilution of wastewater due to paucity of freshwater are a few factors responsible for wasting huge investment without any significant impact on the water quality standards of the river. Due to complicated and large-scale technology, it is tedious and expensive to improve the quality standard and capacity of treatment of centralized STPs. As per the DJB, it would take around Rs. 20,000 crores and two decades to solder the entire Delhi into a centralized sewage system as 46% of the area in the city is presently un-severed.
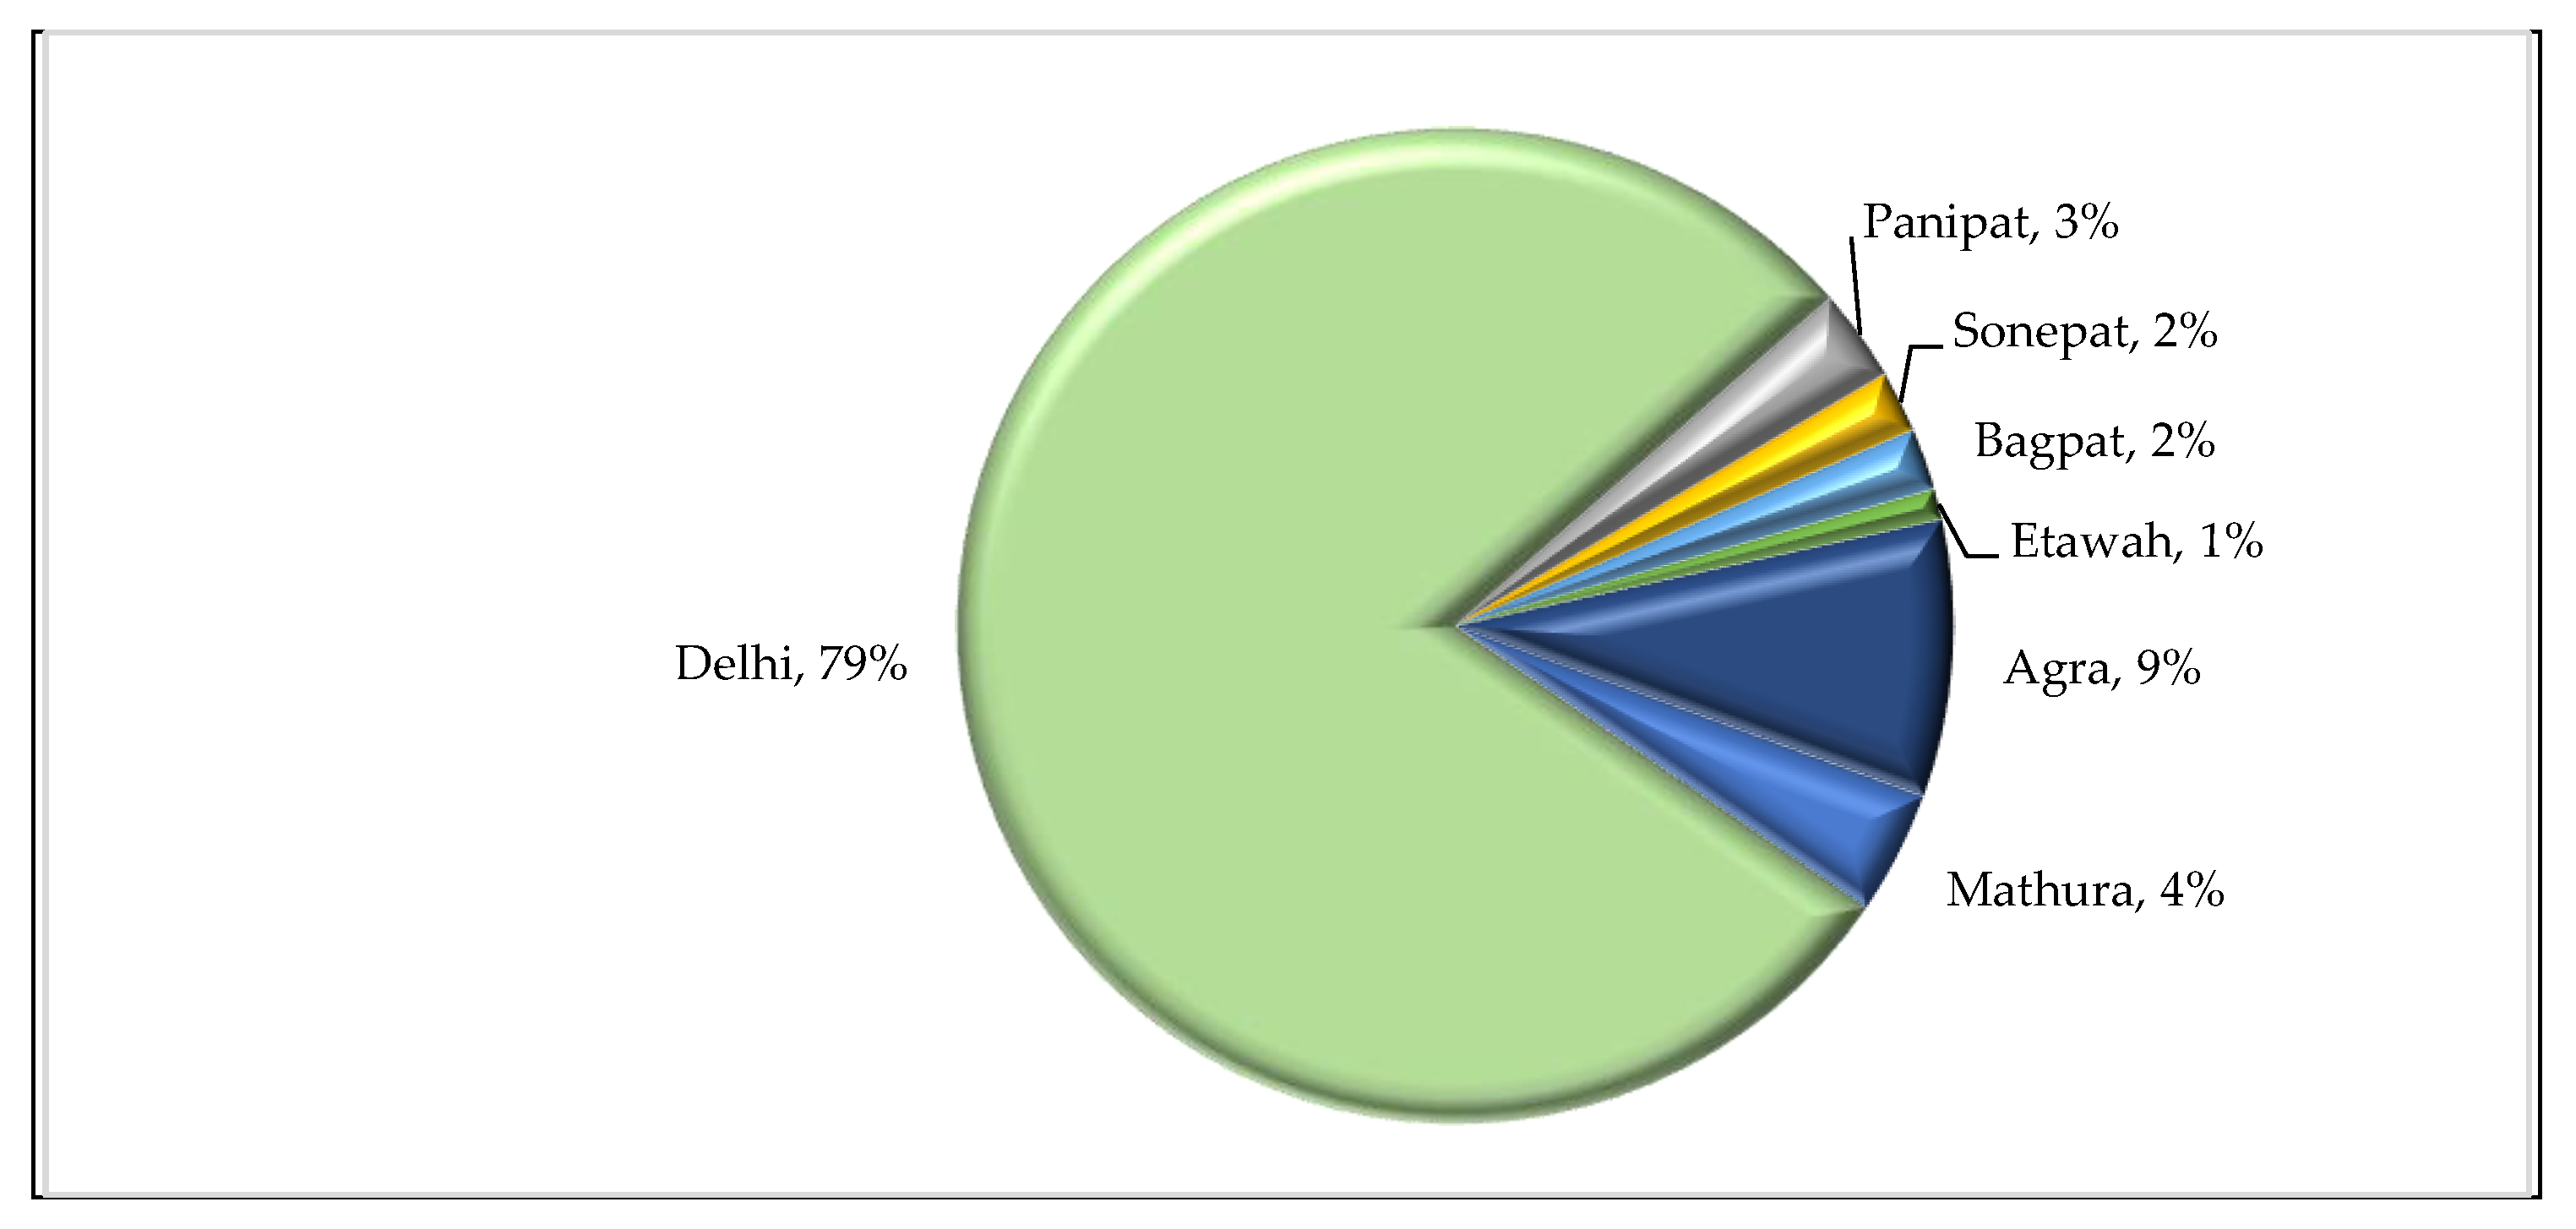
Delhi contributes nearly 79% of the total pollution load in river Yamuna compared to nearby cities (
Figure 5). The unabated discharge of wastewater predominantly from the domestic sources of the city into the river is the foremost reason for the depletion of water quality of the Yamuna River, predominantly after the Wazirabad barrage in the Delhi region. Both cities have a critical status in drinking water supply as it is quantitatively insufficient and qualitatively unsuitable.
Another reason is the non-availability of freshwater in the river after the Wazirbad barrage in the non-monsoon period, which is important for maintaining the self-purification capacity of the river. The primary source of water supply in Delhi is River Yamuna contributing nearly 41.1% of the water resources. It is followed by Ganga River (26%) and Bhakra storage (24%).
The status of drains is analyzed in the Delhi region. Results suggest that the flow contributed by all the drains is nearly above 3000 MLD each year in three years, from 2017 to 2019. The six major drains contribute nearly 90% of the flow and more than 86% of BOD load into the river Yamuna. The Najafgarh drain is the largest, contributing nearly 60% and above of the overall flow in Delhi (
Table 1).
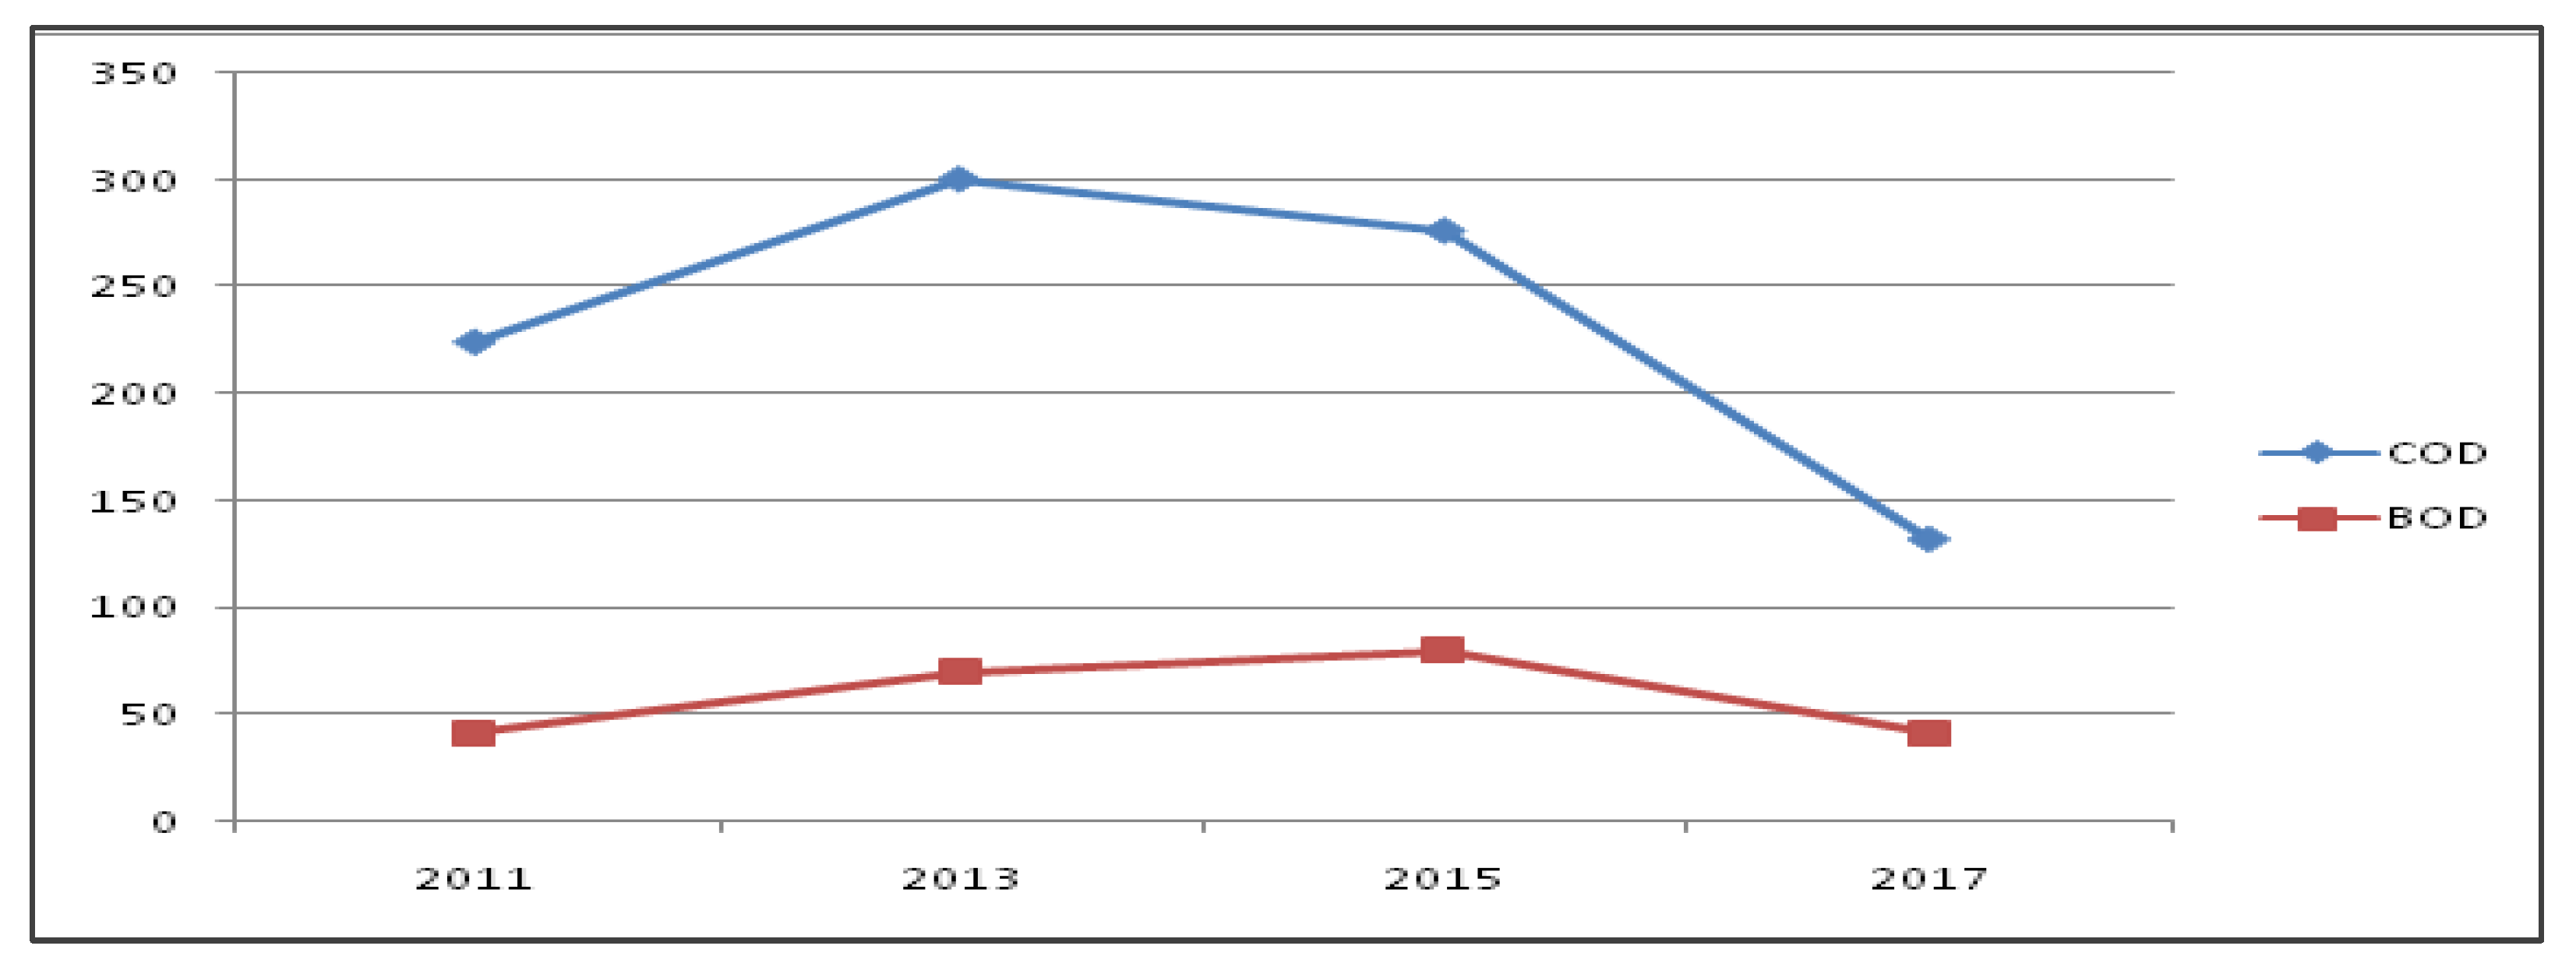
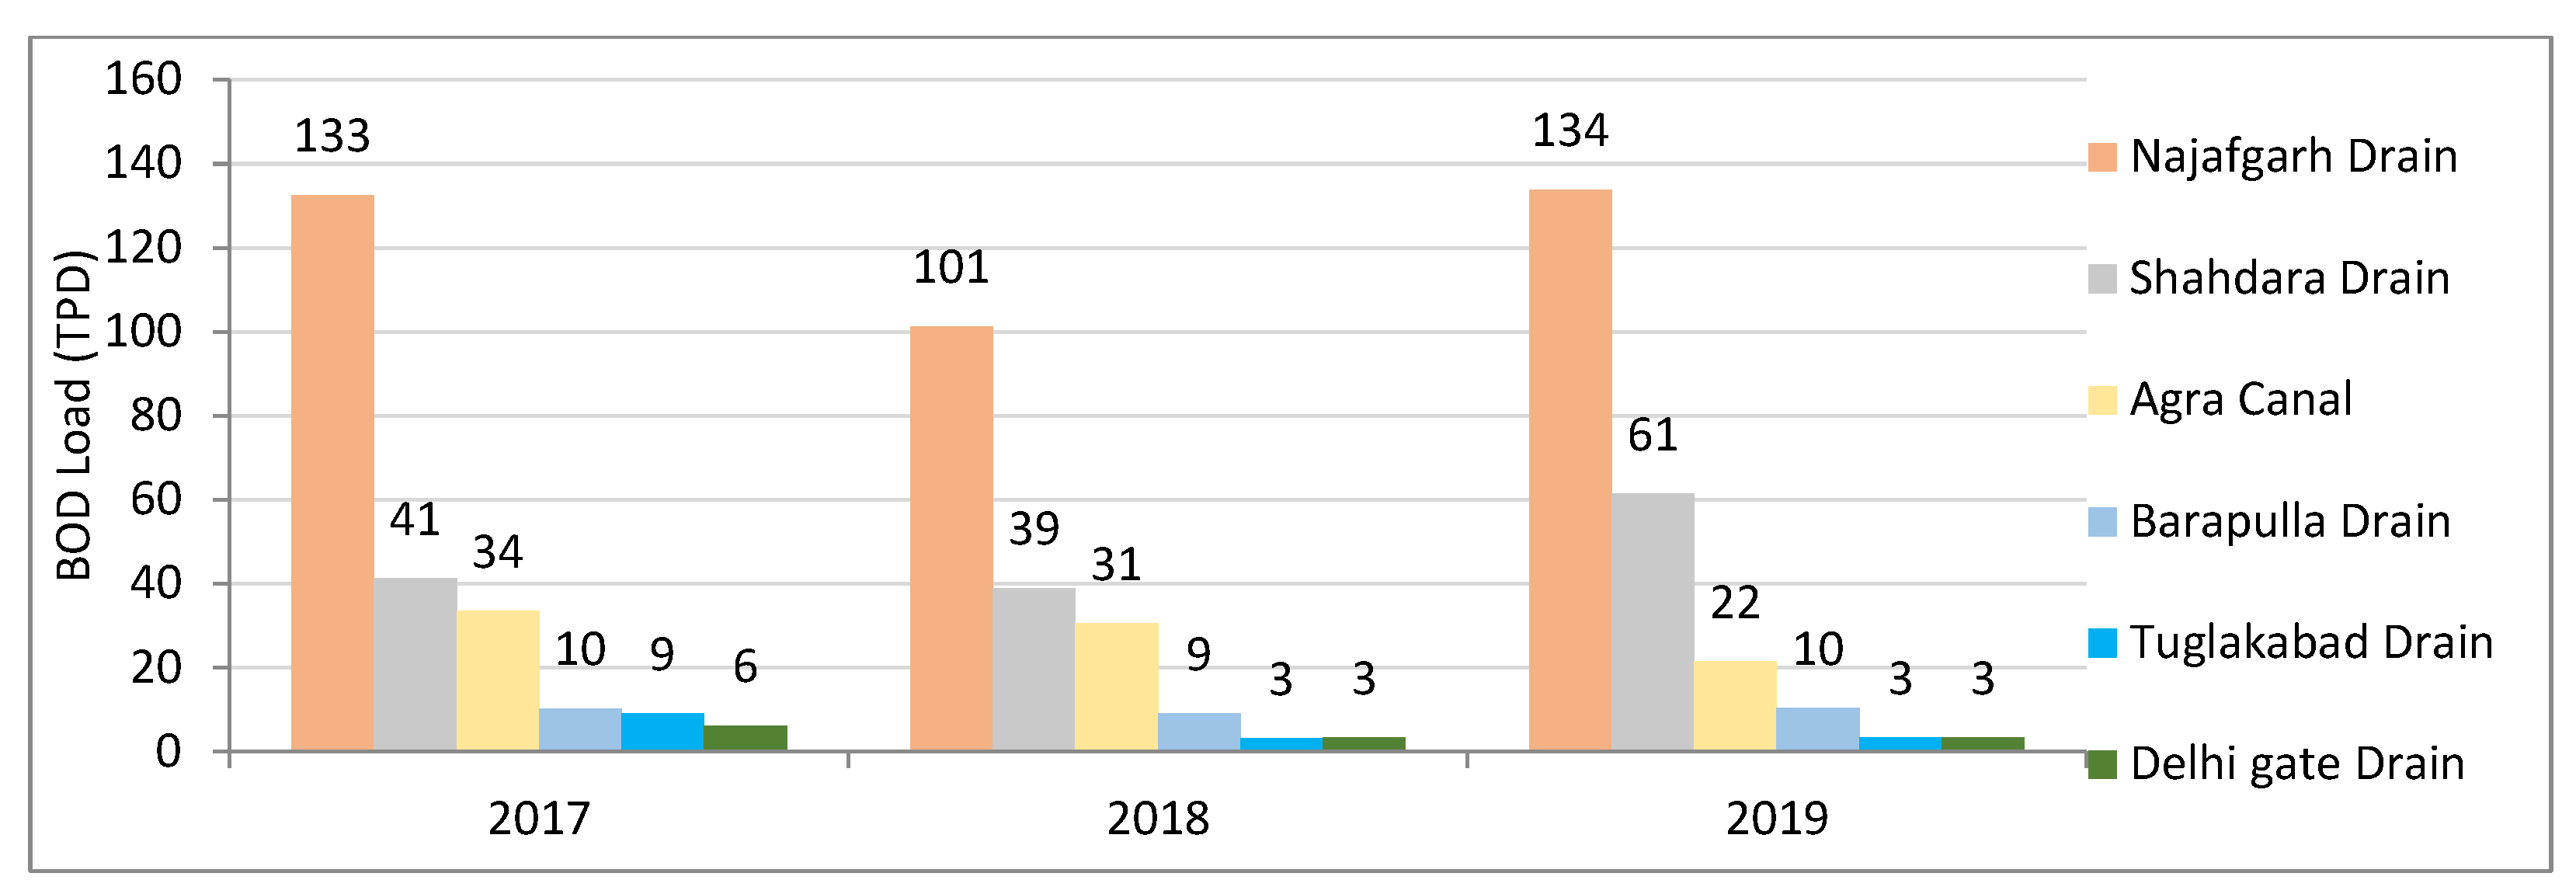
In the three recent years, the drain contributed nearly 2000 MLD flow in the Yamuna River, and the BOD load is also reported to be above 100 upto 134 TPD (tonnes per day). It is followed by the Shahdara drain, where the flow is nearly 500 MLD, and the BOD load varies from 39 to 61 TPD. The COD and BOD parameters for the largest drain in Najafgarh are also reported from 2011 to 2017 based on alternate-year data (
Figure 6). The BOD load in six major drains for three recent years (2017-19) is reported in
Figure 7.
The worrying status is reflected in the data, but the flow from the drains in the river witnessed a decline during the last three years from 3450 MLD in 2017 to 3026 MLD in 2019. İt is mainly contributed by the six major drains as the flow from these six major drains, on a combined basis, has declined from 3126 MLD in 2017 to 2770 MLD in 2019. However, the BOD load witnessed stagnation over the three years.
There are all 24 drains joining Yamuna downstream of Wazirabad, which discharge sewerage and industrial waste into the river. The water quality parameters in mg L
-1 basis for these 24 drain locations for 2019 are reported in
Table 2 in detail. It is highly inadequate to meet the dilution requirement to achieve the desired water quality of BOD, which is nearly 30 mg L
-1. In nearly all the drains (sr. no. 1 to 4), the BOD level is nearly close to the water quality criterion, but for most of the drains (sr. no. 5 to 21), this is reported at disappointing levels. İt is upto six folds above the standards for some drains. The BOD, COD and TSS levels are reported to be the least for drain no. 14 (sr. no. 11). Overall, the water quality standards vary from different drains in the pH range (7.6 to 7.8 ). The other water quality parameters vary in the range of TSS (least 48.5 mg L
-1 to highest 419 mg L
-1), COD (least 51 mg L
-1 to highest 554 mg L
-1), BOD (least 15 mg L
-1 to highest 187 mg L
-1) - the least for Drain no 14 and highest for Sahibabad drain.
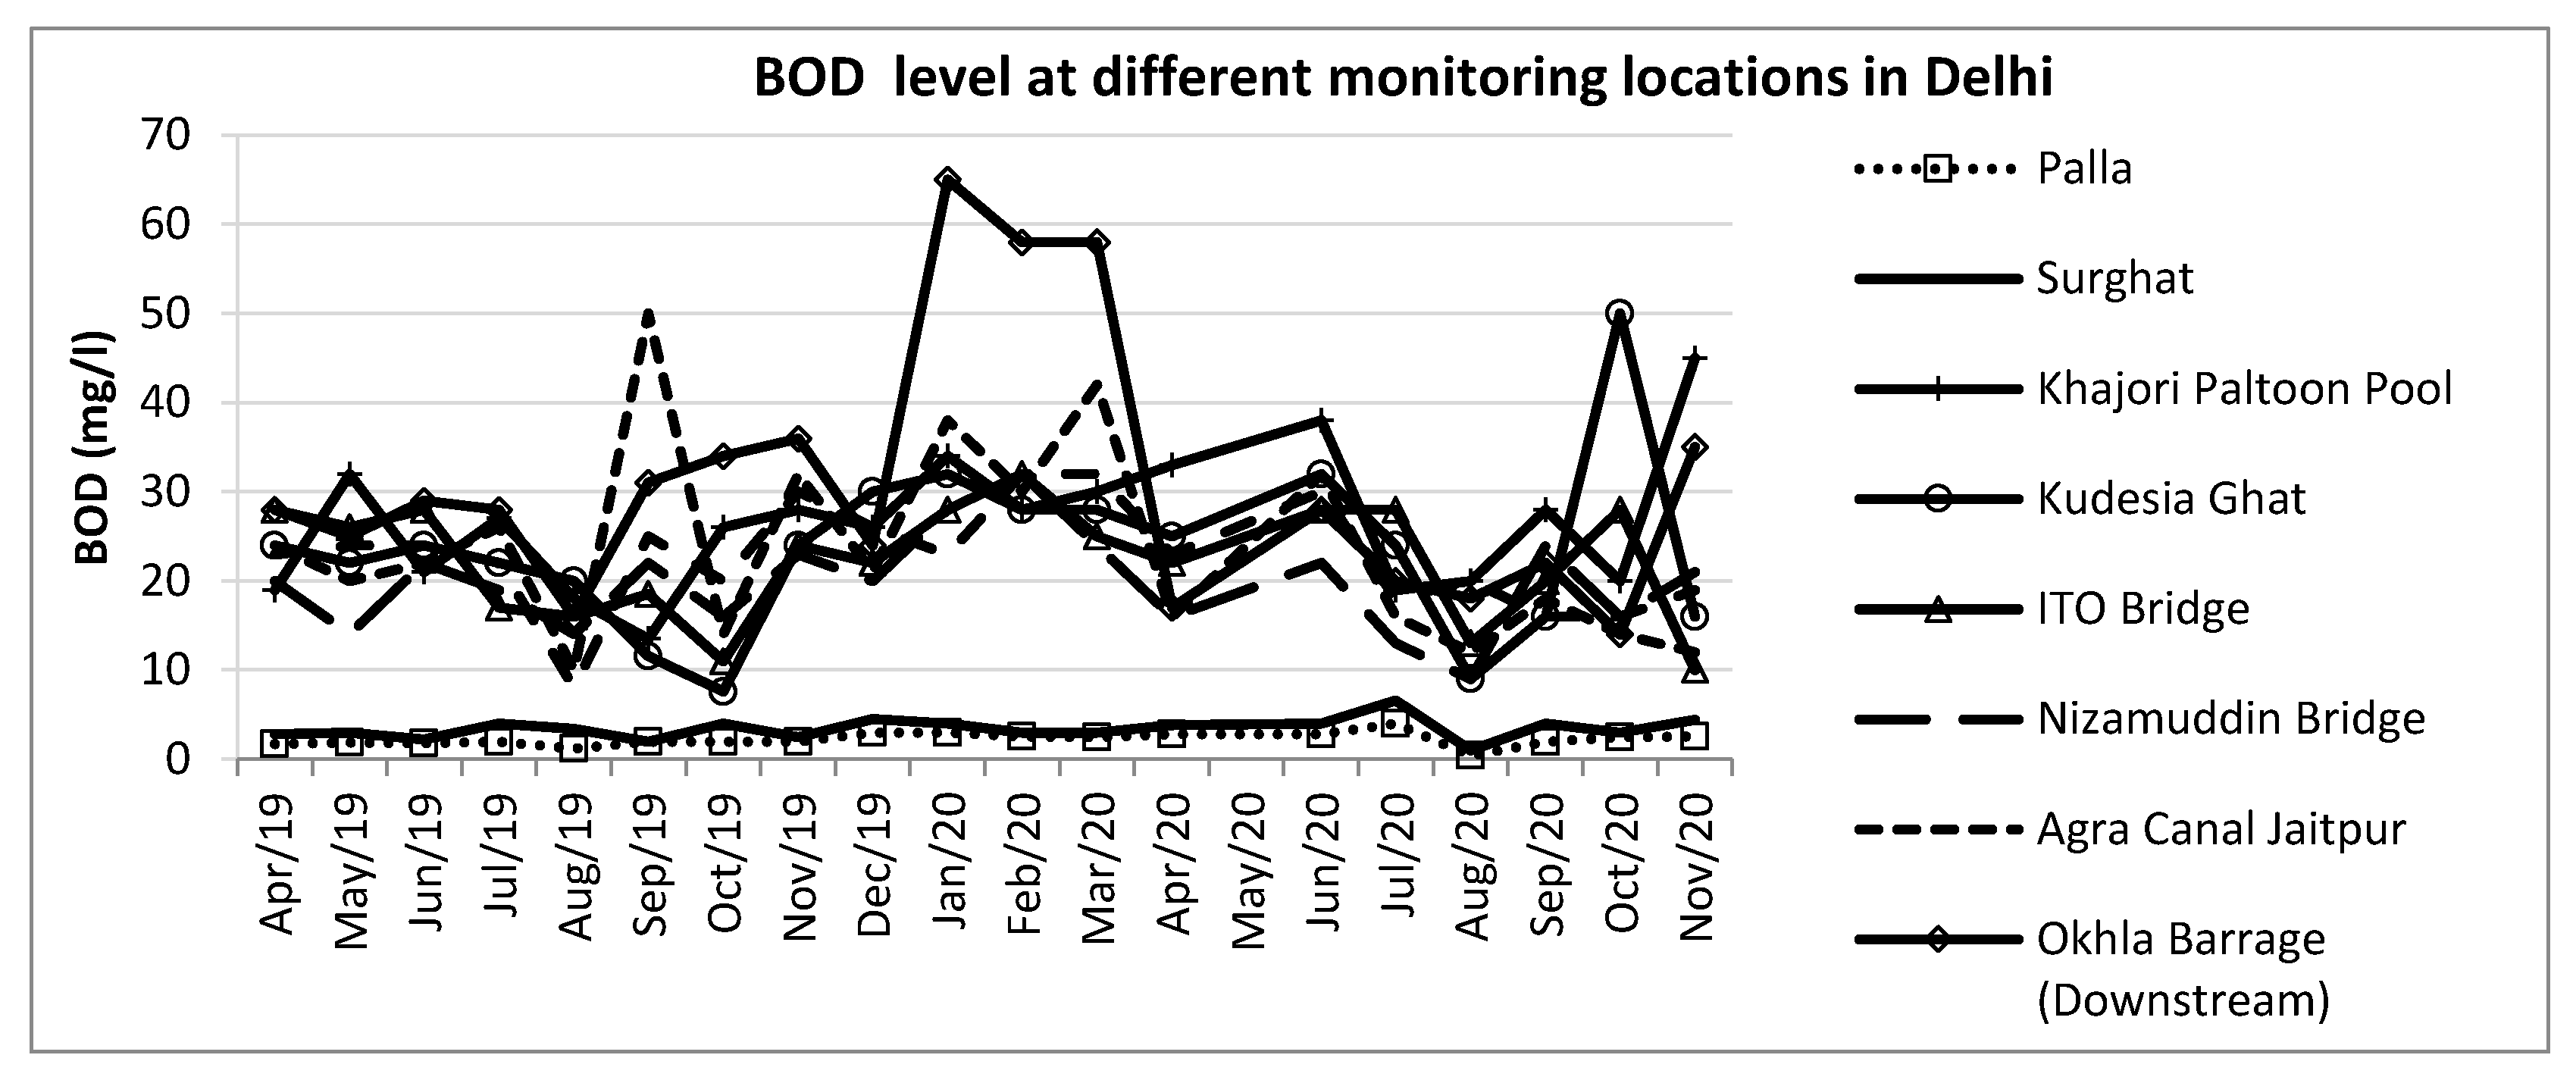
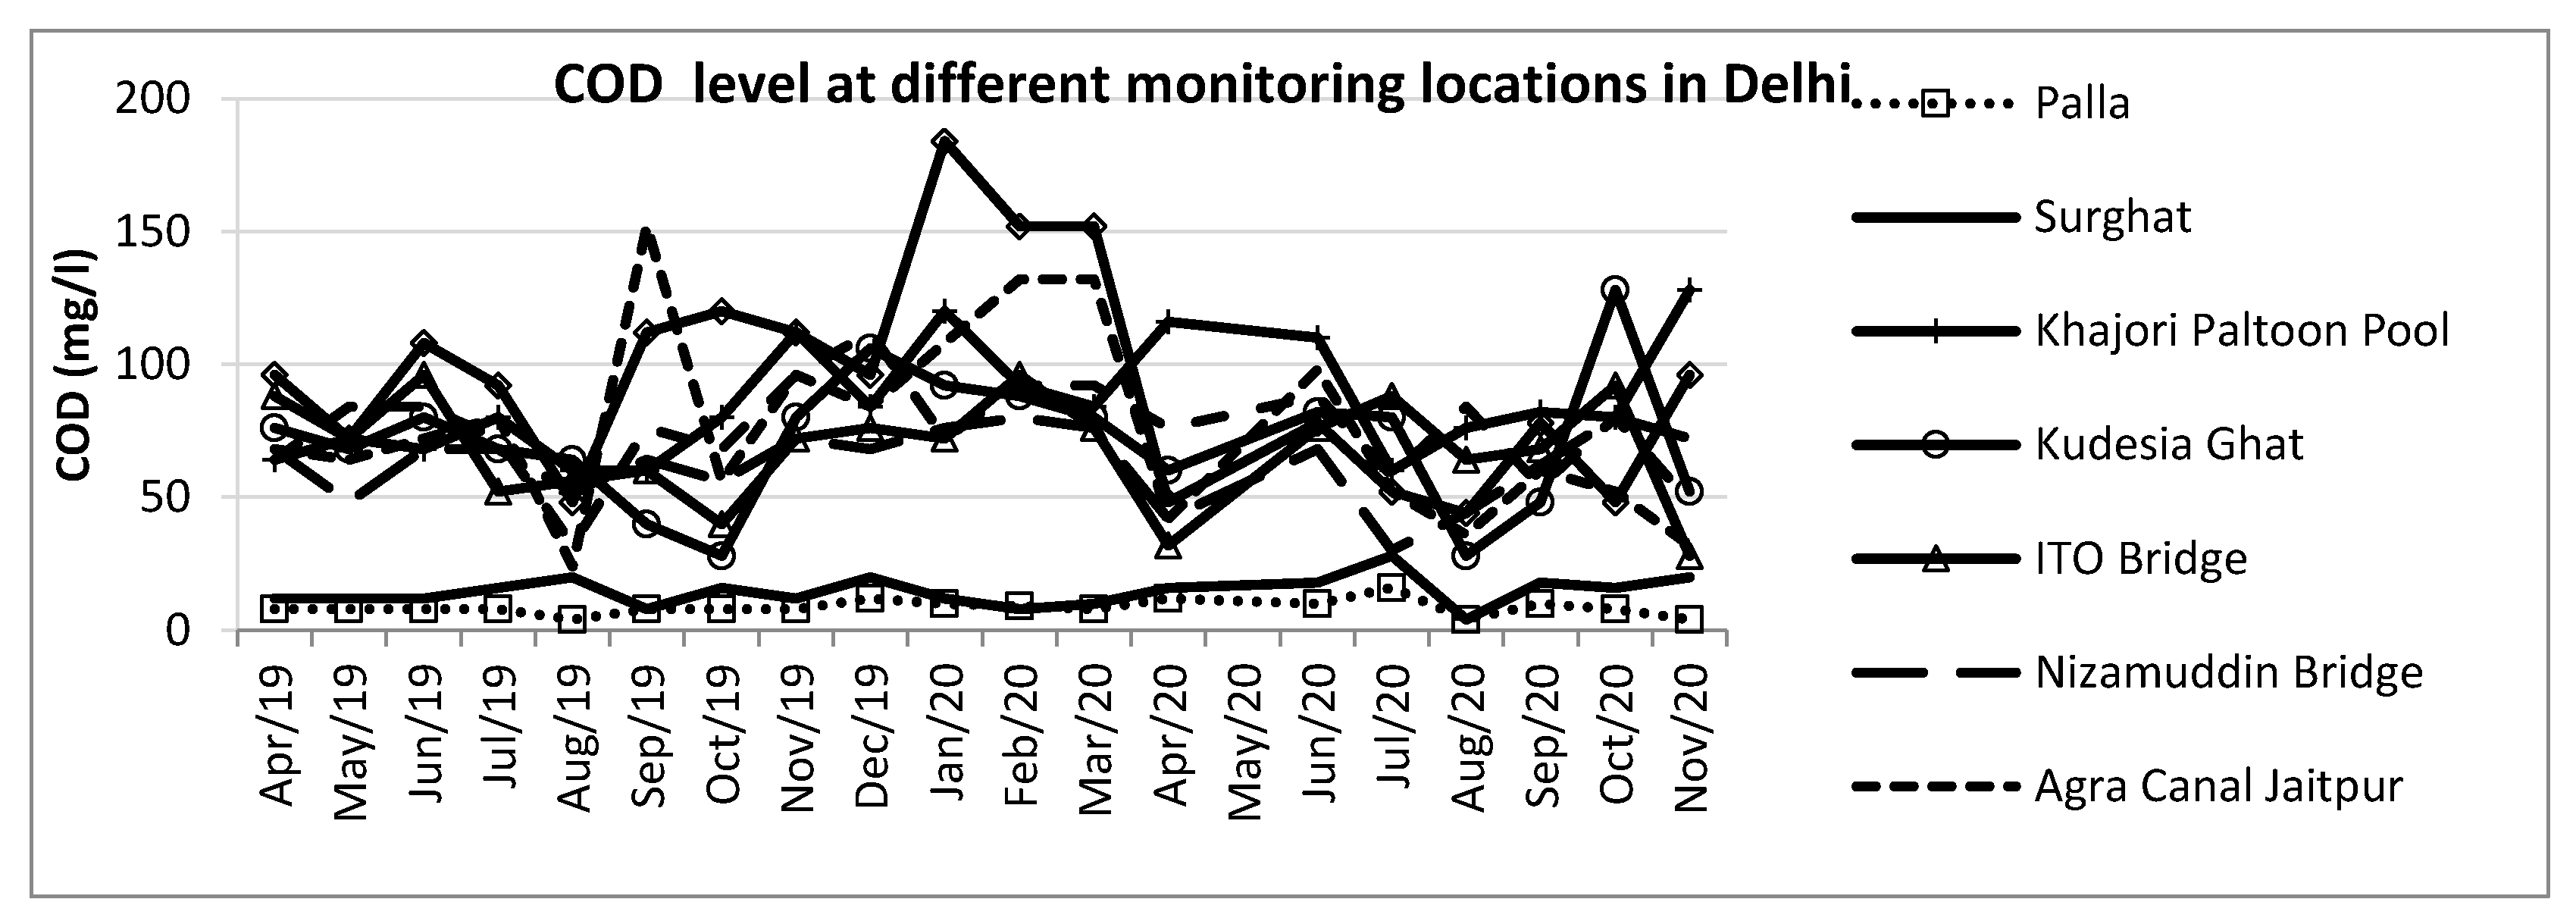
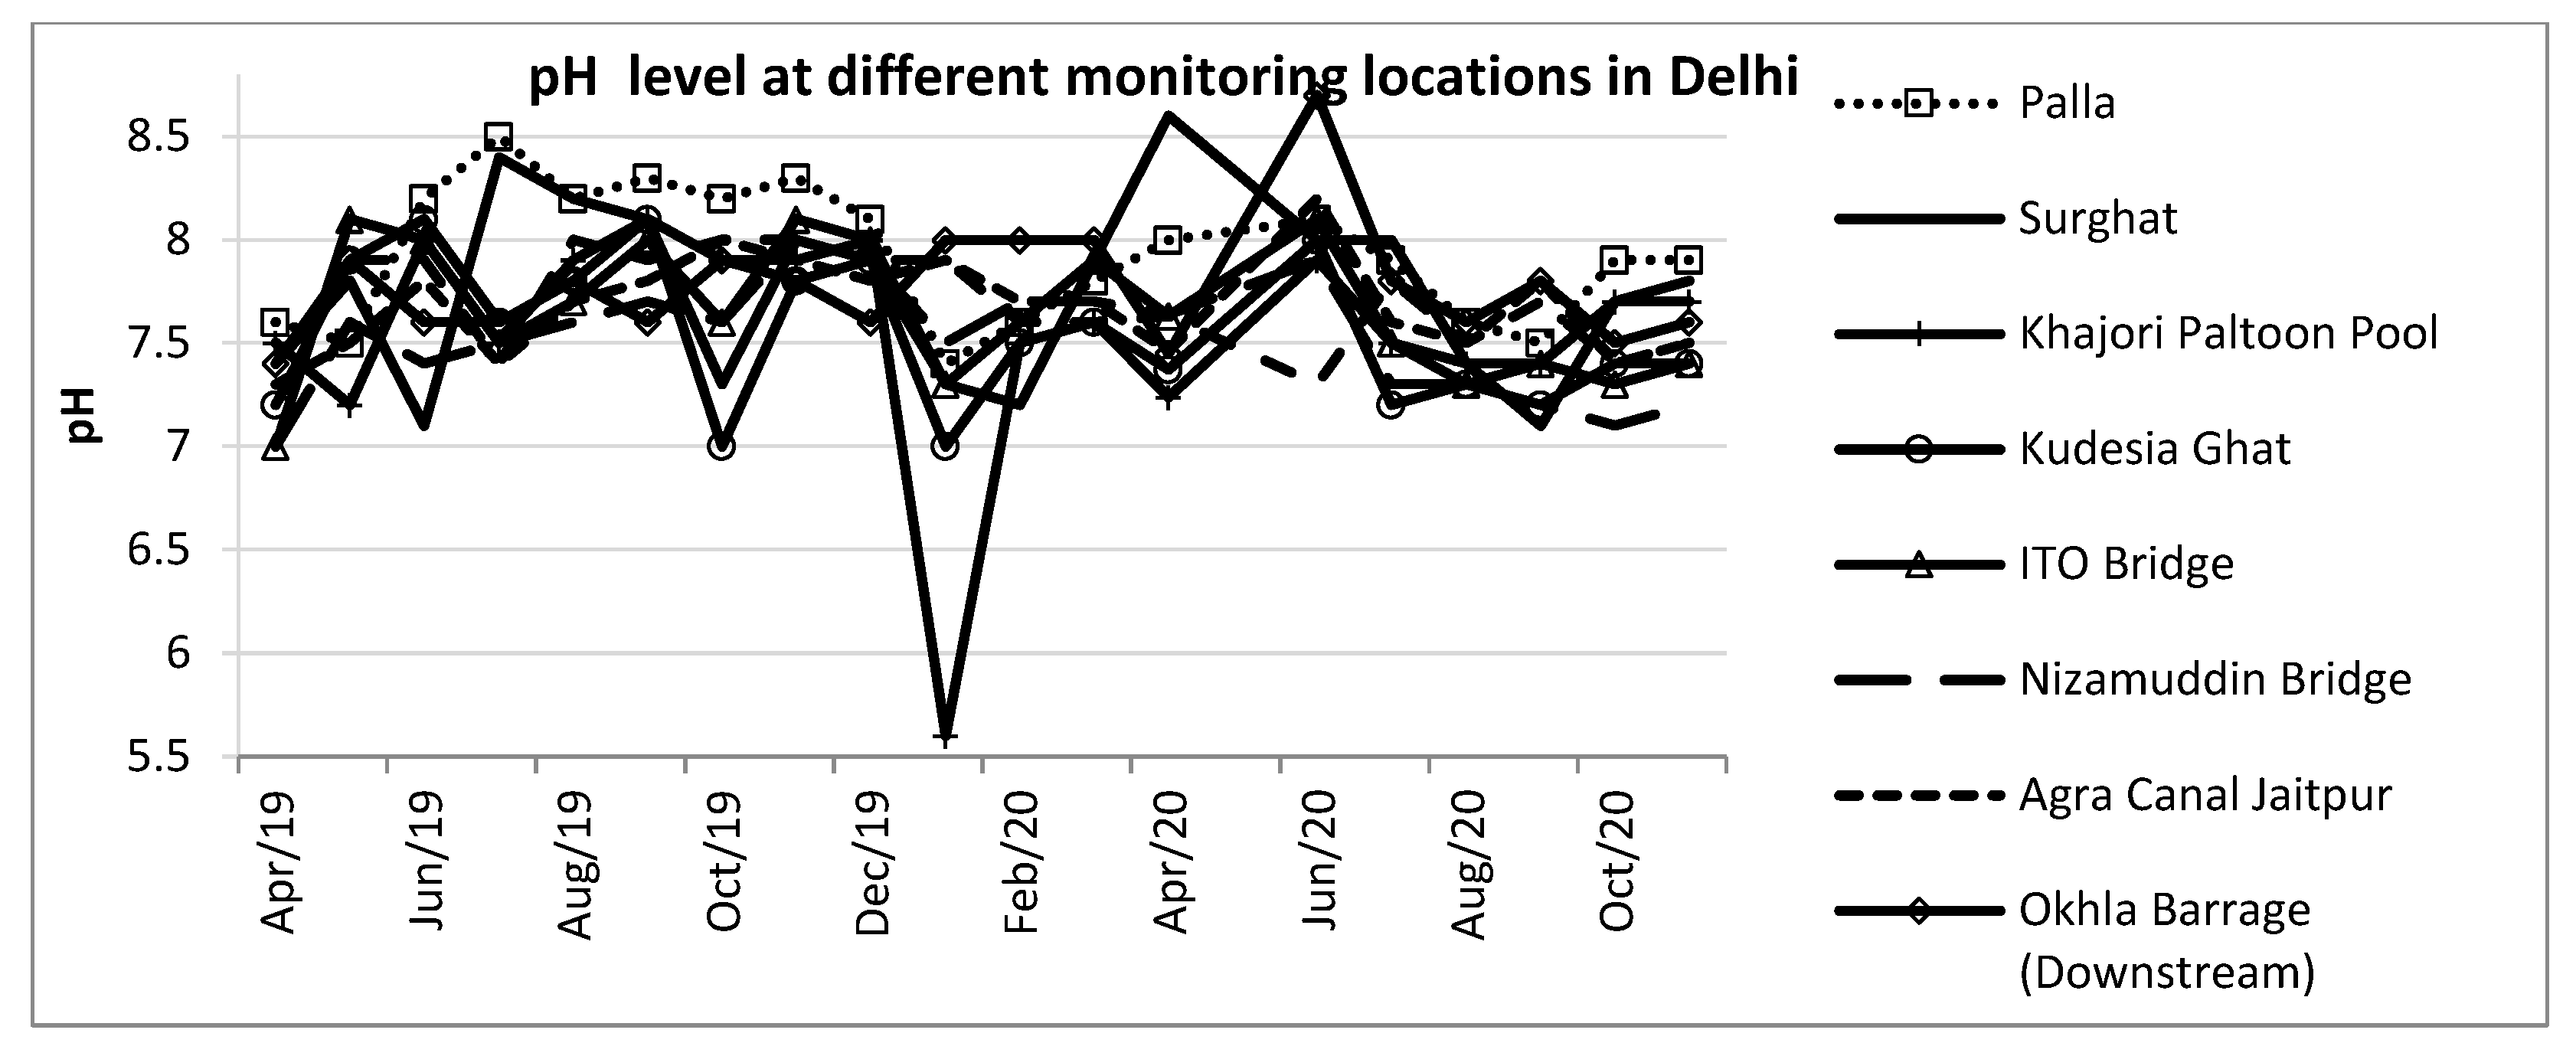
The status of water quality parameters is studied for nine major monitoring locations in Delhi. These locations include – Palla, Surghat, Khajori Paltoon Pool, Kudesia Ghat, Nizamuddin Bridge, ITO Bridge, Okhla Barrage (downstream), Agra Canal Jaitpur and Agra Canal Okhla
. Figure 8,
Figure 9 and
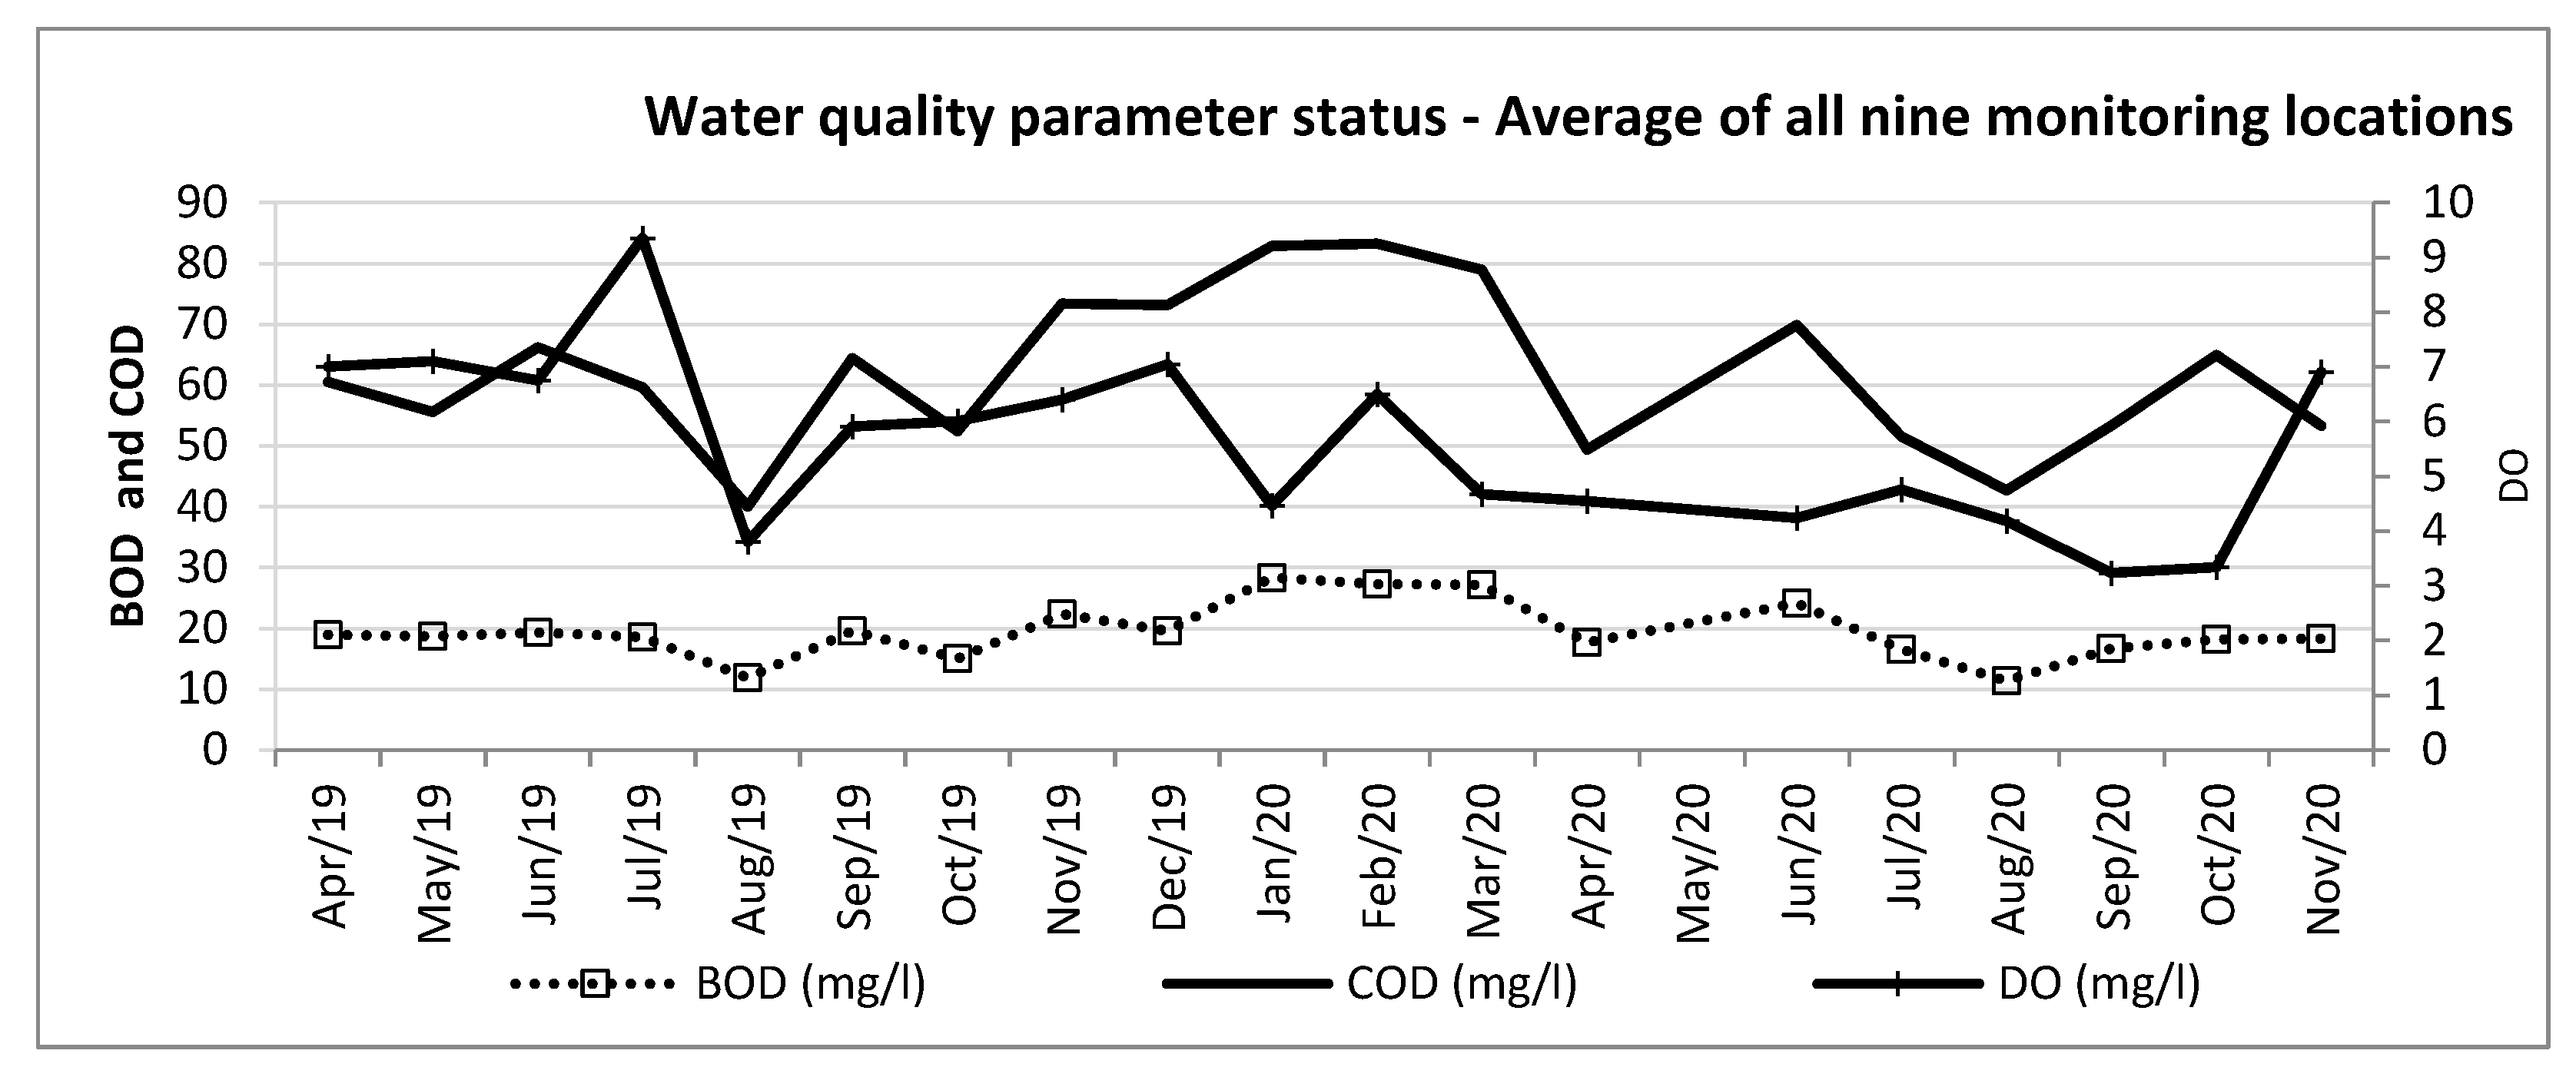
Figure 10 indicate the level of BOD, COD and pH in the river Yamuna at nine locations in Delhi recently. The monthly data is utilized from April 2019 to the latest available month, November 2020. Most parameters are above the hazardous level to use the river water for domestic and industrial use. Monthly data analysis highlights that during the monsoon months, around August, the level witnessed a minimal decline indicating the seasonality effect in water quality parameters with time. The entry locations of the Yamuna in Delhi, such as Palla and Surghat, witnessed a lower level of BOD and COD compared to other locations.
Figure 11 indicates the trend in water quality parameters as the average of all nine monitoring locations in Delhi, on a combined basis, in recent times.
Finally, the correlation analysis is performed among the parameters for the mentioned nine monitoring locations and the average values of all nine locations in Delhi on a monthly data basis. First, the average values of all the study parameters are calculated for all nine locations to calculate the correlation of average values. The correlation is computed among the study parameters. The outcome indicates a highly significant correlation between COD-BOD for almost all the locations (
Table 3). The results reflect nearly 0.94 as the level of association between BOD and COD combined. The correlation for the other parameter relationships appears low. The highest significance is observed at Kudesia ghat, Agra Canal and Okhla Barrage with a 0.95 level of association. The pH of Water remains in range except for a few outliers, reflecting a low significance level with BOD and COD.
Also, the correlation between parameters COD-BOD based on cross-sectional data (as reported in
Table 2) for 21 drain locations for the particular year, 2019, is calculated. The result indicates a very high (0.987) association. İt reflects that all the drains are closely associated with COD and BOD flow levels.
The current sewage system in Delhi requires constructing large-scale operation and maintenance infrastructure, which should be centrally overseen for their performance and accomplishment. The long conveyance structures are a bottleneck in identifying system issues and the subsequent requirement for clogging rehabilitation and leakages in time. This results in a lack of efficiency and effectiveness of these exorbitantly priced technologies. The way ahead is to focus on domestic sewage management via local and decentralized systems as against centralized systems and encourage the re-use of treated Water to ensure sustainable reduction in the direct sewage water disposal by 22 drains of Delhi into the Yamuna.
Decentralized systems exhibit feasibility on all fronts, such as socio-economic, administrative, planning, technological and environmental fronts, given shortcomings are monitored. DJB and community institutions, in unison plan the system, which is managed at the community level under the monitoring of RWAs (Resident Welfare Associations) and DJB. It shall enhance the responsibility and accountability of the community. Further, this bottom-up approach to constructing future sewage system plans will make these plans fool-proof. It would also lead to a better bond with the people (who presently lack trust), with DJB promoting increased community involvement and more transparency in operations.
4. Conclusion and Suggestions
The centralized approach followed in cleaning up the river, such as Interceptor Sewer Project by DJB and Yamuna Action Plan I and II under NRCP (National River Conservation Plan), have not substantially and positively impacted the pollution levels in Yamuna in Delhi stretch. The conventional centralized approach poses critical economic, environmental and infrastructural feasibility challenges. A multitude of inefficiencies concerning capacity, quality of Water treated by the existing infrastructure, time and cost required in bringing various un-severed regions of Delhi under the existing ambit of centralized sewage system has inevitably led to a search for finding sustainable, innovative and alternative solutions to the current sewage management.
Analysis of the drains in Delhi reveals that the flow contributed by all the drains is nearly above 3000 MLD each year in recent years, with the six major drains contributing nearly 90% of the flow and 86% of BOD load into the river Yamuna with Najafgarh drain being the biggest contributor of all. However, the flow from these six major drains has declined over time.
Examination of the water quality of 24 drains in Delhi reveals that the BOD levels of most drains are much above the permissible level, with some drains reporting values six times over the set standards. The water quality parameters for different drains vary in the pH range (7.6 to 7.8). The other water quality parameters vary in the range of TSS (least 48.5 mg L-1 to highest 419 mg L-1), COD (least 51 mg L-1 to highest 554 mg L-1), BOD (least 15 mg L-1 to highest 187 mg L-1). The water quality parameters are way above the standards and need solution-oriented monitoring based on locations, seasonal load on drains and quality parameters to focus.
The correlation analysis performed among the parameters for nine monitoring locations indicates a highly significant level of correlation between COD-BOD for almost all the locations. However, the correlation for the other parameter relationships appears low. The high correlation between COD-BOD for almost all Delhi locations indicates finding closely related solutions to deal with the load flow in the river.
The study of the viability of the existing sewage management treatment systems suggests adaptive measures such as promoting better technology and ease of planning along with coordinated administration analysis for the study of cost comparisons for construction, operation and maintenance. It will ensure that local treatment and re-use of treated Water is socially acceptable. There is a need to increase the capacity for treatment, storage, reopening closed plants and efficient operation to meet the increasing demand for fresh Water. Focus needs to be diverted on managing efficient and localized treatment solutions to the major drains contributing a large proportion of COD and BOD load.
Moreover, on the contrary, adopting localized sewage management systems is a more sustainable way for the future, as these can prove to be more pragmatic than centralized systems. Overall, from a broader perspective, there is a need to look at the possible shortcomings of the adoptive approaches and the system and focus on how these can be addressed. The efficient management of municipal and industrial wastewater is very much required to save the Yamuna for people and aquatic animals.
The discussed and suggestive measures to improve the water quality of Yamuna are summarized:
- i)
Construction of more interceptors to collect sewage water.
- ii)
Discharge of treated Water into the river Yamuna.
- iii)
Increasing the capacity of STPs, as most of them are underutilized.
- iv)
Imposing heavy tariffs on industries/units discharging untreated/partially treated wastewater in drains flowing in river Yamuna.
- v)
Disseminating awareness among the masses and encouraging them to follow preventive steps to avoid pollution in river Yamuna.
- vi)
Creating demand for wastewater in different urban areas sectors like construction, horticulture, industrial coolants, etc.
Funding
The study was funded by Researchers Supporting Project number (RSPD2023R749), King Saud University, Riyadh, Saudi Arabia.
Availability of data and materials
All data and materials are available upon request
Acknowledgements
The study was funded by Researchers Supporting Project number (RSPD2023R749), King Saud University, Riyadh, Saudi Arabia.
Competing Interests
The authors declare that they have no conflict of interest.
Billing address
Yusra Tashkandy(ytashkandi@ksu.edu.sa) Department of Statistics and Operations Research, Faculty of Science, King Saud University, P.O. Box 2455, Riyadh 11451, Saudi Arabia.
References
- Arthington, A. H. (2012). Environmental flows: saving rivers in the third millennium. (Vol. 4). University of California Press.
- Census of India (2011). Office of Registrar General and Census Commissioner.
- CPCB (2013). 'Parivesh'- Sewage pollution- Central Pollution Control Board, Ministry of Environment and Forest, New Delhi, 202-109.
- CPCB (2017). Report of sewerage and sewage treatment plants in Delhi, Central Pollution Control Board, Ministry of Environment and Forest, New Delhi, 126-137.
- CSE (2017). A wastewater recycling manual with case studies, Centre for Science and Environment, Ministry of Housing and Urban Affairs, New Delhi, 85-93.
- Delhi Jal Board (2019). Water Supply and Sewerage, Economic Survey, Govt. of NCT (2019-20), Government Publications, New Delhi, 248-250.
- Delhi Pollution Control Committee (2019). Analysis report CETPs, Government publication, Delhi, 40-50.
- DPCC (2017). Delhi Pollution Control Committee. Analysis report CETPs, Government publication, Delhi, 37-55.
- Economic Survey of Delhi (2019-20). Water supply and sewage, Planning Department, Government of the National Capital Territory of Delhi, New Delhi. 177-193.
- Hameeteman, E. (2013). Future Water (In) security: Facts, figures, and predictions. Global Water Institute, 1, 1-16.
- Hatfield, T. , & Paul, A. J. (2015). A comparison of desktop hydrologic methods for determining environmental flows. Canadian Water Resources Journal/Revue canadienne des ressources hydriques, 40(3), 303-318. [CrossRef]
- Husain, A. , Sharif, M., & Ahmad, M. L. Simulation of Floods in Delhi Segment of River Yamuna Using HEC-RAS. American Journal of Water Resources, 2018, 6, 162-168.
- Jain, S. K. , & Kumar, P. (2014). Environmental flows in India: towards sustainable water management. Hydrological Sciences Journal, 59(3-4), 751-769. [CrossRef]
- Linnansaari, T. , Monk, W. A., Baird, D. J., & Curry, R. A. Review of approaches and methods to assess Environmental Flows across Canada and internationally. DFO Can. Sci. Advis. Sec. Res. Doc 2012, 39, 74. [Google Scholar]
- NIUA-UNESCO (2021). Qualitative Framework to Evaluate the Extent of Integrated Urban Water Management in Indian Cities & Applying the Framework to Delhi, White paper, 79-85.
- RRC (2019). Action Plan by River Rejuvenation Committee (RRC) Govt. of NCT of Delhi for River Yamuna (2019), 22-35.
- Sharma, D. , Kansal, A., & Pelletier, G. (2017). Water quality modeling for urban reach of Yamuna River, India (1999–2009), using QUAL2Kw. Applied Water Science, 7(3), 1535-1559. [CrossRef]
- The Hindu (2019). India's biggest STP to come up at Okhla: DJB, The Hindu, 30th May, 2019. Available online: https://www.thehindu.com/news/cities/Delhi/indias-biggest-stp-to-come-up-at-okhla-djb/article27301495.ece.
- Tilley, E. , Ulrich, L., Lüthi, C., Reymond, Ph., & Zurbrügg, C. (2014). Compendium of Sanitation Systems and Technologies – (2nd Revised ed.). Swiss Federal Institute of Aquatic Science and Technology (Eawag), Duebendorf, Switzerland, 175.
- Yamuna Monitoring Committee Report (2020). Retrieved from yamuna-revival.nic.in.
- Zimmer, A. (2015). Urban Political Ecology in Megacities: The Case of Delhi's Waste Water. In Urban Development Challenges, Risks and Resilience in Asian Mega Cities, Springer, Tokyo, 119-139.
- Available online: https://www.dpcc.delhigovt.nic.in/.
- Available online: https://www.dpcc.delhigovt.nic.in/uploads/sitedata/Analysis_report_CETP.html.
- Available online: https://www.dpcc.delhigovt.nic.in/uploads/sitedata/RRCDelhi.html.
- Available online: https://www.thehindu.com/news/cities/Delhi/indias-biggest-stp-to-come-up-at-okhladjb/article27301495.ece.
- Available online: https://yamuna-revival.nic.in/monitoring-committee-reports/.
|
Disclaimer/Publisher’s Note: The statements, opinions and data contained in all publications are solely those of the individual author(s) and contributor(s) and not of MDPI and/or the editor(s). MDPI and/or the editor(s) disclaim responsibility for any injury to people or property resulting from any ideas, methods, instructions or products referred to in the content. |
© 2023 by the authors. Licensee MDPI, Basel, Switzerland. This article is an open access article distributed under the terms and conditions of the Creative Commons Attribution (CC BY) license (http://creativecommons.org/licenses/by/4.0/).
