Submitted:
18 May 2023
Posted:
19 May 2023
You are already at the latest version
Abstract
Keywords:
1. Introduction
2. Modelling and Methods
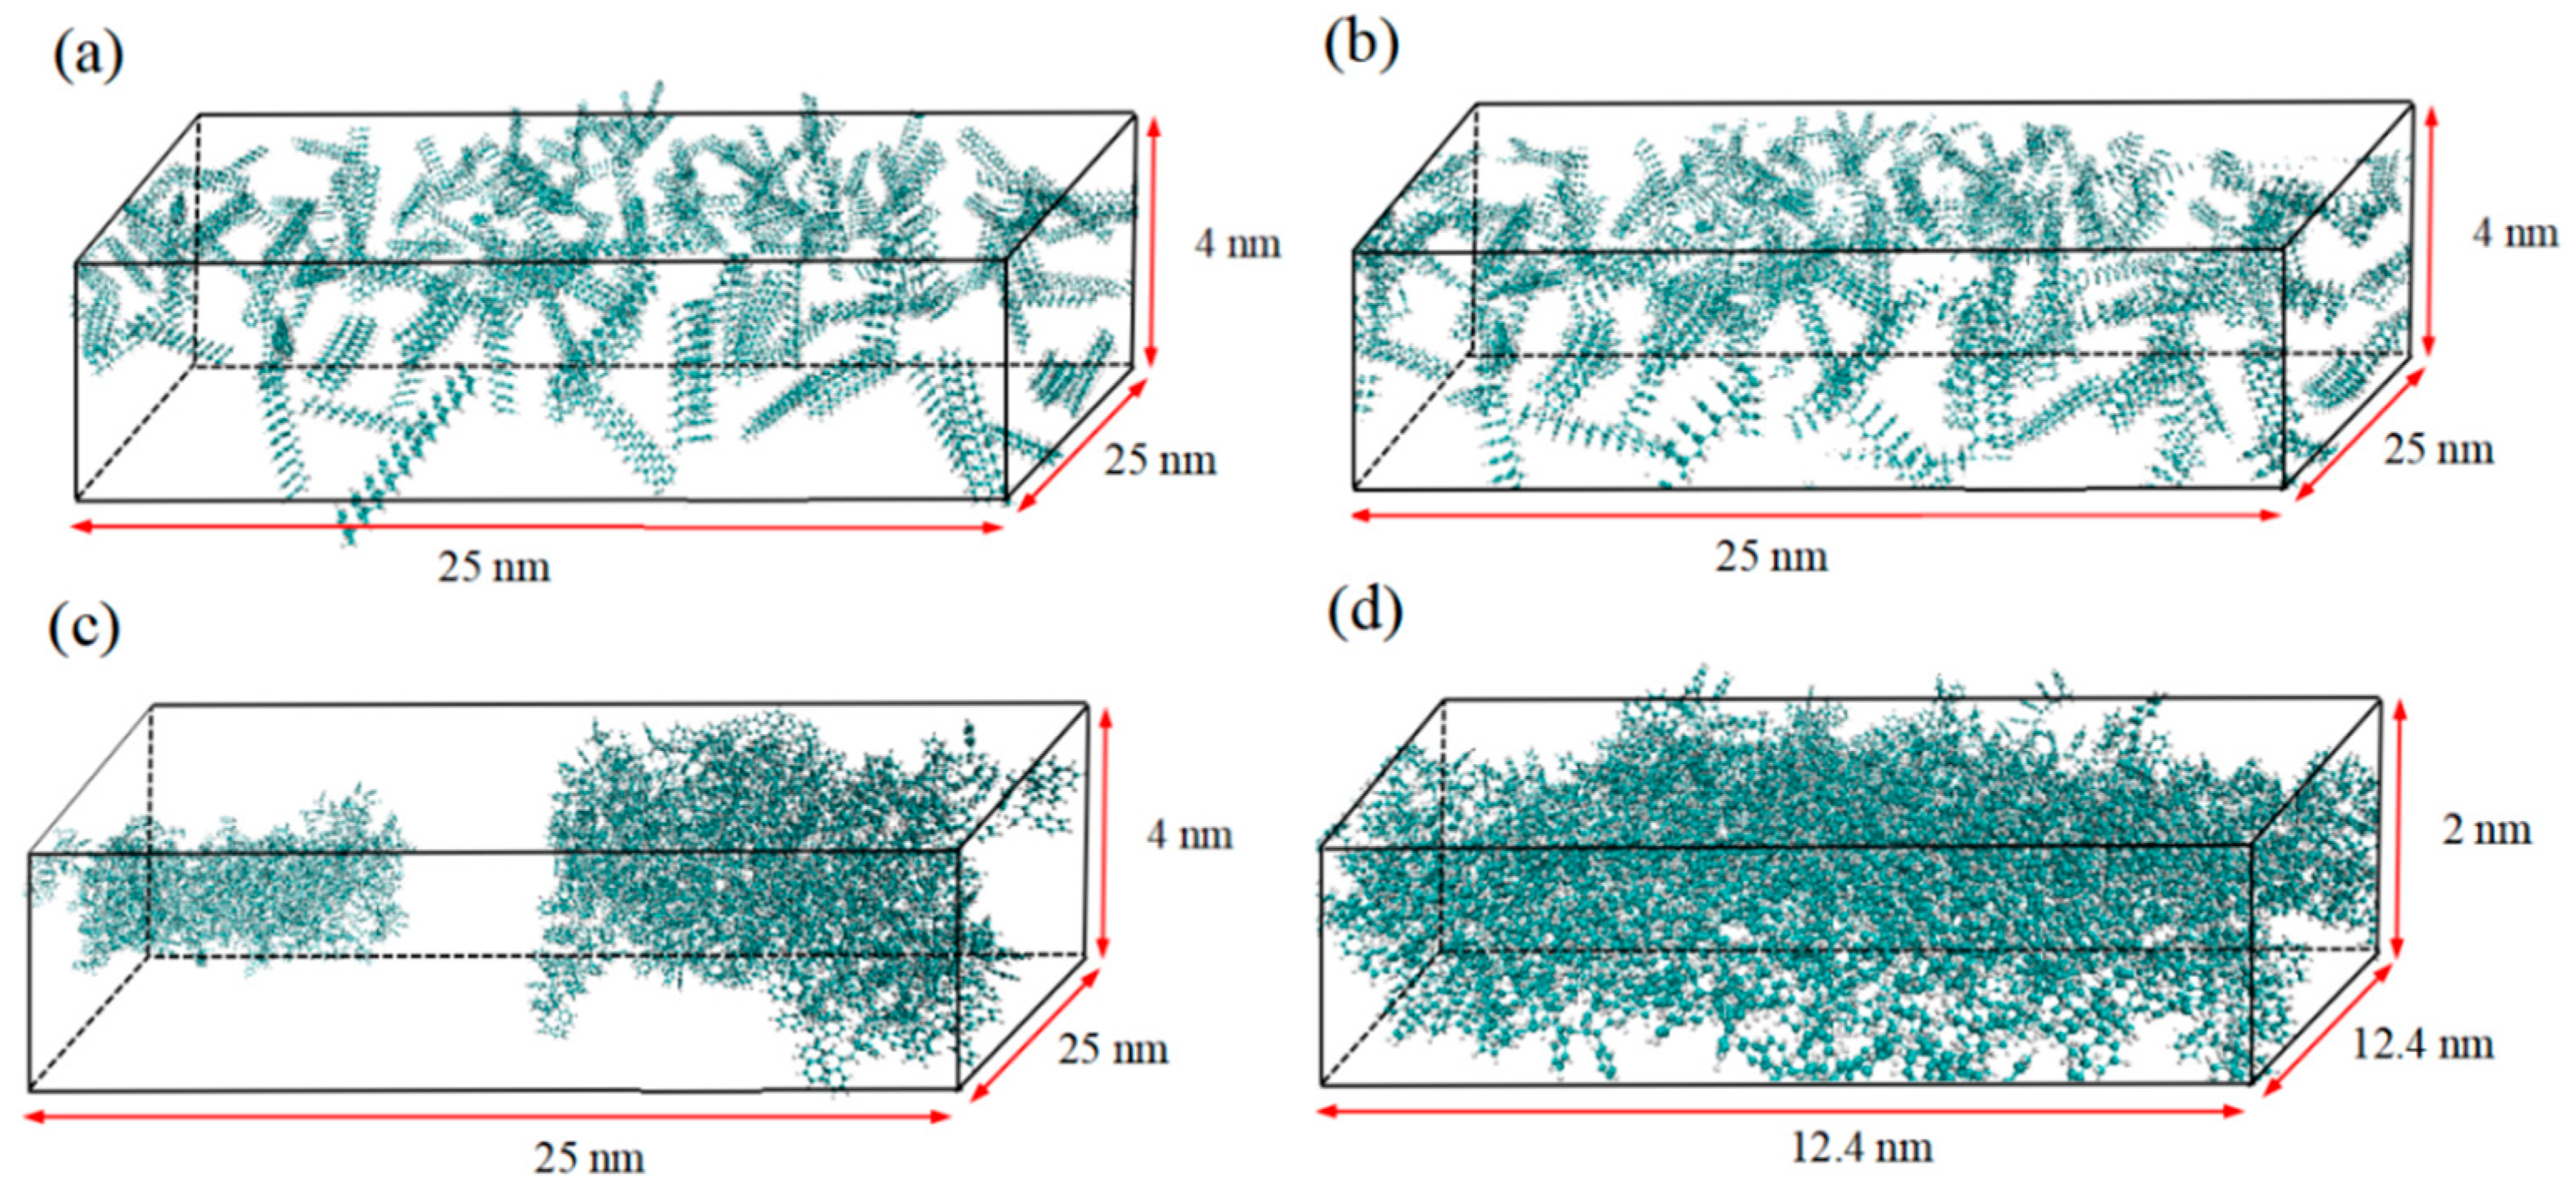
2.1. PS membrane structure
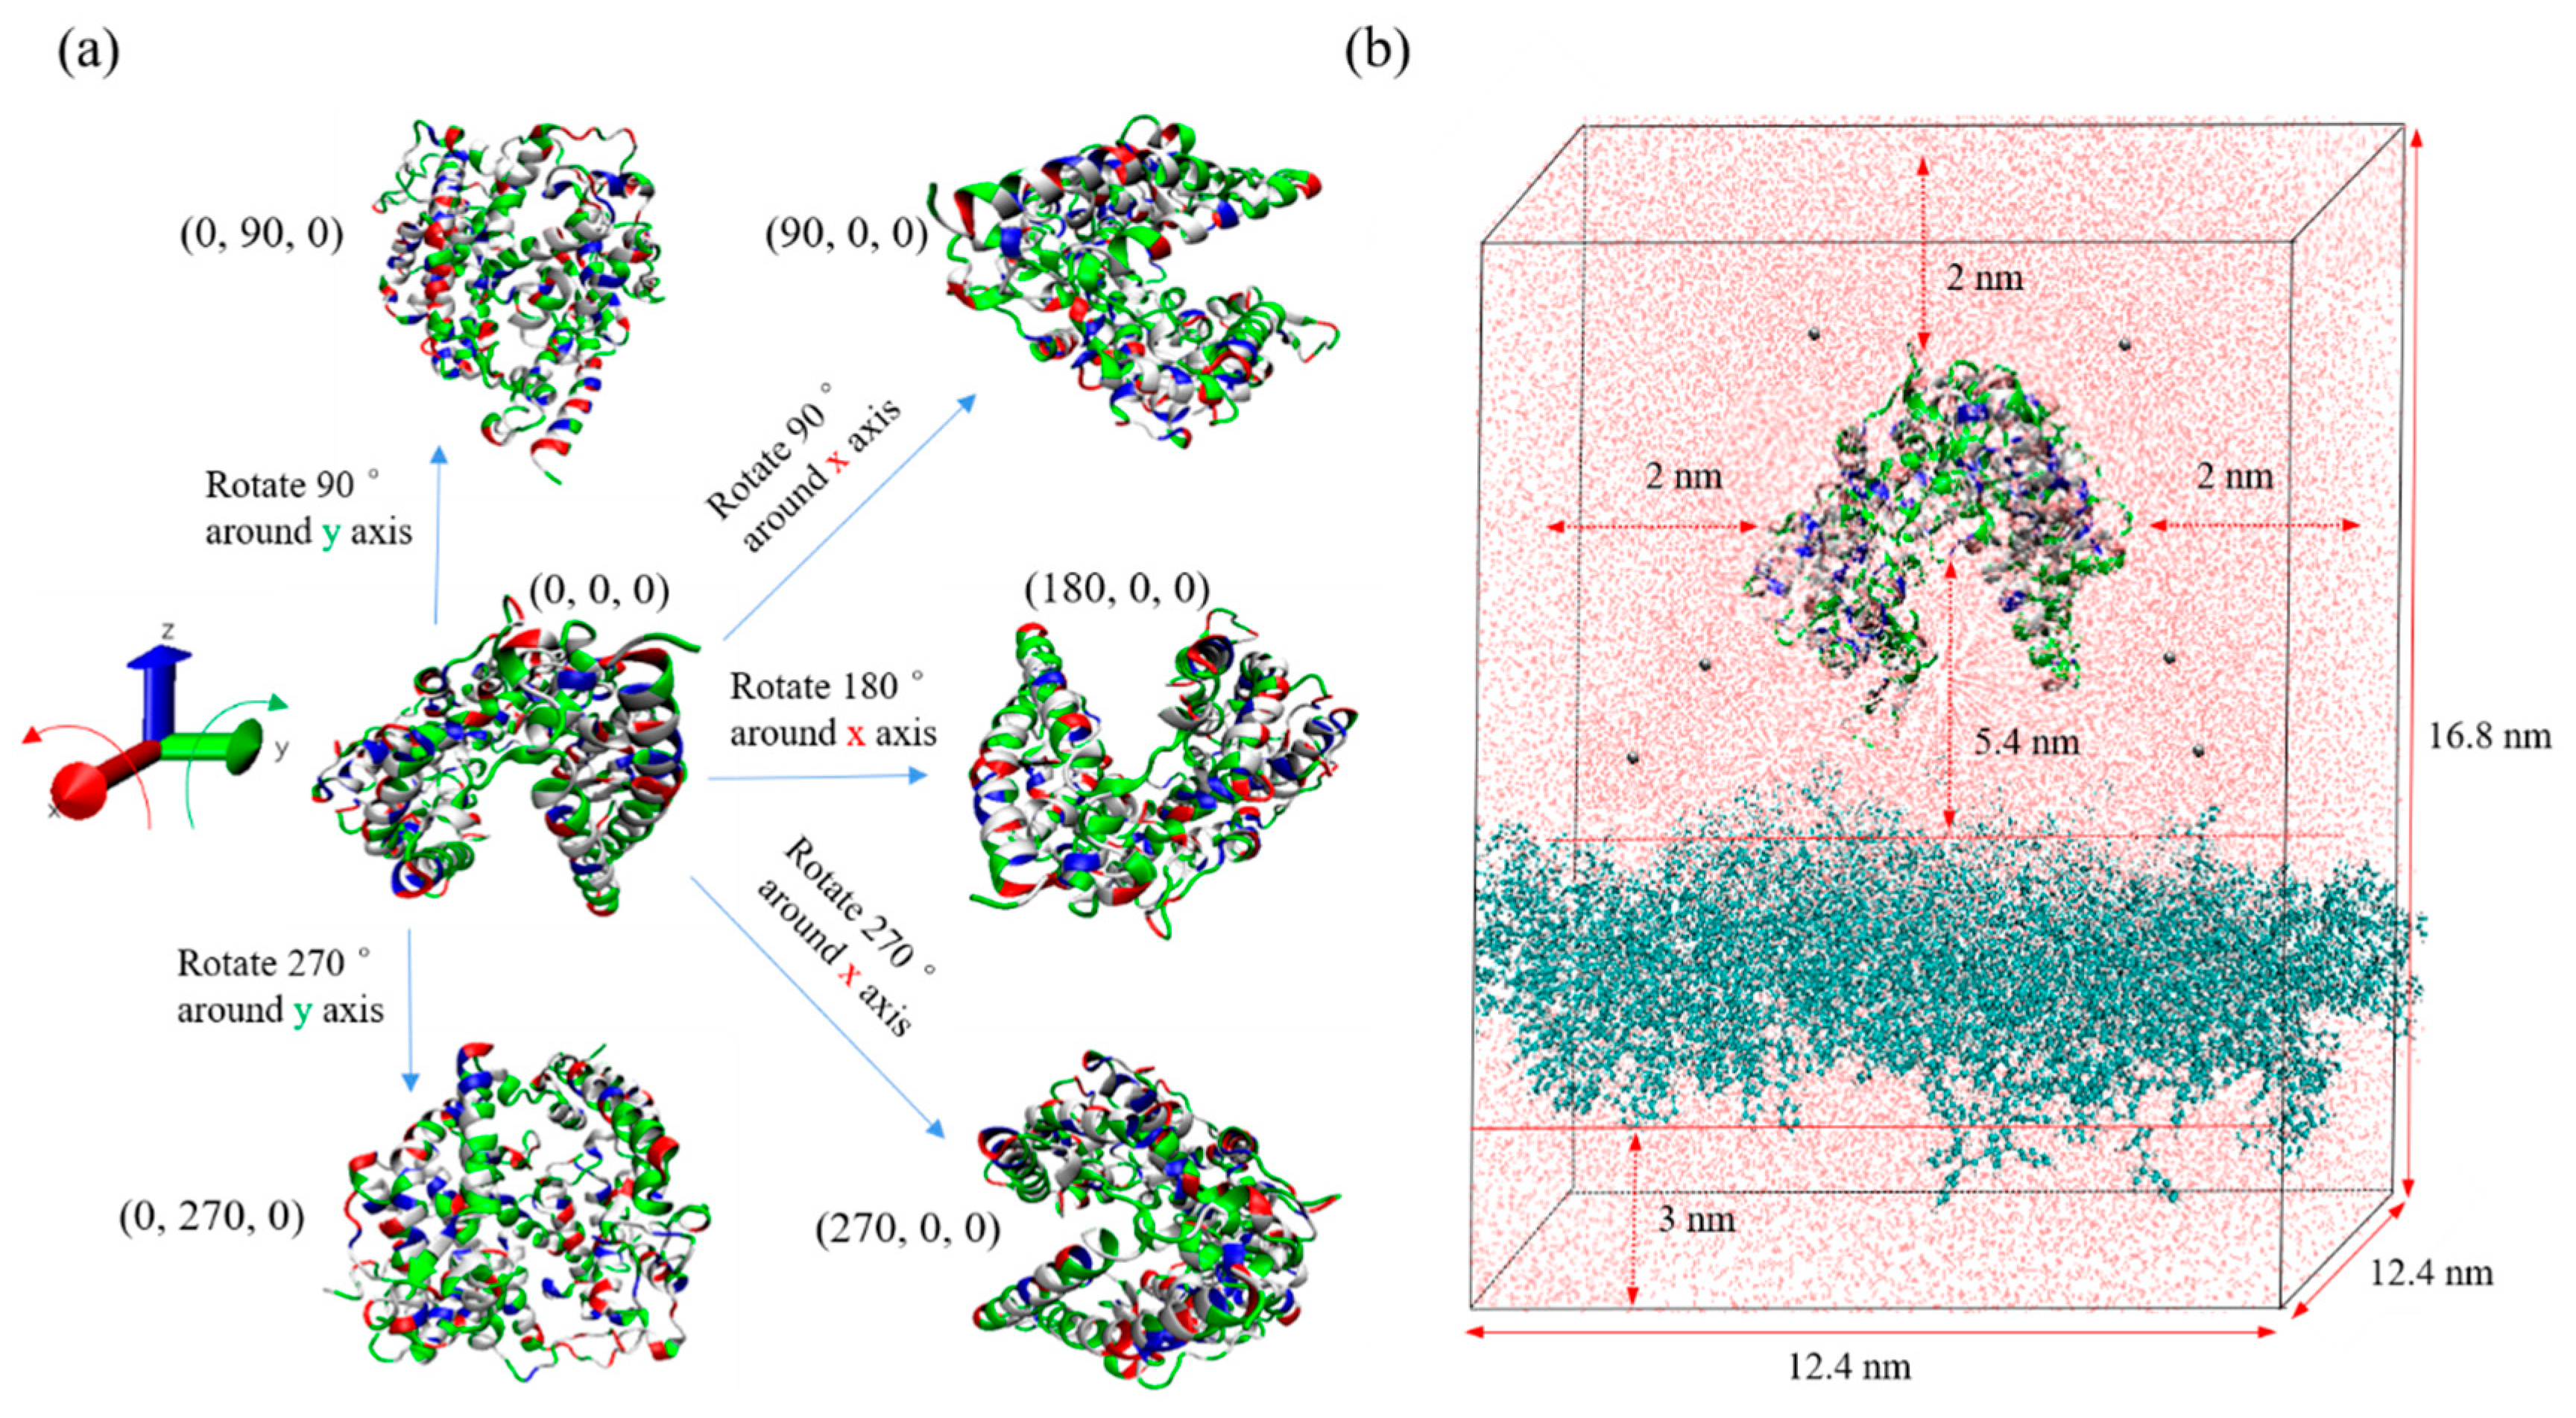
2.2. ACE2 Structure and Charge
2.3. Simulation Procedure—cubic-orientation model
3. Results and Discussion
3.1. Minimum Distance
3.1.1. pH Effect
| pH | 4.5 | 6 | 7 | 8 | 9.5 |
|---|---|---|---|---|---|
| (0, 0, 0) | 0.651 | 0.798 | 0.324 | 0 | 0.668 |
| (0, 90, 0) | 0.603 | 0.941 | 0.962 | 0.844 | 0.970 |
| (0, 270, 0) | 0.560 | 0.845 | 0.618 | 0.829 | 0 |
| (90, 0, 0) | 0.880 | 0.724 | 0.060 | 0.704 | 0.892 |
| (180, 0, 0) | 0.532 | 0.662 | 0.813 | 0.647 | 0.347 |
| (270, 0, 0) | 0.178 | 0 | 0.530 | 0.006 | 0.451 |
| Total | 0.567 | 0.662 | 0.551 | 0.505 | 0.555 |
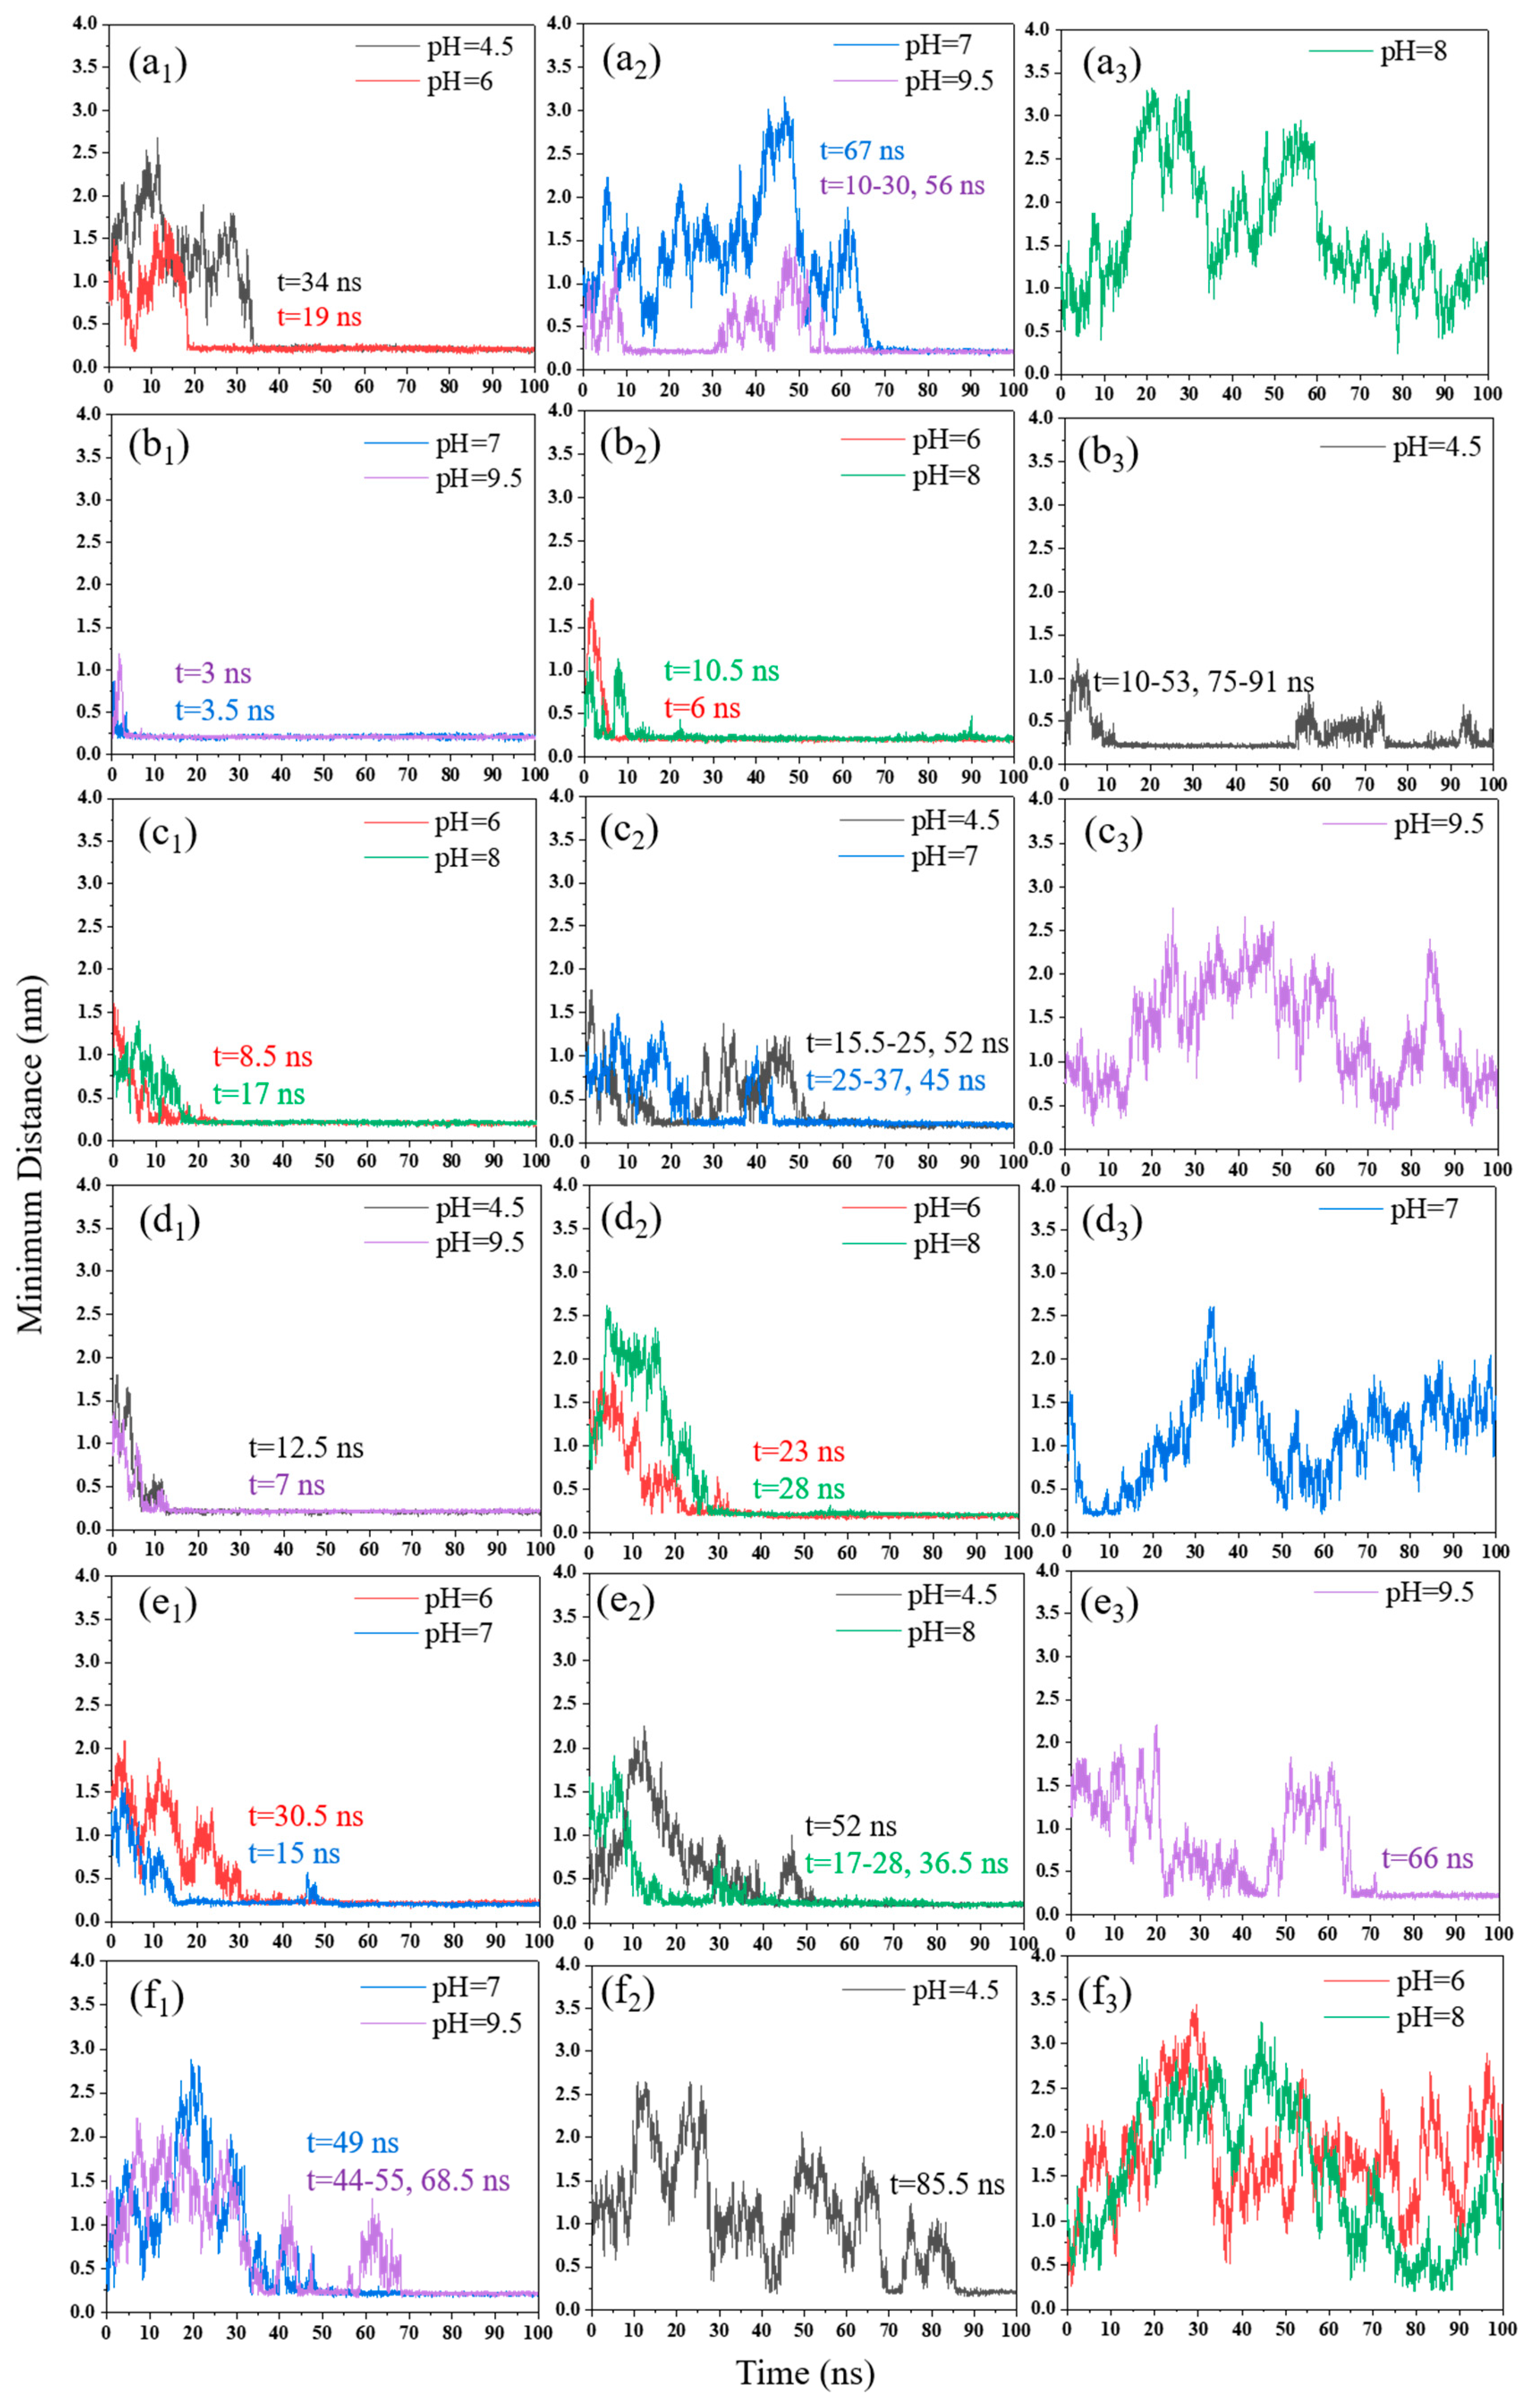
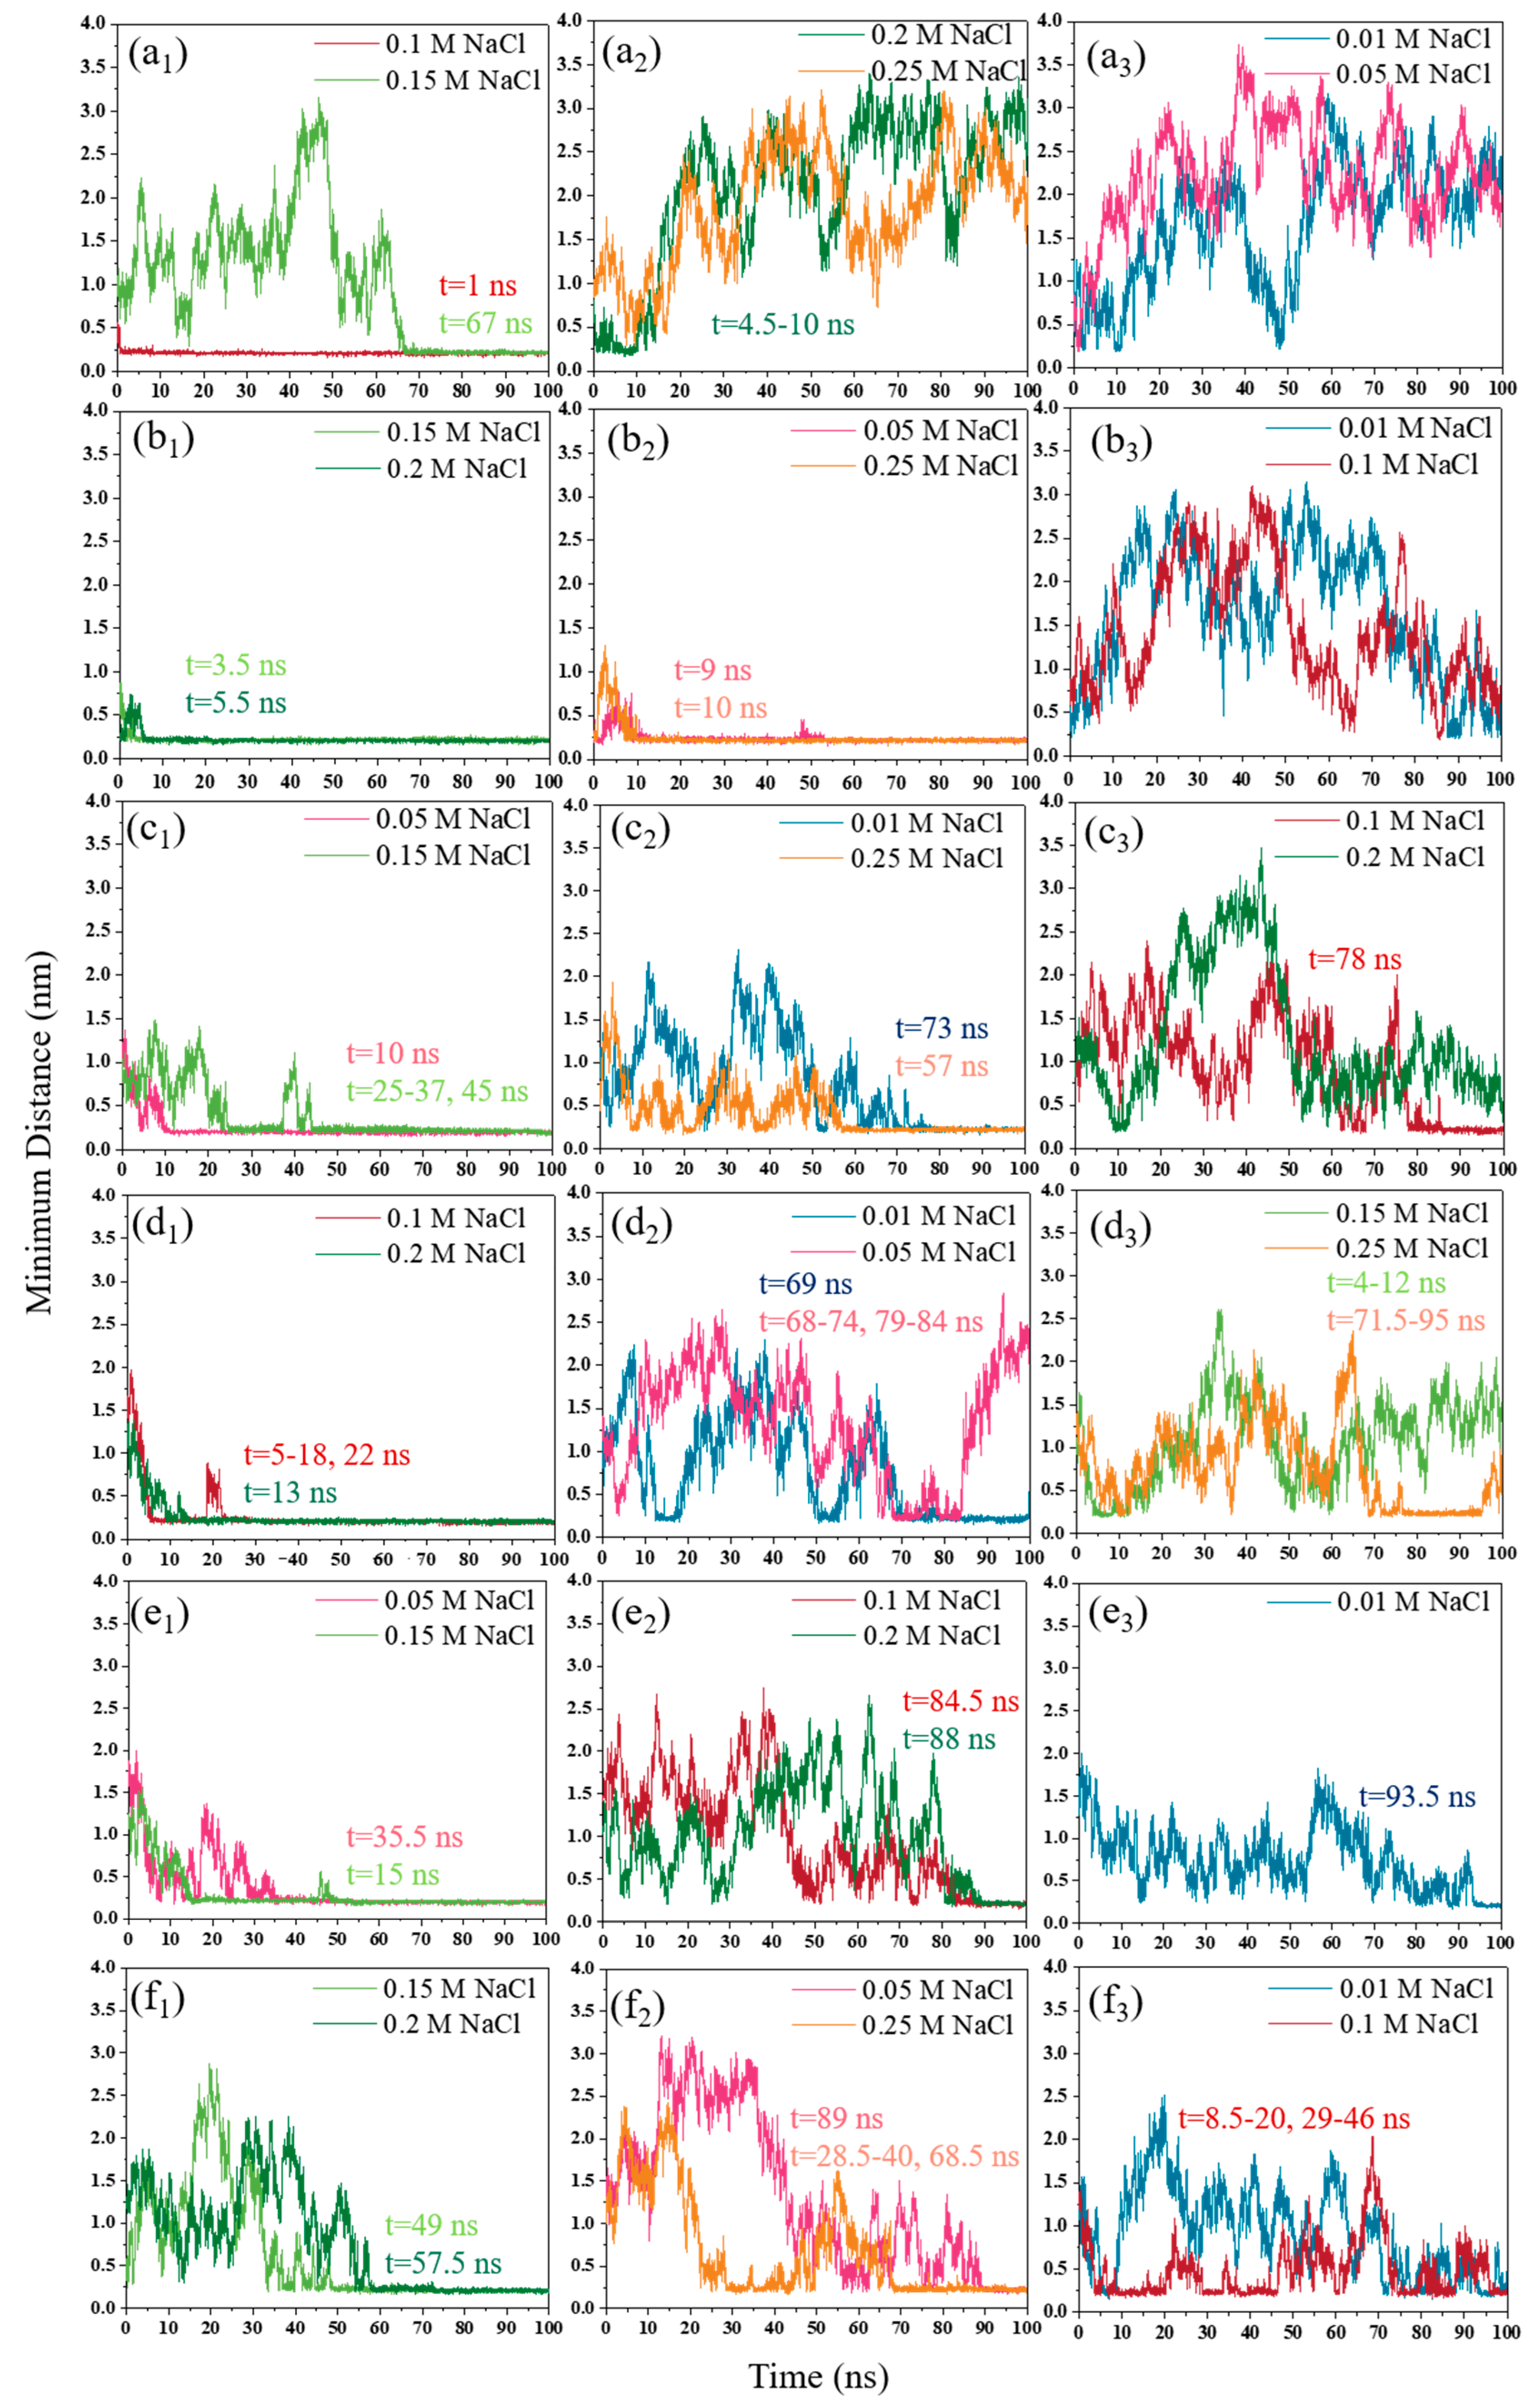
3.1.2. NaCl Effect
3.2. Interaction Energy
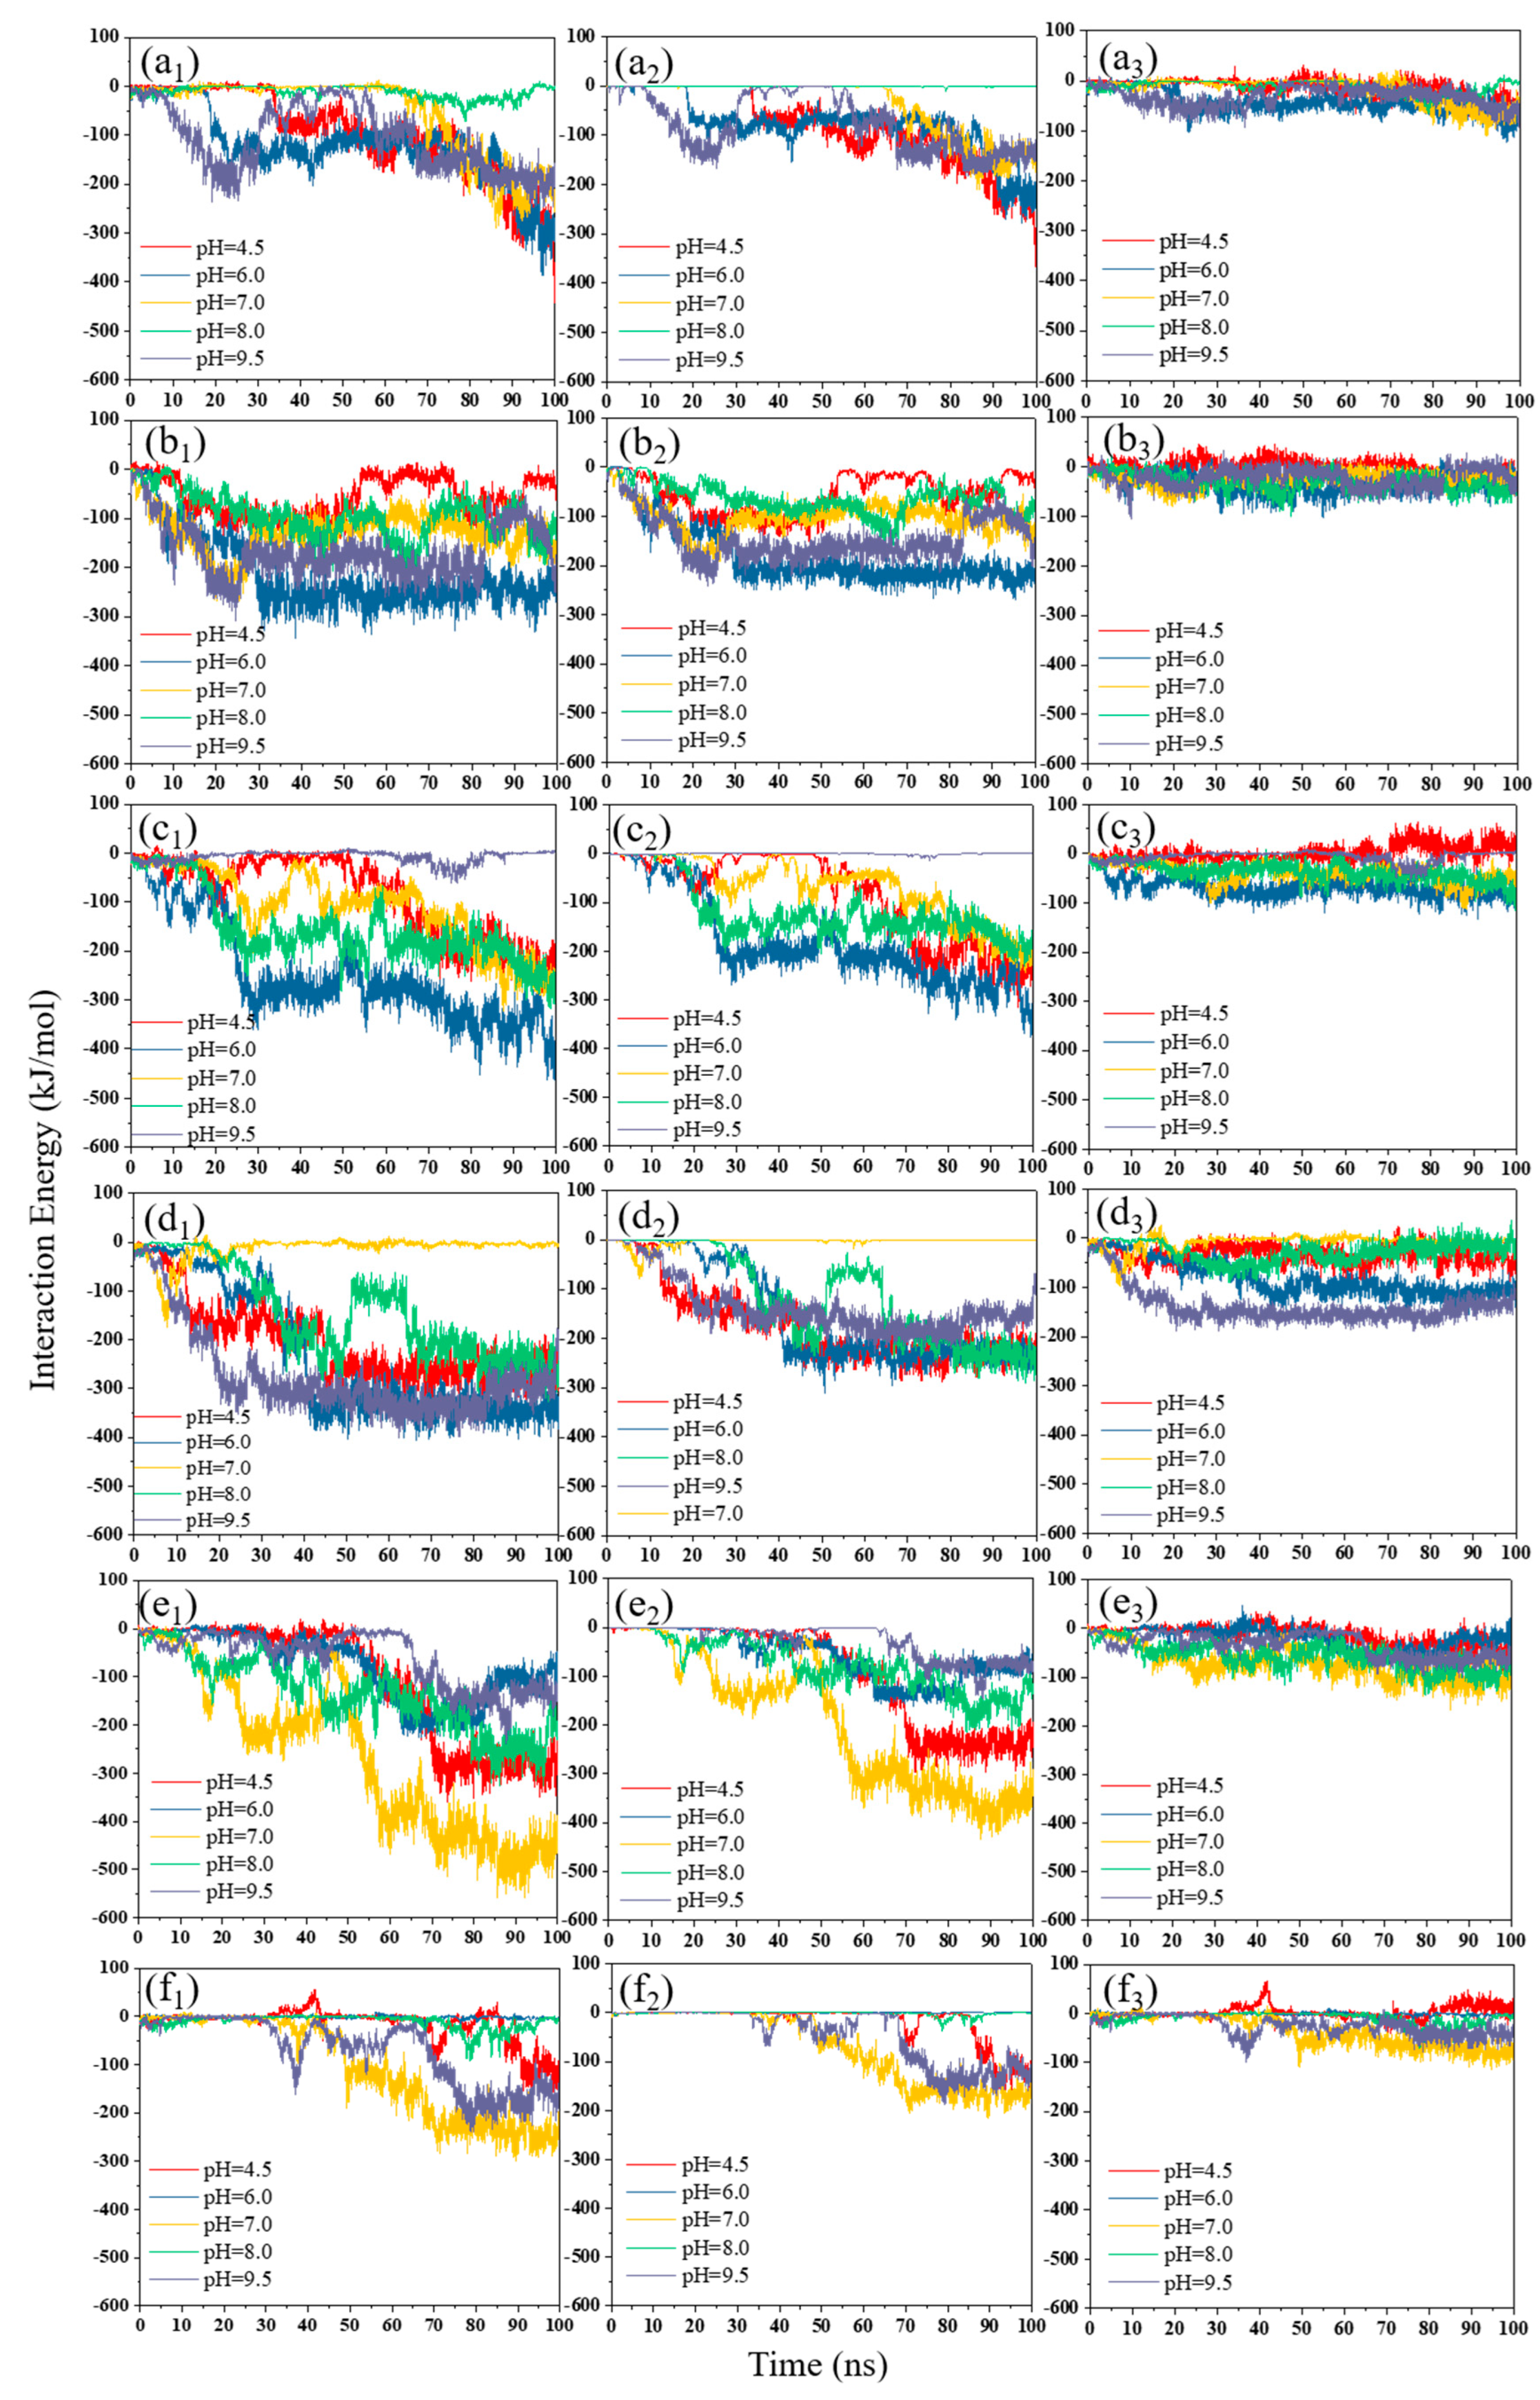
3.2.1. pH Effect
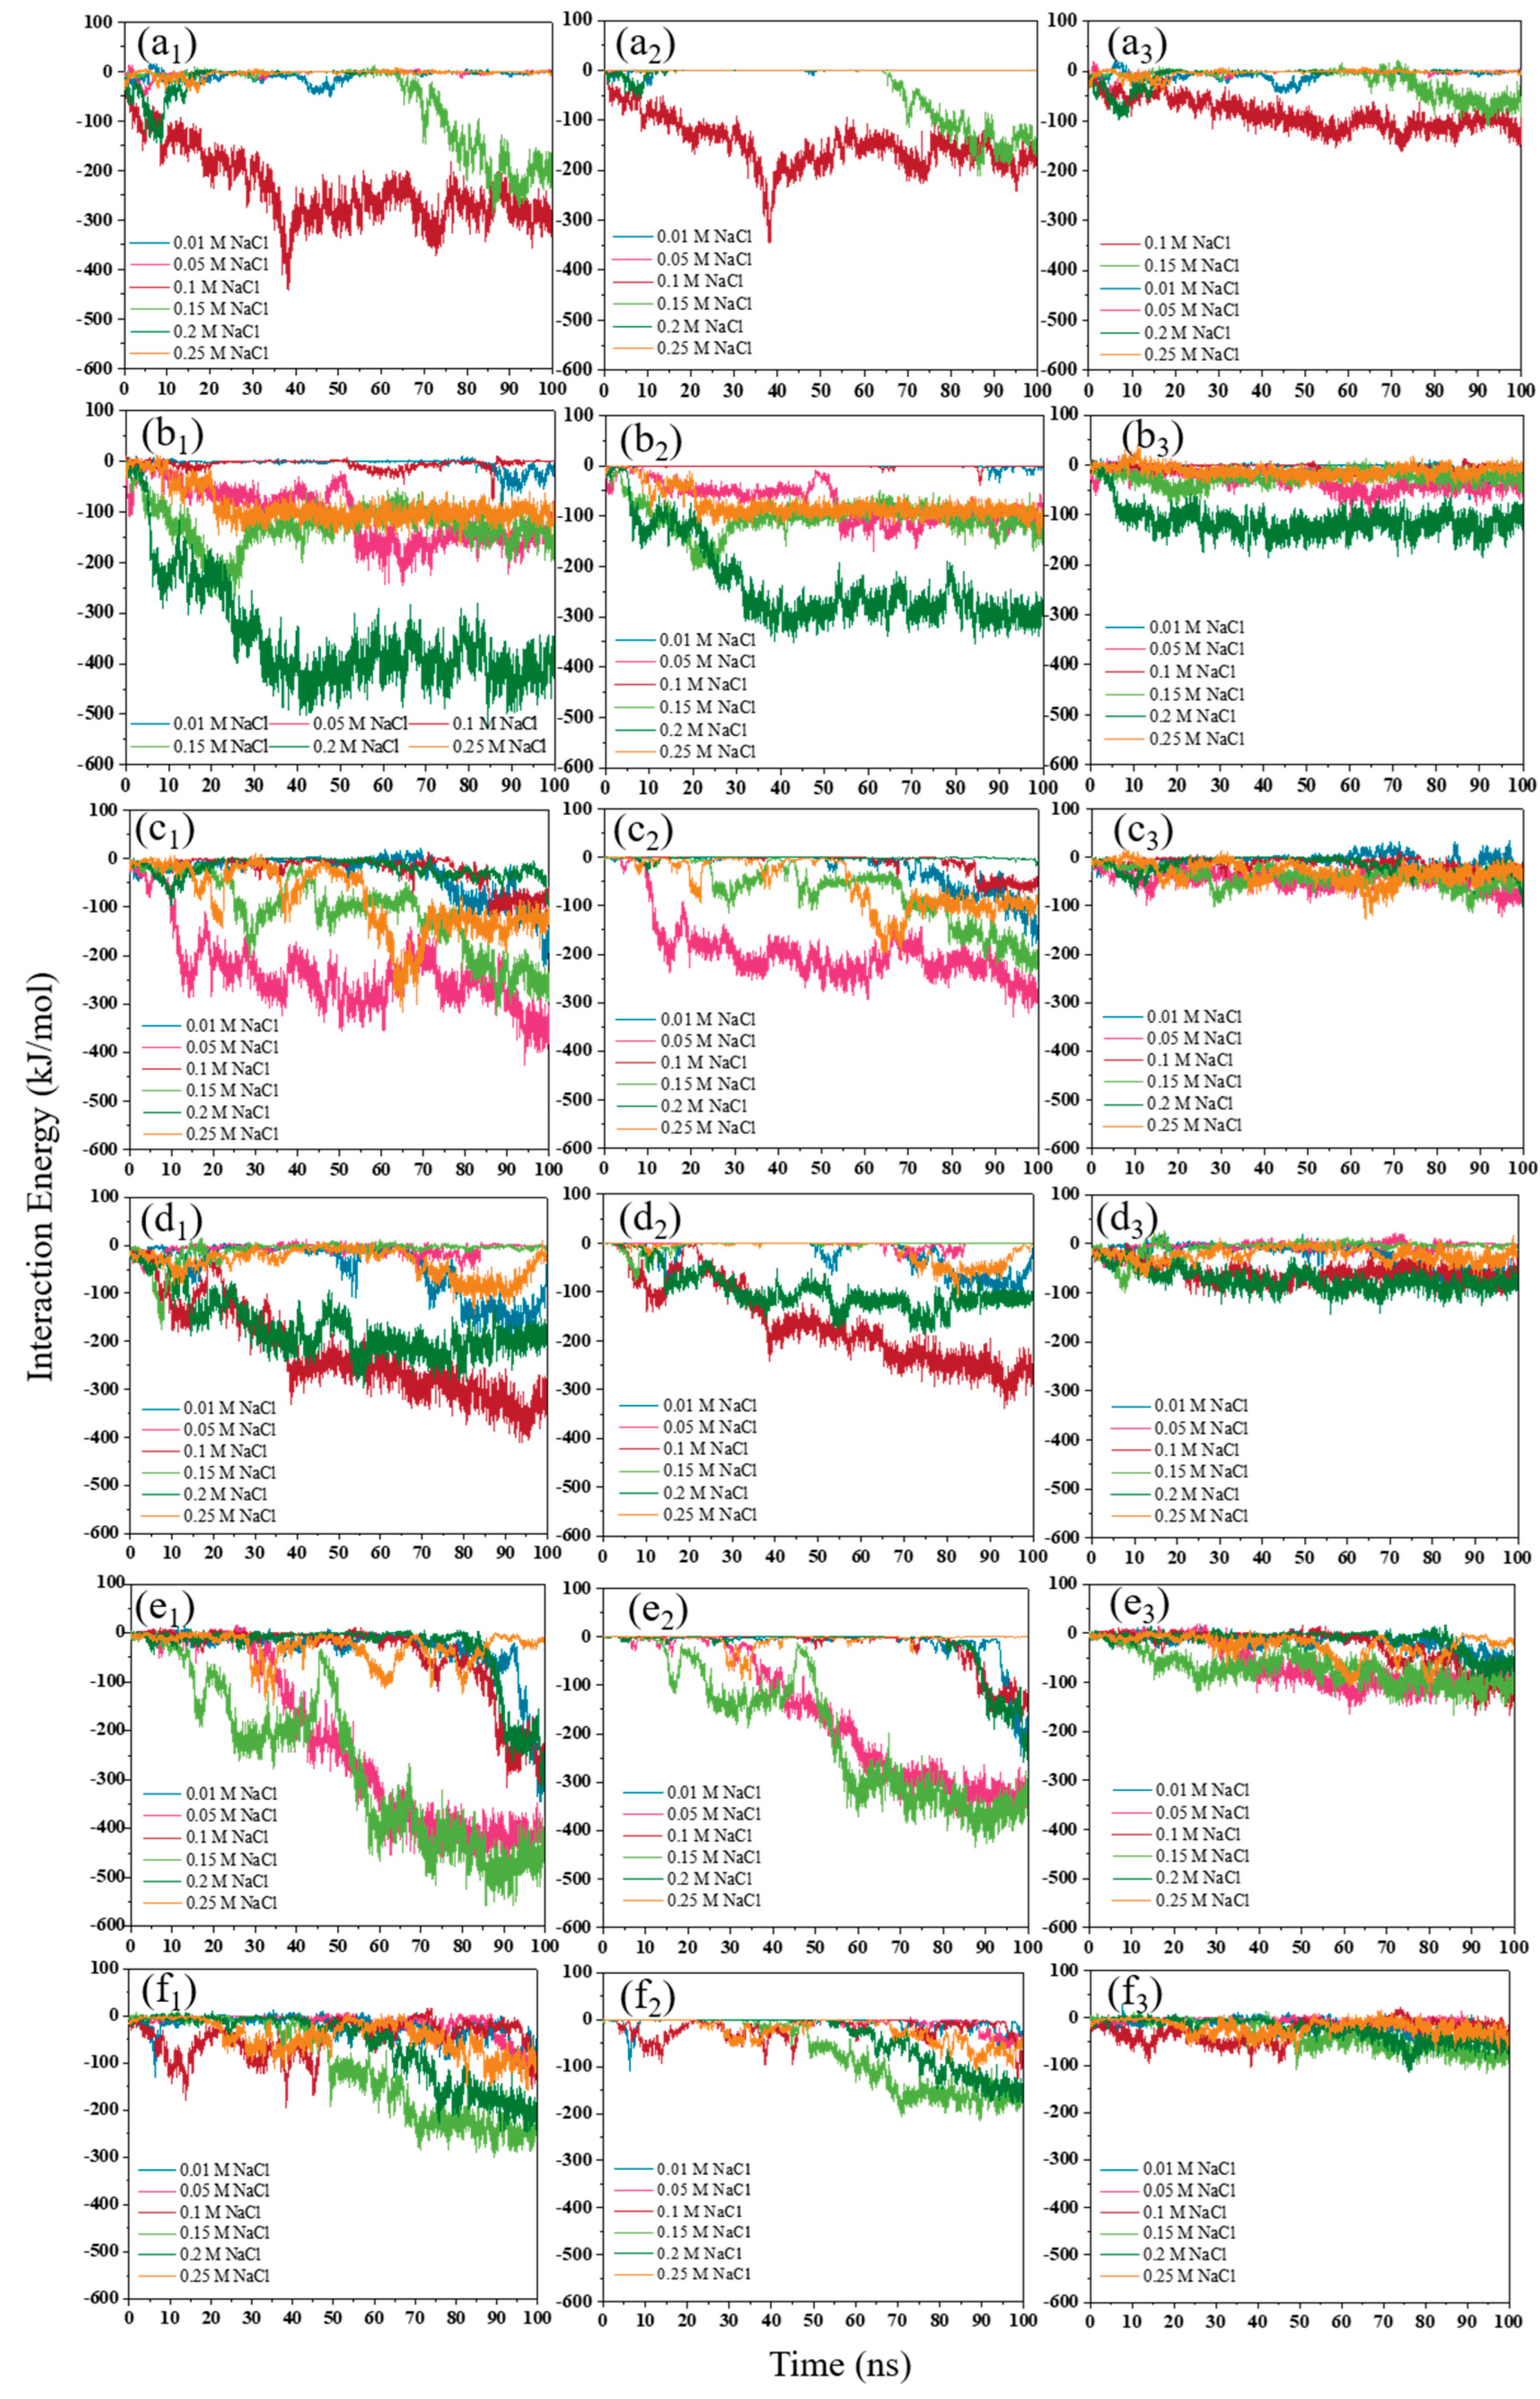
3.2.2. NaCl Effect
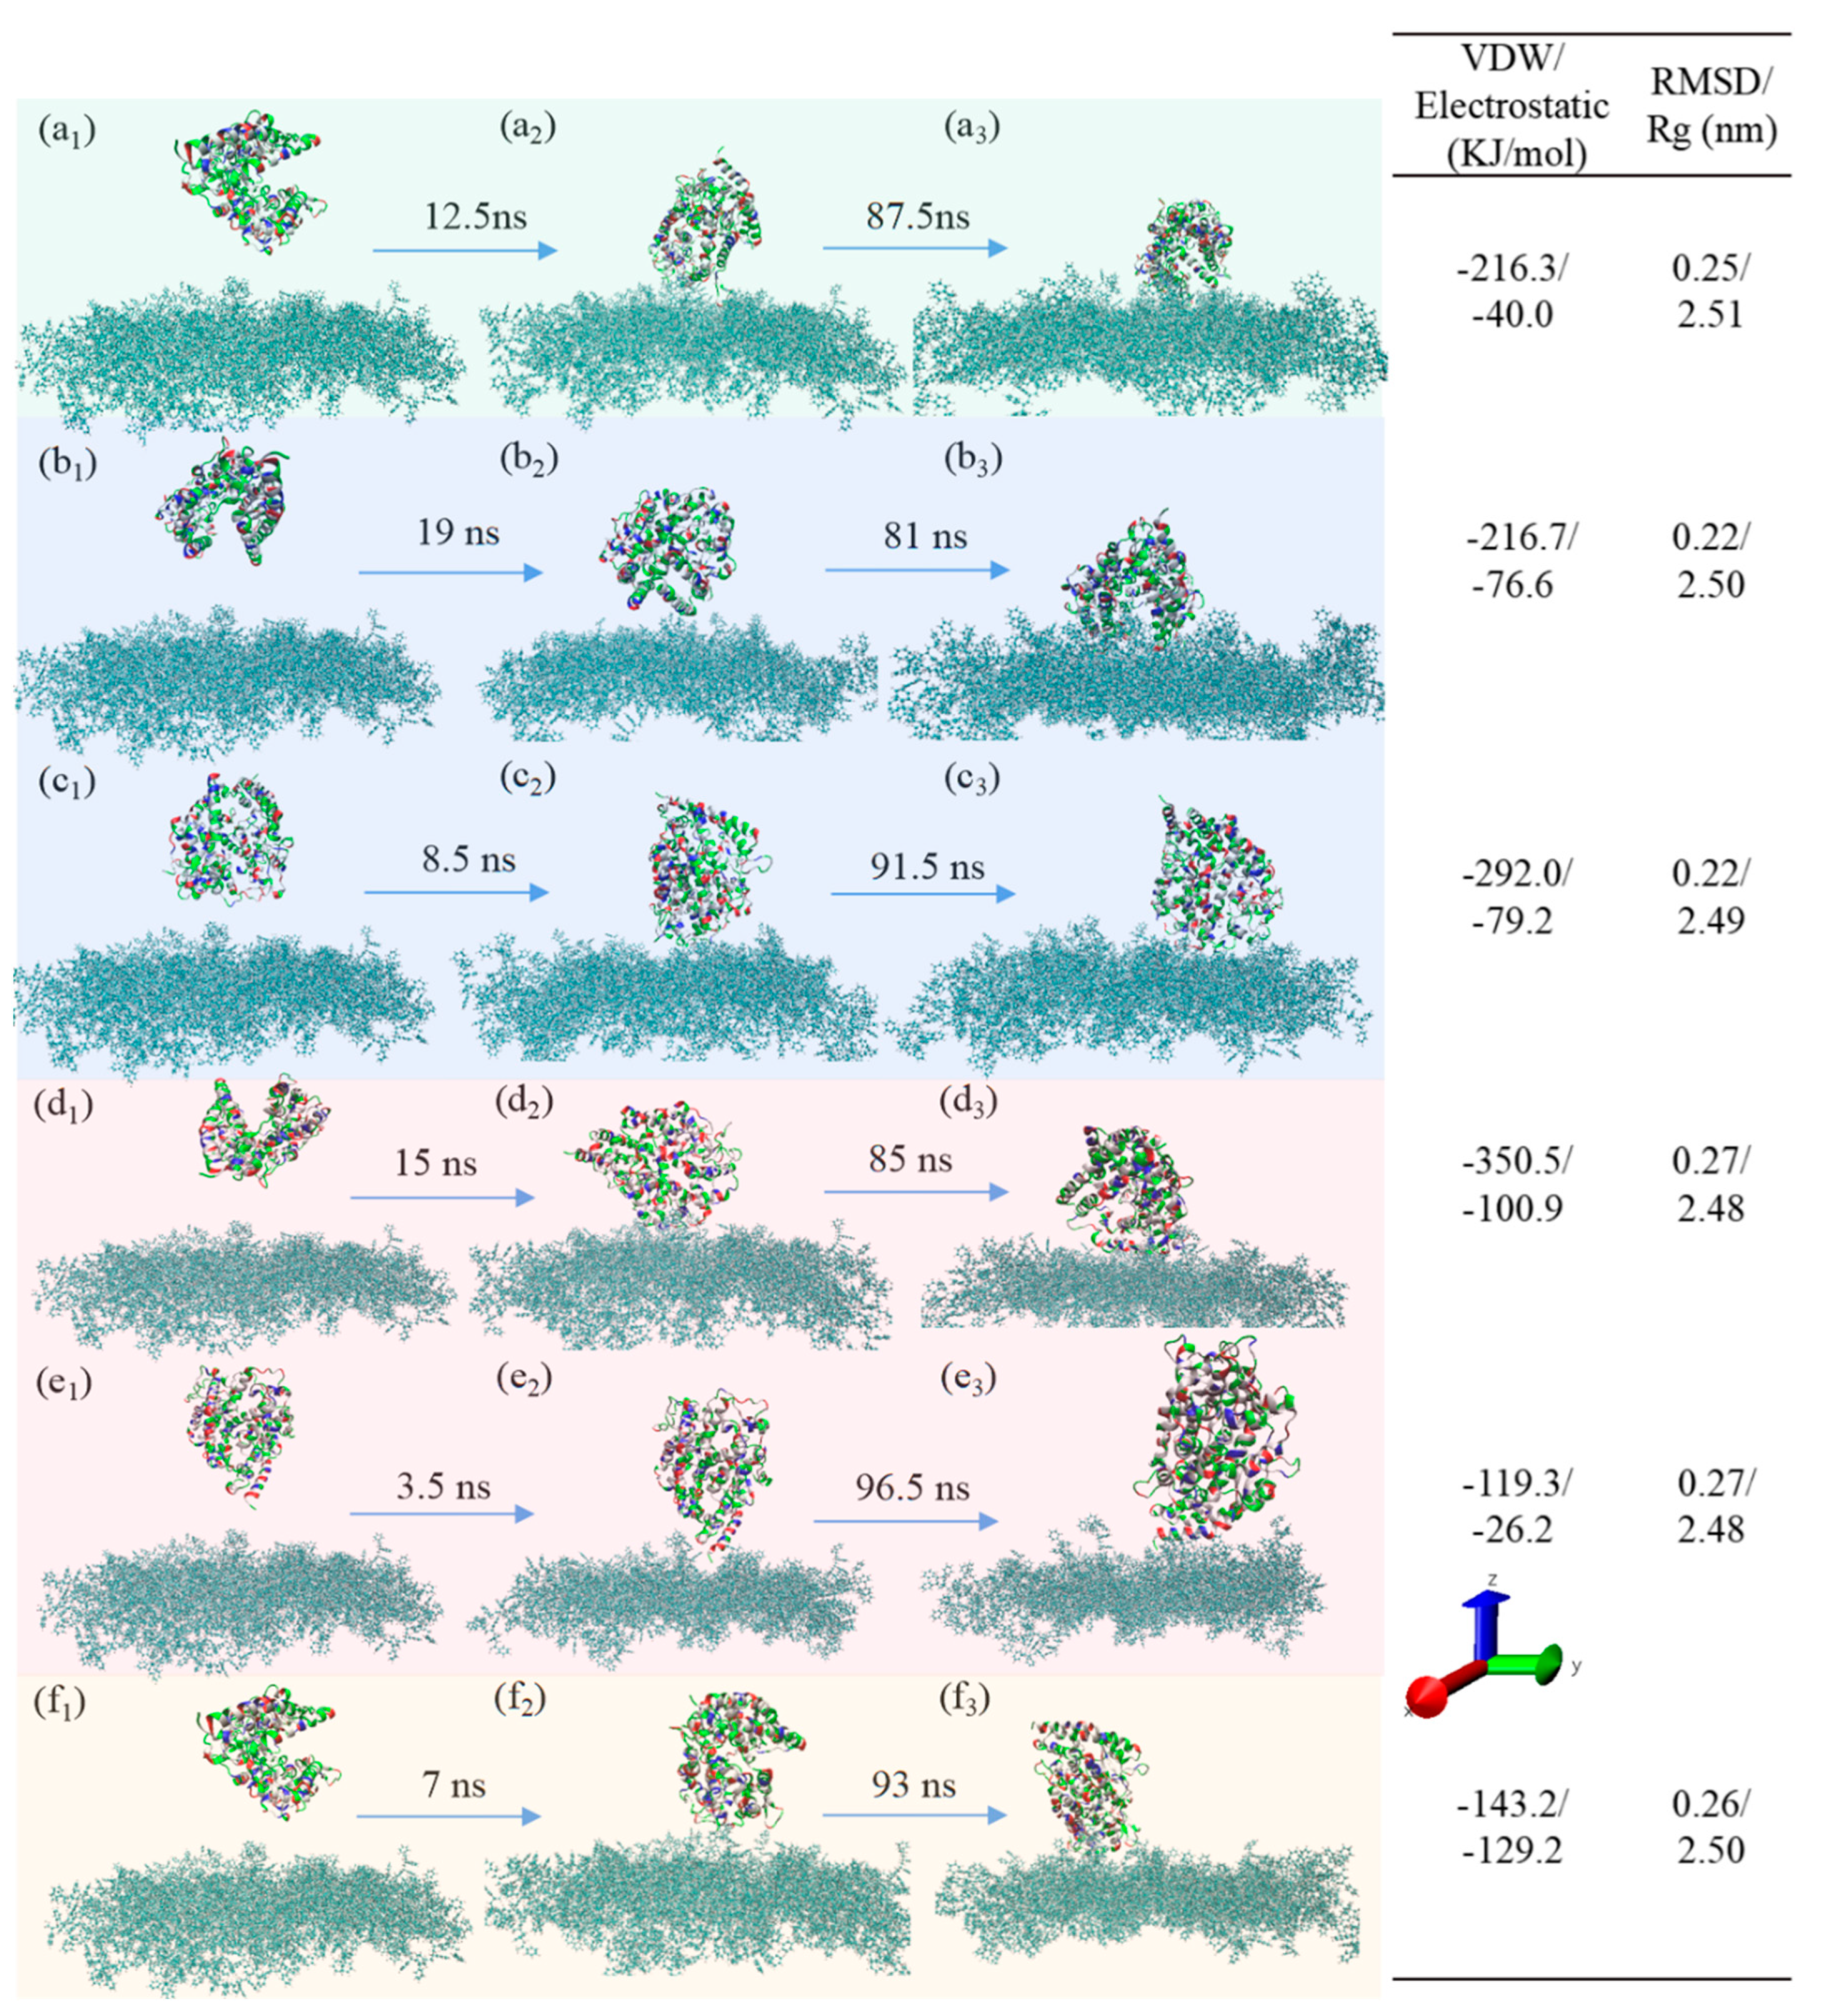
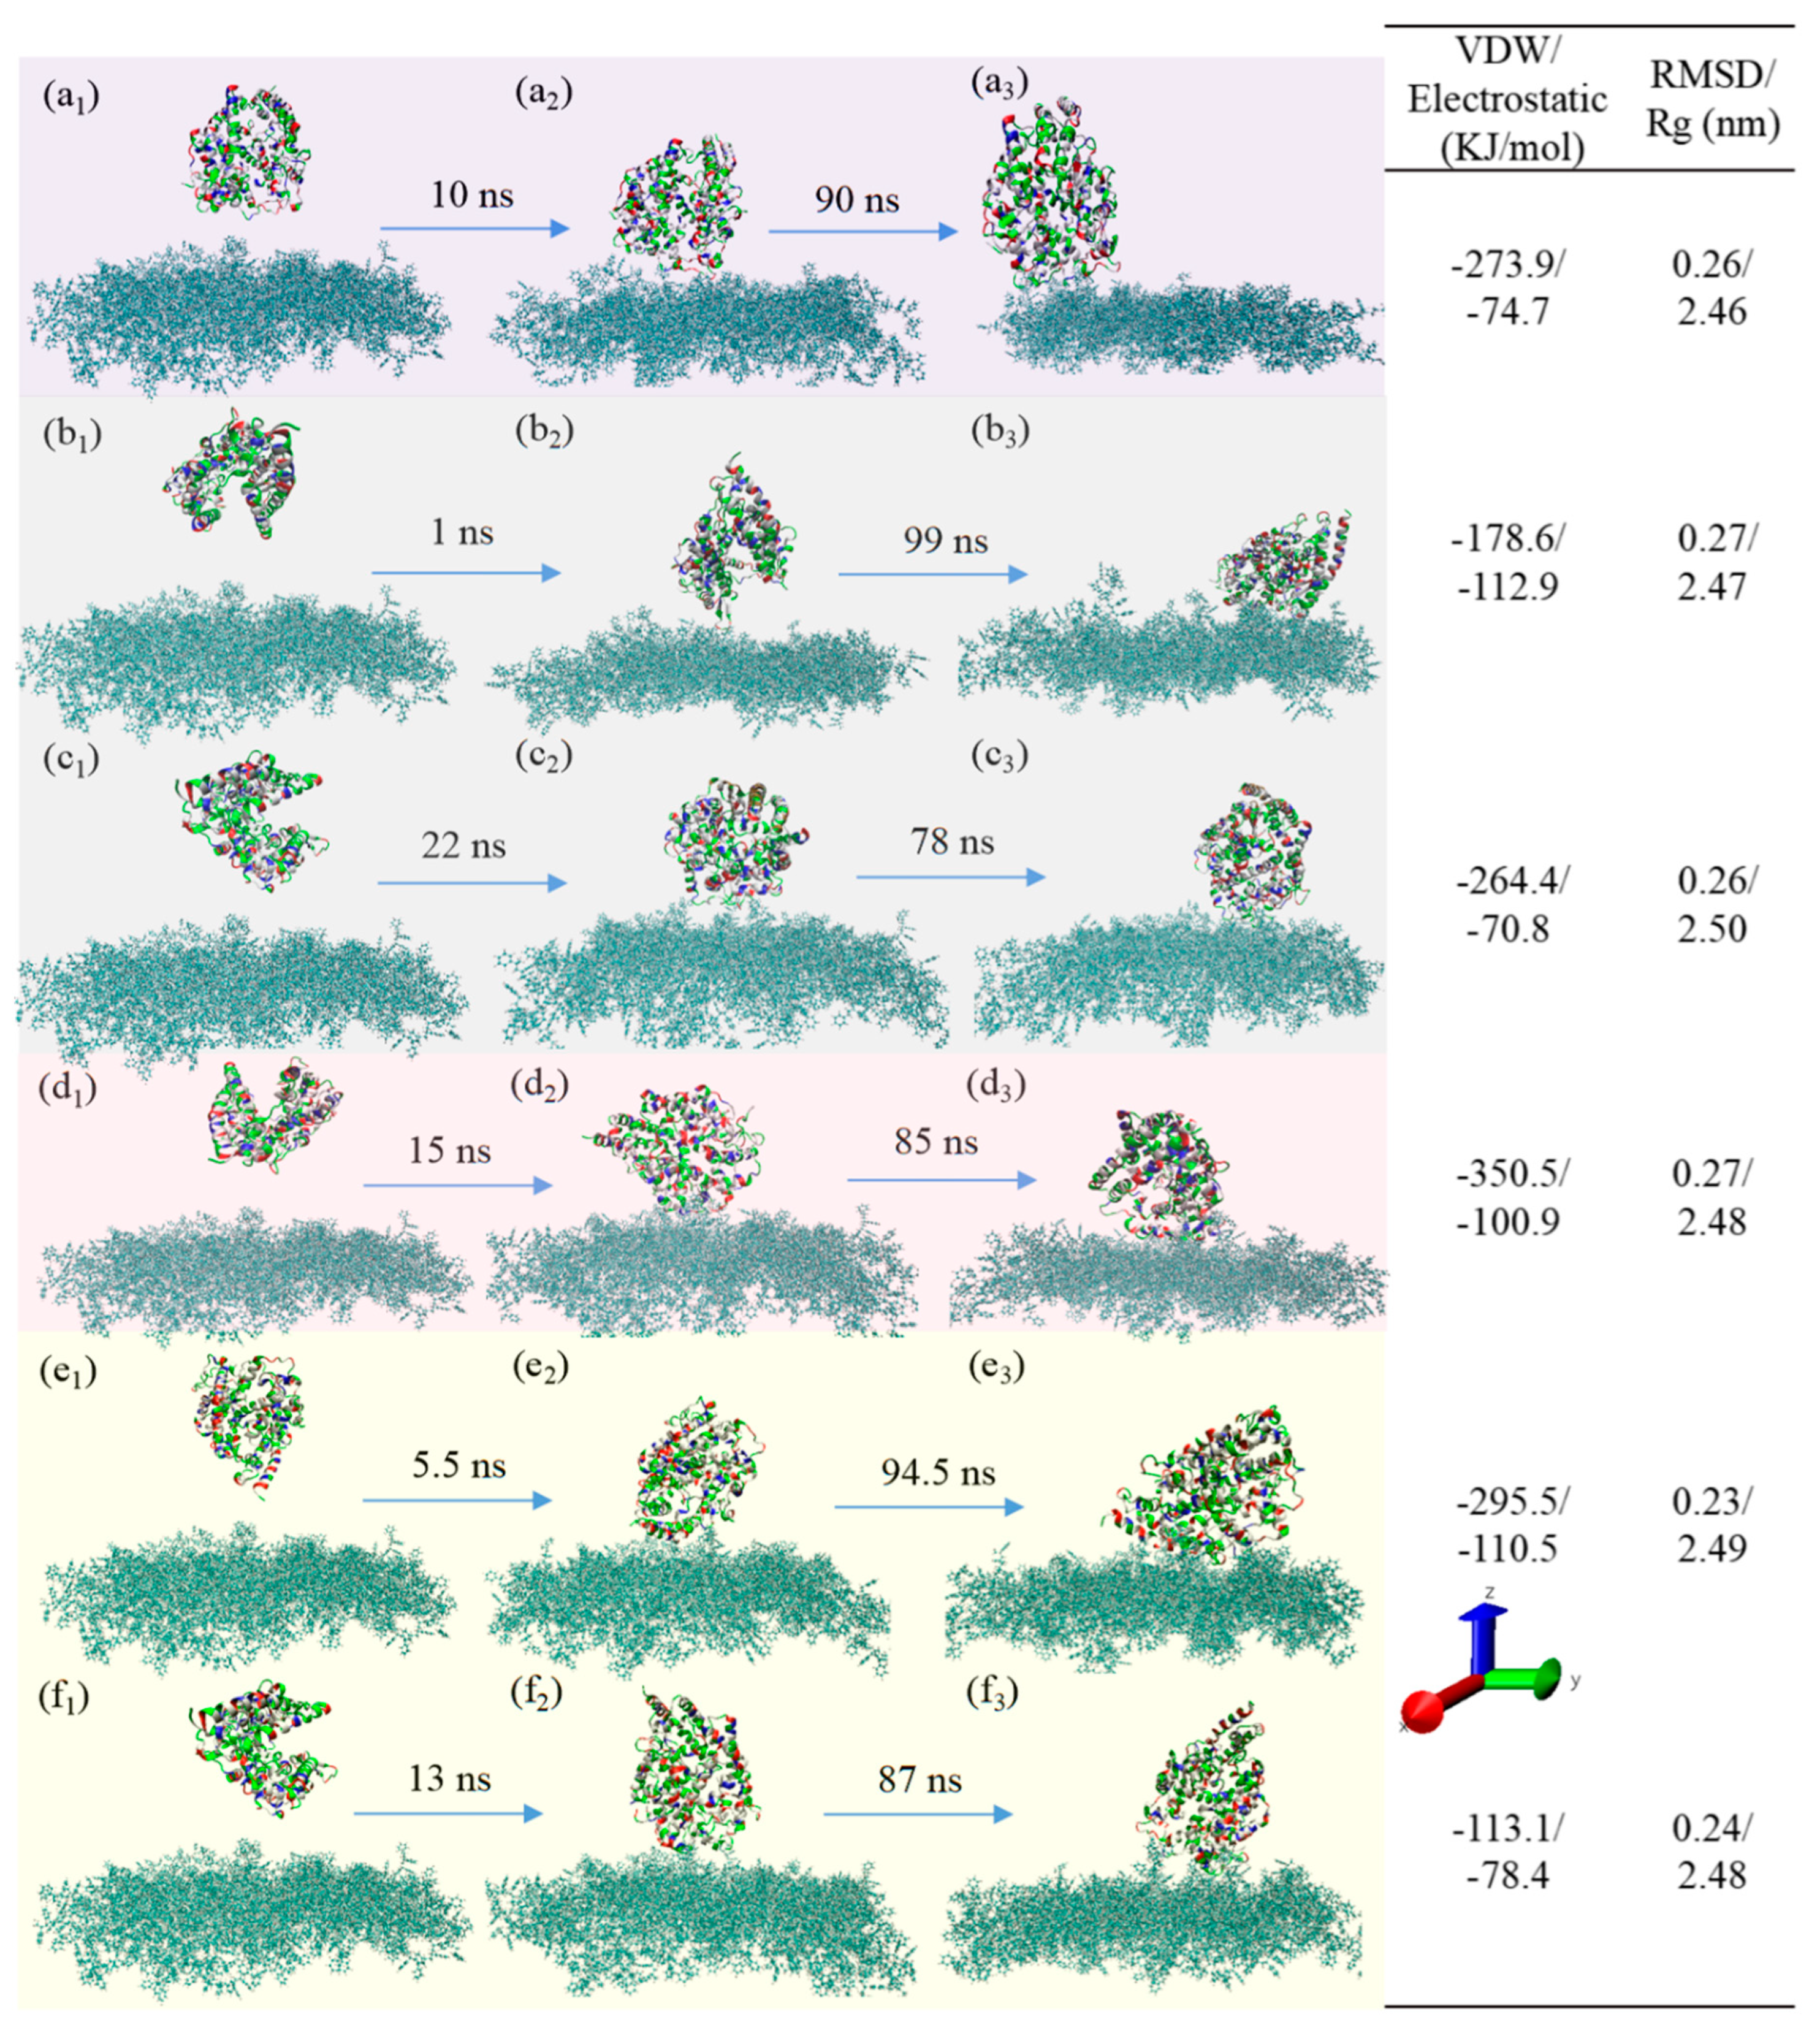
3.3. Adsorption Behavior
4. Conclusions
Supplementary Materials
Author Contributions
Funding
Institutional Review Board Statement
Informed Consent Statement
Conflicts of Interest
References
- Ullah, I.; Wang, W.W.; Ma, N.; Lendlein, A. Multiblock copolymers type PDC - A family of multifunctional biomaterials for regenerative medicine1. Clin. Hemorheol. Microcirc. 2022, 80, 327–341. [Google Scholar] [CrossRef]
- Yu, Y.Y.; Ghalandari, B.; Shen, G.X.; Wang, L.P.; Liu, X.; Wang, A.T.; Li, S.J.; Xie, H.Y.; Ding, X.T. Poly (N-vinylpyrrolidone) modification mitigates plasma protein corona formation on phosphomolybdate-based nanoparticles. J. Nanobiotechnol. 2021, 19, 445. [Google Scholar] [CrossRef] [PubMed]
- Chen, Z. Surface Hydration and antifouling activity of zwitterionic polymers. Langmuir 2022, 38, 4483–4489. [Google Scholar] [CrossRef] [PubMed]
- Ma, Z.Z.; Sun, J.; Dong, X.H.; Gan, D.L.; Peng, W.; Li, Y.X.; Qian, W.J.; Liu, P.S.; Shen, J. Zwitterionic/active ester block polymers as multifunctional coatings for polyurethane-based substrates. J. Mater. Chem. B. 2022, 10, 3687–3695. [Google Scholar] [CrossRef]
- Yeh, S.L.; Deval, P.; Wu, J.G.; Luo, S.C.; Tsai, W.B. One-step electrochemical deposition of antifouling polymers with pyrogallol for biosensing applications. J. Mater. Chem. B. 2022, 10, 2504–2511. [Google Scholar] [CrossRef] [PubMed]
- Kilic, T.; Gessner, I.; Cho, Y.K.; Jeong, N.; Quintana, J.; Weissleder, R.; Lee, H. Zwitterionic polymer electroplating facilitates the preparation of electrode surfaces for biosensing. Adv. Mater. 2022, 34, 2107892. [Google Scholar] [CrossRef] [PubMed]
- Badoux, M.; Billing, M.; Klok, H. Polymer brush interfaces for protein biosensing prepared by surface-initiated controlled radical polymerization. Polym. Chem. 2019, 1, 2925–2951. [Google Scholar] [CrossRef]
- Mierczynska-Vasilev, A.; Smith, P. Adsorption of wine constituents on functionalized surfaces. Molecules 2016, 21, 1394. [Google Scholar] [CrossRef]
- Galus, S.; Lenart, A. Optical, mechanical, and moisture sorption properties of whey protein edible films. J. Food Process Eng. 2019, 42, e13245. [Google Scholar] [CrossRef]
- Tatikonda, A. K.; Tkachev, M.; Naaman, R. A highly sensitive hybrid organic–inorganic sensor for continuous monitoring of hemoglobin. Biosens. Bioelectron. 2013, 45, 201–205. [Google Scholar] [CrossRef]
- Köllnberger, A.; Schrader, R.; Briehn, C.A. Carboxylic acid mediated antimicrobial activity of silicone elastomers. Mater. Sci. Eng. C 2020, 113, 111001. [Google Scholar] [CrossRef]
- Wang, K.; Arado, T.; Huner, A.; Seol, H.; Liu, X.; Wang, H.F.; Hassan, L.; Suresh, K.; Kim, S.; Cheng, G. Thermoplastic zwitterionic elastomer with critical antifouling properties. Biomater. Sci. 2022, 10, 2892–2906. [Google Scholar] [CrossRef]
- Namekawa, K.; Tokoro Schreiber, M.; Aoyagi, T.; Ebara, M. Fabrication of zeolite–polymer composite nanofibers for removal of uremic toxins from kidney failure patients. Biomater. Sci. 2014, 2, 674. [Google Scholar] [CrossRef]
- Xu, Z.L.; Yuan, Y.J. Implementation of guiding layers of surface acoustic wave devices: A review. Biosens. Bioelectron. 2018, 99, 500–512. [Google Scholar] [CrossRef]
- Ozboyaci, M.; Kokh, D.B.; Corni, S.; Wade, R.C. Modeling and simulation of protein-surface interactions: achievements and challenges. Q. Rev. Biophys. 2016, 49, 1–45. [Google Scholar] [CrossRef]
- Gibson, C.C.; Puleo, D.A.; Bizios, R. Biological interactions on materials surfaces : understanding and controlling protein, cell, and tissue responses; Springer: New York, USA, 2009; pp. 1–17. [Google Scholar]
- Ang, W.S.; Elimelech, M. Protein (BSA) fouling of reverse osmosis membranes: Implications for wastewater reclamation. J. Membr. Sci. 2007, 296, 83–92. [Google Scholar] [CrossRef]
- Dee, K.C.; Puleo, D.A.; Bizios, R. An introduction to tissue-biomaterial interactions; John Wiley & Sons: New York, USA, 2003; pp. 37–52. [Google Scholar]
- Wang, K.; Zhou, C.; Hong, Y.; Zhang, X. A review of protein adsorption on bioceramics. Interface Focus 2012, 2, 259–277. [Google Scholar] [CrossRef] [PubMed]
- Noh, H.; Vogler, E.A. Volumetric interpretation of protein adsorption: Competition from mixtures and the Vroman effect. Biomaterials 2007, 28, 405–422. [Google Scholar] [CrossRef] [PubMed]
- Hirsh, S.L.; McKenzie, D.R.; Nosworthy, N.J.; Denman, J.A.; Sezerman, O.U.; Bilek, M.M.M. The Vroman effect: Competitive protein exchange with dynamic multilayer protein aggregates. Colloids Surf. B 2013, 103, 395–404. [Google Scholar] [CrossRef] [PubMed]
- Ratner, B.D.; Hoffman, A.S.; Schoen, F.J.; Lemons, J.E. Biomaterials science: An introduction to materials in medicine; Elsevier Academic Press: San Diego, USA, 2004; pp. 237–246. [Google Scholar]
- Tizazu, G. Investigation of the effect of molecular weight, density, and initiator structure size on the repulsive force between a PNIPAM polymer brush and protein. Adv. Polym. Technol. 2022, 2022, 1–20. [Google Scholar] [CrossRef]
- Jönsson, M.; Johansson, H. Effect of surface grafted polymers on the adsorption of different model proteins. Colloids Surf. B 2004, 37, 71–81. [Google Scholar] [CrossRef] [PubMed]
- Jin, Z.; Feng, W.; Beisser, K.; Sheardown, H.; Brash, J.L. Protein-resistant polyurethane prepared by surface-initiated atom transfer radical graft polymerization (ATRgP) of water-soluble polymers: Effects of main chain and side chain lengths of grafts. Colloids Surf. B 2009, 70, 53–59. [Google Scholar] [CrossRef] [PubMed]
- Akkas, T.; Citak, C.; Sirkecioglu, A.; Güner, F.S. Which is more effective for protein adsorption: surface roughness, surface wettability or swelling? Case study of polyurethane films prepared from castor oil and poly(ethylene glycol). Polym. Int. 2013, 62, 1202–1209. [Google Scholar] [CrossRef]
- Zhang, Z.H.; Li, G.J.; Yan, F.F.; Zheng, X.J.; Li, X.L. Towards understanding of protein adsorption behavior on plasma polymerized pyrrole film. Cent. Eur. J. Chem. 2012, 10, 1157–1164. [Google Scholar] [CrossRef]
- Molino, P.J.; Higgins, M.J.; Innis, P.C.; Kapsa, R.M.I.; Wallace, G.G. Fibronectin and bovine serum albumin adsorption and conformational dynamics on inherently conducting polymers: a QCM-D study. Langmuir 2012, 28, 8433–8445. [Google Scholar] [CrossRef]
- Takami, K.; Matsuno, R.; Ishihara, K. Synthesis of polyurethanes by polyaddition using diol compounds with methacrylate-derived functional groups. Polymer 2011, 52, 5445–5451. [Google Scholar] [CrossRef]
- Zhang, Z.; Feng, C. The investigation of protein adsorption behaviors on different functionalized polymers films. J. Biotechnol. 2007, 2, 743–751. [Google Scholar] [CrossRef]
- Bunk, J.K.G.; Pospiech, D.U.; Eichhorn, K.; Müller, M.; Werner, C.; Bellmann, C.; Simon, F.; Pleul, D.; Grundke, K. Studying the influence of chemical structure on the surface properties of polymer films. Colloids Surf. A 2010, 362, 47–57. [Google Scholar] [CrossRef]
- Oscarsson, S. Factors affecting protein interaction at sorbent interfaces. J. Chromatogr. B 1997, 699, 117–131. [Google Scholar] [CrossRef]
- Mo, H.; Tay, K.G.; Ng, H.Y. Fouling of reverse osmosis membrane by protein (BSA): Effects of pH, calcium, magnesium, ionic strength and temperature. J. Membr. Sci. 2008, 315, 28–35. [Google Scholar] [CrossRef]
- Wang, Y.; Tang, C.Y. Protein fouling of nanofiltration, reverse osmosis, and ultrafiltration membranes—The role of hydrodynamic conditions, solution chemistry, and membrane properties. J. Membr. Sci. 2011, 376, 275–282. [Google Scholar] [CrossRef]
- She, Q.; Tang, C.Y.; Wang, Y.; Zhang, Z.J. The role of hydrodynamic conditions and solution chemistry on protein fouling during ultrafiltration. Desalination 2009, 249, 1079–1087. [Google Scholar] [CrossRef]
- Li, W.; Cao, F.; He, C.; Ohno, K.; Ngai, T. Measuring the interactions between protein-coated microspheres and polymer brushes in aqueous solutions. Langmuir 2018, 34, 8798–8806. [Google Scholar] [CrossRef] [PubMed]
- Wang, B.; Shi, B. Comparison of surface tension components and hansen solubility parameters theories. part I: explanation of protein adsorption on polymers. J. Macromol. Sci. Phys. 2010; 49, 383–391. [Google Scholar]
- Sadegh, H.; Sahay, R.; Soni, S. Protein–polymer interaction: Transfer loading at interfacial region of PES-based membrane and BSA. J. Appl. Polym. Sci. 2019, 136, 47931. [Google Scholar] [CrossRef]
- Kim, J.T.; Shin, G.H. Adsorption behavior of β-lactoglobulin onto polyethersulfone membrane surface. J. Adhes. Sci. Technol. 2015, 29, 2245–2255. [Google Scholar] [CrossRef]
- Prozeller, D.; Rosenauer, C.; Morsbach, S.; Landfester, K. Immunoglobulins on the surface of differently charged polymer nanoparticles. Biointerphases 2020, 15, 31009. [Google Scholar] [CrossRef]
- Moringo, N.A.; Shen, H.; Tauzin, L.J.; Wang, W.X.; Landes, C.F. Polymer free volume effects on protein dynamics in polystyrene revealed by single-molecule spectroscopy. Langmuir 2020, 36, 2330–2338. [Google Scholar] [CrossRef] [PubMed]
- He, C.; Zhang, H.; Lin, C.; Wang, L.; Yuan, S.L. A molecular dynamics study on the adsorption of a mussel protein on two different films: Polymer film and a SAM. Chem. Phys. Lett. 2017, 676, 144–149. [Google Scholar] [CrossRef]
- Panos, M.; Sen, T.Z.; Ahunbay, M.G. Molecular simulation of fibronectin adsorption onto polyurethane surfaces. Langmuir 2012, 28, 12619–12628. [Google Scholar] [CrossRef]
- Li, B.; Jain, P.; Ma, J.; Smith, J.K.; Yuan, Z.; Hung, H.C.; He, Y.; Lin, X.; Wu, K.; Pfaendtner, J.; et al. Trimethylamine N-oxide-derived zwitterionic polymers: A new class of ultralow fouling bioinspired materials. Sci. Adv. 2019, 5, w9562. [Google Scholar] [CrossRef]
- Mollahosseini, A.; Saadati, S.; Abdelrasoul, A. Effects of mussel-inspired co-deposition of 2-hydroxymethyl methacrylate and poly (2-methoxyethyl acrylate) on the hydrophilicity and binding tendency of common hemodialysis membranes: Molecular dynamics simulations and molecular docking studies. J. Comput. Chem. 2022, 43, 57–73. [Google Scholar] [CrossRef]
- Ghermezcheshme, H.; Mohseni, M.; Ebrahimi, M.; Makki, H.; Martinelli, E.; Braccini, S.; Galli, G. Effect of network topology on the protein adsorption behavior of hydrophilic polymeric coatings. ACS Appl. Polym. Mater. 2022, 4, 129–140. [Google Scholar] [CrossRef]
- Hirst, E.R.; Xu, W.L.; Bronlund, J.E.; Yuan, Y.J. Surface Acoustic Wave Delay Line for Bond Rupture Biosensors. IEEE Sensors J. 2011, 11, 2952–2956. [Google Scholar] [CrossRef]
- Xu, Z.L.; Yuan, Y.J. Quantification of Staphylococcus aureus by ZnO naonparticles-based surface acoustic wave. RSC Adv. 2019, 9, 8411–8414. [Google Scholar] [CrossRef] [PubMed]
- Astuti, I.; Ysrafil. Severe acute respiratory syndrome coronavirus 2 (SARS-CoV-2): An overview of viral structure and host response. Diabetes Metab. Res. Rev. 2020, 14, 407–412. [Google Scholar] [CrossRef] [PubMed]
- Cordes, A.K.; Rehrauer, W.M.; Accola, M.A.; Wolk, B.; Hilfrich, B.; Heim, A. Fully automated detection and differentiation of pandemic and endemic coronaviruses (NL63, 229E, HKU1, OC43 and SARS-CoV-2) on the hologic panther fusion. J. Med. Virol. 2021, 93, 4438–4445. [Google Scholar] [CrossRef]
- Neese, F. Software update: The ORCA program system—Version 5.0. WIREs Comput Mol Sci. 2022, 12, e1606. [Google Scholar] [CrossRef]
- Grimme, S. Density functional theory with London dispersion corrections. WIREs Comput Mol Sci. 2011, 1, 211–228. [Google Scholar] [CrossRef]
- Lu, T.; Chen, F. Multiwfn: a multifunctional wavefunction analyzer. J. Comput. Chem. 2012, 33, 580–592. [Google Scholar] [CrossRef]
- Zhang, J.; Lu, T. Efficient evaluation of electrostatic potential with computerized optimized code. Phys. Chem. Chem. Phys. 2021, 23, 20323–20328. [Google Scholar] [CrossRef]
- Wang, J.; Wolf, R.M.; Caldwell, J.W.; Kollman, P.A.; Case, D.A. Development and testing of a general amber force field. J. Comput. Chem. 2004, 25, 1157–1174. [Google Scholar] [CrossRef] [PubMed]
- Abraham, M.J.; Murtola, T.; Schulz, R.; Páll, S.; Smith, J.C.; Hess, B.; Lindahl, E. GROMACS: High performance molecular simulations through multi-level parallelism from laptops to supercomputers. Softwarex 2015, 1-2, 19–25. [Google Scholar] [CrossRef]
- Muntean, S.A.; Gerasimov, R.A.; Lyulin, A.V. Dynamics of water near oxidized polystyrene films. Macromol. Theory Simul. 2012, 21, 544–552. [Google Scholar] [CrossRef]
- Wu, C.; Chan, K.K.; Woo, K.F.; Qian, R.Y.; Li, X.H.; Chen, L.S.; Napper, D.H.; Tan, G.L.; Hill, A.J. Characterization of pauci-chain polystyrene microlatex particles prepared by chemical initiator. Macromolecules 1995, 28, 1592–1597. [Google Scholar] [CrossRef]
- Towler, P.; Staker, B.; Prasad, S.G.; Menon, S.; Tang, J.; Parsons, T.; Ryan, D.; Fisher, M.; Williams, D.; Dales, N.A.; et al. ACE2 X-ray structures reveal a large hinge-bending motion important for inhibitor binding and catalysis. J. Biol. Chem. 2004, 279, 17996–18007. [Google Scholar] [CrossRef] [PubMed]
- Humphrey, W.; Dalke, A.; Schulten, K. VMD: visual molecular dynamics. J. Mol. Graph. 1996, 14, 33–38. [Google Scholar] [CrossRef] [PubMed]
- Guex, N.; Peitsch, M.C. SWISS-MODEL and the Swiss-PdbViewer: an environment for comparative protein modeling. Electrophoresis 1997, 18, 2714–2723. [Google Scholar] [CrossRef]
- Anandakrishnan, R.; Aguilar, B.; Onufriev, A.V. H++ 3.0: automating pK prediction and the preparation of biomolecular structures for atomistic molecular modeling and simulations. Nucleic Acids Res. 2012, 40, 537–541. [Google Scholar] [CrossRef]
- Hornak, V.; Abel, R.; Okur, A.; Strockbine, B.; Roitberg, A.; Simmerling, C. Comparison of multiple Amber force fields and development of improved protein backbone parameters. Proteins 2006, 65, 712–725. [Google Scholar] [CrossRef]
- Ma, Y.; Zydney, A.L.; Chew, J.W. Membrane fouling by lysozyme: Effect of local interaction. AlChE J. 2021, 67, e17212. [Google Scholar] [CrossRef]
- Essmann, U.; Perera, L.; Berkowitz, M.L.; Darden, T.; Lee, H.; Pedersen, L.G. A smooth particle mesh Ewald method. J. Chem. Phys. 1995, 103, 8577–8593. [Google Scholar] [CrossRef]
- Bussi, G.; Donadio, D.; Parrinello, M. Canonical sampling through velocity rescaling. J. Chem. Phys. 2007, 126, 14101. [Google Scholar] [CrossRef]
- Hess, B.; Bekker, H.; Berendsen, H.J.C.; Fraaije, J.G.E.M. LINCS: A linear constraint solver for molecular simulations. J. Comput. Chem. 1997, 18, 1463–1472. [Google Scholar] [CrossRef]
- Berendsen, H.J.C.; Postma, J.P.M.; van Gunsteren, W.F.; Hermans, J. Interaction models for water in relation to protein hydration. In Intermolecular forces; Pullman, B., Ed.; Springer: Dordrecht, Netherlands, 1981; Volume 14, pp. 331–342. [Google Scholar]
- Wang, X.; Wang, M.; Wei, Q.; Yang, X.; Yang, Y.; Cui, B.L.; Yang, X.N.; Xu, Z.J. Modulation of solid-water-peptide interfacial properties towards surface adsorption/bioresistance. Appl. Surf. Sci. 2019, 483, 373–382. [Google Scholar] [CrossRef]
- Alsharif, S.A.; Power, D.; Rouse, I.; Lobaskin, V. In silico prediction of protein adsorption energy on titanium dioxide and gold nanoparticles. Nanomaterials 2020, 10, 1967. [Google Scholar] [CrossRef]
- Nakano, C.M.; Ma, H.; Wei, T. Study of lysozyme mobility and binding free energy during adsorption on a graphene surface. Appl. Phys. Lett. 2015, 106, 153701. [Google Scholar] [CrossRef]
| Protein | Polymers | Environment | Interaction | Method/ theory |
|---|---|---|---|---|
| BSA | 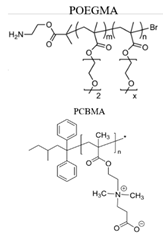 |
NaCl aqueous solution | Electrostatic [36] | TIRM |
 |
Phosphate buffer solution (PBS pH 7.0, 0.1 M) | VDW [37] | STC, HSP | |
| BSA |  |
pH 4.7, 7, 10 NaCl solution | Electrostatic [38] | Contact Angle, FTIR |
| β-lactoglobulin | PBS (pH 3, 5.2, 7, 9.5) | Hydrophobic [39] | Freundlich model | |
| IgG, IgA, IgM |  |
PBS | Electrostatic Hydrophobic [40] | Zeta potential |
| α-LA, Lysozyme | 10 mM HEPES buffer (pH 7.2) | Hydrophobic [41] | TIRM | |
| Mussel protein | 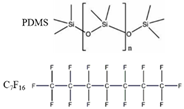 |
water | VDW Electrostatic [42] | MD |
| FN |  |
VDW Electrostatic [43] | ||
 |
Hydrogen bonds [44] | |||
| FB, HSA | 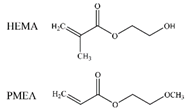 |
VDW Electrostatic Hydrogen bonds [45] | ||
| HSA, FN |  |
Hydrophobic Hydrogen bonds [46] |
| NaCl (M) | 0.01 M | 0.05 M | 0.1 M | 0.15 M | 0.2 M | 0.25 |
|---|---|---|---|---|---|---|
| (0, 0, 0) | 0.017 | 0.002 | 0.984 | 0.324 | 0.043 | 0 |
| (0, 90, 0) | 0.001 | 0.867 | 0 | 0.962 | 0.949 | 0.904 |
| (0, 270, 0) | 0.298 | 0.906 | 0.209 | 0.618 | 0.014 | 0.489 |
| (90, 0, 0) | 0.322 | 0.068 | 0.904 | 0.060 | 0.877 | 0.208 |
| (180, 0, 0) | 0.088 | 0.670 | 0.166 | 0.813 | 0.123 | 0.059 |
| (270, 0, 0) | 0.095 | 0.118 | 0.327 | 0.530 | 0.402 | 0.362 |
| Total | 0.137 | 0.439 | 0.432 | 0.551 | 0.401 | 0.337 |
Disclaimer/Publisher’s Note: The statements, opinions and data contained in all publications are solely those of the individual author(s) and contributor(s) and not of MDPI and/or the editor(s). MDPI and/or the editor(s) disclaim responsibility for any injury to people or property resulting from any ideas, methods, instructions or products referred to in the content. |
© 2023 by the authors. Licensee MDPI, Basel, Switzerland. This article is an open access article distributed under the terms and conditions of the Creative Commons Attribution (CC BY) license (http://creativecommons.org/licenses/by/4.0/).


