1. Introduction
The volume stability and biological transformation dynamics of the construction implanted into a recipient's site are greatly influenced by the biological and physical characteristics of the osteoconductive granulated biopolymers (OGB) [
1,
2]. Osteoconductive properties, controlled biodegradability, and structural support of the bioengineered construction are the fundamental clinical requirements for the OGB [
3]. While OGB internal spaces continue to undergo a biological transformation into a native bone, OGB external spaces serve as native carriers or matrices of the extracellular space, allowing cells to become fixed, proliferate, differentiate, and colonize other available surfaces [
4,
5]. The matrix of physically mediated signals from the OGB significantly impacts these processes [
6]. The physical characteristics of the OGB, which govern how the osteoconduction program is carried out, impact the quality of the signals reaching the recipient's site's intercellular surroundings [
6]. These physical characteristics include the particle's size, shape, pore size, type of connection, solidity, relief, specific surface area, and crystallinity [
7,
8,
9,
10].
According to a study by Stuckensen et al. [
11], specific frames that mimic the architecture and biochemical characteristics of natural bone and cartilage can alter the behavior of cells, causing them to integrate into the structure and produce the matrix without the need for additional ingredients. The particulate fraction's composition becomes heterogeneous during OGB production. When particles aggregate, they develop a different set of physical characteristics that are typical of loose particulate mixtures. After being prepared ex tempore and directly affected by the recipient's site's natural biological environment, OGB's physical characteristics change again. Recent research on the homogenization process and the evolution of the interphase boundary between different particle types has shown that this process is influenced by the initial spatial distribution of the fraction particles as well as by the dynamics of the system [
12,
13]. Conglomerates are formed when OGB particles group into more significant fractions. These conglomerates may cause an uncontrollable volume change in the bioconstruction at the recipient's site. This might make the construction less stable in the immediate aftermath of surgery. The physical indicators that describe the behavior of the OGB at the recipient site—the compaction coefficient, biodegradation rate, and adsorption capacity—can be used to calculate the requirements for maintaining the stability of the scaffold shape in the postoperative period. Finding such precise indicators may be an innovative and fruitful field of study.
In contrast to plain surfaces, the local geometry and 3D structure of OGB create a biological environment that significantly impacts the genetic expression of cells migrating to the biopolymer as well as their proliferation and capacity to colonize structure [
14,
15]. At the same time, the OGB surface convolution determines how quickly cell pools form and local tissue convolution controls how cells and tissues are organized in both time and space [
16]. Compared to block-shaped grafts, ex tempore granules are more practical for treating bone defects with a complex geometric shape due to the ability to model the OGB fraction during implantation easily [
17,
18]. In addition, the OGB has a large area of external and internal surfaces and mobile intergranular spaces available for bone growth factors (BGF) [
19,
20,
21,
22]. According to conventional wisdom, the framework should be 50 to 90 percent porous to simulate spongy bones and 10 to 30 percent porous to represent cortical bone [
23].
The capacity of an implant to facilitate fluid movement across the entirety of the OGB space is a critical factor in determining whether or not guided bone regeneration (GBR) will be effective in repairing defects in the jaw bone. When oxygen or nutrients are in short supply, cells are unable to migrate further than 500 micrometers away from the surface [
24]. As a result of the manufacturing process for OGB, fine dust covers the particle surfaces and pores, which results in a change in the geometry of the pores. Because of this hermetic encapsulation, the pores do not come together to form a functioning system. Instead, dust and air become trapped in the channels. Because of this, the available surfaces of the biopolymer become smaller, drainage becomes more complex, and the adsorption capacity of the bioengineered construction as a whole is reduced [
25]. This is the physical explanation for why OGB's adsorption capacity has decreased.
It is possible for various OGB manufacturing techniques to produce materials with distinct variations in their physical properties, such as porosity, roughness, mechanical properties, and composition gradients [
26,
27]. The roughness of the scaffold's external and internal surfaces significantly impacts the hydrodynamic properties of the bioengineering construction. An increase in the roughness leads to a proportional decrease in the liquid flow intensity and scaffold permeability [
27]. According to the research findings, manipulating the scaffold's structure can assist in regulating the shear stress that cells are subjected to. In this scenario, having a solid understanding of the microenvironment surrounding the bone tissue is necessary. Changing one parameter, such as the surface topology, may have multiple biomechanical effects on the scaffold cells, including endogenous tension and liquid shear stress [
28]. In addition, if there is going to be a surgical procedure, the ideal scaffold should be simple to apply and flexible enough to conform to the recipient's site, which will cut the time needed for the procedure down to the absolute minimum [
27].
Consequently, the volume stability and biotransformation of the bioengineering construction can be improved in the postoperative period by managing physical properties with a high prognostic value. These properties include adsorption capacity, compaction coefficient, the surface of external and internal pores, and the ratio of simple and thorough pores. In addition, new bioengineering solutions are being developed to increase the requirements for the morphology of OGB particle surfaces and improve OGB preparation conditions in clinical settings. The manufacturing strategy should be based on knowledge of how the manufacturing and preparation methods influence the chosen biomaterials [
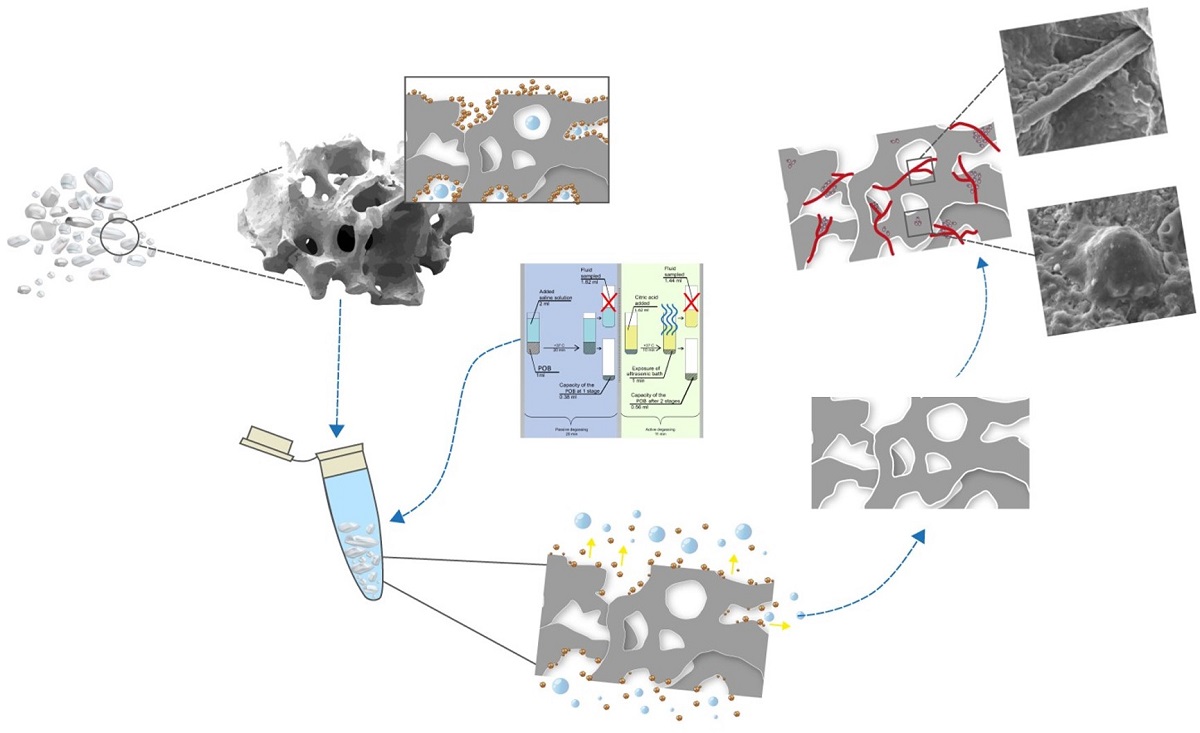
29]. Because of this, it is necessary to identify the conditions that can increase OGB drainage by increasing its adsorption capacity. This will result in an optimized transfer of oxygen and nutrients, as well as the removal of products of cell metabolism. The search for new approaches in bone tissue bioengineering will be defined in the future by combining various materials, treatment methods, and cell types. Therefore, our research focuses on identifying the physical properties that determine the stability of the volume and biotransformation dynamics of the granulated osteoconductive biopolymers during the postoperative period.
2. Materials and Methods
To achieve the objective, we have studied the physical properties of the OGB that determine the stability of the volume and biotransformation dynamics of the scaffold in the postoperative period. Six OGBs were studied (Maxresorb (Botiss biomaterials GmbH, Germany), Bio-Oss (Geistlich, Switzerland), Cerabone (Botiss biomaterials GmbH, Germany), Xenograft Collagen (BioOST, Russia), Osteon II (Genoss, South Korea), and Mineralized spongy powder (MSP) (LYOPLAST-С®, Russia)).
2.1. Calibration of the research protocol
A granular fraction of natural limestone of biogenic origin with a granule modulus of 0.5-1 mm was used to calibrate the study protocol.
2.1.1. Production of a granular limestone fraction (LI) of specified granulometric composition:
The limestone was crushed under pressure and in a mill to obtain a granular fraction.
Granulometric calibration of the fraction granules was carried out: the given granular fraction of limestone was loaded into a sieve with a mesh size of 2 mm and sifted on a sieve shaker S-30 (VIBROTEHNIK, Russian Federation) for 1 minute. The vibration amplitude of the shaker sieves is 0.5 mm, and the vibration frequency is 1500 vibrations per minute.
The fraction of granules with a modulus ≤2 mm was placed in a sieve with a mesh size of up to 1 mm and sieved under similar conditions.
To obtain a granule modulus of 0.5 mm, a fraction of limestone granules with a modulus ≤ 1 mm was placed in a sieve with a mesh size of 0.5 mm and sieved under similar conditions. The residual LI fraction was removed by sieving through a 0.4-mm sieve.
The LI fraction with a granule modulus of 1 mm was mixed with an equal amount of the granule fraction with a 0.5 mm modulus.
The resulting limestone fraction, with a granule modulus of 0.5 - 1 mm, was freed from fine dust with a low stream of dry air.
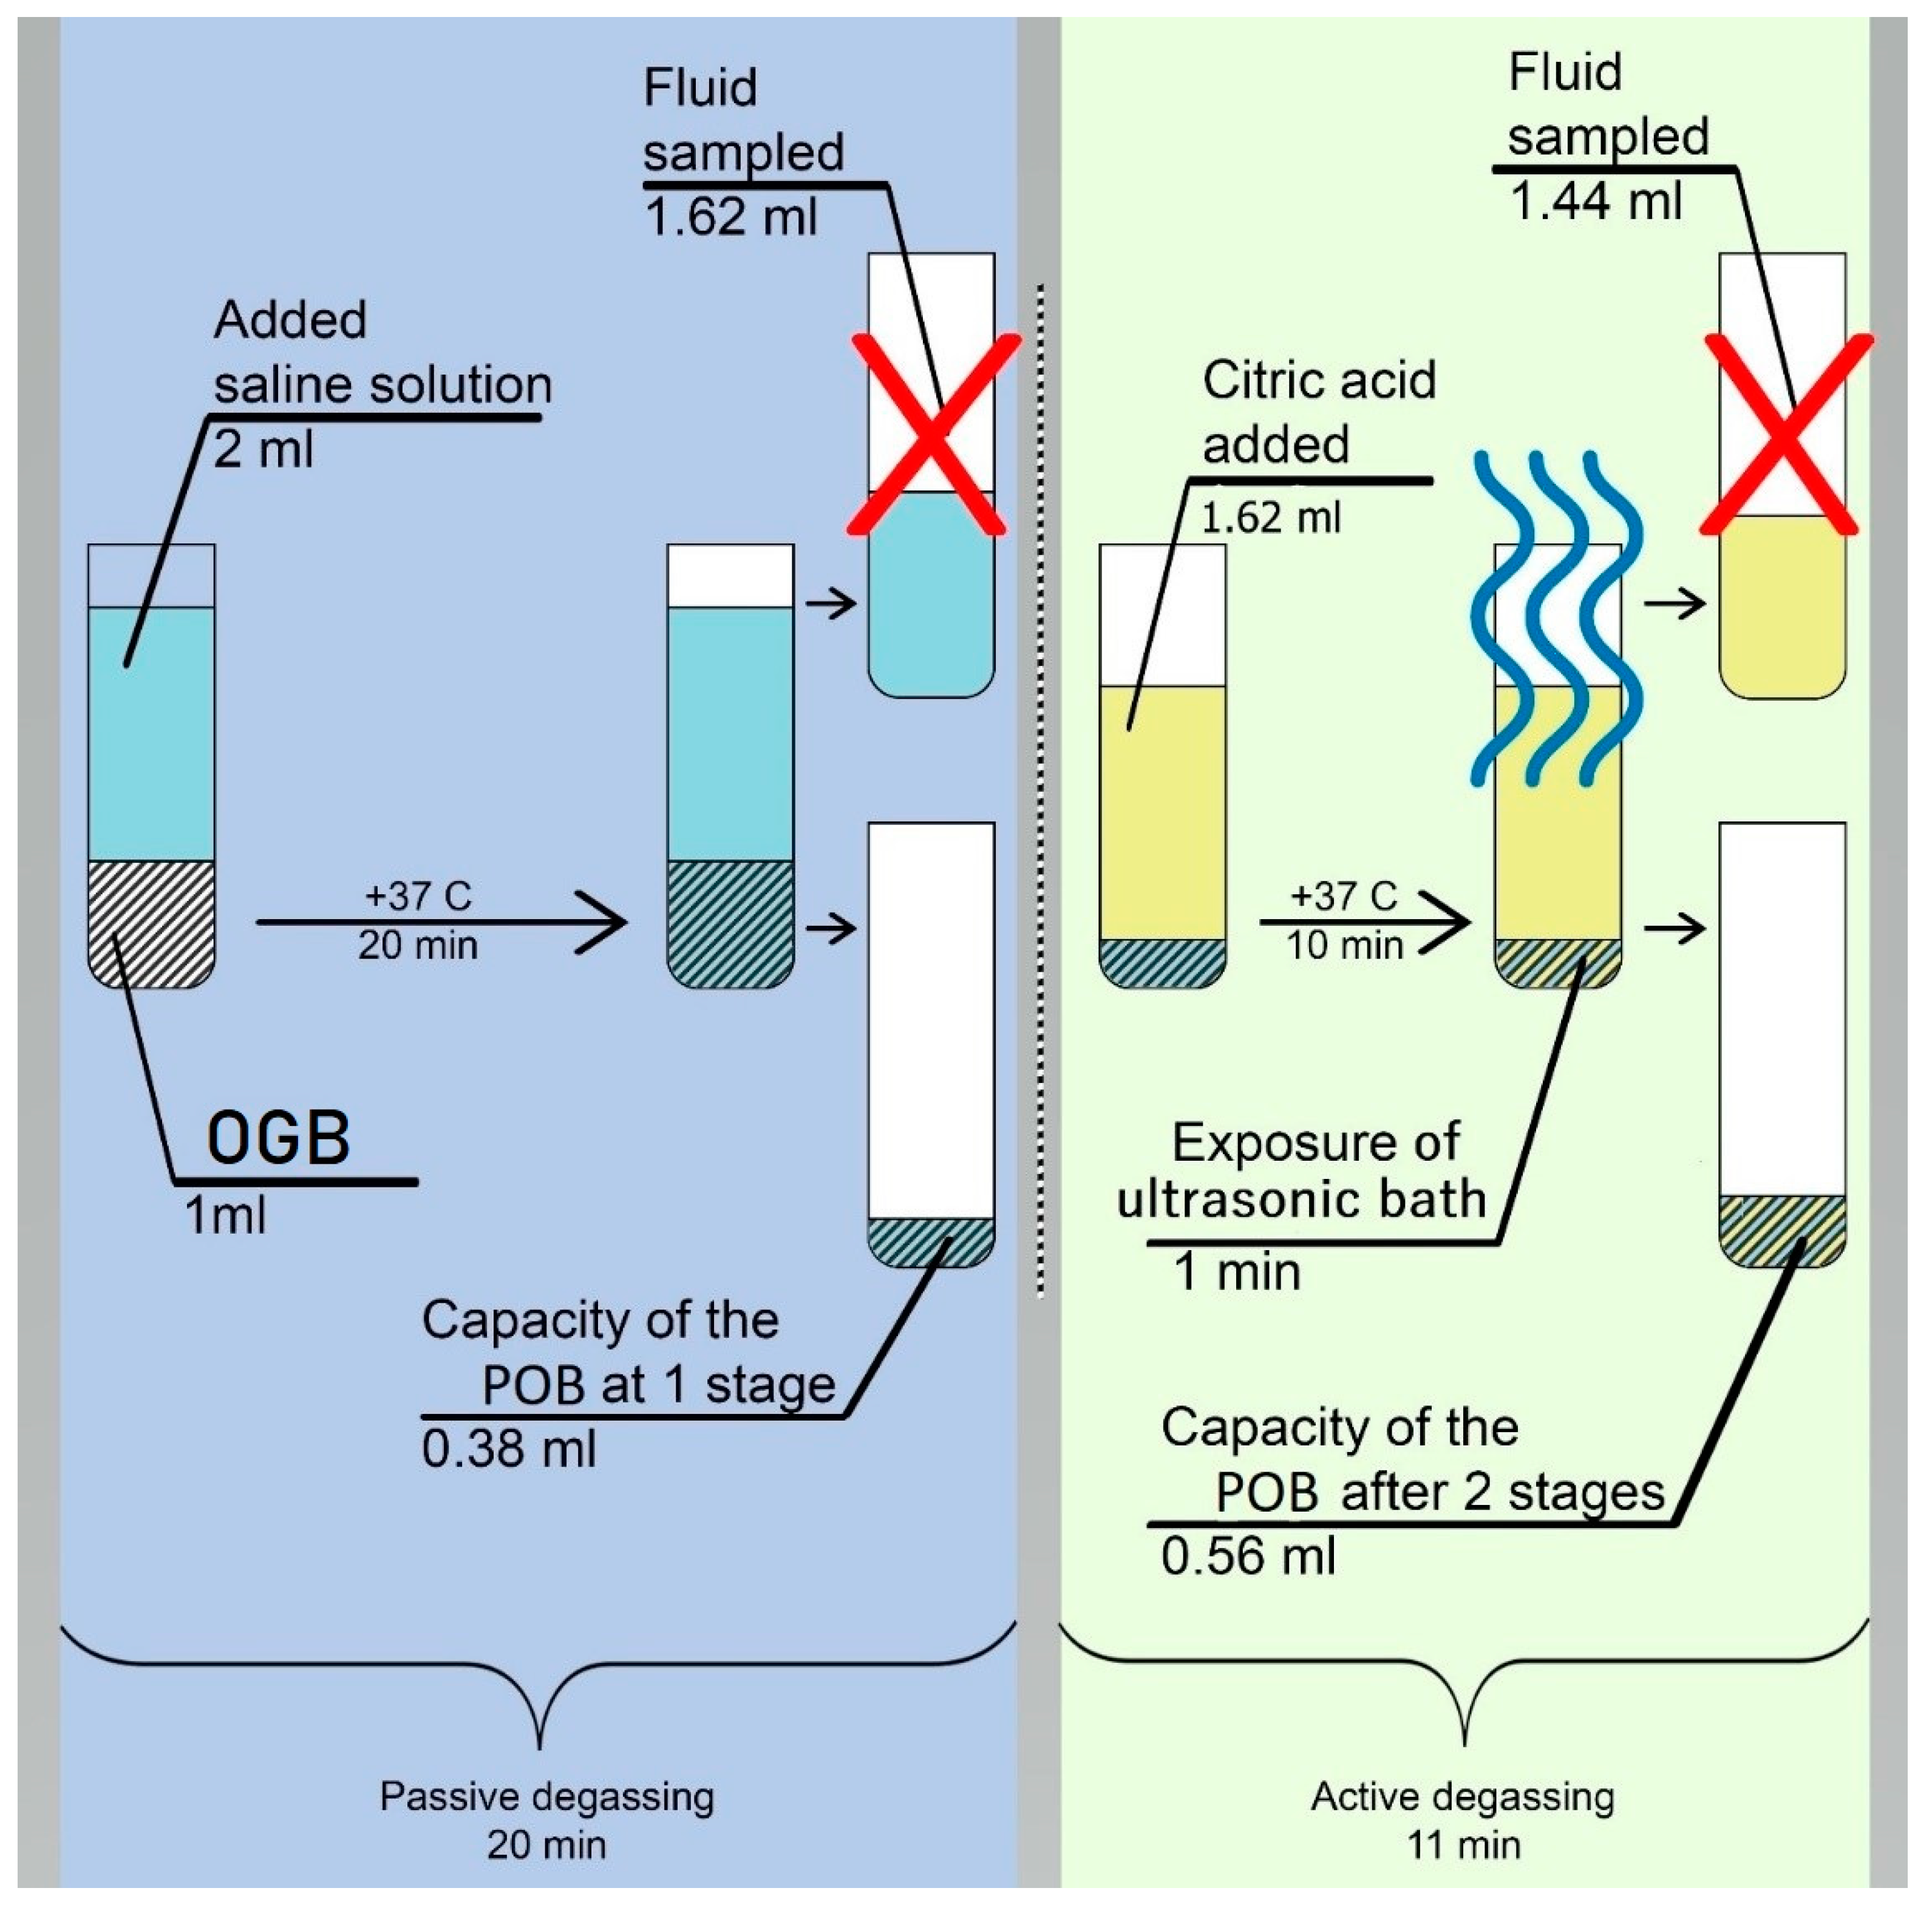
2.1.2. The LI fraction was weighed on analytical scales so that the mass of the dry sample could be determined (m1 = 2 g). The removal of coarse and fine dust and air bubbles from the OGB fraction was done using degassing and dust extraction [30]. The method of degassing and dust extraction is implemented in two stages (Figure 2):
The first stage: is passive degassing and dust extraction, removal of coarse friction dust and air from surfaces and voids. The first stage was carried out in saline solution (SS), since its osmotic pressure (0.9%) corresponds to the osmotic pressure of blood plasma. In the thermostat, the SS temperature was adjusted to +37oC, corresponding to the recipient site's temperature. LI was placed into the test tube of the thermostat and then filled with saline solution with a ratio of 1:2 per 1 cm3 of LI. 2 ml of saline solution was added. Twenty minutes later, the LI fraction was separated from the saline solution using a pipette dispenser (a mechanical single-channel dispenser with a variable volume of 20-200 µl).
The second stage: is active degassing and dust extraction, removing fine friction dust and residual gases from the mouths of interstitial channels and voids. According to [
31,
32], the LI fraction was filled with a citric acid (pH 1) solution at +37 °C for 10 minutes.
Preparation of citric acid solution: A saturated acid solution was prepared by slowly adding anhydrous citric acid to 50 ml of distilled water and using a magnetic stirrer (Microfix, JP Selecta) to stir the solution. Citric acid crystals were added until pH 1 was obtained, which was determined using a pH meter.
After ten minutes of LI being in citric acid solution, ultrasonic generators were activated, and active degassing and dust extraction were carried out in an ultrasonic bath (UZU - 0.25, Russia) with a frequency of 18 kHz, a power of 250 watts, and an exposure time of 60 seconds. After ultrasound treatment, citric acid was separated from the material using a pipette dispenser.
To remove acid residues, the LI fraction was immersed in a saline solution at a temperature of +37oC and treated in an ultrasonic bath (UZU - 0.25, Russia) with a frequency of 18 kHz, a power of 250 watts, and an exposure time of 60 seconds.
2.2. After calibration of the research protocol, six OGBs were prepared similarly according to the sequence of operations in paragraph 2.1.2.3. The OGB fraction analysis for cytotoxicity was made after the preparation for the study according to the protocol stated in paragraph 2.1.2.
The study was performed in vitro on 9 samples (3 in each group). A fraction of the OGB Cerabone ® (Botiss biomaterials GmbH, Germany) was chosen for the study by random sampling. Group 1 – the OGB Cerabone ® fraction without preparation according to the protocol described in paragraph 2.1.2. Group 2 – the OGB Cerabone ® fraction prepared according to the protocol described in paragraph 2.1.2. Group 3 – the control group – the mesenchymal stromal cells (MSC) culture, obtained from the human umbilical cord.
MSC obtained from the human umbilical cord (donor No. 7000400025628, cultures of the second passage) were used to assess the cytotoxicity of the degassing method we developed. The viability of the cells during freezing was 96%. Before being introduced into the experiment, MSC was thawed in a water bath at 37°C for 2.5 minutes. MSC was washed twice from the cryoprotection in a laminar flow cabinet (KS-12 Herasafe (Thermo Scientific, USA)) with a sterile solution of phosphate-salt buffer (Dalbecko solution (DPBS, Biolot, Russia)). The viability of cells before introduction into the experiment was 94% in the amount of 5.8 million.
Samples from each group were placed in 100 cm2 culture Petri dishes (SPL, Korea). In groups 1 and 2, 500,000 cells were transferred to the material's surface using a variable volume dispenser. In group 3, a Petri dish with an area of 100 cm2 with the same number of planted cells was used. 15 minutes after the introduction of the cell suspension in alpha-MEM liquid growth medium with L-glutamine, sterile (Biolot LLC, Russia), 2mM of L-glutamine (Biolot LLC, Russia) was added to each culture cup. The samples in the medium were placed in a CO2 incubator (CB 210; Binder, Germany) and incubated under standard conditions for 8 days. A visual inspection of the culture was carried out daily and cell morphology was evaluated. On the eighth day, the cups were trypsinized with trypsin-EDTA solution (PanEco, Russia)), and the cells were disaggregated from the plastic.
The Countess II FL Automated Cell Counter (Thermo Fisher Scientific, USA) was used to assess the viability of MSC in culture. The proliferative index and the rate of doubling of the culture were determined. The morphology of the cultured cells was evaluated dynamically at all stages of cultivation using an AXIO Observer A1 microscope (Carl Zeiss, Germany).
2.4. Determining the true adsorption capacity (ACT) indicator of the OGB fraction
2.4.1. Determining the apparent adsorption capacity (ACA) of the OGB fraction (Table 1).
The volume (V1) of the extracted SS was determined at the end of the first degassing and dust extraction stage according to the protocol described in paragraph 2.1.2. using a pipette dispenser (a mechanical single-channel dispenser with a variable volume of 20-200 µl) in an eppendorf (volume of 2 ml).
To determine the volume (V2) according to the protocol described in paragraph 2.1.2. at the stage of active degassing and dust extraction, the OGB fraction was filled with the citric acid solution in the volume (V1). At the end of the second stage, the volume (V2) of the extracted liquid was determined using a pipette dispenser in an eppendorf.
The volume (V3) is the initial volume of liquid used in the first stage of degassing and dust extraction (ml).
The apparent adsorption capacity of the OGB was determined by the following formula: АCA = (V3-V1) + (V1-V2)
2.4.2. Determining the indicator of the water absorption by mass of the OGB fraction, including intergranular spaces (WmА)
2.4.3. Determining the indicator of the water absorption by mass of the OGB fraction, excluding intergranular spaces (WmB)
Residual fluid was removed from the intergranular spaces of the OGB fraction. To remove the liquid from the intergranular spaces, the OGB fraction was placed on a slide and moved along the glass surface until the liquid was released from the OGB fraction. The mass (m3) of the OGB fraction was determined.
The indicator of the water absorption by mass of the OGB fraction, excluding intergranular spaces (WmB), was determined according to the following formula - WmB = [(m3-m1) /m1] • 100%.
2.4.4. Calculation of the true adsorption capacity (ACT) indicator of the OGB fraction
The water absorption by mass of the OGB fraction, including and excluding intergranular spaces, the volume of micropores, and the presence of through pores and channels in the granules, were considered. The method of calculating the true adsorption capacity is described in
Section 3.2, "The Results."
2.5. Determining the compaction coefficient of the OGB fraction – CC
The OGB fraction was poured into a test tube without compaction, and the height of the column was marked h1. Then the test tube was installed on a vibrating table (VD 30 VIBRATION DRIVE, VIBROTECHNIK, Russian Federation) and compacted with an oscillation amplitude of 0.25 mm for 10 minutes. The height of the column of the OGB h
2 fraction was obtained after compaction. The calculation of the compaction coefficient of the OGB fraction was carried out according to
Table 2.
2.6. Fourier transform infrared spectroscopy
Fourier transform infrared spectroscopy (FTIR) assessed the chemical composition and major functional groups present in the samples. Before analysis, samples from the four groups were homogenized using a mortar and pestle under dry conditions. Then the spectra were recorded in the 400-4000 cm-1 using a Nicolet IS-50 spectrometer (Thermo Scientific, Milan, Italy) in attenuated total reflection mode. Each spectrum was collected at room temperature with a resolution of 6 cm-1, and the number of samples scanned was 32.
2.7. Scanning electron microscopy
Fragments of the OGB fraction were mounted on a double-coated, carbon-conductive tape and then sputter-coated with gold using UNICOAT 600t. Using a Tescan Vega with an Inga Energy microanalyzer (TES-CAN, Czech Republic) in the secondary electron detection mode and an accelerating voltage of 30 kV, a topographic analysis of the sample surface was done to figure out the area of the outer-inner surfaces of channels and pores, the volume of the pores and channels, and the ratio of pores to channels in the OGB.The working distance was adjusted to obtain a suitable magnification.
The fragments of the OGB fraction that were grown in tissue culture in vitro and the fragments of the regeneration that were obtained by opening the implant plug were fixed in phosphate buffer at a pH of 7.0 to 7.4 with 4 percent formaldehyde. The fragments of the regeneration were obtained after the surgical stage, when the period of bone integration of the dental implant was over – at the stage of healing abutment mounting at the moment of opening the plug. The preparations were naturally dried for 10 minutes at room temperature prior to the study. No additional chemical dehydration took place. In order to be sputtered with a layer of gold that was 5 nm thick in the SPI-Module SputterCoater, the preparations were mounted on aluminum tables and secured with double-sided carbon tape (SPI, USA) (SPI, USA). Using a Quanta 200 3D scanning two-beam ion-electron microscope (FEI Company, USA) in high vacuum with an accelerating voltage of 10 kV, the samples were examined.
2.8. Gas adsorption
Gas adsorption was performed to determine the specific surface area of the investigated samples. The textural characteristics of the samples under study were measured on a Quantachrome Autosorb-1 (Quantachrome Instruments, USA) adsorption porosimeter by low-temperature nitrogen adsorption. To characterize the specific surface area, the Brunauer-Emmett-Teller (BET) model was used at a relative partial pressure P/P0 of 0.05 - 0.3. The total pore volume and pore size distribution were calculated from the desorption curve using the Barrett-Joyner-Halenda (BJH) model. Before testing, the samples were calcinated at a temperature of about 300 degrees Celsius to remove water adsorbed on the surface.
2.9. Cone Bean Computed Tomography (CBCT) Analysis
CBCT was used for 3D planning of bone defect repair using our method [
33]. To assess the stability of the bioengineering construction, a study was conducted two weeks, three months, one year, and two years after the GBR method. Images were analyzed by a CBCT device (Vatech, Korea) Model "PaX-i 3D", X-ray tube (Toshiba "D-052SB") with the following technical parameters: 90 peak kV, 10 peak mA, pixel size 100 μm, 5.9 x 230.4mm sensor active area, and 200 fps.
2.10. Surgical protocol
There were 182 people under observation (women: 117, men: 65). Inclusion criteria: patients with acquired and congenital jaw bone defects (JBD). The exclusion criteria were: JBD is caused by a malignant neoplasm; patients who refused to accept the terms of the treatment protocol. The diagnostic protocol included a clinical examination and treatment planning. The surgical stage included dental implantation in combination with the simultaneous elimination of the bone defect by the guided bone regeneration (GBR) method. Cerabone (Botiss biomaterials GmbH, Germany) was used in 118 patients; Bio-OSS (Geistlich, Switzerland) was used in 28 patients; Xenograft Collagen (BioOST, Russia) was used in 8 patients; Osteon II (Genoss, South Korea) was used in 8 patients; 7 patients used Maxresorb (Botiss biomaterials GmbH, Germany); and 6 patients used Mineralized spongy powder (MSP) (LYOPLAST-С®, Russia). Three or four months after the operation, the implant plug was opened. At the time of the opening of the plug, the regeneration located above the plug of the implant was taken for SEM analysis.
2.11. Statistical Analysis
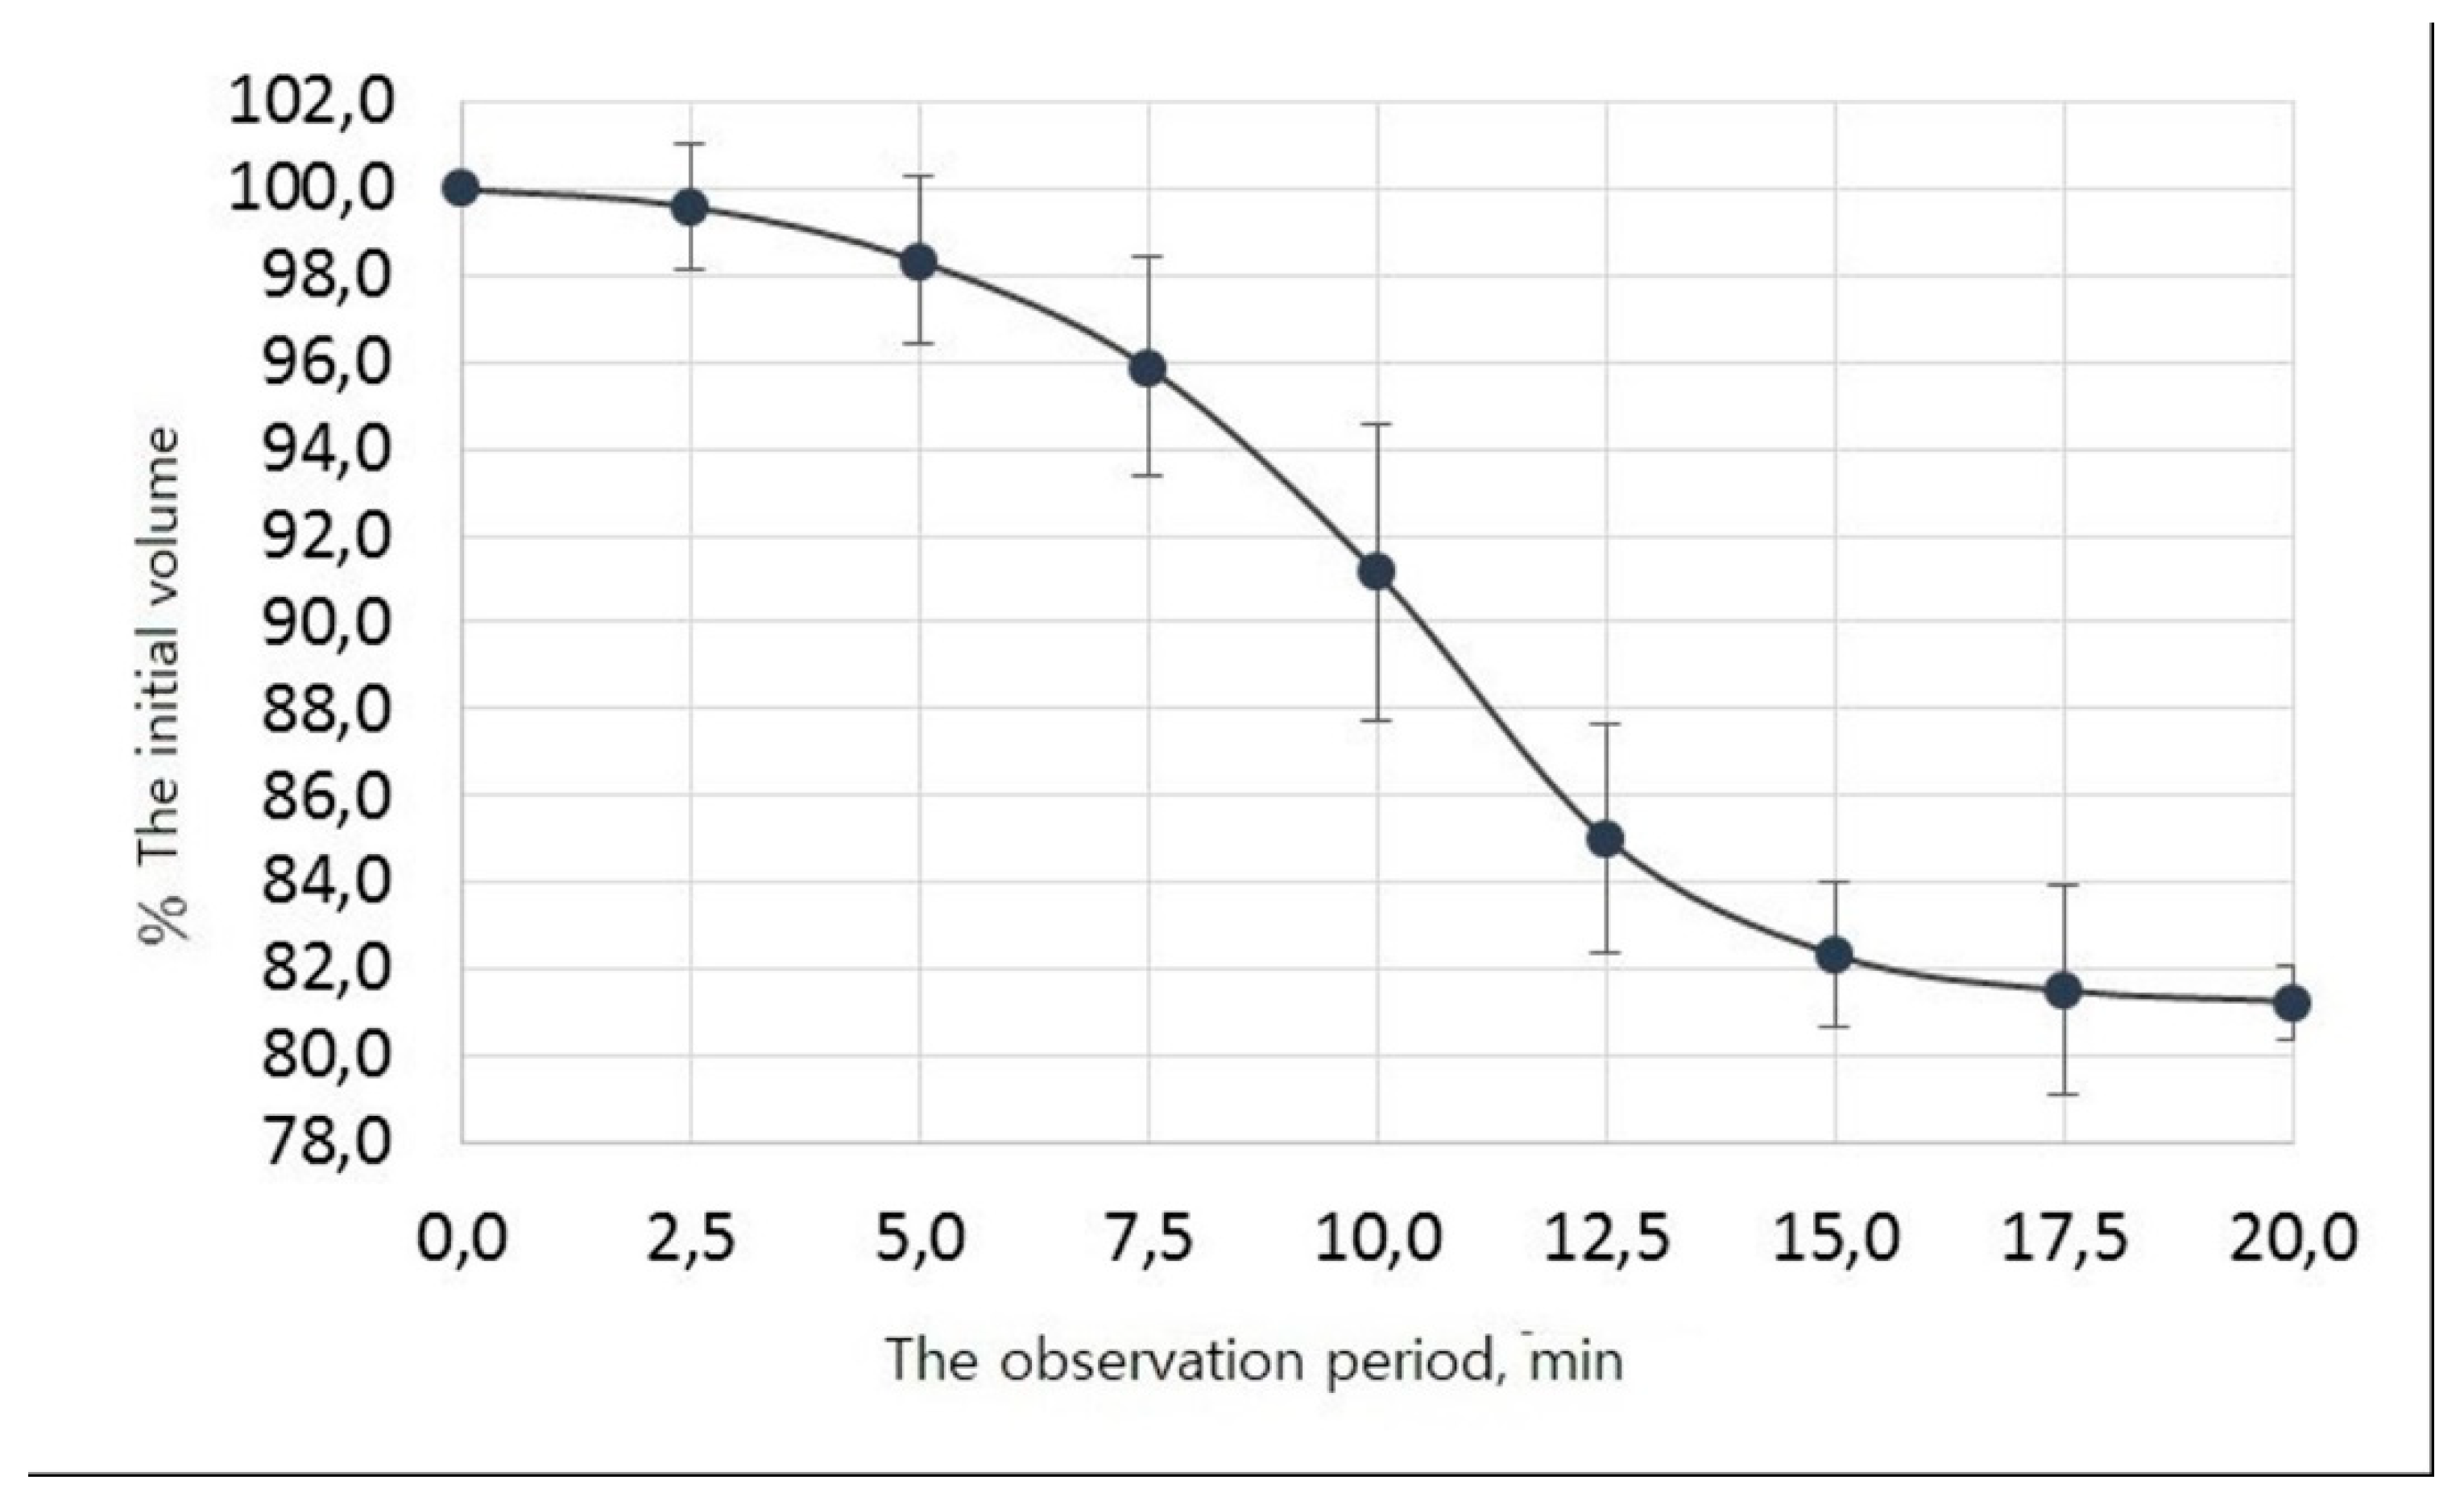
To assess the rate of degassing, the experiment was carried out in triplicate in the interval from 0 min (start of degassing) to 20 min (end of degassing). The volume of the liquid was recorded every 2.5 minutes. The software used for statistical analysis is SPSS 25.0 (IBM Corporation, Armonk, New York, USA).
The arithmetic means of the remaining liquid volume, the standard deviation, the mean error, and the 95% confidence interval boundaries were calculated at each studied time point.
The experimental data -- 9-time points with 3 measurements in each, for a total of 27 pairs of observations -- are smoothed with a high degree of accuracy by a 4-parameter logistic curve, the equation of which in general form is as follows:
f (t) = d + (c-d) / (1 + exp (-a (t-b))),
where f (t) is the percentage of the initial volume of the liquid,
t - time in minutes,
d is the maximum percentage (without degassing), in this study, we took it to be equal to 100%,
с - parameter reflecting the minimum percentage of the initial liquid volume after the completion of degassing,
a is a parameter reflecting the rate of degassing,
b - parameter characterizing the time at which half the degassing occurs.
3. The Results
3.1. Determining the apparent adsorption capacity (ACA) of the OGB fraction
Empirically, we have established that at the stage of passive degassing, when the OGB fraction is immersed for 20 minutes in a saline solution at +37ºC, gas bubbles, and fine dust are released.
Figure 1 shows that the initial descent of the curve is observed 2.5 minutes after the OGB fraction was immersed in the saline solution at +37º C, corresponding to a decrease in the initial volume of liquid and the release of gas bubbles.
The full release of gas bubbles occurs between 7.5 and 12.5 minutes. From 13 to 17 minutes, fine dust is released and fills the entire free volume of the solution as a suspension, which partially precipitates. This is followed by a plateau between 17.5 and 20 minutes; no gas bubbling occurs. We determined the initial liquid volume changes during degassing and dust extraction, the average values, and their 95% confidence intervals (
Table 3).
In the SPSS statistical package environment, the observed values were approximated by an S-shaped function called 4-parameter logistic regression. As a result, the following values of the regression coefficients and their standard errors were obtained: They reflect the parameters of the dependence of the percentage of degassing on time.
A 0.51 ± 0.04
B 10.10 ± 0.17
C 81.01 ± 0.35.
The equation for the dependence of the percentage of degassing on time t is as follows:
f (t) = 100+ (81.01 - 100) / (1 + exp (-0.51 (t - 10.10))),
The coefficient of determination of the constructed model is R
2 = 99%, which characterizes it as very accurate. According to the constructed mathematical model of the process of degassing and dust extraction, it was found that after 10 minutes, half of the gas available in the voids of the OGB fraction was released. After 20 minutes from the beginning, the curve reached a plateau. 20 minutes after the passive degassing stage was over, the volume of the extracted liquid is determined, which amounted to 1.62 ml (
Figure 2). The difference between the initial fluid volume and after passive degassing was 0.38 ml (2 ml - 1.62 ml = 0.38 ml). At the end of the active degassing and dust extraction stage, the residual volume was determined to amount to 1.44 ml. The difference between the volumes of the liquid before and after active degassing was 0.18 ml (1.62 ml - 1.44 ml = 0.18 ml). The results of the difference in fluid volumes after the two stages were summed up, and the sum was 0.56 ml (0.38 ml + 0.18 ml = 0.56 ml). Thus, after two stages of degassing and dust extraction, there was a decrease in liquid volume of 0.56 ml (2.0 ml - 1.44 ml = 0.56 ml) and an increase in its apparent adsorption capacity of 0.56 ml, or 28%. Consequently, the apparent adsorption capacity of Cerabone granulated osteoconductive material as a result of degassing was 0.56 ml and increased by 28% from the initial adsorption capacity.
Figure 2.
Change in the volume of liquids as a result of degassing and extraction of dust from the OGB fraction (Cerabone).
Figure 2.
Change in the volume of liquids as a result of degassing and extraction of dust from the OGB fraction (Cerabone).
Similarly, calculated AC
A for other OGB: Maxresorb, Bio-OSS, Xenograft Collagen, Osteon Ⅱ, MSP (
Table 4).
3.2. Scanning electron microscopy of granules of the OGB fraction
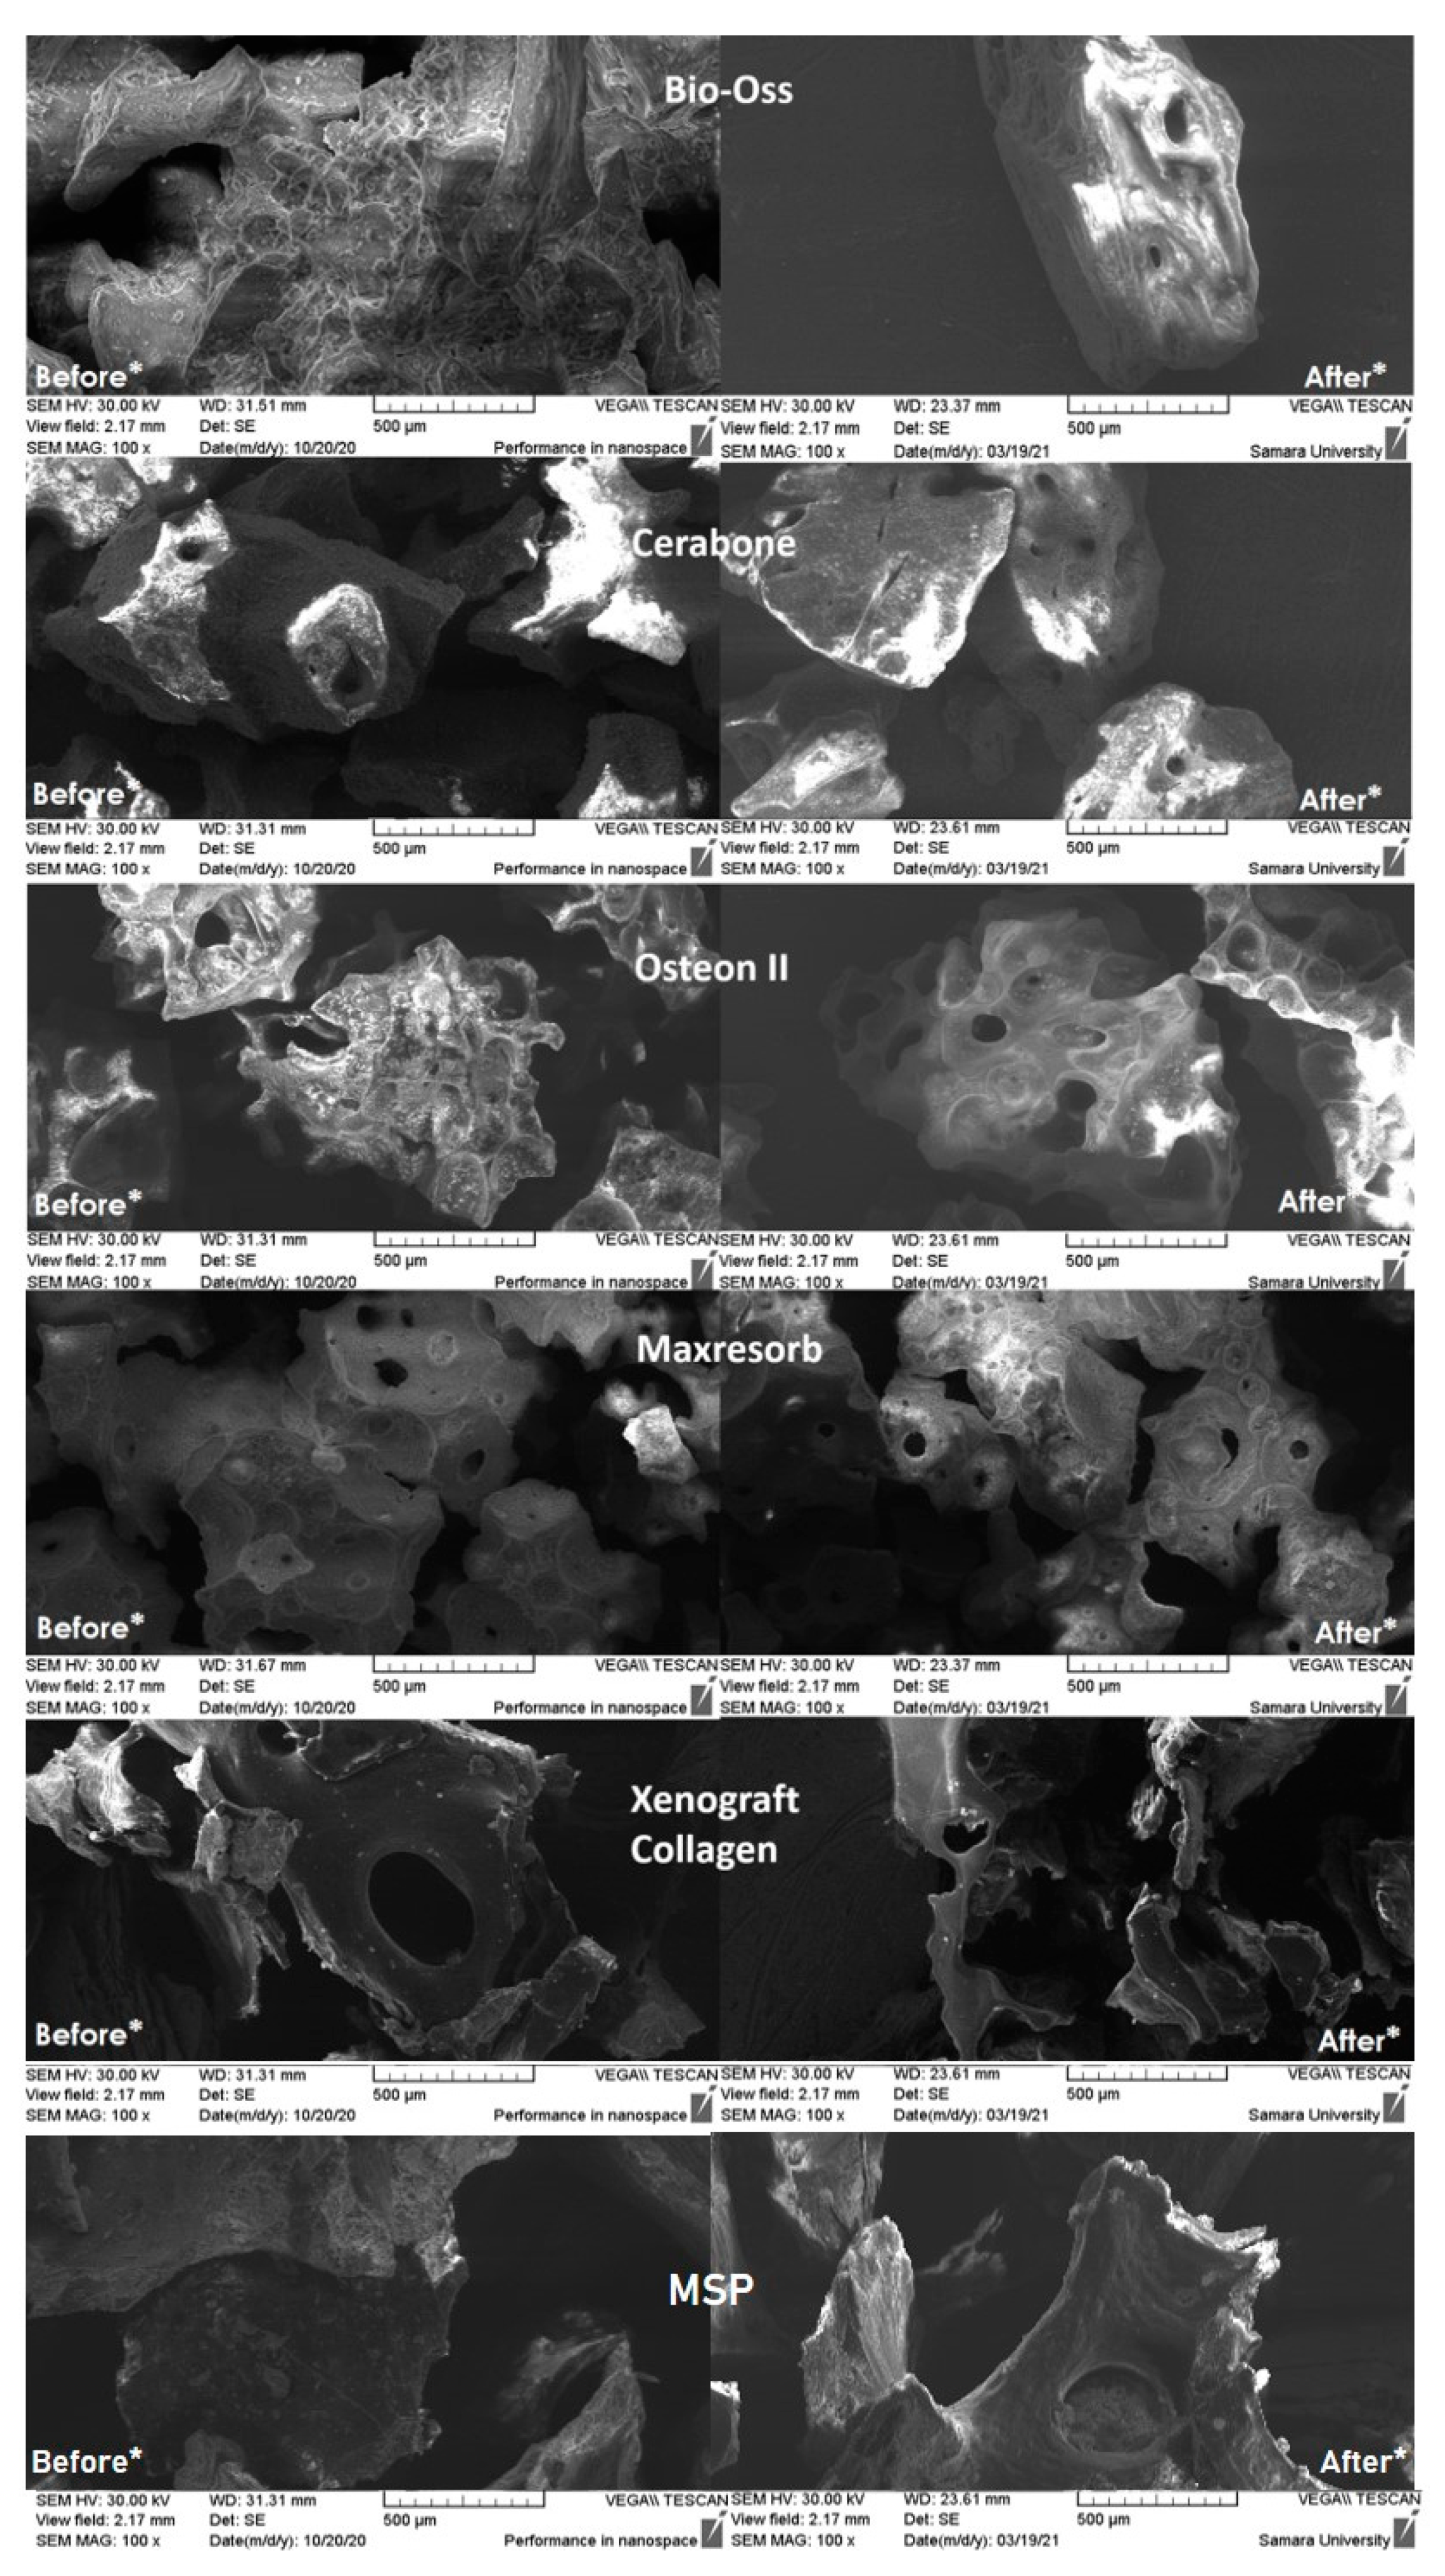
SEM displays the distributions of particle sizes. Porosity can be greatly impacted by particle sizes that are different from the manufacturers' specifications. Consequently, Cerabone and Xenograft Collagen had a high concentration of particles smaller than 0.25 mm in the samples. Maxresorb, Cerabone, Xenograft Collagen, Osteon II, and MSP all have a significant increase in surface area when compared to the other samples that were studied. Xenograft Collagen, MSP, and Osteon II have the most uneven surfaces, according to micrographs of the surface taken at 300 and 500 times magnification. The distribution of macropores in their particles, which range in size from 25 to 210 m, makes them porous structures. Additionally, particles with a size distribution of 50 to 190 m are present within Maxresorb and Cerabone. The most uniform surface of any particle in this sample is found on Bio-Oss particles, which also lack through pores and channels.
After carrying out the stages of preparation and studying the OGB fraction using two stages of degassing and extraction of dust from the OGB fraction on the SEM, we found that the content of coarse and fine dust decreased on the outer and inner surfaces of the channels and pores (
Figure 3). The area of the free surfaces of pores and the mouths of through pores increased. Thus, the OGB preparation increased the adsorption capacity of the Xenograft Collagen OGB fraction at 50%; Osteon II at 40%; Maxresorb at 37%; MSP at 34%; Cerabone at 28%; and Bio-OSS by 17%.
Before * - Photographs of the surface of the investigated biopolymers before preliminary preparation are taken; coarse and fine dust are visualized on the outer and inner surfaces of the OGB;
After * - Photographs of the surface of the investigated biopolymers after preliminary preparation using two stages of degassing and dust extraction from the OGB fraction. First, the outer surfaces of the OGB are free from coarse dust and air bubbles. Second, the inner surfaces of the OGB channels, pores, and voids were freed from fine dust and residual gases.
3.3. Determination of the micropore volume of the OGB fraction by gas adsorption
The values of the specific surface area of each of the samples in granular form were obtained by gas adsorption. These studies allow us to estimate the volume of micropores in the samples under study. The highest value is observed for the “Bio-Oss” sample (88,226 cm3/g), followed by the value obtained for the “Xenograft Collagen” (10,945 cm3/g). For the remaining three studied samples, the pore volume was much smaller and was "MSP" (0,715 cm3/g), “Cerabone” (0,525 cm3/g), “Maxresorb” (0,128 cm3/g), and “Osteon II” (0,124 cm3/g).
3.4. Determination of the true adsorption capacity (ACT) indicator of the OGB fraction
To determine the AC
T of the OGB fraction, we considered the indicators of AC
A, W
mA, and W
mB (Item 2.4), the volume of micropores, the presence of macropores, and through pores in the granules (
Table 4). We determined that the nature of the distribution of macropores and micropores in OGB granules determines the method of calculating AC
T.
For OGB Maxresorb, Cerabone, Osteon Ⅱ, and MSP, AC
T corresponds to AC
A (
Table 4), since the micropore volume is <1 cm
3/g and the presence of macropores, through pores and channels in the granules, is determined;
For OGB Xenograft Collagen, АCT = АCA • ((WmА- WmB) + WmB • 0,85) / WmА, since the volume of micropores is in the range of 1 cm3/g to 10 cm3/g, and the presence of macropores, through pores and channels is determined in granules. 0.85 correction factor that takes into account only macropores in WmB;
For OGB Bio-OSS, АCT = АCA • (WmА- WmB) / WmА, since the volume of micropores is >10 cm3/g and single macropores are determined in the field of view.
Using ACA, micropore volume, WmA, and WmB, we can produce OGB with a given true adsorption capacity of the OGB fraction, according to clinical requirements. The larger the volume of micropores in OGB, the lower the ACT index and the lower the adsorption properties of OGB. The adsorption properties of the OGB fraction largely depend on the number of macropores in 1 cm3 of the OGB fraction.
Empirically, we discovered that the number of bone growth factors (BGF) that OGB can adsorb and place on its surfaces can be estimated using the ACT value. To put them on 1 ml of the OGB Cerabone after preparing its external surfaces and free spaces in our manner, it is sufficient to prepare 0.56 ml of BGF. The data show that the ACT indicator of the OGB fraction corresponds to the required volume of BGF that the OGB fraction can adsorb. The OGB fraction's ability to deposit the greatest amount of BGF on the free surfaces of the granules, in the intergranular spaces, and in the interior spaces of the pores is indicated by its ACT. Due to air and fine dust on the surface, in the pores, and within the channels of the OGB granules, the ACT of the OGB fraction has limitations. BGF migration and invasion of vessels and fibrous structures from the recipient site and soft tissue environment are prevented by hydrodynamic and mechanical shutters.
3.5. Analysis of the OGB fraction for cytotoxicity after preparation for use
A study of the viability of human mesenchymal stromal cells (MSC) in culture showed that the number of removed cells did not have significant differences in groups 1 and 2. Groups 1 and 2 are comparable to each other and group 3 (
Table 5).
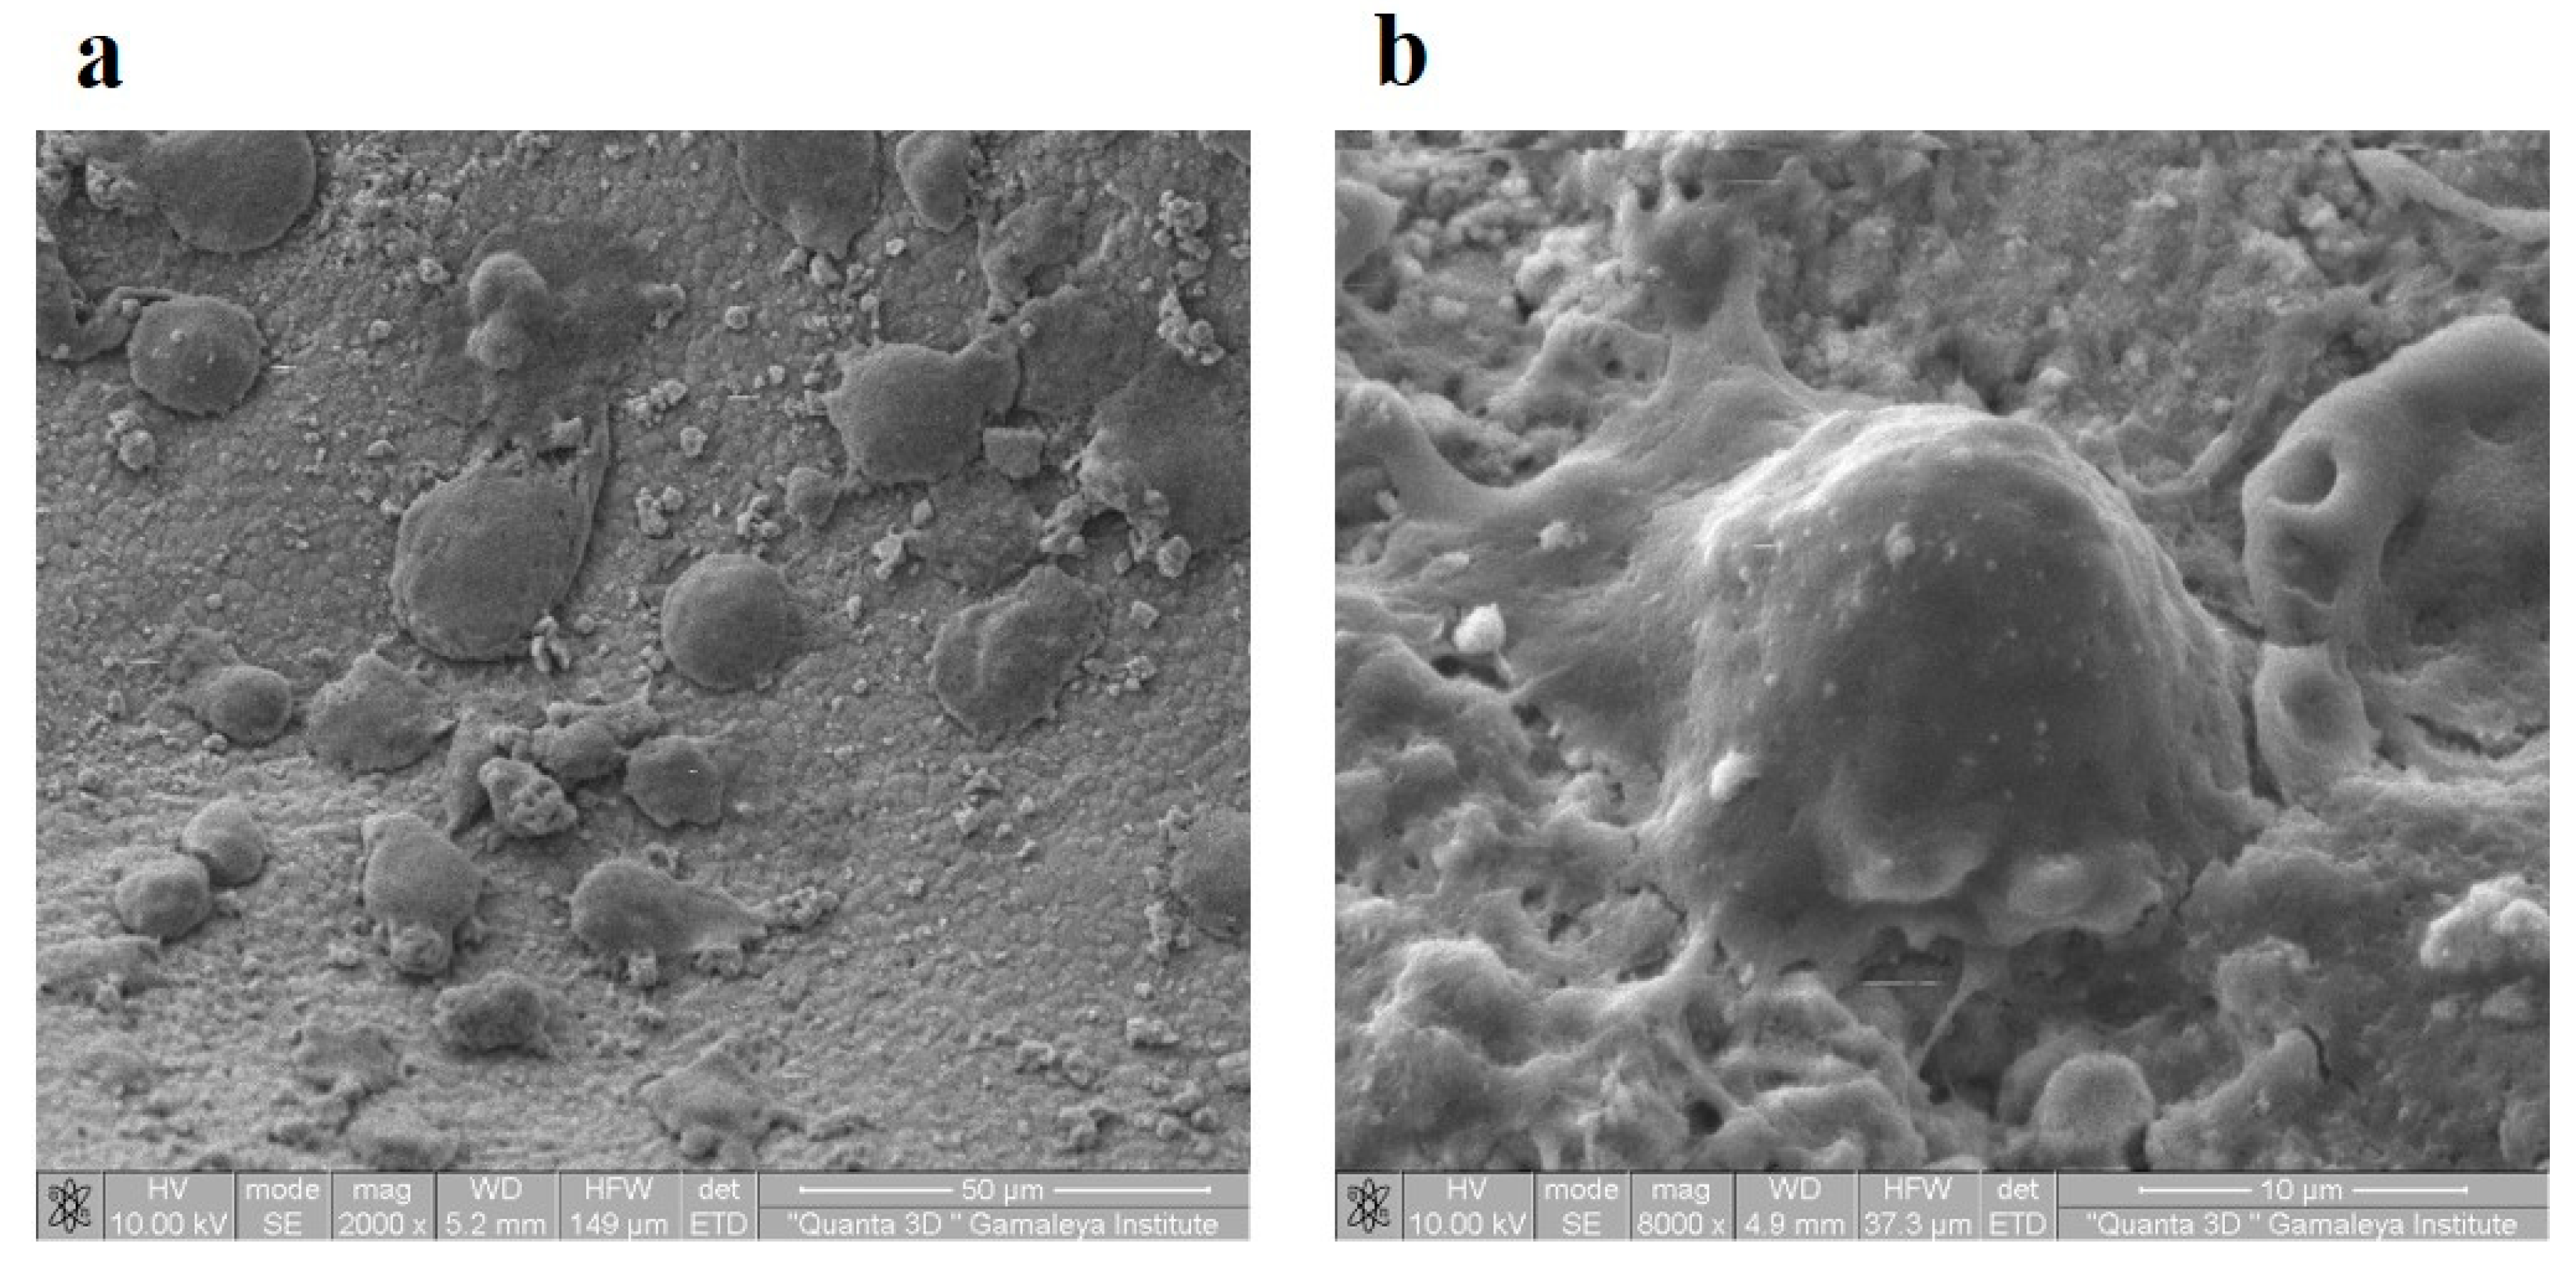
Throughout the cultivation, MSC had a typical spindle-shaped morphology, the edges of the cytoplasm were smooth, and no signs of apoptosis were noted. Microscopic examination in groups 1 and 2 showed marginal attachment of MSC to the surfaces of OGB granules (
Figure 4).
Thus, after preparation for the use of the OGB fraction by our method, we did not reveal any cytotoxic effect on human MSC grown in tissue culture in vitro and placed on the OGB fraction (
Figure 5).
3.6. Fourier transform infrared spectroscopy
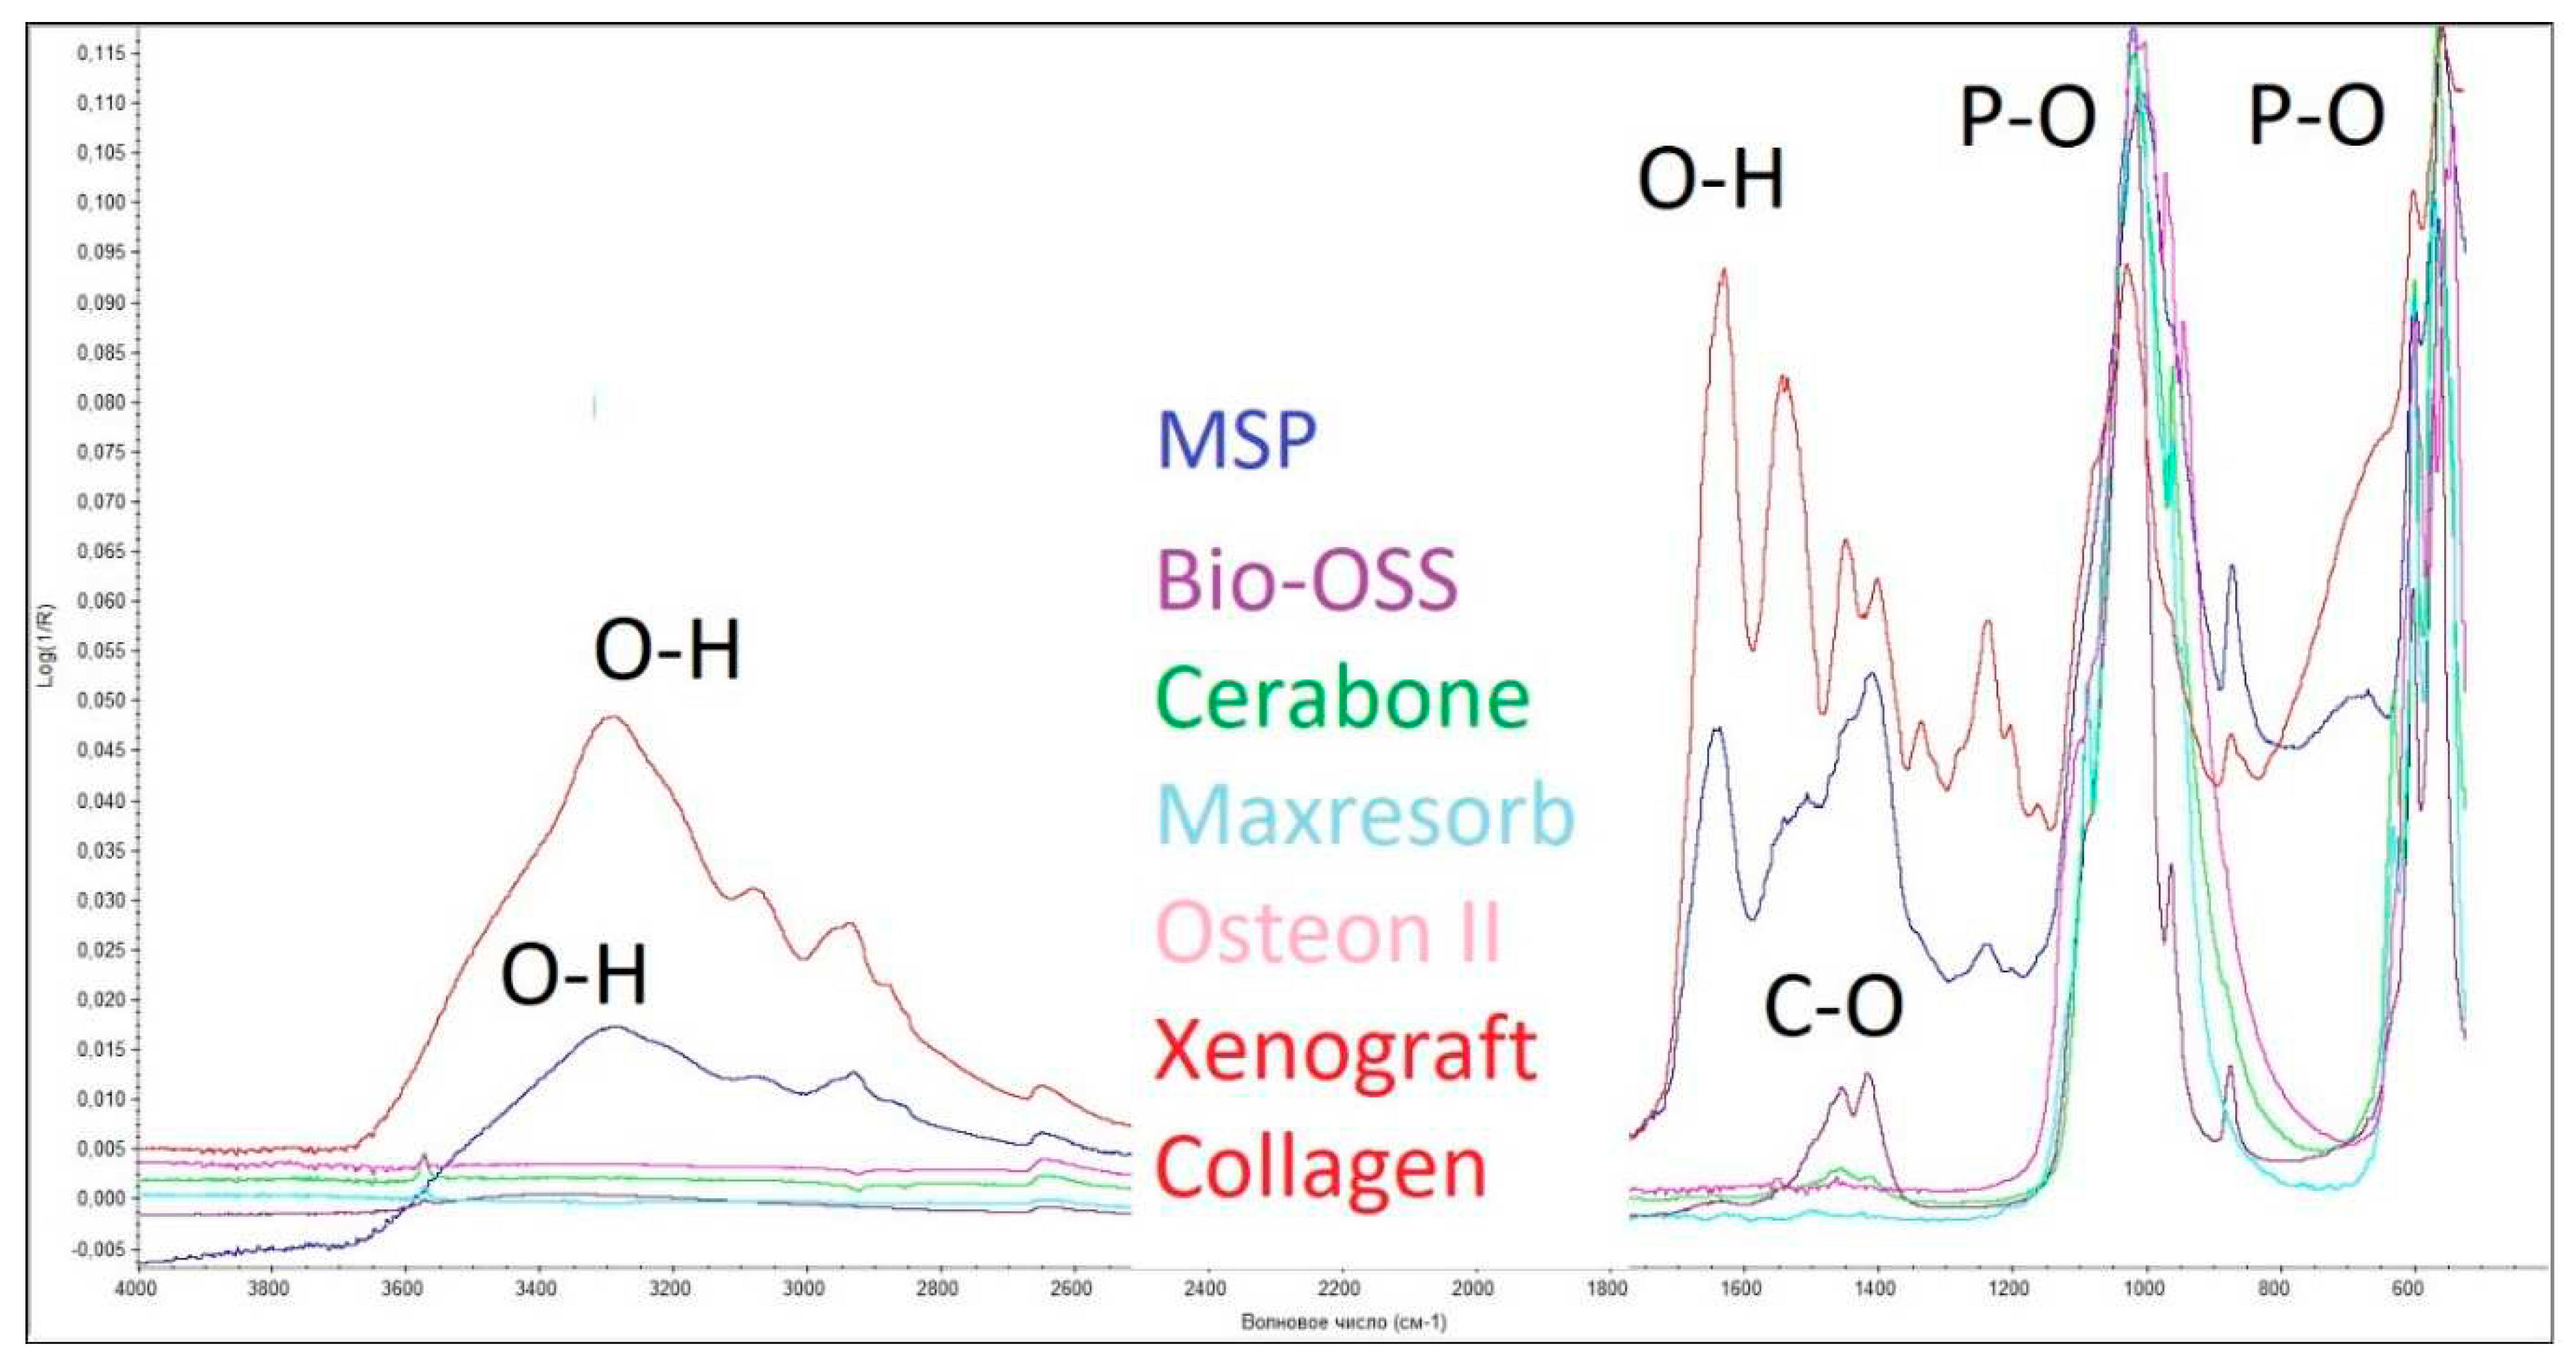
As can be seen from
Figure 6, characteristic peaks for the P-O (570-605 cm
-1), O-H (3500 cm
-1 and 1650 cm
-1) bonds were observed in all spectra of the studied samples. An additional O-H peak (3575 cm
-1) is seen in the spectra of the "Bio-Oss," "Maxresorb," and "Cerabone" samples, which are responsible for the presence of hydroxyapatite in the studied samples. Also, in the samples "Maxresorb" and "Cerabone," peaks are visible responsible for the presence of C-O bonds (1460 cm
-1 and 1420 cm
-1, and 880 cm
-1). In addition to the groups described, the spectrum of the "Xenograft Collagen" and "MSP" samples also contain peaks responsible for the presence of C-H (1550 cm
-1) and N-H (1245 cm
-1) bonds, which indicate the presence of collagen in this sample. All the samples studied contain calcium phosphate. The samples "Bio-Oss," "Maxresorb," and "Cerabone" contain calcium carbonate; and the samples "Xenograft Collagen" and "MSP" contain collagen.
Consequently, the study showed that the surfaces of the three OGBs studied, "Bio-Oss," "Maxresorb," and "Cerabone" has a similar chemical composition. The surface of the "Xenograft Collagen" and "MSP" samples are covered with collagen. The "Osteon II" sample lacks characteristic peaks responsible for hydroxyapatite, calcium carbonate, and collagen in the studied OGB.
3.7. Determination of the compaction coefficient of the OGB fraction – CC
An investigation into how the stability of the bioengineered structure is affected by the dynamics of changes in the physical properties of the OGB fraction was carried out. In order to accomplish this, we computed prognostic indicators that characterize the differences in the OGB fraction's physical properties during the postoperative period. These indicators show the cumulative dynamics of the OGB fraction's behavior in the scaffold after it has been placed in the recipient site. The compaction coefficients for the OGB that was studied are presented in
Table 6.
We found that preparing the OGB fraction for use by our method allowed us to increase the surface area and the volume of free spaces in the OGB fraction that were available for the adsorption of bone growth factors. When eliminating a bone defect in the jaws using the GBR method, the required volume of the OGB fraction must be determined considering the coefficient of natural compaction of the OGB fraction in the scaffold. The compaction coefficient of the OGB fraction is a prognostic indicator that collectively reflects the dynamics of changes in the physical properties of the graft in the postoperative period. Using the OGB compaction coefficient when planning the elimination of JBD allows 3D modeling of the scaffold relief, considering the biotransformation of the OGB, maintains the planned volume of the scaffold, and reduces the risk of uncontrolled changes in the volume of the bioengineered structure at the recipient site.
3.8. Clinical example
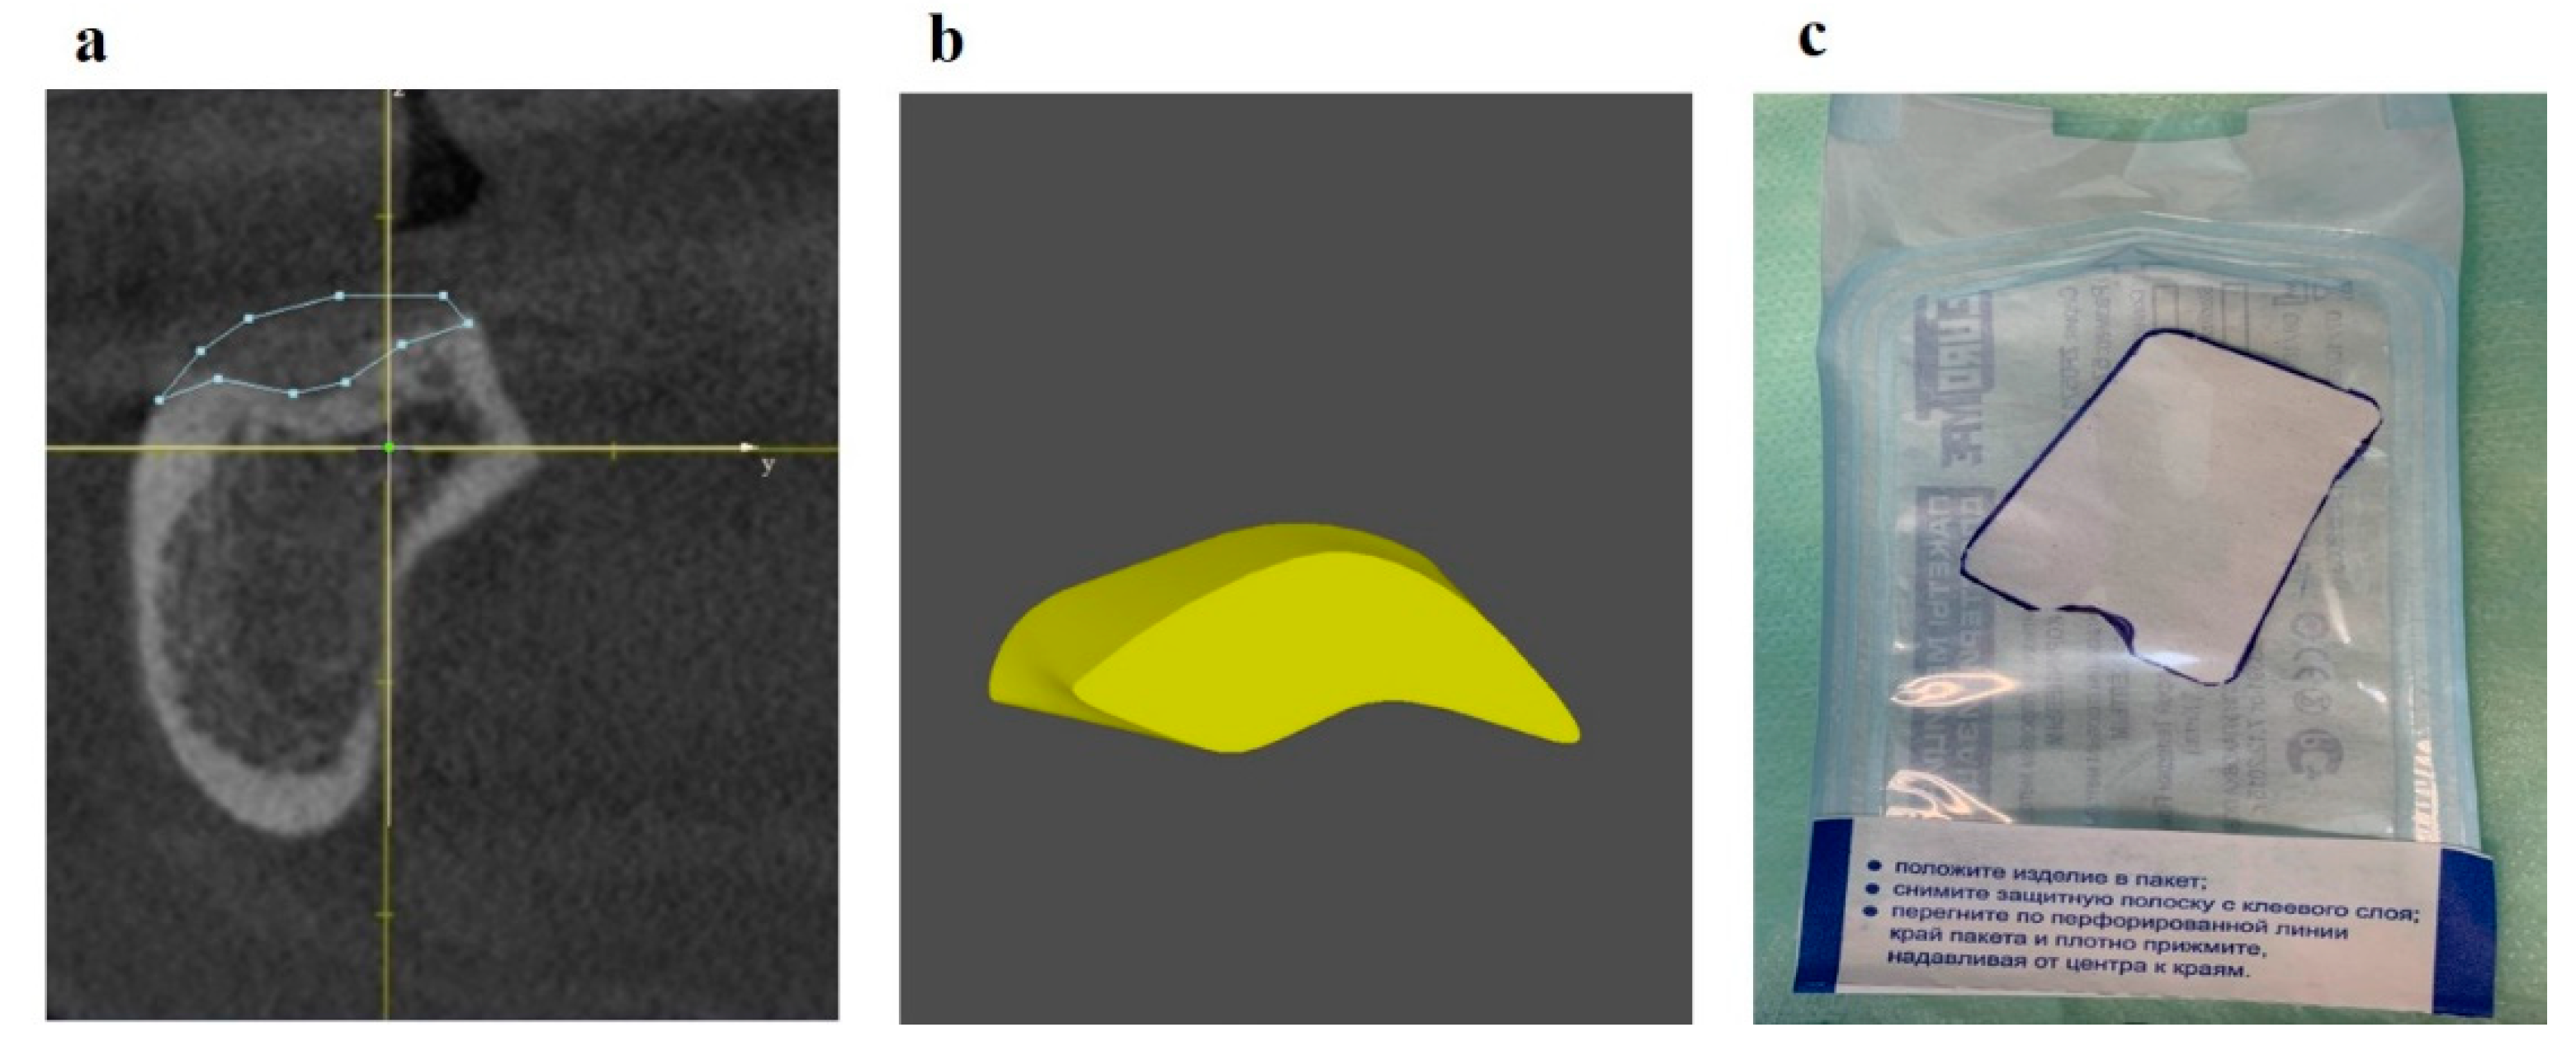
Patients with JBD were treated in three stages: diagnostics and planning for JBD elimination, surgery, and rehabilitation. At the stage of diagnostics and planning, the topography, structure, and volume of JBD were determined, 3D planning of JBD elimination by the GBR method was carried out in the program for 3D modeling of the scaffold [
33], and the required graft volume was calculated, and the membrane template was cut (
Figure 7).
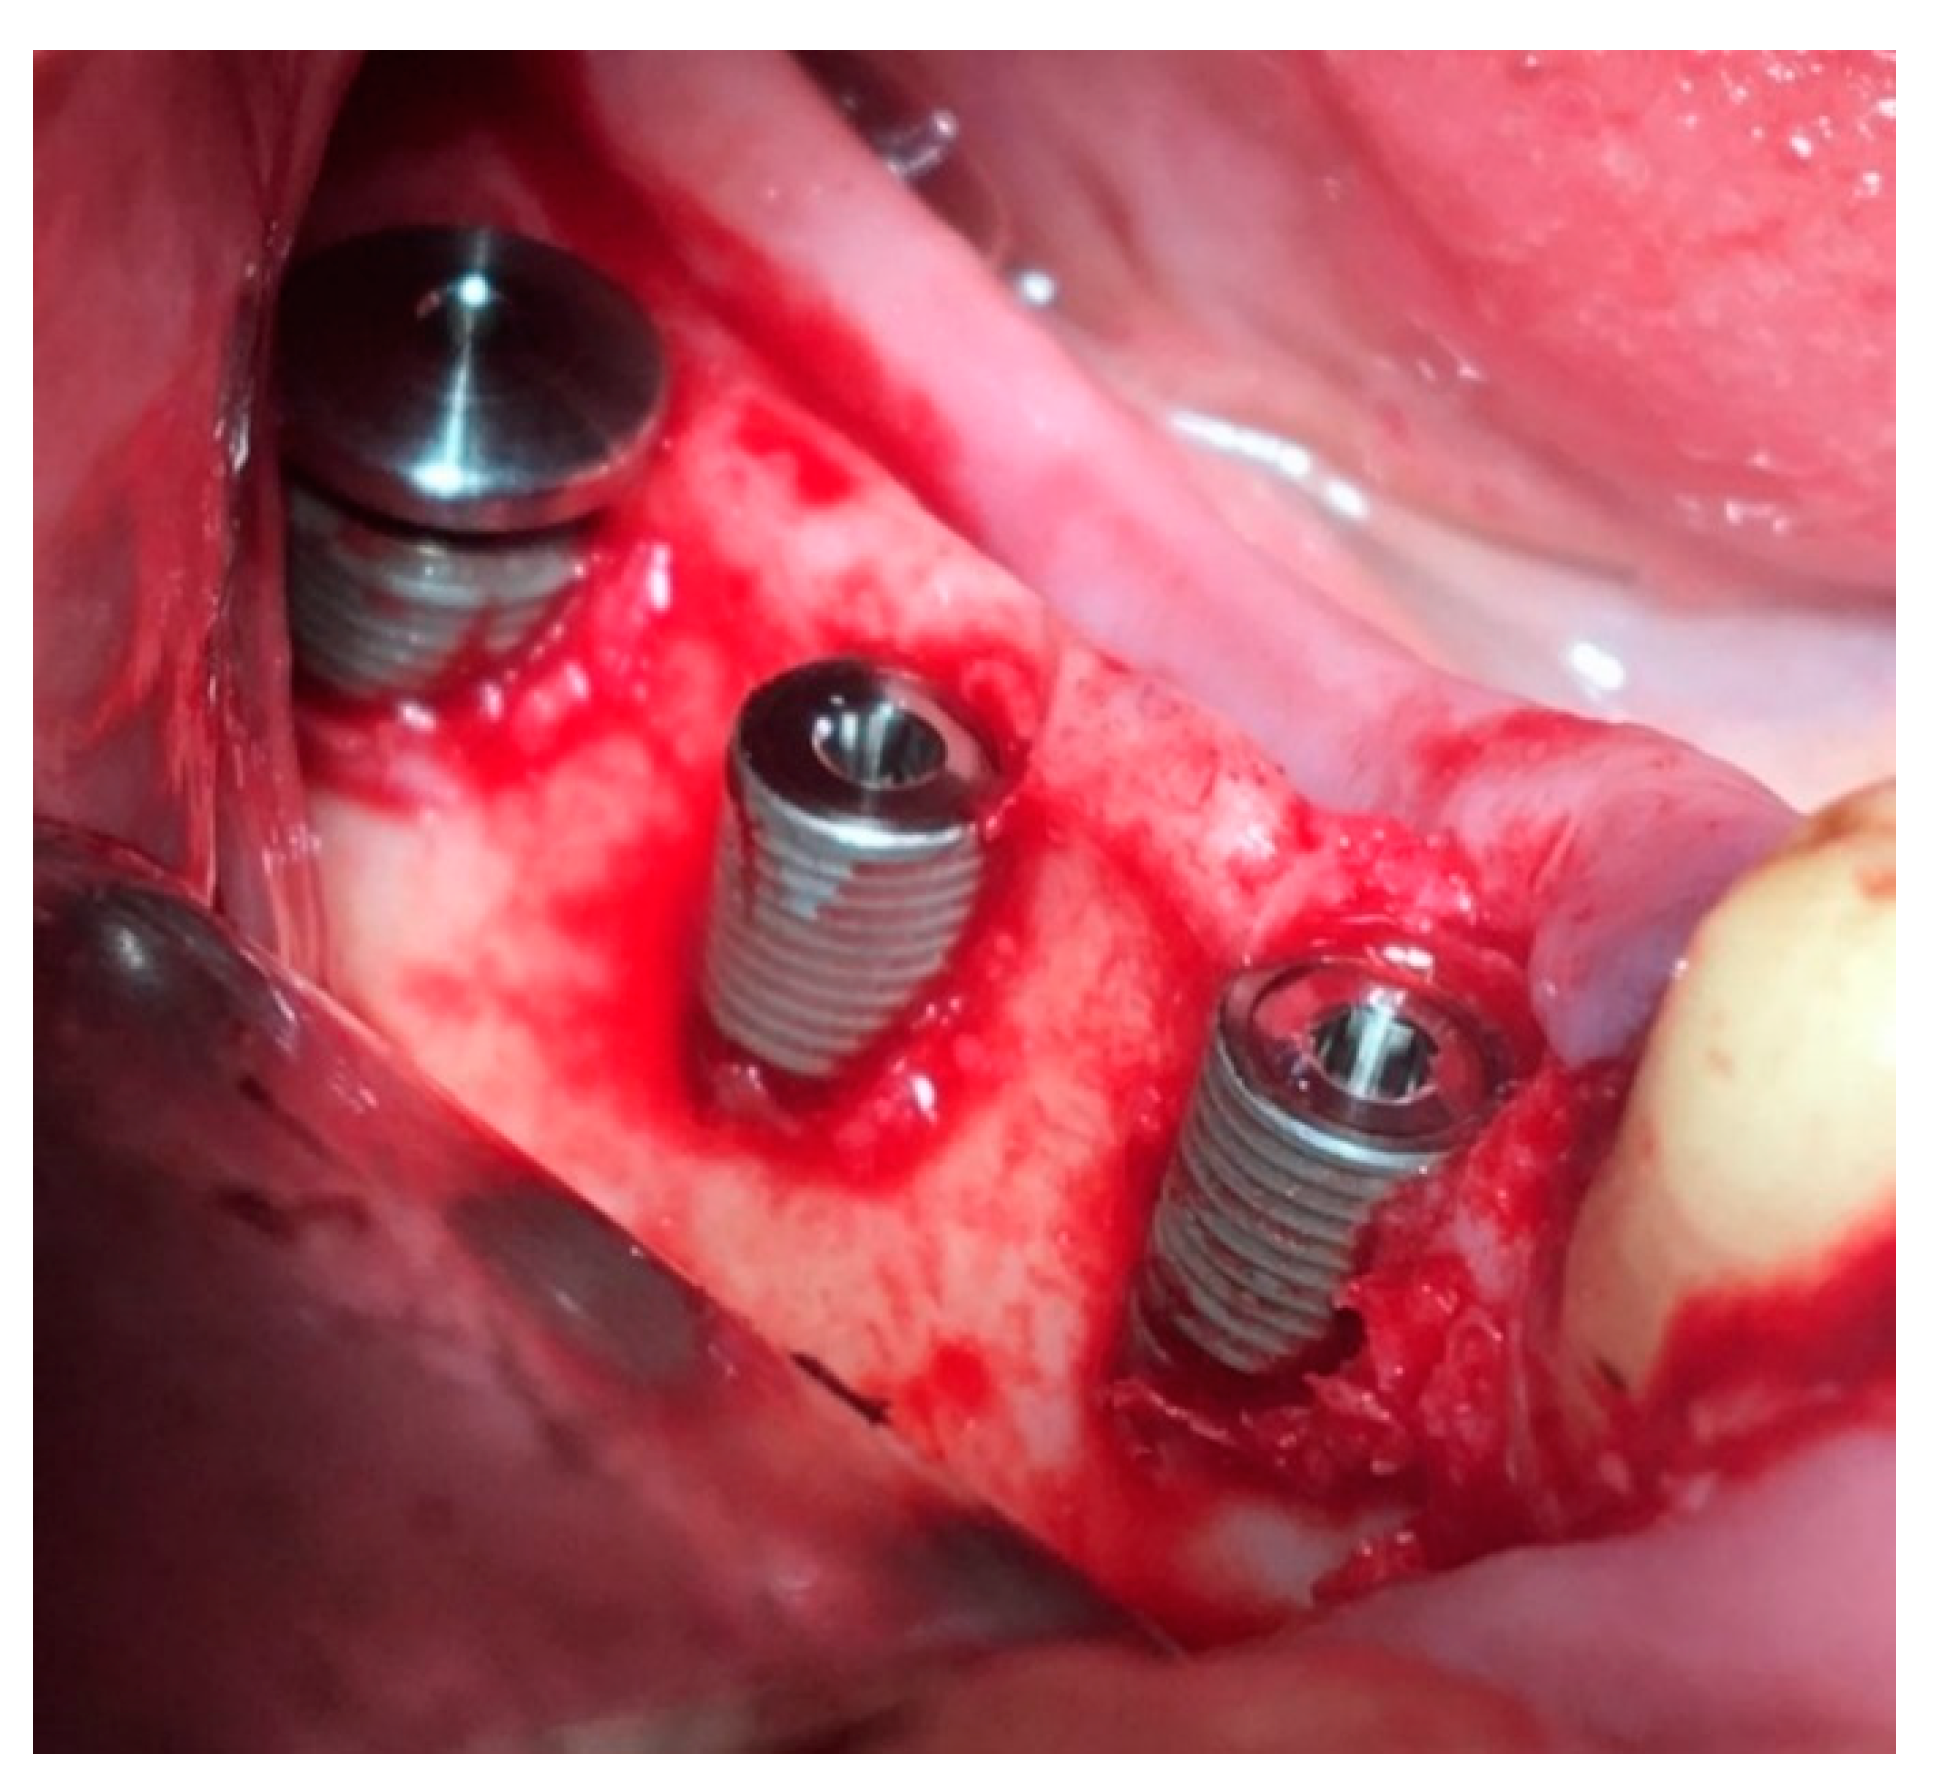
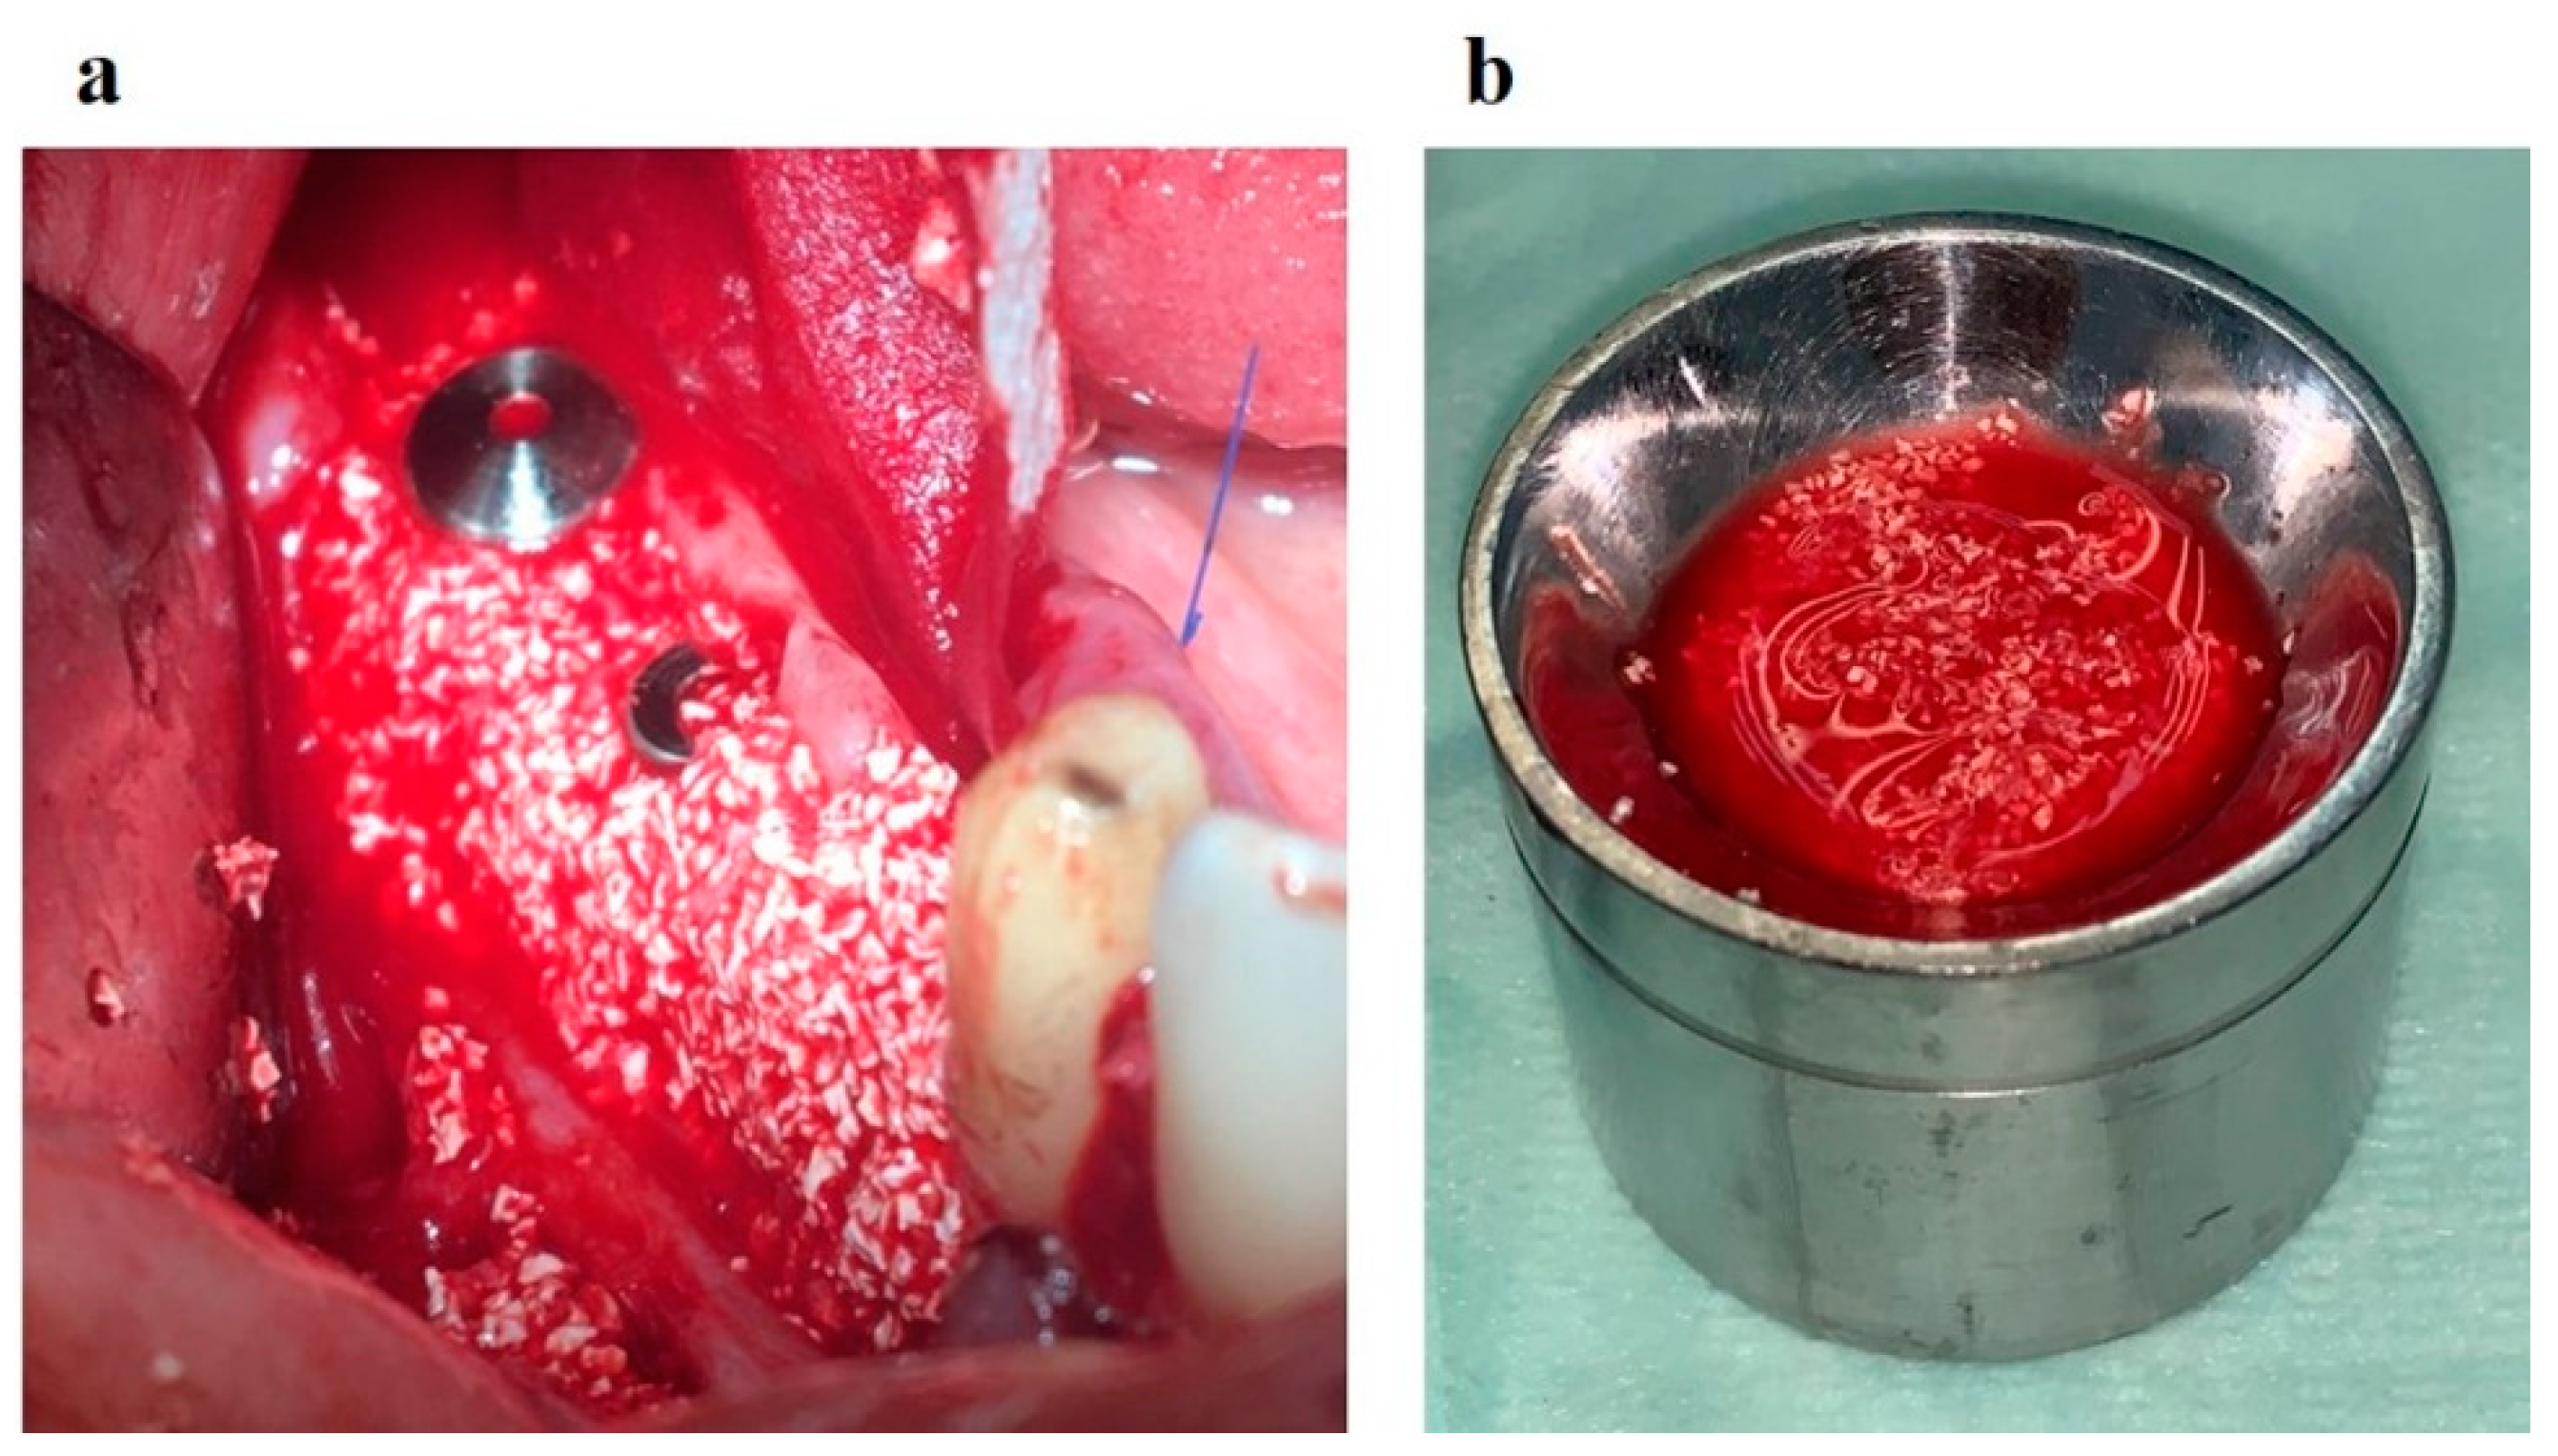
Surgical stage: dental implantation (
Figure 8); horizontal and vertical JBD augmentation within the planned boundaries of the relief (
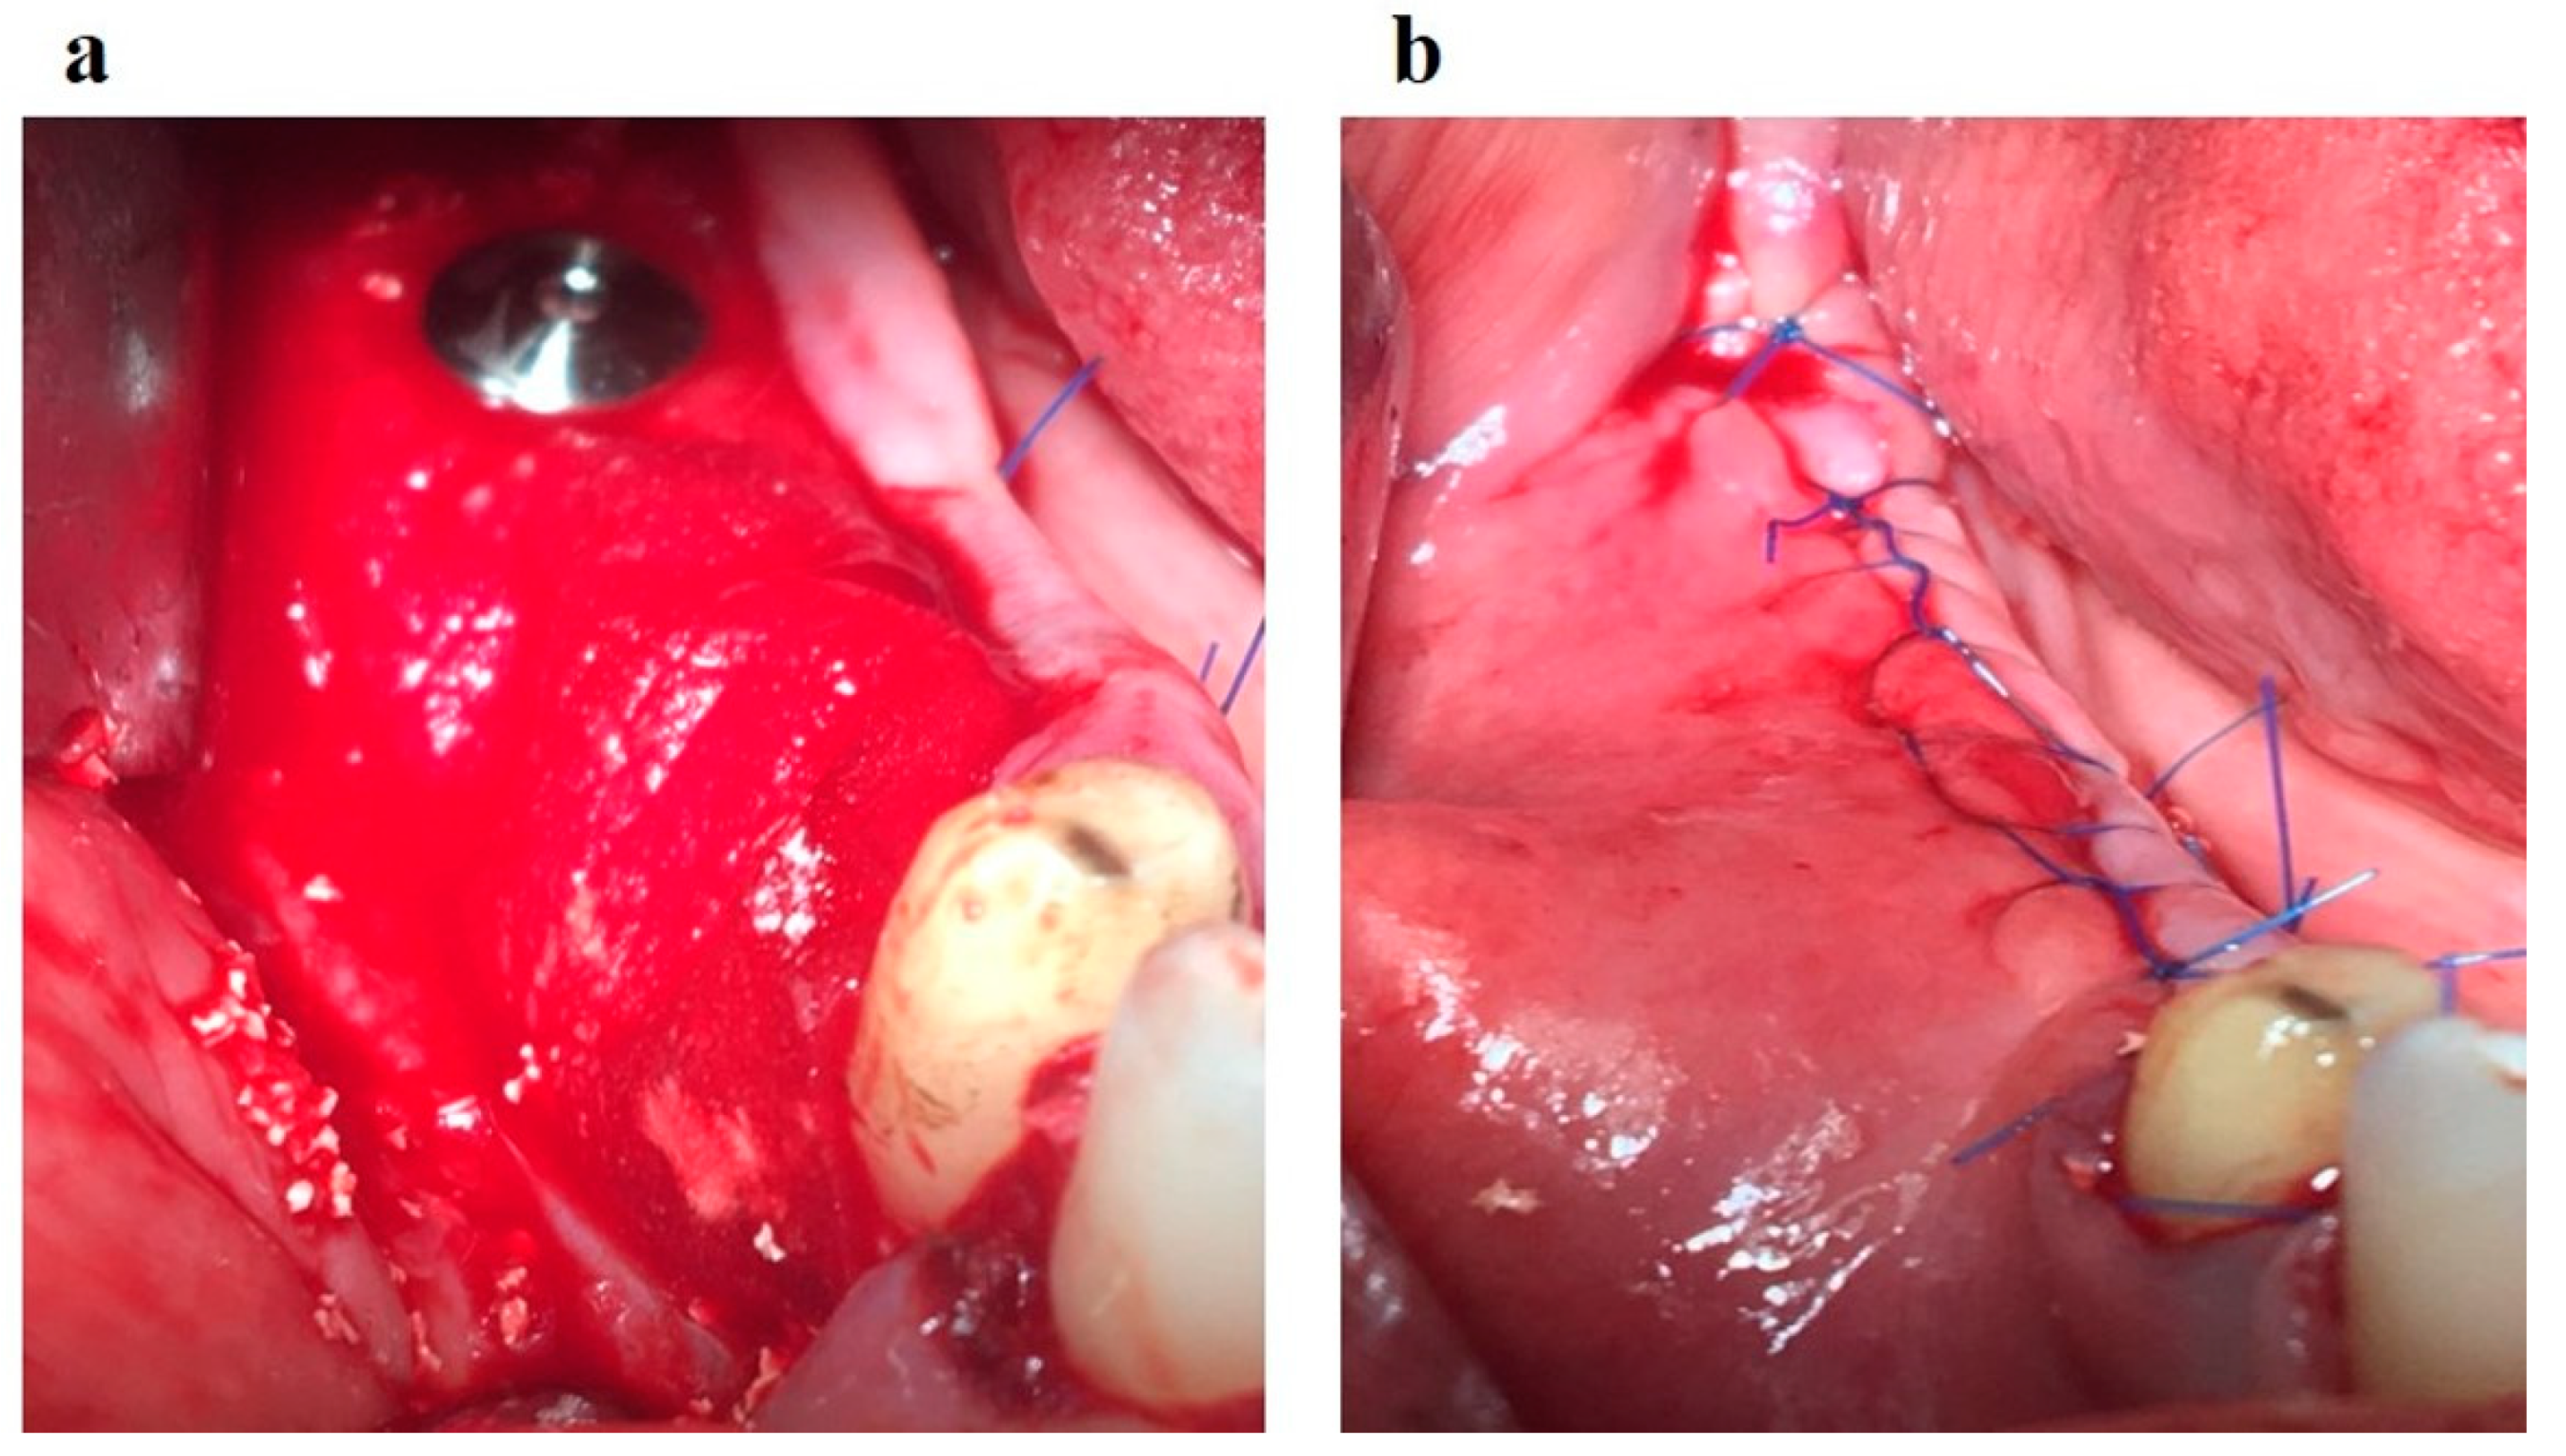
Figure 9); the augmentate is covered with a membrane (
Figure 10a); the wound is sutured in layers (
Figure 10b).
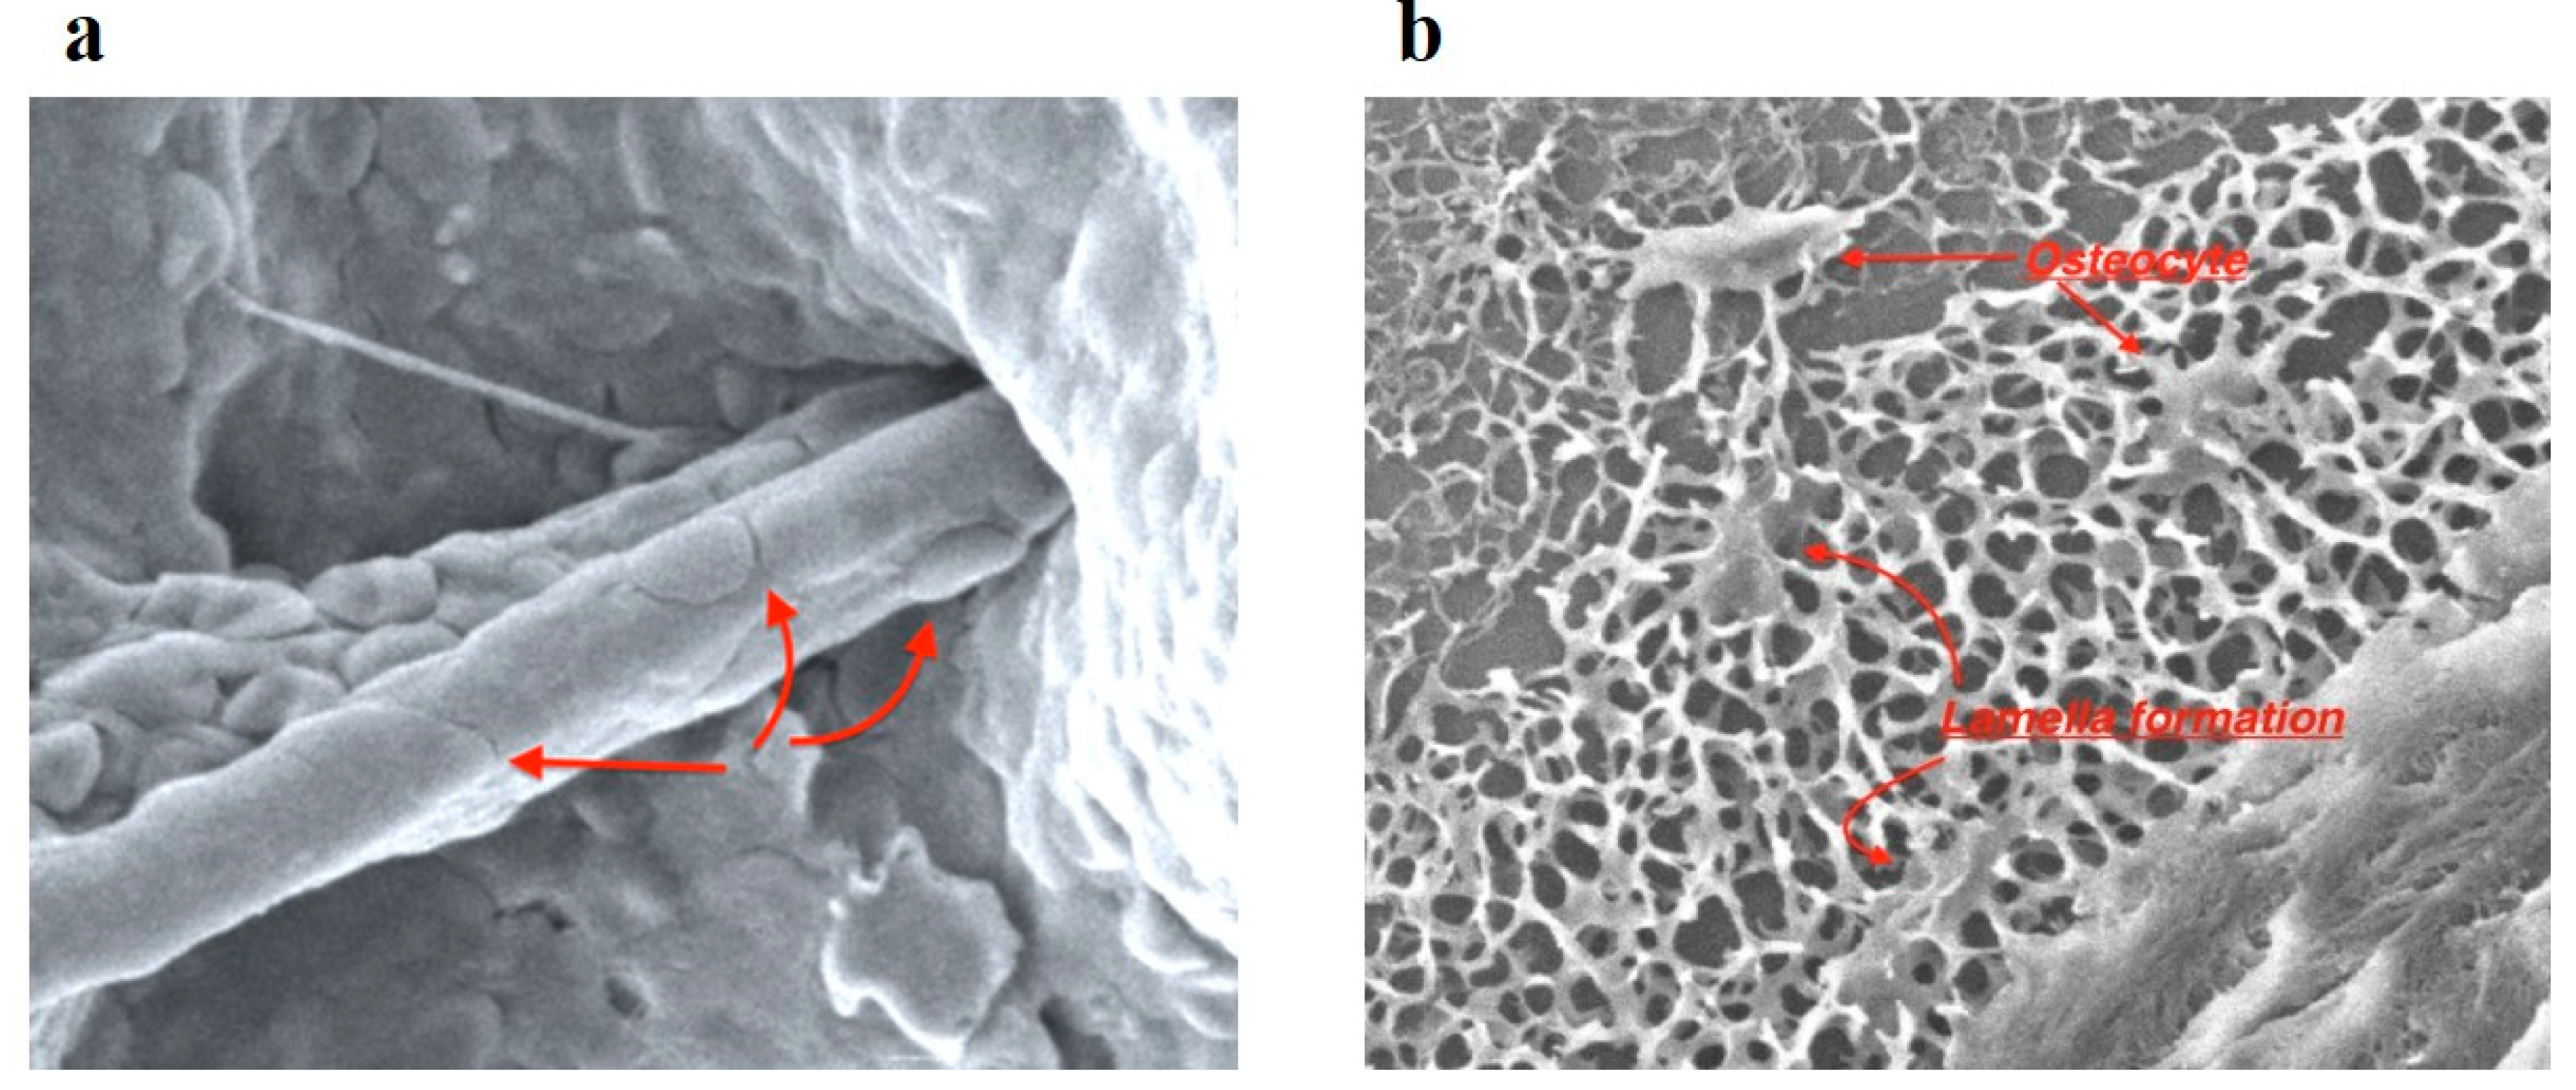
Four months after dental implantation, the implants' plugs were opened. When the plugs were opened, the excess OGB located above the plugs was removed. SEM examined the extracted OGB. Good osteoconductive and angiogenic properties of the optimized OGB fraction were revealed (
Figure 11).
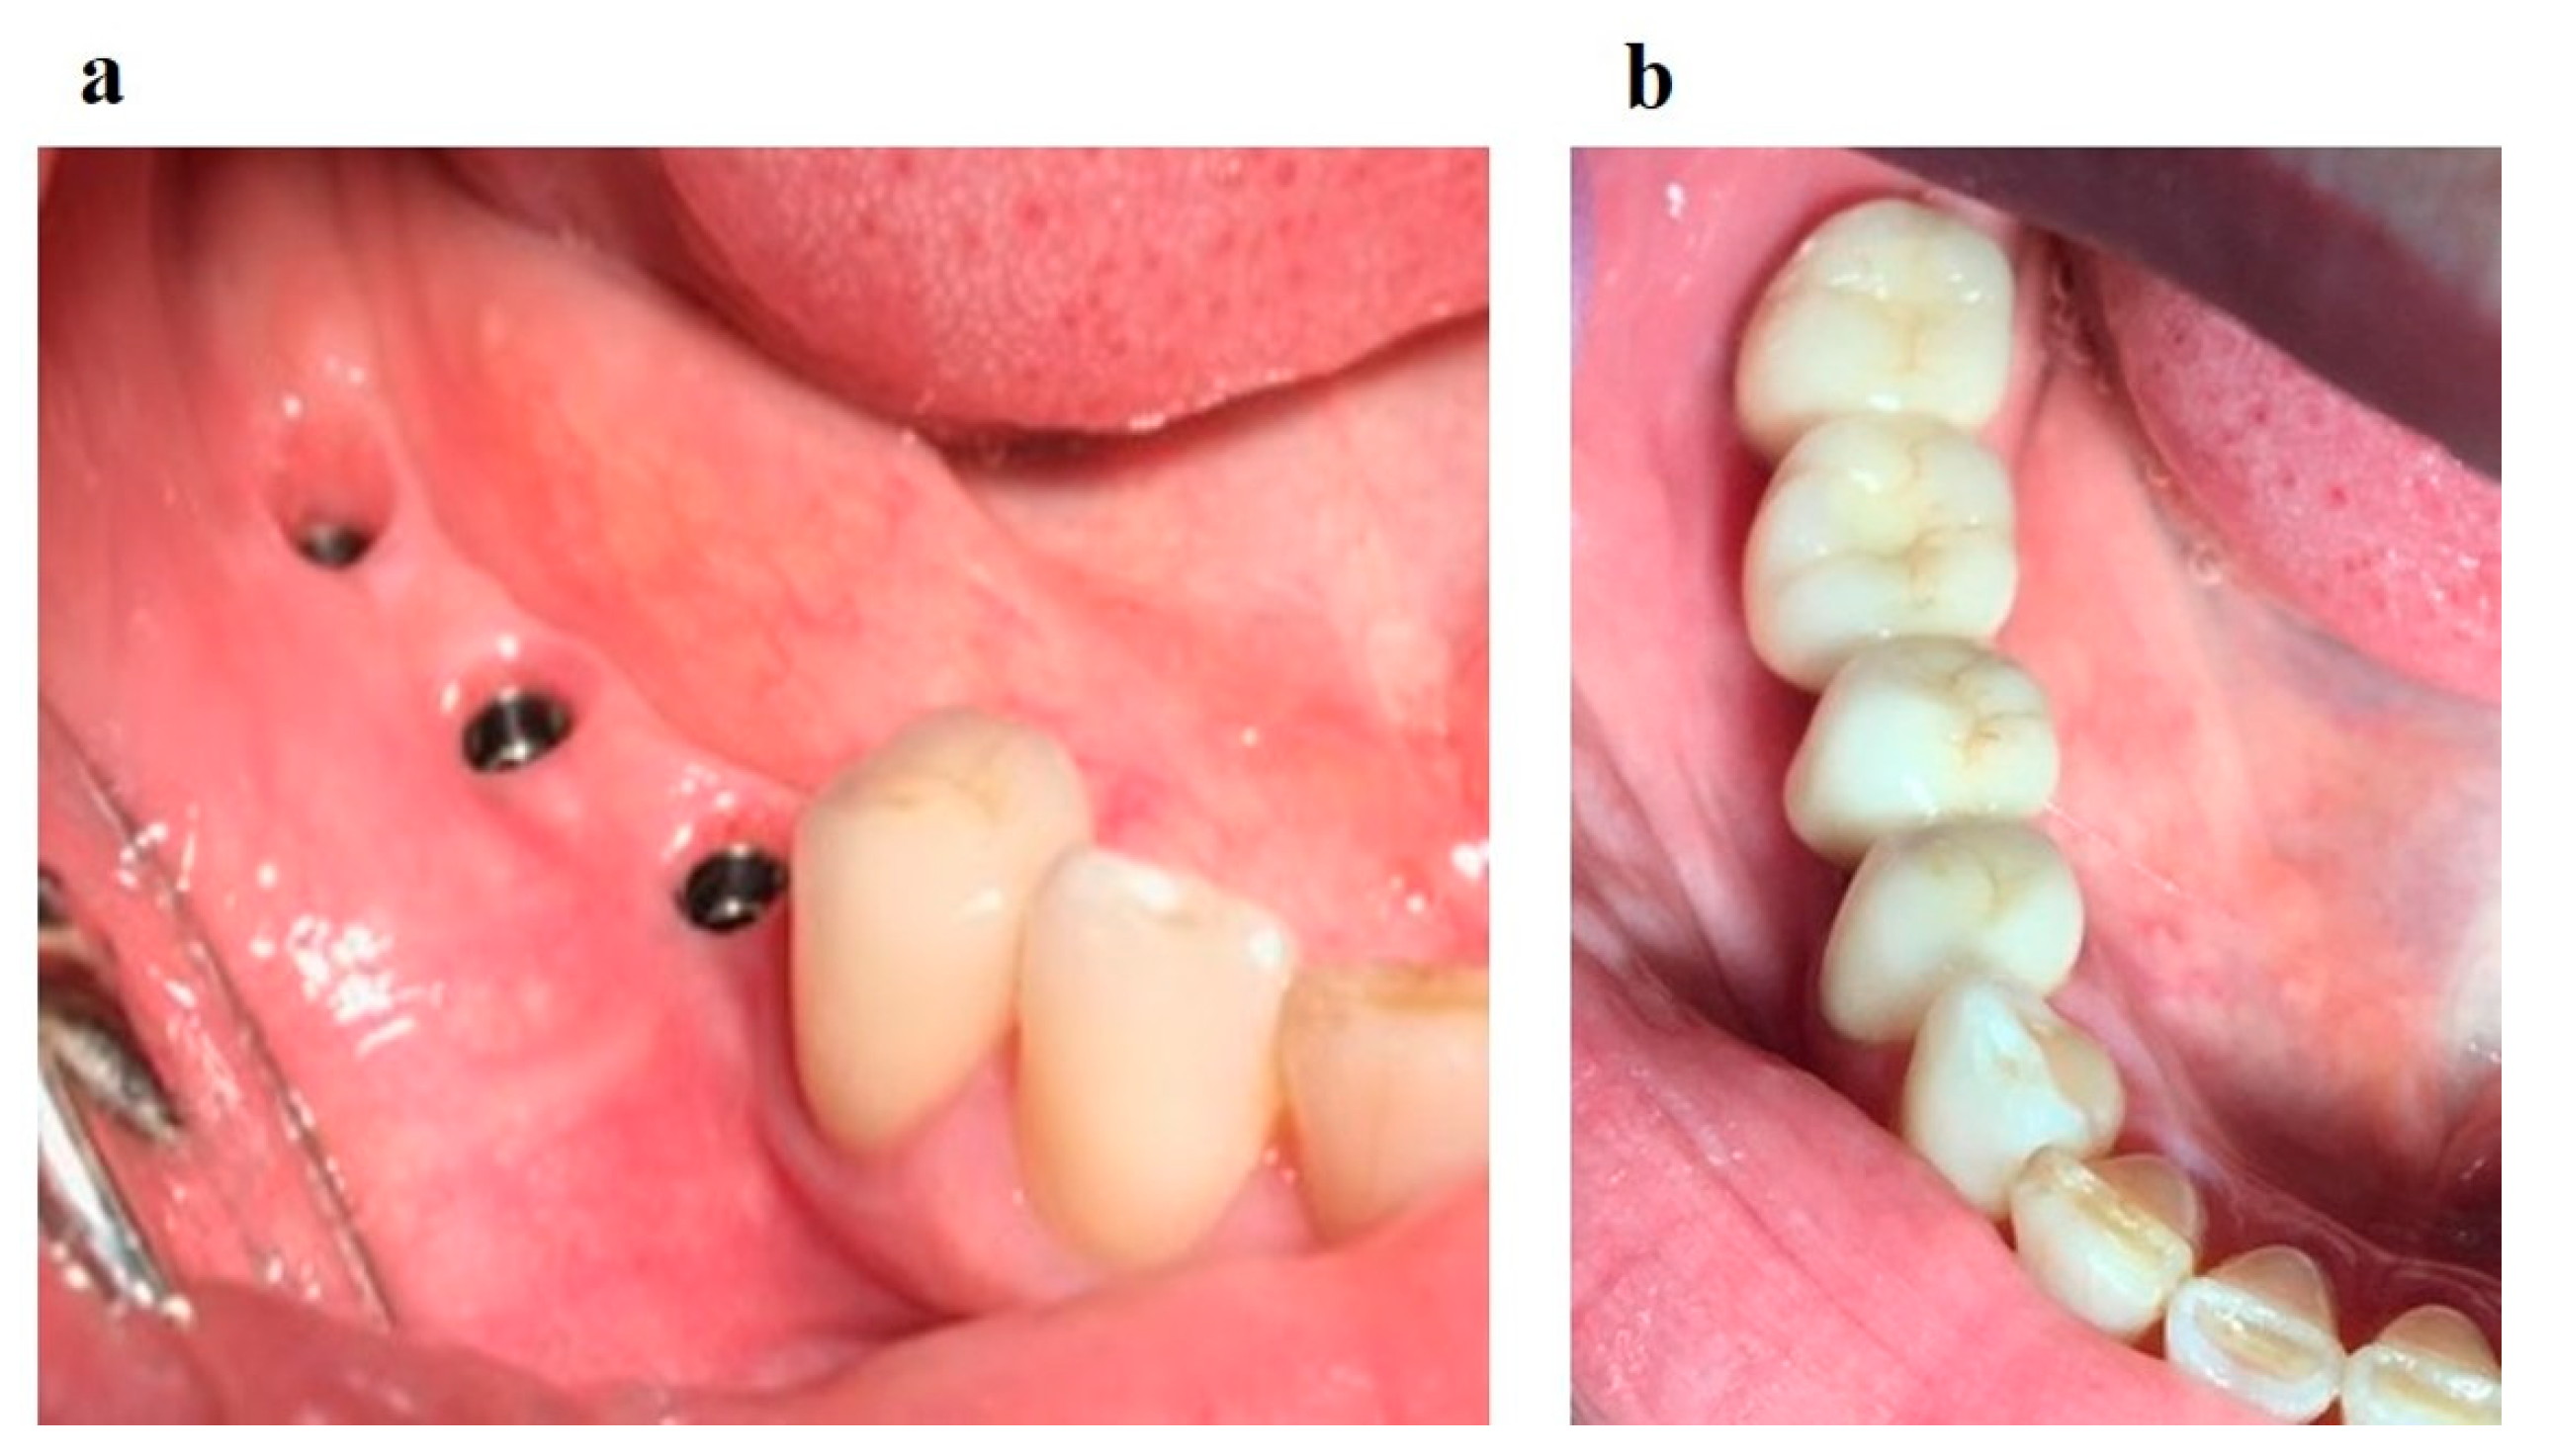
Rehabilitation stage: production of implant-supported dentures. A sufficient volume of keratinized mucosa surrounding the implants is formed (
Figure 12а). The reconstruction of the dentition supported by implants was performed (
Figure 12b).
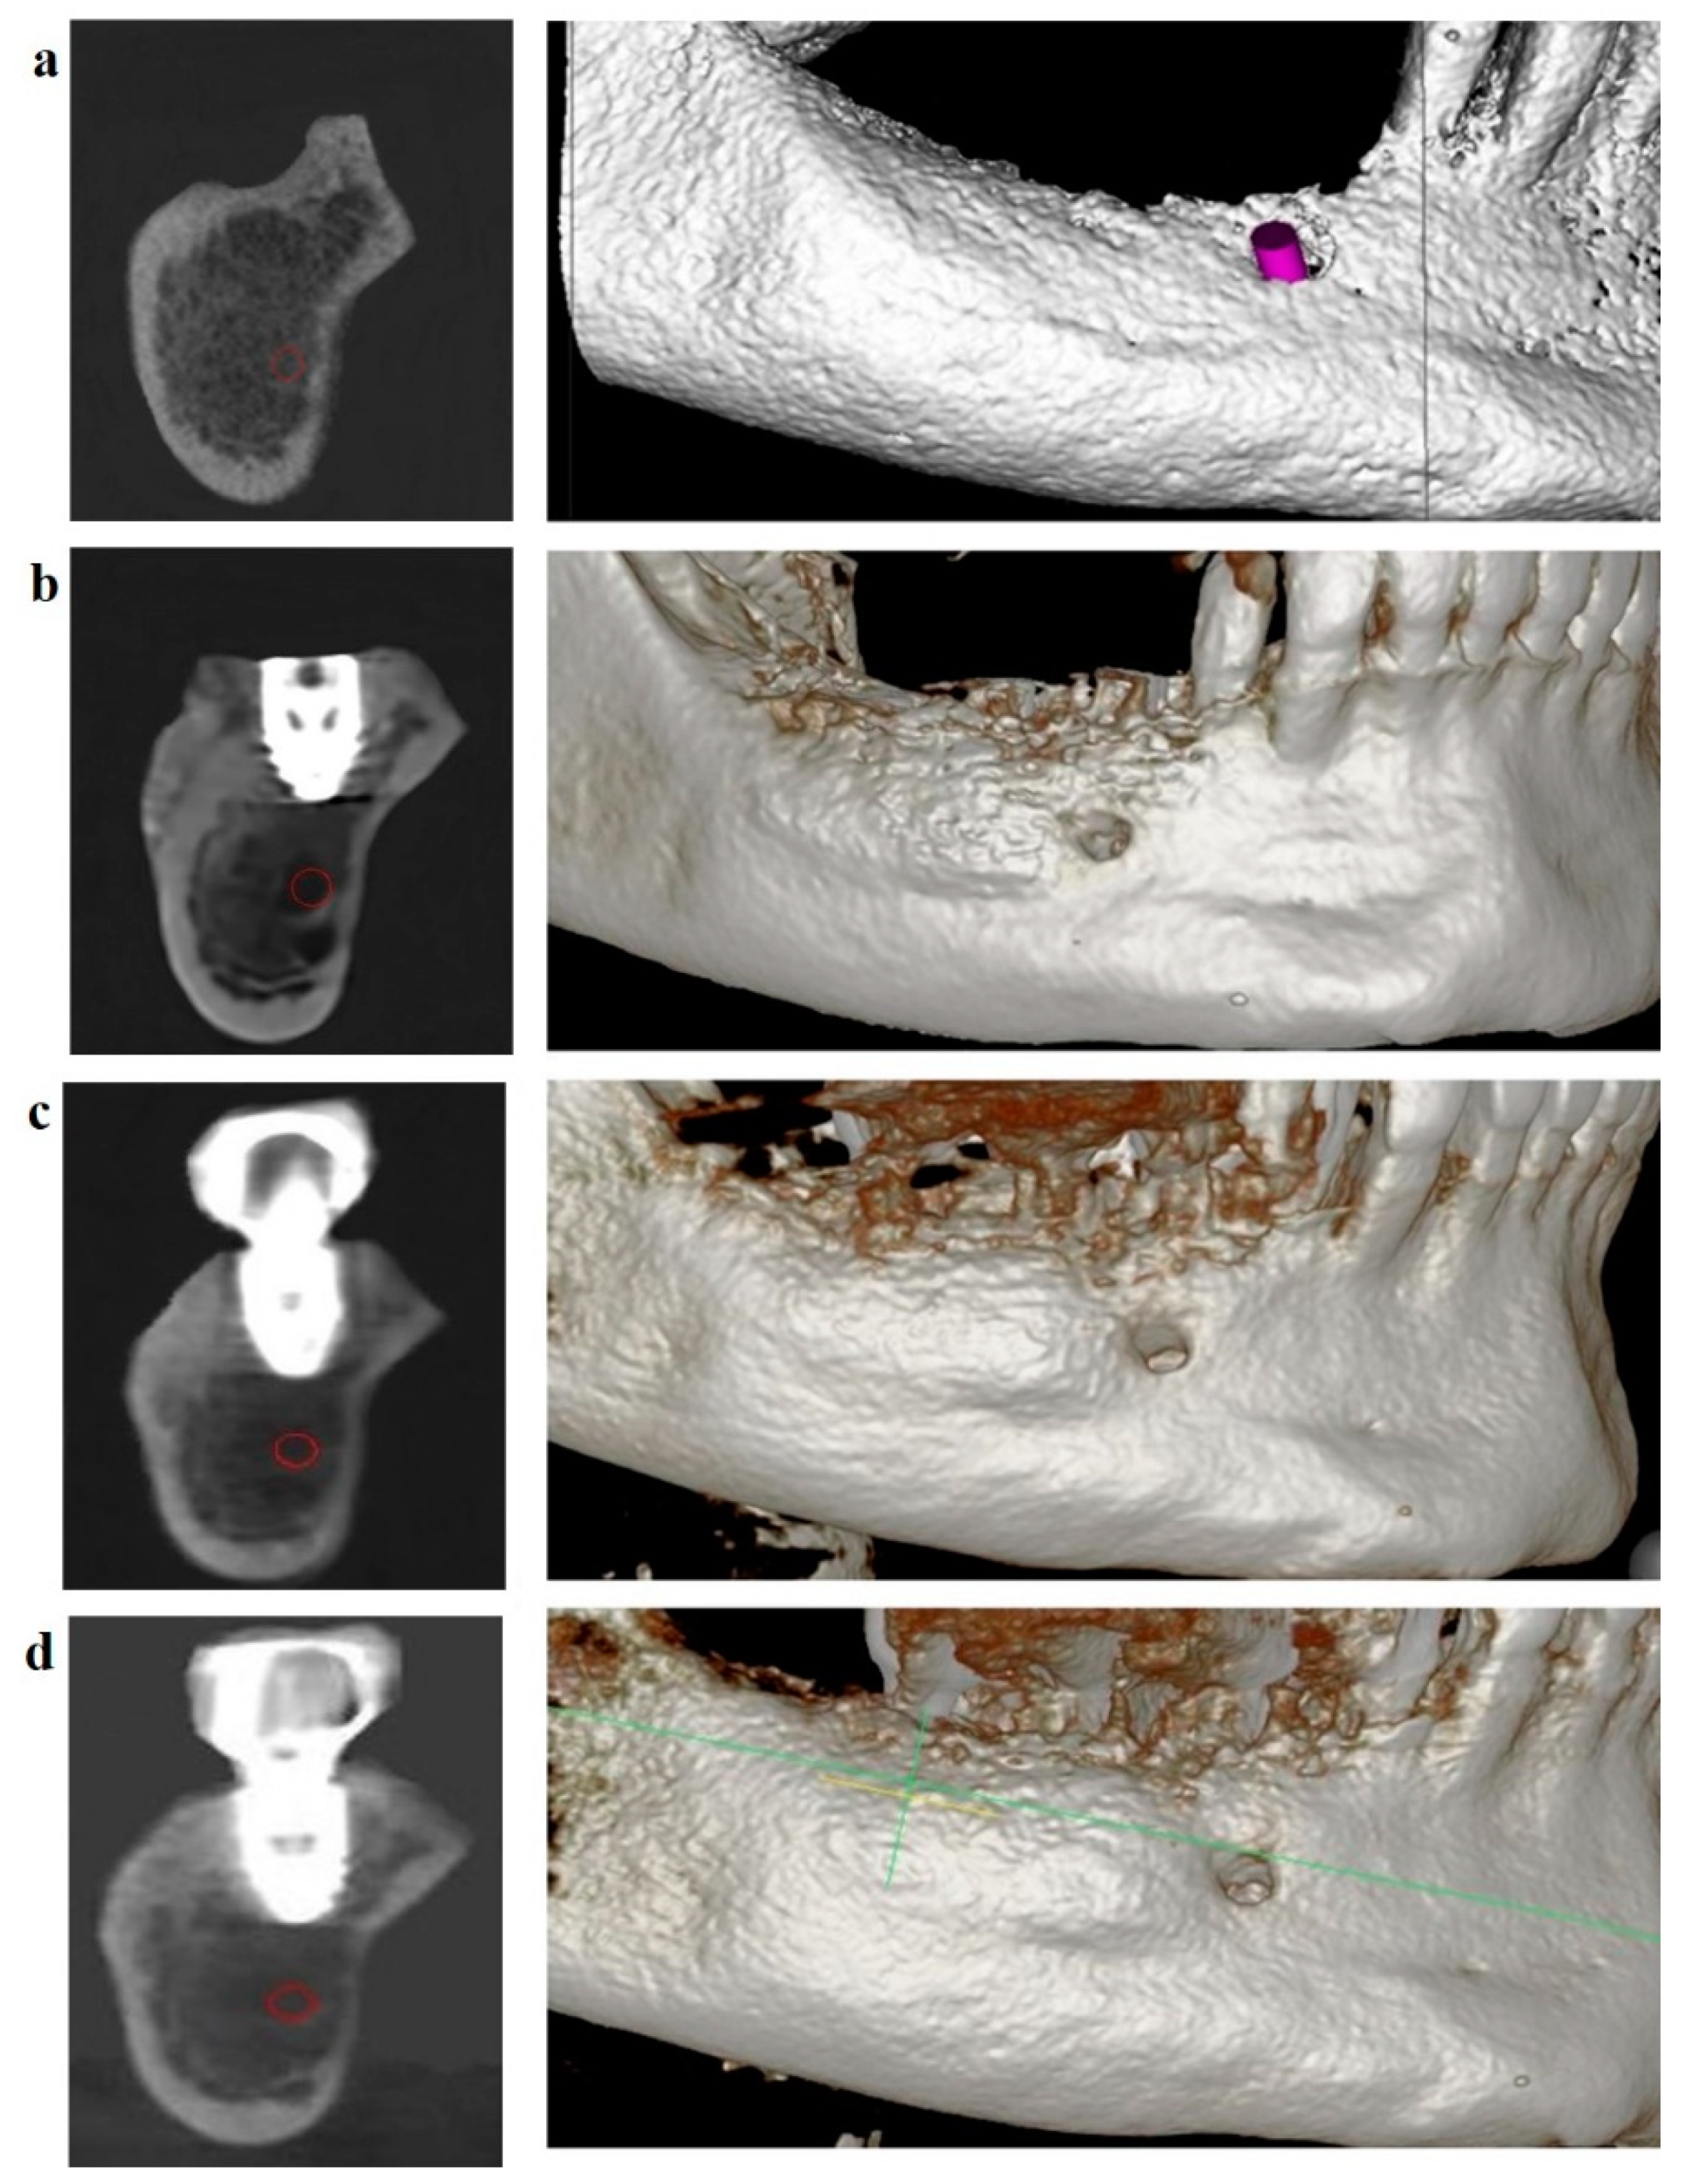
Dynamic follow-up showed good scaffold stability at four months (
Figure 13b), one year and six months after completion of treatment (
Figure 13c), and two years and six months after completion of treatment (
Figure 13d). The boundaries of the scaffold are located at the level of the dental implant. The OGB fraction was well integrated with the underlying bone.
4. Discussion
Osteoconductive granulated biopolymers, also known as OGB, are put to use in the process of restoring damaged jawbone tissue. OGB is used as a fraction characterized by the physical properties typical of loose particulate mixtures; this allows for the filling of cavities that have a complex geometric form. On the other hand, OGB's biological surroundings might alter its physical characteristics. This is the primary reason why the OGB volume changed in an uncontrolled manner during the first three weeks of the postoperative period [
34,
35]. It is necessary to provide the conditions to stabilize bioengineered construction to solve this problem. These conditions should be set based on the modeling of the biomimetic system, which should include such parameters as porosity, surface area, and pore sizes. This modeling should be done to predict how the OGB fraction will behave on the recipient's site. [
36]. A successful bone repair depends not only on the excellent biocompatibility of the OGB but also on its controlled biodegradability throughout all stages of the reparation process [
37,
38]. Osteoconductivity is the ability of biopolymers to provide the necessary physical structure for bone growth on the surface of bone as well as across bone. The process is non-active and enables cell adhesion, proliferation, and migration [
39]. On the other hand, the biological environment of a recipient's site significantly impacts both the dynamics of BGF adsorption and OGB fraction degradation [
40]. In point of fact, it has been demonstrated that a recipient's immune response can bring about uncontrolled changes in the OGB's physical and chemical properties, which can bring about postoperative complications such as a change in the scaffold volume or a loss of the BGF carrier properties. It is necessary to understand the factors that contribute to the alterations in the form of bioengineered construction to eliminate such complications. During the process of 3D modeling, careful consideration must be given to the dynamical changes that occur in the physical properties of OGB at a recipient's site.
When OGB is manufactured, the composition of the particulate fraction becomes heterogeneous. New research in the homogenization process and the interphase border evolution between different types of particles showed that this homogenization process is determined not only by the system's dynamics but also by the initial spatial distribution of the fraction particles [
3,
5]. When OGB is prepared ex tempore, and the native biological environment of a recipient's site directly impacts OGB, its physical properties change again. Studying these processes is directly connected with choosing appropriate models that would allow us to simulate them in vitro and in vivo. These models should, first of all, reflect the behavior and changes of all components of the OGB fraction at a recipient's site. Secondly, they should be economically efficient and easy to apply.
Moreover, it is time to work out a unified protocol for OGB preclinical testing and advance it to clinical practice. For that purpose, it is proposed to use a limestone particulate fraction as a model. Limestone is an organic (biogenic) sedimentary rock with calcite and calcite fossils [
41]. Besides, an inorganic limestone component, i.e., calcium carbonate, can slowly dissolve in water into carbon dioxide and the corresponding basic oxide [
42]. If we analyze basic limestone physical properties, we see that shell limestone density is about 800 kg/m3, tensile strength is about 0,4 MPa, water absorption capacity ranges from 0,1% to 2,1%, and porosity ranges from 0,5% to 35%. These main physical characteristics of the limestone fraction are comparable to those of the OGB fraction.
Using such parameters as АCA, micropore volume, WmА, and WmB, we can manufacture OGB with a set adsorption capacity according to the existing clinical requirements. The larger the volume of micropores in OGB, the lower the ACT indicator and the lower the adsorption properties of OGB. The adsorption properties of the OGB fraction depend to a greater extent on the number of macropores in 1 cm3 of the OGB fraction.
Our study found that the Cerabone, Osteon II, Maxresorb, and MSP OGB fractions have a volume of micropores of <1 cm
3/g, so the W
mB parameter reflected only macropores. At the same time, W
mА is proportionate to АC
A. Thus, АC
T of Cerabone, Osteon II, Maxresorb, and MSP OGB fractions correspond to their АC
A (
Table 4). The volume of micropores in the Xenograft Collagen OGB fraction ranges between 1 сm
3/g and 10 cm
3, with АC
T being different from АC
A. In general, АC
T depends on W
mB, with W
mB, in turn, being represented mainly by macropores and partly by micropores. In order to calculate АC
T of the Xenograft Collagen OGB fraction, we introduced the correction coefficient to exclude micropore volume from the W
mB value. As for the Bio-Oss OGB fraction, we found that it is characterized by an enormous volume of micropores with homogenous micropore surfaces and sporadic macropores using scanning electron microscopy. That is why, when we calculated АC
T for the OGB Bio-Oss fraction, we did not consider W
mB.
The presence of macropores is necessary to optimize reparative osteogenesis and increase the surface area of the OGB fraction [
43,
44,
45,
46]. Large pores improve oxygen diffusion into the internal OGB fraction, thus increasing the viability of cells [
46]. The bimodal distribution of pores with an average size of 38.3 μm is believed to improve cell seeding efficiency, cell viability, and proliferation [
47].
The latest publications discuss the ability of micropores to improve a transplant's ability to adsorb cell elements and participate in cell tissue diffusion while being accessible for vessel growth. The presence of micropores improves ion exchange with body tissues and cell adhesion, proliferation, and differentiation [
48,
49,
50,
51,
52]. Besides, it has been reported that micropores create capillary forces that attract liquids and cells to the surfaces of scaffolds thus increasing cell regeneration potential in vivo [
53,
54]. On the other hand, research has shown that micropores prevent the angiogenesis process and osteoblast precursors' migration and differentiation into the matrix [
55]. This is mainly caused by the mismatch between the sizes of cells and micropores, with osteoblasts being 20 µm in size and osteoclasts reaching the size of 180 µm while pores reach a maximum of 0.03 µm or less. As a result, cells block micropores [
55].
It is well known that proliferation activity on the surface of particles is significantly decreased in the presence of dust [
52]. Therefore, the presence of free spaces in macropores and through pores of the granules and intergranular spaces allows the placing an additional volume of OGB, which positively affects the stability of the bioengineered construction in the recipient site. Our method's preparation of the OGB fraction allows for creating optimal conditions for placing the calculated volume of BGF. Scanning electronic microscopy showed that the content of coarse crumbs and fine dust decreased after degassing and removal of industrial dust on the outer and inner surfaces of pores and through pores. Specifically, passive degasification purified external OGB surfaces from coarse dust and air particles. At the stage of active degassing, the inner surfaces of pores, through pores and voids of OGB granules, are freed from fine dust and residual gases. Ultrasound applied at the active degasification stage creates a cavitation effect that initiates hydraulic strokes on the external and internal surfaces of the particles, with surface roughness causing wave interference and diffraction. This process releases the gases and fine loose particles from the OGB into the solution. A stable process to get rid of the hydraulic traps is initiated. Tiny air bubbles are united into larger ones that collapse and are then released from OGB spaces into the surrounding solution [
56]. Purified pores and channels of through pores increase the surface area of BGF contact with internal surfaces of the OGB fraction of the microcirculatory bloodstream, interstitial fluid, and cell components, migrating from the periphery of a recipient's site deep into OGB.
5. Conclusions
When treating a defect in the jaw bone with the GBR method, it is necessary to calculate the necessary volume of the OGB fraction. This must be done while taking into account the compaction coefficient of the OGB fraction within the scaffold. This factor makes it possible to make generalizations about the dynamics of changes in OGB physical properties during the postoperative period. When applied during the planning stage, this factor enables a 3D planning of the construction that considers OGB transformation. This, in turn, enables the preservation of the volume calculated for a scaffold and reduces the risk of an uncontrolled volume change occurring at the recipient's site of the bioengineered construction.
According to the data received, the volume of BGF required that can be adsorbed by the OGB fraction corresponds to OGB adsorption capacity. The adsorption capacity of the OGB fraction reflects the maximum amount of BGF that can make contact with the free OGB surfaces of both the internal and external pore surfaces and the spaces between the particles. The presence of air and fine dust on the particle surface as well as within the internal, external, and thorough pores all work to inhibit the adsorption capacity of the particle. The deep pores contain hydrodynamic and mechanical traps that prevent BGF, vessels, and fibrous elements from migrating from a recipient's site into the OGB.
We can manufacture OGB with a predetermined adsorption capacity by using parameters such as ACA, micropore volume, WmA, and WmB. Clinical requirements drive these parameters. The decrease in ACT and OGB adsorption properties can be attributed to increased micropore volume. The higher ratio of the free surface area to the volume of the external and internal surfaces of the OGB fraction increases the diffusion of the interstitial fluid and blood plasma, optimizes the fixation and migration of cells, and creates conditions for the invasion of vessels and neoangiogenesis in the free OGB spaces. These benefits are brought about by the ratio of the free surface area to the volume of the external and internal surfaces is higher. The adsorption and drainage properties of the OGB fraction can be significantly improved by enhancing the manufacturing process and performing additional preparation of a biopolymer in clinical conditions ex tempore.
6. Patents
1. Slesarev O.V., Bairikov I.M., Malchikova D.V., Platonov V.I., Jordanishvili A.K., Muzykin M.I., Gribkova O.V., Komarova M.V., 2758570 C1, 2021.
2. Ruzanov N.V., Slesarev O.V., Bolotov M.A., Malchikova D.V., 2021666327, 2021.
Author Contributions
Conceptualization, O.V.S. and D.V.M.; Methodology, O.V.S., D.V.M. and V.I.P.; Software, O.V.S. and D.V.M.; Validation, O.V.S., D.V.M., N.A.M, A.A.M., V.I.P., M.A.A. and R.B.A.; Formal Analysis, O.V.S., D.V.M., V.I.P., M.A.A. and R.B.A.; Investigation, O.V.S., D.V.M., A.A.M. and V.I.P.; Resources, O.V.S., D.V.M., N.A.M., A.A.M. and V.I.P.; Data Curation, O.V.S., D.V.M., N.A.M., A.A.M., V.I.P., M.A.A. and R.B.A.; Writing—Original Draft Preparation, O.V.S. and D.V.M.; Writing—Review & Editing, N.A.M.; Visualization, O.V.S. and D.V.M.; Supervision, O.V.S., D.V.M., N.A.M., A.A.M., V.I.P., M.A.A. and R.B.A.; Project Administration O.V.S., D.V.M., N.A.M., A.A.M., V.I.P., M.A.A. and R.B.A.; Funding Acquisition, O.V.S. and D.V.M. All authors have read and agreed to the published version of the manuscript.
Funding
This research received no external funding.
Institutional Review Board Statement
Not applicable.
Data Availability Statement
Not applicable.
Conflicts of Interest
The authors declare no conflict of interest.
References
- Fernandez de Grado, G.; Keller, L.; Idoux-Gillet, Y.; Wagner, Q.; Musset, A.M.; Benkirane-Jessel, N.; Bornert, F.; Offner, D. Bone substitutes: a review of their characteristics, clinical use, and perspectives for large bone defects management. J Tissue Eng. 2018, 9, 2041731418776819. [Google Scholar] [CrossRef] [PubMed]
- Hsu, E.L.; Stock, S.R. Growth Factors, Carrier Materials, and Bone Repair. Handb Exp Pharmacol. 2020, 262, 121–156. [Google Scholar] [CrossRef] [PubMed]
- Zhang, L.; Yang, G.; Johnson, B.N.; Jia, X. Three-dimensional (3D) printed scaffold and material selection for bone repair. Acta Biomater. 2019, 84, 16–33. [Google Scholar] [CrossRef] [PubMed]
- Ferlin, K.M.; Prendergast, M.E.; Miller, M.L.; Kaplan, D.S.; Fisher, J.P. Influence of 3D printed porous architecture on mesenchymal stem cell enrichment and differentiation. Acta Biomater. 2016, 32, 161–169. [Google Scholar] [CrossRef] [PubMed]
- Lutzweiler, G.; Ndreu, H. A.; Engin, V. N. The Overview of Porous, Bioactive Scaffolds as Instructive Biomaterials for Tissue Regeneration and Their Clinical Translation. Pharmaceutics 2020, 12, 602. [Google Scholar] [CrossRef] [PubMed]
- Callens, S.J.P.; Uyttendaele, R.J.C.; Fratila-Apachitei, L.E.; Zadpoor, A.A. Substrate curvature as a cue to guide spatiotemporal cell and tissue organization. Biomaterials 2020, 232, 119739. [Google Scholar] [CrossRef] [PubMed]
- Kasten, P.; Beyen, I.; Niemeyer, P. , Luginbühl, R.; Bohner, M.; Richter, W. Porosity and pore size of beta–tricalcium phosphate scaffold can influence protein production and osteogenic differentiation of human mesenchymal stem cells: an in vitro and in vivo study. Acta Biomater. 2008, 4, 1904–1915. [Google Scholar] [CrossRef]
- Figueiredo, M.; Henriques, J.; Martins, G.; Guerra, F.; Judas, F.; Figueiredo, H. Physicochemical characterization of biomaterials commonly used in dentistry as bone substitutes--comparison with human bone. J Biomed Mater Res B Appl Biomater. 2010, 92, 409–419. [Google Scholar] [CrossRef]
- Karageorgiou, V.; Kaplan, D. Porosity of 3D biomaterial scaffolds and osteogenesis. Biomaterials. 2005, 232, 119739. [Google Scholar] [CrossRef]
- Trajkovski, B.; Jaunich, M.; Müller, W.-D.; Beuer, F.; Zafiropoulos, G.-G.; Houshmand, A. Hydrophilicity, Viscoelastic, and Physicochemical Properties Variations in Dental Bone Grafting Substitutes. Materials 2018, 11, 215. [Google Scholar] [CrossRef]
- Trajkovski, B.; Jaunich, M.; Müller, W.D.; Beuer, F.; Zafiropoulos, G.G.; Houshmand, A. Hydrophilicity, Viscoelastic, and Physicochemical Properties Variations in Dental Bone Grafting Substitutes. Materials (Basel). 2018, 11, 215. [Google Scholar] [CrossRef] [PubMed]
- Szczodra, A.; Tainio, J. M.; Houaoui, A.; Liu, H.; Pohjola, J.; Miettinen, S.; Brauer, D. S.; Massera, J. Impact of borosilicate bioactive glass scaffold processing and reactivity on in-vitro dissolution properties. Materials Today Communications 2023, 35, 105984. [Google Scholar] [CrossRef]
- Kohout, M.; Barczi, T.; Travnickova, T.; Havlica, J. Effect of Bed Depth on Granular Flow and Homogenization in a Vertical Bladed Mixer via Discrete Element Method. Chemical Engineering & Technology 2015, 38. [Google Scholar] [CrossRef]
- Antoni, D.; Burckel, H.; Josset, E.; Noel, G. Three-dimensional cell culture: A breakthrough in vivo. Int. J. Mol. Sci. 2015, 16, 5517–5527. [Google Scholar] [CrossRef] [PubMed]
- Callens, S.J.P.; Uyttendaele, R.J.C.; Fratila-Apachitei, L.E.; Zadpoor, A.A. Substrate curvature as a cue to guide spatiotemporal cell and tissue organization. Biomaterials. 2020, 232, 119739. [Google Scholar] [CrossRef] [PubMed]
- Buenzli, P.R.; Lanaro, M.; Wong, C.S.; McLaughlin, M.P.; Allenby, M.C.; Woodruff, M.A.; Simpson, M.J. Cell proliferation and migration explain pore bridging dynamics in 3D printed scaffolds of different pore size. Acta Biomater. 2020, 114, 285–295. [Google Scholar] [CrossRef] [PubMed]
- Zhou, W.N.; Pan, Y.C.; Tang, Y.C.; Hou, W.; Wu, D.M.; Yuan, H.; Wan, L.Z.; Du, Y.F.; Jiang, H.B. Comparative Outcomes of Block and Cancellous Iliac Bone Grafting in Older Unilateral Alveolar Cleft Patients. Cleft Palate Craniofac J. 2019, 56, 936–943. [Google Scholar] [CrossRef]
- Aloy-Prosper, A.; Maestre-Ferrin, L.; Penarrocha-Oltra, D.; Penarrocha-Diago, M. Bone regeneration using particulate grafts: an update. Med Oral Patol Oral Cir Bucal. 2011, 16, e210–4. [Google Scholar] [CrossRef]
- Troeltzsch, M.; Troeltzsch, M.; Kauffmann, P.; Gruber, R.; Brockmeyer, P.; Moser, N.; Rau, A.; Schliephake, H. Clinical efficacy of grafting materials in alveolar ridge augmentation: A systematic review. J Craniomaxillofac Surg. 2016, 44, 1618–1629. [Google Scholar] [CrossRef]
- Lee, S.H.; Choi, B.H.; Li, J.; Jeong, S.M.; Kim, H.S.; Ko, C.Y. Comparison of corticocancellous block and particulate bone grafts in maxillary sinus floor augmentation for bone healing around dental implants. Oral Surg Oral Med Oral Pathol Oral Radiol Endod. 2007, 104, 324–328. [Google Scholar] [CrossRef]
- Alias, M.A.; Buenzli, P.R. Modeling the Effect of Curvature on the Collective Behavior of Cells Growing New Tissue. Biophysical Journal 2017, 112, 193–204. [Google Scholar] [CrossRef] [PubMed]
- Hegarty-Cremer, S.G.D.; Simpson, M.J.; Andersen, T.L.; Buenzli, P.R. Modelling cell guidance and curvature control in evolving biological tissues. J Theor Biol. 2021, 520, 110658. [Google Scholar] [CrossRef] [PubMed]
- Ghassemi, T.; Shahroodi, A.; Ebrahimzadeh, M.H.; Mousavian, A.; Movaffagh, J.; Moradi, A. Current Concepts in Scaffolding for Bone Tissue Engineering. Arch Bone Jt Surg. 2018, 6, 90–99. [Google Scholar] [PubMed]
- Dehghani, F.; Annabi, N. Engineering porous scaffolds using gas-based techniques. Curr Opin Biotechnol. 2011, 22, 661–666. [Google Scholar] [CrossRef] [PubMed]
- Burger, E.H.; Klein-Nulend, J. Mechanotransduction in bone—role of the lacuno-canalicular network. FASEB J. 1999, 13, 101–112. [Google Scholar] [CrossRef]
- Pina, S.; Ribeiro, V.P.; Marques, C.F.; Maia, F.R.; Silva, T.H.; Reis, R.L.; Oliveira, J.M. Scaffolding Strategies for Tissue Engineering and Regenerative Medicine Applications. Materials (Basel). 2019, 12, 1824. [Google Scholar] [CrossRef] [PubMed]
- Ali, D.; Sen, S. Computational Fluid Dynamics Study of the Effects of Surface Roughness on Permeability and Fluid Flow-Induced Wall Shear Stress in Scaffolds. Ann Biomed Eng. 2018, 46, 2023–2035. [Google Scholar] [CrossRef]
- Zhu, G.; Zhang, T.; Chen, M.; Yao, K.; Huang, X.; Zhang, B.; Li, Y.; Liu, J.; Wang, Y.; Zhao, Z. Bone physiological microenvironment and healing mechanism: Basis for future bone-tissue engineering scaffolds. Bioact Mater. 2021, 6, 4110–4140. [Google Scholar] [CrossRef]
- Maia, F.R.; Bastos, A.R.; Oliveira, J.M.; Correlo, V.M.; Reis, R.L. Recent approaches towards bone tissue engineering. Bone 2022, 154, 116256. [Google Scholar] [CrossRef]
- Slesarev, O.V., Bairikov I.M., Malchikova D.V., Platonov V.I., Jordanishvili A.K., Muzykin M.I., Gribkova O.V., Komarova M.V., 2758570 C1, 2021.
- Higashi, T.; Okamoto, H. The effect of ultrasonic irrigation before and after citric acid treatment on collagen fibril exposure: an in vitro SEM study. J Periodontol. 1995, 66, 887–891. [Google Scholar] [CrossRef]
- Shetty, B.; Dinesh, A.; Seshan, H. Comparitive effects of tetracyclines and citric acid on dentin root surface of periodontally involved human teeth: A scanning electron microscope study. J Indian Soc Periodontol. 2008, 12, 8–15. [Google Scholar] [CrossRef] [PubMed]
- Ruzanov, N.V., Slesarev O.V., Bolotov M.A., Malchikova D.V., 2021666327, 2021.
- Jemt, T.; Lekholm, U. Measurements of buccal tissue volumes at single-implant restorations after local bone grafting in maxillas: a 3-year clinical prospective study case series. Clin Implant Dent Relat Res. 2003, 5, 63–70. [Google Scholar] [CrossRef] [PubMed]
- Araújo, M.G.; Sonohara, M.; Hayacibara, R.; Cardaropoli, G.; Lindhe, J. Lateral ridge augmentation by the use of grafts comprised of autologous bone or a biomaterial. An experiment in the dog. J Clin Periodontol. 2002, 29, 1122–1131. [Google Scholar] [CrossRef]
- Chen, X.; Fan, H.; Deng, X.; Wu, L.; Yi, T.; Gu, L.; Zhou, C.; Fan, Y.; Zhang, X. Scaffold Structural Microenvironmental Cues to Guide Tissue Regeneration in Bone Tissue Applications. Nanomaterials (Basel). 2018, 8, 960. [Google Scholar] [CrossRef] [PubMed]
- Haugen, H.J.; Lyngstadaas, S.P.; Rossi, F.; Perale, G. Bone grafts: which is the ideal biomaterial. J Clin Periodontol. 2019, 46, 92–102. [Google Scholar] [CrossRef] [PubMed]
- Yamada, M.; Egusa, H. Current bone substitutes for implant dentistry. J Prosthodont Res. 2018, 62, 152–161. [Google Scholar] [CrossRef]
- Navarro, M.; Michiardi, A.; Castaño, O.; Planell, J.A. Biomaterials in orthopaedics. J R Soc Interface. 2008, 5, 1137–1158. [Google Scholar] [CrossRef]
- Baino, F. Biomaterials and implants for orbital floor repair. Acta Biomater. 2011, 7, 3248–3266. [Google Scholar] [CrossRef]
- Shixaliyev, K.S. The study of the properties of limestone grains surfaces and determination of optimal proportions between breakstone and limestone. British journal of innovation in science and technology 2018, 3, 31–36. [Google Scholar] [CrossRef]
- Massalimov, I.A.; Massalimov, B.I.; Akhmetshin, B.S.; Urakaev, F.Kh.; Burkitbaev, M.M. Transformation of limestone-shell rock mining waste by impregnation with polysulfide solutions. Nanotechnologies in Construction: A Scientific Internet-Journal 2020, 12, 77–83. [Google Scholar] [CrossRef]
- Bertazzo, S.; Zambuzzi, W.F.; Campos, D.D.; Ogeda, T.L.; Ferreira, C.V.; Bertran, C.A. Hydroxyapatite surface solubility and effect on cell adhesion. Colloids Surf B Biointerfaces. 2010, 78, 177–184. [Google Scholar] [CrossRef]
- Cyster, L.A.; Grant, D.M.; Howdle, S.M.; Rose, F.R.; Irvine, D.J.; Freeman, D.; Scotchford, C.A.; Shakesheff, K.M. The influence of dispersant concentration on the pore morphology of hydroxyapatite ceramics for bone tissue engineering. Biomaterials 2005, 26, 697–702. [Google Scholar] [CrossRef] [PubMed]
- Tian, T.; Liao, J.; Zhou, T.; Lin, S.; Zhang, T.; Shi, S.R.; Cai, X.; Lin, Y. Fabrication of Calcium Phosphate Microflowers and Their Extended Application in Bone Regeneration. ACS Appl Mater Interfaces. 2017, 9, 30437–30447. [Google Scholar] [CrossRef] [PubMed]
- Zambuzzi, W.F.; Oliveira, R.C.; Pereira, F.L.; Cestari, T.M.; Taga, R.; Granjeiro, J.M. Rat subcutaneous tissue response to macrogranular porous anorganic bovine bone graft. Braz Dent J. 2006, 17, 274–278. [Google Scholar] [CrossRef] [PubMed]
- Salerno, A.; Guarnieri, D.; Iannone, M.; Zeppetelli, S.; Netti, P.A. Effect of micro- and macroporosity of bone tissue three-dimensional-poly(epsilon-caprolactone) scaffold on human mesenchymal stem cells invasion, proliferation, and differentiation in vitro. Tissue Eng Part A. 2010, 16, 2661–2673. [Google Scholar] [CrossRef] [PubMed]
- Annaz, B.; Hing, K.A.; Kayser, M.; Buckland, T.; Di, S.L. An ultrastructural study of cellular response to variation in porosity in phase-pure hydroxyapatite. J Microsc. 2004, 216, 97–109. [Google Scholar] [CrossRef]
- da Cruz, A.C.; Pochapski, M.T.; Daher, J.B.; da Silva, J.C.; Pilatti, G.L.; Santos, F.A. Physico-chemical characterization and biocompatibility evaluation of hydroxyapatites. J Oral Sci. 2006, 48, 219–226. [Google Scholar] [CrossRef]
- Hing, K.A.; Annaz, B.; Saeed, S.; Revell, P.A.; Buckland, T. Microporosity enhances bioactivity of synthetic bone graft substitutes. J Mater Sci Mater Med. 2005, 16, 467–475. [Google Scholar] [CrossRef]
- Murugan, R.S.; Panduranga, R.K. Nanoporous hydroxy-carbonate apatite scaffold made of natural bone. Materials Letters 2006, 60, 2844–2847. [Google Scholar] [CrossRef]
- Turco, G.; Porrelli, D.; Marsich, E.; Vecchies, F.; Lombardi, T.; Stacchi, C.; Di Lenarda, R. Three-Dimensional Bone Substitutes for Oral and Maxillofacial Surgery: Biologic1al and Structural Characterization. J Funct Biomater. 2018, 9, 62. [Google Scholar] [CrossRef]
- Polak, S.J.; Rustom, L.E.; Genin, G.M.; Talcott, M.; Wagoner Johnson, A.J. A mechanism for effective cell-seeding in rigid, microporous substrates. Acta Biomater. 2013, 9, 7977–7986. [Google Scholar] [CrossRef] [PubMed]
- Rustom, L.E.; Boudou, T.; Lou, S.; Pignot-Paintrand, I.; Nemke, B.W.; Lu, Y.; Markel, M.D.; Picart, C.; Wagoner Johnson, A.J. Micropore-induced capillarity enhances bone distribution in vivo in biphasic calcium phosphate scaffolds. Acta Biomater. 2016, 44, 144–154. [Google Scholar] [CrossRef] [PubMed]
- Bobbert, F.S.L.; Zadpoor, A.A. Effects of bone substitute architecture and surface properties on cell response, angiogenesis, and structure of new bone. J Mater Chem B. 2017, 5, 6175–6192. [Google Scholar] [CrossRef] [PubMed]
- GI, E. Cavitation mechanism of ultrasonic melt degassing. Ultrasonics Sonochemistry 1995, 2, 137–141. [Google Scholar] [CrossRef]
Figure 1.
The process of degassing and extraction of dust from the OGB fraction.
Figure 1.
The process of degassing and extraction of dust from the OGB fraction.
Figure 3.
SEM micrographs of Bio-Oss, Cerabone, Maxresorb, Osteon II, Xenograft Collagen, MSP.
Figure 3.
SEM micrographs of Bio-Oss, Cerabone, Maxresorb, Osteon II, Xenograft Collagen, MSP.
Figure 4.
(a) The OGB Cerabone without preparation according to the protocol of paragraph 2.1.2, group 1; (b) the OGB Cerabone, prepared according to the protocol of paragraph 2.1.2, group 2; (c) control group 3. 1 - Cerabone, 2 - cultured human MSC.
Figure 4.
(a) The OGB Cerabone without preparation according to the protocol of paragraph 2.1.2, group 1; (b) the OGB Cerabone, prepared according to the protocol of paragraph 2.1.2, group 2; (c) control group 3. 1 - Cerabone, 2 - cultured human MSC.
Figure 5.
(a) SEM of MSC placed on OGB in vitro on a culture medium. A. Attachment, migration, and proliferation of cells on the surface of the OGB, x2000; (b) MSC 8 days after placement on the OGB, x8000.
Figure 5.
(a) SEM of MSC placed on OGB in vitro on a culture medium. A. Attachment, migration, and proliferation of cells on the surface of the OGB, x2000; (b) MSC 8 days after placement on the OGB, x8000.
Figure 6.
Fourier-transformed infrared spectra of the six granulated biopolymers: Bio-Oss, Cerabone, Maxresorb, Osteon II, Xenograft Collage, MSP.
Figure 6.
Fourier-transformed infrared spectra of the six granulated biopolymers: Bio-Oss, Cerabone, Maxresorb, Osteon II, Xenograft Collage, MSP.
Figure 7.
(a) CBCT of the lower jaw: scaffold modeling to eliminate JBD; (b) fragment of the 3D augmentate model in the projection of the distal implant installation; (c) synthetic membrane template.
Figure 7.
(a) CBCT of the lower jaw: scaffold modeling to eliminate JBD; (b) fragment of the 3D augmentate model in the projection of the distal implant installation; (c) synthetic membrane template.
Figure 8.
Dental implants with plugs are installed, and ICX-Bone ring set consisting of a lock screw and cover screw is installed in the distal implant to fix the membrane.
Figure 8.
Dental implants with plugs are installed, and ICX-Bone ring set consisting of a lock screw and cover screw is installed in the distal implant to fix the membrane.
Figure 9.
(a) Horizontal and vertical JBD augmentations; (b) the calculated augmentate volume.
Figure 9.
(a) Horizontal and vertical JBD augmentations; (b) the calculated augmentate volume.
Figure 10.
(a) The augmentate is covered with a membrane and fixed with an inner-outer suture and a membrane plug of the implant; (b) the wound was sutured in layers.
Figure 10.
(a) The augmentate is covered with a membrane and fixed with an inner-outer suture and a membrane plug of the implant; (b) the wound was sutured in layers.
Figure 11.
(a) Invasion of a blood vessel into the channel of the OGB granule, pericytes are located on the vessel wall (↑); (b) osteocytes (↑) and trabecula (↑) of spongy bone in spaces between OGB granules.
Figure 11.
(a) Invasion of a blood vessel into the channel of the OGB granule, pericytes are located on the vessel wall (↑); (b) osteocytes (↑) and trabecula (↑) of spongy bone in spaces between OGB granules.
Figure 12.
(a) After four months, the implants are uncovered, a sufficient volume of the keratinized mucosa is located on the underlying bone; (b) dentures are installed in the oral cavity.
Figure 12.
(a) After four months, the implants are uncovered, a sufficient volume of the keratinized mucosa is located on the underlying bone; (b) dentures are installed in the oral cavity.
Figure 13.
(a) CBCT of the lower jaw in the projection of the distal implant. JBD before installing the implant; (b) four months after the installation of the implant: the JBD is removed with a sufficient volume of the augmentate, and the boundary between the OGB and the JBD bone is visualized from the vestibular surface; (c) CBCT after one year and six months: successful biotransformation of the augmentate within the planned boundaries of the relief; (d) CBCT after two years and six months.
Table 1.
Physical indicators for calculating the true adsorption capacity of the OGB fraction.
Table 1.
Physical indicators for calculating the true adsorption capacity of the OGB fraction.
| Indicator |
Formula |
| Apparent adsorption capacity of the biopolymer (АCA), ml |
АCA = (V3-V1) + (V1-V2) |
| The indicator of the water absorption by mass, including intergranular spaces (WmА), % |
WmА = [(m2- m1) / m1]• 100% |
| The indicator of the water absorption by mass excluding intergranular spaces (WmB), % |
WmB = [(m3- m1) / m1]• 100% |
Table 2.
Determining the СС of the OGB fraction.
Table 2.
Determining the СС of the OGB fraction.
| Indicator |
Formula |
| Real volume of the OGB fraction in its natural form |
VE = (π • r2 • h1)/4 |
| Average density |
ρе = m1 / VE
|
| Water adsorption of the OGB fraction by mass |
WmЕ = [(m4- m1) / m1]• 100% |
| Water adsorption of the OGB fraction by volume |
WvЕ = [(m4- m1) / VE] • 100% |
| Dependency coefficient |
d = WvE / WmE
|
| The volume of the OGB fraction after compaction |
VC = (π • r2 • h2) / 4 |
| Water adsorption of the OGB fraction by mass after degassing |
WmC = [(m5-m1) /m1] •100% |
| Water adsorption of the OGB fraction by volume after degassing |
WvC = [(m5-m1) / VC] •100% |
| Dependency coefficient after compaction |
dmax = WvC / WmC
|
| Density of the OGB fraction after compaction |
ρc = m1/ VC
|
| The compaction coefficient of the OGB fraction |
CC= dmax /d |
Table 3.
Percentage of the initial fluid volume depending on time: average values and their 95% confidence intervals.
Table 3.
Percentage of the initial fluid volume depending on time: average values and their 95% confidence intervals.
| Time, min |
% of the initial volume, average values |
% of the initial volume, lower bound 95% confidence intervals |
% of the initial volume, upper bound 95% confidence intervals |
| 0,0 |
100,0 |
100,0 |
100,0 |
| 2,5 |
99,6 |
98,2 |
101,0 |
| 5,0 |
98,3 |
96,4 |
100,3 |
| 7,50 |
95,9 |
93,3 |
98,4 |
| 10,0 |
91,2 |
87,7 |
94,6 |
| 12,5 |
85,0 |
82,4 |
87,7 |
| 15,0 |
82,3 |
80,7 |
84,0 |
| 17,5 |
81,5 |
79,1 |
83,9 |
| 20,0 |
81,3 |
80,4 |
82,1 |
Table 4.
Indicators of changes in the physical properties of the OGB and descriptive statistics in the form of averages and standard deviations (M±SD).
Table 4.
Indicators of changes in the physical properties of the OGB and descriptive statistics in the form of averages and standard deviations (M±SD).
| OGB |
WmА, % |
WmB, % |
АCA, ml |
АCT, ml |
| Xenograft Collagen |
129,27±0,67 |
87,47±0,83 |
0,997±0,015 |
0,895±0,015 |
| Osteon II |
93,63±1,06 |
31,73±1,40 |
0,803±0,015 |
0,803±0,015 |
| Maxresorb |
115,10±1,65 |
41,93±0,47 |
0,753±0,015 |
0,753±0,015 |
| MSP |
80,12±0,83 |
28,60±0,56 |
0,681±0,015 |
0,681±0,015 |
| Cerabone |
59,13±0,70 |
19,10±0,70 |
0,563±0,015 |
0,563±0,015 |
| Bio-OSS |
131,13±1,29 |
59,00±0,40 |
0,703±0,015 |
0,386±0,015 |
Table 5.
Indicators of the viability of MSC in culture include the proliferative index, the culture doubling rate, and descriptive statistics in the form of means and standard deviations (M±SD).
Table 5.
Indicators of the viability of MSC in culture include the proliferative index, the culture doubling rate, and descriptive statistics in the form of means and standard deviations (M±SD).
| Group number |
Number of planted cells in 1 ml *106
|
Viability,% |
Quantity collected cells in 1 ml *106
|
Speed doubling in a day |
| 1 |
0,4 |
94,6 |
3,51 ±0,38 |
0,5162 ±0,1148 |
| 2 |
0,4 |
94,3 |
3,44 ±0,29 |
0,4884 ±0,2457 |
| 3 |
0,4 |
96,0 |
3,62 ±0,24 |
0,5212 ±0,2354 |
Table 6.
The compaction coefficient of the OGB and descriptive statistics in the form of averages and standard deviations (M ± SD).
Table 6.
The compaction coefficient of the OGB and descriptive statistics in the form of averages and standard deviations (M ± SD).
| OGB |
The compaction coefficient |
| Osteon Ⅱ |
1,69±0,02 |
| Maxresorb |
1,28±0,01 |
| Cerabone |
1,25±0,01 |
| Xenograft Collagen |
1,24±0,01 |
| MSP |
1,03±0,01 |
| Bio-OSS |
1,02±0,02 |
|
Disclaimer/Publisher’s Note: The statements, opinions and data contained in all publications are solely those of the individual author(s) and contributor(s) and not of MDPI and/or the editor(s). MDPI and/or the editor(s) disclaim responsibility for any injury to people or property resulting from any ideas, methods, instructions or products referred to in the content. |
© 2023 by the authors. Licensee MDPI, Basel, Switzerland. This article is an open access article distributed under the terms and conditions of the Creative Commons Attribution (CC BY) license (http://creativecommons.org/licenses/by/4.0/).
