Submitted:
12 May 2023
Posted:
22 May 2023
You are already at the latest version
Abstract
Keywords:
1. Introduction
2. Materials and Methods
2.1. Materials
2.2. Identification of a novel Wx-B1 allele
2.3. Cloning of Wx-B1 and genome walking
2.4. Characterization of a novel waxy mutant
2.5. Statistical analysis
3. Results
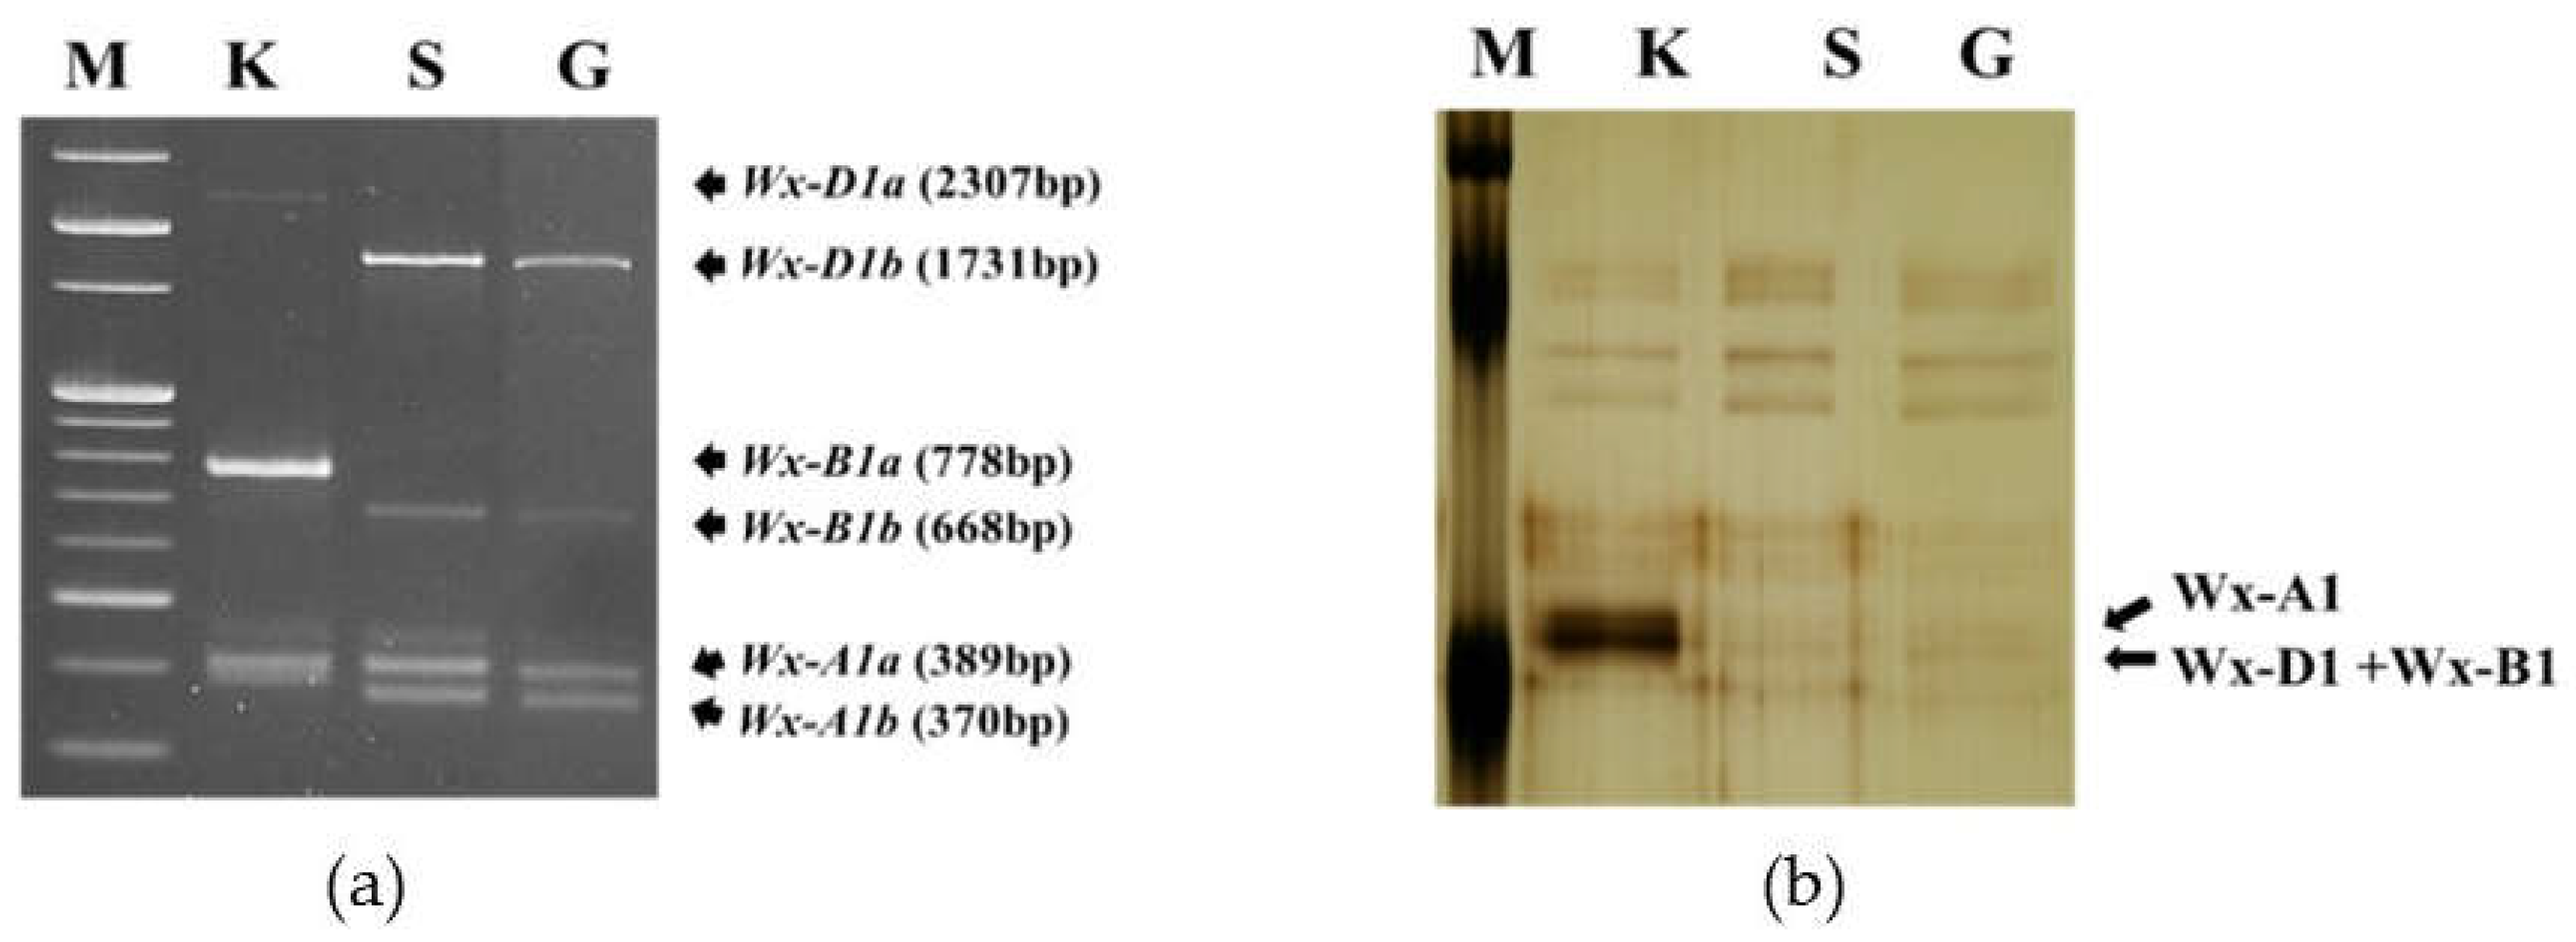
3.1. Analysis of the waxy protein polymorphism and PCR
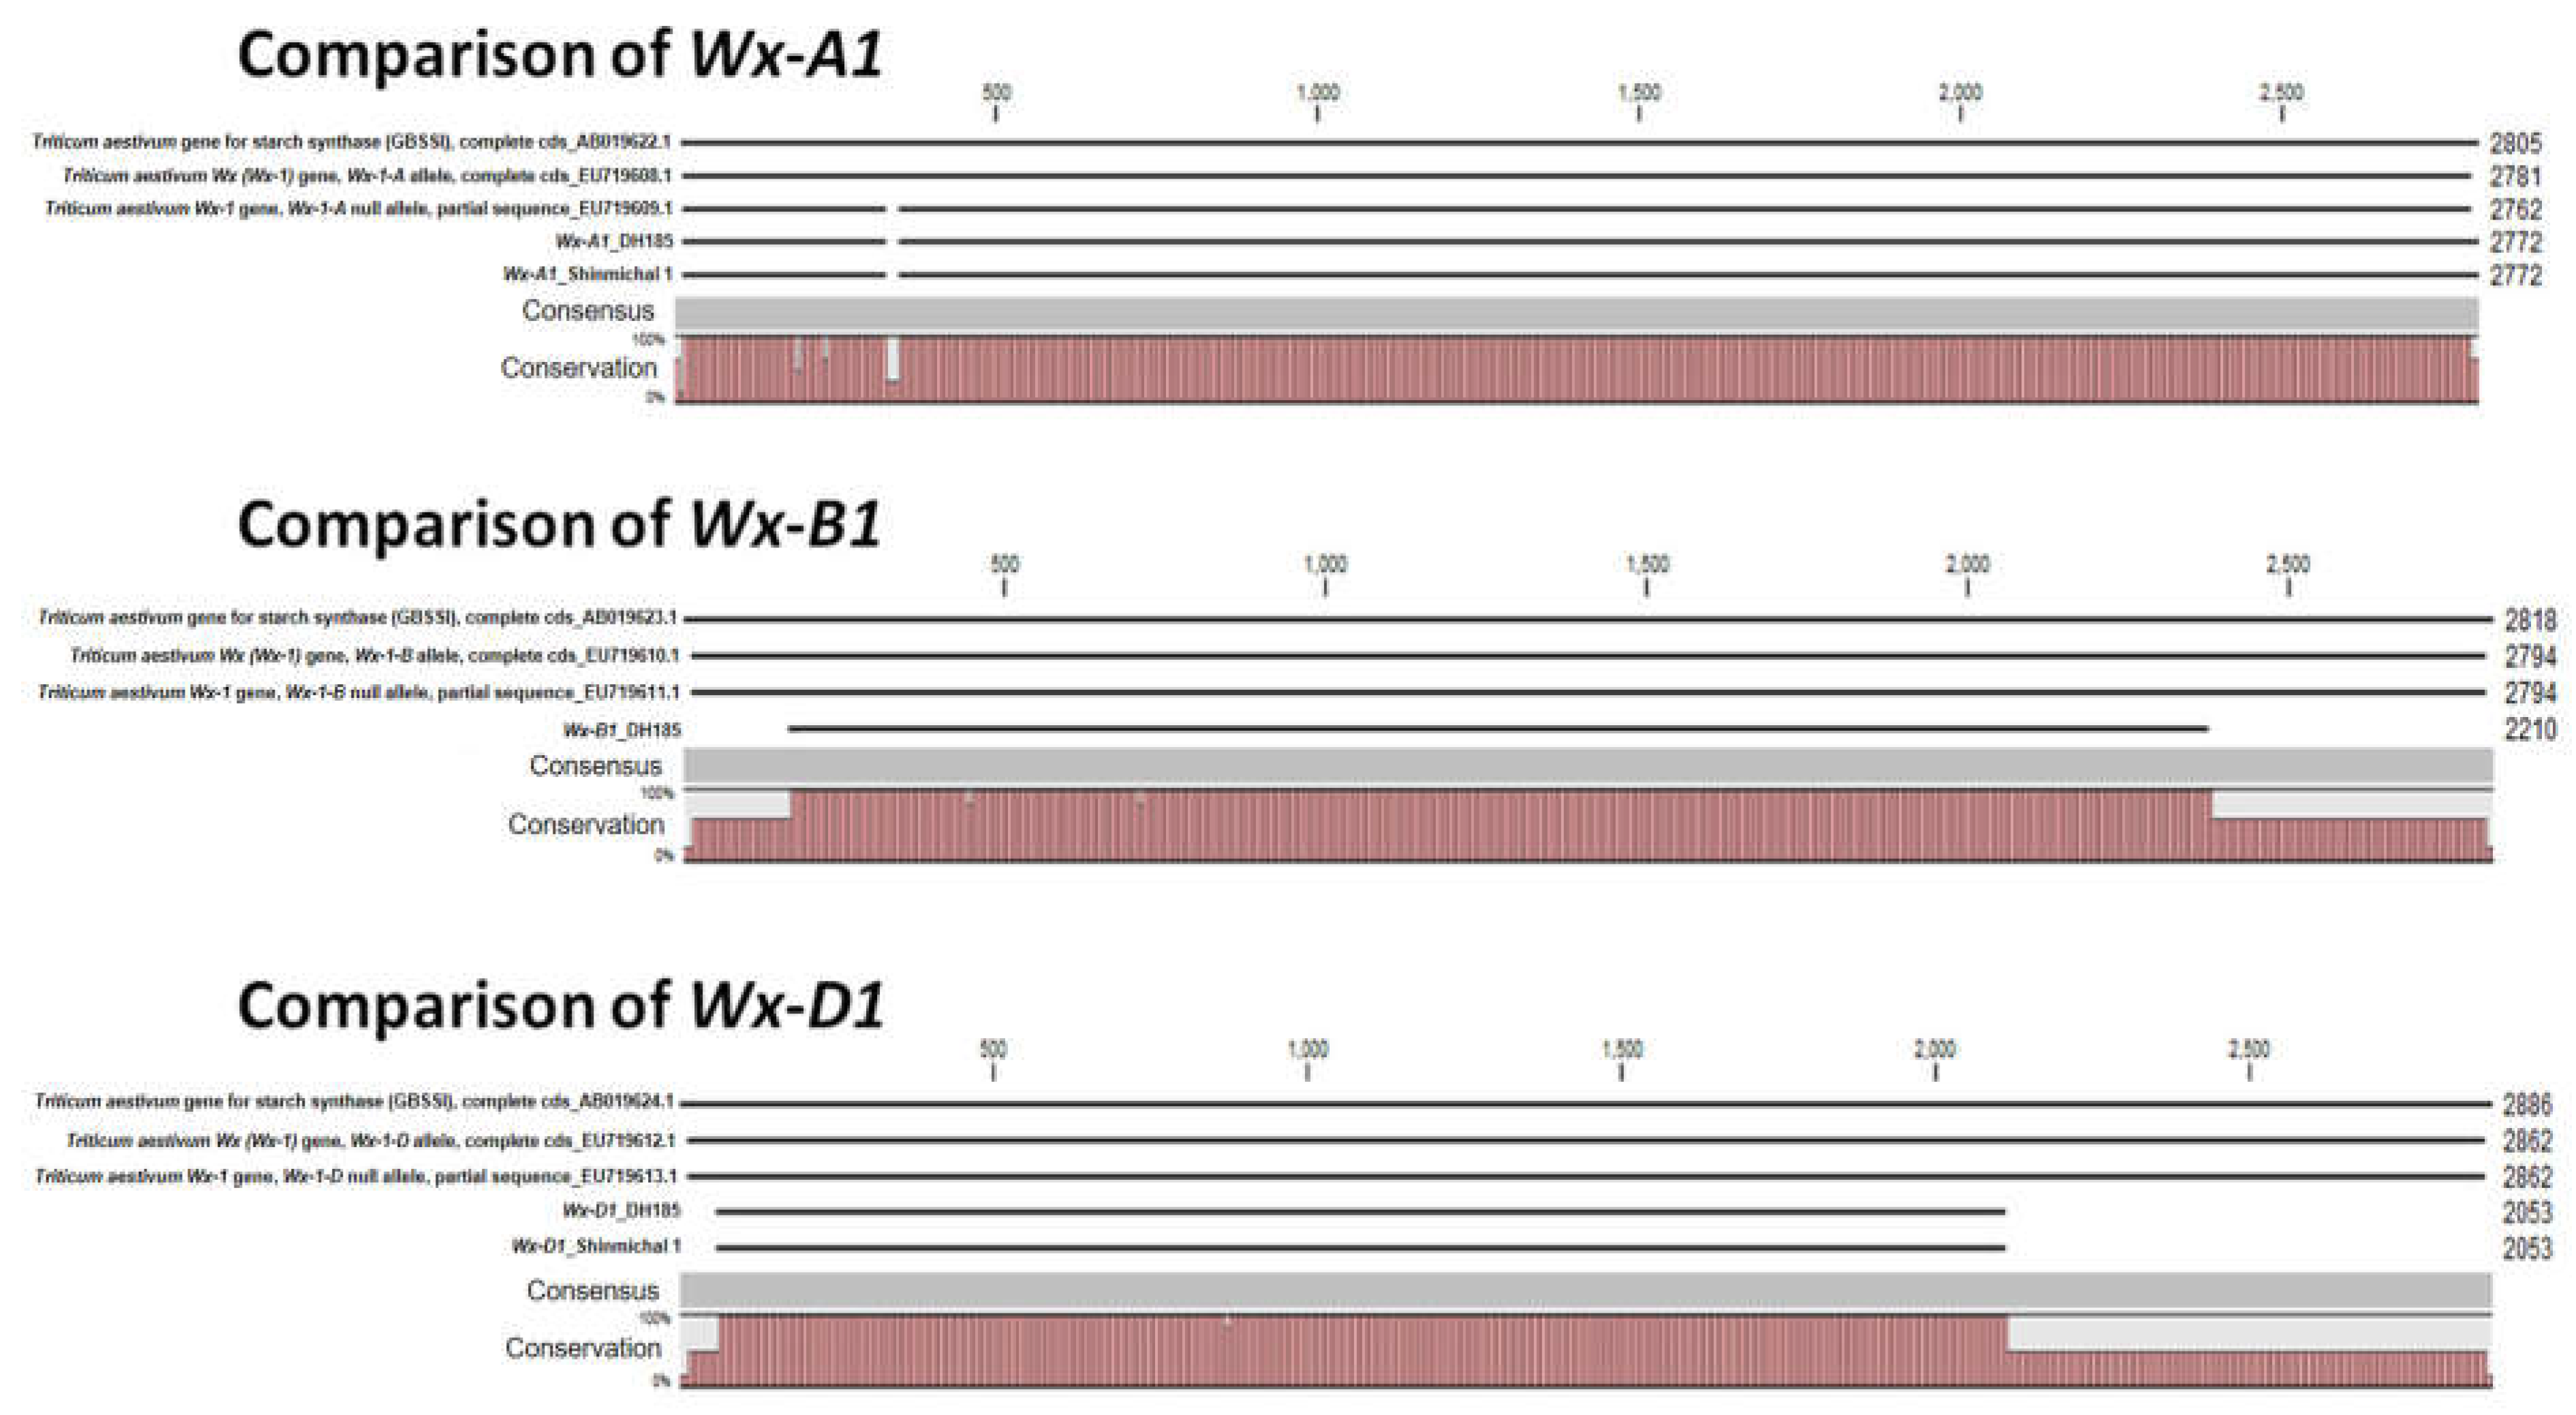
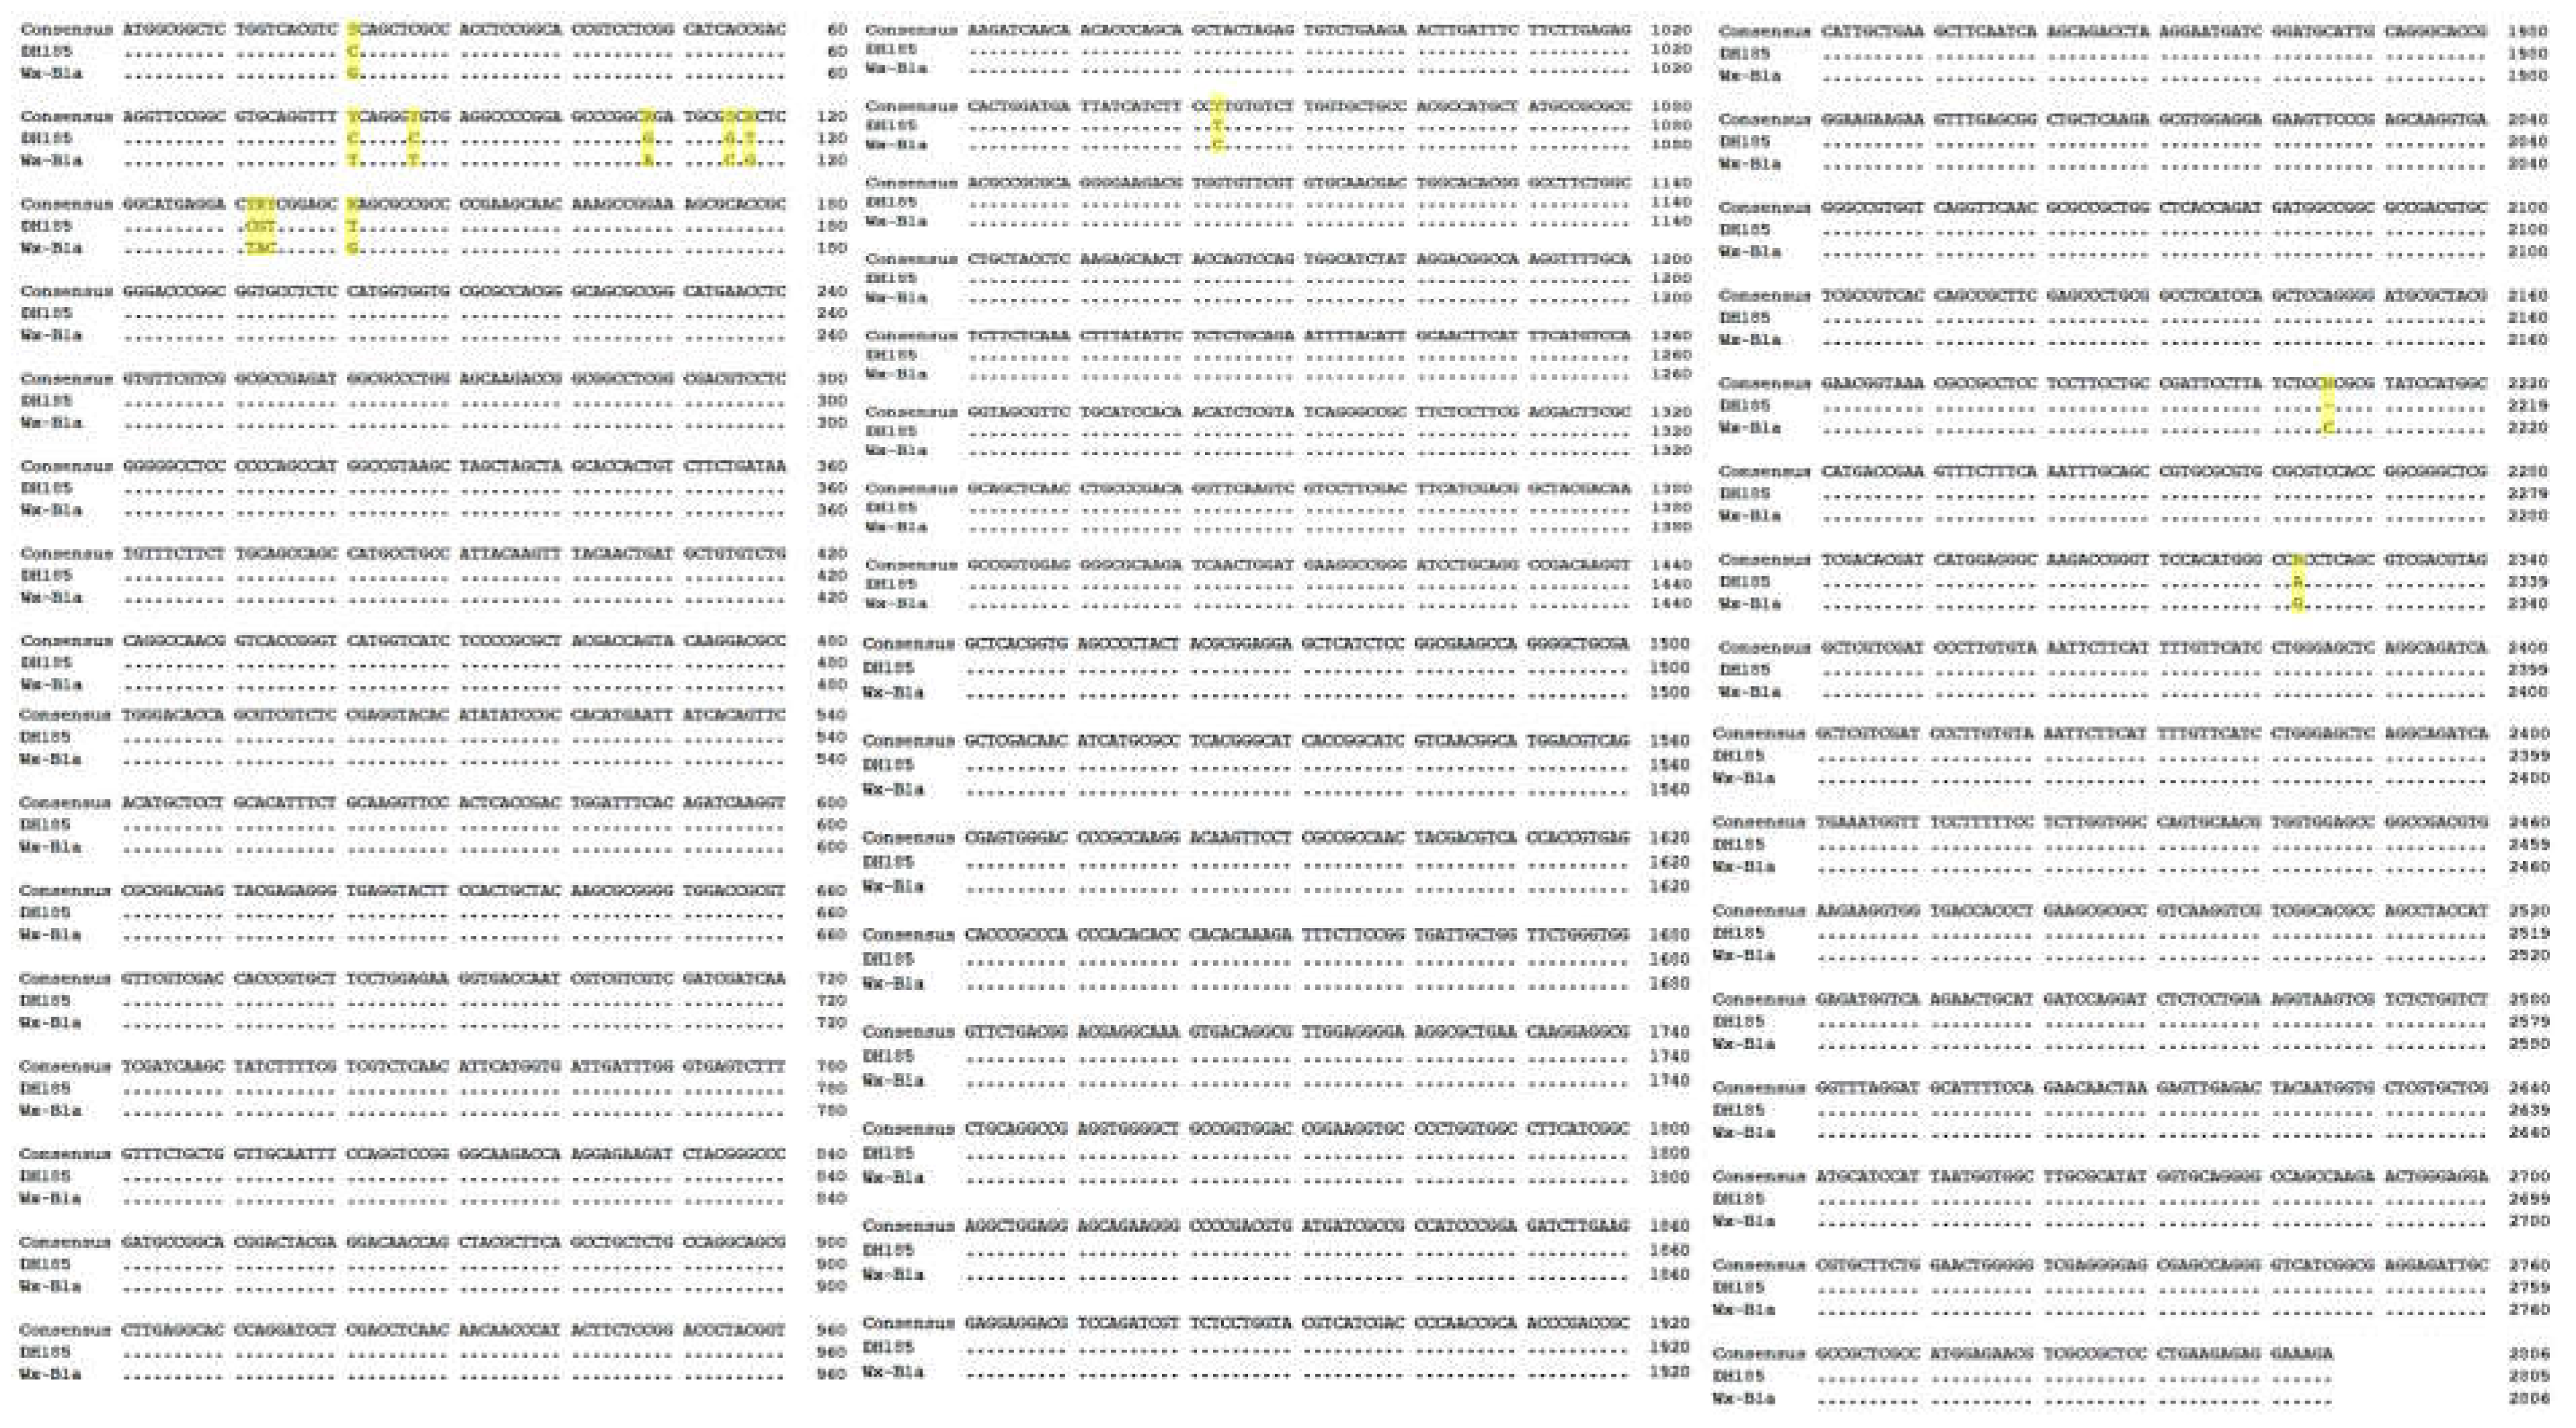
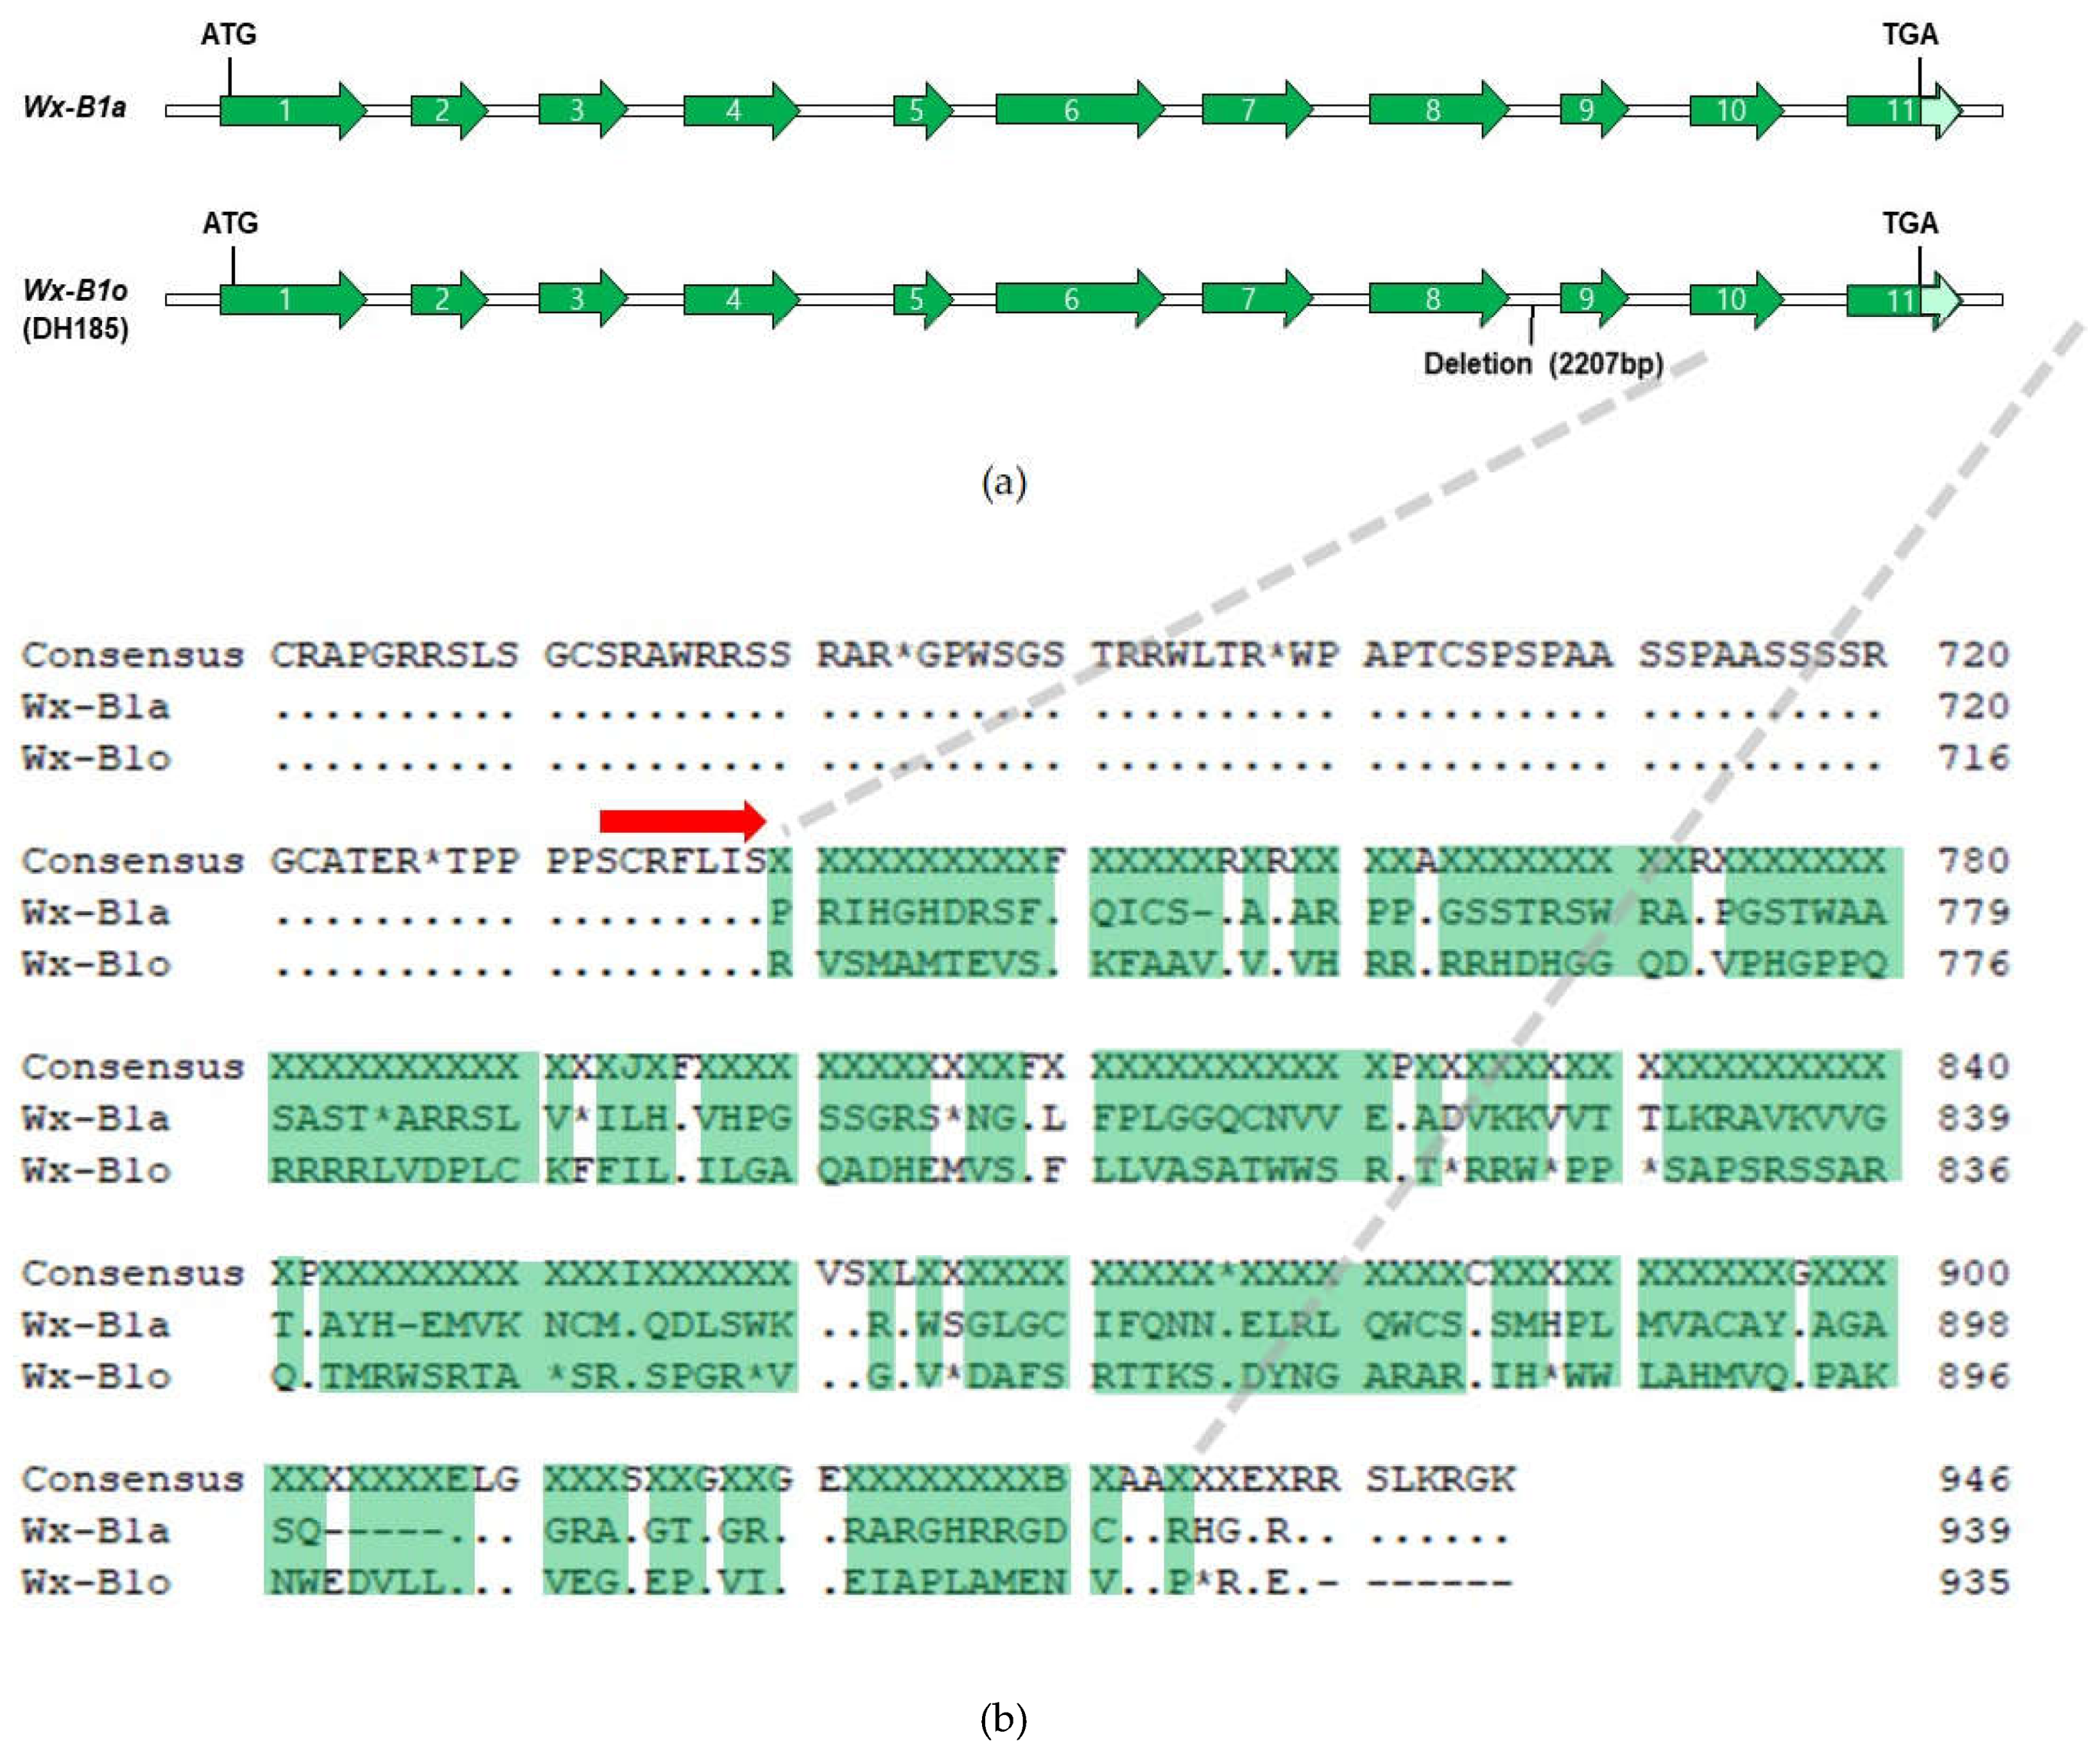
3.2. Sequence analysis of the waxy genes
3.3. Analysis of the flour characteristic and starch structure of the waxy-type mutant (Gunji-3) and parental wheat
3.3.1. Flour characteristics
3.3.2. Noodle dough sheet characteristics and texture of the cooked noodles.
3.3.3. Starch characteristics
4. Discussion
5. Conclusions
Acknowledgments
References
- FAOSTAT, F., Forestry Database. 2019.
- Jeon, J.S., et al., Starch biosynthesis in cereal endosperm. Plant Physiol Biochem, 2010. 48(6): p. 383-92.
- Seib, P.A., Reduced-amylose wheats and Asian noodles. Cereal Foods World, 2000. 45: p. 504-512.
- Yamamori, M., T. Nakamura, and A. Kuroda, Variations in the content of starch-granule bound protein among several Japanese cultivars of common wheat (Triticum aestivum L.). Euphytica, 1992. 64(3): p. 215-219.
- Clark, J.R., M. Robertson, and C.C. Ainsworth, Nucleotide sequence of a wheat (Triticum aestivum L.) cDNA clone encoding the waxy protein. Plant Mol Biol, 1991. 16(6): p. 1099-101.
- Briney, A., et al., A PCR-based marker for selection of starch and potential noodle quality in wheat. Molecular Breeding, 1998. 4(5): p. 427-433.
- Murai, J., T. Taira, and D. Ohta, Isolation and characterization of the three Waxy genes encoding the granule-bound starch synthase in hexaploid wheat. Gene, 1999. 234(1): p. 71-9.
- Yan, L., et al., The genes encoding granule-bound starch synthases at the waxy loci of the A, B, and D progenitors of common wheat. Genome, 2000. 43(2): p. 264-72.
- Vrinten, P., T. Nakamura, and M. Yamamori, Molecular characterization of waxy mutations in wheat. Mol Gen Genet, 1999. 261(3): p. 463-71.
- 1Guzman, C. and J.B. Alvarez, Wheat waxy proteins: polymorphism, molecular characterization and effects on starch properties. Theor Appl Genet, 2016. 129(1): p. 1-16.
- 1Araki, E., H. Miura, and S. Sawada, Differential effects of the null alleles at the three Wx loci on the starch-pasting properties of wheat. Theoretical and Applied Genetics, 2000. 100(7): p. 1113-1120.
- Yamamori, M., et al., Genetic elimination of a starch granule protein, SGP-1, of wheat generates an altered starch with apparent high amylose. Theoretical and Applied Genetics, 2000. 101(1): p. 21-29.
- Yamamori, M. and C. Guzmán, SNPs and an insertion sequence in five Wx-A1 alleles as factors for variant Wx-A1 protein in wheat. Euphytica, 2013. 192(3): p. 325-338.
- Ayala, M., et al., Molecular characterization of waxy alleles in three subspecies of hexaploid wheat and identification of two novel Wx-B1 alleles. Theor Appl Genet, 2015. 128(12): p. 2427-35.
- Guzmán, C., et al., Molecular characterization of two novel null waxy alleles in Mexican bread wheat landraces. Journal of Cereal Science, 2015. 62: p. 8-14.
- Nakamura, T., et al., Rapid classification of partial waxy wheats using PCR-based markers. Genome, 2002. 45(6): p. 1150-6.
- Seo, Y.-W., B.-H. Hong, and Y.-W. Ha, Identification of granule bound starch synthase (GBSS) isoforms in wheat. KOREAN JOURNAL OF CROP SCIENCE, 1998. 43(2): p. 89-94.
- Jegasothy, H., M. Wootton, and R.J. Fairclough, Agarose gel electrophoresis of wheat starch. Journal of Cereal Science, 2000. 31(1): p. 75-78.
- Guzmán, C. and J.B. Alvarez, Molecular characterization of a novel waxy allele (Wx-A u 1a) from Triticum urartu Thum. ex Gandil. Genetic resources and crop evolution, 2012. 59: p. 971-979.
- Kearse, M., et al., Geneious Basic: An integrated and extendable desktop software platform for the organization and analysis of sequence data. Bioinformatics, 2012. 28(12): p. 1647-1649.
- Camacho, C., et al., BLAST plus : architecture and applications. Bmc Bioinformatics, 2009. 10.
- Dubat, A., A new AACC International approved method to measure rheological properties of a dough sample. Cereal Foods World (CFW), 2010. 55(3): p. 150.
- Nguimbou, R.M., et al., Effect of Cross-Section Differences and Drying Temperature on the Physicochemical, Functional and Antioxidant Properties of Giant Taro Flour. Food and Bioprocess Technology, 2013. 6(7): p. 1809-1819.
- Gibson, T.S., V.A. Solah, and B.V. McCleary, A procedure to measure amylose in cereal starches and flours with concanavalin A. Journal of Cereal Science, 1997. 25(2): p. 111-119.
- Gibson, T.S., H. Alqalla, and B.V. Mccleary, An Improved Enzymatic Method for the Measurement of Starch Damage in Wheat-Flour. Journal of Cereal Science, 1992. 15(1): p. 15-27.
- McCleary, B.V., T.S. Gibson, and D.C. Mugford, Measurement of total starch in cereal products by amyloglucosidase-alpha-amylase method: Collaborative study. Journal of Aoac International, 1997. 80(3): p. 571-579.
- Douglas, S.G., A rapid method for the determination of pentosans in wheat flour. Food Chemistry, 1981. 7(2): p. 139-145.
- Czuchajowska, Z. and Y. Pomeranz, Protein-Concentrates and Prime Starch from Wheat Flours. Cereal Chemistry, 1993. 70(6): p. 701-706.
- Kasemsuwan, T., et al., Characterization of the Dominant Mutant Amylose-Extender (Ael-5180) Maize Starch. Cereal Chemistry, 1995. 72(5): p. 457-464.
- Sollars, W.F., Fractionation and reconstitution techniques for studying water-retention properties of wheat flours. 1973.
- Yamamori, M., et al., Resistant starch and starch pasting properties of a starch synthase IIa-deficient wheat with apparent high amylose. Australian Journal of Agricultural Research, 2006. 57(5): p. 531-535.
- Sasaki, T. and J. Matsuki, Effect of wheat starch structure on swelling power. Cereal Chemistry, 1998. 75(4): p. 525-529.
- Hayakawa, K., et al., Quality characteristics of waxy hexaploid wheat (Triticum aestivum L.): Properties of starch gelatinization and retrogradation. Cereal Chemistry, 1997. 74(5): p. 576-580.
- Park, C.S. and B.K. Baik, Flour characteristics related to optimum water absorption of noodle dough for making white salted noodles. Cereal Chemistry, 2002. 79(6): p. 867-873.
- Park, C.S., B.H. Hong, and B.K. Baik, Protein quality of wheat desirable for making fresh white salted noodles and its influences on processing and texture of noodles. Cereal Chemistry, 2003. 80(3): p. 297-303.
- Trethowan, R.M. and A. Mujeeb-Kazi, Novel germplasm resources for improving environmental stress tolerance of hexaploid wheat. Crop science, 2008. 48(4): p. 1255-1265.
- Van Hung, P., et al., Waxy and high-amylose wheat starches and flours—characteristics, functionality and application. 2006. 17(8): p. 448-456.
- Zeng, M., et al., Sources of variation for starch gelatinization, pasting, and gelation properties in wheat. Cereal Chemistry, 1997. 74(1): p. 63-71.
- Fredriksson, H., et al., The influence of amylose and amylopectin characteristics on gelatinization and retrogradation properties of different starches. Carbohydrate polymers, 1998. 35(3-4): p. 119-134.
- Nakamura, T., et al., Identification of three Wx proteins in wheat (Triticum aestivum L.). Biochemical genetics, 1993. 31: p. 75-86.
- Graybosch, R.A., Waxy wheats: Origin, properties, and prospects. Trends in Food Science & Technology, 1998. 9(4): p. 135-142.
- Zhang, K., et al., Effect of different starch acetates on the quality characteristics of frozen cooked noodles. 2022. 10(3): p. 678-688.
- Ragaee, S. and E.-S.M.J.F.c. Abdel-Aal, Pasting properties of starch and protein in selected cereals and quality of their food products. 2006. 95(1): p. 9-18.
- Singh, S., et al., Relationship of granule size distribution and amylopectin structure with pasting, thermal, and retrogradation properties in wheat starch. 2010. 58(2): p. 1180-1188.
- Heo, H., et al., Influence of amylose content on cooking time and textural properties of white salted noodles. 2012. 21: p. 345-353.
- Huang, Y.-C. and H.-M.J.J.o.F.E. Lai, Noodle quality affected by different cereal starches. 2010. 97(2): p. 135-143.
- Van Hung, P., T. Maeda, and N. Morita, Waxy and high-amylose wheat starches and flours—characteristics, functionality and application. Trends in Food Science & Technology, 2006. 17(8): p. 448-456.
- Heo, H., et al., A new waxy wheat cultivar" Shinmichal1" with stress tolerance. 2007. 39(3): p. 385-386.
- Li, Q., et al., A molecular explanation of wheat starch physicochemical properties related to noodle eating quality. 2020. 108: p. 106035.
- Abdel-Aal, E.S., et al., Physicochemical and structural characteristics of flours and starches from waxy and nonwaxy wheats. 2002. 79(3): p. 458-464.
- Crosbie, G.J.J.o.c.s., The relationship between starch swelling properties, paste viscosity and boiled noodle quality in wheat flours. 1991. 13(2): p. 145-150.
- Konik, C.M., et al., Contribution of starch and non-starch parameters to the eating quality of Japanese white salted noodles. 1992. 58(3): p. 403-406.
- McCormick, K., J. Panozzo, and S.J.A.J.o.A.R. Hong, A swelling power test for selecting potential noodle quality wheats. 1991. 42(3): p. 317-323.
- Oh, N., et al., Starch damage on the quality characteristics of dry noodles'. 1985. 62(6): p. 441-446.
- De Villiers, O., E.J.S.A.J.o.P. Laubscher, and Soil, Use of the SDSS test to predict the protein content and bread volume of wheat cultivars. 1995. 12(4): p. 140-142.
- Oh, N., et al., Noodles. V. Determination of optimum water absorption of flour to prepare oriental noodles. 1986. 63(2): p. 93-96.
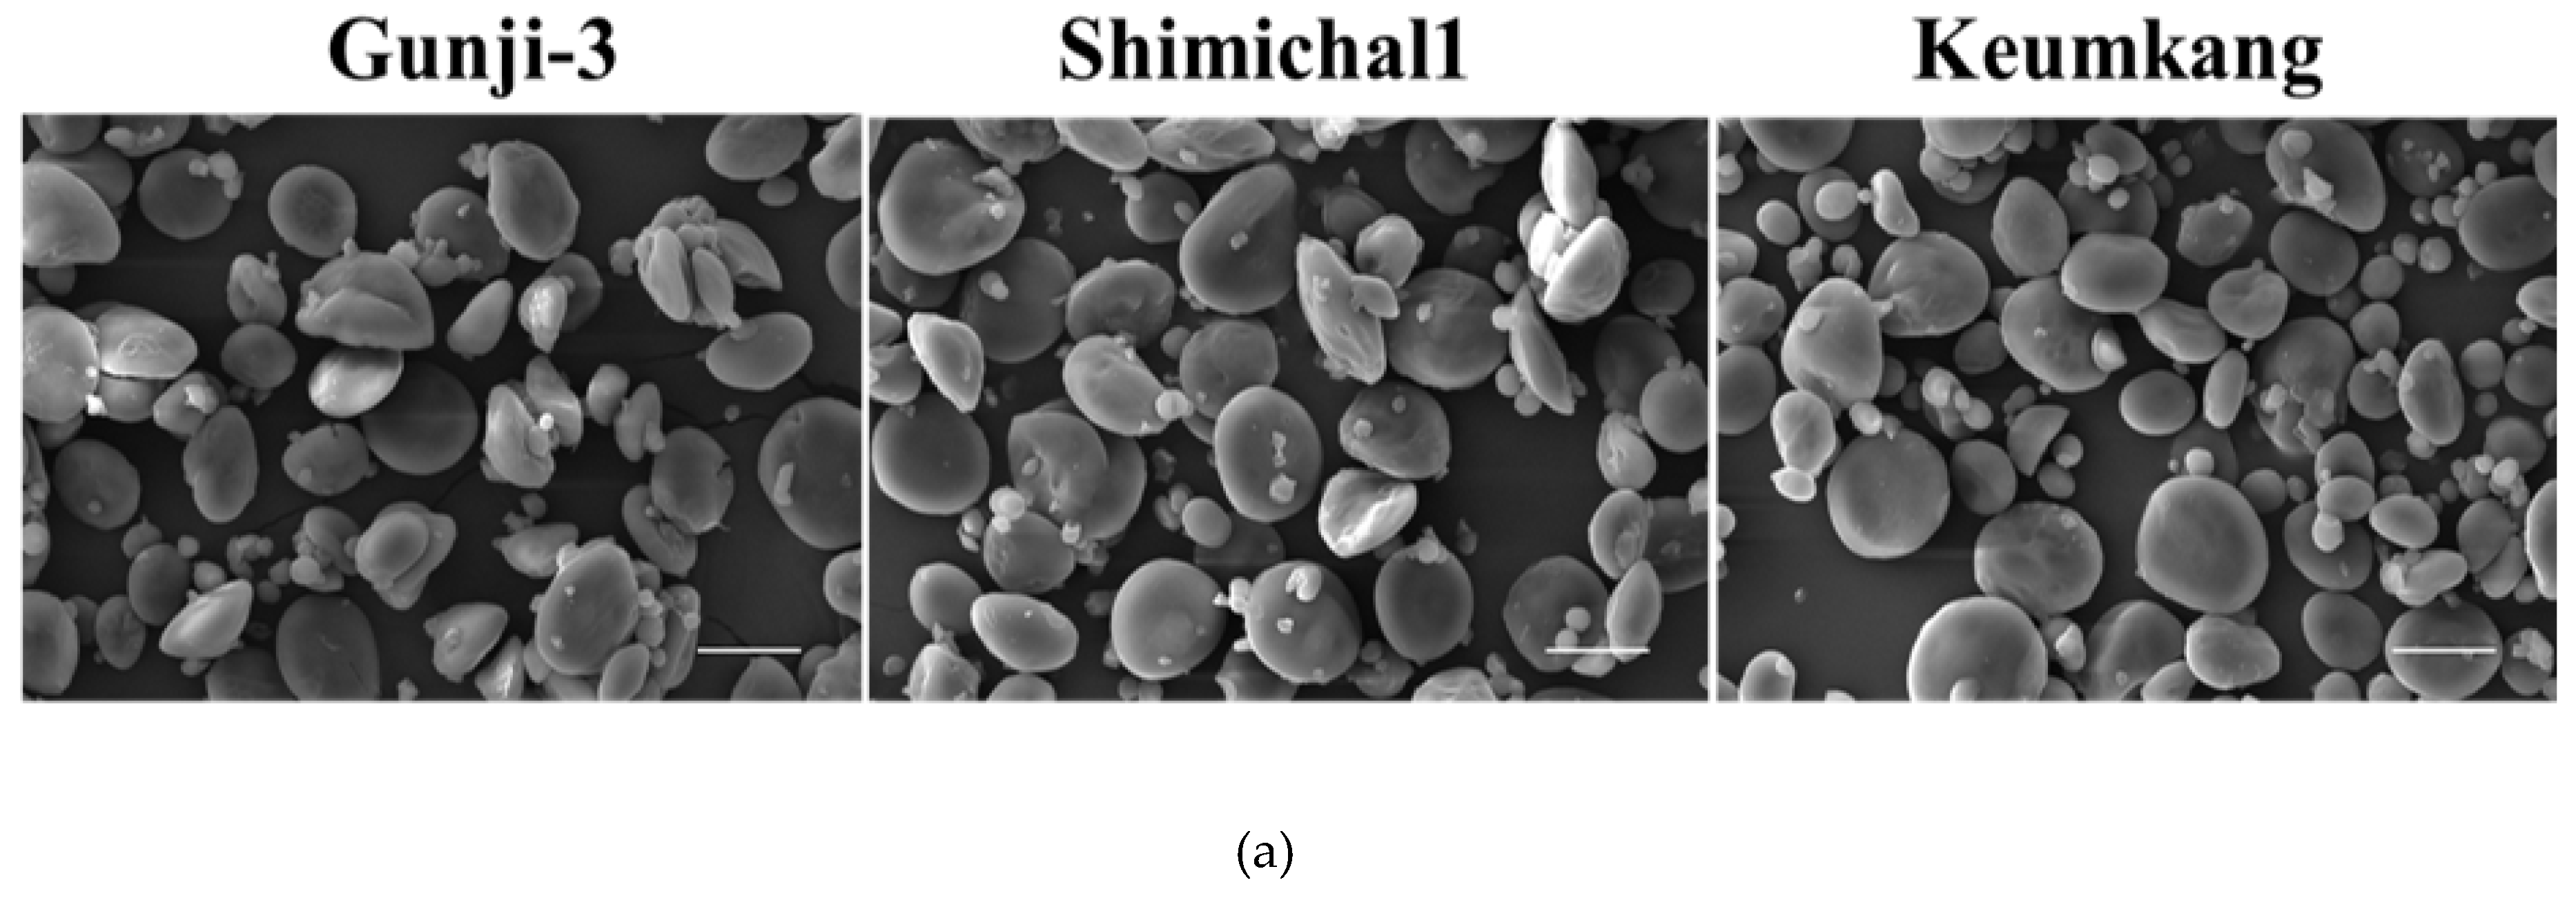
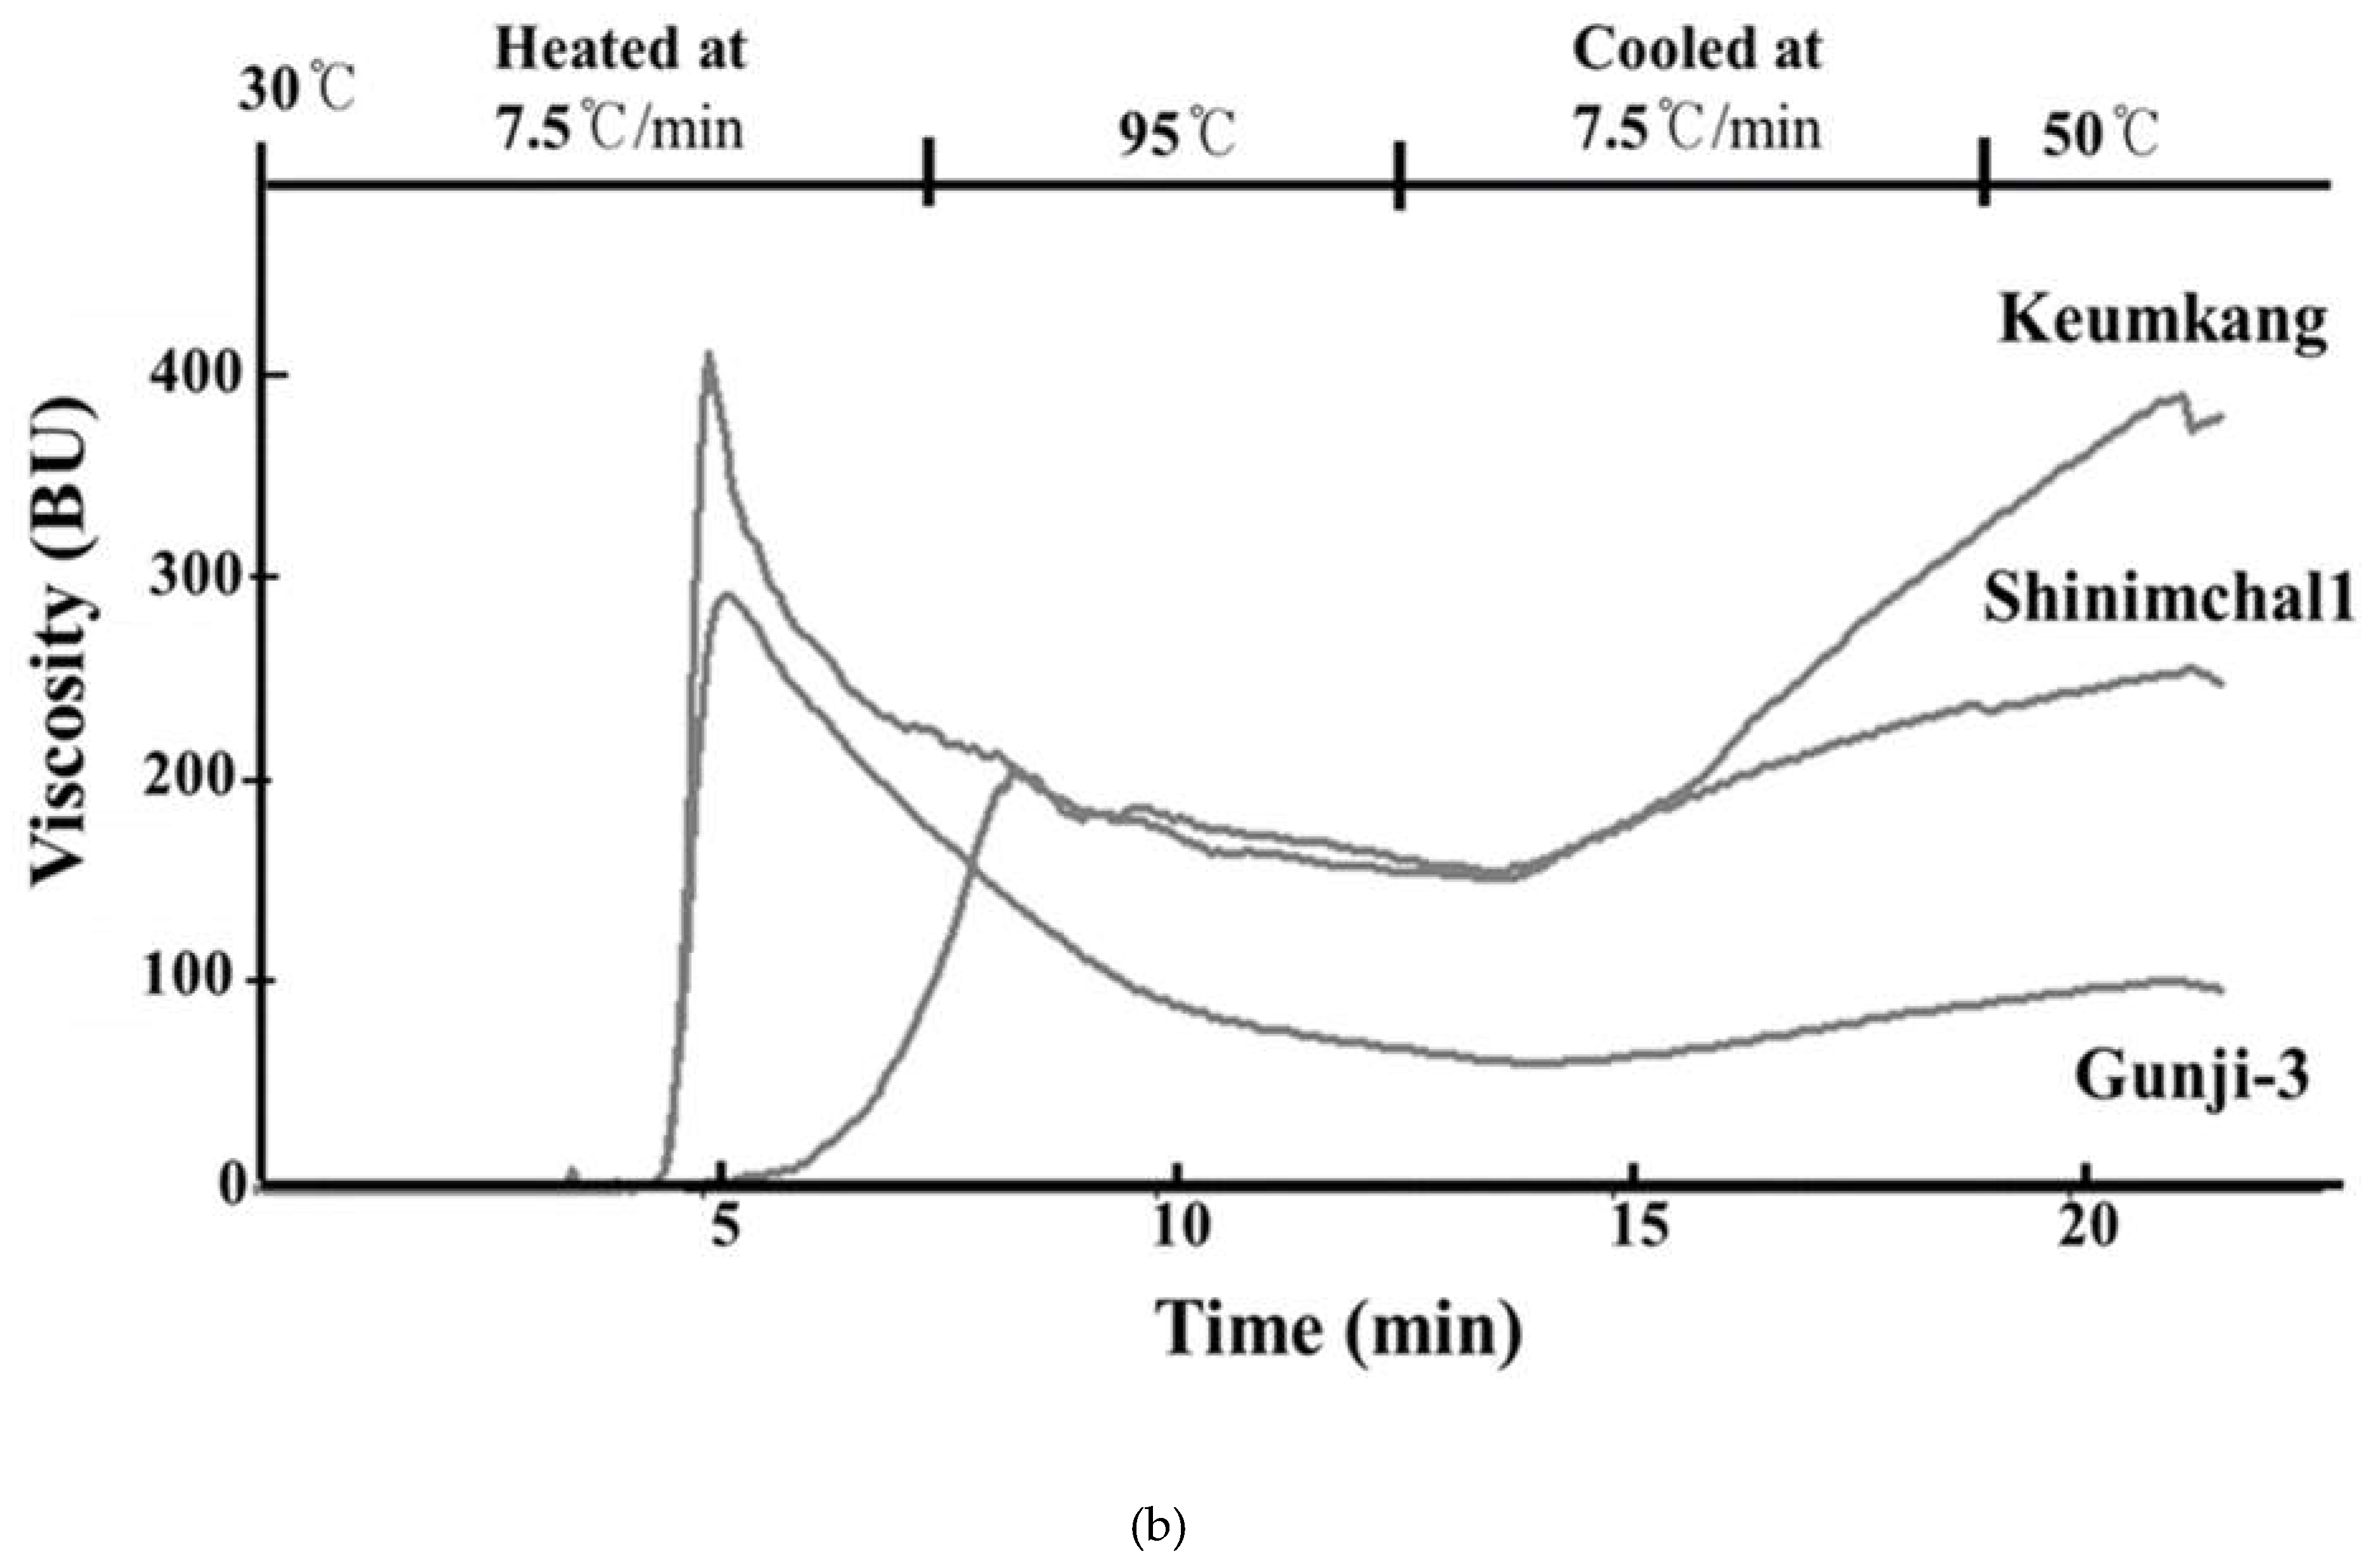
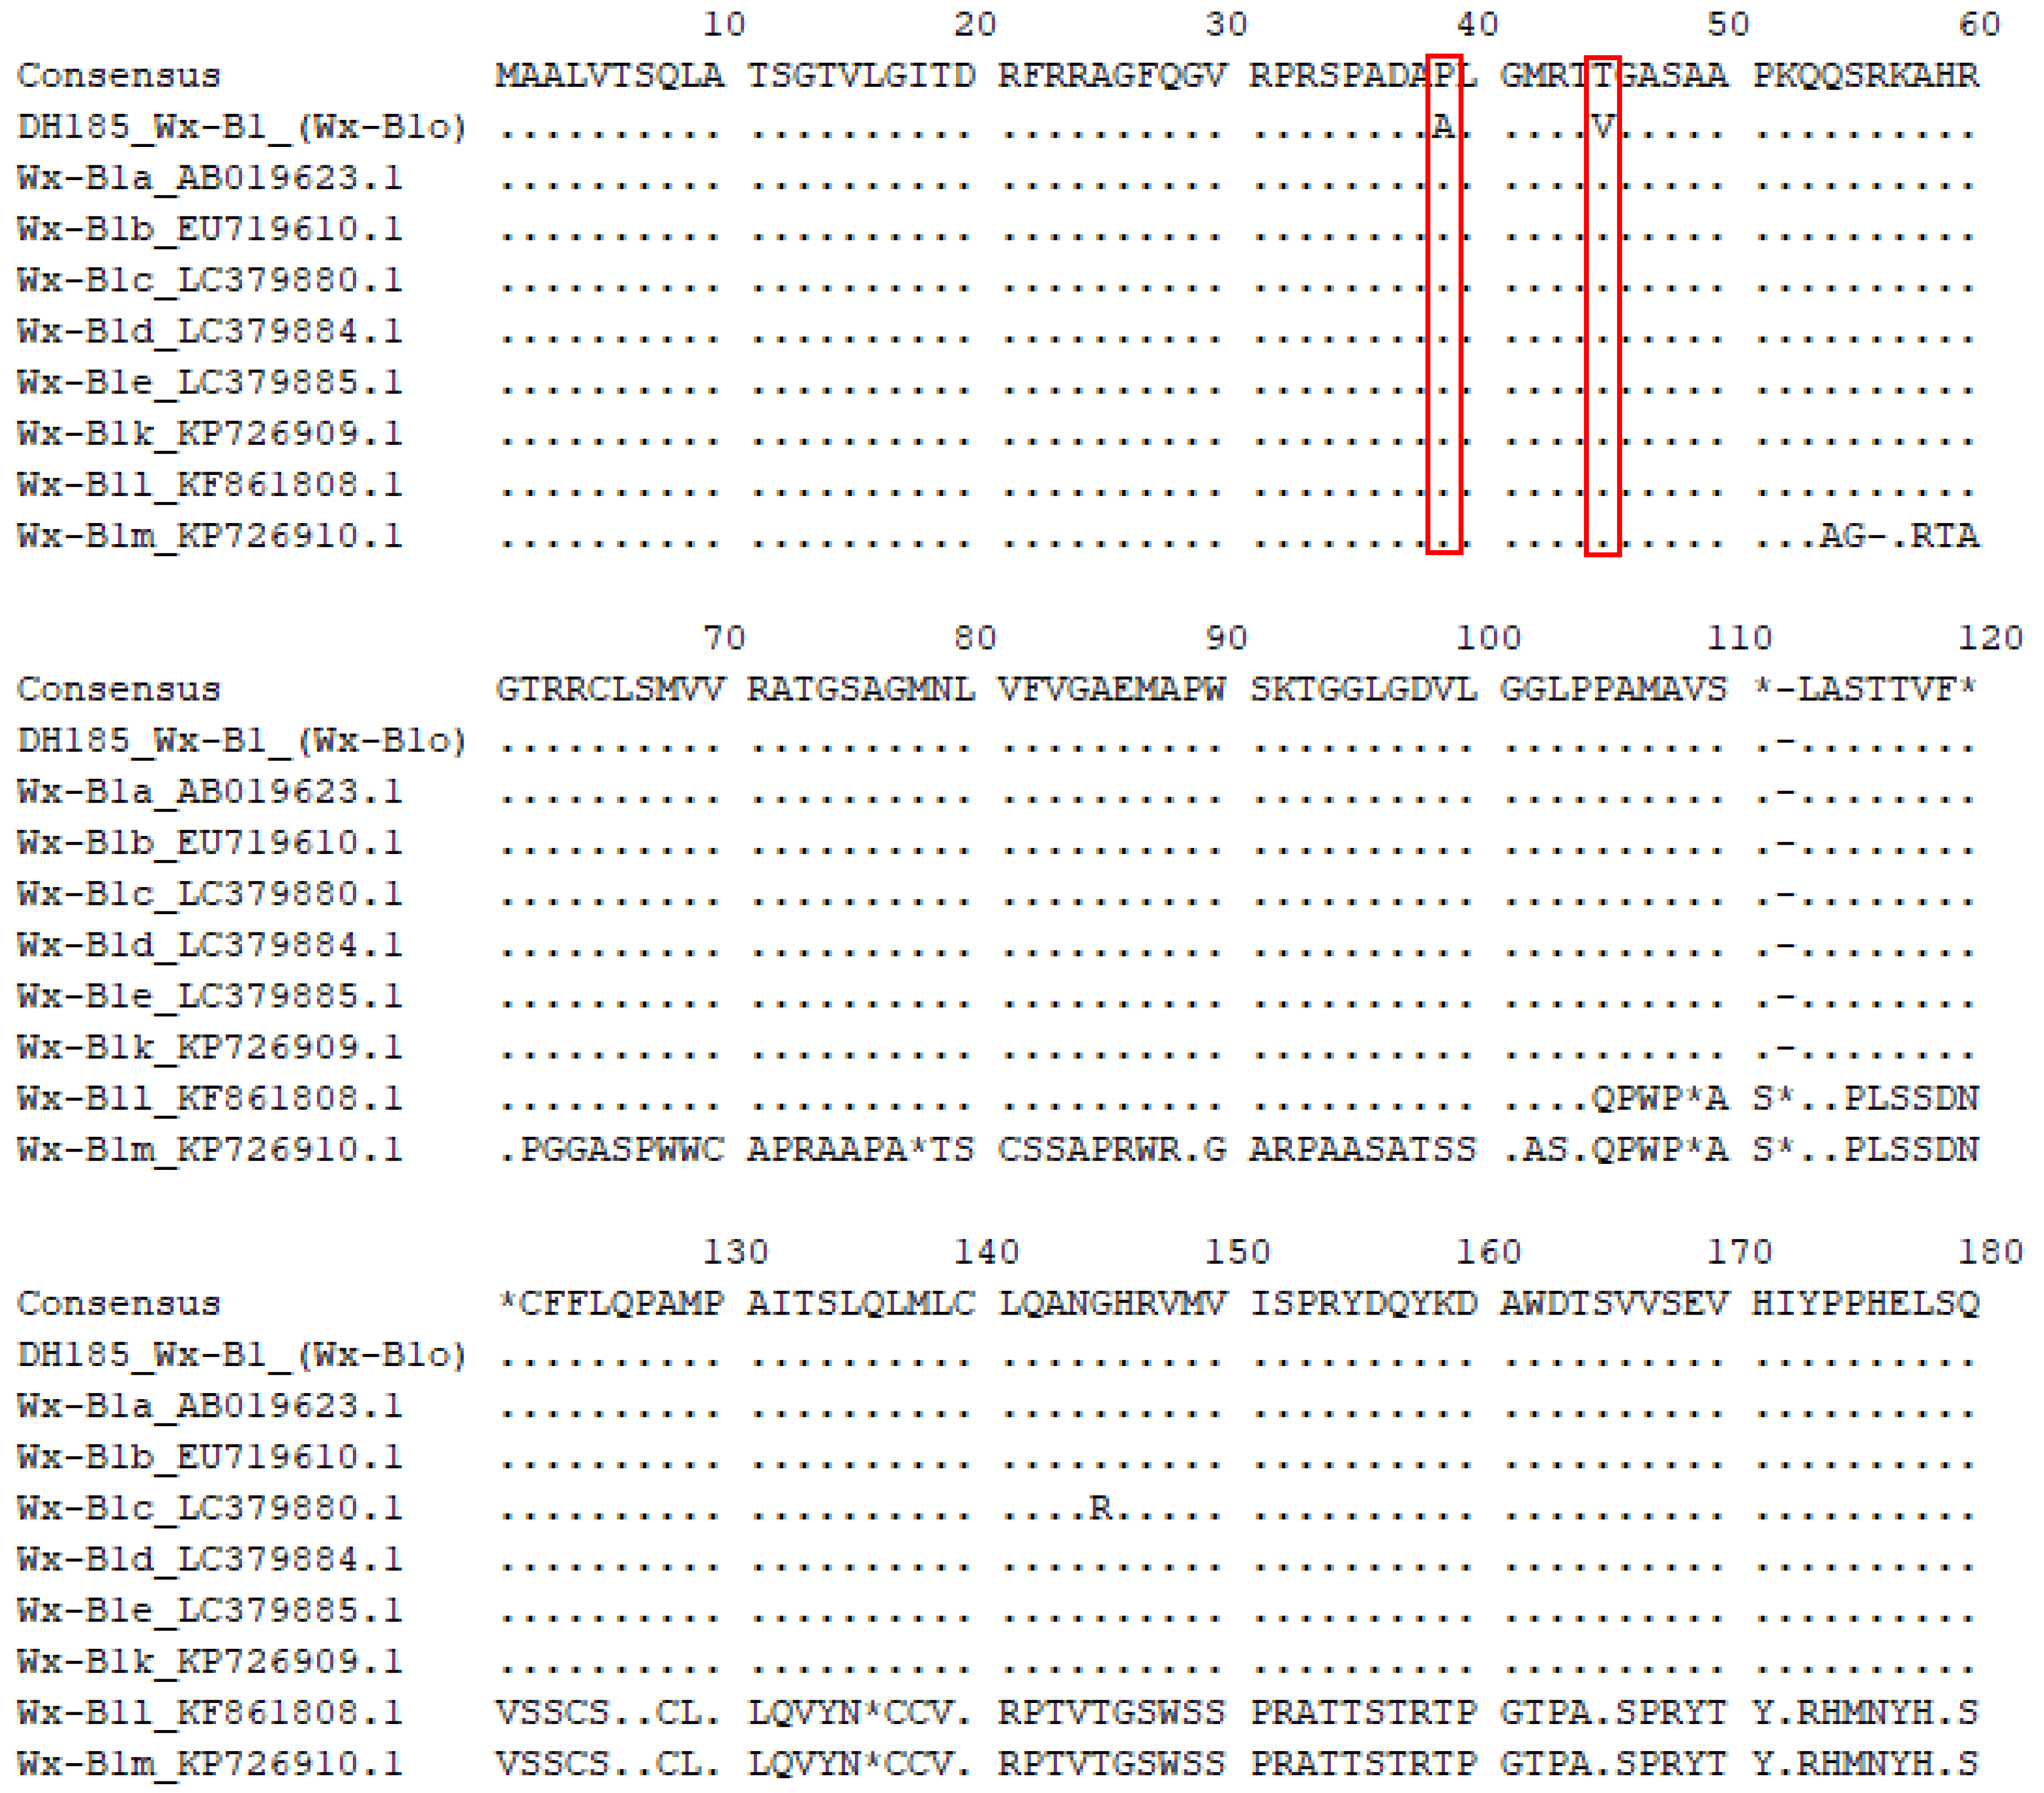
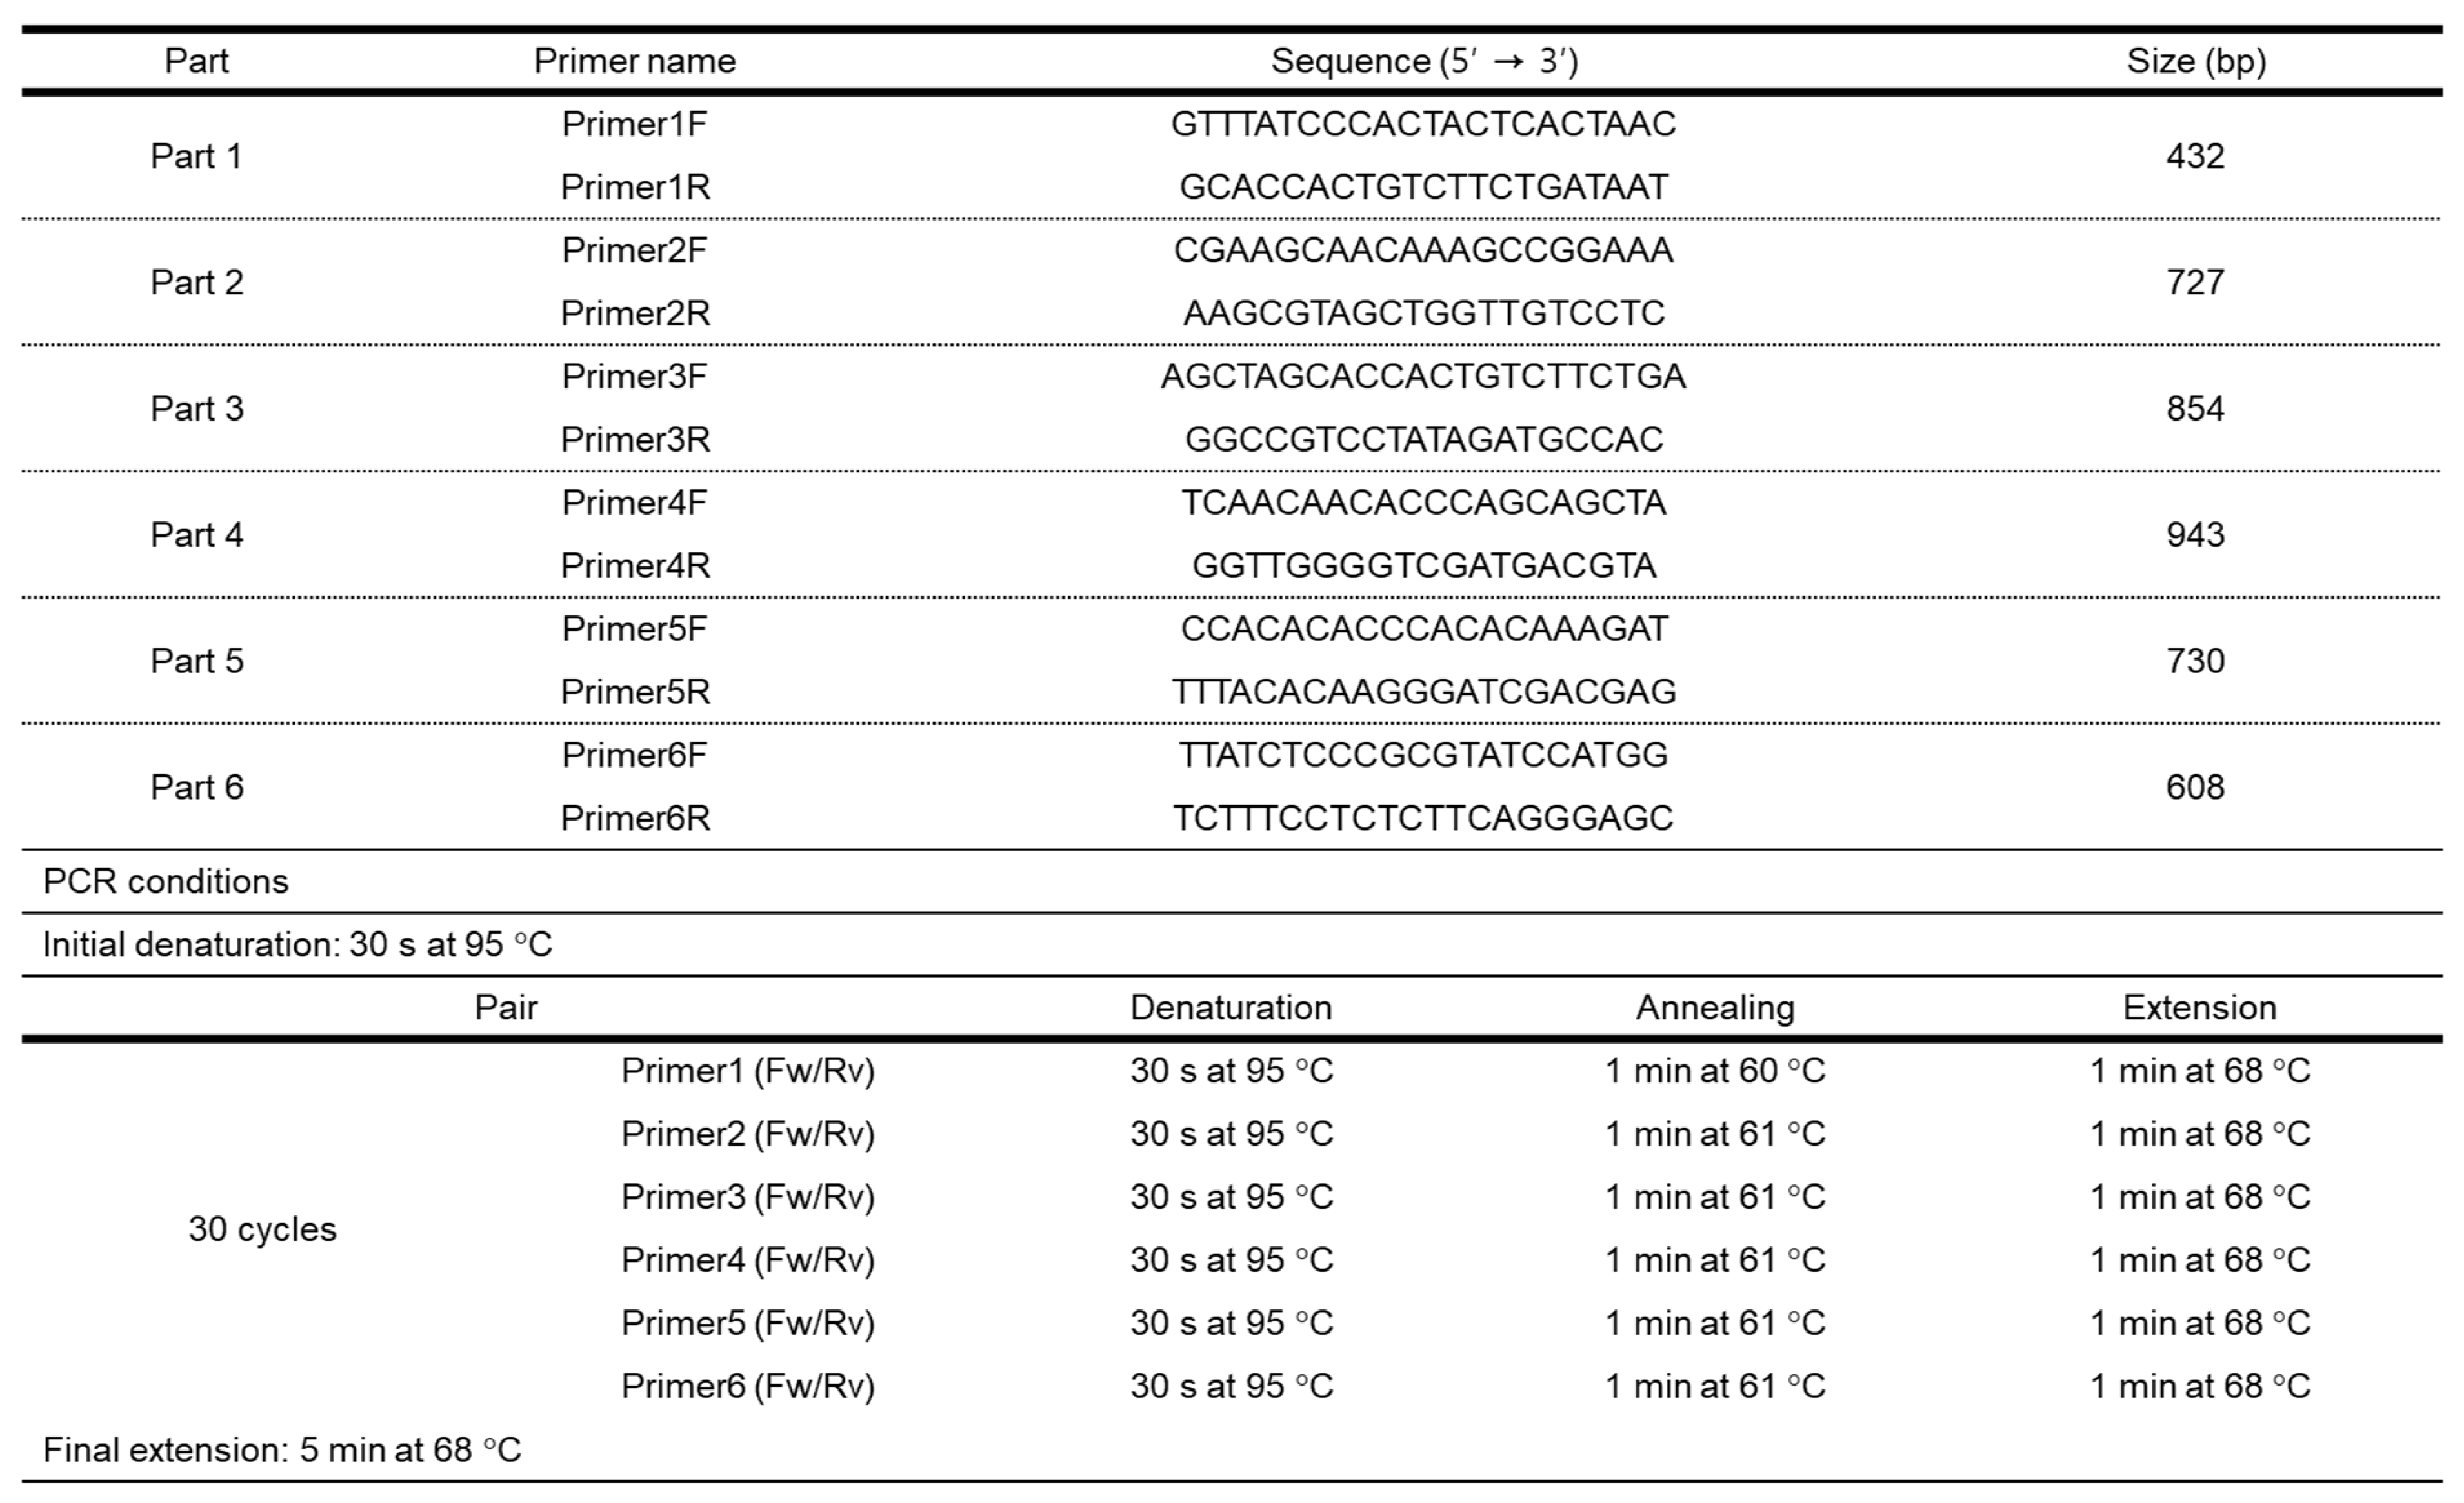
| Characteristics | Gunji-3 | Shinmichal 1 | Keumkang | |
|---|---|---|---|---|
| Starch Granule Size (µm) | ||||
| A-type | 19.43 ± 0.39b | 22.17 ± 0.74a | 20.33 ± 0.88b | |
| B-type | 4.17 ± 0.06a | 4.09 ± 0.12a | 4.22 ± 0.22a | |
| Amylose (%) | 2.30 ± 0.15c | 7.45 ± 0.05b | 27.67 ± 0.26a | |
| Cold water retention capacity (%) | 84.66 ± 1.05a | 75.91 ± 0.69b | 66.07 ± 1.05c | |
| Swelling properties | ||||
| Swelling volume (ml) | 8.30 ± 0.11a | 8.40 ± 0.10a | 4.23 ± 0.06b | |
| Swelling power (g) | 19.43 ± 0.06a | 18.35 ± 0.04b | 9.82 ± 0.07c | |
| Pasting properties | ||||
| Gelatinization Tm (℃) | 64.97 ± 0.12b | 64.13 ± 0.71b | 75.10 ± 0.17a | |
| Peak viscosity (BU) | 295.00 ± 1.00b | 403.33 ± 1.53a | 208.33 ± 1.00c | |
| Tm at Peak viscosity (℃) | 69.87 ± 0.21b | 67.27 ± 0.50c | 92.77 ± 0.38a | |
| Holding strength (BU) | 63.33 ± 2.08c | 159.00 ± 1.00a | 145.33 ± 2.52b | |
| Final viscosity (BU) | 94.33 ± 1.53c | 243.67 ± 2.08b | 336.67 ± 2.52a | |
| Breakdown (BU) | 231.67 ± 2.89b | 244.33 ± 2.31a | 63.00 ± 2.00c | |
| Setback (BU) | 31.00 ± 1.00c | 84.67 ± 1.53b | 191.33 ± 4.62a | |
| Gel hardness (N) | 0.38 ± 0.01b | 0.49 ± 0.03b | 17.56 ± 0.23a | |
| X-ray diffraction | ||||
| Patterns | A | A | A | |
| Degree of crystallinity (%) | 18.68 ± 0.16a | 17.40 ± 0.24a | 11.92 ± 0.01b | |
| Gelatinization characteristicsb | ||||
| Onset temperature (°C, To) | 57.91 ± 1.20a | 56.95 ± 0.47ab | 54.80 ± 1.36b | |
| Peak temperature (°C, Tp) | 64.08 ± 0.11a | 64.04 ± 0.10a | 59.71 ± 0.21b | |
| Transition enthalpy (J/g, ΔH) | 146.19 ± 0.32a | 143.60 ± 5.74a | 124.68 ± 0.32b |
| Characteristics | Gunji-3 | Shinmichal 1 | Keumkang | |
|---|---|---|---|---|
| Flour yield (%) | 71.23 ± 0.74b | 63.60 ± 0.08c | 73.43 ± 0.02a | |
| Ash (%) | 0.43 ± 0.01a | 0.44 ± 0.01a | 0.45 ± 0.01a | |
| Whiteness index | 89.86 ± 0.06ab | 90.02 ± 0.07a | 88.44 ± 0.06b | |
| Average of particle size (μm) | 79.77 ± 0.46a | 81.73 ± 1.67a | 77.61 ± 0.66b | |
| Total starch (%) | 70.82 ± 0.24b | 72.13 ± 0.19a | 72.16 ± 0.16a | |
| Damaged starch (%) | 4.01 ± 0.01a | 4.12 ± 0.06a | 3.96 ± 0.02a | |
| Arabinoxylan (%) | 1.74 ± 0.01b | 1.87 ± 0.01a | 1.55 ± 0.04c | |
| Protein (%) | 15.27 ± 0.15a | 11.19 ± 0.14c | 13.27 ± 0.15b | |
| SDS-sedimentation volume (mL) | 53.67 ± 0.58a | 39.50 ± 0.50b | 59.50 ± 0.50a | |
| Mixograph absorption (%) | 64.33 ± 0.58a | 65.00 ± 1.00a | 65.17 ± 0.29a | |
| Mixing time (min) | 2.40 ± 0.10b | 2.60 ± 0.01b | 4.03 ± 0.06a | |
| Mixing tolerance (mm) | 19.67 ± 0.58b | 21.67 ± 0.58b | 24.67 ± 1.53a |
| Characteristics | Gunji-3 | Shinmichal 1 | Keumkang | |
|---|---|---|---|---|
| Noodle dough sheet | ||||
| Water absorption (%) | 41.00a | 37.00b | 34.00c | |
| Thickness (mm) | 1.80 ± 0.03b | 1.88 ± 0.01a | 1.89 ± 0.02a | |
| Whiteness index | 76.01 ± 0.01b | 77.76 ± 0.01a | 76.01 ± 0.01b | |
| Texture of cooked noodles | ||||
| Hardness (N) | 1.07 ± 0.01c | 1.55 ± 0.11b | 3.35 ± 0.11b | |
| Springiness (Ratio) | 0.83 ± 0.01b | 0.85 ± 0.02b | 0.88 ± 0.02a | |
| Cohesiveness (Ratio) | 0.63 ± 0.01c | 0.70 ± 0.01a | 0.66 ± 0.01b |
Disclaimer/Publisher’s Note: The statements, opinions and data contained in all publications are solely those of the individual author(s) and contributor(s) and not of MDPI and/or the editor(s). MDPI and/or the editor(s) disclaim responsibility for any injury to people or property resulting from any ideas, methods, instructions or products referred to in the content. |
© 2023 by the authors. Licensee MDPI, Basel, Switzerland. This article is an open access article distributed under the terms and conditions of the Creative Commons Attribution (CC BY) license (http://creativecommons.org/licenses/by/4.0/).


