Submitted:
18 May 2023
Posted:
22 May 2023
You are already at the latest version
Abstract
Keywords:
1. Introduction
1.1. Background
1.2. Research Objectives
2. Materials and Methods
2.1. Computational Fluid Dynamics Studies
2.1.1. CFD Geometries
2.1.2. CFD Meshes

2.1.3. CFD Turbulence Method and Flow Conditions


2.2. Finite Element Analysis Studies
2.2.1. FEA Geometry
2.2.2. Material Properties


2.2.3. FEA Meshes
2.2.4. Load and Boundary Conditions
2.3. Wind Tunnel Experiments
2.3.1. Aerodynamic Center Finding Procedure.
2.3.2. Lift, Drag, and Moment Measurements
2.3.3. Elevon effectiveness and Trimming Procedure
2.3.4. Thrust Experiment
3. Results and Discussion
3.1. CFD Aerodynamic Results
3.2. FEA Results
3.3. Experimental Results


4. Conclusions
Author Contributions
Funding
Data Availability Statement
Acknowledgments
Conflicts of Interest
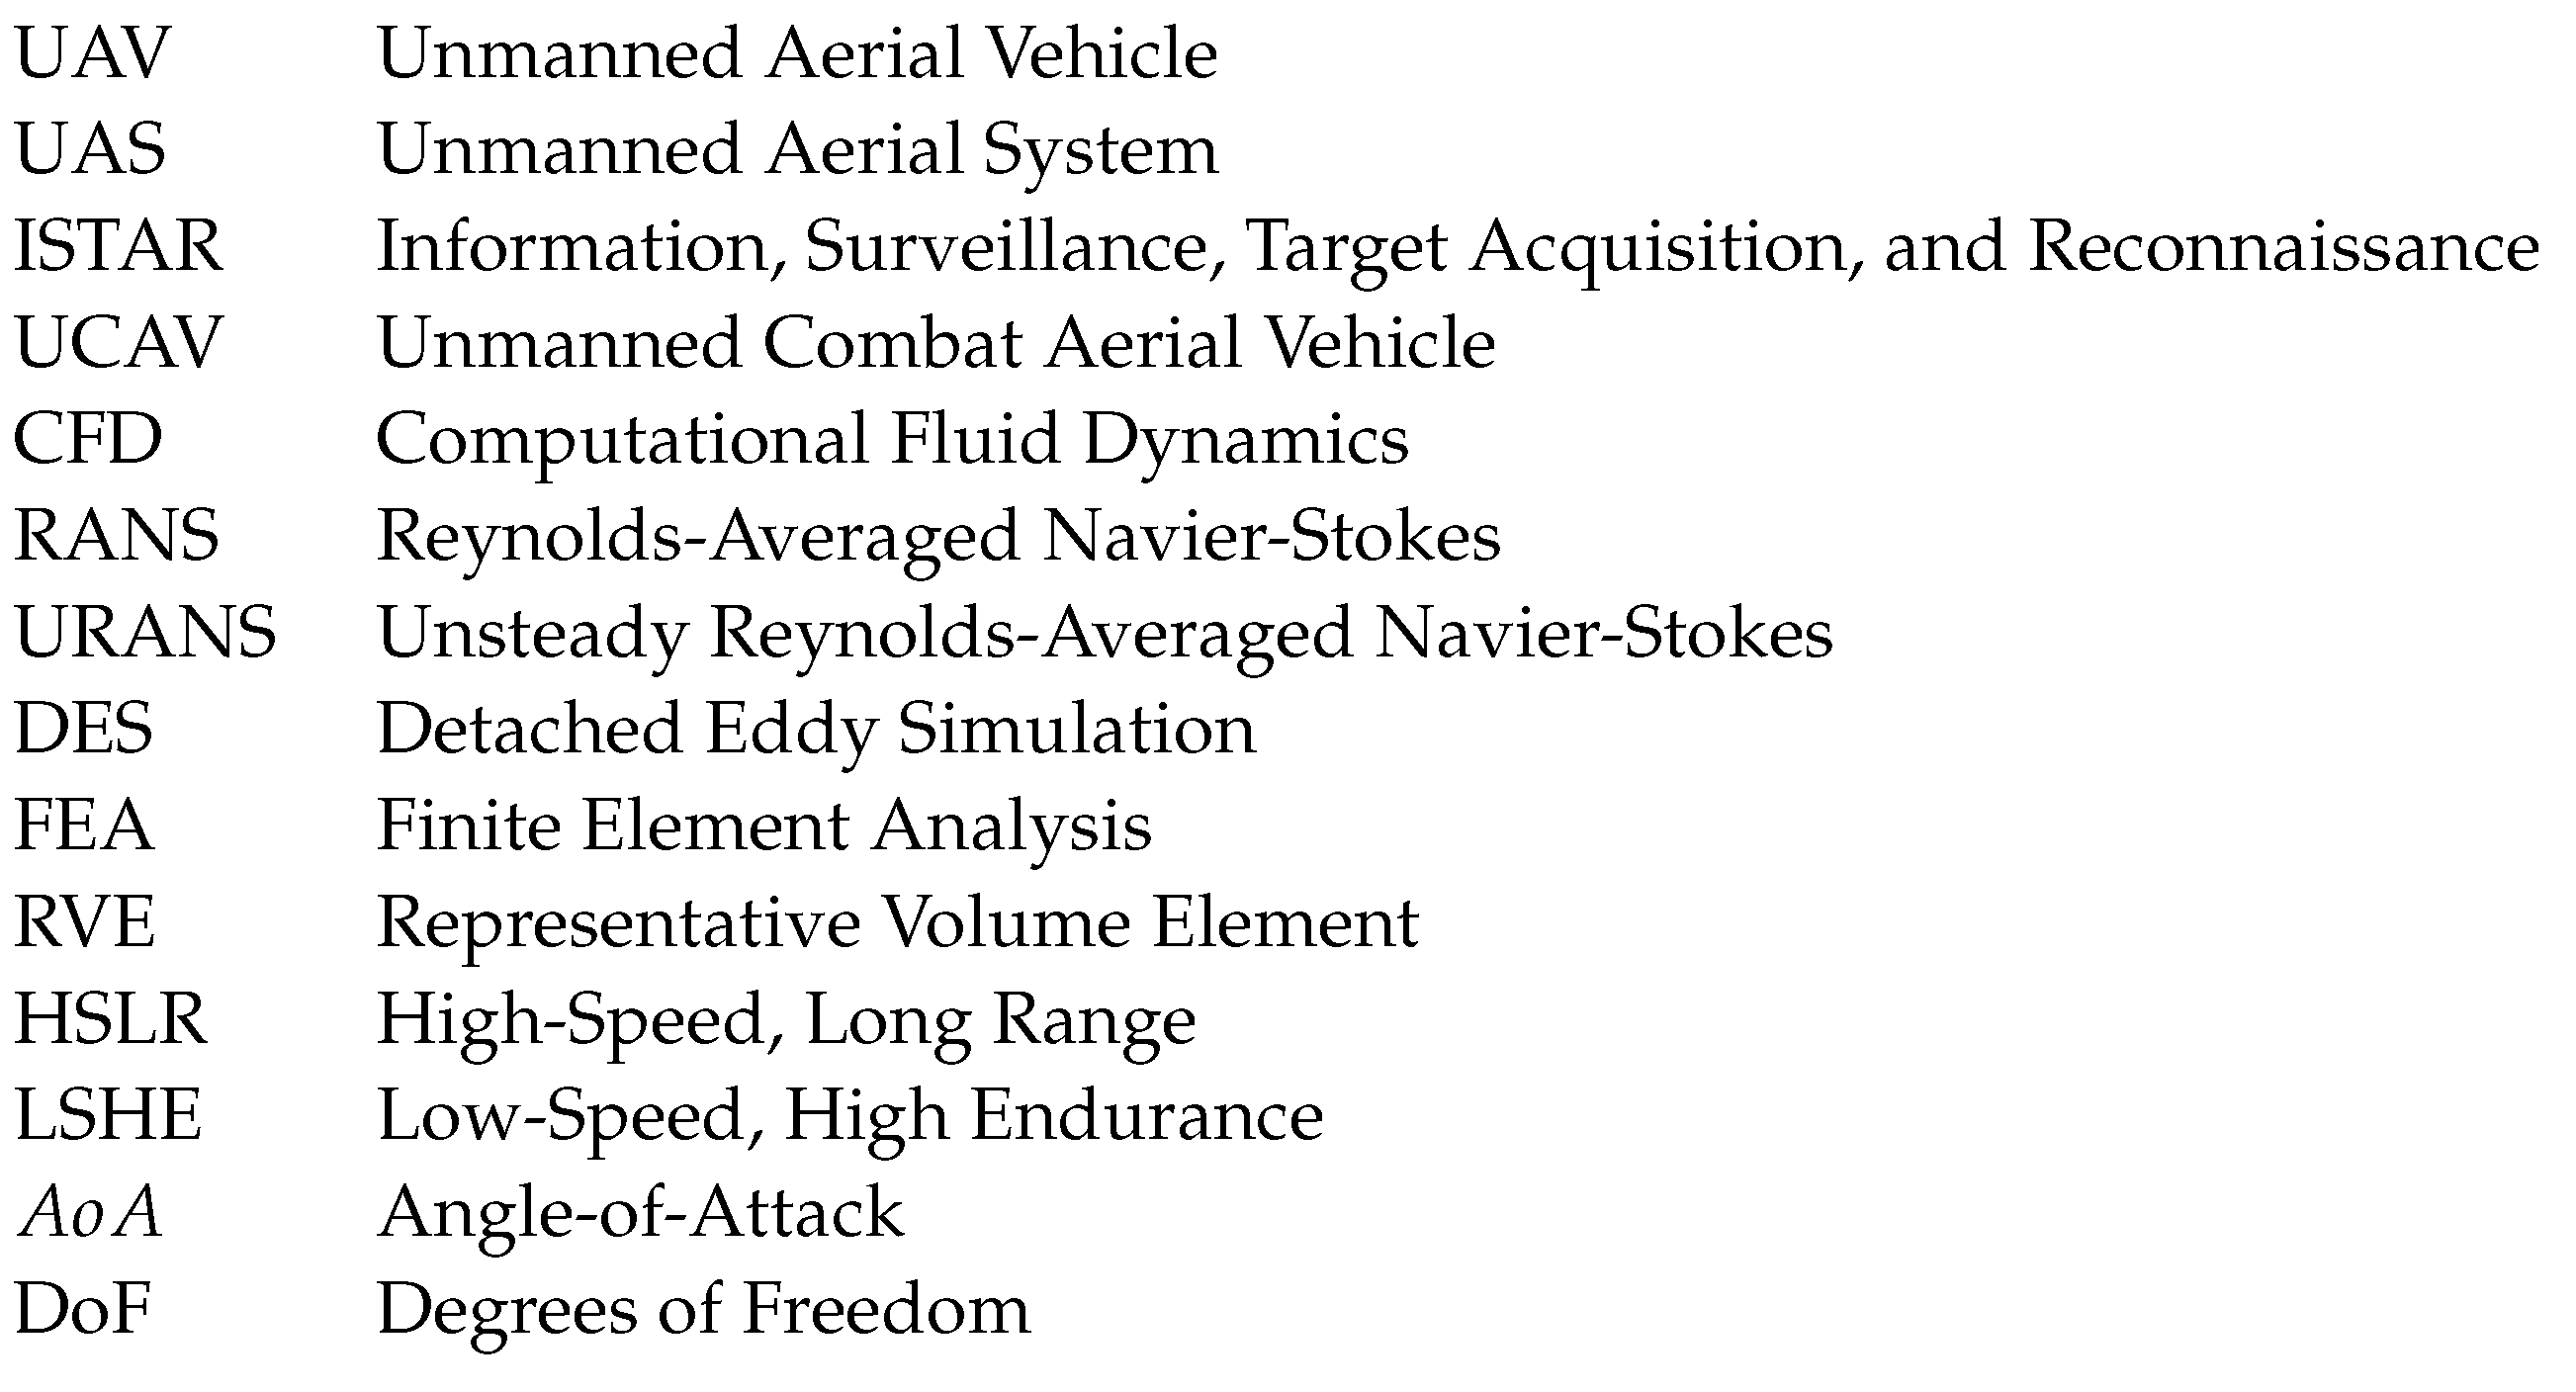
Abbreviations
References
- Chowdhury, S.; Maldonado, V.; Tong, W.; Messac, A. New Modular Product-Platform-Planning Approach to Design Macroscale Reconfigurable Unmanned Aerial Vehicles. Journal of Aircraft 2016, 53, 309–322. [Google Scholar] [CrossRef]
- Pate, D.J.; Patterson, M.D.; German, B.J. Optimizing Families of Reconfigurable Aircraft for Multiple Missions. Journal of Aircraft 2012, 49, 1988–2000. [Google Scholar] [CrossRef]
- Maldonado, V.; Santos, D.; Wilt, M.; Ramirez, D.; Shoemaker, J.; Ayele, W.; Beeson, B.; Lisby, B.; Zamora, J.; Antu, C. ‘Switchblade’: Wide-Mission Performance Design of a Multi-Variant Unmanned Aerial System. In Proceedings of the AIAA Scitech 2021 Forum. [CrossRef]
- Santos, D.; Ramirez, D.; Rogers, J.; Zamora, J.; Rezende, A.; Maldonado, V. Full-Cycle Design and Analysis of the Switchblade Reconfigurable Unmanned Aerial System. In Proceedings of the AIAA Aviation 2022 Forum. [CrossRef]
- Gargalakos, M. The role of unmanned aerial vehicles in military communications: application scenarios, current trends, and beyond. The Journal of Defense Modeling and Simulation 15485129211031668. [CrossRef]
- Christensen, C.; Salmon, J. An agent-based modeling approach for simulating the impact of small unmanned aircraft systems on future battlefields. The Journal of Defense Modeling and Simulation 2022, 19, 481–500. [Google Scholar] [CrossRef]
- Wang, Y.C.; Chen, T.; Yeh, Y.L. Advanced 3D printing technologies for the aircraft industry: a fuzzy systematic approach for assessing the critical factors. International Journal of Advanced Manufacturing Technology 2019, 105, 4059–4069. [Google Scholar] [CrossRef]
- Zhu, W. Models for wind tunnel tests based on additive manufacturing technology. Progress in Aerospace Sciences 2019, 110, 100541. [Google Scholar] [CrossRef]
- Raza, A.; Farhan, S.; Nasir, S.; Salamat, S. Applicability of 3D Printed Fighter Aircraft Model for Subsonic Wind Tunnel. In Proceedings of the 2021 International Bhurban Conference on Applied Sciences and Technologies (IBCAST); pp. 730–735. [CrossRef]
- Taylor, R.M.; Niakin, B.; Lira, N.; Sabine, G.; Lee, J.; Conklin, C.; Advirkar, S. Design Optimization, Fabrication, and Testing of a 3D Printed Aircraft Structure Using Fused Deposition Modeling. In Proceedings of the AIAA Scitech 2020 Forum; 2020. [Google Scholar] [CrossRef]
- Skawinski, I.; Goetzendorf-Grabowski, T. FDM 3D printing method utility assessment in small RC aircraft design. Aircraft Engineering and Aerospace Technology 2019, 91, 865–872. [Google Scholar] [CrossRef]
- Ayele, W.; Maldonado, V. Conceptual Design of a Robotic Ground-Aerial Vehicle with an Aeroelastic Wing Model for Mars Planetary Exploration. Aerospace 2023, 10. [Google Scholar] [CrossRef]
- Panagiotou, P.; Yakinthos, K. Aerodynamic efficiency and performance enhancement of fixed-wing UAVs. Aerospace Science and Technology 2020, 99, 105575. [Google Scholar] [CrossRef]
- Tormalm, M.; Schmidt, S. Computational Study of Static And Dynamic Vortical Flow over the Delta Wing SACCON Configuration Using the FOI Flow Solver Edge. In Proceedings of the 28th AIAA Applied Aerodynamics Conference. [CrossRef]
- Sandoval, P.; Cornejo, P.; Tinapp, F. Evaluating the longitudinal stability of an UAV using a CFD-6DOF model. Aerospace Science and Technology 2015, 43, 463–470. [Google Scholar] [CrossRef]
- Mumtaz, M.S.; Maqsood, A.; Sherbaz, S. Computational Modeling of Dynamic Stability Derivatives for Generic Airfoils. MATEC Web Conf. 2017, 95, 12006. [Google Scholar] [CrossRef]
- Kim, M.; Kim, S.; Kim, W.; Kim, C.; Kim, Y. Flow Control of Tiltrotor Unamnned-Aerial-Vehicle Airfoils Using Synthetic Jets. Journal of Aircraft 2011, 48, 1045–1057. [Google Scholar] [CrossRef]
- Bliamis, C.; Vlahostergios, Z.; Misirlis, D.; Yakinthos, K. Numerical Evaluation of Riblet Drag Reduction on a MALE UAV. Aerospace 2022, 9. [Google Scholar] [CrossRef]
- Guiler, R.; Huebsch, W. Wind Tunnel Analysis of a Morphing Swept Wing Tailless Aircraft. In Proceedings of the 23rd AIAA Applied Aerodynamics Conference. [CrossRef]
- Goetten, F.; Finger, D.; Marino, M.; Bil, C.; Havermann, M.; Braun, C. A Review of Guidelines and Best Practices for Subsonic Aerodynamic Simulations Using RANS CFD. In Proceedings of the Asia Pacific International Symposium on Aerospace Technology.
- Zore, K.; Shah, S.; Stokes, J.; Sasanapuri, B.; Sharkey, P. ANSYS CFD Study for High Lift Aircraft Configurations. In Proceedings of the 2018 Applied Aerodynamics Conference; 2514. [Google Scholar] [CrossRef]
- Menter, F.R.; Smirnov, P.E.; Liu, T.; Avancha, R. A One-Equation Local Correlation-Based Transition Model. Flow Turbulence Combust 2015, 95, 583–619. [Google Scholar] [CrossRef]
- Menter, F. Two-Equation Eddy-Viscosity Turbulence Models for Engineering Applications. AIAA Journal 1994, 32. [Google Scholar] [CrossRef]
- Vostruha, K.; Pelant, J. Perturbation Analysis of "kω" and "kϵ" Turbulent Models. Wall Functions. EPJ Web of Conferences 2013, 45, 01097. [Google Scholar] [CrossRef]
- Rodriguez, S. Applied Computational Fluid Dynamics and Turbulence Modeling: Practical Tools, Tips and Techniques; Springer International Publishing, 2019. [Google Scholar]
- Gu, J.; Chen, P.; Su, L.; Li, K. A theoretical and experiemental assessment of 3D macroscopic failure criteria for predicting 652 pure inter-fiber fracture of transversely isotropic UD composites. Composite Structures 2020. [Google Scholar]
- Stratasys. Nylon 12 Carbon Fiber, 2015.
- Chen, R.; Ramachandran, A.; Liu, C.; Chang, F.K.; Senesky, D. Tsai-Wu Analysis of a Thin-Walled 3D-Printed Polylactic Acid (PLA) Structural Bracket. In Proceedings of the 58th AIAA/ASCE/AHS/ASC Structures, Structural Dynamics, and Materials Conference. [CrossRef]
- Raymer, D. Aircraft Design: A Conceptual Approach; American Institute of Aeronautics and Astronautics: Reston, VA, 2012. [Google Scholar] [CrossRef]
- Evans, S.; Lardeau, S. Validation of a turbulence methodology using the SST k ω model for adjoint calculation. In Proceedings of the 54th AIAA Aerospace Sciences Meeting. [CrossRef]
- Spalart, P.R.; Rumsey, C.L. Effective Inflow Conditions for Turbulence Models in Aerodynamic Calculations. AIAA Journal 2007, 45, 2544–2553. [Google Scholar] [CrossRef]
- Castillo, R.; Pol, S. Wind tunnel studies of wind turbine yaw and speed control effects on the wake trajectory and thrust stabilization. Renewable Energy 2022, 189, 726–733. [Google Scholar] [CrossRef]
- Maldonado, V.; Castillo, L.; Thormann, A.; Meneveau, C. The role of free stream turbulence with large integral scale on the aerodynamic performance of an experimental low Reynolds number S809 wind turbine blade. Journal of Wind Engineering and Industrial Aerodynamics 2015, 142, 246–257. [Google Scholar] [CrossRef]
- Brandt, J.; Selig, M. Propeller Performance Data at Low Reynolds Numbers. In Proceedings of the 49th AIAA Aerospace Sciences Meeting including the New Horizons Forum and Aerospace Exposition. [CrossRef]
- Ananda, G. UIUC Propeller Database, Volume 1, 2015.
- Traub, L.W. Range and Endurance Estimates for Battery-Powered Aircraft. Journal of Aircraft 2011, 48, 703–707. [Google Scholar] [CrossRef]







Disclaimer/Publisher’s Note: The statements, opinions and data contained in all publications are solely those of the individual author(s) and contributor(s) and not of MDPI and/or the editor(s). MDPI and/or the editor(s) disclaim responsibility for any injury to people or property resulting from any ideas, methods, instructions or products referred to in the content. |
© 2023 by the authors. Licensee MDPI, Basel, Switzerland. This article is an open access article distributed under the terms and conditions of the Creative Commons Attribution (CC BY) license (http://creativecommons.org/licenses/by/4.0/).


