Submitted:
22 May 2023
Posted:
23 May 2023
You are already at the latest version
Abstract
Keywords:
1. Introduction
2. Experimental
2.1. Catalyst Synthesis
2.2. Catalytic Experiments
2.3. Characterization of Catalysts
3. Results and Discussion
3.1. Texture Characteristics of the NiCex-C Catalysts
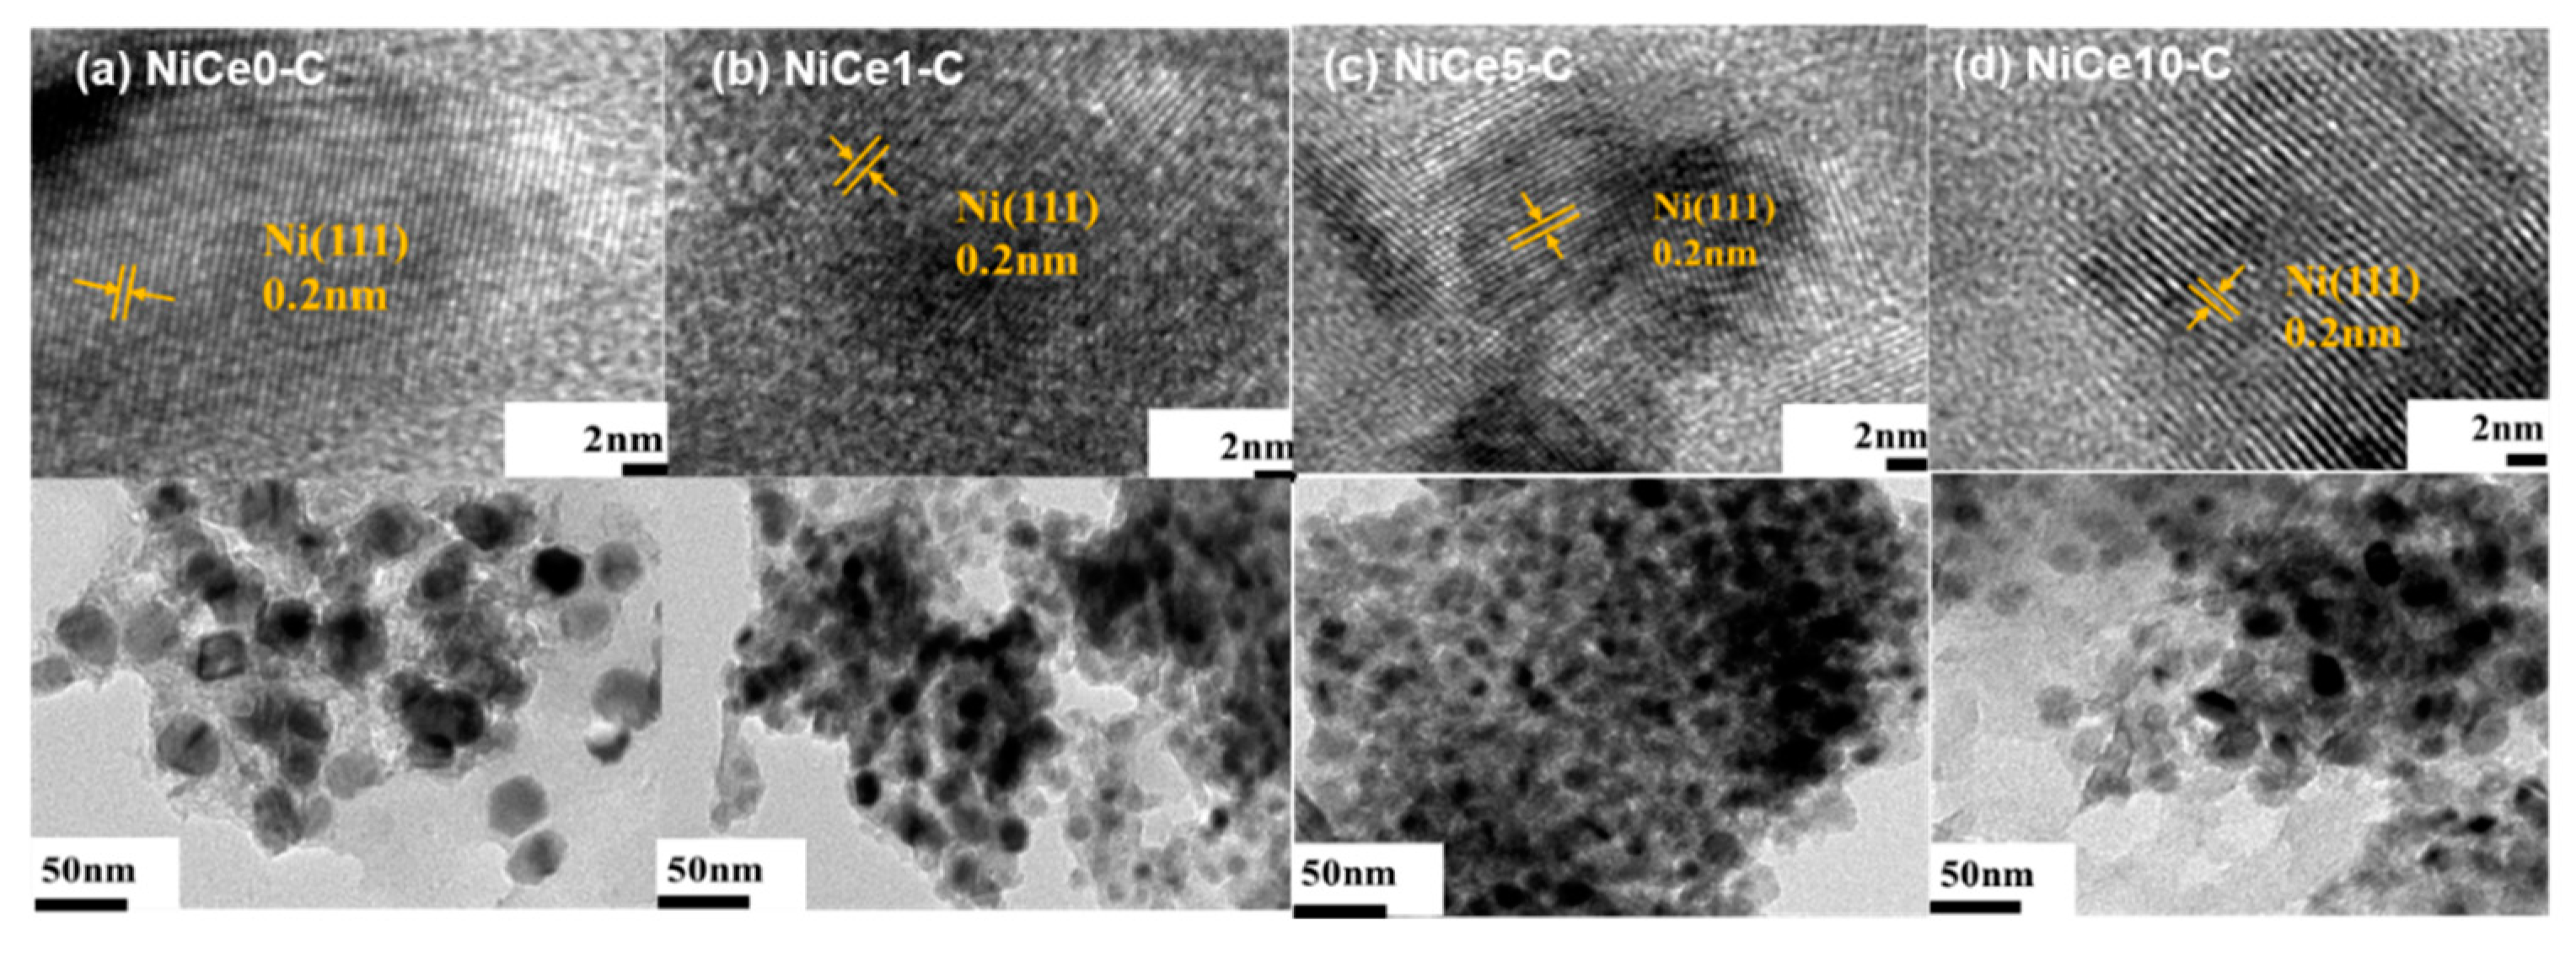
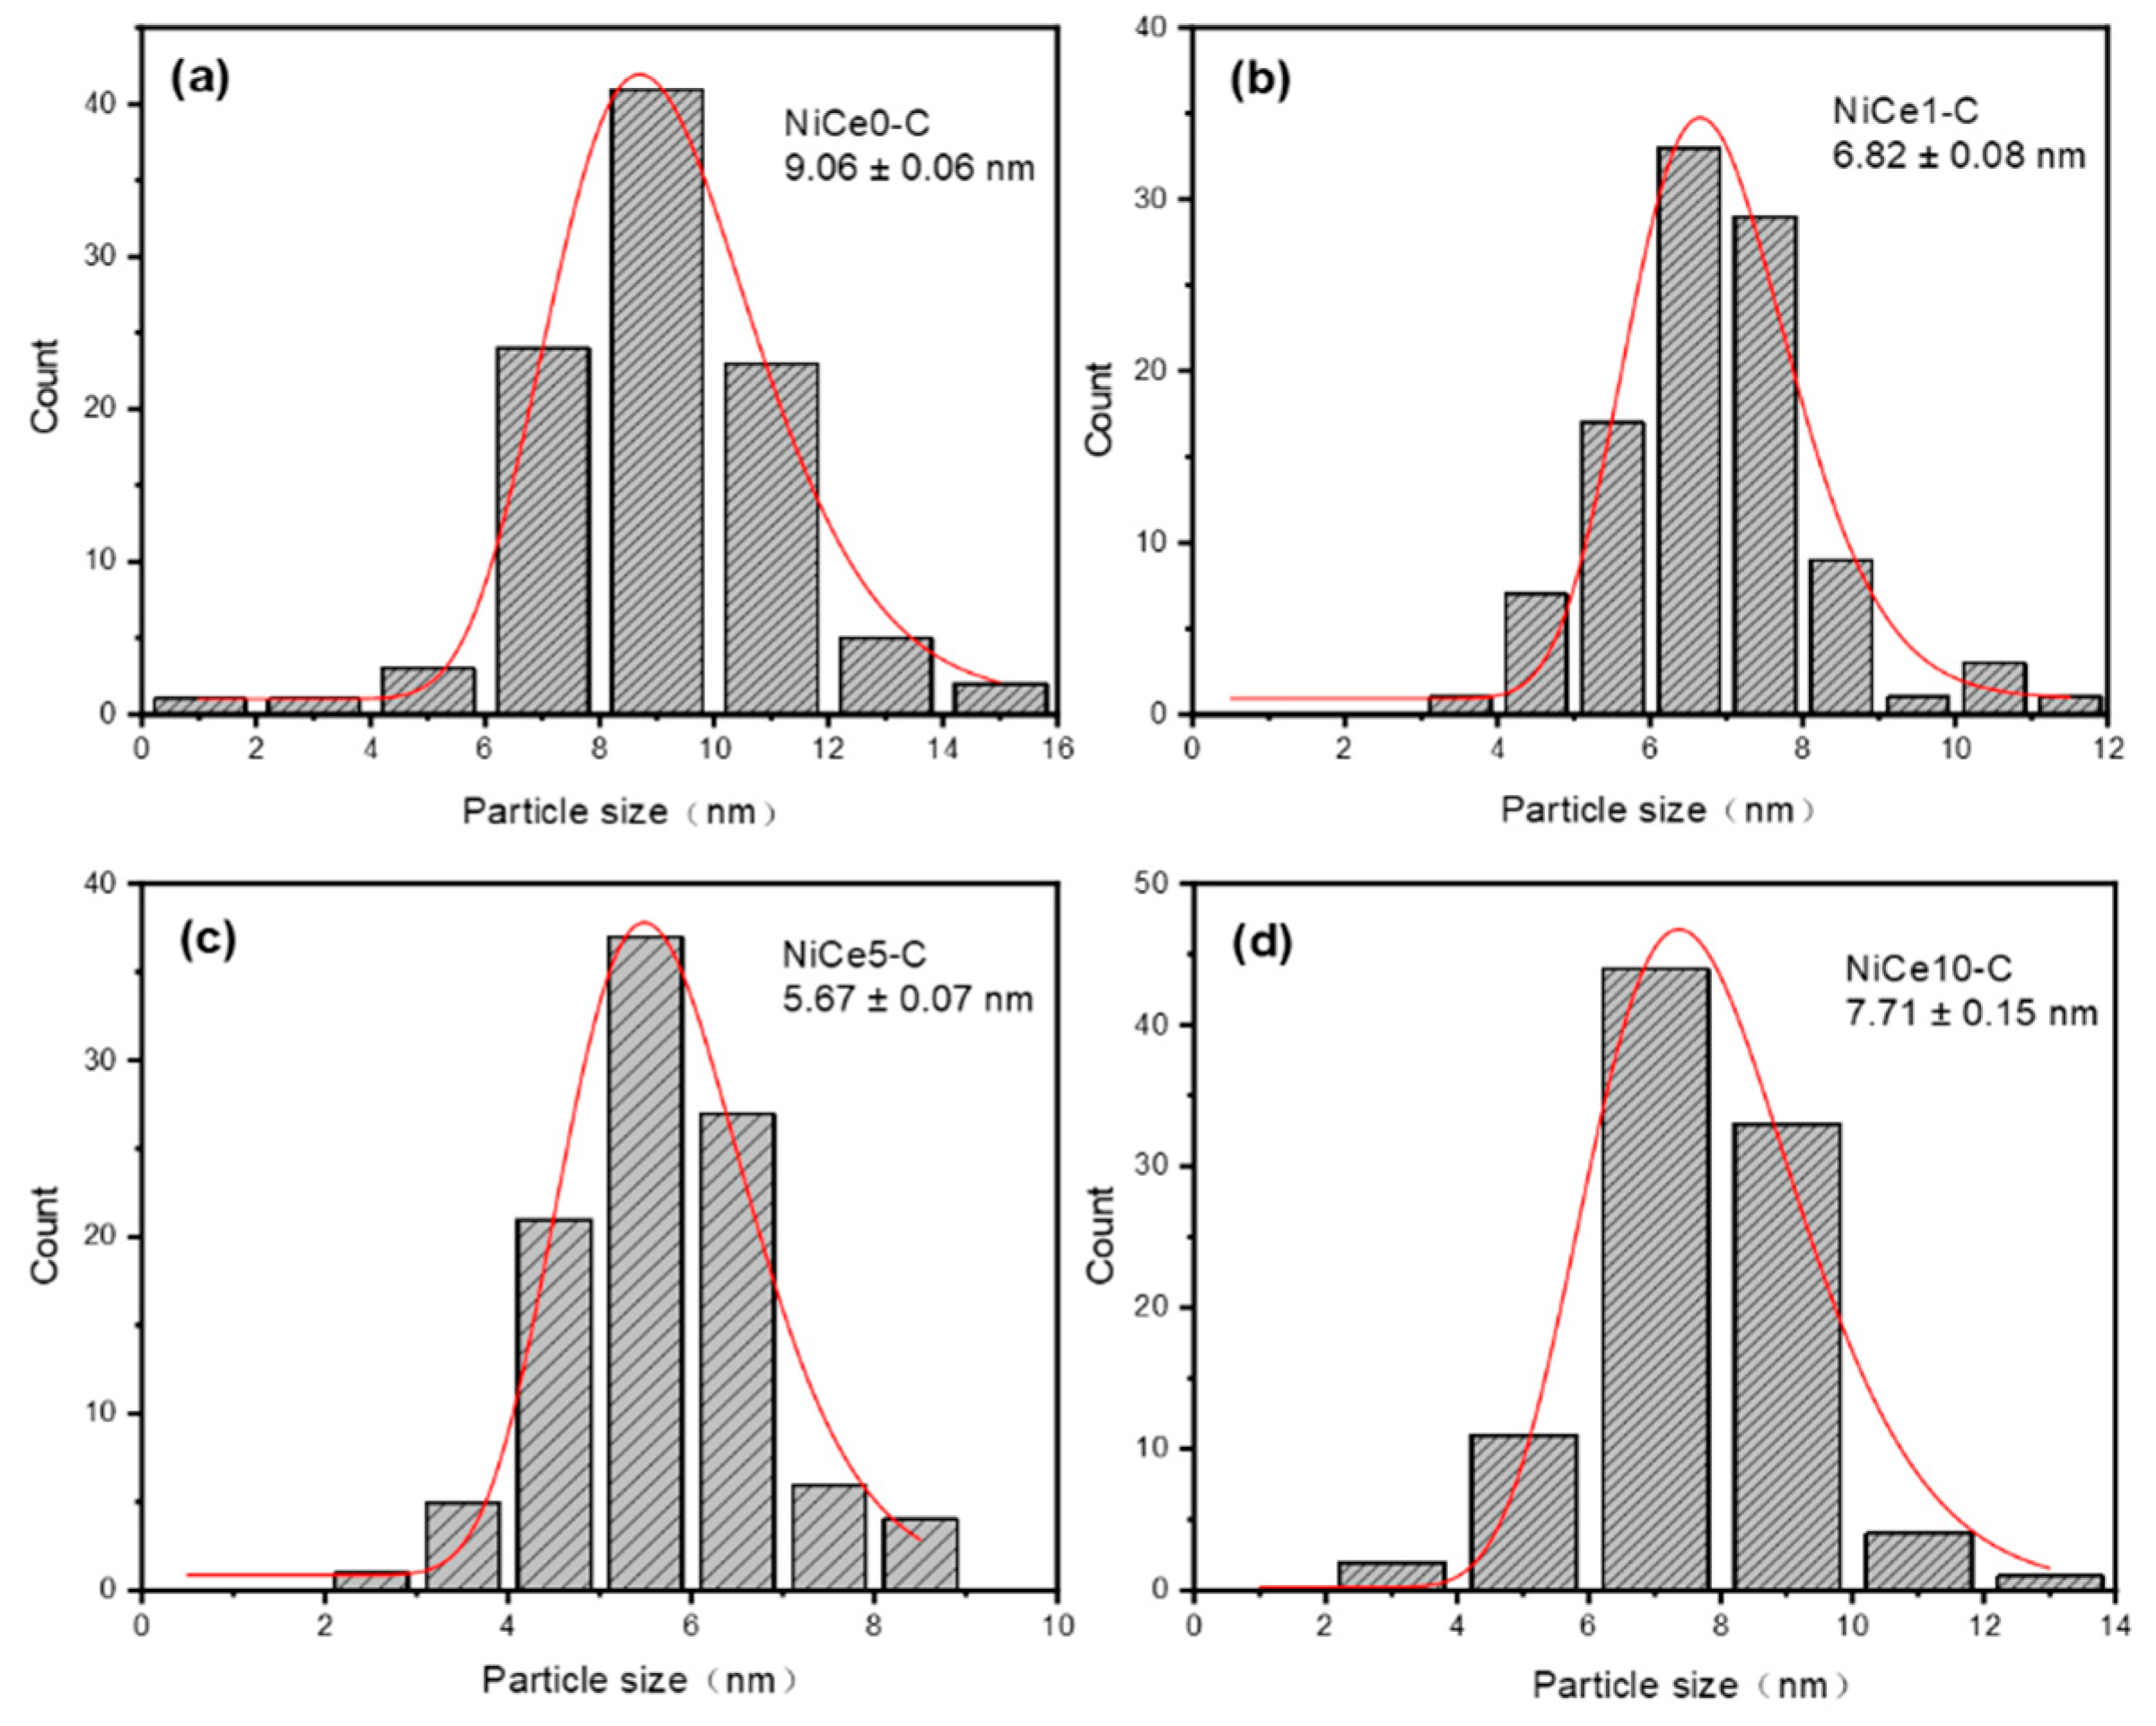
3.2. Morphological Study and the Particle Size Analysis
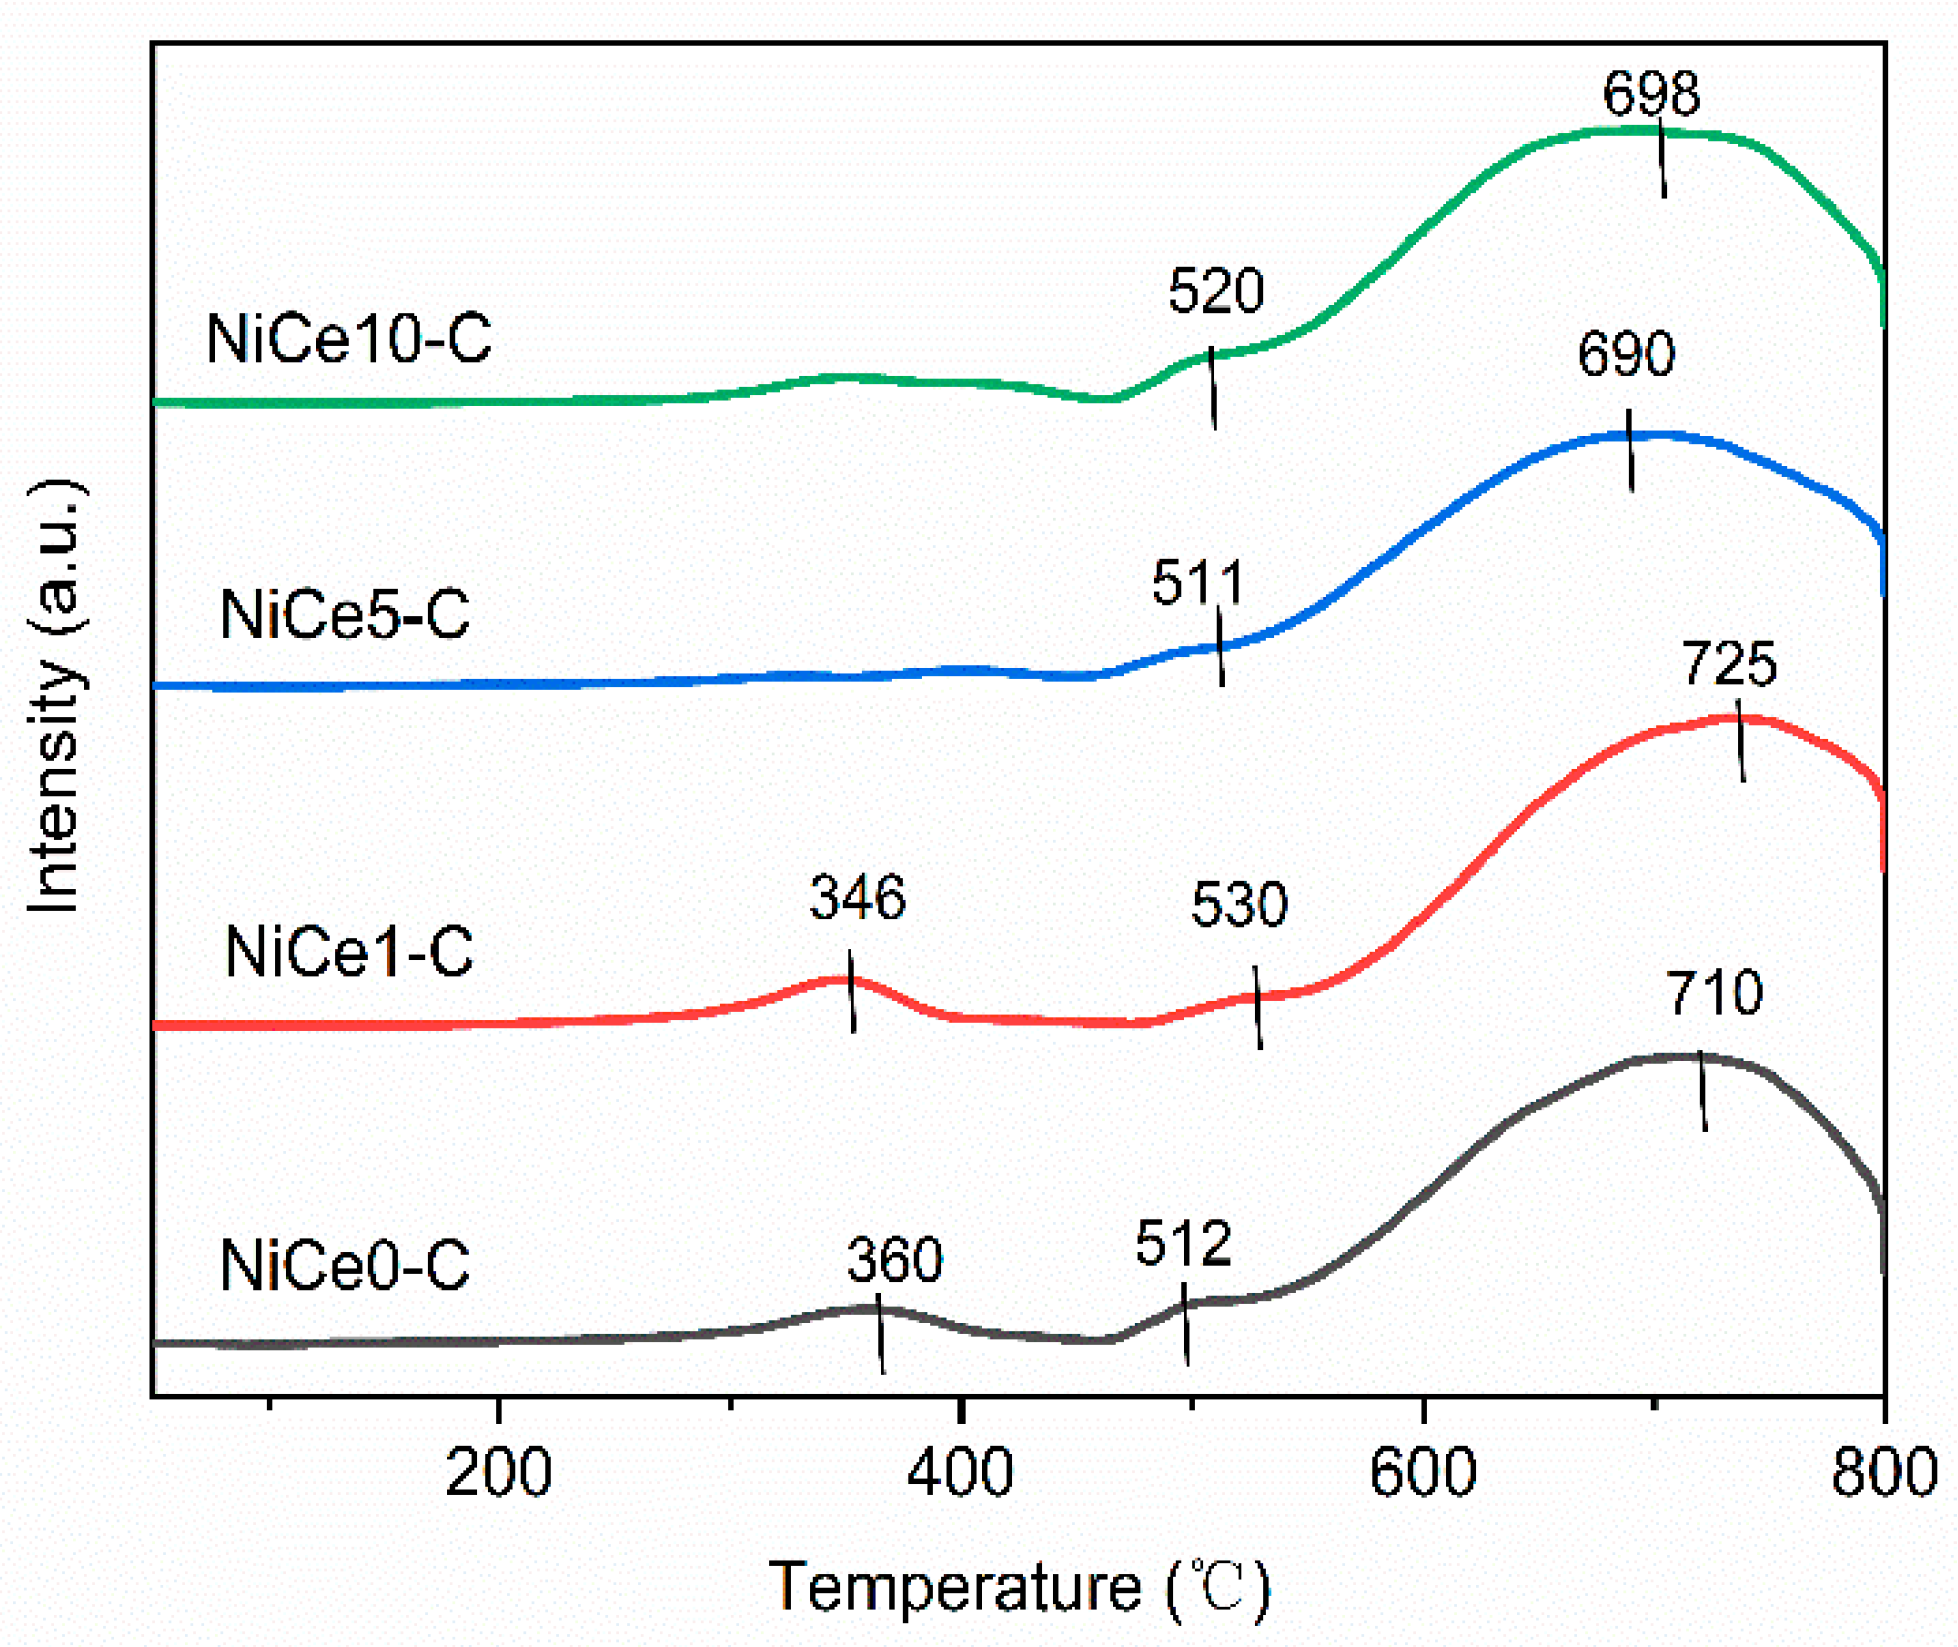
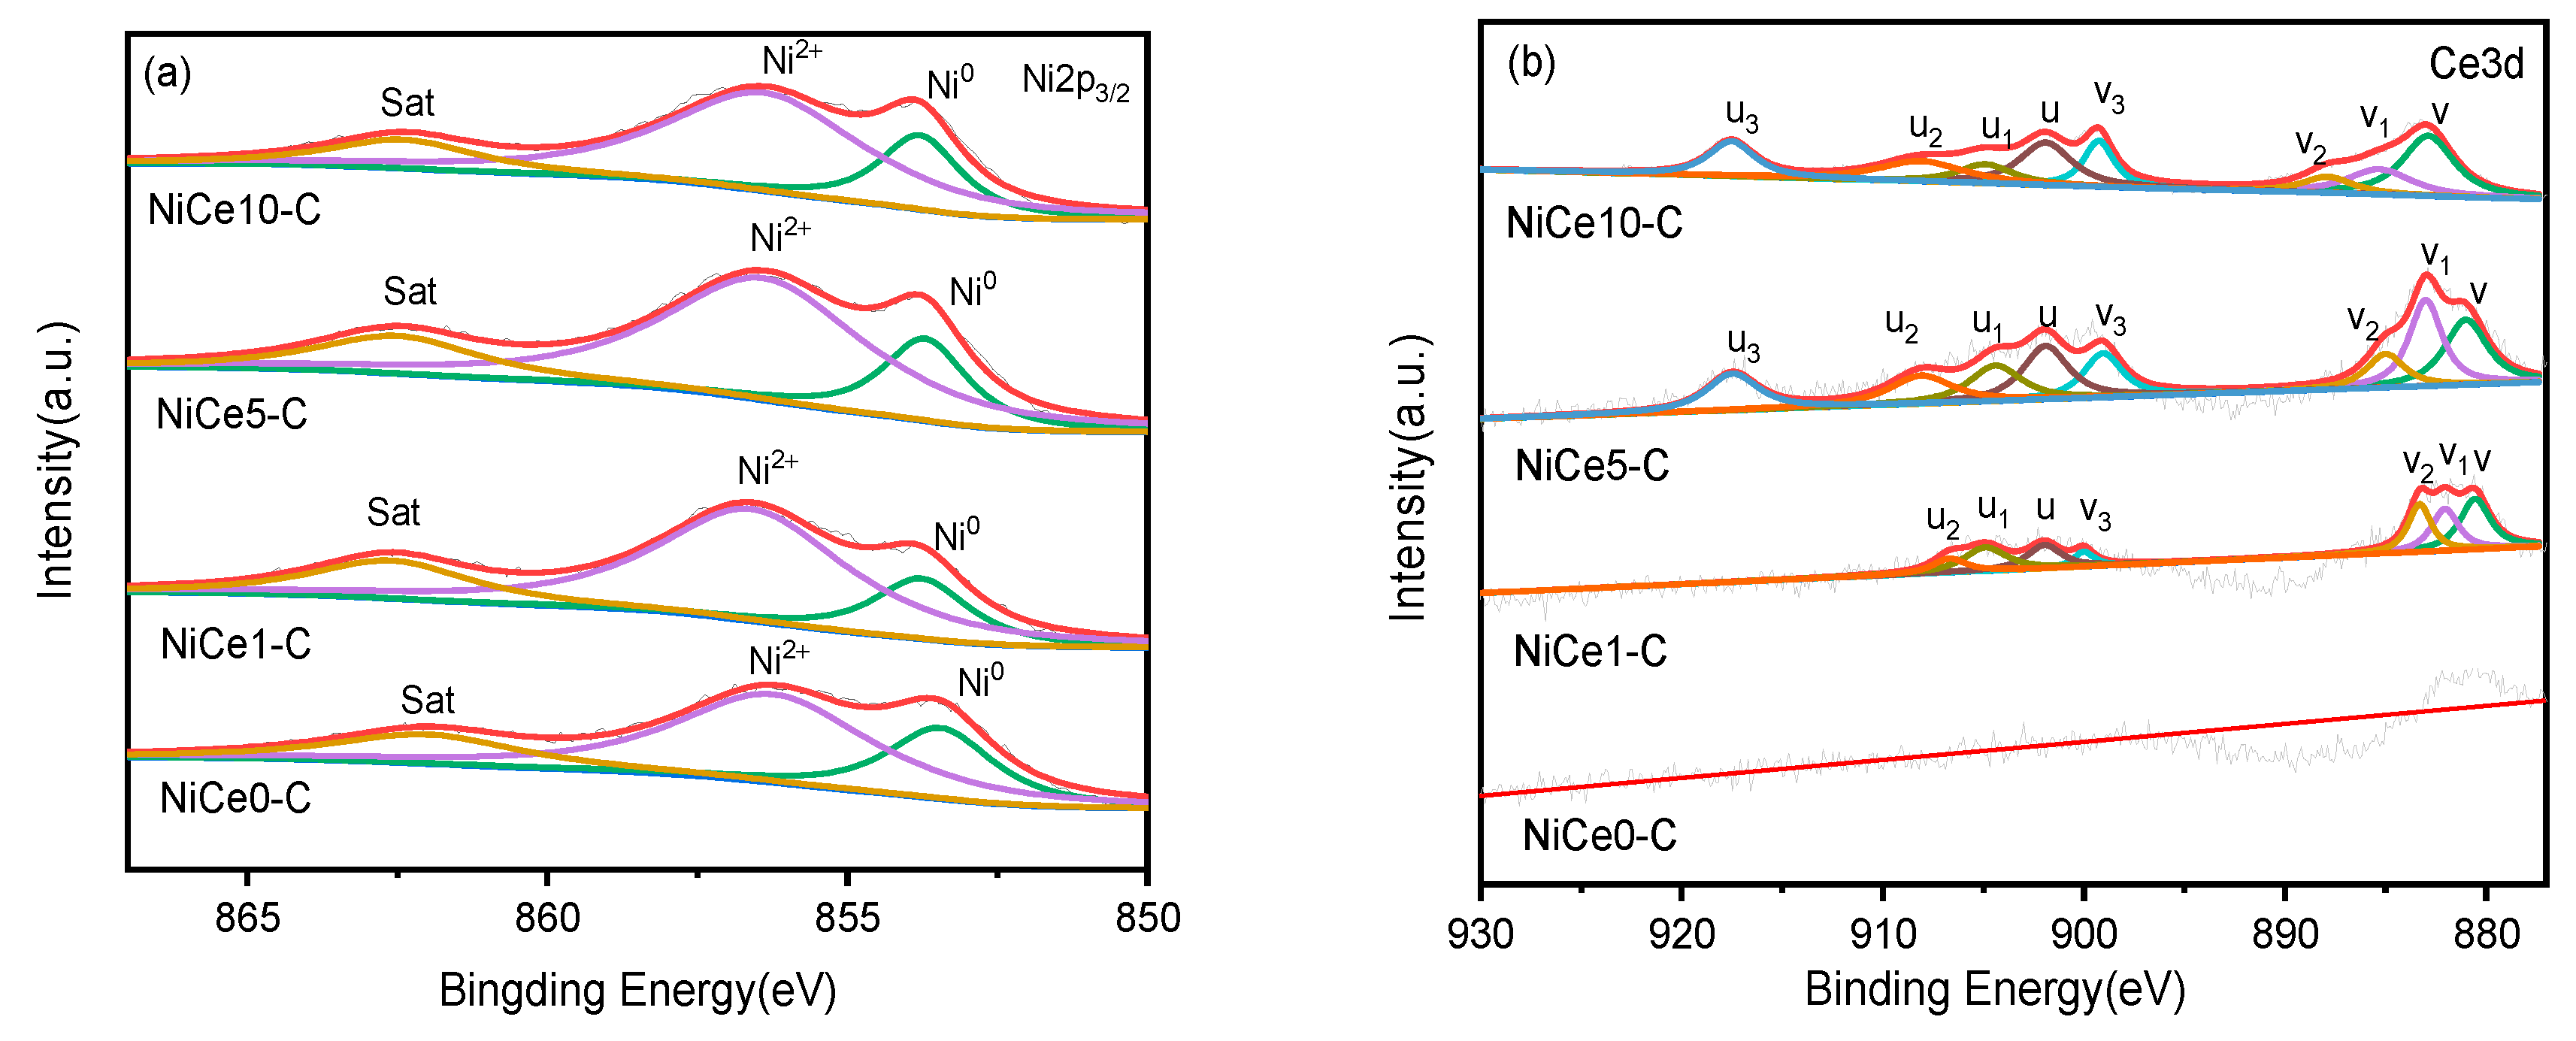
3.3. Reducibility and Metal-Support Interaction Study
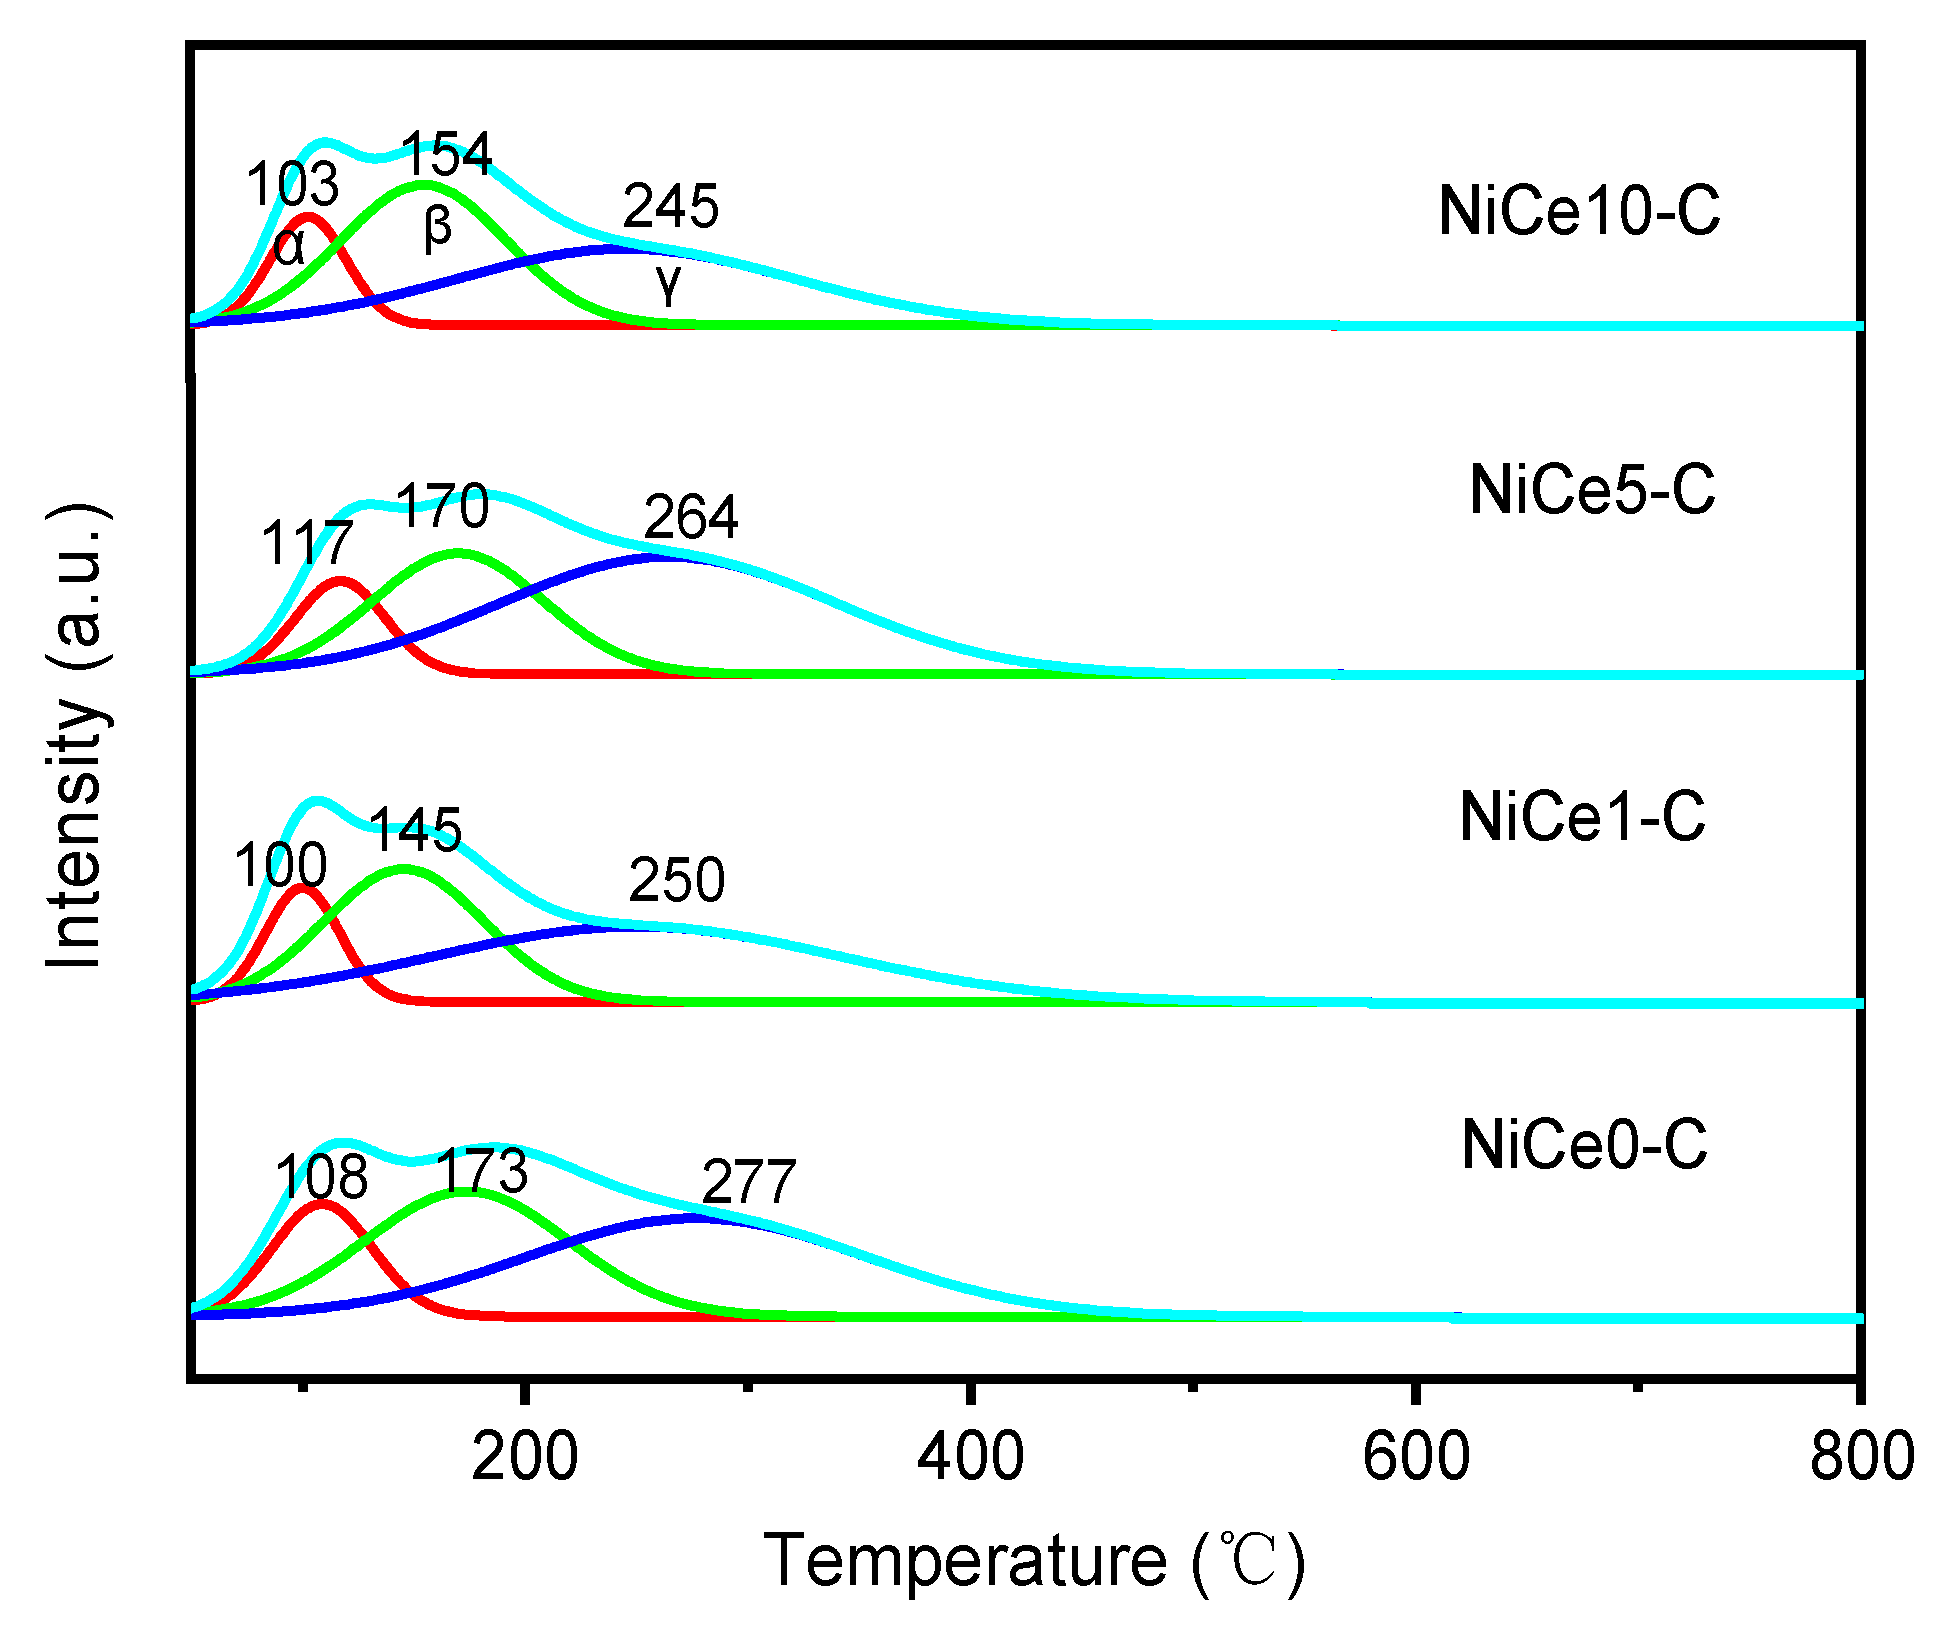
3.4. Surface Basicity and Element Distribution Analysis
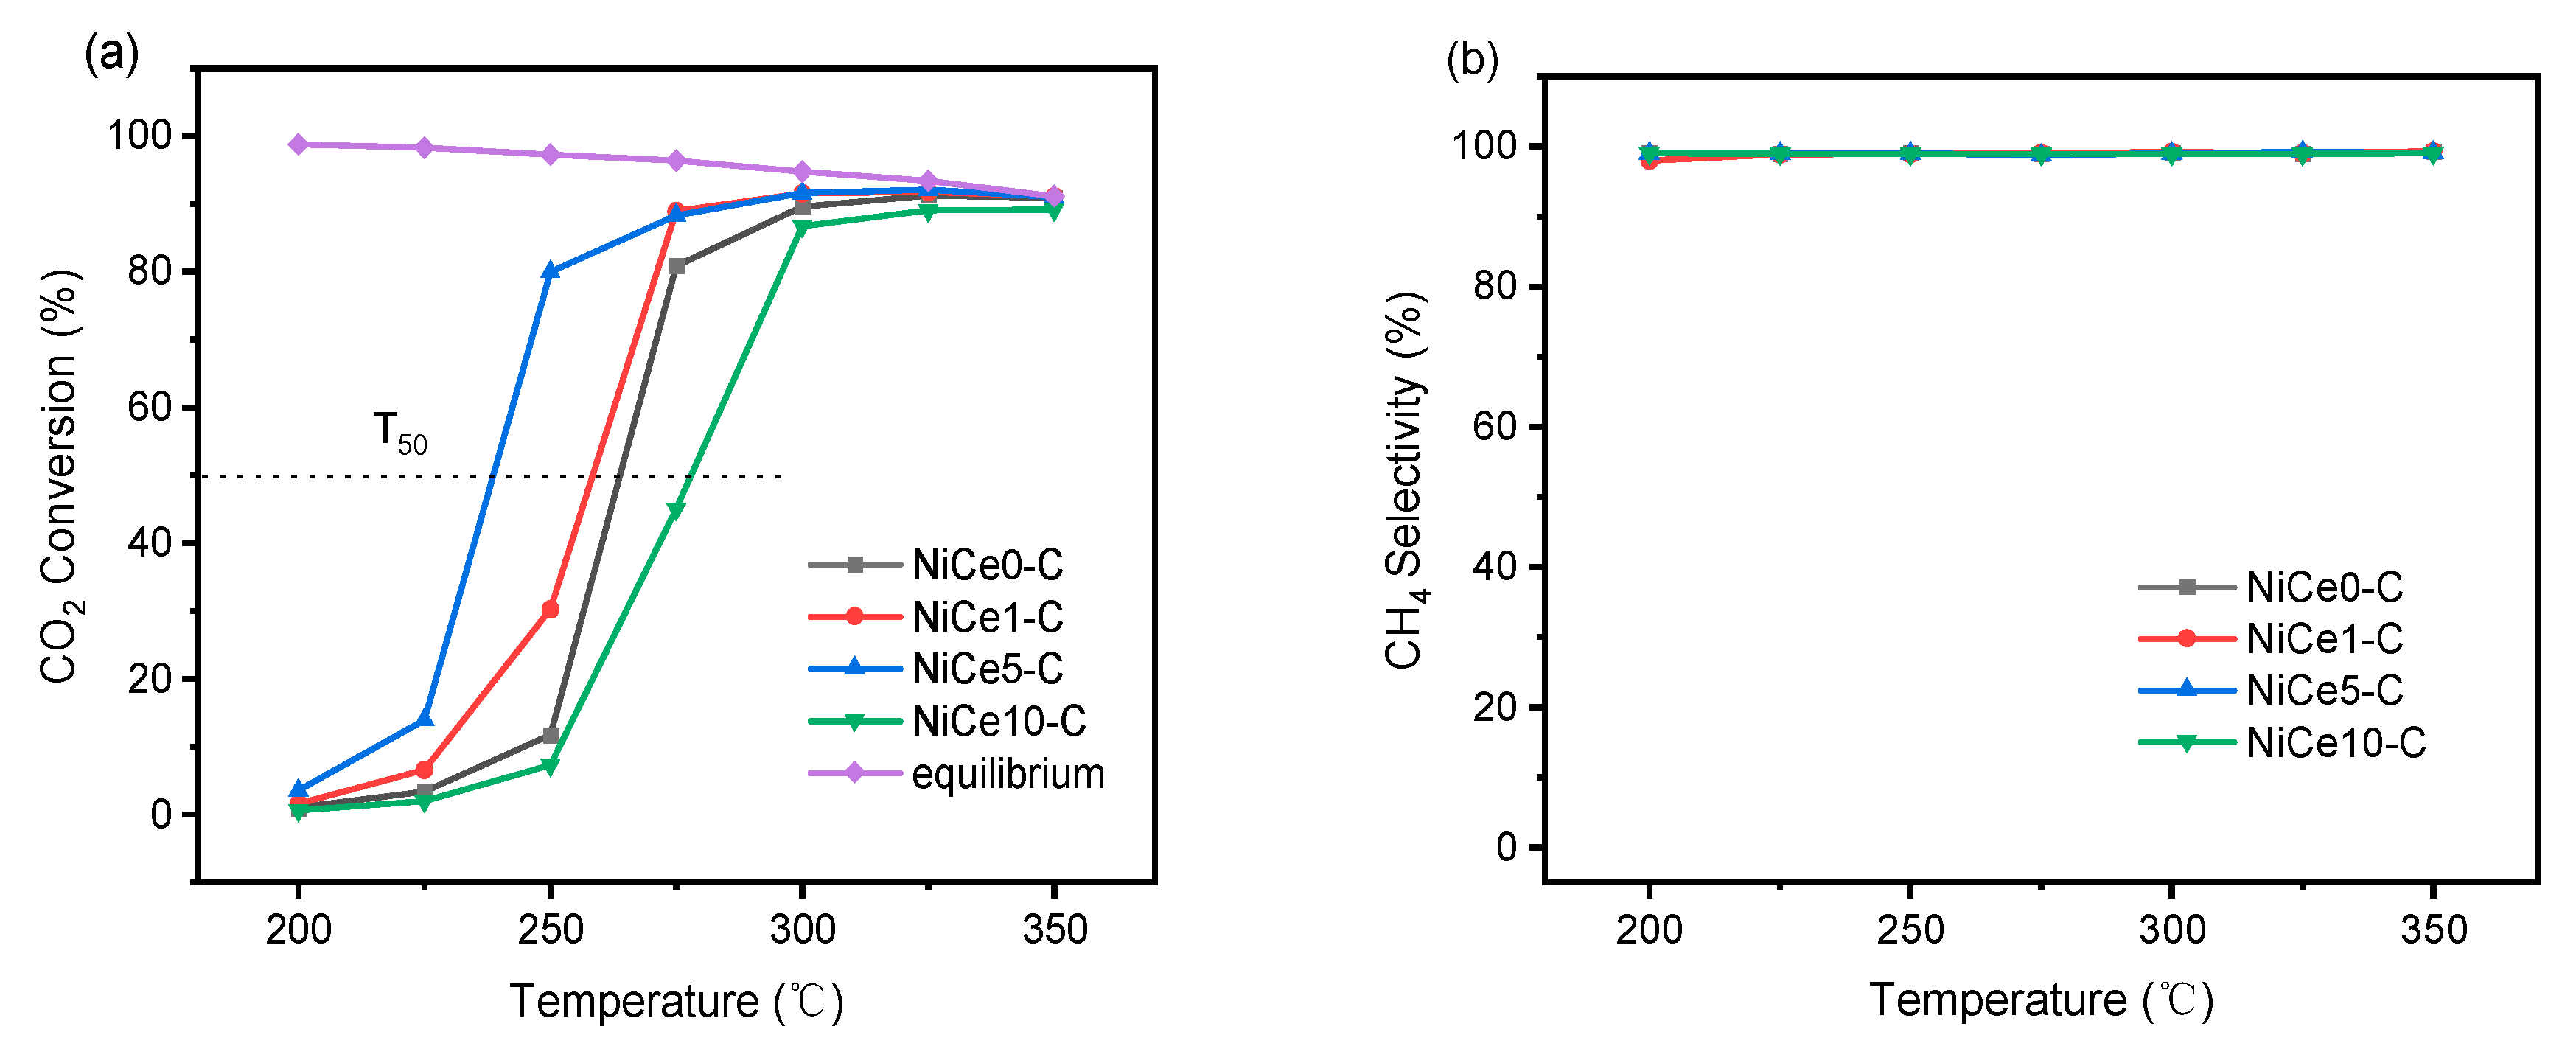
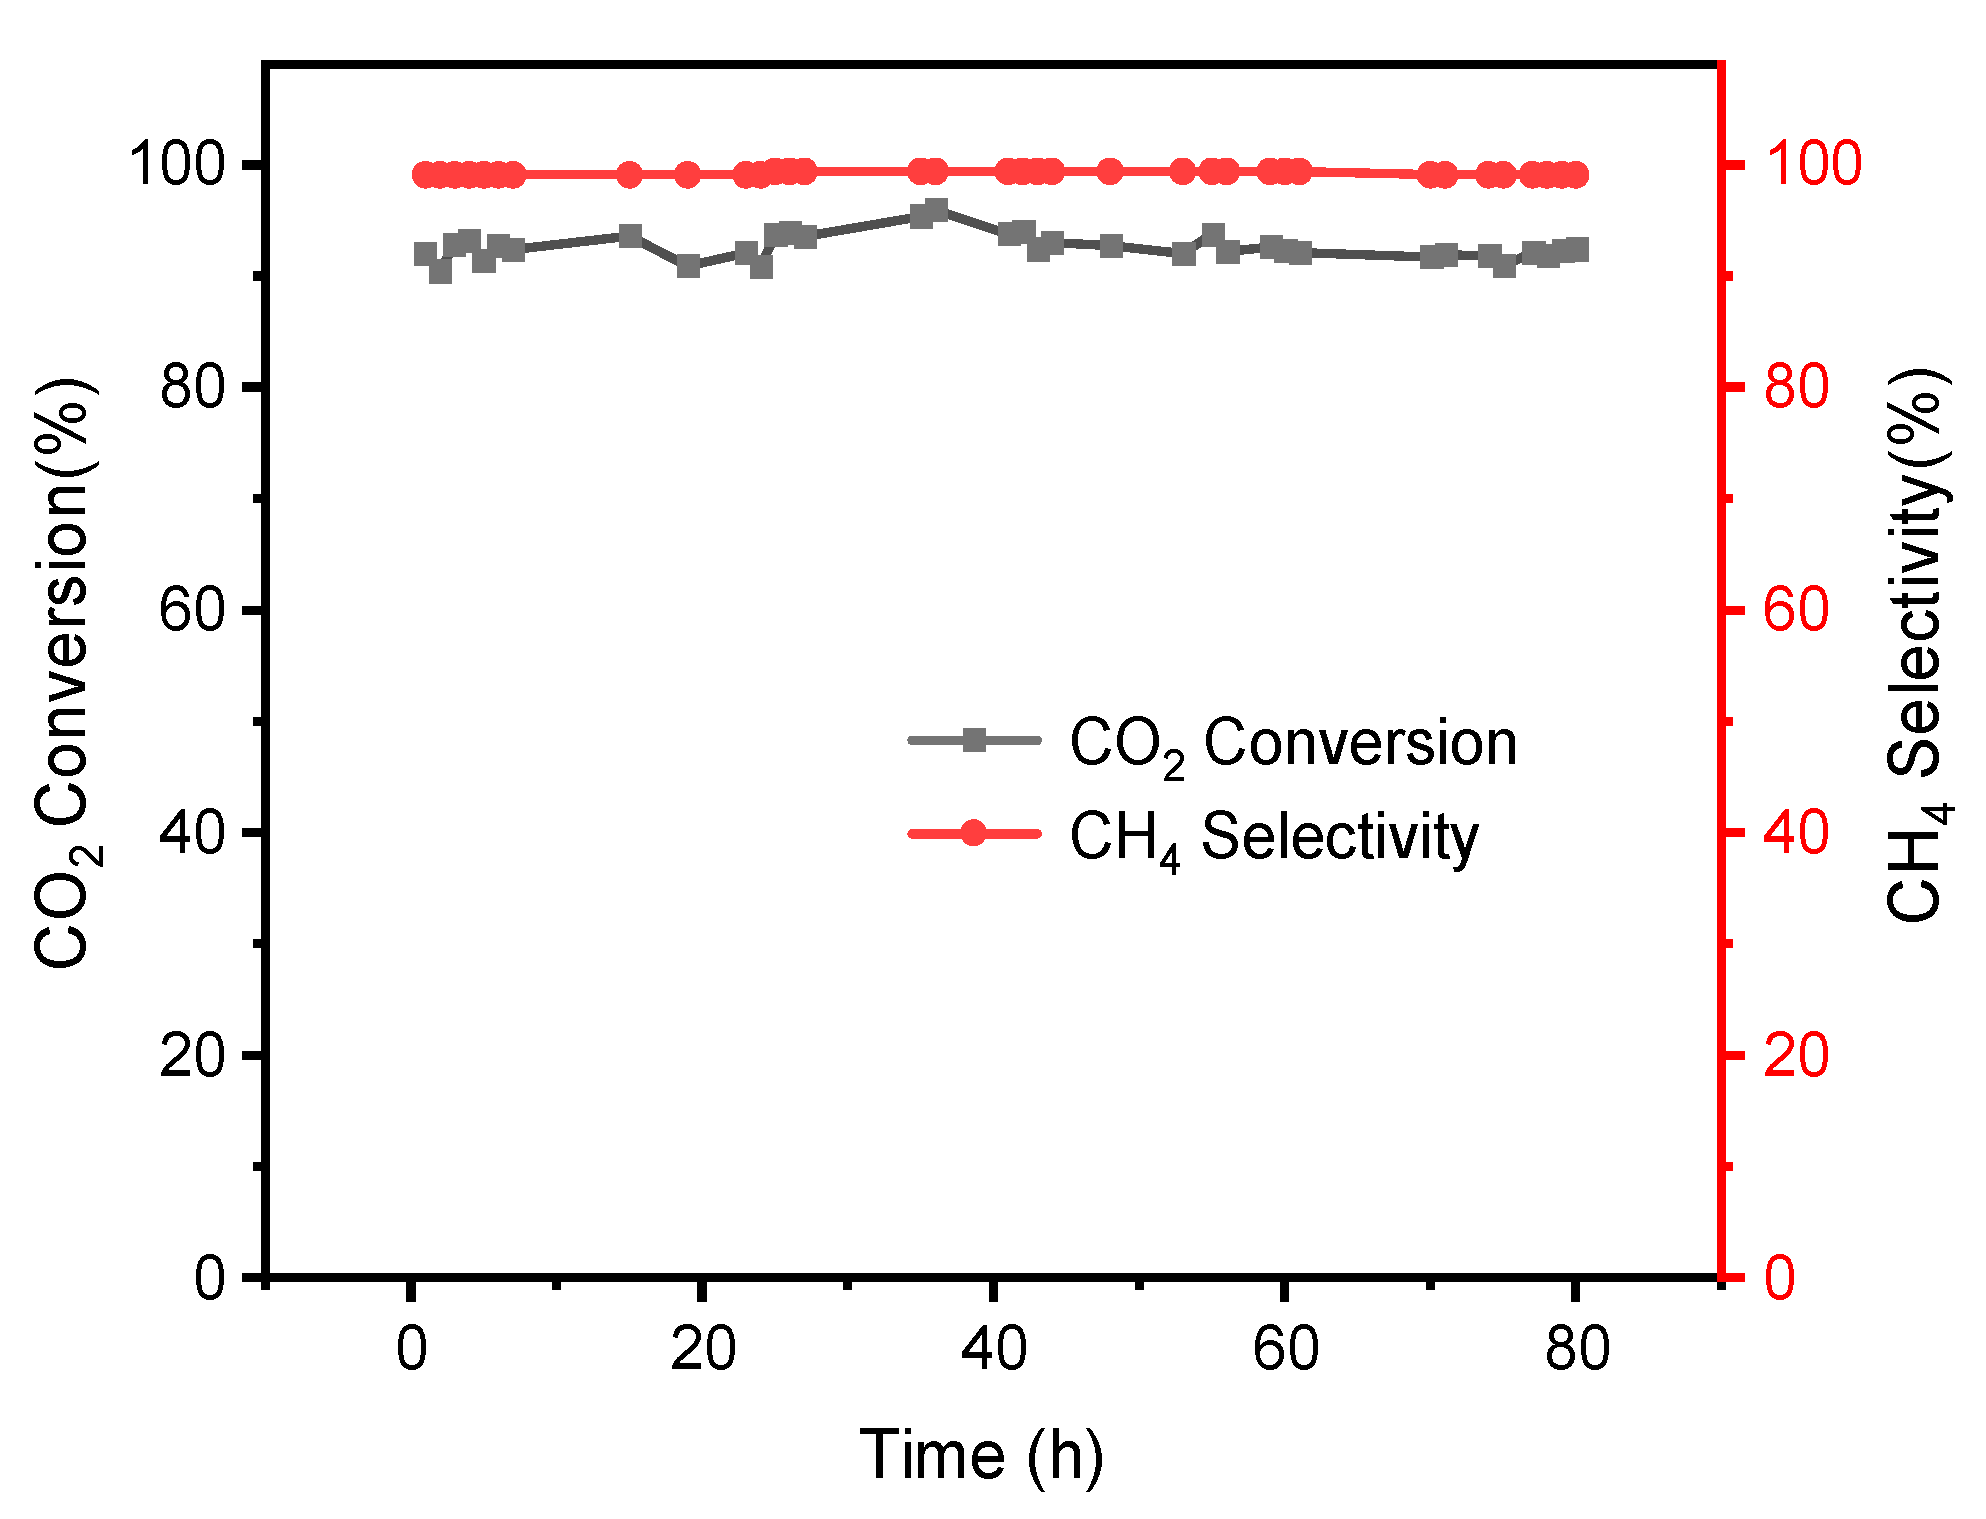
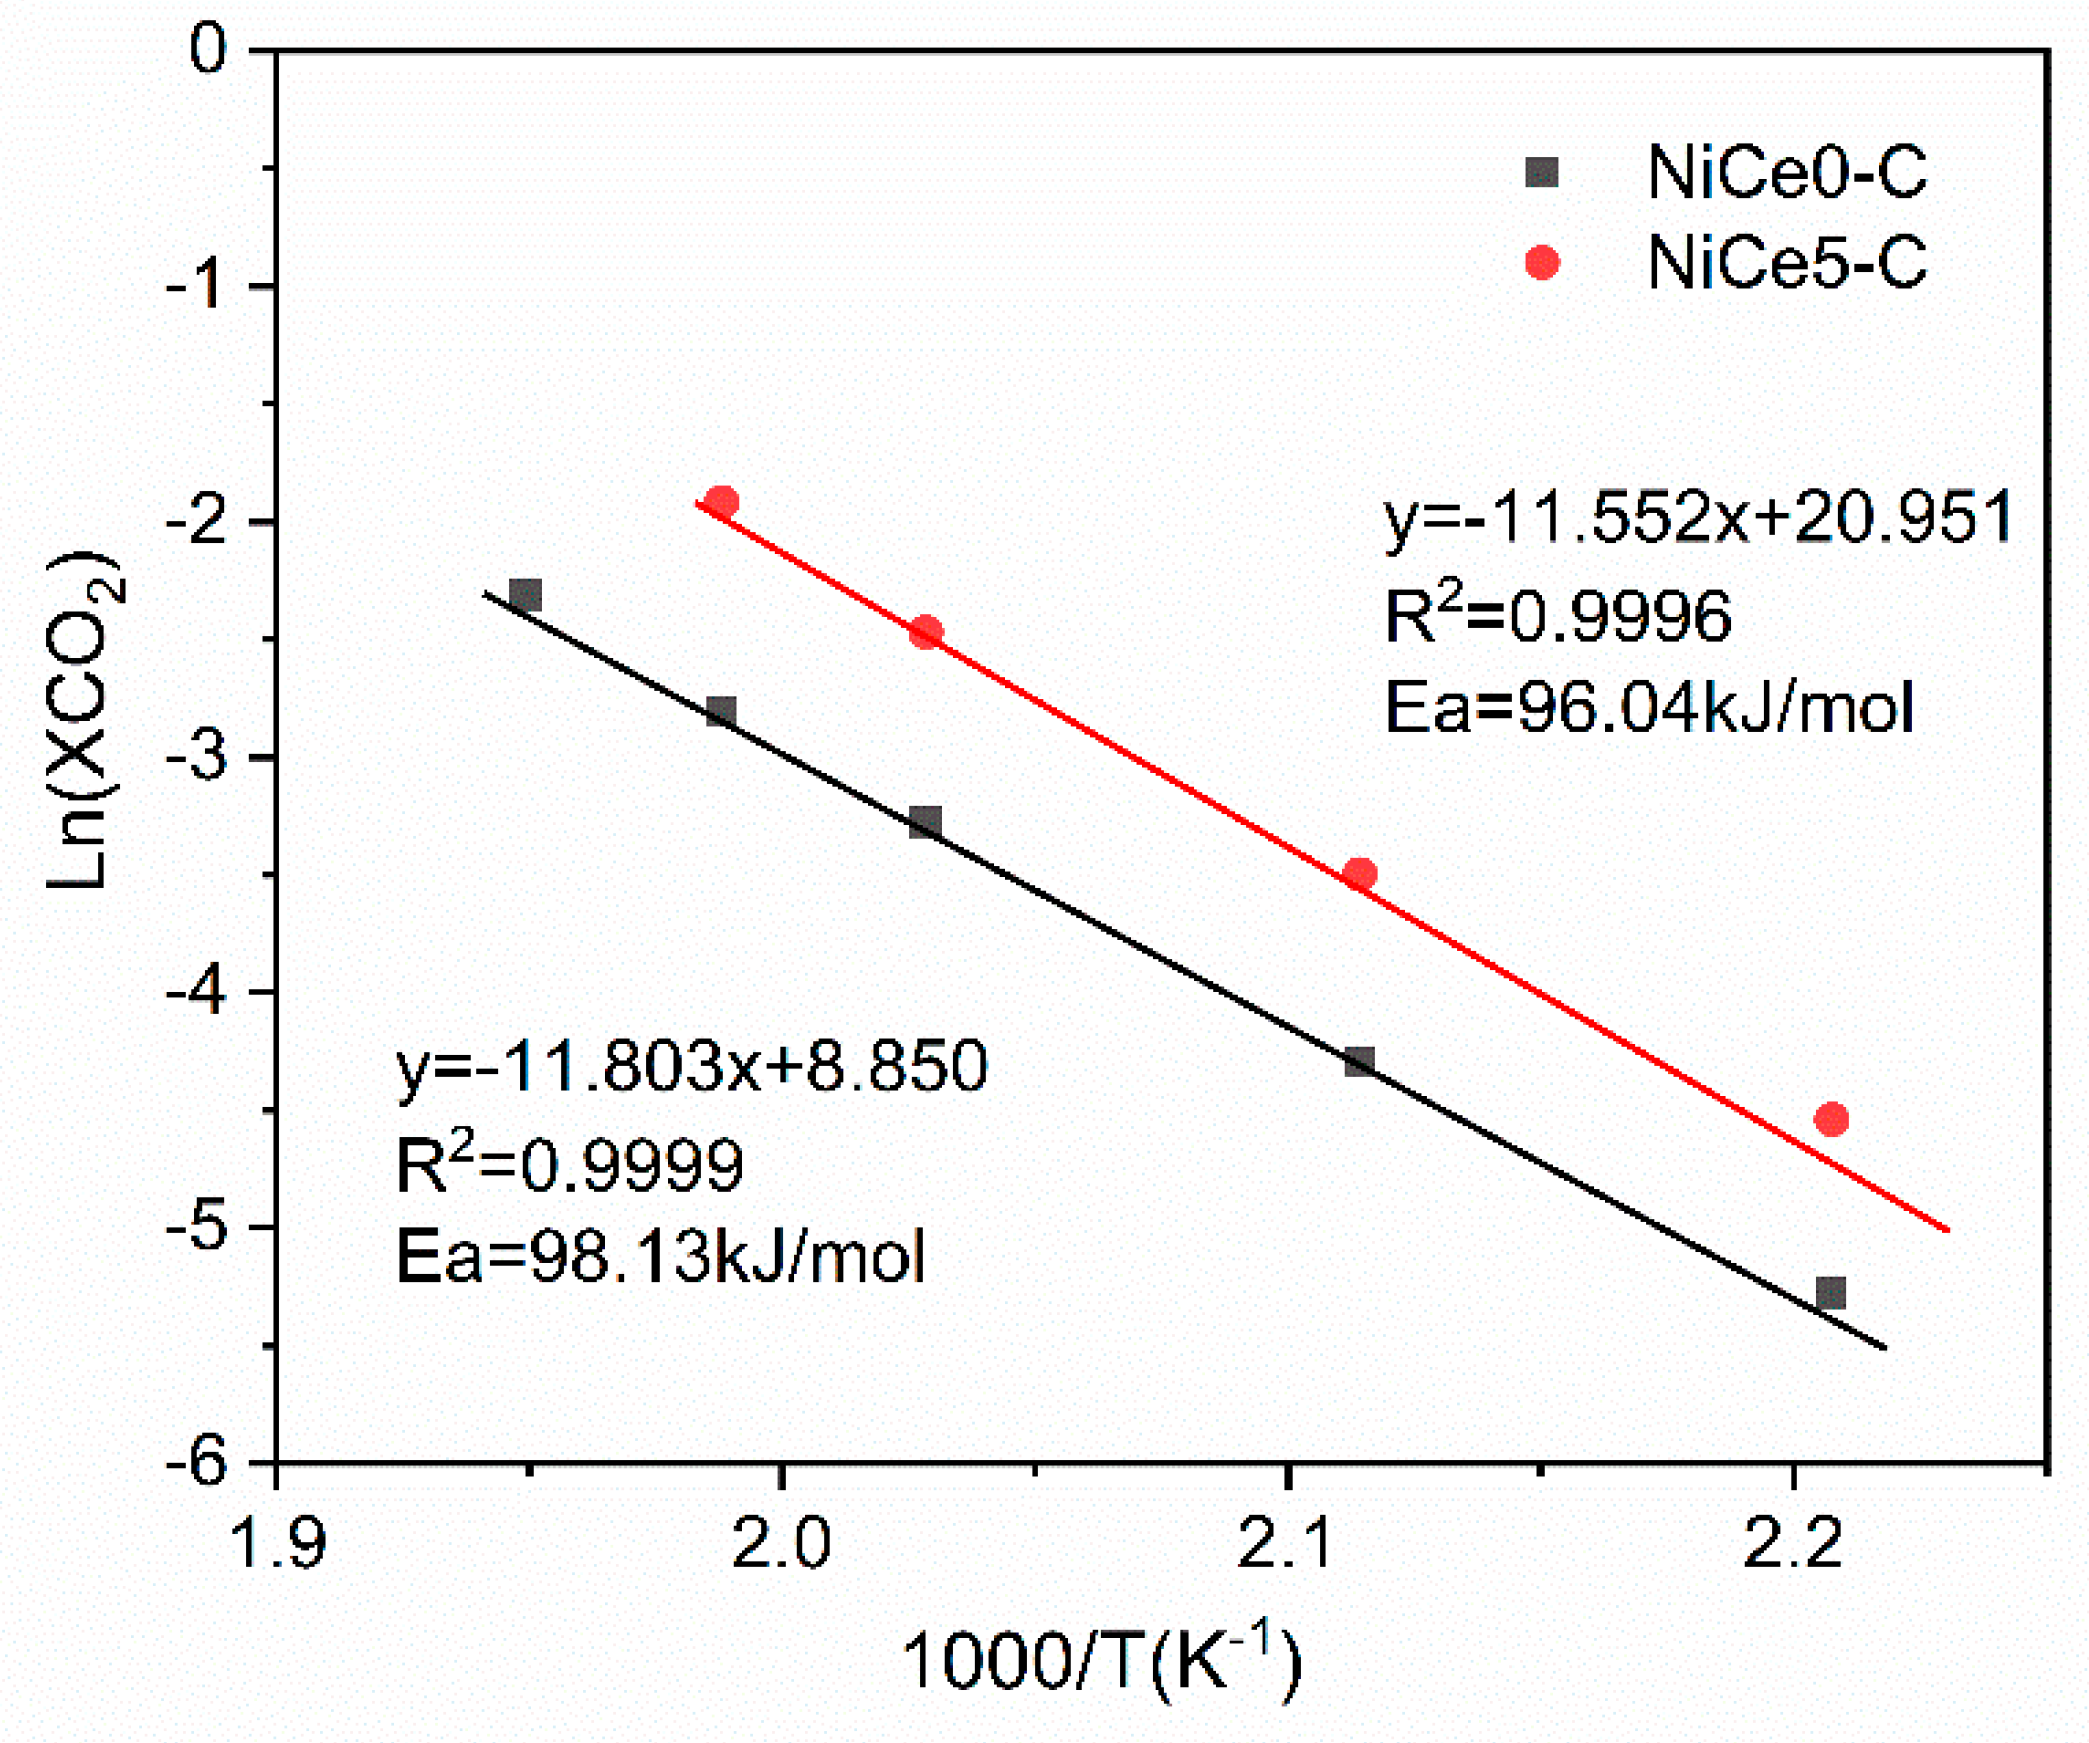
3.4. Catalytic Activity and Stability in CO2 Methanation Reaction
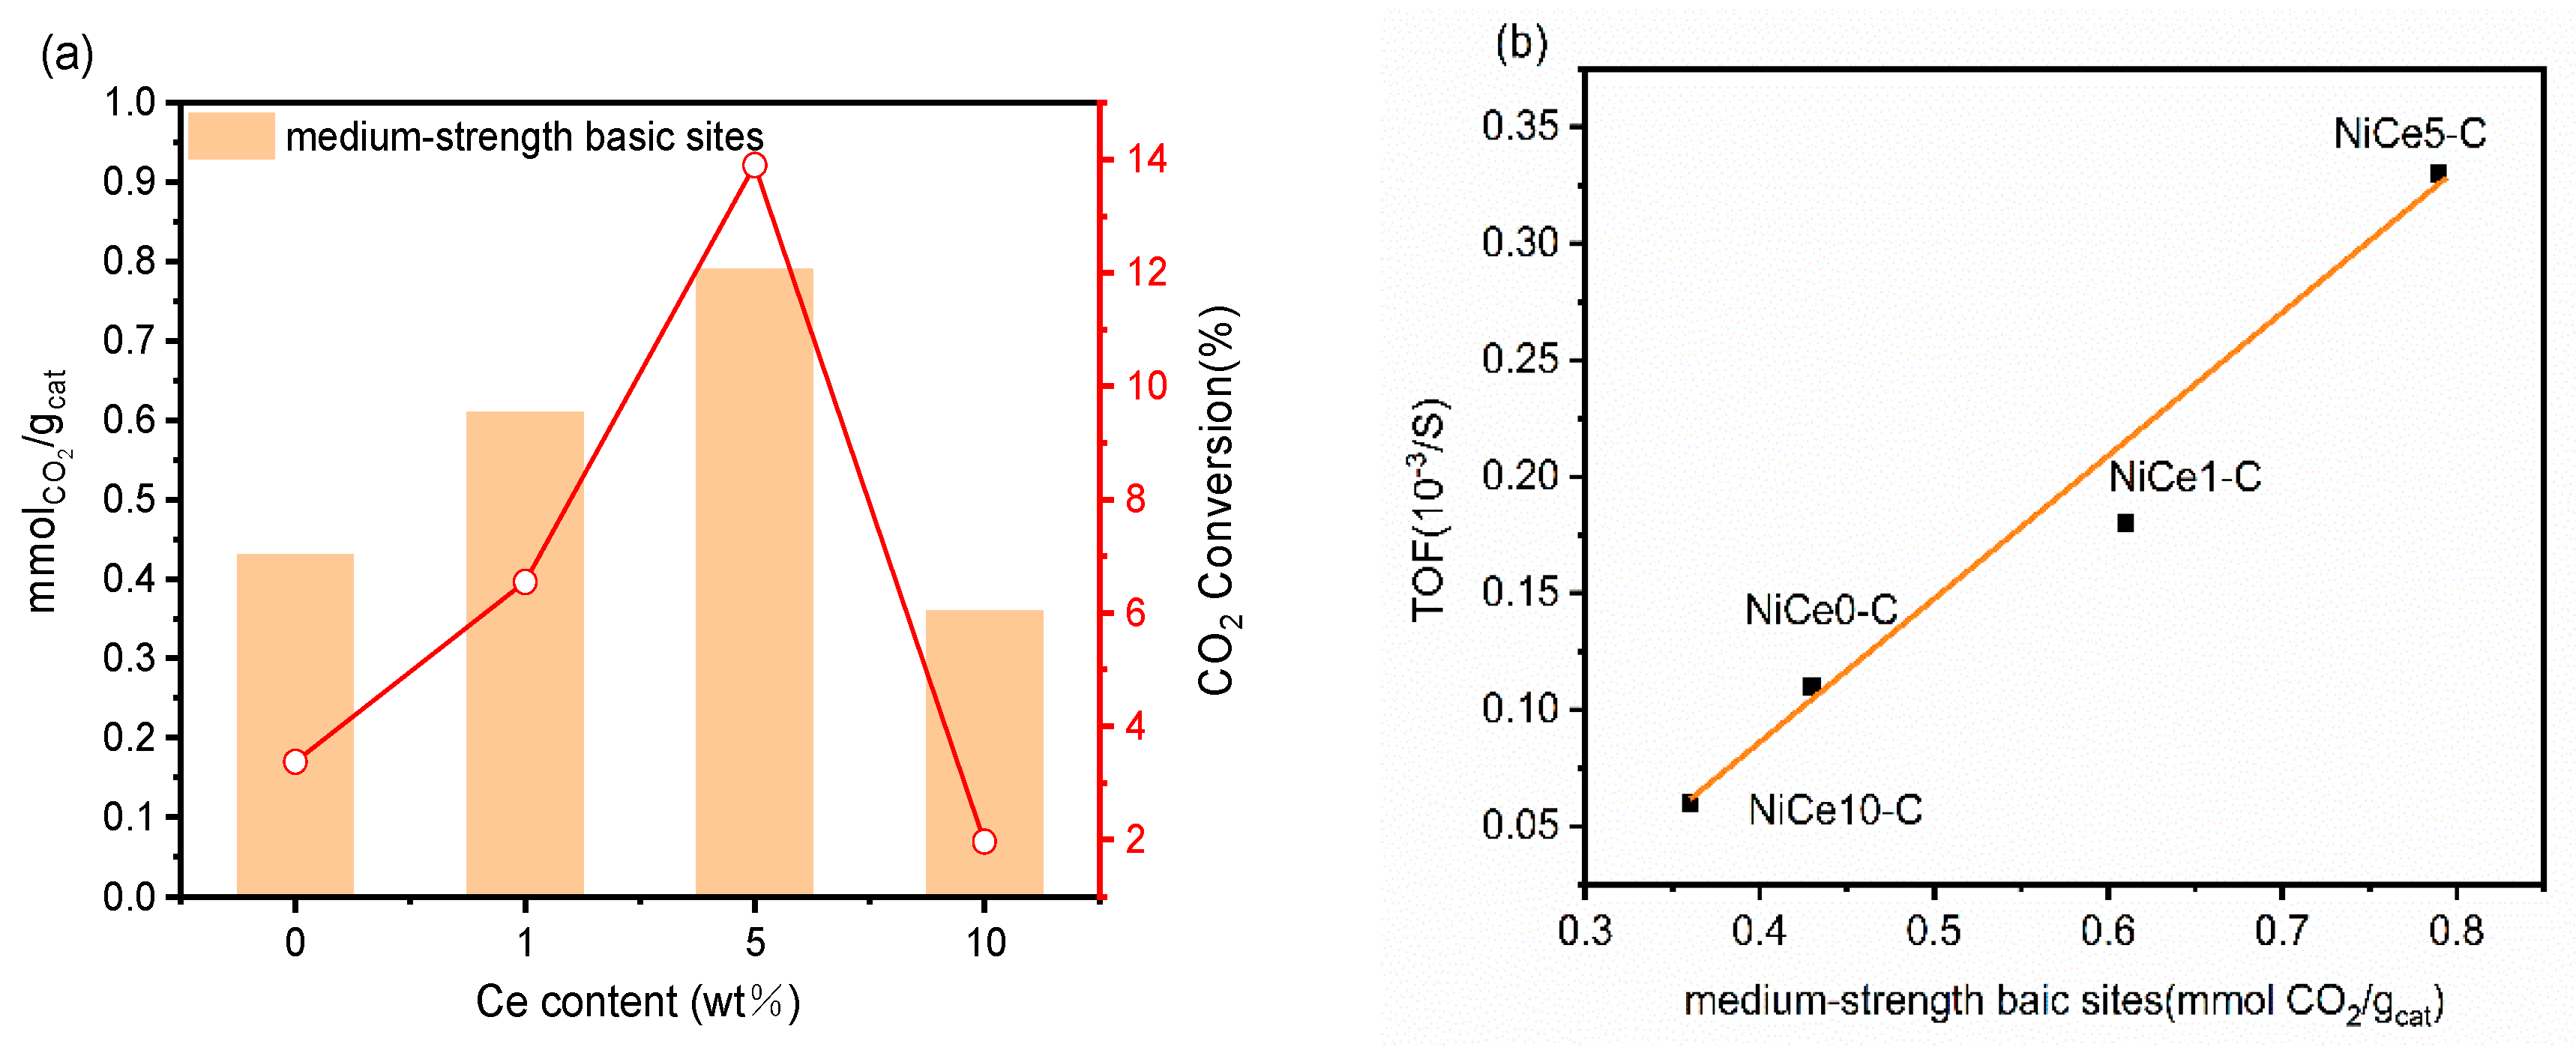
3.5. The Descriptors of the Relationship between Catalytic Performance and Surface Basicity
4. Conclusions
References
- Bian, Y.; Xu, C.; Wen, X.; Xu, L.; Cui, Y.; Wang, S.; Wu, C.-e.; Qiu, J.; Cheng, G.; Chen, M. , CO2 methanation over the Ni-based catalysts supported on nano-CeO2 with varied morphologies. Fuel 2023, 331. [Google Scholar] [CrossRef]
- Tada, S.; Kikuchi, R., Mechanistic study and catalyst development for selective carbon monoxide methanation. Catalysis Science & Technology 2015, 5, (6), 3061-3070.
- Lin, J.; Ma, C.; Wang, Q.; Xu, Y.; Ma, G.; Wang, J.; Wang, H.; Dong, C.; Zhang, C.; Ding, M. Enhanced low-temperature performance of CO2 methanation over mesoporous Ni/Al2O3-ZrO2 catalysts. Applied Catalysis B: Environmental 2019, 243, 262-272.
- Varvoutis, G.; Lykaki, M.; Stefa, S.; Binas, V.; Marnellos, G. E.; Konsolakis, M. Deciphering the role of Ni particle size and nickel-ceria interfacial perimeter in the low-temperature CO2 methanation reaction over remarkably active Ni/CeO2 nanorods. Applied Catalysis B: Environmental 2021, 297.
- Kopyscinski, J.; Schildhauer, T. J.; Biollaz, S. M. A. , Production of synthetic natural gas (SNG) from coal and dry biomass – A technology review from 1950 to 2009. Fuel 2010, 89,(8), 1763–1783. [Google Scholar] [CrossRef]
- Zhen, W.; Gao, F.; Tian, B.; Ding, P.; Deng, Y.; Li, Z.; Gao, H.; Lu, G. , Enhancing activity for carbon dioxide methanation by encapsulating (1 1 1) facet Ni particle in metal–organic frameworks at low temperature. Journal of Catalysis 2017, 348, 200–211. [Google Scholar] [CrossRef]
- Summa, P.; Swirk, K.; Wierzbicki, D.; Motak, M.; Alxneit, I.; Ronning, M.; Da Costa, P. Co-Precipitated Ni-Mg-Al Hydrotalcite-Derived Catalyst Promoted with Vanadium for CO2 Methanation. Molecules 2021, 26, (21).
- Rui, N.; Zhang, X.; Zhang, F.; Liu, Z.; Cao, X.; Xie, Z.; Zou, R.; Senanayake, S. D.; Yang, Y.; Rodriguez, J. A.; Liu, C.-J. Highly active Ni/CeO2 catalyst for CO2 methanation: Preparation and characterization. Applied Catalysis B: Environmental 2021, 282.
- Aziz, M. A. A.; Jalil, A. A.; Triwahyono, S.; Ahmad, A. , CO2 methanation over heterogeneous catalysts: recent progress and future prospects. Green Chemistry 2015, 17 (5), 2647–2663. [Google Scholar] [CrossRef]
- Mutz, B.; Carvalho, H. W. P.; Mangold, S.; Kleist, W.; Grunwaldt, J.-D. , Methanation of CO2: Structural response of a Ni-based catalyst under fluctuating reaction conditions unraveled by operando spectroscopy. Journal of Catalysis 2015, 327, 48–53. [Google Scholar] [CrossRef]
- Xiao, X.; Wang, J.; Li, J.; Dai, H.; Jing, F.; Liu, Y.; Chu, W. , Enhanced low-temperature catalytic performance in CO2 hydrogenation over Mn-promoted NiMgAl catalysts derived from quaternary hydrotalcite-like compounds. International Journal of Hydrogen Energy 2021, 46 (66), 33107–33119. [Google Scholar] [CrossRef]
- Ma, L.; Ye, R.; Huang, Y.; Reina, T. R.; Wang, X.; Li, C.; Zhang, X. L.; Fan, M.; Zhang, R.; Liu, J. , Enhanced low-temperature CO2 methanation performance of Ni/ZrO2 catalysts via a phase engineering strategy. Chemical Engineering Journal 2022, 446. [Google Scholar]
- Yan, Y.; Dai, Y.; He, H.; Yu, Y.; Yang, Y. A novel W-doped Ni-Mg mixed oxide catalyst for CO2 methanation. Applied Catalysis B: Environmental 2016, 196, 108-116.
- He, F.; Zhuang, J.; Lu, B.; Liu, X.; Zhang, J.; Gu, F.; Zhu, M.; Xu, J.; Zhong, Z.; Xu, G.; Su, F. Ni-based catalysts derived from Ni-Zr-Al ternary hydrotalcites show outstanding catalytic properties for low-temperature CO2 methanation. Applied Catalysis B: Environmental 2021, 293.
- Dębek, R.; Radlik, M.; Motak, M.; Galvez, M. E.; Turek, W.; Da Costa, P.; Grzybek, T. , Ni-containing Ce-promoted hydrotalcite derived materials as catalysts for methane reforming with carbon dioxide at low temperature – On the effect of basicity. Catalysis Today 2015, 257, 59–65. [Google Scholar] [CrossRef]
- Li, C.; Wei, M.; Evans, D. G.; Duan, X. , Layered double hydroxide-based nanomaterials as highly efficient catalysts and adsorbents. Small 2014, 10 (22), 4469–86. [Google Scholar] [CrossRef]
- Liu, J.; Bing, W.; Xue, X.; Wang, F.; Wang, B.; He, S.; Zhang, Y.; Wei, M. Alkaline-assisted Ni nanocatalysts with largely enhanced low-temperature activity toward CO2 methanation. Catalysis Science & Technology 2016, 6, (11), 3976-3983.
- Guo, X.; Gao, D.; He, H.; Traitangwong, A.; Gong, M.; Meeyoo, V.; Peng, Z.; Li, C. , Promotion of CO2 methanation at low temperature over hydrotalcite-derived catalysts-effect of the tunable metal species and basicity. International Journal of Hydrogen Energy 2021, 46 (1), 518–530. [Google Scholar] [CrossRef]
- Wang, J.; Xiao, X.; Li, J.; Gao, X.; Zheng, J.; Chu, W. , Hydrotalcite-derived Ni-LDO catalysts via new approach for enhanced performances in CO2 catalytic reduction. Fuel 2022, 324 (2022), 124491. [Google Scholar] [CrossRef]
- Wang Y, X. Y., Liu Q, Sun J, Ji S, Z.j. Wang., Enhanced low-temperature activity for CO2 methanation over NiMgAl_SiC. J Chem Technol Biotechnol 2019, 94, 3780–6.
- Du, X.; Zhang, D.; Gao, R.; Huang, L.; Shi, L.; Zhang, J. , Design of modular catalysts derived from NiMgAl-LDH@m-SiO2 with dual confinement effects for dry reforming of methane. Chem Commun (Camb) 2013, 49 (60), 6770–2. [Google Scholar] [CrossRef] [PubMed]
- Wierzbicki, D.; Debek, R.; Motak, M.; Grzybek, T.; Gálvez, M. E.; Da Costa, P. , Novel Ni-La-hydrotalcite derived catalysts for CO2 methanation. Catalysis Communications 2016, 83, 5–8. [Google Scholar] [CrossRef]
- Sun, C.; Świrk, K.; Wierzbicki, D.; Motak, M.; Grzybek, T.; Da Costa, P. , On the effect of yttrium promotion on Ni-layered double hydroxides-derived catalysts for hydrogenation of CO2 to methane. International Journal of Hydrogen Energy 2021, 46 (22), 12169–12179. [Google Scholar] [CrossRef]
- aufiq-Yap, Y. H.; Sudarno; Rashid, U.; Zainal, Z., CeO2–SiO2 supported nickel catalysts for dry reforming of methane toward syngas production. Applied Catalysis A: General 2013, 468, 359-369.
- Montini, T.; Melchionna, M.; Monai, M.; Fornasiero, P. , Fundamentals and Catalytic Applications of CeO2-Based Materials. Chem Rev 2016, 116 (10), 5987–6041. [Google Scholar] [CrossRef]
- Dębek, R.; Motak, M.; Galvez, M. E.; Grzybek, T.; Da Costa, P. , Influence of Ce/Zr molar ratio on catalytic performance of hydrotalcite-derived catalysts at low temperature CO2 methane reforming. International Journal of Hydrogen Energy 2017, 42 (37), 23556–23567. [Google Scholar] [CrossRef]
- Cárdenas-Arenas, A.; Quindimil, A.; Davó-Quiñonero, A.; Bailón-García, E.; Lozano-Castelló, D.; De-La-Torre, U.; Pereda-Ayo, B.; González-Marcos, J. A.; González-Velasco, J. R.; Bueno-López, A. Isotopic and in situ DRIFTS study of the CO2 methanation mechanism using Ni/CeO2 and Ni/Al2O3 catalysts. Applied Catalysis B: Environmental 2020, 265.
- Zhang, J.; Ren, B.; Fan, G.; Yang, L.; Li, F. Exceptional low-temperature activity of a perovskite-type AlCeO3 solid solution-supported Ni-based nanocatalyst towards CO2 methanation. Catalysis Science & Technology 2021, 11, (11), 3894-3904.
- Dębek, R.; Galvez, M. E.; Launay, F.; Motak, M.; Grzybek, T.; Da Costa, P. , Low temperature dry methane reforming over Ce, Zr and CeZr promoted Ni–Mg–Al hydrotalcite-derived catalysts. International Journal of Hydrogen Energy 2016, 41 (27), 11616–11623. [Google Scholar] [CrossRef]
- Wierzbicki, D.; Baran, R.; Dębek, R.; Motak, M.; Grzybek, T.; Gálvez, M. E.; Da Costa, P. , The influence of nickel content on the performance of hydrotalcite-derived catalysts in CO2 methanation reaction. International Journal of Hydrogen Energy 2017, 42 (37), 23548–23555. [Google Scholar] [CrossRef]
- Lin, S.; Hao, Z.; Shen, J.; Chang, X.; Huang, S.; Li, M.; Ma, X. , Enhancing the CO2 methanation activity of Ni/CeO2 via activation treatment-determined metal-support interaction. Journal of Energy Chemistry 2021, 59, 334–342. [Google Scholar] [CrossRef]
- Guo, X.; Peng, Z.; Hu, M.; Zuo, C.; Traitangwong, A.; Meeyoo, V.; Li, C.; Zhang, S. Highly Active Ni-Based Catalyst Derived from Double Hydroxides Precursor for Low Temperature CO2 Methanation. Industrial & Engineering Chemistry Research 2018, 57, (28), 9102-9111.
- Gao, J.; Jiang, Q.; Liu, Y.; Liu, W.; Chu, W.; Su, D. S. , Probing the enhanced catalytic activity of carbon nanotube supported Ni-LaO(x) hybrids for the CO(2) reduction reaction. Nanoscale 2018, 10 (29), 14207–14219. [Google Scholar] [CrossRef]
- Wang, X.; Liu, Q.; Jiang, J.; Jin, G.; Li, H.; Gu, F.; Xu, G.; Zhong, Z.; Su, F. SiO2-stabilized Ni/t-ZrO2 catalysts with ordered mesopores: one-pot synthesis and their superior catalytic performance in CO methanation. Catalysis Science & Technology 2016, 6, (10), 3529-3543.
- Xu, X.; Liu, L.; Tong, Y.; Fang, X.; Xu, J.; Jiang, D.-e.; Wang, X. , Facile Cr3+-Doping Strategy Dramatically Promoting Ru/CeO2 for Low-Temperature CO2 Methanation: Unraveling the Roles of Surface Oxygen Vacancies and Hydroxyl Groups. ACS Catalysis 2021, 11 (9), 5762–5775. [Google Scholar] [CrossRef]
- Asencios, Y. J. O.; Elias, K. F. M.; Assaf, E. M. , Oxidative-reforming of model biogas over NiO/Al2O3 catalysts: The influence of the variation of support synthesis conditions. Applied Surface Science 2014, 317, 350–359. [Google Scholar] [CrossRef]
- Zhang, Q.; Xu, R.; Liu, N.; Dai, C.; Yu, G.; Wang, N.; Chen, B. , In situ Ce-doped catalyst derived from NiCeAl-LDHs with enhanced low-temperature performance for CO2 methanation. Applied Surface Science 2022, 579. [Google Scholar] [CrossRef]
- Tanasoi, S.; Mitran, G.; Tanchoux, N.; Cacciaguerra, T.; Fajula, F.; Săndulescu, I.; Tichit, D.; Marcu, I.-C. Transition metal-containing mixed oxides catalysts derived from LDH precursors for short-chain hydrocarbons oxidation. Applied Catalysis A: General 2011, 395, (1-2), 78-86.
- Tao, M.; Meng, X.; Lv, Y.; Bian, Z.; Xin, Z. , Effect of impregnation solvent on Ni dispersion and catalytic properties of Ni/SBA-15 for CO methanation reaction. Fuel 2016, 165, 289–297. [Google Scholar] [CrossRef]
- Kim, M.-J.; Youn, J.-R.; Kim, H. J.; Seo, M. W.; Lee, D.; Go, K. S.; Lee, K. B.; Jeon, S. G. , Effect of surface properties controlled by Ce addition on CO2 methanation over Ni/Ce/Al2O3 catalyst. International Journal of Hydrogen Energy 2020, 45 (46), 24595–24603. [Google Scholar] [CrossRef]
- Guo, X.; He, H.; Traitangwong, A.; Gong, M.; Meeyoo, V.; Li, P.; Li, C.; Peng, Z.; Zhang, S. Ceria imparts superior low temperature activity to nickel catalysts for CO2 methanation. Catalysis Science & Technology 2019, 9, (20), 5636-5650.
- Bette, N.; Thielemann, J.; Schreiner, M.; Mertens, F. , Methanation of CO2 over a (Mg,Al)OxSupported Nickel Catalyst Derived from a (Ni,Mg,Al)-Hydrotalcite-like Precursor. ChemCatChem 2016, 8 (18), 2903–2906. [Google Scholar] [CrossRef]
- Du, X.; Zhang, D.; Shi, L.; Gao, R.; Zhang, J. , Coke- and sintering-resistant monolithic catalysts derived from in situ supported hydrotalcite-like films on Al wires for dry reforming of methane. Nanoscale 2013, 5 (7), 2659–63. [Google Scholar] [CrossRef]
- Xiao, X.; Gao, J.; Xi, S.; Lim, S. H.; Png, A. K. W.; Borgna, A.; Chu, W.; Liu, Y. Experimental and in situ DRIFTs studies on confined metallic copper stabilized Pd species for enhanced CO2 reduction to formate. Applied Catalysis B: Environmental 2022, 309.
- Duarte, R. B.; Nachtegaal, M.; Bueno, J. M. C.; van Bokhoven, J. A. , Understanding the effect of Sm2O3 and CeO2 promoters on the structure and activity of Rh/Al2O3 catalysts in methane steam reforming. Journal of Catalysis 2012, 296, 86–98. [Google Scholar] [CrossRef]
- Du, Y.; Qin, C.; Xu, Y.; Xu, D.; Bai, J.; Ma, G.; Ding, M. , Ni nanoparticles dispersed on oxygen vacancies-rich CeO2 nanoplates for enhanced low-temperature CO2 methanation performance. Chemical Engineering Journal 2021, 418. [Google Scholar] [CrossRef]
- Sato, A. G.; Volanti, D. P.; Meira, D. M.; Damyanova, S.; Longo, E.; Bueno, J. M. C. , Effect of the ZrO2 phase on the structure and behavior of supported Cu catalysts for ethanol conversion. Journal of Catalysis 2013, 307, 1–17. [Google Scholar] [CrossRef]
- Amin, R.; Chang, X.; Liu, B., Synergistic Effect of CeO2 in CH4/CO2 Dry Reforming Reaction over Stable xCeO2 yNi/MCM-22 Catalysts. Industrial & Engineering Chemistry Research 2017, 56, (26), 7445-7453.
- Wu, Y.; Lin, J.; Ma, G.; Xu, Y.; Zhang, J.; Samart, C.; Ding, M. , Ni nanocatalysts supported on mesoporous Al2O3-CeO2 for CO2 methanation at low temperature. RSC Adv 2020, 10 (4), 2067–2072. [Google Scholar] [CrossRef]
- Li, W.; Liu, Y.; Mu, M.; Ding, F.; Liu, Z.; Guo, X.; Song, C. Organic acid-assisted preparation of highly dispersed Co/ZrO2 catalysts with superior activity for CO2 methanation. Applied Catalysis B: Environmental 2019, 254, 531-540.
- Satthawong, R.; Koizumi, N.; Song, C.; Prasassarakich, P. Bimetallic Fe–Co catalysts for CO2 hydrogenation to higher hydrocarbons. Journal of CO2 Utilization 2013, 3-4, 102-106.
- Li, Y.; Men, Y.; Liu, S.; Wang, J.; Wang, K.; Tang, Y.; An, W.; Pan, X.; Li, L. Remarkably efficient and stable Ni/Y2O3 catalysts for CO2 methanation: Effect of citric acid addition. Applied Catalysis B: Environmental 2021, 293.
- Liu, Z.; Gao, X.; Liu, B.; Song, W.; Ma, Q.; Zhao, T.-s.; Wang, X.; Bae, J. W.; Zhang, X.; Zhang, J. Highly stable and selective layered Co-Al-O catalysts for low-temperature CO2 methanation. Applied Catalysis B: Environmental 2022, 310.
- Dai, Y.; Xu, M.; Wang, Q.; Huang, R.; Jin, Y.; Bian, B.; Tumurbaatar, C.; Ishtsog, B.; Bold, T.; Yang, Y. Enhanced activity and stability of Ni/La2O2CO3 catalyst for CO2 methanation by metal-carbonate interaction. Applied Catalysis B: Environmental 2020, 277.
- Wierzbicki, D.; Baran, R.; Dębek, R.; Motak, M.; Gálvez, M. E.; Grzybek, T.; Da Costa, P.; Glatzel, P. Examination of the influence of La promotion on Ni state in hydrotalcite-derived catalysts under CO2 methanation reaction conditions: Operando X-ray absorption and emission spectroscopy investigation. Applied Catalysis B: Environmental 2018, 232, 409-419.
- Xu, Y.; Wu, Y.; Li, J.; Wei, S.; Gao, X.; Wang, P. , Combustion-impregnation preparation of Ni/SiO2 catalyst with improved low-temperature activity for CO2 methanation. International Journal of Hydrogen Energy 2021, (40), 20919–20929. [Google Scholar] [CrossRef]
- Weidler, N.; Schuch, J.; Knaus, F.; Stenner, P.; Hoch, S.; Maljusch, A.; Schäfer, R.; Kaiser, B.; Jaegermann, W. , X-ray Photoelectron Spectroscopic Investigation of Plasma-Enhanced Chemical Vapor Deposited NiOx, NiOx(OH)y, and CoNiOx(OH)y: Influence of the Chemical Composition on the Catalytic Activity for the Oxygen Evolution Reaction. The Journal of Physical Chemistry C 2017, 121 (12), 6455–6463. [Google Scholar] [CrossRef]
- Wu, H.; Pantaleo, G.; La Parola, V.; Venezia, A. M.; Collard, X.; Aprile, C.; Liotta, L. F. Bi- and trimetallic Ni catalysts over Al2O3 and Al2O3-MO (M = Ce or Mg) oxides for methane dry reforming: Au and Pt additive effects. Applied Catalysis B: Environmental 2014, 156-157, 350-361.
- Cao, Y.; Li, H.; Zhang, J.; Shi, L.; Zhang, D. , Promotional effects of rare earth elements (Sc, Y, Ce, and Pr) on NiMgAl catalysts for dry reforming of methane. RSC Advances 2016, 6 (113), 112215–112225. [Google Scholar] [CrossRef]
- Ang, M. L.; Oemar, U.; Kathiraser, Y.; Saw, E. T.; Lew, C. H. K.; Du, Y.; Borgna, A.; Kawi, S. , High-temperature water–gas shift reaction over Ni/xK/CeO2 catalysts: Suppression of methanation via formation of bridging carbonyls. Journal of Catalysis 2015, 329, 130–143. [Google Scholar] [CrossRef]
- Lin, B.; Lei, Z.; Xu, F.; Cheng, N.; Mu, S. , Poly(vinylpyrrolidone) tailored porous ceria as a carbon-free support for methanol electrooxidation. Electrochimica Acta 2018, 290, 55–62. [Google Scholar] [CrossRef]
- Li, W.; Nie, X.; Jiang, X.; Zhang, A.; Ding, F.; Liu, M.; Liu, Z.; Guo, X.; Song, C. ZrO2 support imparts superior activity and stability of Co catalysts for CO2 methanation. Applied Catalysis B: Environmental 2018, 220, 397-408.
- Gao, J.; Jiang, Q.; Liu, Y.; Liu, W.; Chu, W.; Su, D. S. , Probing the enhanced catalytic activity of carbon nanotube supported Ni-LaOx hybrids for the CO2 reduction reaction. Nanoscale 2018, 10 (29), 14207–14219. [Google Scholar] [CrossRef] [PubMed]
- Gao, J.; Wang, Y.; Ping, Y.; Hu, D.; Xu, G.; Gu, F.; Su, F. A thermodynamic analysis of methanation reactions of carbon oxides for the production of synthetic natural gas. RSC Advances 2012, 2, (6).
- Cai, M.; Wen, J.; Chu, W.; Cheng, X.; Li, Z. , Methanation of carbon dioxide on Ni/ZrO2-Al2O3 catalysts: Effects of ZrO2 promoter and preparation method of novel ZrO2-Al2O3 carrier. Journal of Natural Gas Chemistry 2011, 20 (3), 318–324. [Google Scholar] [CrossRef]
- Wang, W.; Chu, W.; Wang, N.; Yang, W.; Jiang, C. , Mesoporous nickel catalyst supported on multi-walled carbon nanotubes for carbon dioxide methanation. International Journal of Hydrogen Energy 2016, 41 (2), 967–975. [Google Scholar] [CrossRef]
- Pan, Q.; Peng, J.; Sun, T.; Wang, S.; Wang, S. , Insight into the reaction route of CO2 methanation: Promotion effect of medium basic sites. Catalysis Communications 2014, 45, 74–78. [Google Scholar] [CrossRef]
- Zhang, L.; Bian, L.; Zhu, Z.; Li, Z. , La-promoted Ni/Mg-Al catalysts with highly enhanced low-temperature CO2 methanation performance. International Journal of Hydrogen Energy 2018, 43 (4), 2197–2206. [Google Scholar] [CrossRef]
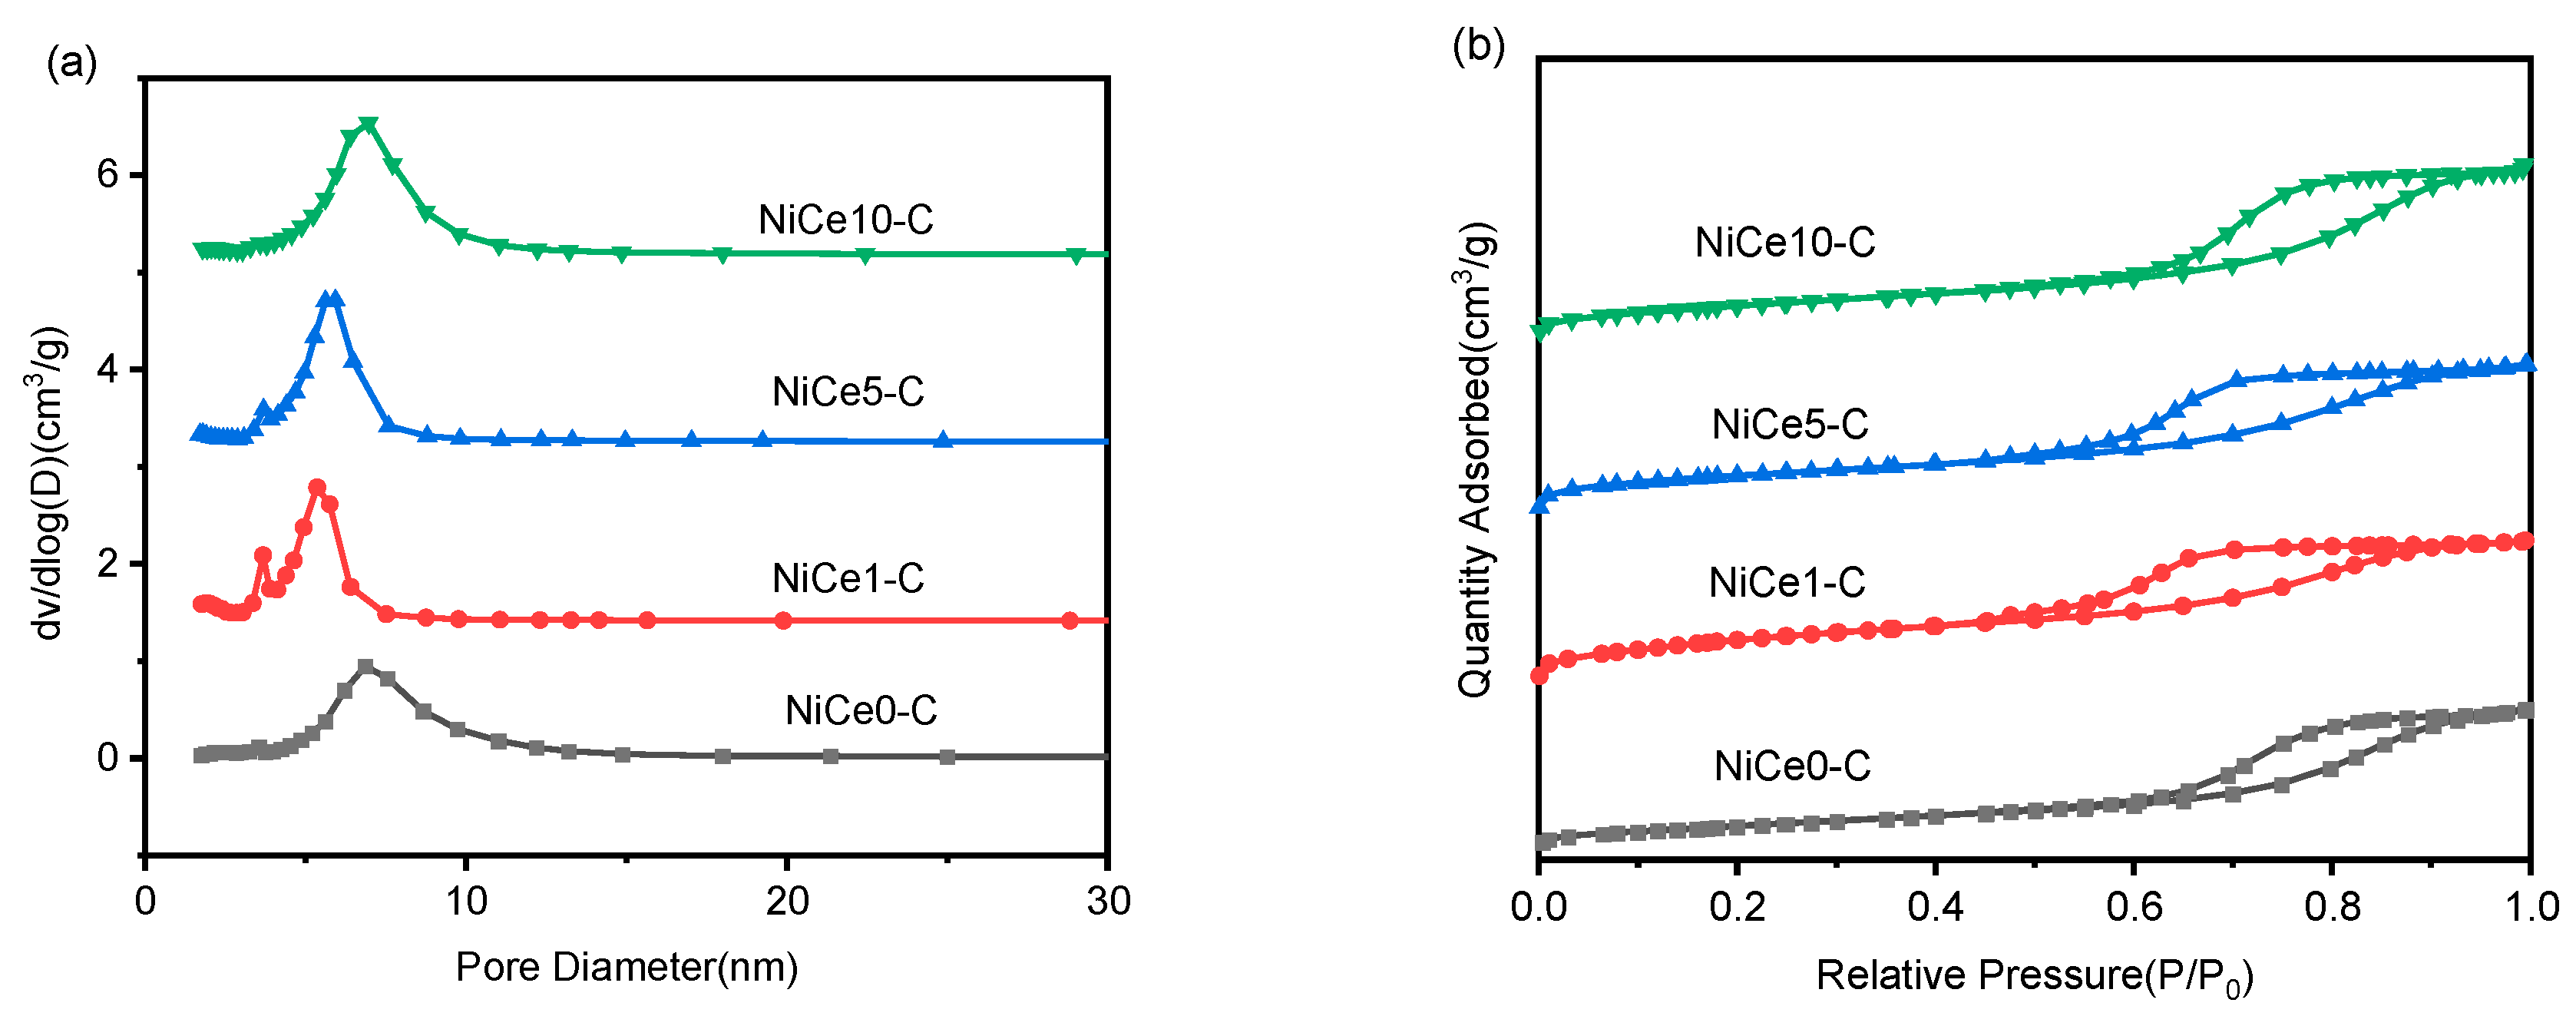
| Sample | SBETa(m2/g) | Vpb(cm3/g) | Dpc(nm) | Nid% | Cee% | Mg/Alf |
|---|---|---|---|---|---|---|
| NiCe0-C | 127.7 | 0.24 | 6.41 | 44.5 | 0.0 | 1.5 |
| NiCe1-C | 215.0 | 0.25 | 6.25 | 40.5 | 0.79 | 1.5 |
| NiCe5-C | 176.9 | 0.26 | 5.24 | 40.1 | 4.07 | 1.5 |
| NiCe10-C | 169.0 | 0.29 | 4.37 | 42.3 | 8.70 | 1.4 |
| Samples | Reduction temperature (℃) | Relative content (%) | |||||
|---|---|---|---|---|---|---|---|
| α | β | γ | α | β | γ | ||
| NiCe0-C | 108 | 173 | 277 | 16.1 | 36.2 | 47.7 | |
| NiCe1-C | 100 | 145 | 250 | 13.9 | 35.5 | 50.6 | |
| NiCe5-C | 117 | 170 | 264 | 11.9 | 30.3 | 57.8 | |
| NiCe10-C | 103 | 154 | 245 | 14.3 | 40.5 | 45.2 | |
| Samples | Weak-strength basic sites (α+β) (mmol CO2/gcat) |
Medium-strength basic sites (γ) (mmol CO2/gcat) |
CO2-adsorption amount (mmol CO2/gcat) |
|---|---|---|---|
| NiCe0-C | 0.48 | 0.43 | 0.91 |
| NiCe1-C | 0.59 | 0.61 | 1.20 |
| NiCe5-C | 0.58 | 0.79 | 1.37 |
| NiCe10-C | 0.44 | 0.36 | 0.80 |
| Samples | Relative content (%) | |
|---|---|---|
| Ni0/(Ni0+Ni2+) | Ce3+/(Ce3++ Ce4+) | |
| NiCe0-C | 31.5 | 0.0 |
| NiCe1-C | 34.7 | 19.6 |
| NiCe5-C | 40.5 | 23.2 |
| NiCe10-C | 34.1 | 18.8 |
| Samples | Conversion (%) | Selectivity (%) | RCO2(μmolCO2/gcat/s) | TOF(h-1) | |
|---|---|---|---|---|---|
| CH4 | CO | ||||
| NiCe0-C | 3.4 | 98.7 | 1.3 | 1.26 | 0.39 |
| NiCe1-C | 6.6 | 98.9 | 1.1 | 2.43 | 0.65 |
| NiCe5-C | 13.9 | 99.8 | 0.2 | 5.17 | 1.19 |
| NiCe10-C | 2.0 | 98.9 | 1.1 | 0.73 | 0.22 |
| Reaction conditions: T=225℃ (conversion < 15%), GHSV=15000 mL/gcat/h H2/CO2 =4 (molar ratio), 50 mL/min, 200 mg catalyst. | |||||
Disclaimer/Publisher’s Note: The statements, opinions and data contained in all publications are solely those of the individual author(s) and contributor(s) and not of MDPI and/or the editor(s). MDPI and/or the editor(s) disclaim responsibility for any injury to people or property resulting from any ideas, methods, instructions or products referred to in the content. |
© 2023 by the authors. Licensee MDPI, Basel, Switzerland. This article is an open access article distributed under the terms and conditions of the Creative Commons Attribution (CC BY) license (http://creativecommons.org/licenses/by/4.0/).


