Submitted:
22 May 2023
Posted:
23 May 2023
You are already at the latest version
Abstract
The foundation for accurately understanding regional land-use structures and pursuing the coordination of human–land relations is the scientific identification and simulation of temporal and spatial evolution patterns of land-use spatial conflict (LUSC). Taking the Yimengshan Geopark (YG) as an example, based on the productional–living–ecological space (PLES) perspective, which constructs a land-use spatial conflict identification and intensity diagnosis model (LUCSII) using the landscape ecology index. We apply geographic information system (GIS) and other methods to achieve the spatial pattern of LUSC over the last 20 years, and we use the GMOP–Markov–PLUS model to simulate the evolution of LUSC in the future under various scenarios. From 2000 to 2020, the LUSC values in the YG were mainly stable and controllable, with mild conflict, while the areas of severe conflict were mainly concentrated in the central urban area of Mengyin County and in low and flat terrain areas such as southern Bailin Town. The LUSC in the YG showed a significant positive spatial correlation, and spatial agglomeration is gradually strengthening. The high–high clusters are found in contiguous areas at the junction of Changlu Town, Gaodu Town, and Mengyin Street, as well as in the southern hilly areas. The low–low clusters were concentrated in Yedian Town, Daigu Town inarea north of the study, and areas surrounding Yunmeng Lake Wetland Park. In the next ten years, the ecological priority scenario (EPD) and sustainable development scenario (ESD) will both be reasonable options for easing and controlling LUSC in YG. Local governments and park management bureaus should determine the three lines and three zones based on the needs of social and economic development, particularly the boundary red line for construction land growth, and plan production and living spaces to alleviate land-use conflicts and stabilize the land-use system. Regional ecological security can be maintained, and future deterioration of the park’s ecological environment avoided, by performing well in terms of ecological isolation.
Keywords:
Land-use spatial conflict
; Productional-living-ecological space
; Multiscenario simulation
; Grey multiobjective optimization
; Yimengshan Geopark
1. Introduction
The interplay and coupling of regional populations and the physical geography environment constitute a spatial conflict under the backdrop of territorial ecological alteration, and the land productivity, life, and ecological functions are becoming out of unbalanced [1]. Therefore, the 18th National Congress of the Communist Party of China clearly put forward the productional–living–ecological space (PLES) development goal of “intensive and efficient production space, livable and moderate living space, and ecological space with beautiful mountains and clear waters.” At present, the problem of LUSC has attracted the attention of governments at all levels and all sectors of society. The quantitative identification of LUSC, its spatial patterns, and multiscenario simulations have become hot issues in the field of geography and land science. In recent years, with the continuous increase of people’s demand for tourism, tourism products have gradually shifted from a single sightseeing category to a vacation category that integrates sightseeing tourism, vacation and leisure, health care and recuperation, and cultural entertainment [2]. Resorts, geoparks, and other specific areas organically integrate natural and cultural landscapes [3], becoming important places for professional upgrading of rural tourism. Geoparks are not only key protected areas for geological relic landscapes and ecological environments, but also bases for conducting geological scientific research and popularization of education. The natural environment and socioeconomic issues caused by the development and protection of geological parks have received widespread attention. Land resources as an important carrier for socioeconomic and ecological development of geological parks. Land-use types and structures within the region exhibit a diversified and composite trend driven by the planning and construction of supporting facilities such as transportation, catering, accommodation, shopping, and amusement facilities [4]. The land-use conflicts caused by these activities have become urgent problems to be solved for the sustainable development of geological parks.
Land-use conflict refers to inconsistency and disharmony among many stakeholders in the process of land resource use in terms of the methods, quantity, and other aspects of land use, as well as the contradictory state between various land-use methods and the environmental aspects [5]. Its connotation is the evolution of various interest conflicts and multiple land-use functions [5,6,7]. At present, the global academic community has achieved rich research results on land-use conflict, mainly focusing on the following four aspects.The first is research on the identification and classification of land-use conflict. There are three categories of methods for identifying land-use conflict: 1) qualitative identification methods such as participatory surveys, logical framework approach, and other qualitative identification methods [8,9]. 2) the comprehensive index method, which constructs a comprehensive index of land-use conflict through the pressure–state–response model and the complexity–vulnerability–stability model of land ecosystems [6,10,11]; this method is simple to operate and can reflect the relative strength of conflict. 3) the map factors overlay method, which is widely used for land-use conflict recognition and intensity diagnosis due to its accurate positioning [2,12]. In addition, the catastrophe series method, improved grey target model, minimum cumulative resistance model, and public participation GIS (PPGIS) have achieved good results in the identification of land-use conflict [13,14,15,16]. The classification system for land-use conflict varies due to differences in research perspectives, research purposes, and geographical location conditions [17,18]. The second is research on the causes and mechanisms of land-use conflict, in which the correlation studies reveal the impacts of land systems, land scarcity, land competition, and socioeconomic factors on land-use conflict [19,20,21], while pointing out natural conditions, population growth, historical basis, and the economic development is an important factor affecting the evolution of land-use conflict [22,23,24,25]. In addition, global climate change and cross-regional flows of population and resources in the context of globalization have become new incentives for land-use conflict. The third is research on mitigation and regulation of land-use conflict. Scholars use game theory, multiobjective planning, and genetic algorithms to regulate land-use conflict based on the perspective of land-use planning and management [26,27,28], focusing on alleviating multiple contradictions and on the decision-making equilibrium question, but it is difficult to achieve differentiated and targeted regulation of land-use conflict. With the development of remote sensing (RS), geographic information system (GIS), and artificial intelligence technology, methods such as actor networks, participatory GIS, and spatial planning have become important methods for alleviating conflict [13,29,30]. Moreover, policies, systems, laws, and regulations are also important means of conflict regulation and control. The fourth is research on multiscenario simulation and specific areas of land-use conflict, which are based on future land use simulation model (FLUS), the conversion of land use and its effects modelling framework-simulation (CLUE-S), Markov-cellular automata (CA), and other models. The research on land-use conflict in specific areas such as mining areas, vacation areas, national park communities, and mine–grain mixed zones has received much attention. Overall, research on land-use conflict is becoming increasingly comprehensive, greatly enriching the connotation and analysis methods of land-use conflict, providing a theoretical basis and scientific support for effectively alleviating land-use conflict and the contradictions between humans and land. The miniaturization of research scales has become a new research trend, and vacation areas and nature reserves with complex functional positioning have become new research hotspots. The evolution of future land-use conflict is especially worthy of further exploration. With the popularization of the concept of economy–environment–society for sustainable development, exploring regional land zoning and use from the perspective of PLES has been accepted by many scholars [31]. Therefore, how to coordinate the functions of multiple land systems in these regions and optimize the territorial spatial pattern has become an important discussion topic to solve the conflict of land production, living space, and ecological space.
Delineating space for geological parks and allocating various spatial resources based on the perspective of the PLES has become an important lever for promoting ecological environmental protection, governance, and rural revitalization. This study constructs a LUSC identification and intensity diagnosis model using the landscape pattern ecological index from the perspective of PLES and using GIS, spatial autocorrelation analysis, and other methods to reveal the spatial and temporal differentiation characteristics of LUSC from 2000 to 2020 in YG. Finally, we used the Patch-generating Land-use Simulation (PLUS) Model to construct different scenarios to simulate the evolution of future LUSC, to provide a reference for promoting the orderly use of land resources in the YG and building a harmonious human–land relationship.
2. Materials and Methods
2.1. Study Area
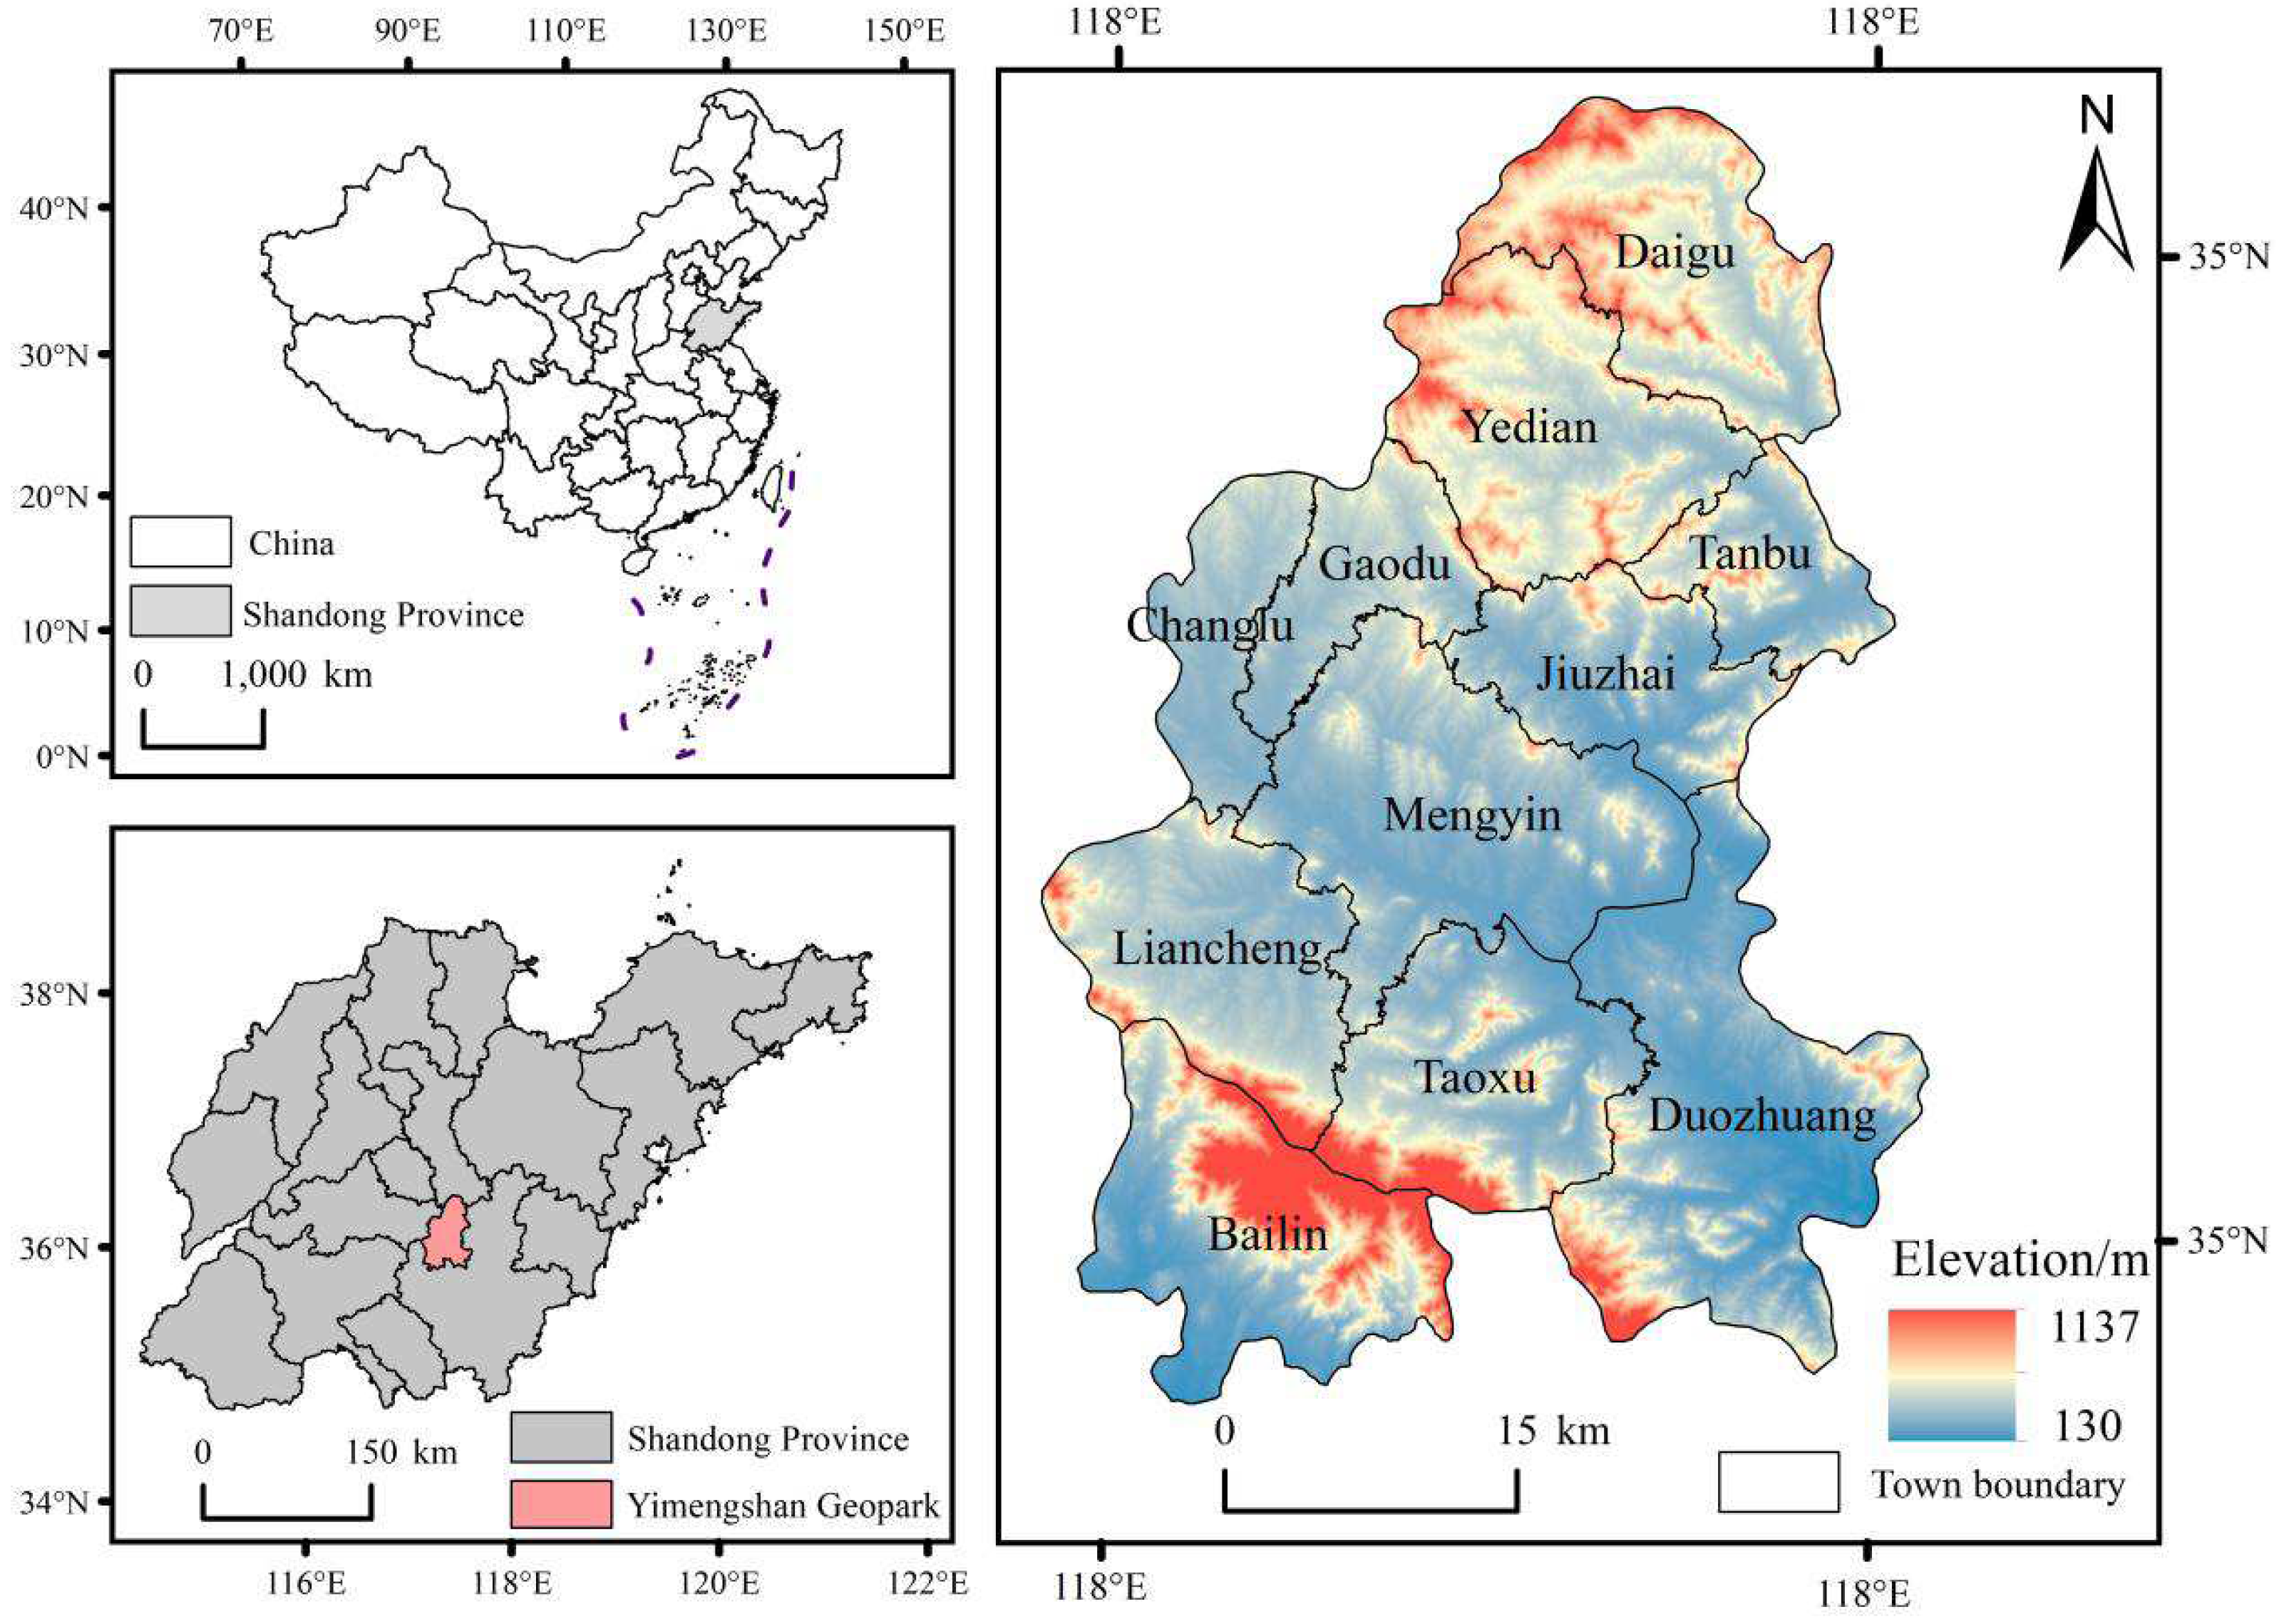
The Yimengshan Geopark (YG) is in Linyi City, Shandong Province, and ranges from 35°26'N to 36°01'N and from 117°43'E to 118°14'E. It involves seven counties—Mengyin, Feixian, Pingyi, Yishui, Yinan, Junan, and Linshu. There are hundreds of scenic spots including Mengshan Park, Diamond Park, Daigu Park, Menglianggu Park, and Yunmenghu Park. It is a comprehensive geological park with multiple geological heritage resources, with a total area of 1804.76 km2. The YG is in a low mountain hillside area, surrounded by three mountains on the west, north, and south sides, with high terrain in the south and north and low terrain in the middle. The Yimeng Mountain region belongs to the continental monsoon climate of the East Asian warm temperate zone, with four distinct seasons. The average annual temperature ranges from 12°C–13.5°C, and the average annual precipitation is 823.8 mm. The geological park is situated in an area rich in rivers and water resources. With outstanding ecological service functions, this area is dominated by ecological space and serves as a significant ecological barrier in southern Shandong province as well as an important water source protection area in the northern part of the Huai River Basin.
Figure 1.
Location of Yimengshan Geopark (YG).
2.2. Data Sources
The data used in this study include land-use data, natural environment, location conditions, social economy, and other data (Table 1). The land-use data (2000, 2010, 2020) comes from China's land cover dynamic data set from 1990 to 2021 (https://doi.org/10.5281/zenodo.5816591), the resolution is 30 m by 30 m. Based on ArcGIS software, land use is classified into six types: cultivated land, forest land, grassland, water body, construction land, and unused land. The data on grain prices and yields is sourced from the National Agricultural Statistics on Agricultural Products’ Cost and Income 2020 (https://data.cnki.net/), and the data of population and industrial gross domestic product come from the statistical yearbooks and statistical bulletin of the corresponding years of the counties and districts of Linyi city (http://tjj.linyi.gov.cn/). In addition, some missing indicator data is calculated from adjacent year data. Finally, the land-use data and the driving factors data were unified into WGS_1984_Albers projections with a spatial resolution of 30 m by 30 m, projected into a uniform frame of axes.
2.3. Research Methods
Based on the spatiotemporal evolution of LUSC in the YG, this study constructed a grey multiobjective optimization (GMOP)–Markov–PLUS coupling model to optimize land-use structures under four scenarios in 2030 and to calculate and analyze LUSC. The research framework is shown in Figure 2.
2.3.1. The Establishment of the PLES Spatial Classification System
Land has multifunctional properties. Based on previous research and actual situations [32], all land-use classification types were divided into production space, living space, and ecological space to establish a new land-use classification system to reflect the land-use spatiotemporal changes and spatial conflict status in YG (Table 2, Figure 3).
2.3.2. Construction of the PLES Spatial Conflict Index Model
With the rapid population growth, the impact of human activities on the natural environment has become increasingly significant, and land-use changes have led to changes in landscape structures [33]. The formation of landscape patterns reflects different ecological processes and affects the evolution of ecosystem landscapes. The landscape pattern index is a quantitative representation of the characteristics of land-use spatial patterns. In view of the complexity, vulnerability, stability, and other characteristics of the land-use ecosystem, combined with the resource and environmental characteristics in the study area, the landscape ecology index was constructed from the three aspects of complexity (P), vulnerability (V), and stability (S) to calculate the LUSC intensity of YG using the following formula:
where LUCS is the comprehensive index of land-use spatial conflict, and P, V, and S are the spatial complexity index, spatial vulnerability index, and spatial stability index, respectively. In addition, based on ArcGIS and Fragstats software, the LUSC grades in YG were measured from 2000 to 2020. The equidistant method was used to classify the spatial conflict level into five categories: stable controllable [0, 0.2], mild conflict (0.2, 0.4], moderate conflict (0.4, 0.6], intense conflict (0.6, 0.8], and severe conflict (0.8, 1]. More details and guides for Fragstats software could be downloaded at http://www.umass.edu/landeco/research/fragstats/downloads/fragstats_downloads.html.
Spatial Complexity Index (LUP). The area weighted average fractal dimension (AWMPFD) is used in calculation. A higher LUP value indicates that the landscape unit has a greater chance of being disturbed by neighboring landscapes, and the land-use structure of the spatial unit is more complex.
where Pij is the perimeter of the jth patch in the ith land-use category; aij is the area of the jth patch in the ith type of land-use; A is the area of the spatial evaluation unit.
Spatial Vulnerability Index (LUV). The spatial vulnerability index reflects the vulnerability of the land-use system under external pressure interferences. Different landscape elements have different responses to external pressure. Based on the actual situation of YG, the spatial vulnerability indices of production space, living space, and ecological space were 1, 2, 3, respectively.
where n is the number of land types included in PLES land (n=3); ai is the area of each land type; Fi assigns a value for the vulnerability of different land types; and S is the area of the spatial evaluation unit.
Spatial Stability Index (LUS). The land-use stability index is calculated using the reciprocal of landscape fragmentation (PD), as follows:
where ni is the number of patches in land-use category i.
2.3.3. Spatial Autocorrelation Analysis
The spatial autocorrelation characteristics of LUSC in the YG were analyzed based on global and local analysis methods. In addition, the global Moran’s I index was used to discern the spatial clustering characteristics of LUSC in the YG, and Local indicators of spatial association (LISA) was used to portray the spatial dependence and heterogeneity of spatial conflict intensity. The formulas were calculated as follows:
where LISAi is the local spatial autocorrelation statistic of spatial unit i; n is the number of spatial units in the study area; xi and xj denote the LUSC intensity values of units i and j, respectively; denotes the average value of LUSC intensity; and Wij is the spatial weight matrix. The value of Moran’s I ranges from -1 to 1, with I > 0 indicating a positive spatial autocorrelation, and I < 0 indicating a negative spatial autocorrelation. A LISAi value greater than 0 means that the similar higher or lower values are clustered around the target grid, and the value of LISAi less than 0 indicates that a grid has high (low) value with low-value (high-value) neighbors.
2.3.4. Patch Generating Land-Use Simulation
The Patch generating Land-use Simulation (PLUS) model compensates for the shortcomings of models such as CLUE-S and FLUS in mining transformation rules and simulating landscape dynamics. It can simulate multiple types of land-use changes at the patch level, and the simulation results can perfectly adapt to multiobjective optimization algorithms. This study uses the PLUS model to simulate the land use patterns of YG in 2030 under different scenarios. The driving and limiting factors of land-use change refer to the research settings of Liang et al. [34] (Figure 4). Based on the land-use data of YG in 2010, the model accuracy was validated by fitting with the land-use data of 2020. The Kappa coefficient was 0.888, which meets the research needs. More details and guides for PLUS software could be downloaded at https:// github.com/HPSCIL/Patch-generating_Land_Use_Simulation_Model. The specific operation is as follows:
(a) Simulation of the land-use spatial pattern
Based on the land-use data and socioeconomic natural data of YG in 2010 and 2020, this study explores land-use changes from 2010 to 2020, fits and optimizes land-use demand through Markov chain and GMOP models, and uses the PLUS model to simulate and predict the land-use distribution pattern of YG under the natural development scenario and the multiobjective optimization scenarios (Figure 5).
(b) Design of multiple scenarios based on grey multiobjective optimization
The grey multiobjective optimization model can solve various uncertainties of objective functions and constraints in actual land use and provide decision-makers with the best land-use optimization configuration plan [35]. To achieve ecological protection and coordinated economic development of the YG, four land-use scenarios were studied and designed: the natural development, ecological priority, economic priority, and sustainable development scenarios [36]. By predicting the land-use demand under different scenarios, the simulation of the LUSC pattern for 2030 in YG can be achieved.
(1) Natural development scenario (LED). The Markov chain predicts the total demand of land-use types in 2030 through the transfer probability between land-use types from 2010 to 2020.
where n is the number of land-use types, Pij is the probability of converting type i into type j, 0 ≤Pi,j≤ 1, and the sum of elements in each row is equal to 1.
(2) Ecological priority scenario (EPD). The EPD ensures the priority development of the ecological benefits of the YG by setting the value of ecosystem service and maximizing the capacity of the ecological environment. Each land type can provide ecological benefits to the maximum extent. The ecosystem service value (ESV) and ecological capacity (EC) are ecological functions to measure the ecological benefit. The calculation formulas for ecosystem service value (ESV) are as follows:
where F1(x) represents the total ecosystem service value provided by the land system; ESVi is the ecosystem service value per unit area of land-use type i (10000 CNY/hm2); a is the area of each cell network, which is 1 hm2 in this study; D is the equivalence factors of ecosystem service value, and its calculation method is shown in reference [36]. Based on the national average grain price of 2.19 CNY/kg from 2000 to 2020, D is calculated as 1489.54 yuan/hm2; Eij is the equivalent coefficient of the j-th ecological service value provided by the land-use type i, referring to the research settings of Xie et al. [37]. Finally, the total unit ESV values of cultivated land, forest land, grassland, water body, construction land, and unused land were calculated to be 0.58, 2.77, 2.32, 18.71, 0, and 0.03 (unit: 10000 CNY/hm2), respectively. If the construction land has no ecological benefits, the ESV of the construction land can be set to zero [38]. Therefore, the adjustment function of ESV can be expressed as the formula:
The formula for calculating ecological carrying capacity is as follows:
where F2(x) represents the total ecological carrying capacity; Eci, Qi, and Yi are the ecological carrying capacity, equivalence factors, and yield factors of the land-use type i, respectively. Research by Wackernagel et al. [39] showed that retaining 12% of productive land is more conducive to biodiversity conservation. Referring to relevant research [39,40], we set the values of Qi and Yi, and calculated Eci. Formula (10) can then be rewritten as:
In summary, the EPD multiobjective optimization function is expressed as max{F1(x),F2(x)}.
(3) Economic priority scenario (RED). The goal of the RED is to maximize the economic benefits of various land-use types. Setting this scenario helps to scientifically grasp the potential risks of LUSC that YG may face, revealing the potential threat of economic priority development to the park’s development and protection, as well as its environmental carrying capacity. The formula is expressed as:
where F3(x) represents the total economic benefit; Ecoi is the economic benefit of land-use type i per unit area (10000 CNY/hm2); xi refers to the area (hm2) of land-use type i, with indices i ranging from 1 to 6 representing cultivated land, forest land, grassland, water body, construction land, and unused land. We estimate the economic benefits of cultivated land, forest land, grassland, and water body using the output values of agriculture, forestry, animal husbandry, and fisheries. The total output values of secondary and tertiary industries is an estimate of the economic benefits of construction land. The economic benefits of unused land are set to 0. Based on historical economic data from 2010 to 2020 and using the grey prediction model GM (1,1) to estimate Ecoi, formula (14) can be rewritten as:
In summary, the multiobjective optimization function in the RED scenario is expressed as max {F3(x)}.
(4) Sustainable development scenario (ESD). The ESD aims to build a harmonious human–land relationship in the YG by maximizing economic and ecological benefits. Its function is expressed as max{F1(x),F2(x),F3(x)}.

Table 3.
Land-use structure constraints of the YG.
| Constraint Factor | Constraints Condition/Unit | Formula Settings |
|---|---|---|
| Total factor | Total land area/hm2 | |
| Population size | The population density of cultivated land, forest land, and grassland is 3.01 people/hm2, and the construction land is 8.32 people/hm2, and the population of the research area in 2030 is less than 717936 people. | |
| Macro planning | Agricultural land constraints/hm2 | |
| Construction land constraints/hm2 | ||
| Cultivated land constraints/hm2 | ||
| Forest land constraints/hm2 | ||
| Grassland constraints/hm2 | ||
| Water body constraints/hm2 | ||
| Ecological needs | Biodiversity constraints/hm2 | |
| Nonnegative constraint |
The objective functions under EPD, RED, and ESD will be constrained by real-world conditions. The constraint conditions for the multiobjective planning models are developed based on existing national spatial planning and related research. We import the established objective function and constraint conditions into LINGO 18.0 modeling solution to obtain the land-use demand under EPD, RED, and ESD. Along with the land-use demand under LED, these are imported into the PLUS model to simulate the land-use patterns under four scenarios. Finally, we use the LUCSII model to simulate the LUSC pattern under four land-use scenarios of YG in 2030. More details and guides for LINGO 18.0 software could be downloaded at https://www.lindo.com/index.php/ls-downloads/try-lingo.
3. Results
3.1. LUSC Spatial and Temporal Distribution Characteristics
The LUSC were mainly stable controllable or with mild conflict. Significant changes in area occurred for different grades in the YG from 2000 to 2020 (Table 4). During this period, the LUSC in the YG continued to intensify, manifesting as the contraction of the stable controllable area and the expansion of conflict zones in other grades. The stable controllable area decreased from 1037.38 km2 in 2000 to 817.37 km2 in 2020, with an average annual decrease of 1.06%; the area of mild conflict expanded by 135.65 km2 or 20.45%. The area of moderate conflict increased by 50.94 km2, with an average annual growth of 2.20%. In addition, the area of intense conflict increased by 59.08%, with an average annual growth of 2.95%, and the area of severe conflict has expanded by 1.77 times, with an average annual growth of 8.86%.
Obvious differences in the spatial distribution of the levels LUSC were observed in the YG from 2000 to 2020, which demonstrate a general pattern of high in the middle and low in the exterior areas with a very high degree of coupling with the spatial distribution characteristics of construction land (Figure 6). The areas of severe conflict were mainly concentrated in the central urban area of Mengyin County and low and flat terrain areas such as southern Bailin Town. The areas of strong conflict were scattered around the construction land in each urban area, adjacent to the severe conflict areas, and along both sides of the river. The areas of mild and moderate conflict were distributed in the mountainous and hilly areas at the junction of Bailin Town, Liancheng Town, and Taoyin Town, as well as the ecotone between cultivated land and grass in the northern.
According to the spatial conflict trends, urban and rural living spaces accounted for the majority of LUSC in the YG from 2000 and 2010. There was a large rural population during this time, and cultivated land and forestland served as the core production space elements of the rural regional system, providing the majority of farmers’ income. They were essential to the rivalry between various stakeholders, which caused a high degree of spatial conflict in rural areas. The demand for construction land has skyrocketed due to the region’s rapid urbanization, and some rural people have migrated into urban areas. The contradiction between humans and land in rural space was accompanied by population flow from rural areas to urban, making cities and towns a hot spot for spatial conflict. Spatial conflict hotspots started appearing in the water areas and the tourist attractions in the YG from 2010 to 2020. With the rapid development of the urban economy, the Linyi Municipal Government continues to plan and construct supporting facilities such as transportation, catering, lodging, shopping, and amusement facilities in the park, taking the successful application of the YG project as an opportunity. This has resulted in significant effects on the natural environment and socioeconomic aspects of the YG and continual imbalances in the ecological, production, and living spatial structures. As a result, the LUSC in tourist areas was continually intensifying in the YG.
3.2. Spatial Agglomeration Characteristics of the Spatial Conflict
The Moran’s I index in 2000, 2010, and 2020 is 0.597, 0.610, and 0.624, respectively, these values passed the significance test (Z > 1.96, P < 0.01). Thus, LUSC in the YG showed a significant positive spatial correlation, and spatial agglomeration is gradually strengthening.
To further explore the spatial clustering and dispersion of LUSC in the YG, we used local spatial autocorrelation to calculate the local Gi* index of land-use spatial conflict in the YG from 2000 to 2020. The corresponding spatial clustering map is shown in Figure 7. From 2000 to 2020, the LUSC agglomeration characteristics in the YG were high in the central south and low in the northeast, expanded outward along the road network. The high–high clusters shifted from the central region to the tourist attraction area of Duozhuang Town in the southwest, while the low–low clusters are found in the north central region, and the high–low and low–high clusters reduced. Figure 7 shows that in 2000, the high–high clusters were distributed in contiguous areas at the junction of Changlu Town, Gaodu Town, and Mengyin Street, as well as in the southern hilly areas. The low–low clusters were concentrated in Yedian Town, Daigu Town in the north, and the areas around Yunmeng Lake Wetland Park. Compared to 2010, the LUSC of YG in 2020 showed the high-high clusters expanded and the low-low clusters contracted. The high–high agglomeration areas expanded in Mengyin County and Bailin Town, primarily because of the region’s frequent human economic construction activities, high proportion of living-production land, high spatial complexity of land use, and correspondingly prominent spatial fragility and low stability, while led to the high spatial conflict, high value (high–high) clusters in these areas. The low–low clusters congregate around Duozhuang Town and Taoxu Town, which were affected by the terrain and have not undergone significant changes in land-use types. Due to the minimal impact of human activity, the stability of the landscape remains high, and the low value areas were significantly impacted by the topography and distribution of water resources.
3.3. Multiscenario Simulations of LUSC
The land-use structure and spatial conflict of YG under four scenarios in 2030 have similarities and differences (Table 5 and Table 6). In 2030, the YG’s land-use structure will primarily consist of cultivated land, forestland, grasslands, and water bodies, with a small quantity of construction land and unused land. The LED construction land area is the largest among the four scenarios, at 198.28 km2, or 10.70% of all land area. This scenario’s LUSC is considered more severe than the other three, with a severe conflict area of 29.89 km2, or 1.61% of the total area. The RED has the least quantity of arable land, the largest quantity of forest land, and the second-highest percentage of construction land (9.67%) after the LED. The proportions of areas of intense and severe conflict in this scenario are 2.76% and 1.57%, respectively; the degree of spatial conflict is second only to the LED. The EPD has a construction land size of 176.83 km2, accounting for 9.54% of the entire area, which is less than that of the other three scenarios. In this scenario, the fraction of areas of intense and severe conflict is 3.74% of the study area, and the degree of land-use spatial conflict is rather low. Among the four scenarios, the ESD features the most grassland and the least forest area, with building land accounting for 9.60% of the total area, second only to the EPD. In this scenario, the area of intense and severe conflict is 71.34 km2, accounting for 3.85% of the total. Overall, under the LED and RED, YG focuses on economic development, with frequent human economic construction activities and significant expansion of construction land through conversion of cultivated land and grassland, which is concentrated in areas surrounding the county and towns. The EPD and ESD focus on environmental conservation and integrated socioeconomic development. The proportions of cultivated land and grassland with significant ecological service functions are relatively high, and construction land expansion is slow. Moreover, the ESD has the minimum proportion of construction land, and the smallest proportion of areas of intense and severe conflict, the totals of which are only 3.74% of the study area.
There are significant variations in the LUSC in the YG among the four 2030 scenarios (Figure 8), displaying overall patterns of high in the middle and low in the surrounding areas. The areas of severe conflict are mostly concentrated within county towns, important villages and towns, and major transit routes, covering areas such as Mengyin Street, Bailin Town, Changlu Town, and Duozhuang Town. Within the park, cultivated land, forest land, and grassland are broadly spread in low and flat terrain areas with little human activity and low levels of LUSC, which are mostly stable controllable zones. The intense and severe conflict regions have expanded toward Changlu Town, Bailin Town, and the county center in the LED and RED. The main expanding regions of intense and severe conflict include the border regions of Changlu Town, Liancheng Town, and Mengyin Street, as well as the rural neighboring regions of Duozhuang Town. The areas of intense and severe conflict in the EPD and ESD clearly contract toward areas such as Mengyin Street and Duozhuang Town. The main areas of intense and severe conflict are in the core of Mengyin County, the transportation arteries along Jiuzhai Township and Duozhuang Town, and in the urban–rural ecotone.
4. Discussion
4.1. Temporal and Spatial Pattern of LUSC
Land is an essential element of human social development, and it supports the great majority of socioeconomic activity, among which multiple factors influence land-use conflict. This study developed a measurement model for spatial conflicts based on complexity, vulnerability, and stability to uncover spatial disparities in park land-use spatial conflicts, as in earlier research on land-use conflicts [13,41]. According to research, the increasing demand for land resources in densely inhabited and highly urbanized areas between 2000 and 2020 resulted in increased LUSC [42]. Using the GMOP–Markov–PLUS model to simulate future LUSC patterns, it was discovered that the land-use structure and spatial conflict of YG under four scenarios in 2030 have similarities and differences. The overall pattern of spatial conflict is high in the middle and low in the surrounding areas. The places of severe conflict are mostly concentrated in county towns, important villages or towns, and along major transit routes, covering Mengyin Street, Bailin Town, Changlu Town, and Duozhuang Town, among others. Within the park, cultivated land, forest land, and grassland are broadly spread in low and flat terrain areas with little human activity and low levels of LUSC, which are mostly stable controllable zones. Overall, ecological land has a low spatial conflict value; construction land, however, has a high spatial conflict value, which is consistent with previous research findings [43,44].
In comparison to prediction models such as the CLUE-S model and the FLUS model, the PLUS model can simulate the evolution of patch-level changes in various land-use types more effectively, and it has the advantage of revealing the contribution rates of land-use change driving factors, which allows it to simulate future land-use patterns with more scientific and logical outcomes. As a result, the GMOP–Markov–PLUS model can better explain the relationship between the occurrence of LUSC and spatial changes under multiple future scenarios, providing a possibility for alleviating LUSC in the PLES of the park. Second, the study selected driving factors for simulating land-use structures from natural environment, geographic location, and socioeconomic considerations, making the conclusions more objective and congruent with the findings of other scholars' research [34,45]. The importance ranking of each driving factor for six types of land use was obtained by training the random forest (RF) algorithm in the PLUS model (Figure 9). The top four important factors driving the evolution of cultivated land, forest land, and construction land are elevation, slope, distance from rivers, and population distribution, which is consistent with the results of Li et al. and Guo et al. [43,46]. This implies that topographical characteristics, as well as population spatial distribution and flow, impact the patterns and evolution of spatial conflict, and humans play a prominent role in the LUSC process [47]. In addition, the GMOP–Markov–PLUS combination model not only can forecast LUSC under the natural development pattern, but also can simulate spatial conflict in various circumstances. When the simulation results are compared, the optimal mode is chosen as the future development trend, which has a major guiding significance.
4.2. Evaluation of the Multiscenarios Simulation Effect of LUSC
Trends of the LUCS grade changes in the YG (Figure 10) and of spatial intensity grades (Figure 11) are identified based on the LUSC patterns from 2000 to 2020 and the simulation results under four scenarios in 2030, to evaluate the effectiveness of LUSC resolution under each scenario.
From 2000 to 2020, the spatial conflict area of YG underwent significant regional expansion. The area of intense conflict increased from 27.74 km2 in 2000 to 44.13 km2 in 2020, and the area of severe conflict increased from 9.61 km2 to 26.64 km2, indicating that the human–land conflict in YG has intensified over the last 20 years. It is urgent to coordinate and balance the LUSC. Simulation results show that the LED continues the study area’s historical growth and change trajectory, causing unorganized expansion of the areas of severe and intense conflict. The simulation results of the RED scenario are slightly better than those of the LED, but the trend of intense and severe conflict zone expansion remains unchanged. In the EPD, and ESD, the evolution curves of both intense and severe conflict areas show a downward trend, indicating that the land-use conflict situation has improved.
In summary, the EPD land-use strategy effectively reduces the degree of LUSC in the YG, whereas the ESD maintains the trend of land-use development in 2020. There is not a significant difference in the spatial conflict zones of moderate and higher degree between these two scenarios. The EPD is an ecology is more important than economy development model, and the most valuable asset in YG is the ecological environment. The natural environment in the area is magnificent, with excellent air quality; and its land-use landscape serves cultural, aesthetic, and other purposes. As a result, increasing the economy while focusing on environmental conservation is also a reasonable option. The ESD is a balanced development and protection relationship that not only protects the ecological environment and coordinates human–land relations, but also promotes the economy. It is a scientific and rational model for development. In the next ten years, both the EPD and ESD will be viable options for easing and managing LUSC in the YG.
4.3. Limitations and Future Research
Based on the PLES perspective, this study constructs a LUSC identification and intensity diagnosis model using the landscape ecology index, enhancing and deepening the research on regional LUSC. The study relies on the practical requirements of development and environmental protection in the YG, which reveal the spatiotemporal differentiation characteristics of potential LUSC and use the GMOP–Markov–PLUS model to simulate the LUSC patterns under various future scenarios. Then, through analysis of the dynamic evolution of spatial conflicts in the YG, differential control strategies are set up through spatial conflict zoning. There has been limited study of land-use change and multiple scenario simulation in geological parks in LUSC research. Therefore, this study can fills gaps in the expression, type, intensity, and distribution characteristics of LUSC in the within area.
In the spatial analysis method, the LUCSII model, which is based on the response of landscape patch characteristics to ecological environment protection, can quantitatively measure the spatial distribution characteristics of spatial conflicts and reveal the potential land-use risks in the geopark area. The LUCSII model has significant theoretical and practical usefulness, but it lacks the evidence of land-use adaptability and multifunction qualities. The GMOP–Markov–PLUS combination model has some limitations due to the subjectivity of indicator determination and difficulty in quantifying these parameters, as well as limitations in the selection of socioeconomic and policy indicators within the geological park, which ignore competition and cooperation between townships [48]. As a result, the primary objective of this study is to simulate changes in LUSC using environmental, geographic, and socioeconomic factors. In the future, it will be possible to further quantify how policies affect the simulation and estimate the severity of land-use spatial conflicts based on the outcomes of land suitability assessments. This not only reflects the characteristics of suitable land use, but also the rivalries between different stakeholders for spatial resources.
5. Conclusions
(1) From 2000 to 2020, the LUSC in the YG was mainly stable controllable or mild conflict, with significant changes in area at all grades. The central urban areas of Mengyin County and low-lying areas, such as southern Bailin Town, have seen the greatest increase in areas of severe conflict. The areas of intense conflict, which are second in scale, are distributed around construction land in various urban areas, adjacent to the severe conflict areas, and along both sides of the river.
(2) LUSC in the YG showed a significant positive spatial correlation, and spatial agglomeration is gradually strengthening. The high–high clusters were found in contiguous areas at the junction of Changlu Town, Gaodu Town, and Mengyin Street, as well as in the southern hilly areas. The low–low clusters were concentrated in Yedian Town, Daigu Town in the north, and areas surrounding Yunmeng Lake Wetland Park.
(3) The land-use structure and spatial conflict of YG under four scenarios in 2030 exhibit similarities and differences. The expansion of construction land is obvious in the LED and RED, and the degree of spatial conflict is relatively high. In the next ten years, EPD and ESD will both be reasonable options for easing and controlling LUSC in YG.
A differentiated governance strategy of spatial conflict is proposed based on the manifestation, conflict degree, and spatiotemporal pattern characteristics of LUSC in YG, as well as the spatial pattern in different future scenarios. Areas with mild spatial conflict have a high degree of consistency between their tourism function positioning and land-use suitability, so land simply must be developed and used in accordance with the existing tourism function positioning. For areas with high levels of spatial conflict, strict protection of natural and cultural resources such as geological relics, mineral wonders, historical sites, cultural relics, and traditional villages should be strengthened, and the ecological function of tourist areas should be strengthened. The areas of severe conflict are found in urban and rural construction land, as well as tourist attraction facilities, which are the core functional regions of geological park tourism activities and residents’ everyday lives. The conflicts are particularly obvious in the disorderly expansion of construction land, as well as the spatial conflicts generated by the overlap between tourism ecological land and tourism construction land. In this portion of the region, it is necessary to determine the three zones (include urban space, agricultural space, and ecological space) and three lines (include urban development boundaries, permanent basic farmland, and ecological protection red lines) based on the demands of social and economic development, particularly the boundary red line for construction land growth (it is a limit for growth of construction land), and to plan production and living spaces. It is necessary to maintain regional ecological security and avoid future deterioration of the park’s ecological environment by performing well in terms of ecological isolation.
Author Contributions
Conceptualization, J.M. and P.S.; methodology, J.M.; software, J.M. and J.Z.; validation, P.S. and N.L.; formal analysis, P.S. and N.L.; investigation, J.M., P.S., N.L., D.S, and K.W.; writing-original draft preparation, P.S. and J.M.; writing-review and editing, P.S.; supervision, P.S. All authors have read and agreed to the published version of the manuscript.
Funding
This research was funded by National Natural Science Foundation of China (No. 42101258) and Natural Science Foundation of Shandong (No. ZR2019QD006).
Institutional Review Board Statement
Not applicable.
Informed Consent Statement
Not applicable.
Data Availability Statement
The datasets used in this article can be obtained by readers after the article is published online.
Conflicts of Interest
The authors declare no conflict of interest.
References
- Chen, Z.; Feng, X.; Hong, Z.; Li, Y. Calculation and Analysis of Spatial Conflicts in Land Use of Nanchang City. Areal Res. Dev. 2020, 39, 150–155. [Google Scholar] [CrossRef]
- Wang, J.; Zou, L.; Li, M. Identification and governance of potential land use conflict in tourism resort based on ecological-production-living suitability. Trans. Chin. Soc. Agric. Eng. 2019, 35, 279–288. [Google Scholar] [CrossRef]
- Zhang, W.; Jin, B.; Chen, Y.; Wang, M. Study on evaluation of geological tourism resources in Yimengshan Geopark. Shandong Land Resour. 2019, 35, 42–50. [Google Scholar] [CrossRef]
- Andriotis, K. Hosts, guests and politics: Coastal Resorts Morphological Change. Annals of Tour Res. 2006, 33, 1079–1098. [Google Scholar] [CrossRef]
- Yu, B.; Lv, C. The progress and prospect of land use conflict. Prog. Geogr. 2006, 25, 106–115. [Google Scholar] [CrossRef]
- Zhou, D.; Xu, J.; Wang, L. LUSC and complexity: A case study of the urban agglomeration around Hangzhou Bay. Geogr. Res. 2015, 34, 1630–1642. [Google Scholar] [CrossRef]
- Zhou, L.; Liu, Y.; Wang, Y. Research progress and prospect of land-use conflict in China. Prog. Geogr. 2020, 39, 298–309. [Google Scholar] [CrossRef]
- Henderson, S.R. Managing land- use conflict around urban centres: Australian poultry farmer attitudes towards relocation. Appl. Geogr. 2005, 25, 97–119. [Google Scholar] [CrossRef]
- Ye, L. Study on Land Use Conflict Analysis and Diagnosis. Doctoral Thesis, Nanjing Agricultural University, Nanjing, China, 2010. [Google Scholar]
- Meng, J.; Jiang, S.; La, Z.; Zhang, W. The spatial and temporal analysis of land use conflict in the middle reaches of the Heihe River Based on landscape pattern. Sci. Geol. Sin. 2020, 40, 1553–1562. [Google Scholar] [CrossRef]
- Gao, Y.; Wang, J.; Zhang, M.; Li, S. Measurement and prediction of land use conflict in an opencast mining area. Resour. Policy. 2021, 71, 101999. [Google Scholar] [CrossRef]
- Cui, J.; Kong, X.; Chen, J.; Sun, J.; Zhu, Y. Spatially explicit evaluation and driving factor identification of land use conflict in Yangtze River economic belt. Land 2021, 10, 43. [Google Scholar] [CrossRef]
- Zou, L.; Liu, Y.; Wang, J.; Yang, Y. An analysis of land use conflict potentials based on ecological-production-living function in the southeast coastal area of China. Ecol. Indic. 2021, 122, 107297. [Google Scholar] [CrossRef]
- Moore, S.A.; Brown, G.; Kobryn, H.; Strickland-Munro, J. Identifying conflict potential in a coastal and marine environment using participatory mapping. J. Environ. Manag. 2017, 197, 706–718. [Google Scholar] [CrossRef] [PubMed]
- Sun, P. Temporal and Spatial Evolution of Land Use Conflicts in the Poverty Belt around Beijing and Tianjin from the Perspective of Ecological Security. Doctoral Thesis, China Agricultural University, Beijing, China, 2017. [Google Scholar]
- Zhang, Y.; Long, H.; Tu, S.; Ge, D.; Ma, L.; Wang, L. Spatial identification of land use functions and their tradeoffs/synergies in China: Implications for sustainable land management. Ecol. Indic. 2019, 107, 105550. [Google Scholar] [CrossRef]
- Cieślak, I. Identification of areas exposed to land use conflict with the use of multiple-criteria decision-making methods. Land Use Policy 2019, 89, 104225. [Google Scholar] [CrossRef]
- Kim, I.; Arnhold, S. Mapping environmental land use conflict potentials and ecosystem services in agricultural water bodies. Sci. Total Environ. 2018, 630, 827–838. [Google Scholar] [CrossRef] [PubMed]
- Benjaminsen, T.A.; Koffi, A.; Halvard, B.; Buseth, J.T. Does climate change drive Land-use conflicts in the sahel. J. Peace. Res. 2012, 49, 97–111. [Google Scholar] [CrossRef]
- Montanari, A.; Londei, A.; Staniscia, B. Can we interpret the evolution of coastal land use conflicts? Using Artificial Neural Networks to model the effects of alternative development policies. Ocean. Coast Manag. 2014, 101, 114–122. [Google Scholar] [CrossRef]
- Adam, Y.O.; Pretzsch, J.; Darr, D. Land use conflicts in central Sudan: Perception and local coping mechanisms. Land Use Policy 2015, 42, 1–6. [Google Scholar] [CrossRef]
- Junior, R.F.V.; Varandas, S.G.P.; Pacheco, F.A.L.; Pereira,V. R.; Santos,C.F.; Cortes,R.M.V.; Sanches Fernandes, L.F. Impacts of land use conflicts on riverine ecosystems. Land Use Policy 2015, 43, 48–62. [Google Scholar] [CrossRef]
- Yu, A.; Wu, Y.; Zheng, B.; Zhang, X.; Shen, L. Identifying risk factors of urban-rural conflict in urbanization: A case of China. Habitat Int. 2014, 44, 177–185. [Google Scholar] [CrossRef]
- Min, J.; Wang, Y.; Bai, R.; Zhang, J.; Kong, X. The research on identification of land use potential conflict based on multiobjective suitability evaluation on mountainous city: A case study of Qijiang district of Chongqing municipality. J. Chongqing Norm. Univ. 2018, 35, 82–89. [Google Scholar] [CrossRef]
- Sun, P.; Xu, Y.; Liu, Q.; Liu, C. Study on dynamic change of multi-functionality of land use and its driving factors in Zhangjiakou city. Trans. Chin. Soc. Agric. Eng. 2018, 39, 65–74. [Google Scholar] [CrossRef]
- Qin, X.; Min, Q.; Li, W.; Geng, Y. Pareto optimal land use patterns with three conflicting benefits in an area to the south of Liupan mountain. Resour. Sci. 2010, 32, 184–194. [Google Scholar] [CrossRef]
- Dong, G.; Ge, Y.; Jia, H.; Sun, C.; Pan, S. Land use multi-suitability, land resource scarcity and diversity of human needs: A new framework for land use conflict identification. Land 2021, 10, 1003. [Google Scholar] [CrossRef]
- Bircol, G.A.C.; De Souza, M.P.; Fontes, A.T.; Chiarello,A. G.; Ranieri, V.E.L. Planning by the rules: A fair chance for the environment in a land-use conflict area. Land Use Policy 2018, 76, 103–112. [Google Scholar] [CrossRef]
- Wang, A.; Ma, X.; Yan, X. Land use conflict and their governance mechanics on actors network theory:A case of fruit tree protection zone of Haizhu district, Guangzhou City. Sci. Geol. Sin. 2010, 30, 80–85. [Google Scholar] [CrossRef]
- Wang, X.; Liu, W. Spatial planning system in China: Status, problems and reconstruction. Econ. Geogr. 2012, 32, 7–15. [Google Scholar] [CrossRef]
- Paracchini, M.L.; Pacini, C.; Jones, M.L.M.; Laurence, M.J.; Pérez-Soba, M. An aggregation framework to link indicators associated with multifunctional land use to the stakeholder evaluation of policy options. Ecol. Indic. 2011, 11, 71–80. [Google Scholar] [CrossRef]
- Liu, J.; Liu, Y.; Li, Y. Classification evaluation and spatial-temporal analysis of "production-living-ecological" spaces in China. Acta Geogr. Sin. 2017, 72, 1290–1304. [Google Scholar] [CrossRef]
- Fu, B.; Chen, L.; Wang, J.; Meng, Q.; Zhao, W. Land use structure and ecological processes. J. Quat. Sci. 2003, 3, 247–255. [Google Scholar] [CrossRef]
- Liang, X.; Guan, Q.; Clarke, K.C.; Liu, S.; Yao, Y. Understanding the drivers of sustainable land expansion using a patch generating land use simulation (PLUS) model: A case study in Wuhan, China. Comput. Environ. Urban 2021, 85, 101569. [Google Scholar] [CrossRef]
- Steuer, G.R.E. Unified Interactive Multiple Objective Programming: An Open Architecture For Accommodating New Procedures. J. Oper. Res. Soc. 1994, 45, 1456–1466. [Google Scholar] [CrossRef]
- Wang, Y.; Li, X.; Zhang, Q.; Li, J.; Zhou, X. Projections of future land use changes: Multiple scenarios-based impacts analysis on eco-system services for Wuhan city, China. Ecol. Indic. 2018, 94, 430–445. [Google Scholar] [CrossRef]
- Xie, G.; Zhen, L.; Lu, C.; Xiao, Y.; Chen, C. Expert knowledge-based valuation method of ecosystem services in China. J. Nat. Resour. 2008, 5, 911–919. [Google Scholar] [CrossRef]
- Wang, Y.; Li, X.; Li, J. Study on the response of ecological capacity to land-use/cover change in Wuhan City: A remote sensing and GIS based approach. Sci. World J. 2014, 794–323. [Google Scholar] [CrossRef] [PubMed]
- Wackernagel, M.; Onisto, L.; Bello, P.; Alejandro. National natural capital accounting with the ecological footprint concept. Ecol. Econ. 1999, 29, 375–390. [Google Scholar] [CrossRef]
- Costanza, R.; d'Arge, R.; De Groot, R.; Farberk, S.; Belt, M.V.D. The value of the world's ecosystem services and natural capital. Nature 1997, 387, 253–260. [Google Scholar] [CrossRef]
- Fan, J.; Wang, Y.; Zhou, Z.; You, N.; Meng, J. Dynamic ecological risk assessment and management of land use in the middle reaches of the Heihe River based on landscape patterns and spatial statistics. Sustainability 2016, 8, 536. [Google Scholar] [CrossRef]
- Wang, J.; Lin, Y.; Glendinning, A.; Xu, Y. Land use changes and land policies evolution in China’s urbanization processes. Land Use Policy 2019, 75, 375–38. [Google Scholar] [CrossRef]
- Guo, R.; Wu, T.; Wu, X.; Luigi, S.; Wang, Y. Simulation of Urban Land Expansion Under Ecological Constraints in Harbin-Changchun Urban Agglomeration, China. Sci. Geol. Sin. 2022, 32, 18. [Google Scholar] [CrossRef]
- Jiang, S.; Meng, J.; Zhu, L.; Chen, H. Spatial-temporal pattern of land use conflict in China and its multilevel driving mechanisms. Sci. Total Environ. 2021, 801, 149697. [Google Scholar] [CrossRef] [PubMed]
- Zhou, M.; Ma, Y.; Tu, J.; Wang, M. SDG-oriented multi-scenario sustainable land-use simulation under the background of urban expansion. Environ. Sci. Pollut. Res. Int. 2022, 29, 72797–72818. [Google Scholar] [CrossRef] [PubMed]
- Li, C.; Wu, Y.; Gao, B.; Wu, Y.; Li, C. Multi-scenario simulation of ecosystem service value for optimization of land use in the Sichuan-Yunnan ecological barrier, China. Ecol. Indic. 2021, 132, 108328. [Google Scholar] [CrossRef]
- Zhang, S.; Yang, P.; Xia, J.; Wang, W.; Cai, W.; Chen, N.; Hu, S.; Li, J.; Zhang, C. Land use/land cover prediction and analysis of the middle reaches of the Yangtze River under different scenarios. Sci Total Environ. 2022, 833, 155238. [Google Scholar] [CrossRef]
- Zhang, X.; Gu, R. Spatio-temporal pattern and multi-scenario simulation of land use conflict: A case study of the Yangtze River Delta urban agglomeration. Geogr. Res. 2022, 41, 1311–1326. [Google Scholar] [CrossRef]
Figure 2.
The research framework of this study.
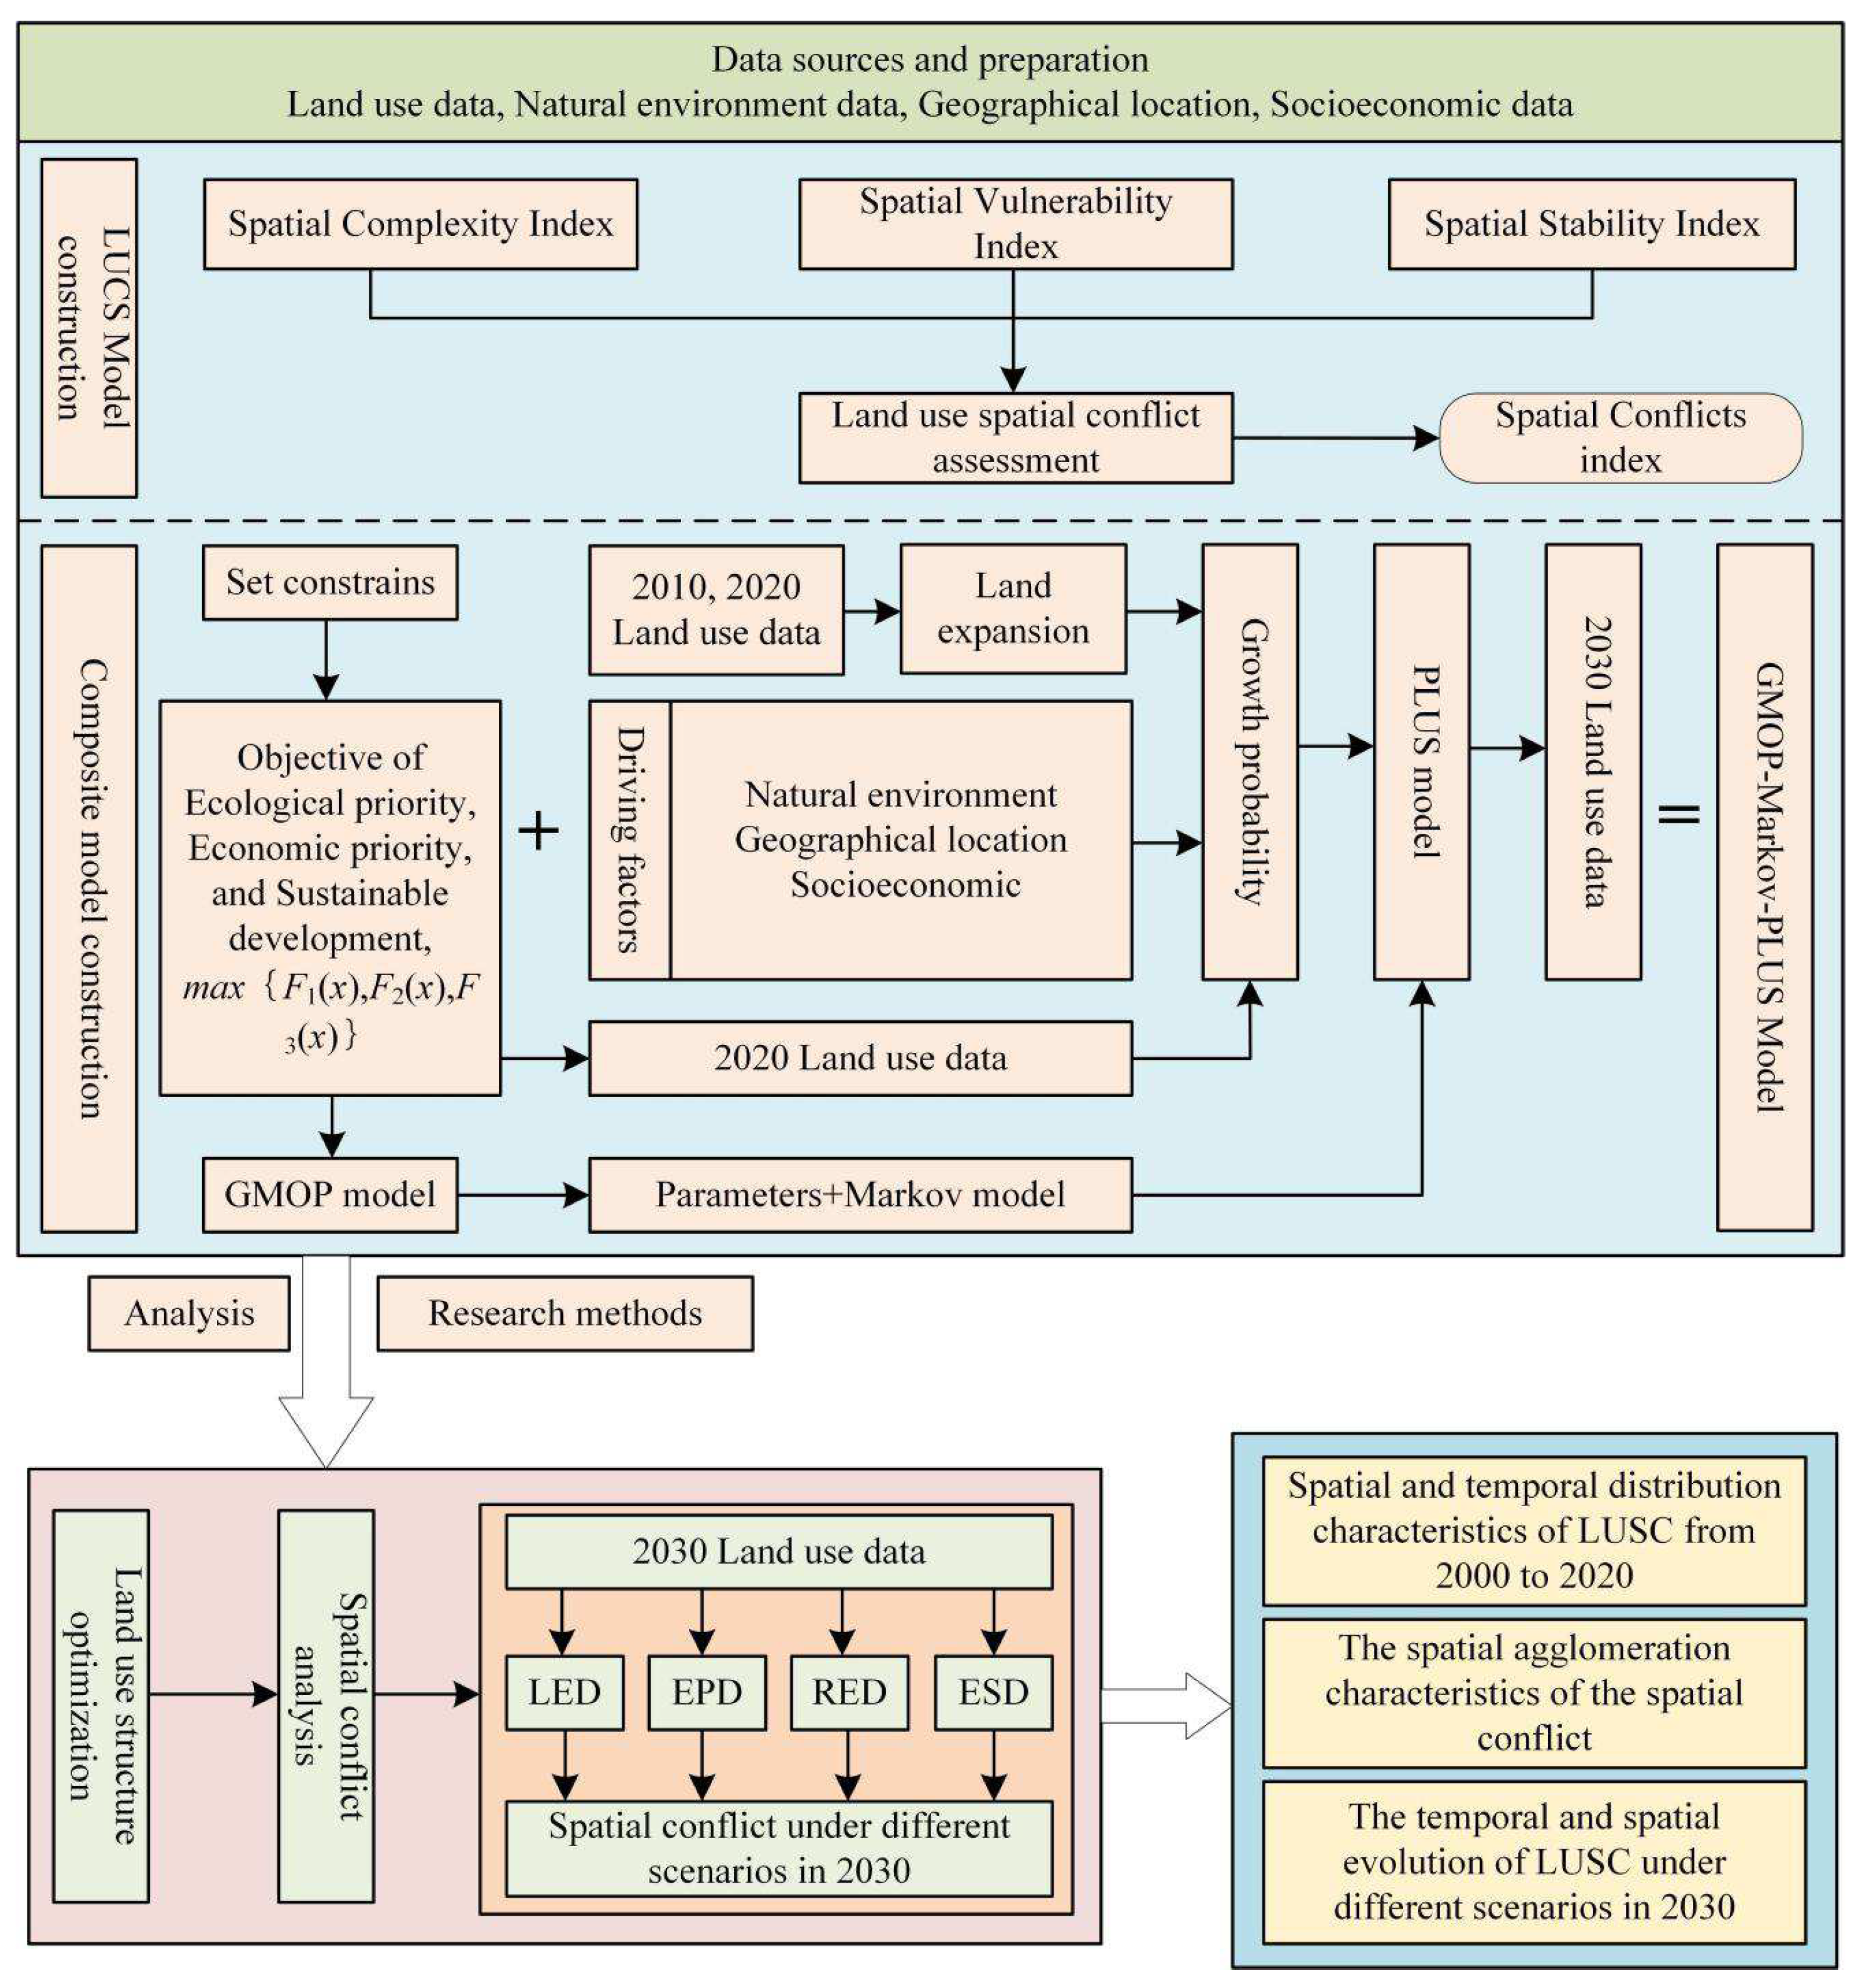
Figure 3.
The productional–living–ecological space (PLES) patterns of the Yimengshan Geopark (YG) from 2000 to 2020.
Figure 3.
The productional–living–ecological space (PLES) patterns of the Yimengshan Geopark (YG) from 2000 to 2020.
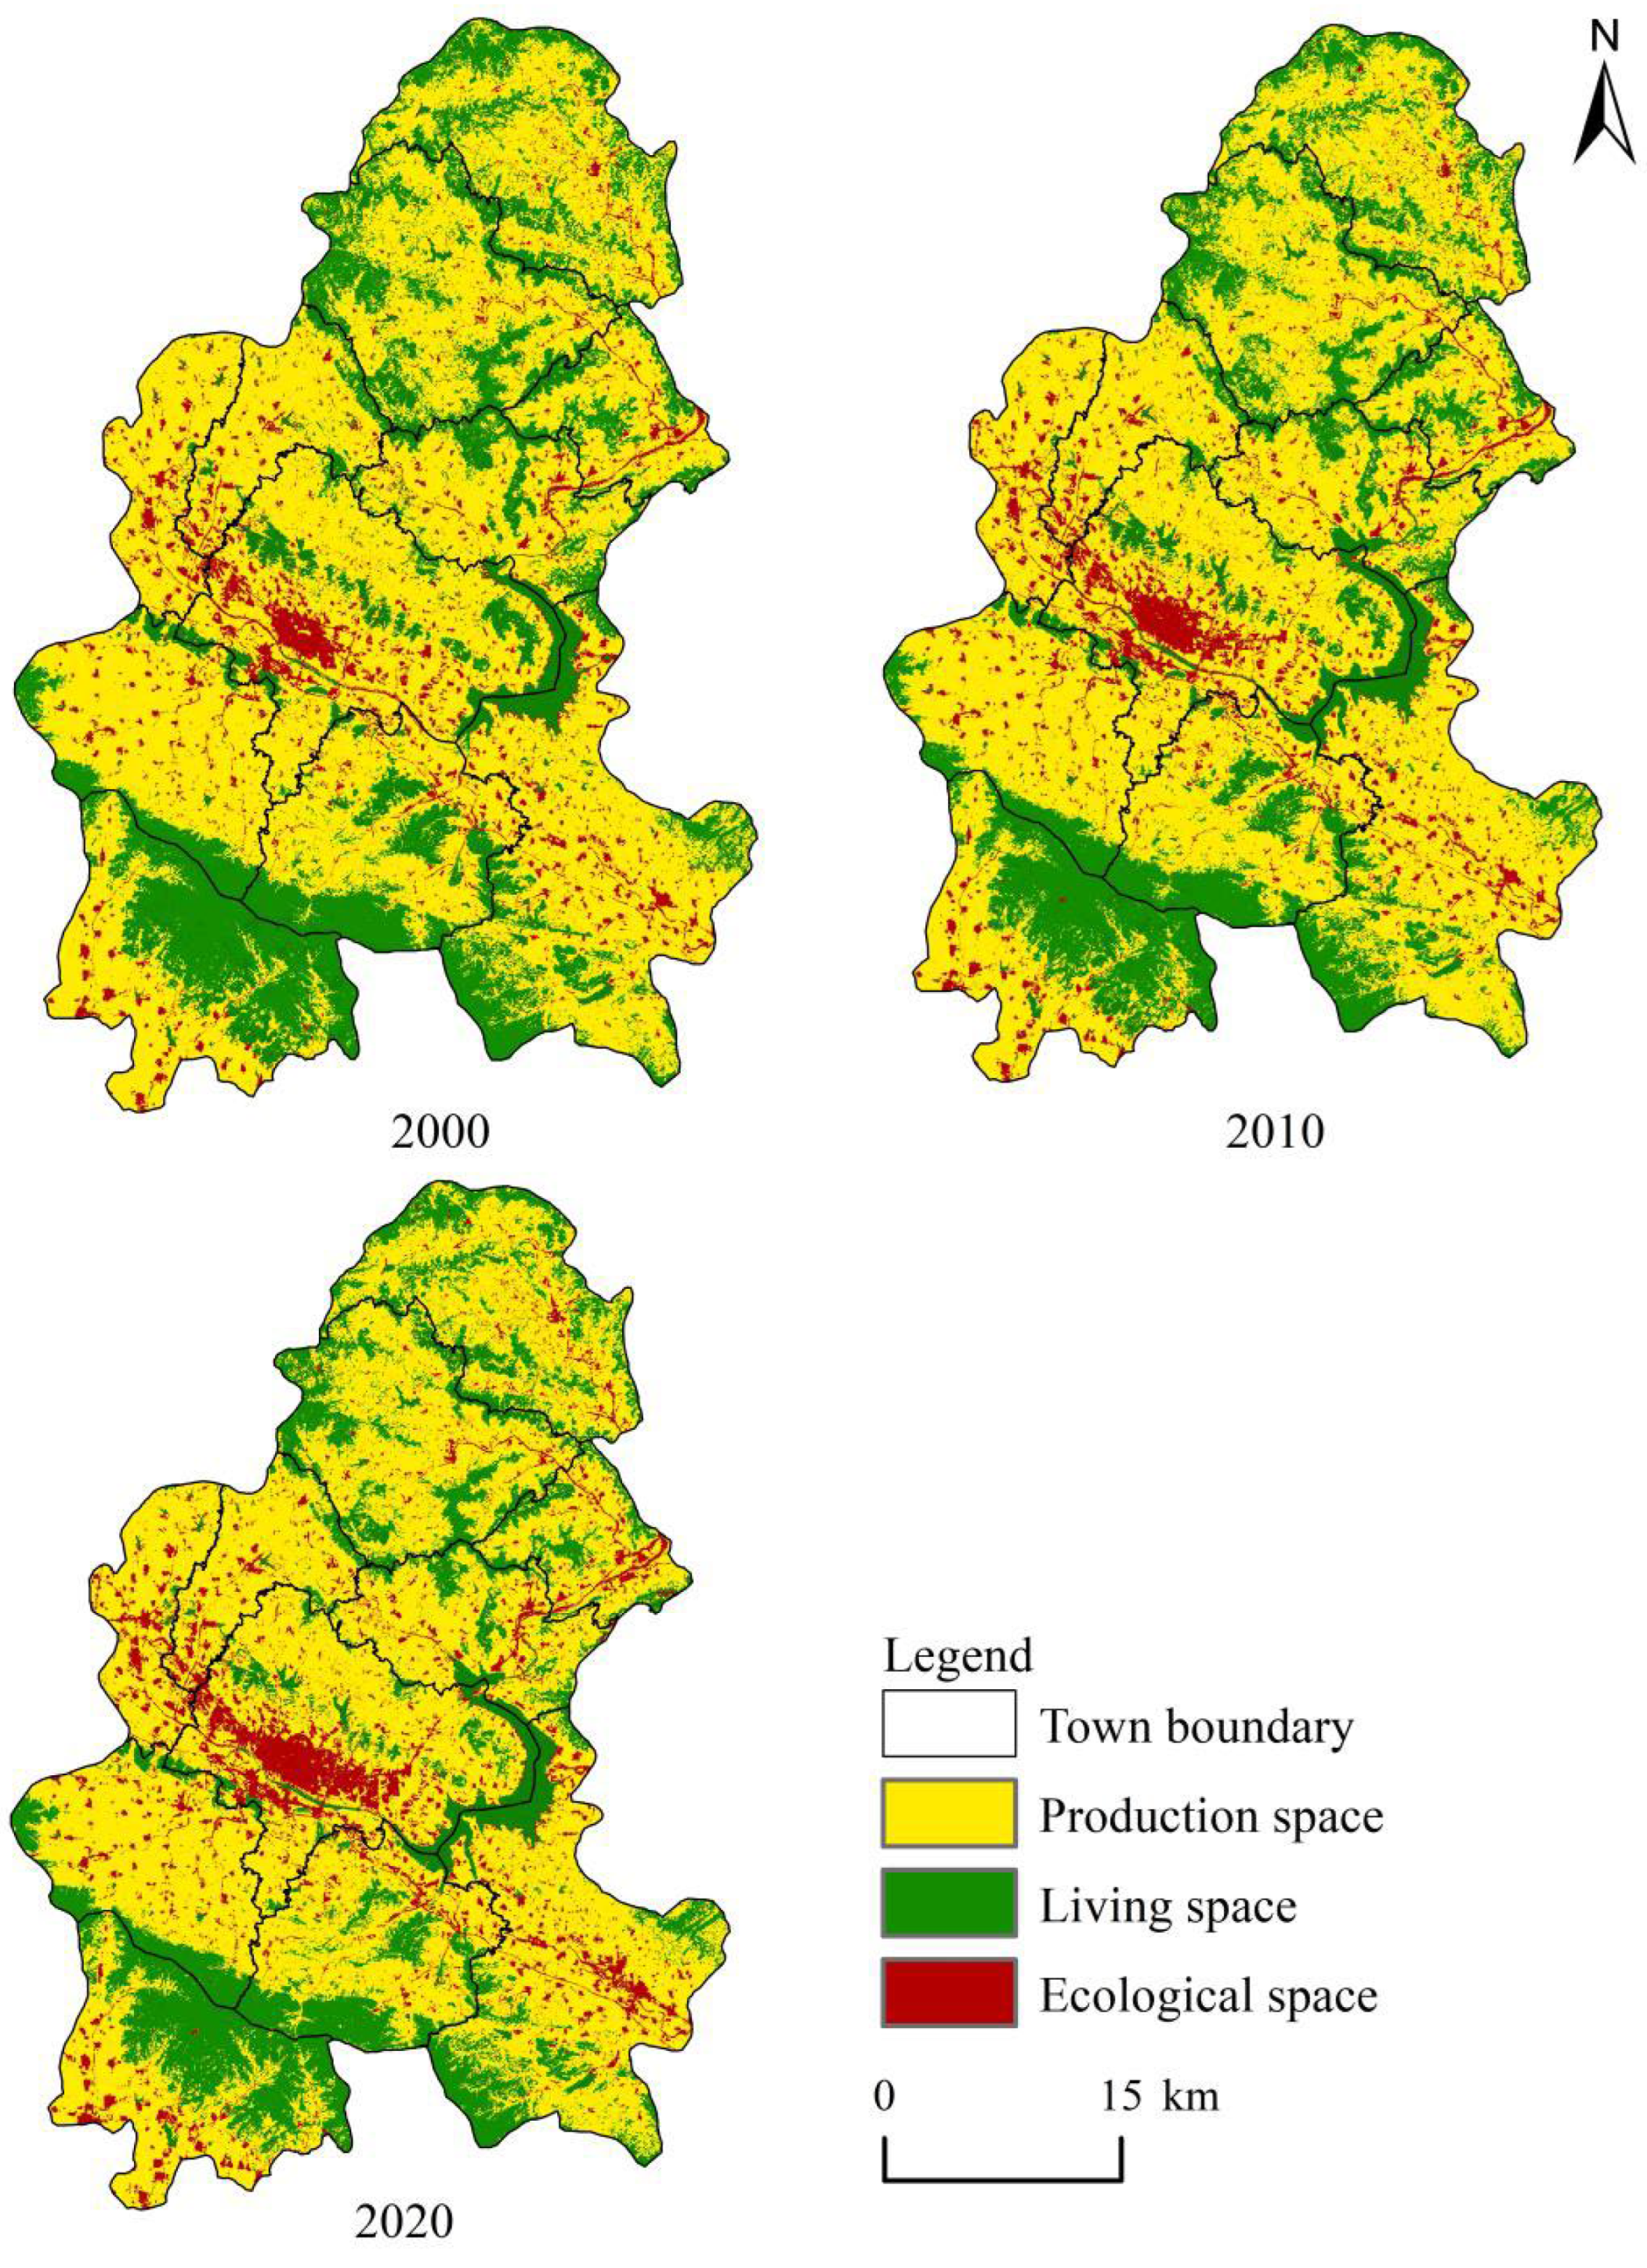
Figure 4.
Driving factors for land-use simulations under multiple scenarios.
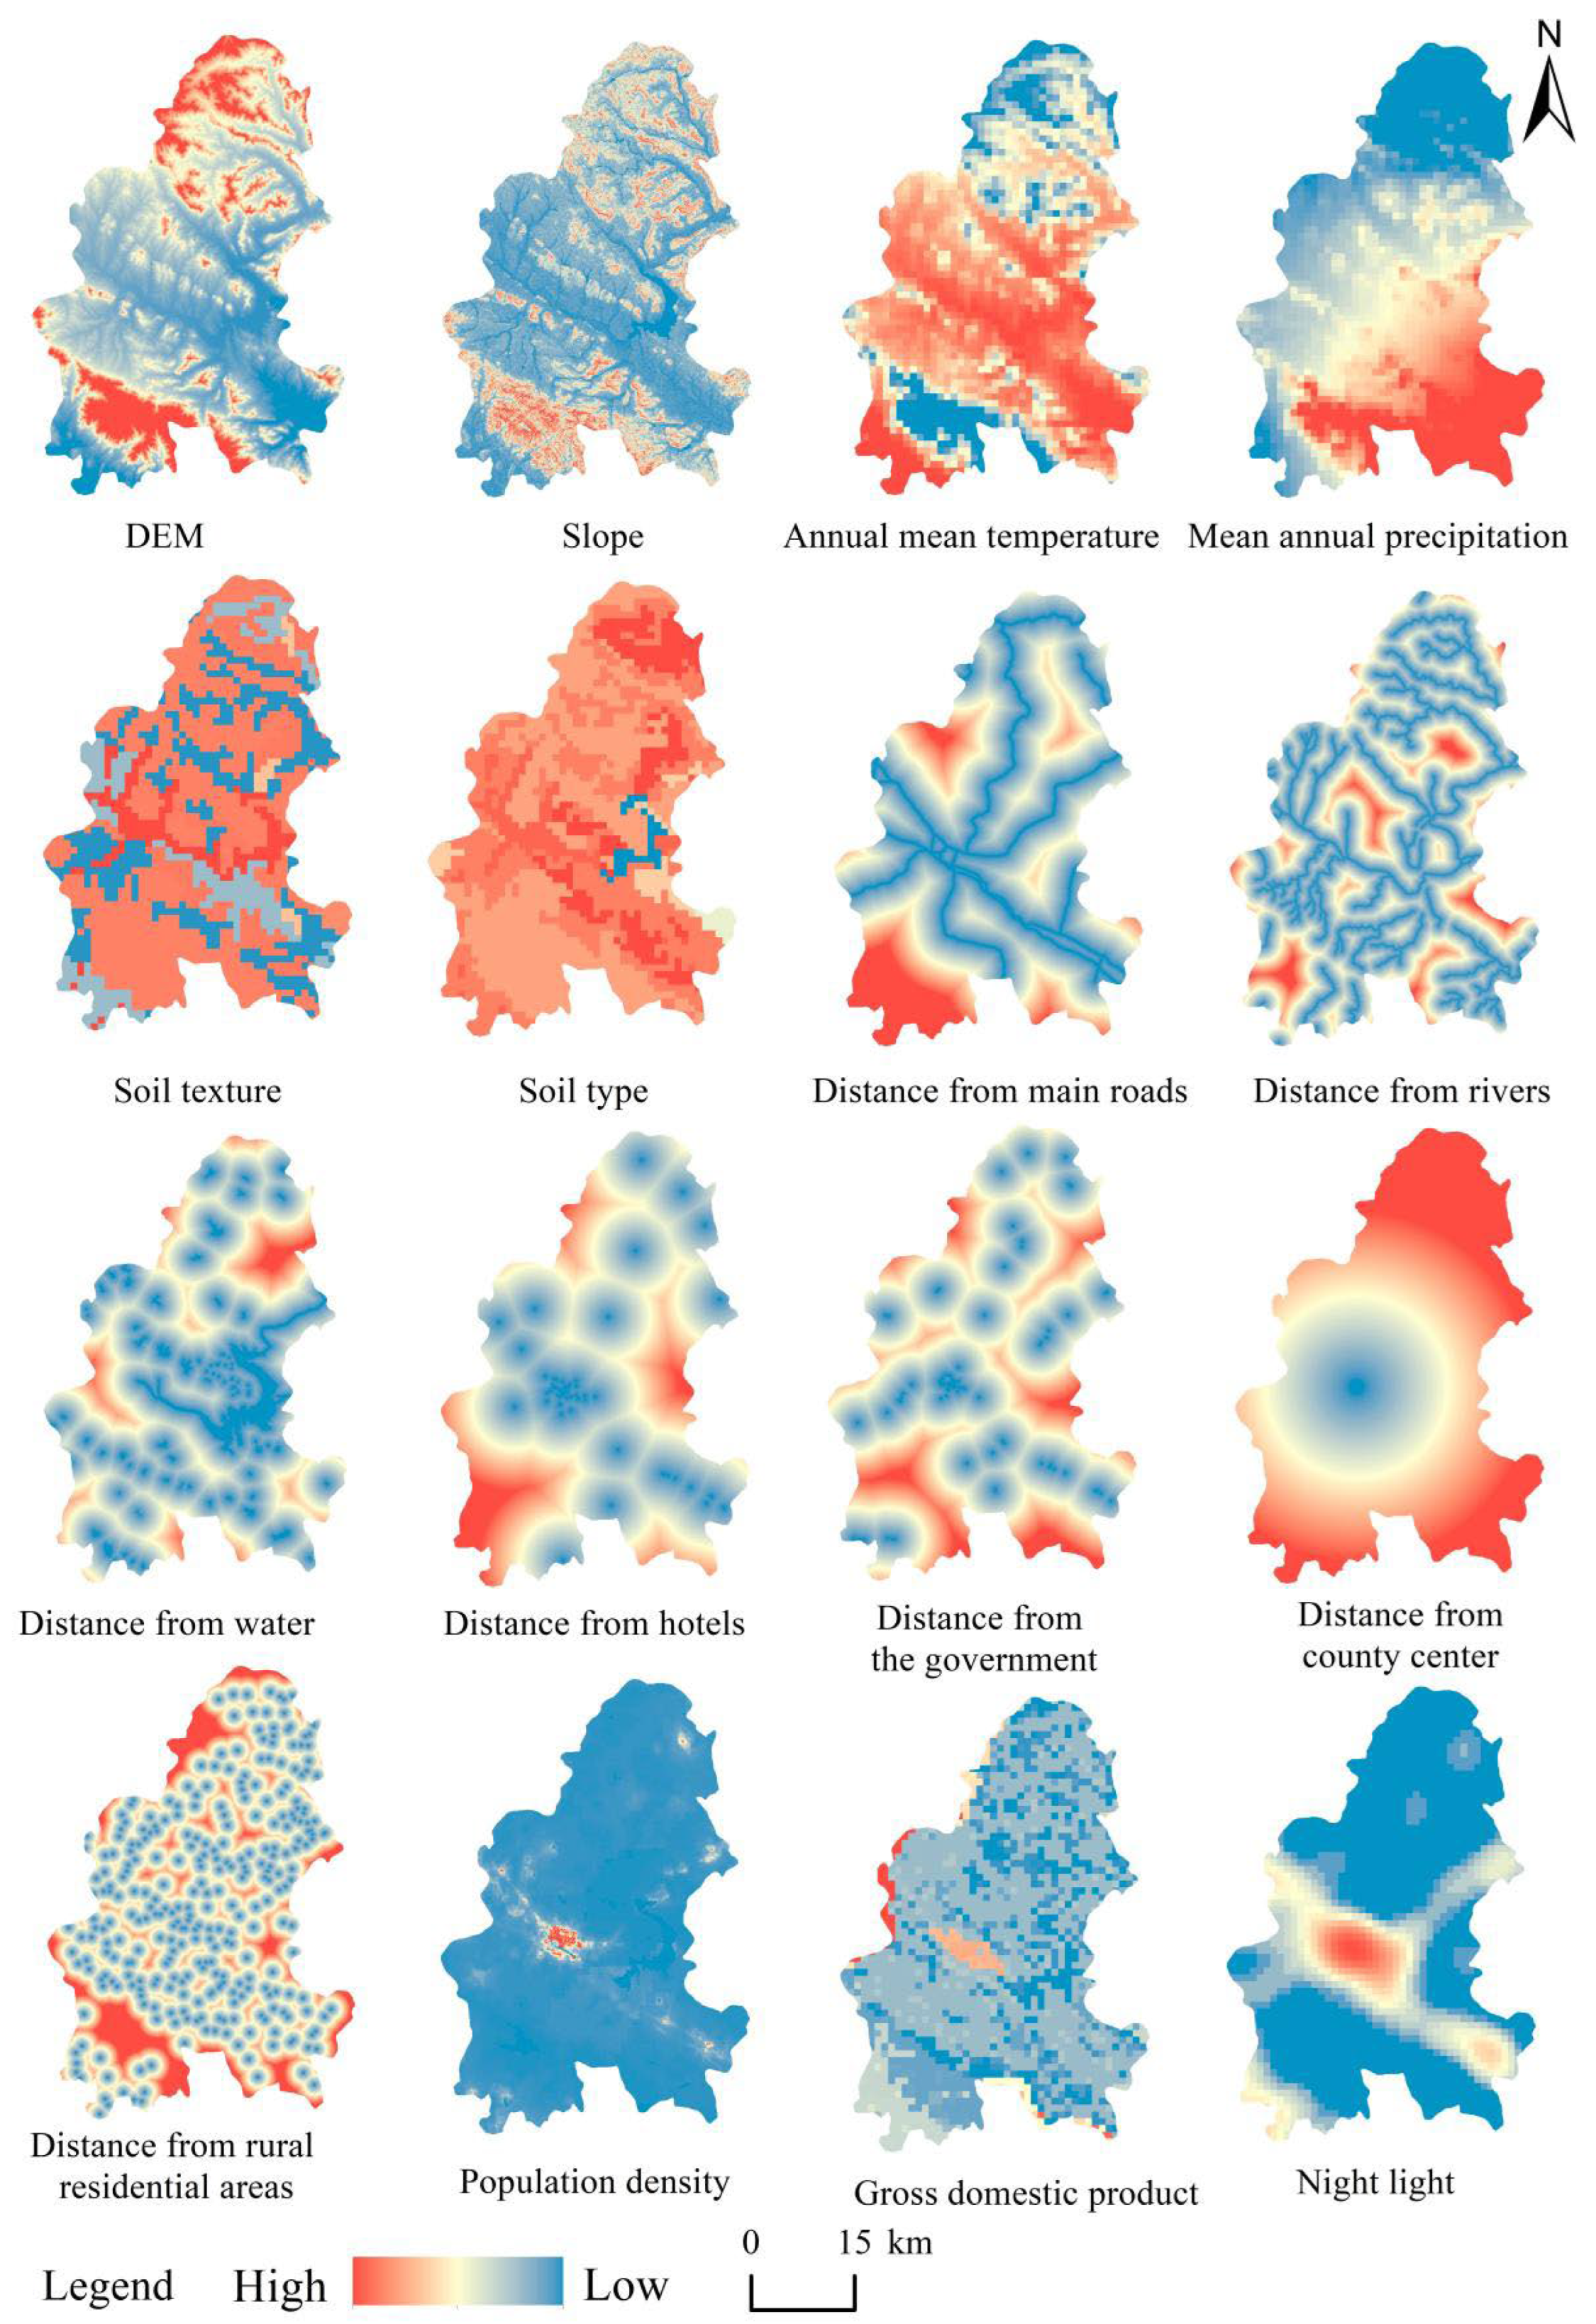
Figure 5.
Scenario simulation framework based on grey multiobjective optimization (GMOP)–Markov–patch-generating land use simulation (PLUS) coupling model.
Figure 5.
Scenario simulation framework based on grey multiobjective optimization (GMOP)–Markov–patch-generating land use simulation (PLUS) coupling model.
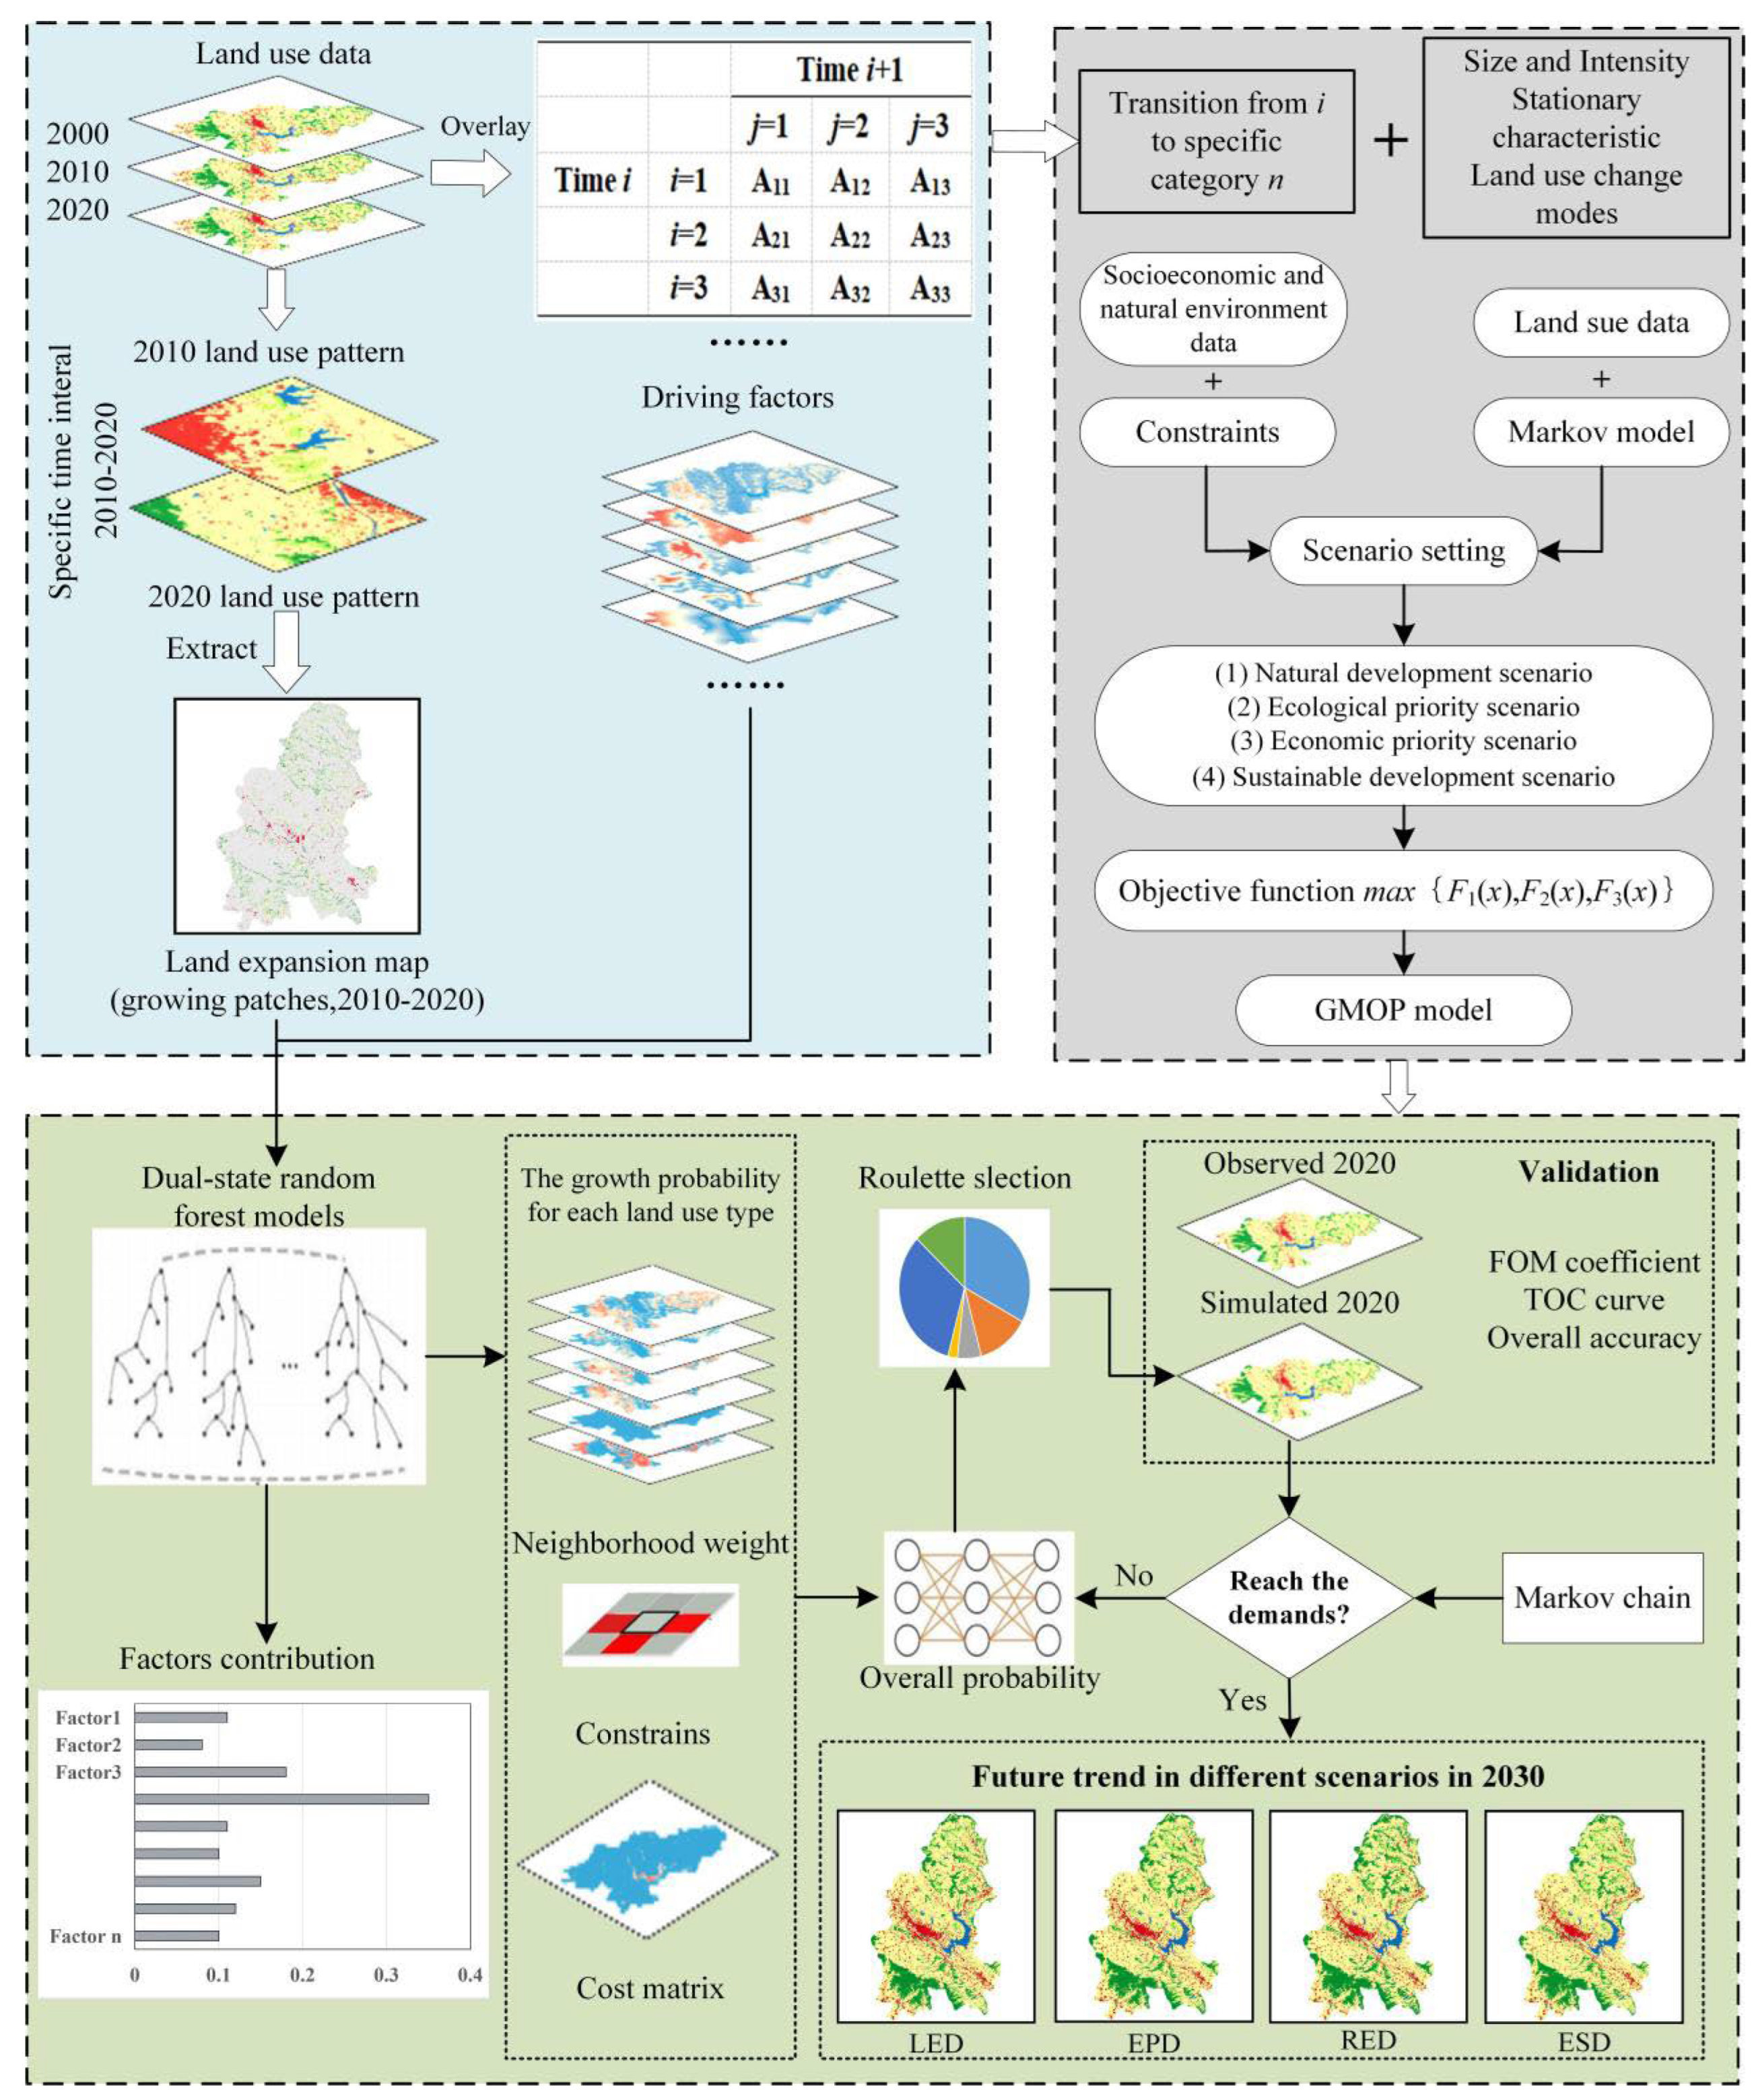
Figure 6.
Spatial distribution characteristic of land-use spatial conflict (LUSC) in the Yimengshan Geopark (YG) in 2000, 2010, and 2020.
Figure 6.
Spatial distribution characteristic of land-use spatial conflict (LUSC) in the Yimengshan Geopark (YG) in 2000, 2010, and 2020.
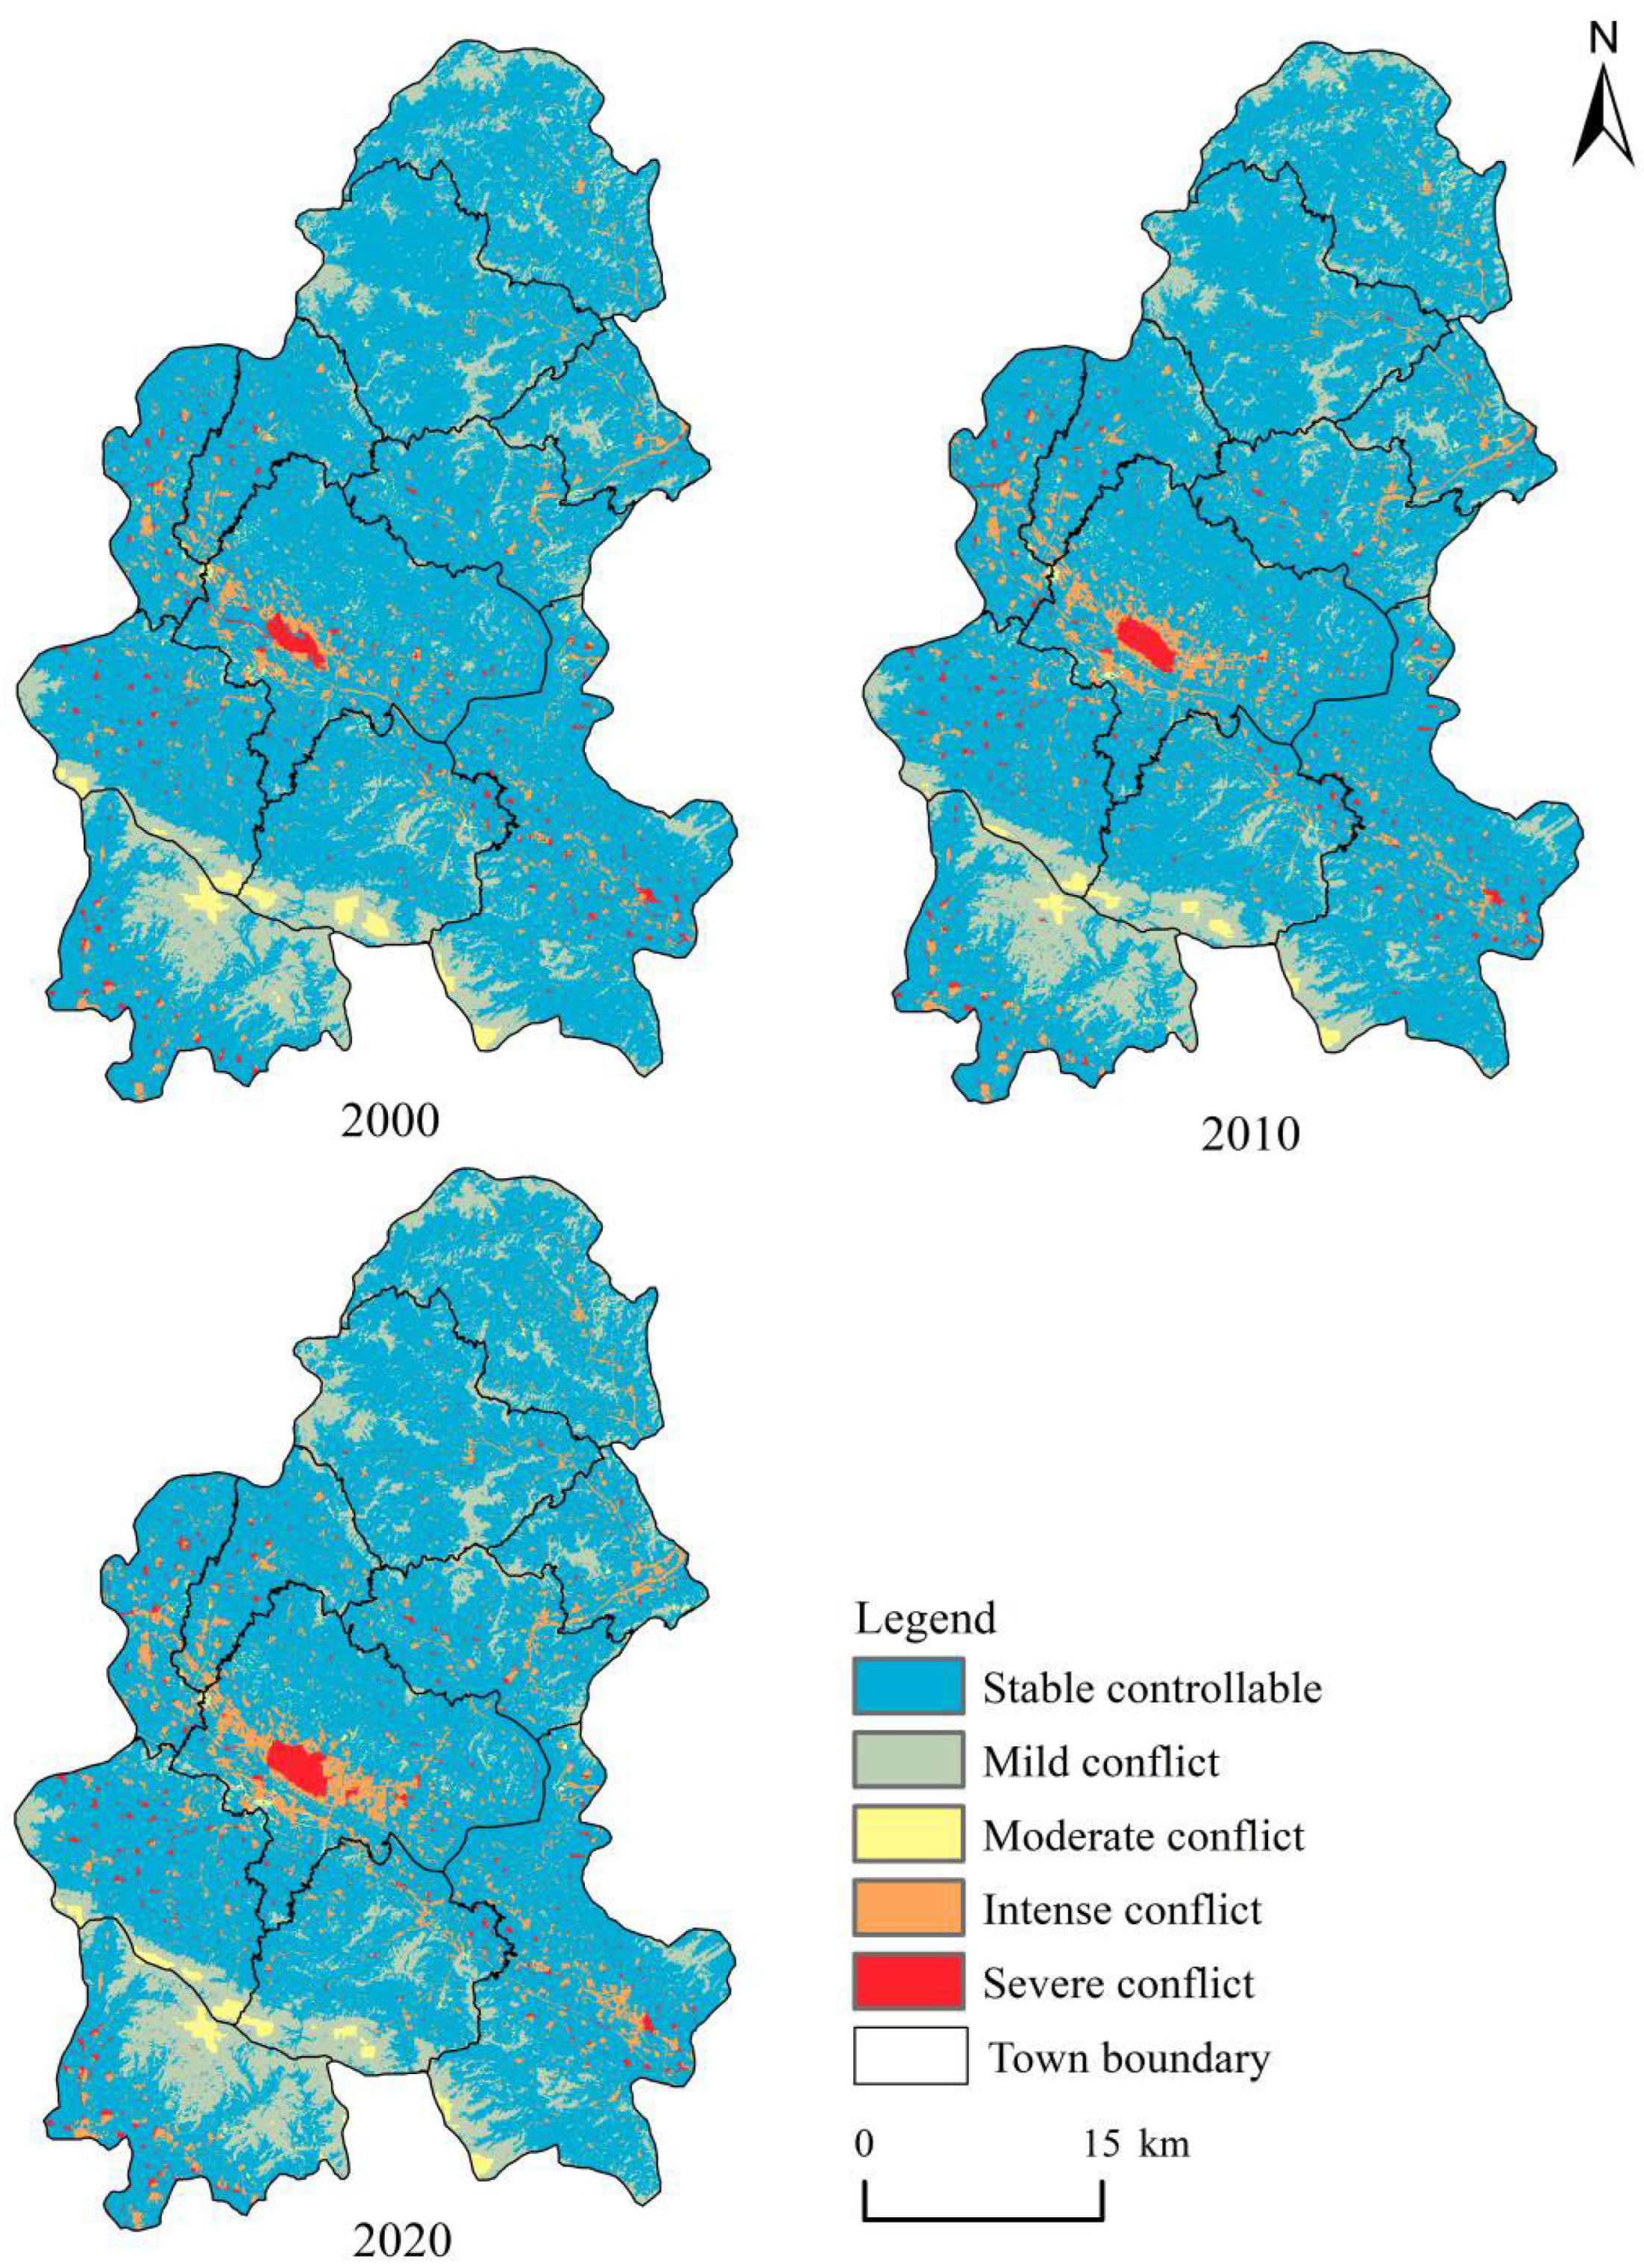
Figure 7.
LISAi agglomeration maps of land-use spatial conflict in the Yimengshan Geopark (YG) in 2000, 2010, and 2020.
Figure 7.
LISAi agglomeration maps of land-use spatial conflict in the Yimengshan Geopark (YG) in 2000, 2010, and 2020.
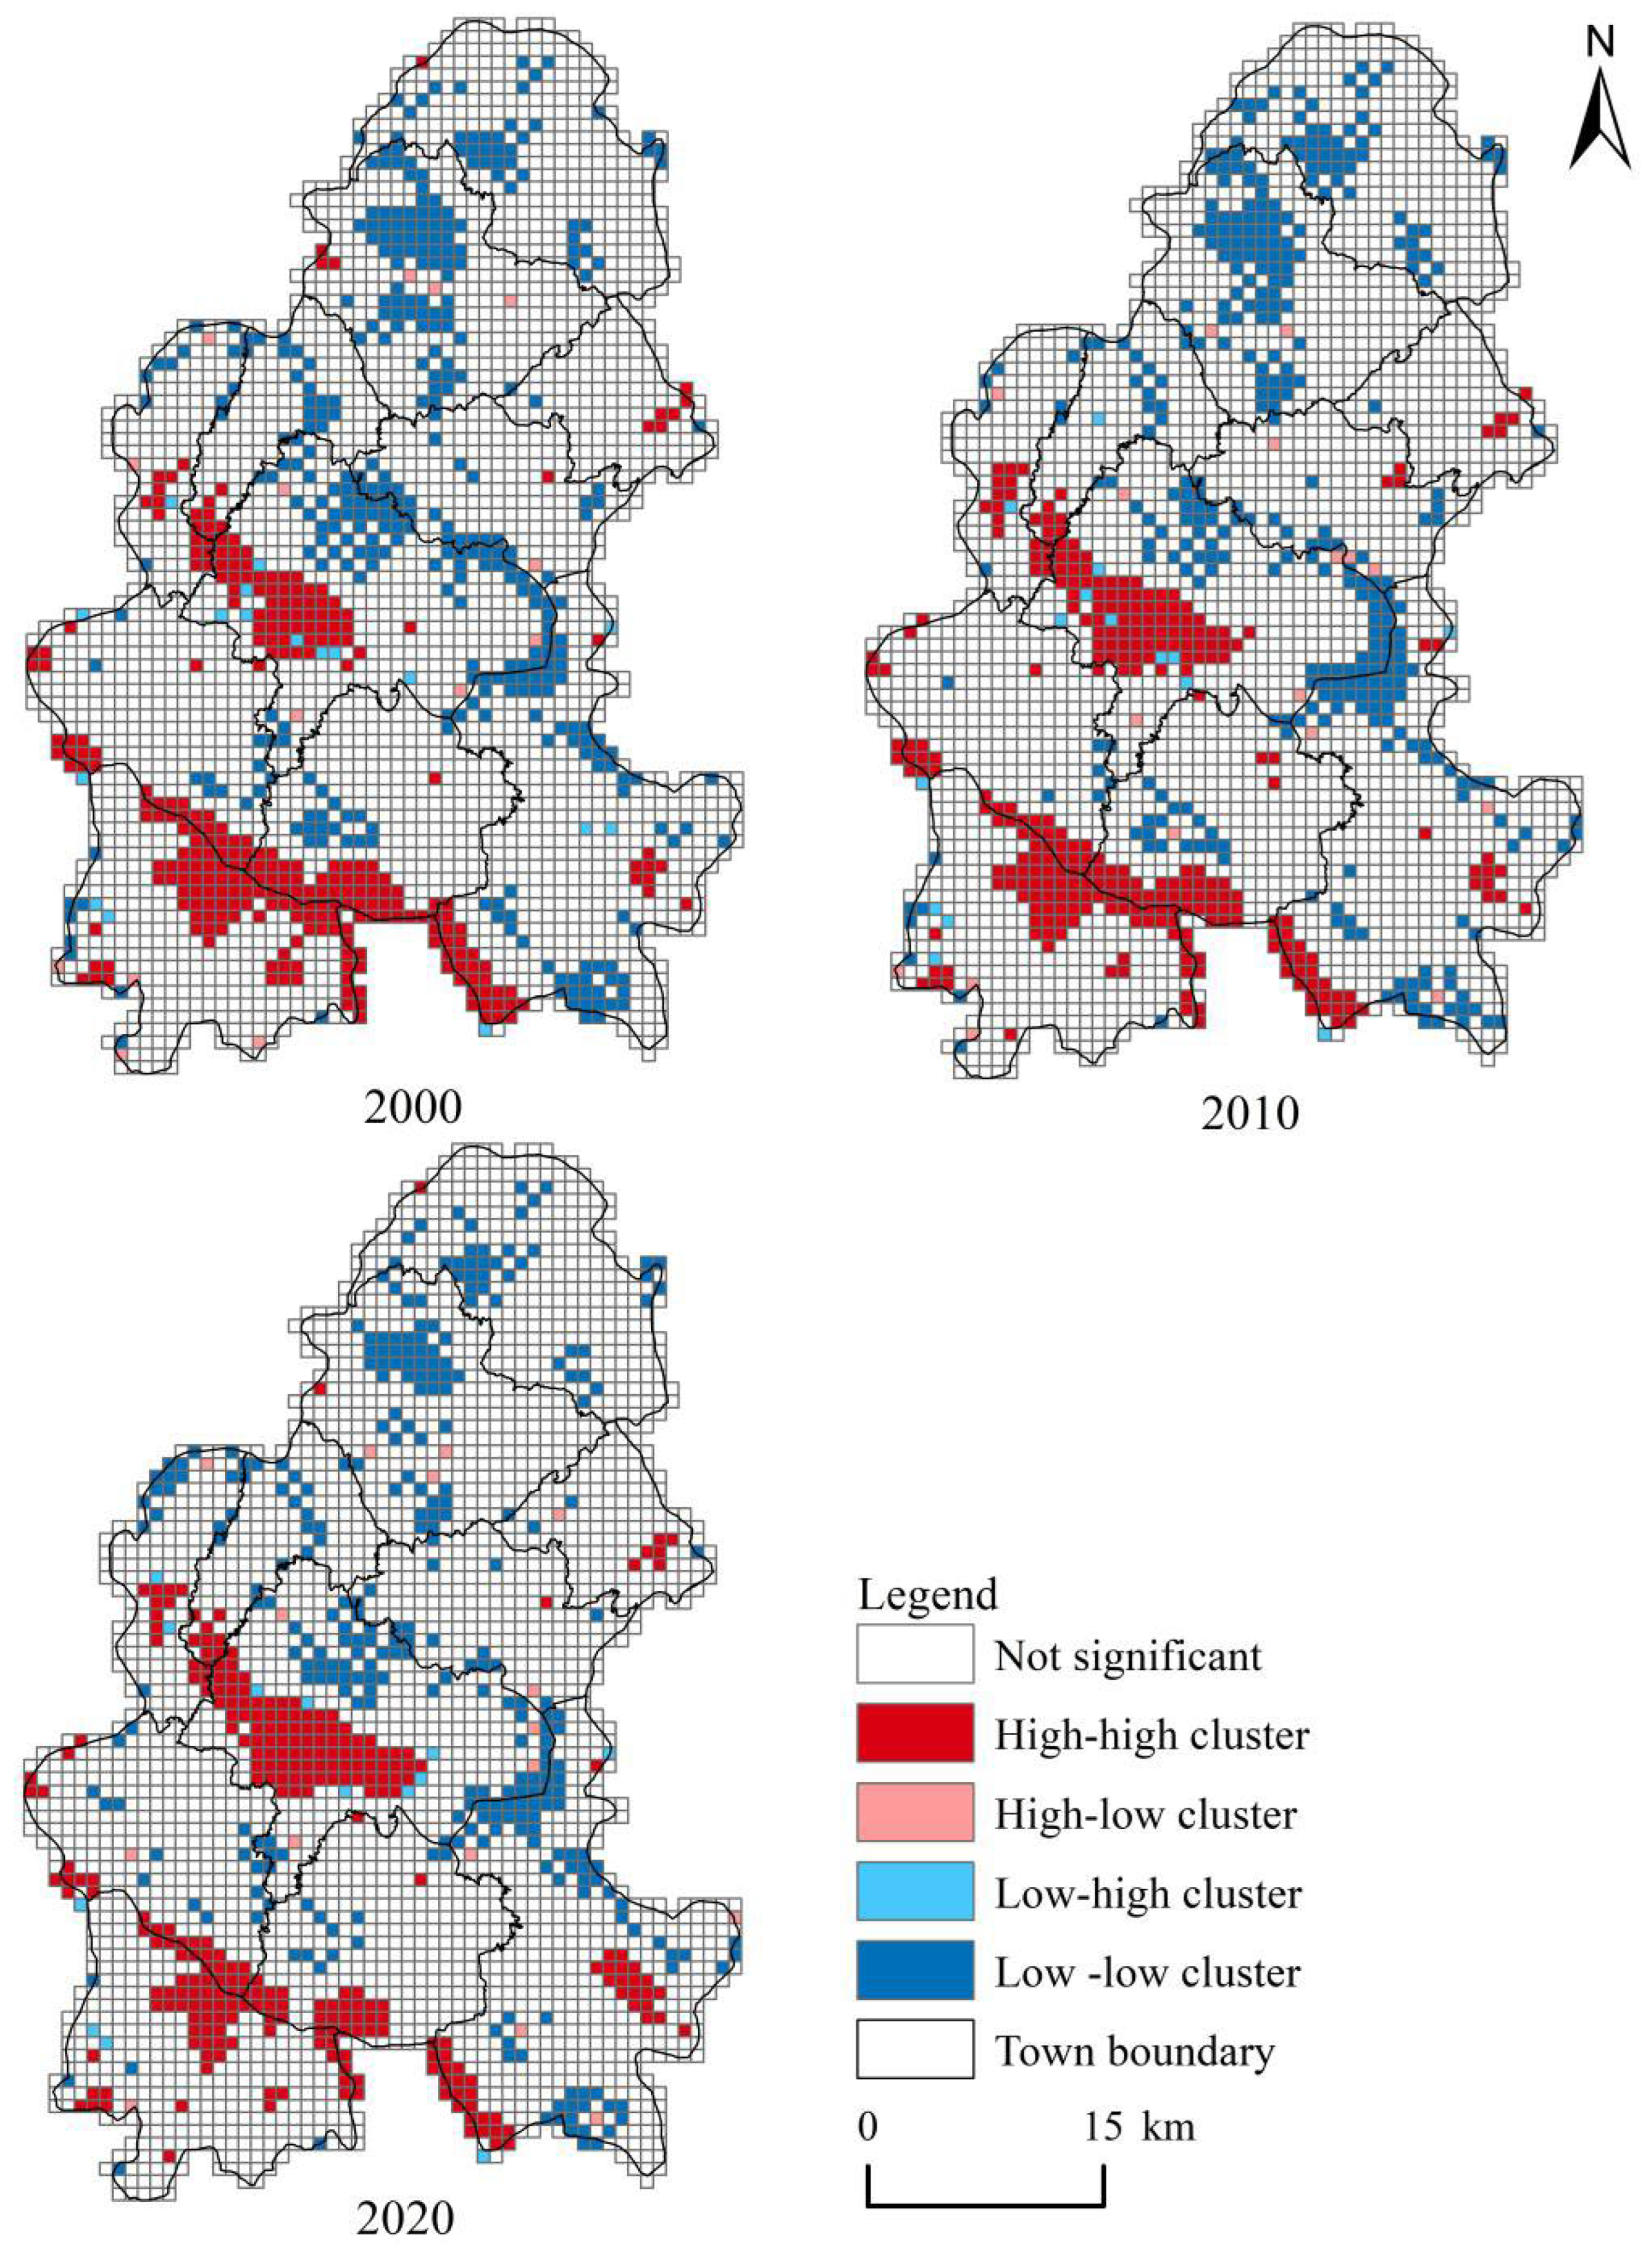
Figure 8.
Multiscenario simulation pattern of land-use spatial conflict in the Yimengshan Geopark (YG) in 2030.
Figure 8.
Multiscenario simulation pattern of land-use spatial conflict in the Yimengshan Geopark (YG) in 2030.
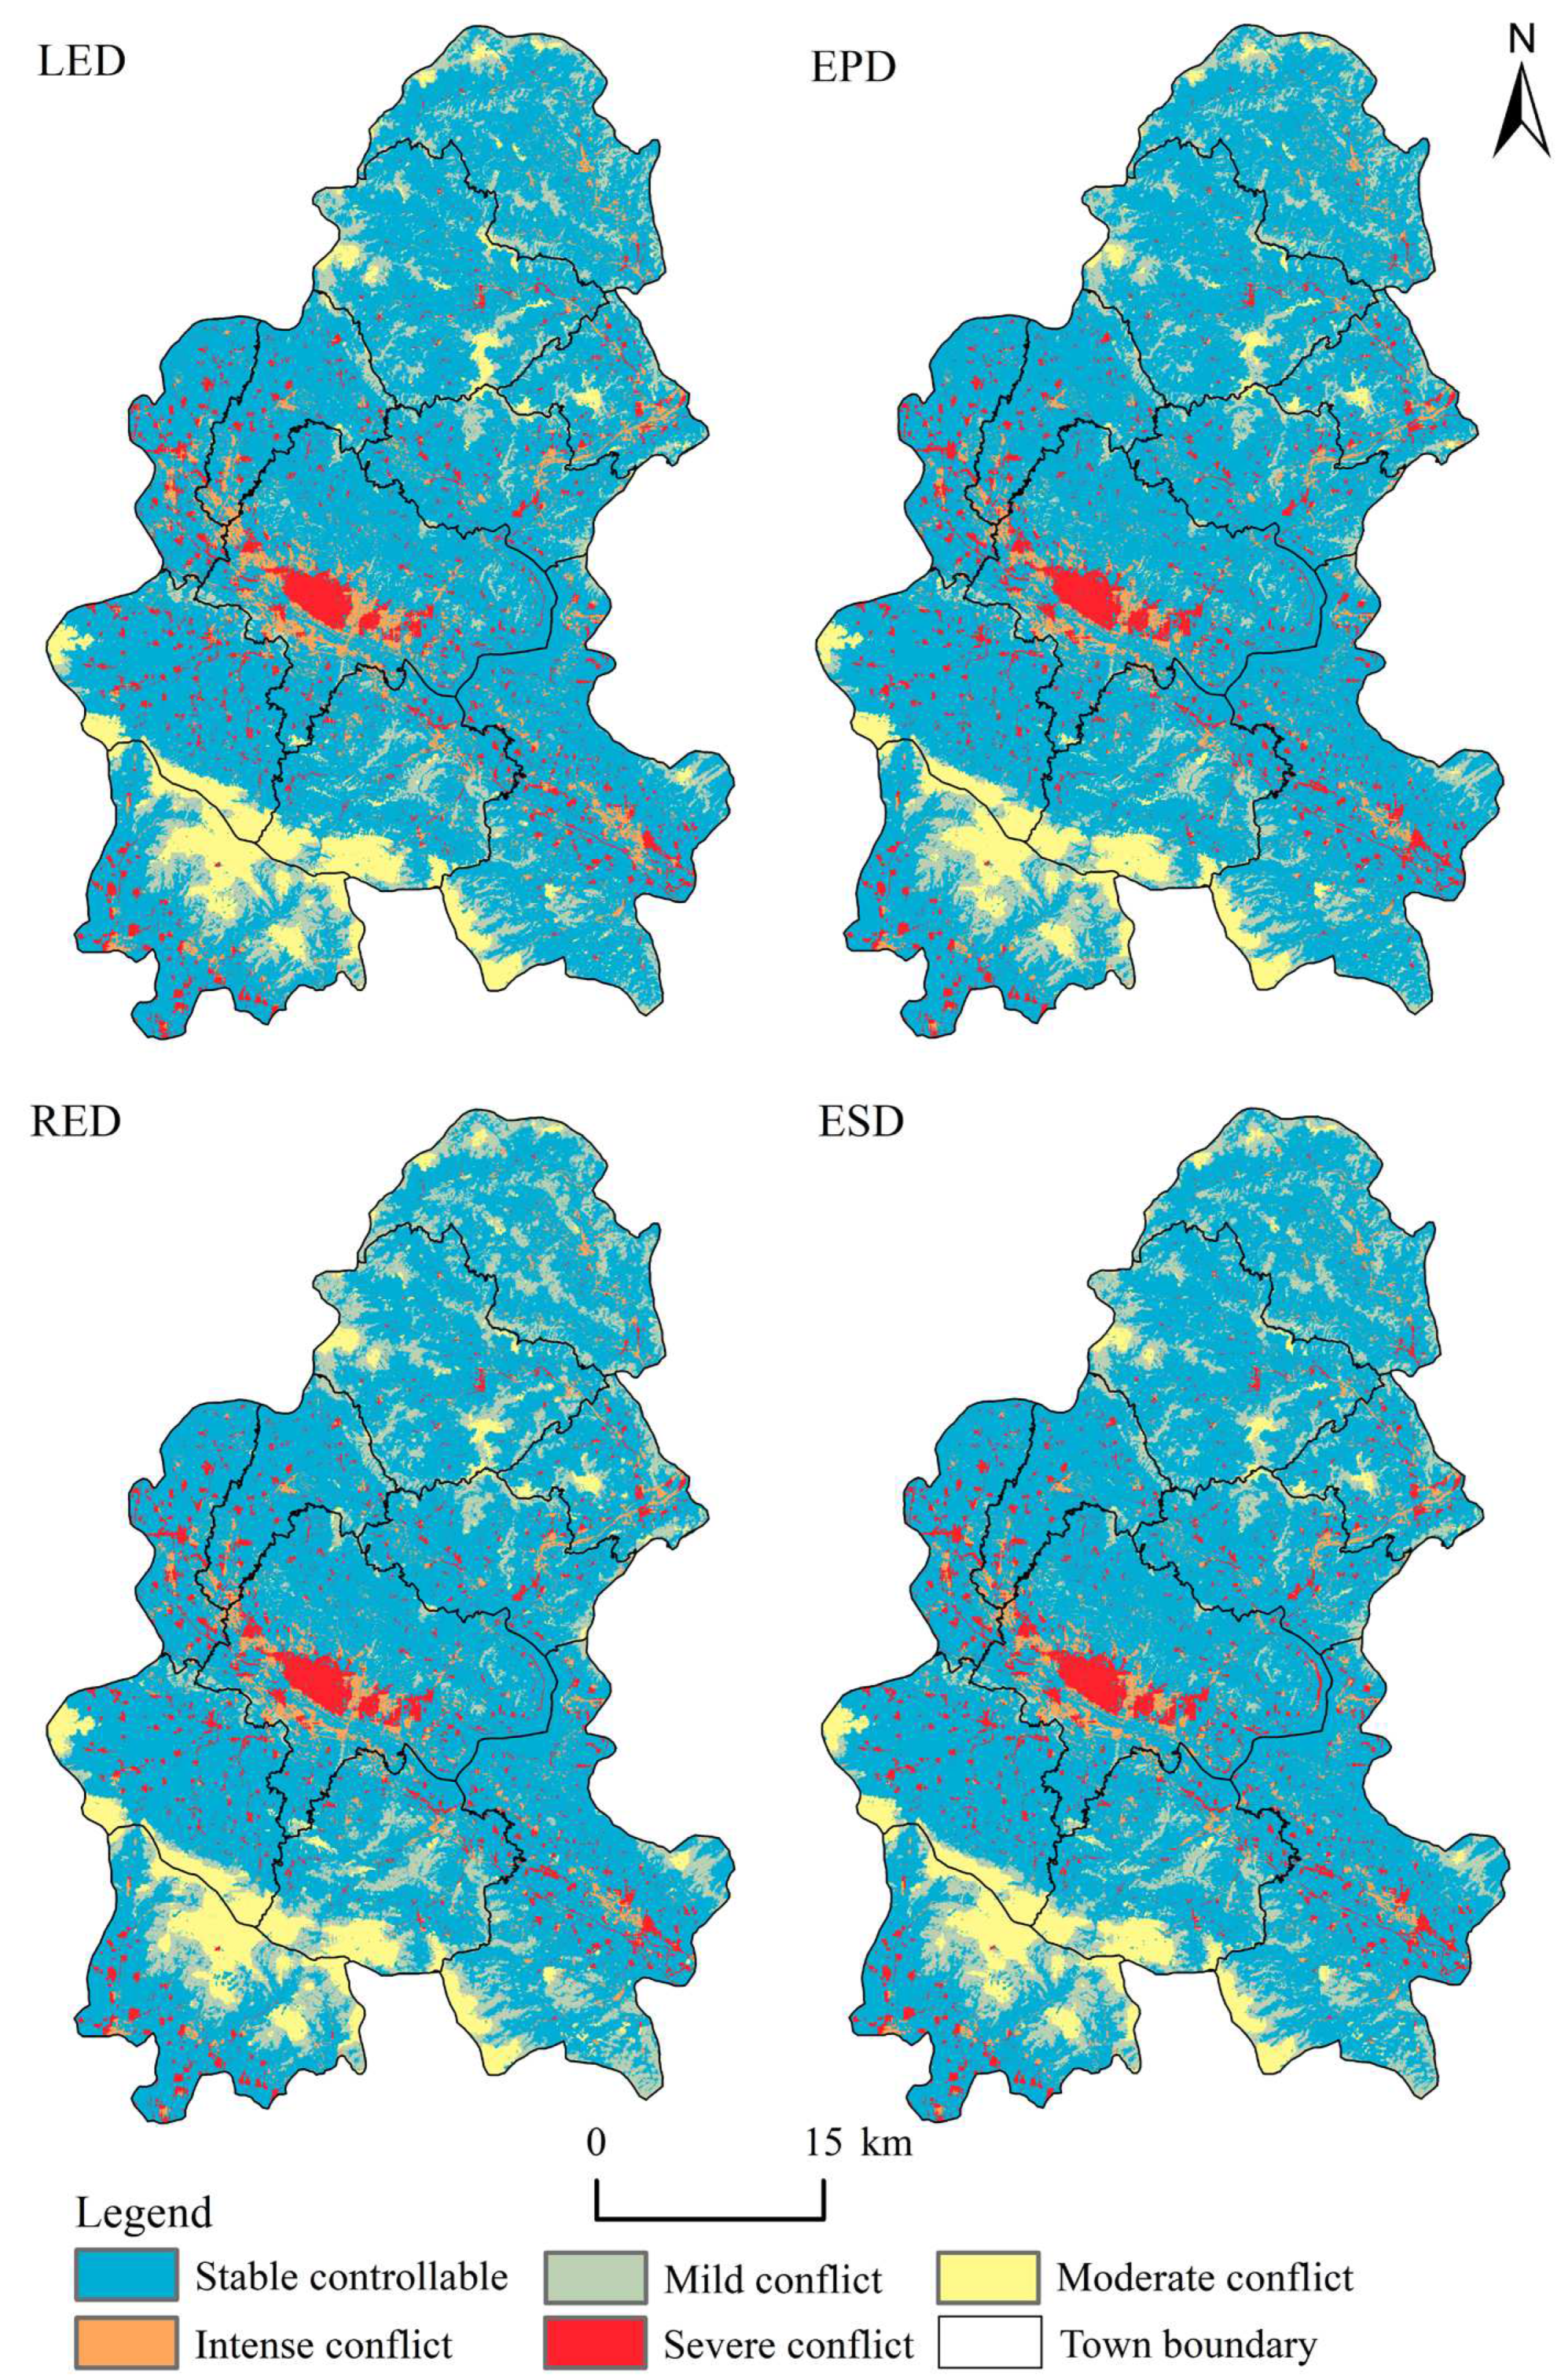
Figure 9.
Diving factors importance rankings of six land-use types used in the scenario simulations.
Figure 9.
Diving factors importance rankings of six land-use types used in the scenario simulations.
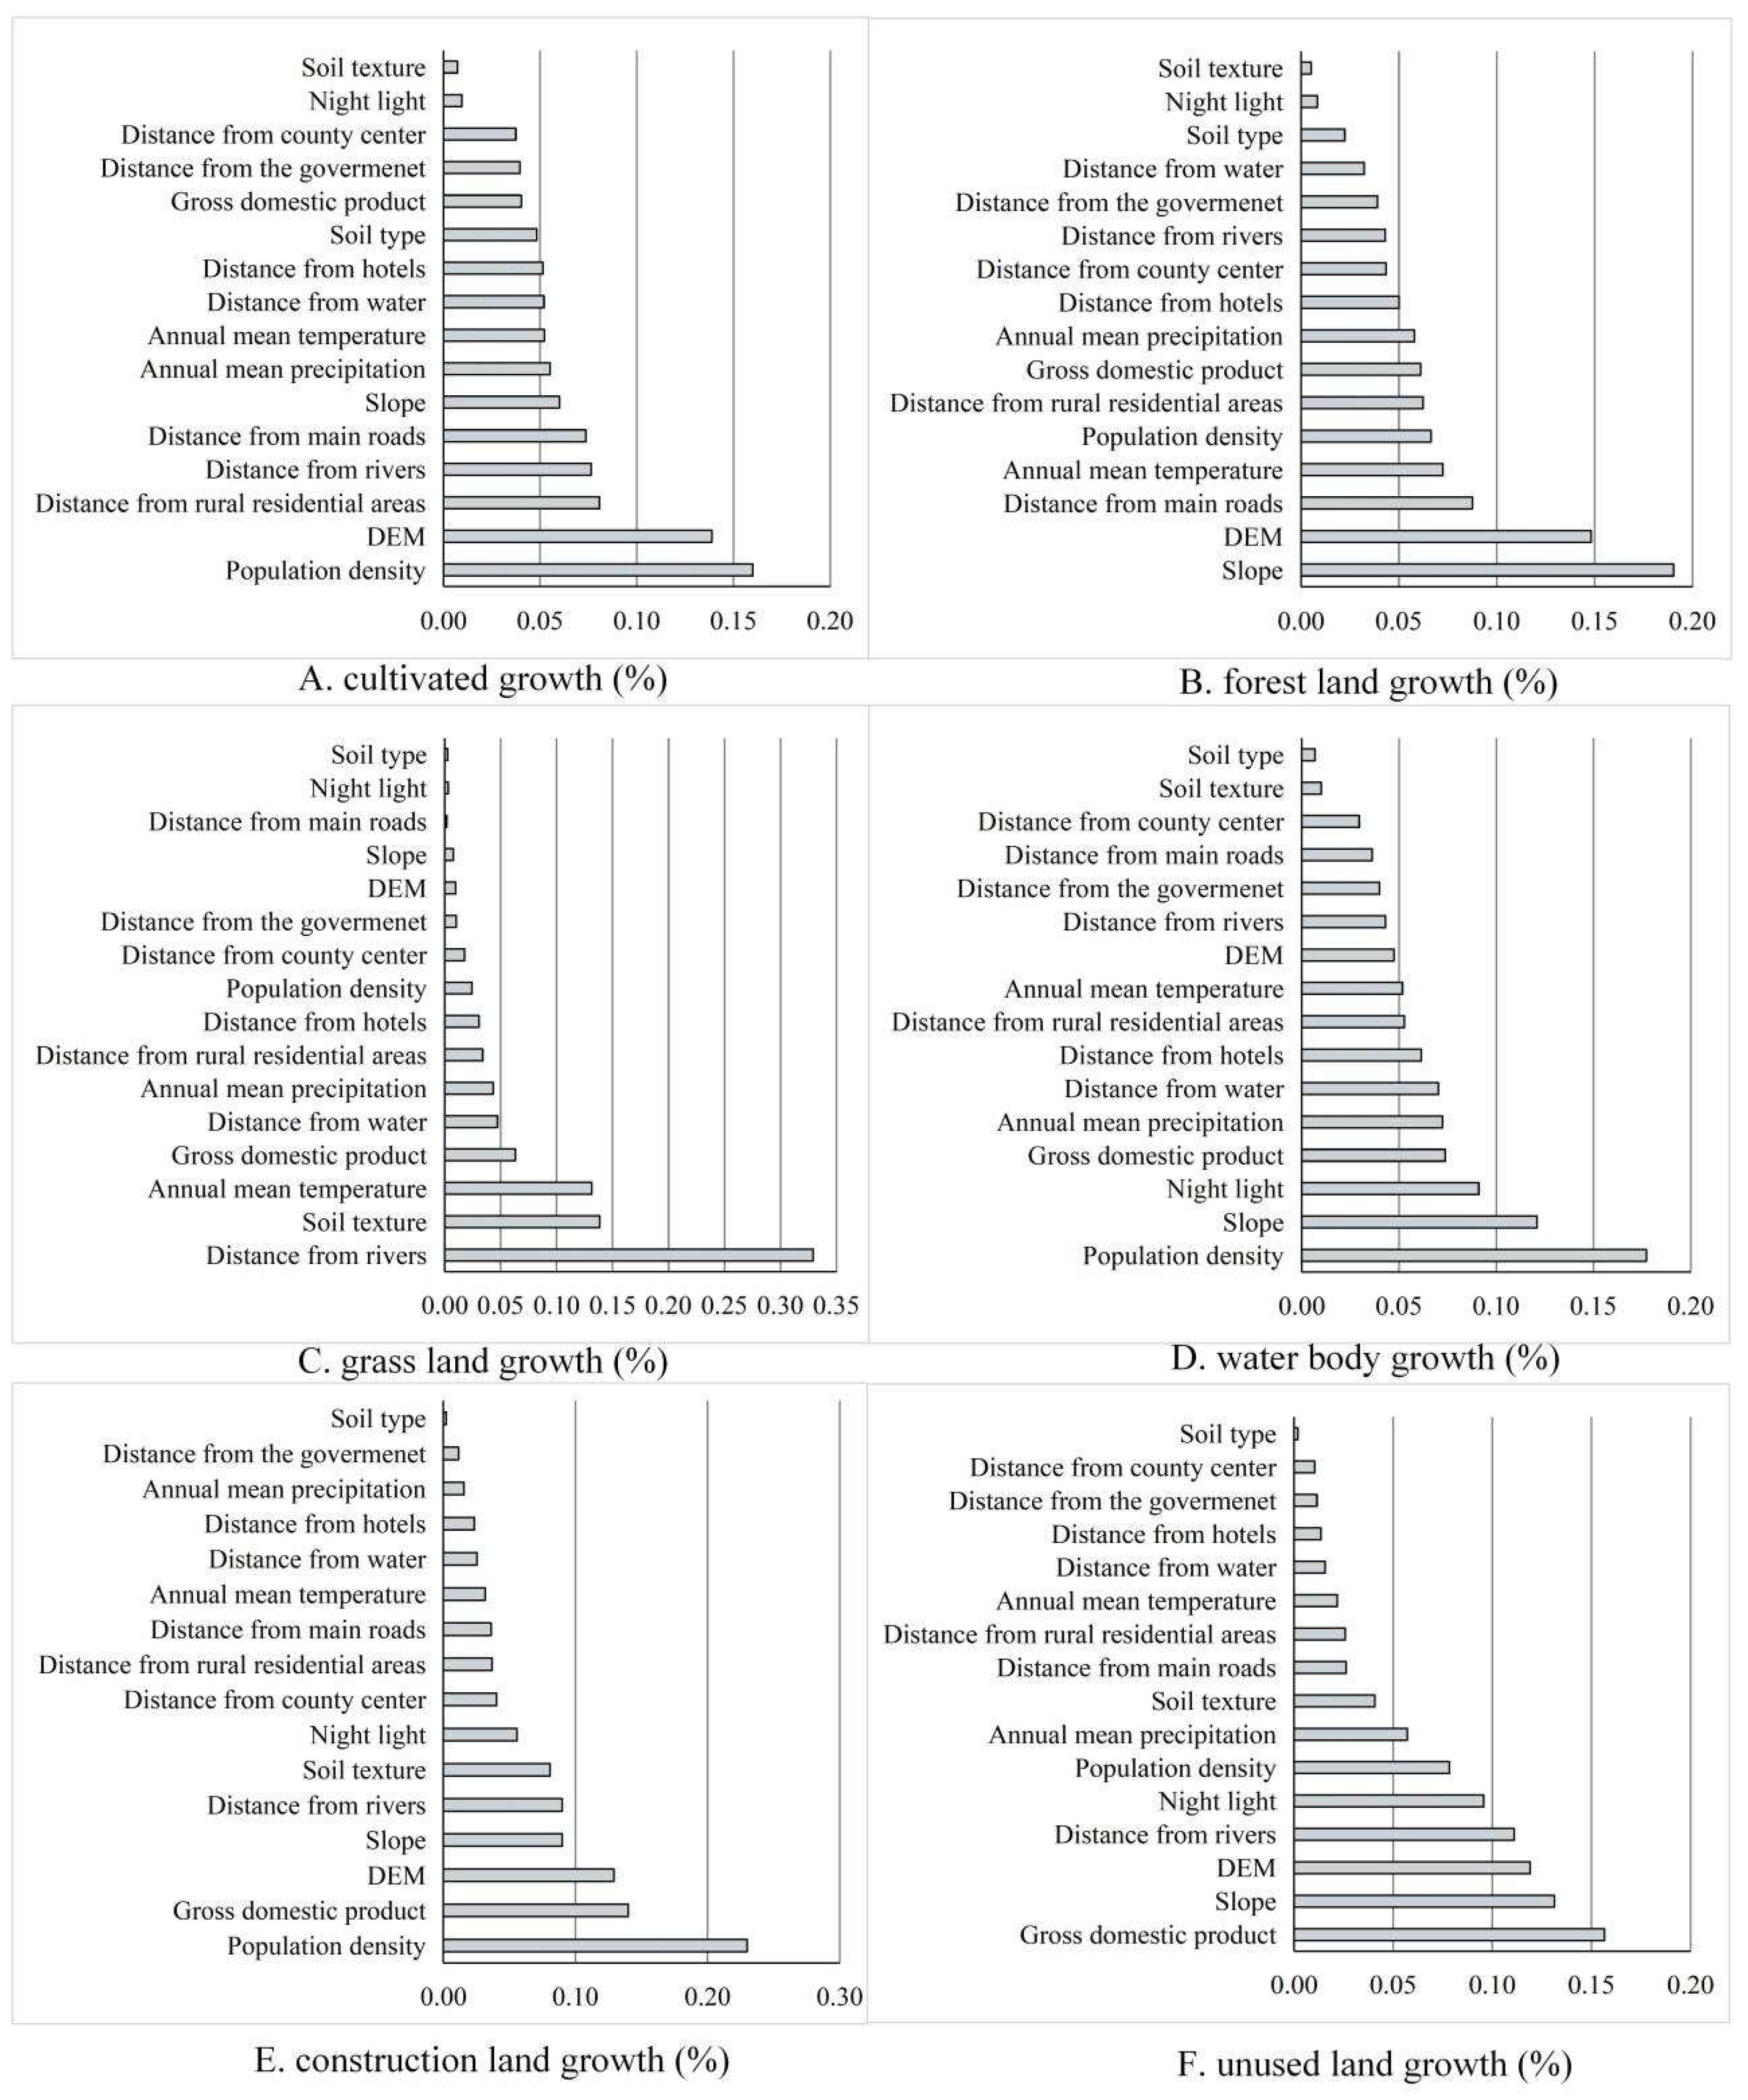
Figure 10.
Area change trends of land-use spatial conflict (LUSC) in different scenarios in 2030.
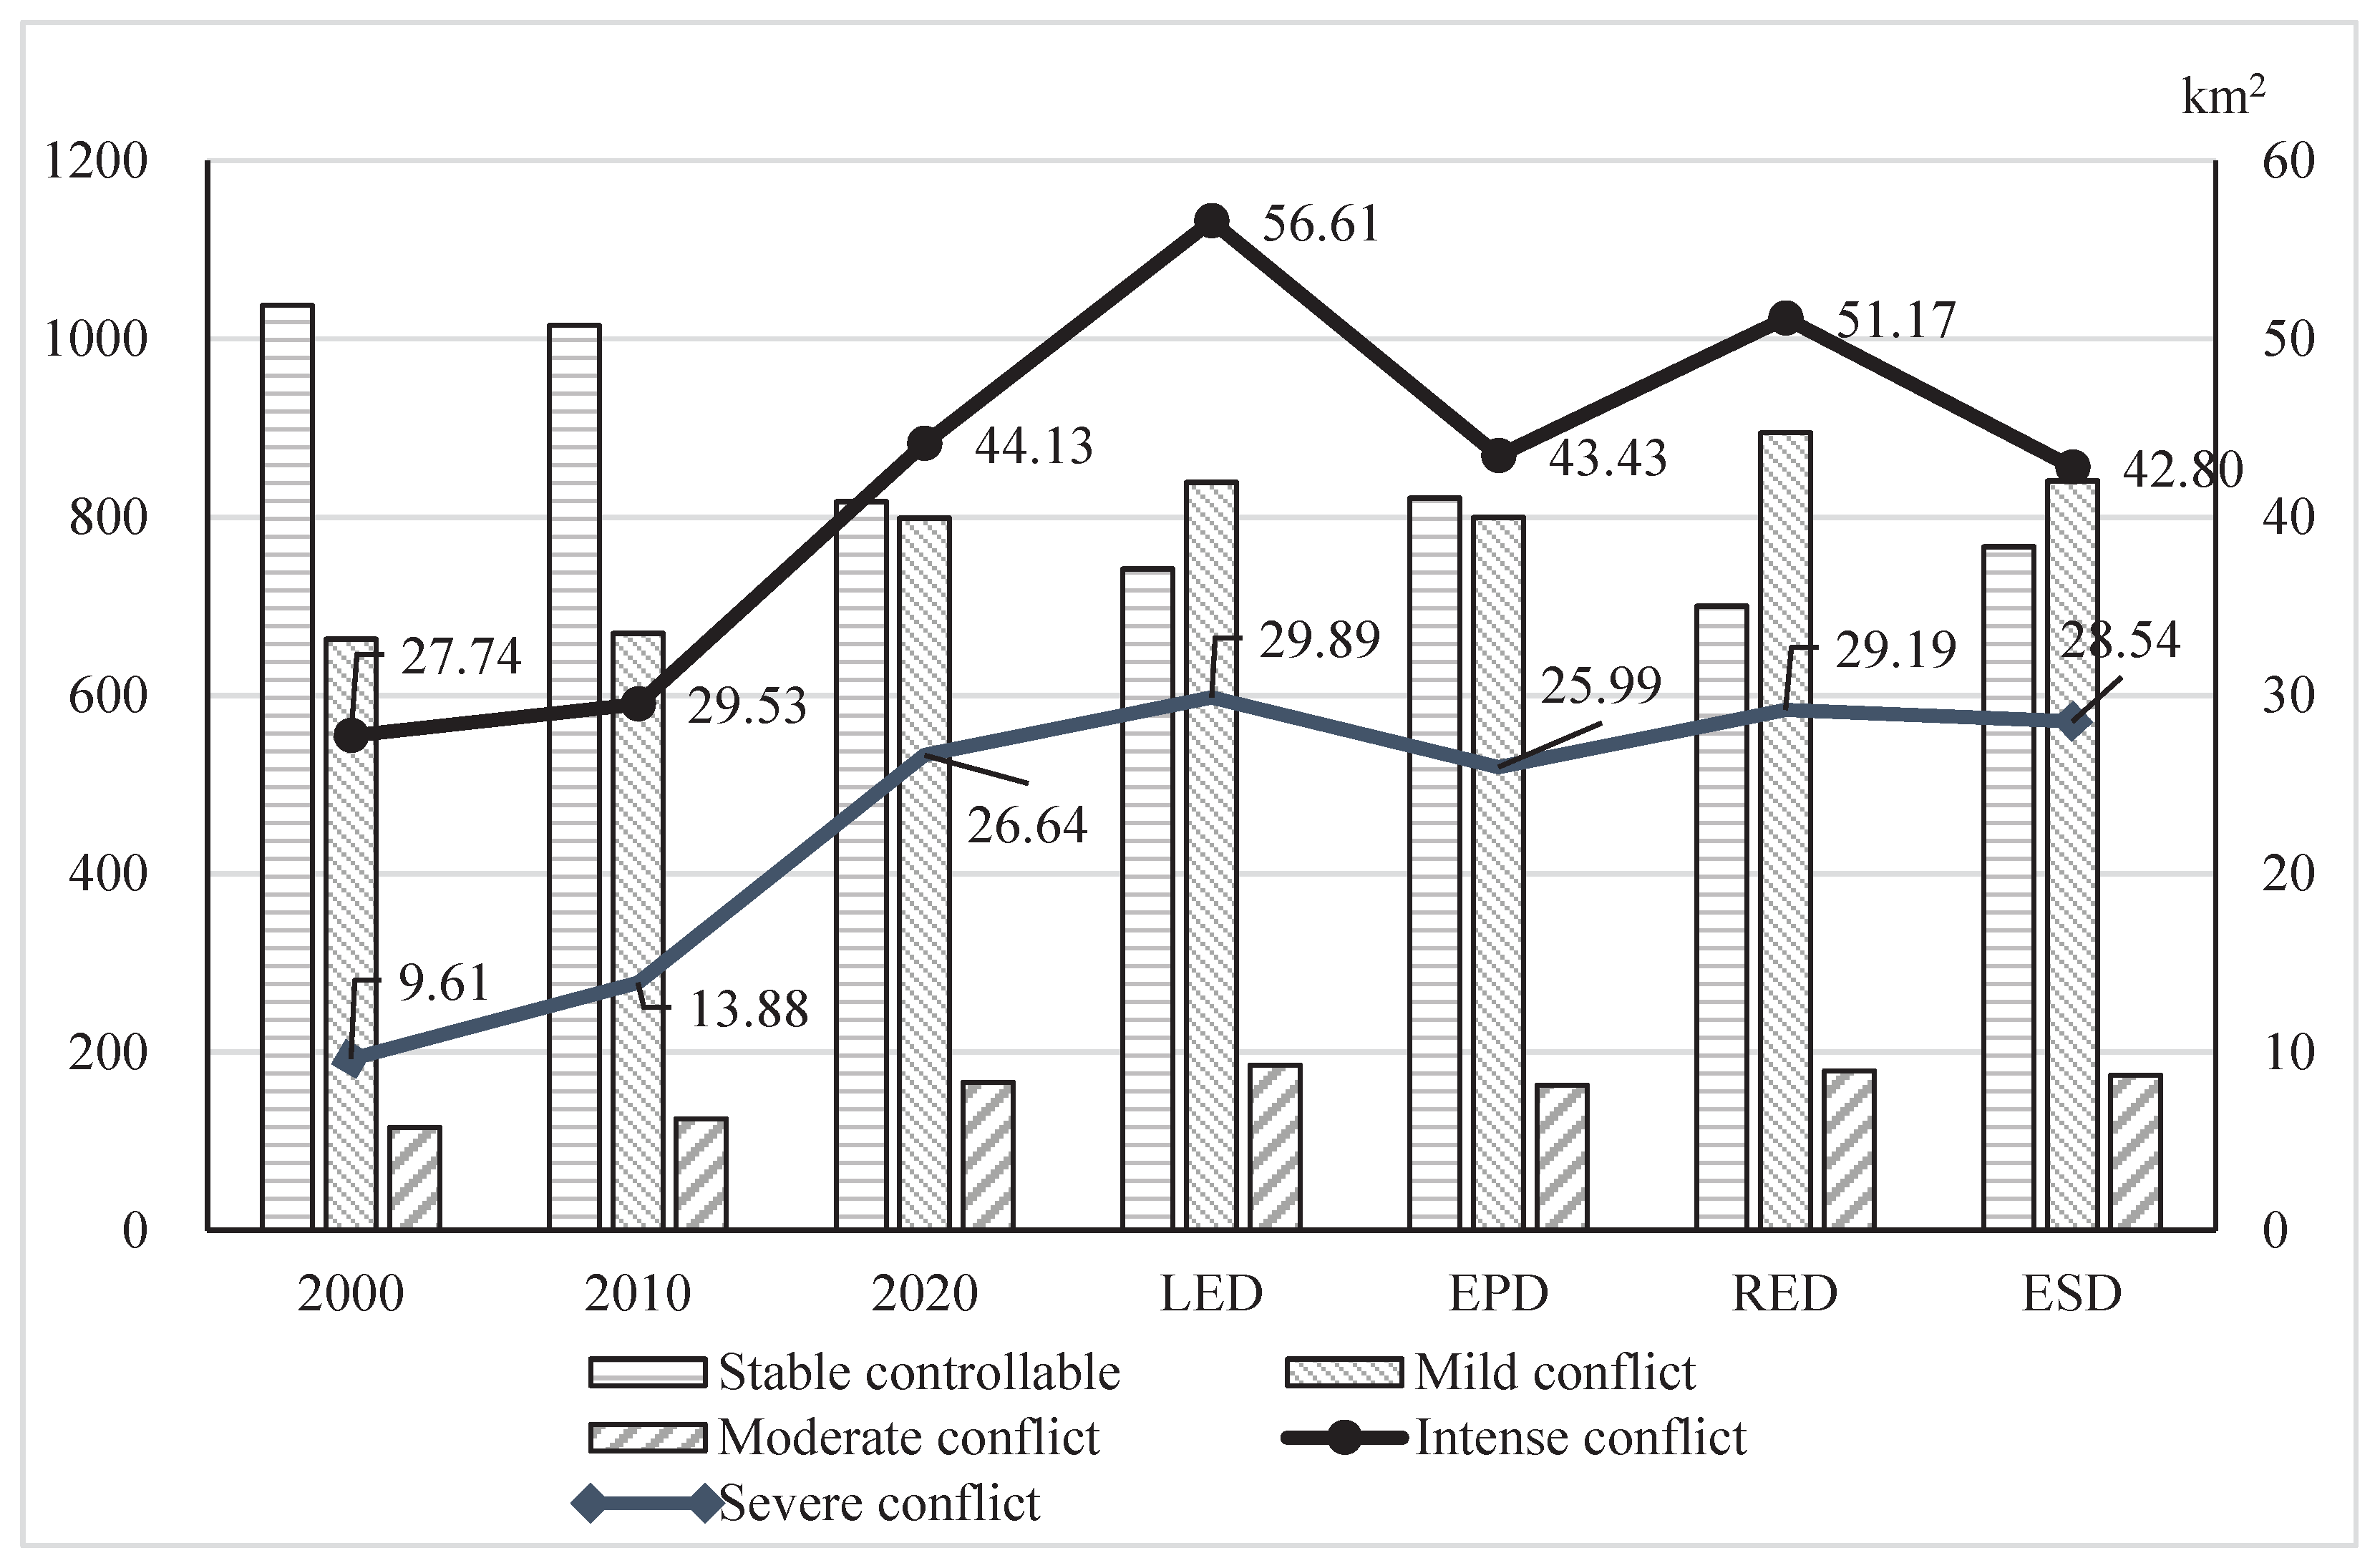
Figure 11.
Trends of spatial conflict intensity in multiple scenarios.
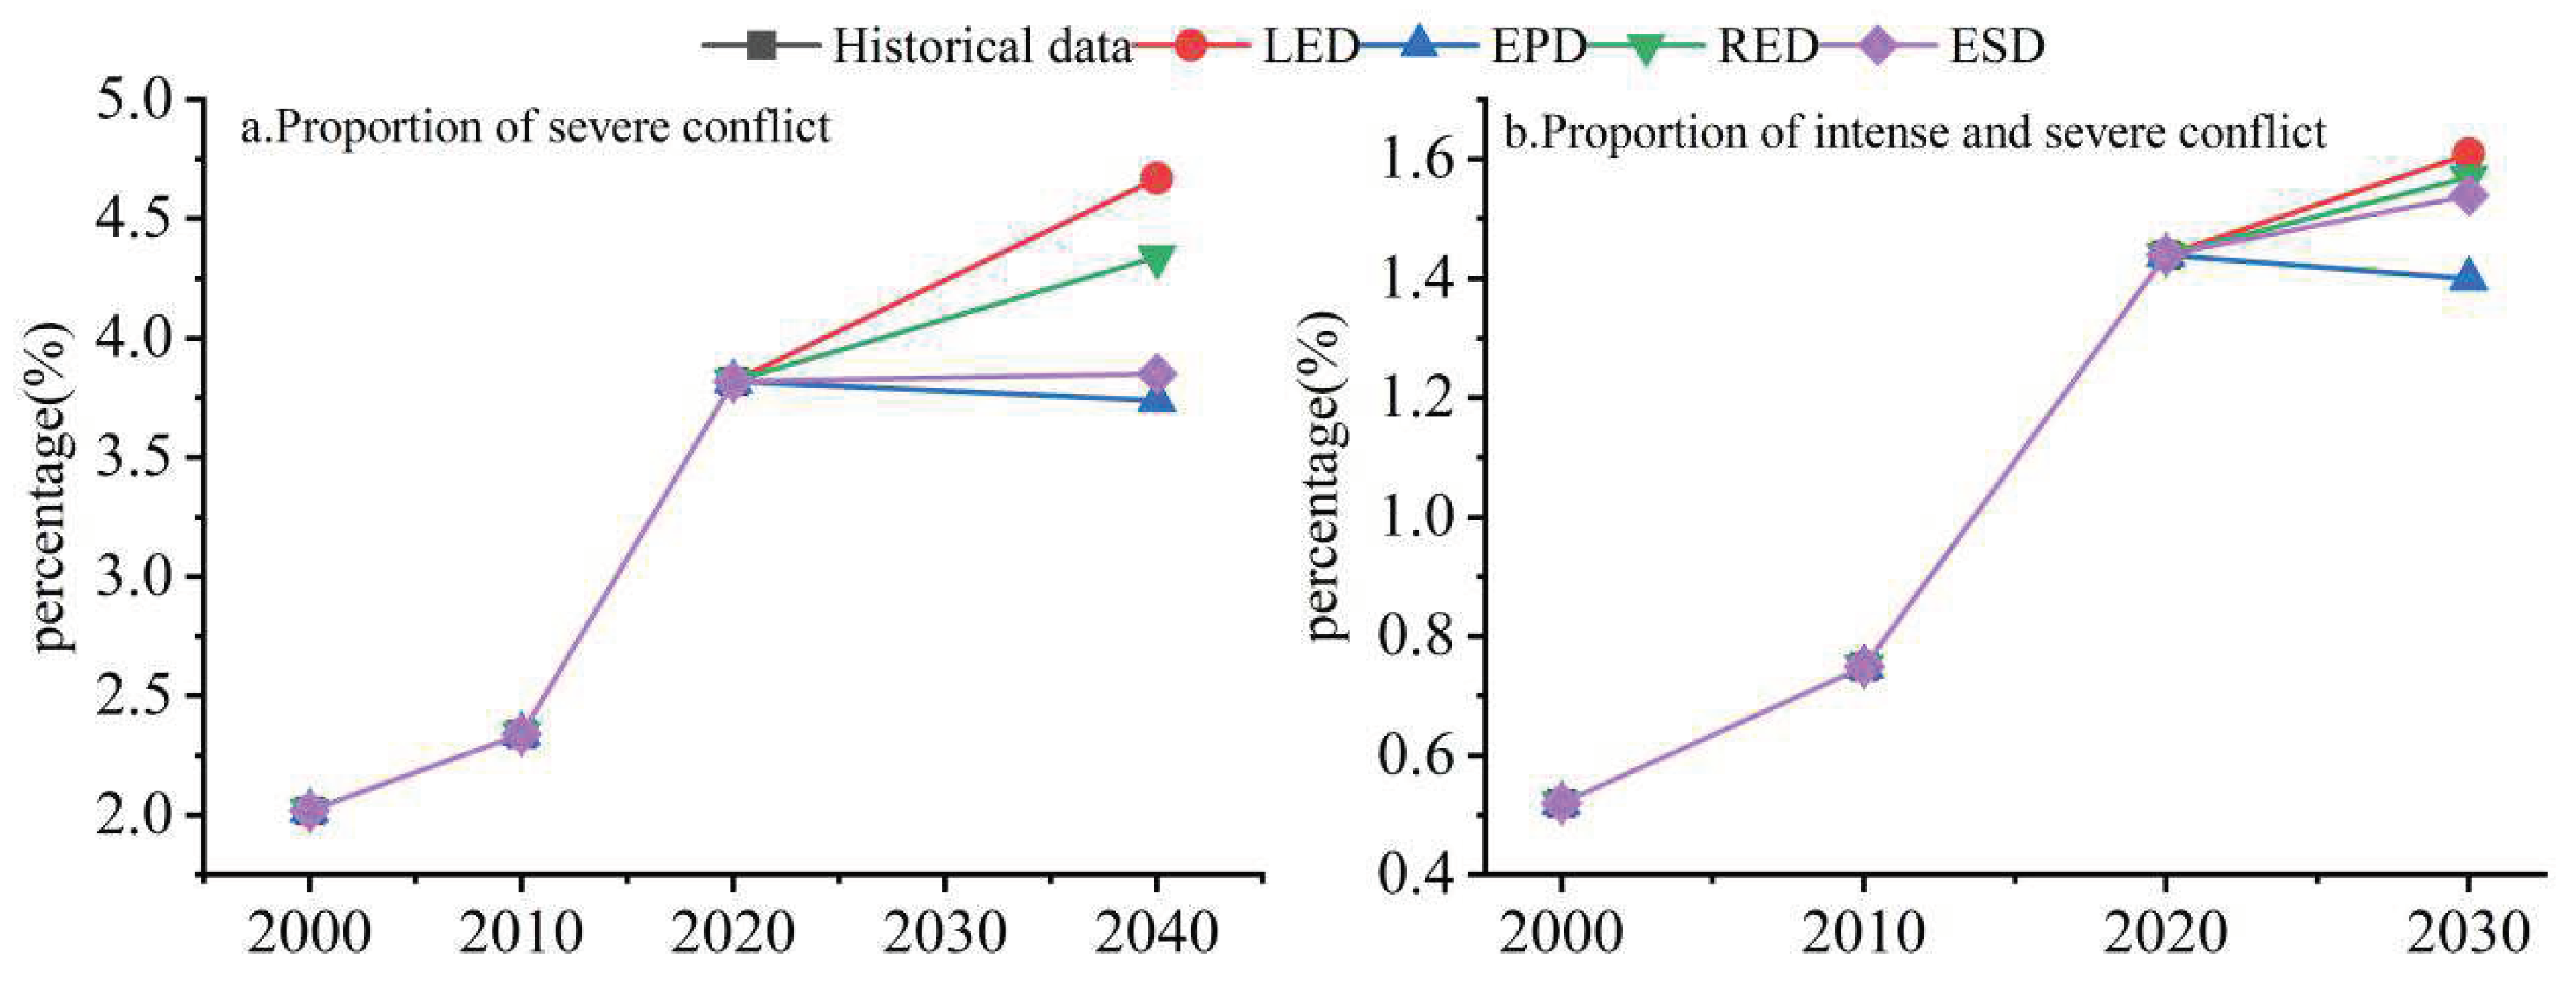
Table 1.
Data types and sources.
| Data Type | Data Description | Data Sources | |
|---|---|---|---|
| Land-use data | Land-use in 2000, 2010, and 2020 | Raster, 30 m×30 m | China’s land cover dynamic data sets from 1990 to 2021. (https://doi.org/10.5281/zenodo.5816591) |
| Natural environment data | Digital elevation model (DEM) | Geospatial Data Cloud (http:// www.gscloud.cn) | |
| Slope | |||
| Annual mean temperature | Raster, 1 km×1 km | Resource and Environment Science and Data Center of the Chinese Academy of Sciences (http://www.resdc.cn/) | |
| Mean annual precipitation | Raster, 1 km×1 km | ||
| Soil type | Raster, 1 km×1 km | ||
| Soil texture | Raster, 1 km×1 km | ||
| Location data | Distance from rivers | Vector | OpenStreetMap (https://www.openstreetmap.org/) |
| Distance from main roads | Vector | ||
| Distance from rural residential areas | Vector | ||
| Distance from the county center | Vector | ||
| Distance from hotels | Vector | ||
| Distance from the government | Vector | ||
| Socioeconomic data | Yield of grain, and grain price | — | Statistical yearbooks of county in the corresponding years in the Yimengshan Geopark, and National Agricultural Statistics on Agricultural Products’ Cost and Income 2020 |
| Population density, gross domestic product (GDP), night light | Raster, 1 km×1 km | Resource and Environment Science and Data Center of the Chinese Academy of Sciences (http://www.resdc.cn/) | |
| Policy constraints | Open water surface | Raster, 30 m×30 m | |
Table 2.
Land-use classification system of productional–living–ecological space (PLES).
| First Class | Secondary Class | Third Class | Forth Class |
|---|---|---|---|
| Productional space | Agricultural production space | Cultivated land | Paddy fields and dry fields |
| Living space | Industrial and mining productional-living space | Construction land | Industrial, mining, transportation, and other construction land |
| Urban living space | Urban land | ||
| Rural living space | Rural residential land | ||
| Ecological space | Green ecological space | Forest land, grassland, and unused land | Forest land, shrub land, sparse forest land, other forest land, high coverage grassland, medium coverage grassland, low coverage grassland, sandy land, saline alkali land, bare land, and bare rock gravel land |
| Water ecological space | Water body | Rivers, ditches, lakes, mudflat, beaches, marshes, reservoirs, and ponds |
Table 4.
Land-use spatial conflict change in different grades in the Yimengshan Geopark (YG), 2000, and 2020.
Table 4.
Land-use spatial conflict change in different grades in the Yimengshan Geopark (YG), 2000, and 2020.
| Conflict Grade | 2000 | 2020 | 2000-2020 | |||
|---|---|---|---|---|---|---|
| Area/km2 | Proportion/% | Area/km2 | Proportion/% | Area/km2 | Rate of Change/% | |
| Stable controllable | 1037.38 | 55.96 | 817.37 | 44.09 | −220.01 | −21.21 |
| Mild conflict | 663.37 | 35.79 | 799.03 | 43.10 | 135.65 | 20.45 |
| Moderate conflict | 115.62 | 6.24 | 166.55 | 8.98 | 50.94 | 44.06 |
| Intense conflict | 27.74 | 1.50 | 44.13 | 2.38 | 16.39 | 59.08 |
| Severe conflict | 9.61 | 0.52 | 26.64 | 1.44 | 17.03 | 177.21 |
Table 5.
The land-use structure in the Yimengshan Geopark under different scenarios in 2030.
| Scenario Type | Cultivated Land | Forest Land | Grassland | Water Body | Construction Land | Unused Land | ||||||
|---|---|---|---|---|---|---|---|---|---|---|---|---|
| Area/km2 | Proportion/% | Area/km2 | Proportion/% | Area/km2 | Proportion/% | Area/km2 | Proportion/% | Area/km2 | Proportion/% | Area/km2 | Proportion/% | |
| LED | 1229.62 | 66.33 | 312.93 | 16.88 | 64.87 | 3.50 | 47.98 | 2.59 | 198.28 | 10.70 | 0.037 | 0.002 |
| EPD | 1234.44 | 66.59 | 299.07 | 16.13 | 95.03 | 5.13 | 48.32 | 2.61 | 176.83 | 9.54 | 0.027 | 0.001 |
| RED | 1206.18 | 65.07 | 364.18 | 19.65 | 55.66 | 3.00 | 48.40 | 2.61 | 179.25 | 9.67 | 0.045 | 0.002 |
| ESD | 1211.37 | 65.35 | 322.12 | 17.38 | 96.94 | 5.23 | 45.36 | 2.45 | 177.91 | 9.60 | 0.024 | 0.001 |
Table 6.
The quantity situation of land-use spatial conflict in the Yimengshan Geopark under different scenarios in 2030.
Table 6.
The quantity situation of land-use spatial conflict in the Yimengshan Geopark under different scenarios in 2030.
| Scenario Type | Stable Controllable | Mild Conflict | Moderate Conflict | Intense Conflict | Severe Conflict | |||||
|---|---|---|---|---|---|---|---|---|---|---|
| Area/km2 | Proportion/% | Area/km2 | Proportion/% | Area/km2 | Proportion/% | Area/km2 | Proportion/% | Area/km2 | Proportion/% | |
| LED | 741.88 | 40.02 | 839.65 | 45.3 | 185.69 | 10.02 | 56.61 | 3.05 | 29.89 | 1.61 |
| EPD | 821.72 | 44.33 | 799.54 | 43.13 | 163.04 | 8.8 | 43.43 | 2.34 | 25.99 | 1.4 |
| RED | 700.35 | 37.78 | 894.32 | 48.24 | 178.69 | 9.64 | 51.17 | 2.76 | 29.19 | 1.57 |
| ESD | 767.26 | 41.39 | 840.86 | 45.36 | 174.26 | 9.4 | 42.80 | 2.31 | 28.54 | 1.54 |
Disclaimer/Publisher’s Note: The statements, opinions and data contained in all publications are solely those of the individual author(s) and contributor(s) and not of MDPI and/or the editor(s). MDPI and/or the editor(s) disclaim responsibility for any injury to people or property resulting from any ideas, methods, instructions or products referred to in the content. |
© 2023 by the authors. Licensee MDPI, Basel, Switzerland. This article is an open access article distributed under the terms and conditions of the Creative Commons Attribution (CC BY) license (http://creativecommons.org/licenses/by/4.0/).
Copyright: This open access article is published under a Creative Commons CC BY 4.0 license, which permit the free download, distribution, and reuse, provided that the author and preprint are cited in any reuse.


