1. Introduction
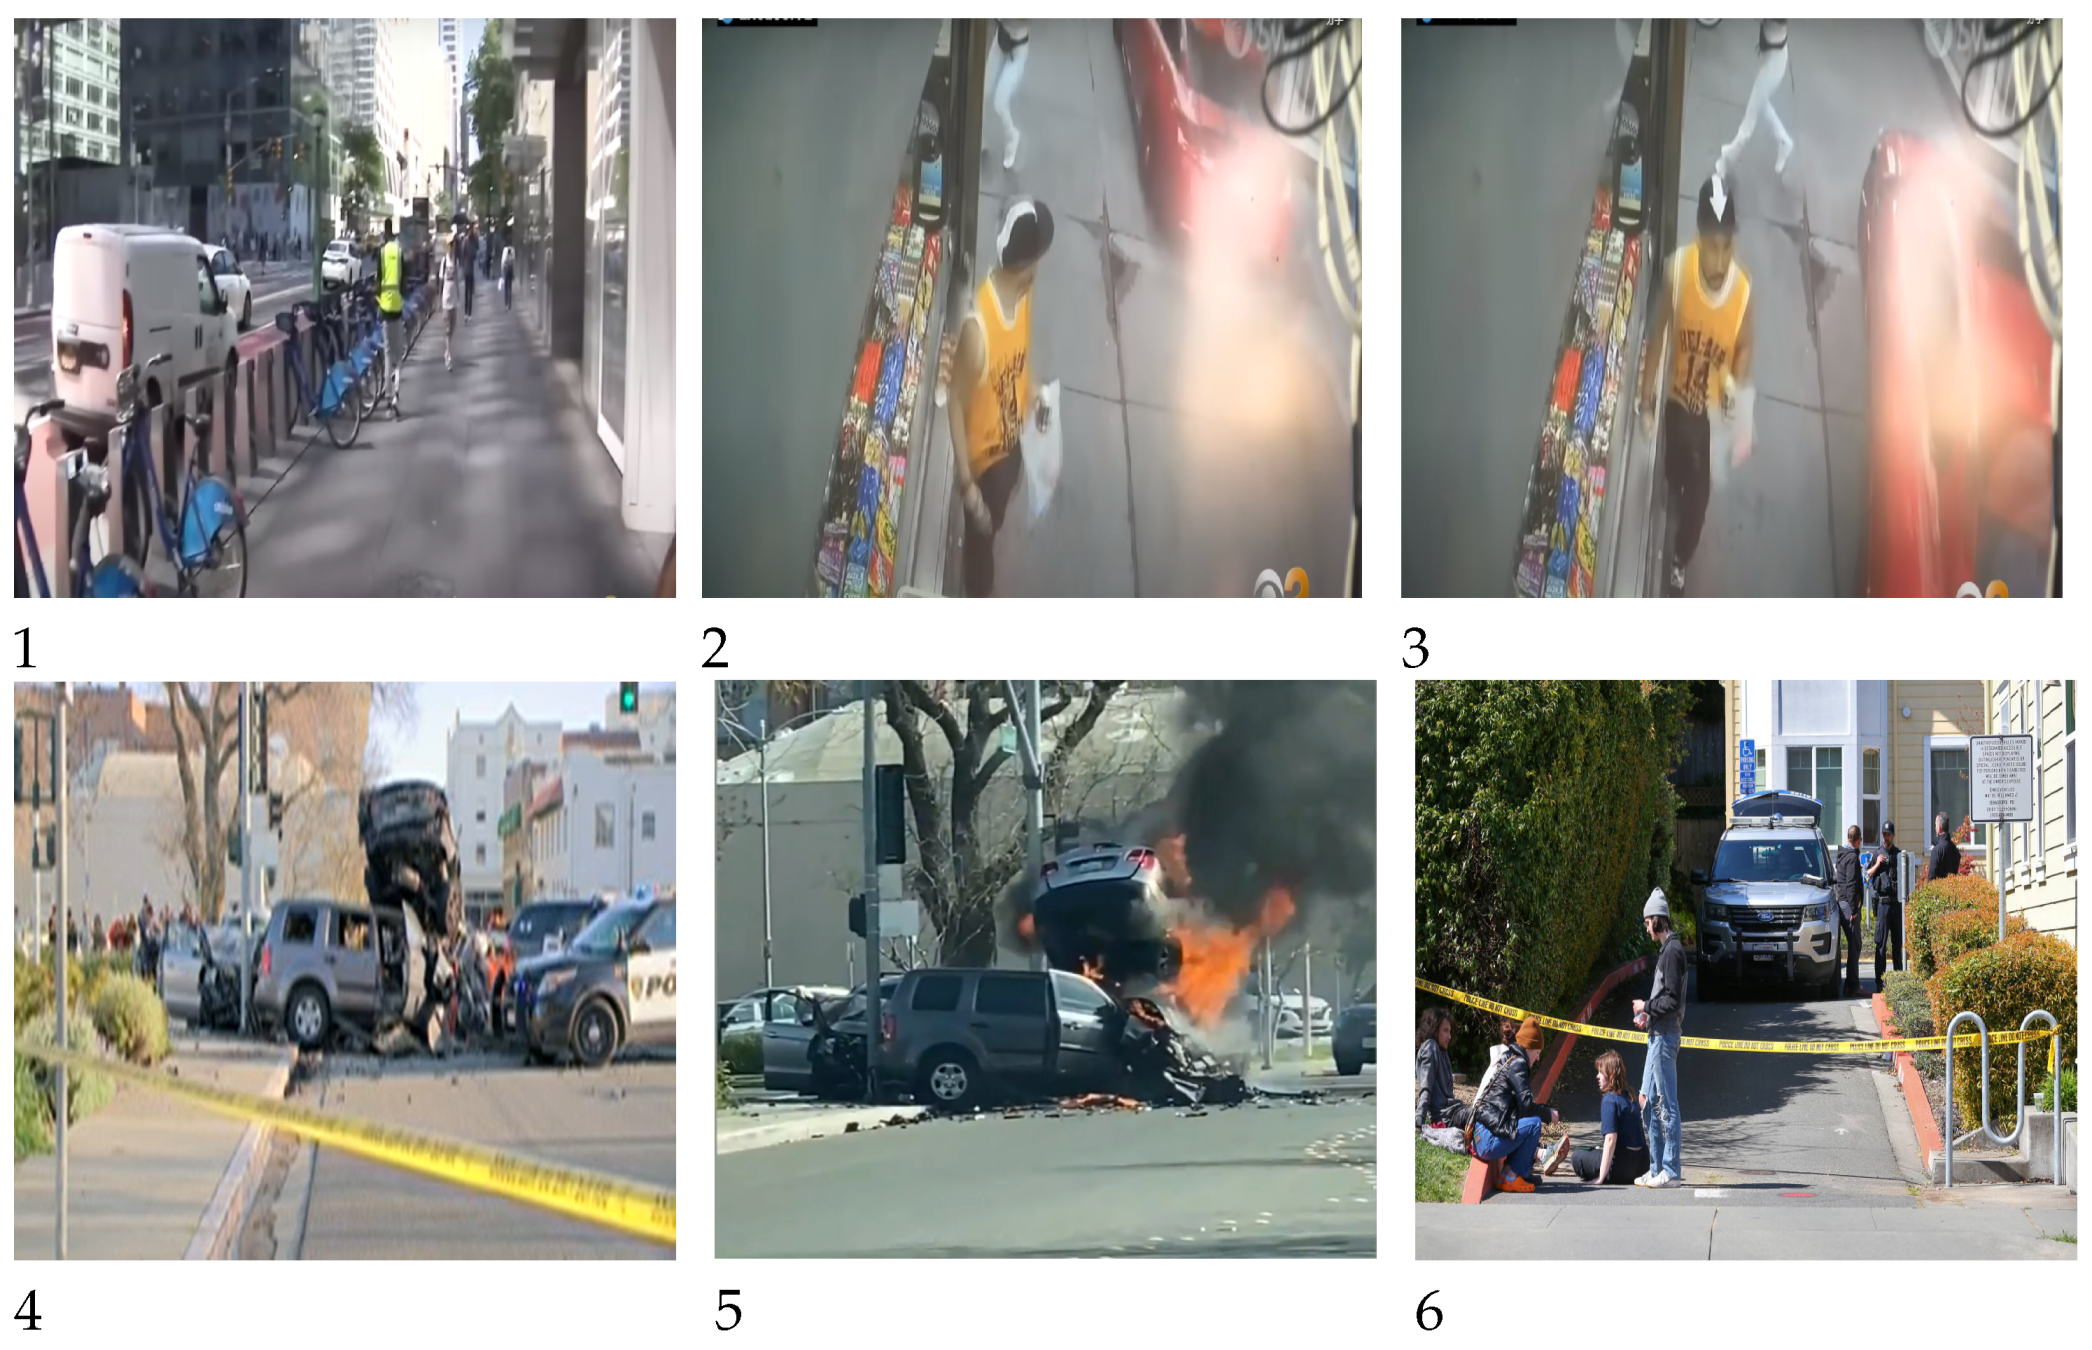
With the continuous population growth, human activities have become increasingly frequent, and increasing unusual emergencies have occurred, such as gathering and fleeing, fighting, and terrorist activities. Public security has become a major problem affecting social order. It is not uncommon to see news reports of modern transportation being maliciously used as a tool for committing crimes, such as deliberately driving a car onto a sidewalk with the intention of hitting pedestrians. According to FOX31 Denver, the suspect drove at high speed on the road, causing three victims to be injured, and there are also some other similar cases as shown in the
Figure 1. With the development of social security, surveillance videos have been gradually adopted in ensuring people’s safety in public places and for crime prevention [
1]. Artificial intelligence and big data technologies can further enhance the security capabilities of public places. For example, computer vision technology can be used to automatically recognize and analyze surveillance footage, quickly detect abnormal behavior, and issue warnings. Data mining techniques can be used to analyze historical crime data, grasp criminal patterns and trends, and provide scientific basis for security decision-making. Intelligent recommendation algorithms can be used to screen people entering and exiting public places, thus achieving the detection and control of suspicious individuals. The application of these technologies can improve the safety of public places, ensuring the personal and property security of citizens.
Along with the monitoring and control system is more and more huge, huge amounts of security video data more and more, and the abnormal event detection in video images and the analysis of the causes of accidents, such as business needs people to analysis and processing, the need to observe many workers for a long time without stopping the surveillance video, task workload is huge. Rely purely on people to observe the surveillance videos will lead to poor and false detection in the monitoring, which will reduce safety and the practicality of the entire security system, because people cannot maintain a high degree of concentration for a long time and require rest [
2]. Therefore, to enhance the monitoring ability of video surveillance, they should be made to emulate the human brain to recognize events and provide early warning and developed to become intelligent and reduce the occurrence of all kinds of public hazards. For this goal, a technology that can automatically analyze and find abnormal conditions from surveillance videos without relying heavily on manpower should be developed, that is, video automatic anomaly detection technology.
Video anomaly behavior detection and localization refers to automatically detecting and locating abnormal behavior by utilizing the difference between the representation of normal and abnormal behavior features. With the increasing demand for automated anomaly detection in various applications, many practical anomaly detection frameworks have been proposed. The GMM method has attracted great attention for background modeling techniques for detection and location in crowded scenes [
7,
8]. The GMM generates a model based on the Gaussian probability density function by calculating the intensity, mean, and variance parameters [
9]. Sabokrou et al. [
10] used the GMM model to detect and locate abnormal behaviors in crowded scenes. Leyva et al. [
11] combined the GMM model , Markov chains, and Bag-of-Words for video anomaly detection. Lu et al. [
12] merged the Markov random field and the GMM to detect abnormal behavior through the calculation of the confidence measure. Marsden et al. [
13] blended support vector machine (SVM) and the GMM to classify abnormal behaviors. Optical flow is an important feature that describes the motion patterns of visual features (such as points, objects, and shapes) through the continuous observation of the environment [
32]. Yuan et al. [
33] proposed an abnormal event detection method based on statistical hypothesis testing, which identifies abnormal events as events with high scores. In [
34], a new feature descriptor, that is, hybrid optical flow histogram, is proposed, using sparse reconstruction cost to detect abnormal behavior because sparse representation has high recognition rate and stability. Li et al. [
35] proposed a novel motion feature descriptor, that is, the histogram of maximal optical flow projection, to detect abnormal events in crowded scenes, using SVM to classify abnormal frames. As can be seen from the above elaboration, surveillance video anomaly detection efficiently detects abnormal events from many videos, and it usually consists of three parts: foreground extraction and motion target detection, feature extraction, classification and anomaly behavior detection, each of which is described in more detail below.
Traditional motion target detection algorithms mainly include background subtraction method, frame difference, edge detection, and optical flow methods. With the development of deep learning in the field of object detection, object detection networks have been widely used in foreground extraction and anomaly behavior detection. YOLACT (You Only Look At CoefficienTs) is an object detection technique based on instance segmentation, which can output both the position and mask information of objects. This method can be used for video anomaly detection because it can accurately segment and locate abnormal objects. Methods based on YOLOACT have achieved good results in video anomaly detection and have high practical value. Xu et al. [
3] proposed a real-time video anomaly detection method based on Region Proposal Network and YOLACT, which can efficiently detect abnormal behaviors in a scene. Object detection and instance segmentation are performed using YOLACT, and multi-level convolutional networks are used for feature extraction to achieve fast and accurate anomaly detection.
Feature extraction is crucial for anomaly behavior detection. The higher the discriminability of features between normal and abnormal behaviors, the higher the detection accuracy. Traditional hand-crafted features represent behavior using manually defined low-level visual features (e.g. LUV, Cascade Step Search, OP and HOG), such as using Histograms of Oriented Gradients (HOG) to represent human body shape and contour information in static images, using optical flow to describe the changes in pixel grayscale values between adjacent frames to represent motion information, and using trajectories to describe the trajectory of moving targets. Features extracted based on deep learning can automatically learn the distribution rules of data from massive datasets, extract more robust high-level semantic features, and are less sensitive to crowded scenes. Gradually, they have replaced traditional feature extraction techniques.
Anomaly detection techniques require training a classifier to detect behavior after extracting features. For a given specific scene with video data samples, the motion and appearance features of video frames or images within video windows are first extracted, and a model is built to learn the distribution of normal samples. During testing, the extracted features of the test sample are input into the model, and the model judges the sample as normal or abnormal anomaly score. Commonly used classifiers include SVM, Naive Bayes classifiers and decision tree.
Deep learning have shown remarkable potential in learning appearance representations from images. Methods based on deep learning are widely used in the field of computer vision, such as image detection and classification [
14,
15] and behavior detection [
16,
17,
18,
19,
20,
21,
22,
23]. Hu et al. [
24] used the deep learning network framework to calculate the number of individuals in a population extracted from a picture. Shao et al. [
25] presented the slicing CNN (S-CNN) for effectively extracting appearance and dynamic information in crowd video scenarios. Karen Simonyan and Andrew Zisserman [
26] proposed a method based on two independent recognition streams; the spatial stream extracts action recognition frames from still videos, while the temporal stream is trained to recognize actions from motion in the form of dense optical flow and then fuses them. Feichtenhofer et al. [
27] proposed a new spatio-temporal architecture for two-stream networks to spatially and temporally learn the correspondence between highly abstract deep features. Yi et al. [
28] proposed Behavior-CNN) to model pedestrian behaviors in crowded scenes. Luo et al. [
29] used the YOLOv3 target detection network to detect pedestrians holding sticks, guns, knives and facial shielding. The local resolution enhancement network (LDA-Net) proposed by Gong et al. [
30] took the foreground human body extracted by YOLO network as the input of 3DCNN, so as to extract the spatio-temporal characteristics of behaviors and classify normal and abnormal behaviors. Zou [
31] input the feature vector extracted from YOLO network into LSTM network. This structure of CNN and LSTM makes full use of the spatio-temporal fusion features of video, thus improving the recognition accuracy.
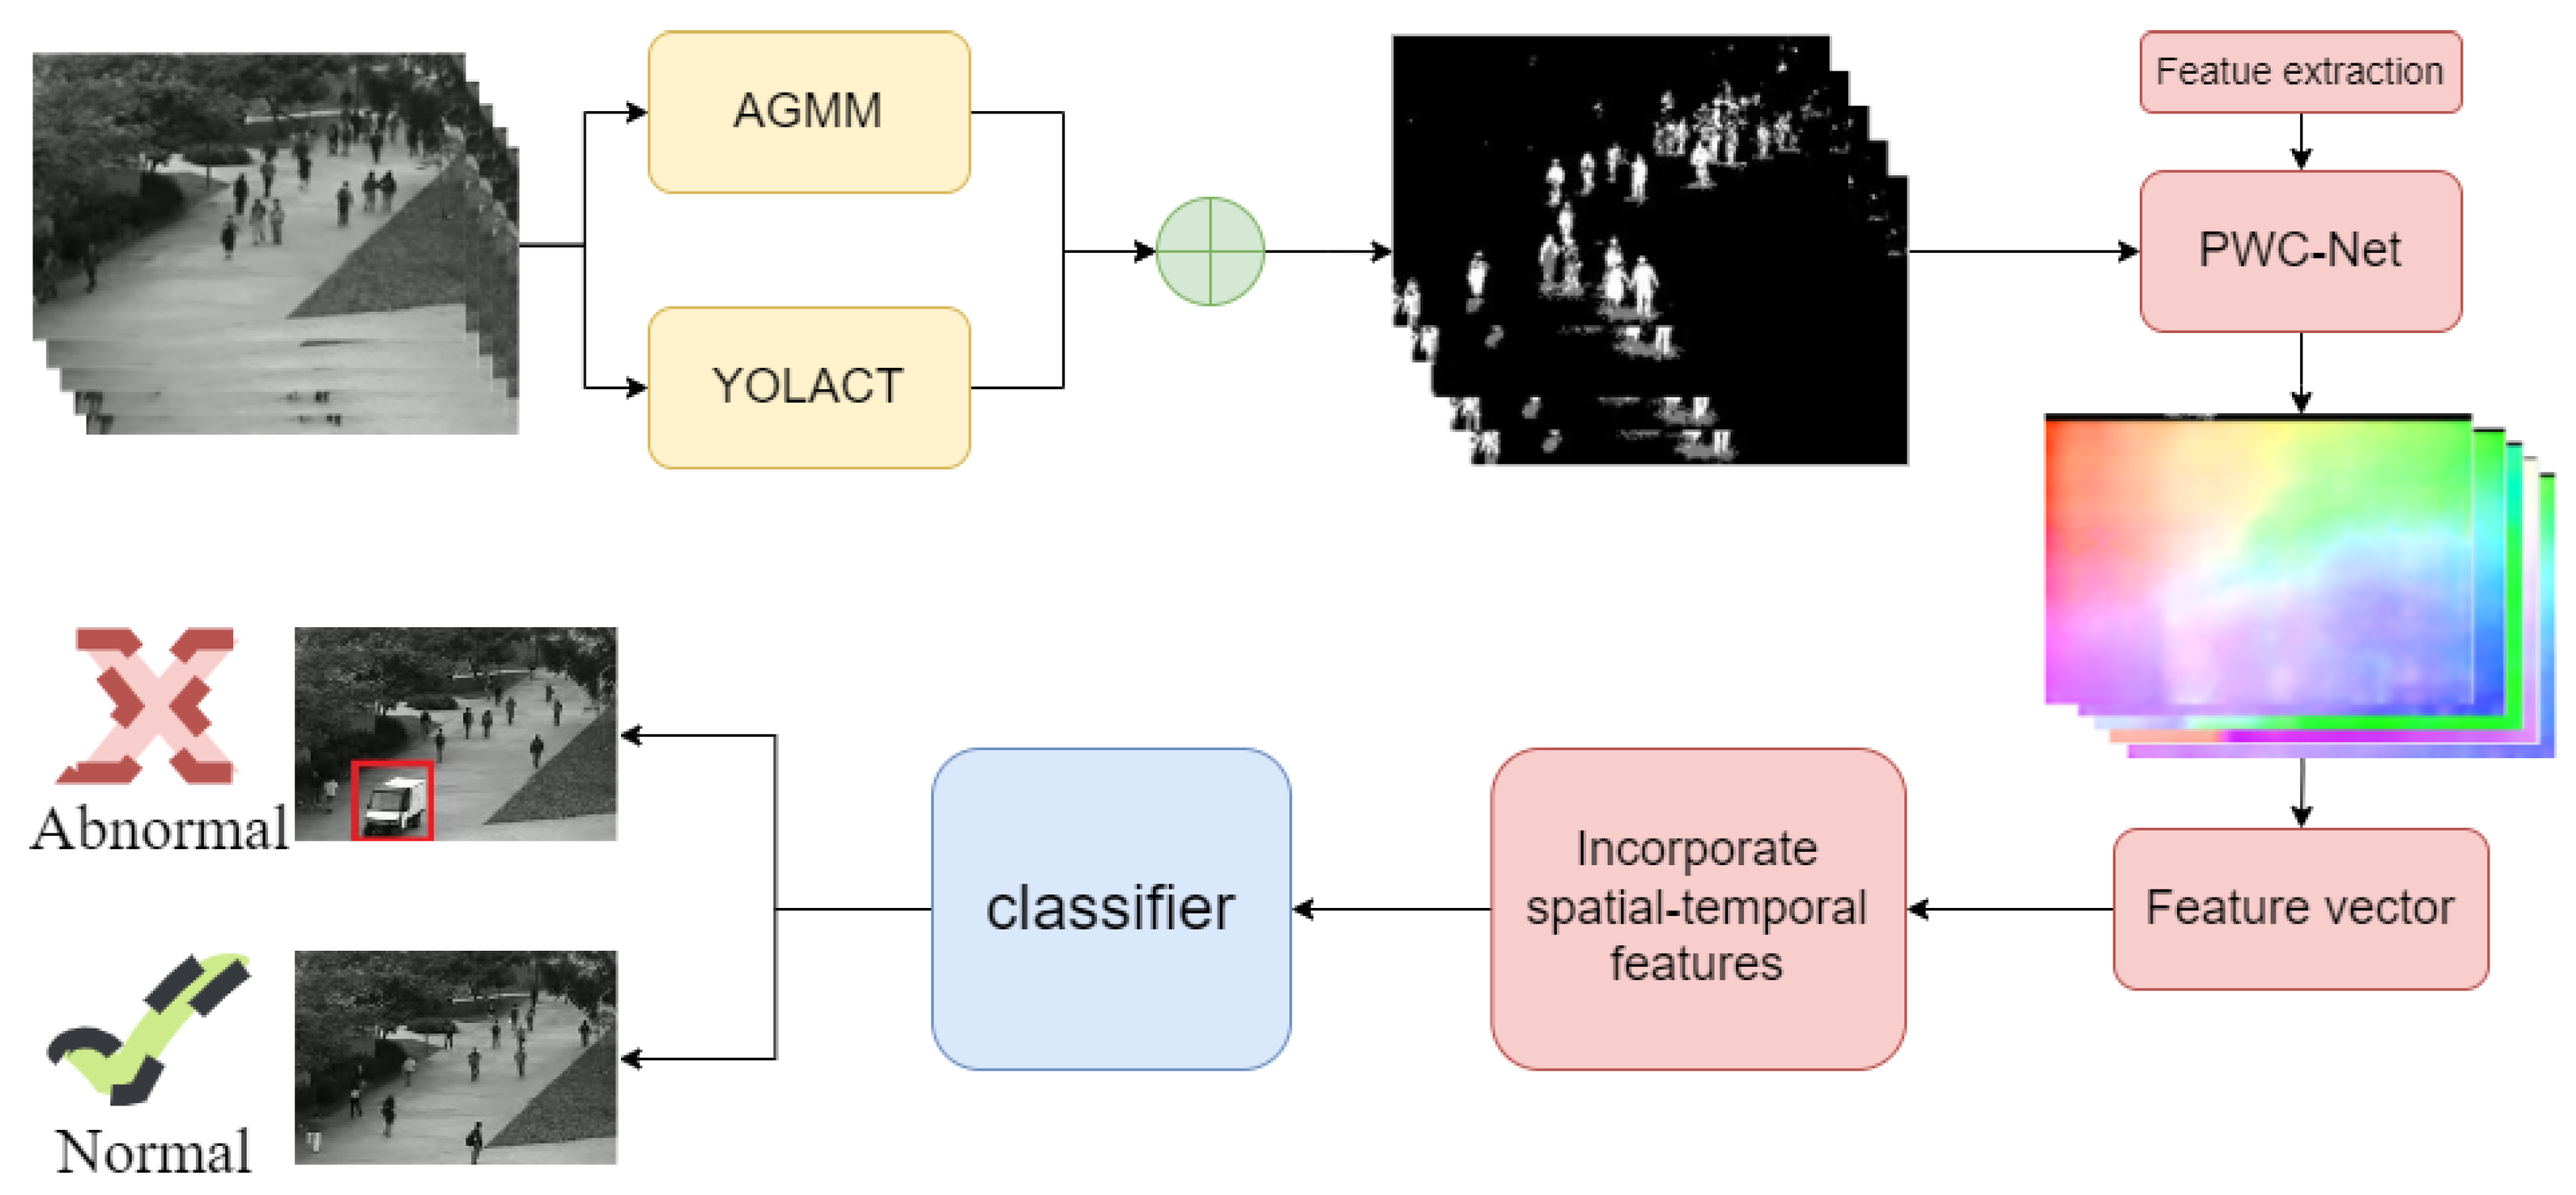
Given the success of deep neural network (DNN) in feature representation, the features extracted by a DNN represent the appearance and motion pattern in different scenes more specifically than the traditional anomaly detection approaches. The proposed hybrid method, which combines deep learning feature extraction with traditional foreground extraction and abnormal behavior detection, is effective in detecting and locating abnormal behaviors in crowded scenes. In this paper, we use the adaptive Gaussian mixture mode (AGMM) and to YOLOACT extract the foreground and the foreground masks as a preprocessing procedure of feature extraction. Then PWC-Net is applied to extract the motion information from the foreground map. Furthermore, we input the motion information to the classification network to output the anomaly score. Finally, this paper proposes a real-time object detection and tracking method using YOLOv5 and DeepSORT for surveillance videos. Specifically, after object detection is performed using YOLOv5, the results will contain the position and class information of each detected object. Then, these object information are fed into DeepSORT, which assigns a unique ID to each target and performs real-time tracking of the targets. In the subsequent video frames, DeepSORT can accurately predict the position of the targets by calculating their motion information and appearance features, achieving continuous tracking of the targets. The main contributions of this paper are as follows:
- *
This paper fine-tunes the YOLACT network and introduces a mask generation module to meet the requirements of the proposed method.
- *
This paper combines traditional methods with deep learning networks to extract foreground mask images from video frames, thereby enhancing the richness and accuracy of the foreground masks.
- *
In this paper, PWC-Net is used to extract foreground object features and these features are used to train the anomaly detection classifier, resulting in improved accuracy of anomaly detection classification.
- *
The method proposed in this paper consists of two stages. The first stage involves detecting and locating anomalies in video frames, while the second stage focuses on tracking the objects in the video frames to facilitate better understanding and analysis.
- *
This paper adopts a hybrid methods to detect and locate anomalous video frames. Specifically, we use deep features to construct the feature space instead of handcrafted features, and then use traditional machine learning methods to detect anomalies. By leveraging the strengths of these two approaches, we improve the performance of the method.
The remainder of this paper is organized as follows.
Section 2 reviews the related works on anomaly detection and localization.
Section 3 provides a detailed description of the proposed method. First, the framework of the proposed method is introduced. Then, the components of surveillance video anomaly detection are discussed.
Section 4 presents the experimental results and comparisons. Finally, the conclusion is presented in
Section 5.
3. Proposed Method
In this paper, we take into account the appearance and dynamics of video surveillance scenes, as well as their spatial and temporal characteristics. Furthermore, deep features have stronger descriptive abilities compared to handcrafted features. Thus, in our proposed hybrid method that combines traditional and deep learning methods, we use deep features to replace handcrafted features and employ traditional machine learning methods to detect anomalies.
Usually, anomalies refer to an individual’s activity that significantly deviates from its neighboring individuals in a densely crowded environment, or to a specific abnormal situation in the overall scene, while the activity of local individuals may be normal. Therefore, the identification of abnormal appearance and movement patterns is the key problem of anomaly detection. Supervised-learning-based feature extraction methods have been successful in other tasks. The proposed supervised method involves judging video abnormal behavior based on video frame features and classifiers to model normal and abnormal patterns, which includes the scene background, appearance, and motion of normal and abnormal activities. The flowchart of the proposed detection method is presented in
Figure 2.
3.1. Object Detection
Traditional handcrafted features based on manually defined low-level visual features cannot represent complex behaviors and the extracted features are relatively simple, resulting in weak generalization ability. On the other hand, deep learning-based feature extraction can automatically learn the distribution rules of massive datasets and extract more robust high-level semantic features to better represent complex behaviors. However, low-level features often have some advantages that high-level features do not have, such as invariance under lighting changes, strong interpretability, and the ability to provide basic spatial, temporal, and frequency information. Therefore, this paper proposes to combine traditional background subtraction methods and the YOLACT network to detect and segment foreground images in video frames. Specifically, combining AGMM (Adaptive Gaussian Mixture Model) and YOLACT for video frame object extraction can enhance the accuracy and efficiency of the process. AGMM is a background subtraction method that models the background by a mixture of Gaussian distributions, and it adapts to the scene changes by adjusting the parameters of the distributions. AGMM can handle different types of scenes and achieve good results in complex environments with moving backgrounds. YOLACT, on the other hand, is a deep learning-based object detection and instance segmentation technique that combines target detection and instance segmentation using interactive convolutional networks (Interact Convolutional Networks) and can accurately detect and segment objects in real-time. By combining AGMM and YOLACT, we can effectively extract the background and foreground, which can not only use traditional methods to extract low-level features but also use deep learning to extract high-level semantic features, thus improving the accuracy and robustness of video anomaly detection. This method can effectively handle complex scenes and achieve better results than using only one method.
Overall, the combination of AGMM and YOLACT can provide a more robust and accurate solution for video frame object extraction. The specific implementation is as follows:
1. The YOLACT technique was used for object detection and instance segmentation to obtain the foreground map .
YOLACT is a real-time object detection and instance segmentation technique based on deep learning techniques. Its main principle is to combine object detection and instance segmentation together by using Interact Convolutional Networks. Specifically, YOLACT uses a loss function called Mask-IoU loss, which optimizes the performance of both object detection and instance segmentation. The Mask-IoU loss measures the model’s performance using the Intersection over Union (IoU) metric, combining the results of object detection and instance segmentation and minimizing the difference between them. Additionally, YOLACT also uses a Feature Pyramid Network to process feature maps of different scales, improving the model’s detection and segmentation capabilities for objects of different sizes. In summary, YOLACT achieves efficient object detection and instance segmentation by combining object detection and instance segmentation, using Mask-IoU loss and Feature Pyramid Network, among other techniques. The result of the YOLACT is shown in
Figure 3.
From
Figure 3, it can be seen that YOLACT generates foreground images, while what we need is a foreground mask similar to AGMM. By having a similar data type distribution for the foreground masks generated by YOLACT and AGMM, it is easier to fuse them together. Therefore, this paper proposes an improvement to the YOLACT network by adding a mask generation module. The YOLACT foreground map is a gray image where each pixel has a single value indicating whether the pixel belongs to the foreground object or not. In the YOLACT technique, a set of feature maps are obtained by performing convolution and feature extraction on the input image, and then a Mask Head network is used to process each feature map to obtain the corresponding foreground mask, which is the YOLACT foreground map. During the process of generating the foreground mask, each pixel is thresholded to classify it as foreground or background. Let the input image be
I, the feature map extracted by the YOLACT model, and the foreground mask be
M. For each position
in the feature map, the generation of the foreground mask can be expressed by the following formula:
Here,
represents the foreground probability of the pixel corresponding to the position
in the feature map, and
H is a preset threshold. Specifically, for each position
in the feature map, we can calculate its foreground probability
using the Mask Head network:
Here,
w is the parameter of the Mask Head network,
represents the feature vector corresponding to the position
in the feature map, and
represents the sigmoid function. Finally, by setting the threshold
H, we can convert the foreground probability
into a gray foreground mask value
, thereby obtaining the YOLACT foreground map, the outcome of improved YOLACT is presented in
Figure 3.
In this paper, the YOLACT network architecture is used for foreground extraction from video frames. The model is trained on the COCO dataset for 800,000 epochs with a 54-layer convolutional neural network.
2. AGMM is used to process the video frame and get the foreground map
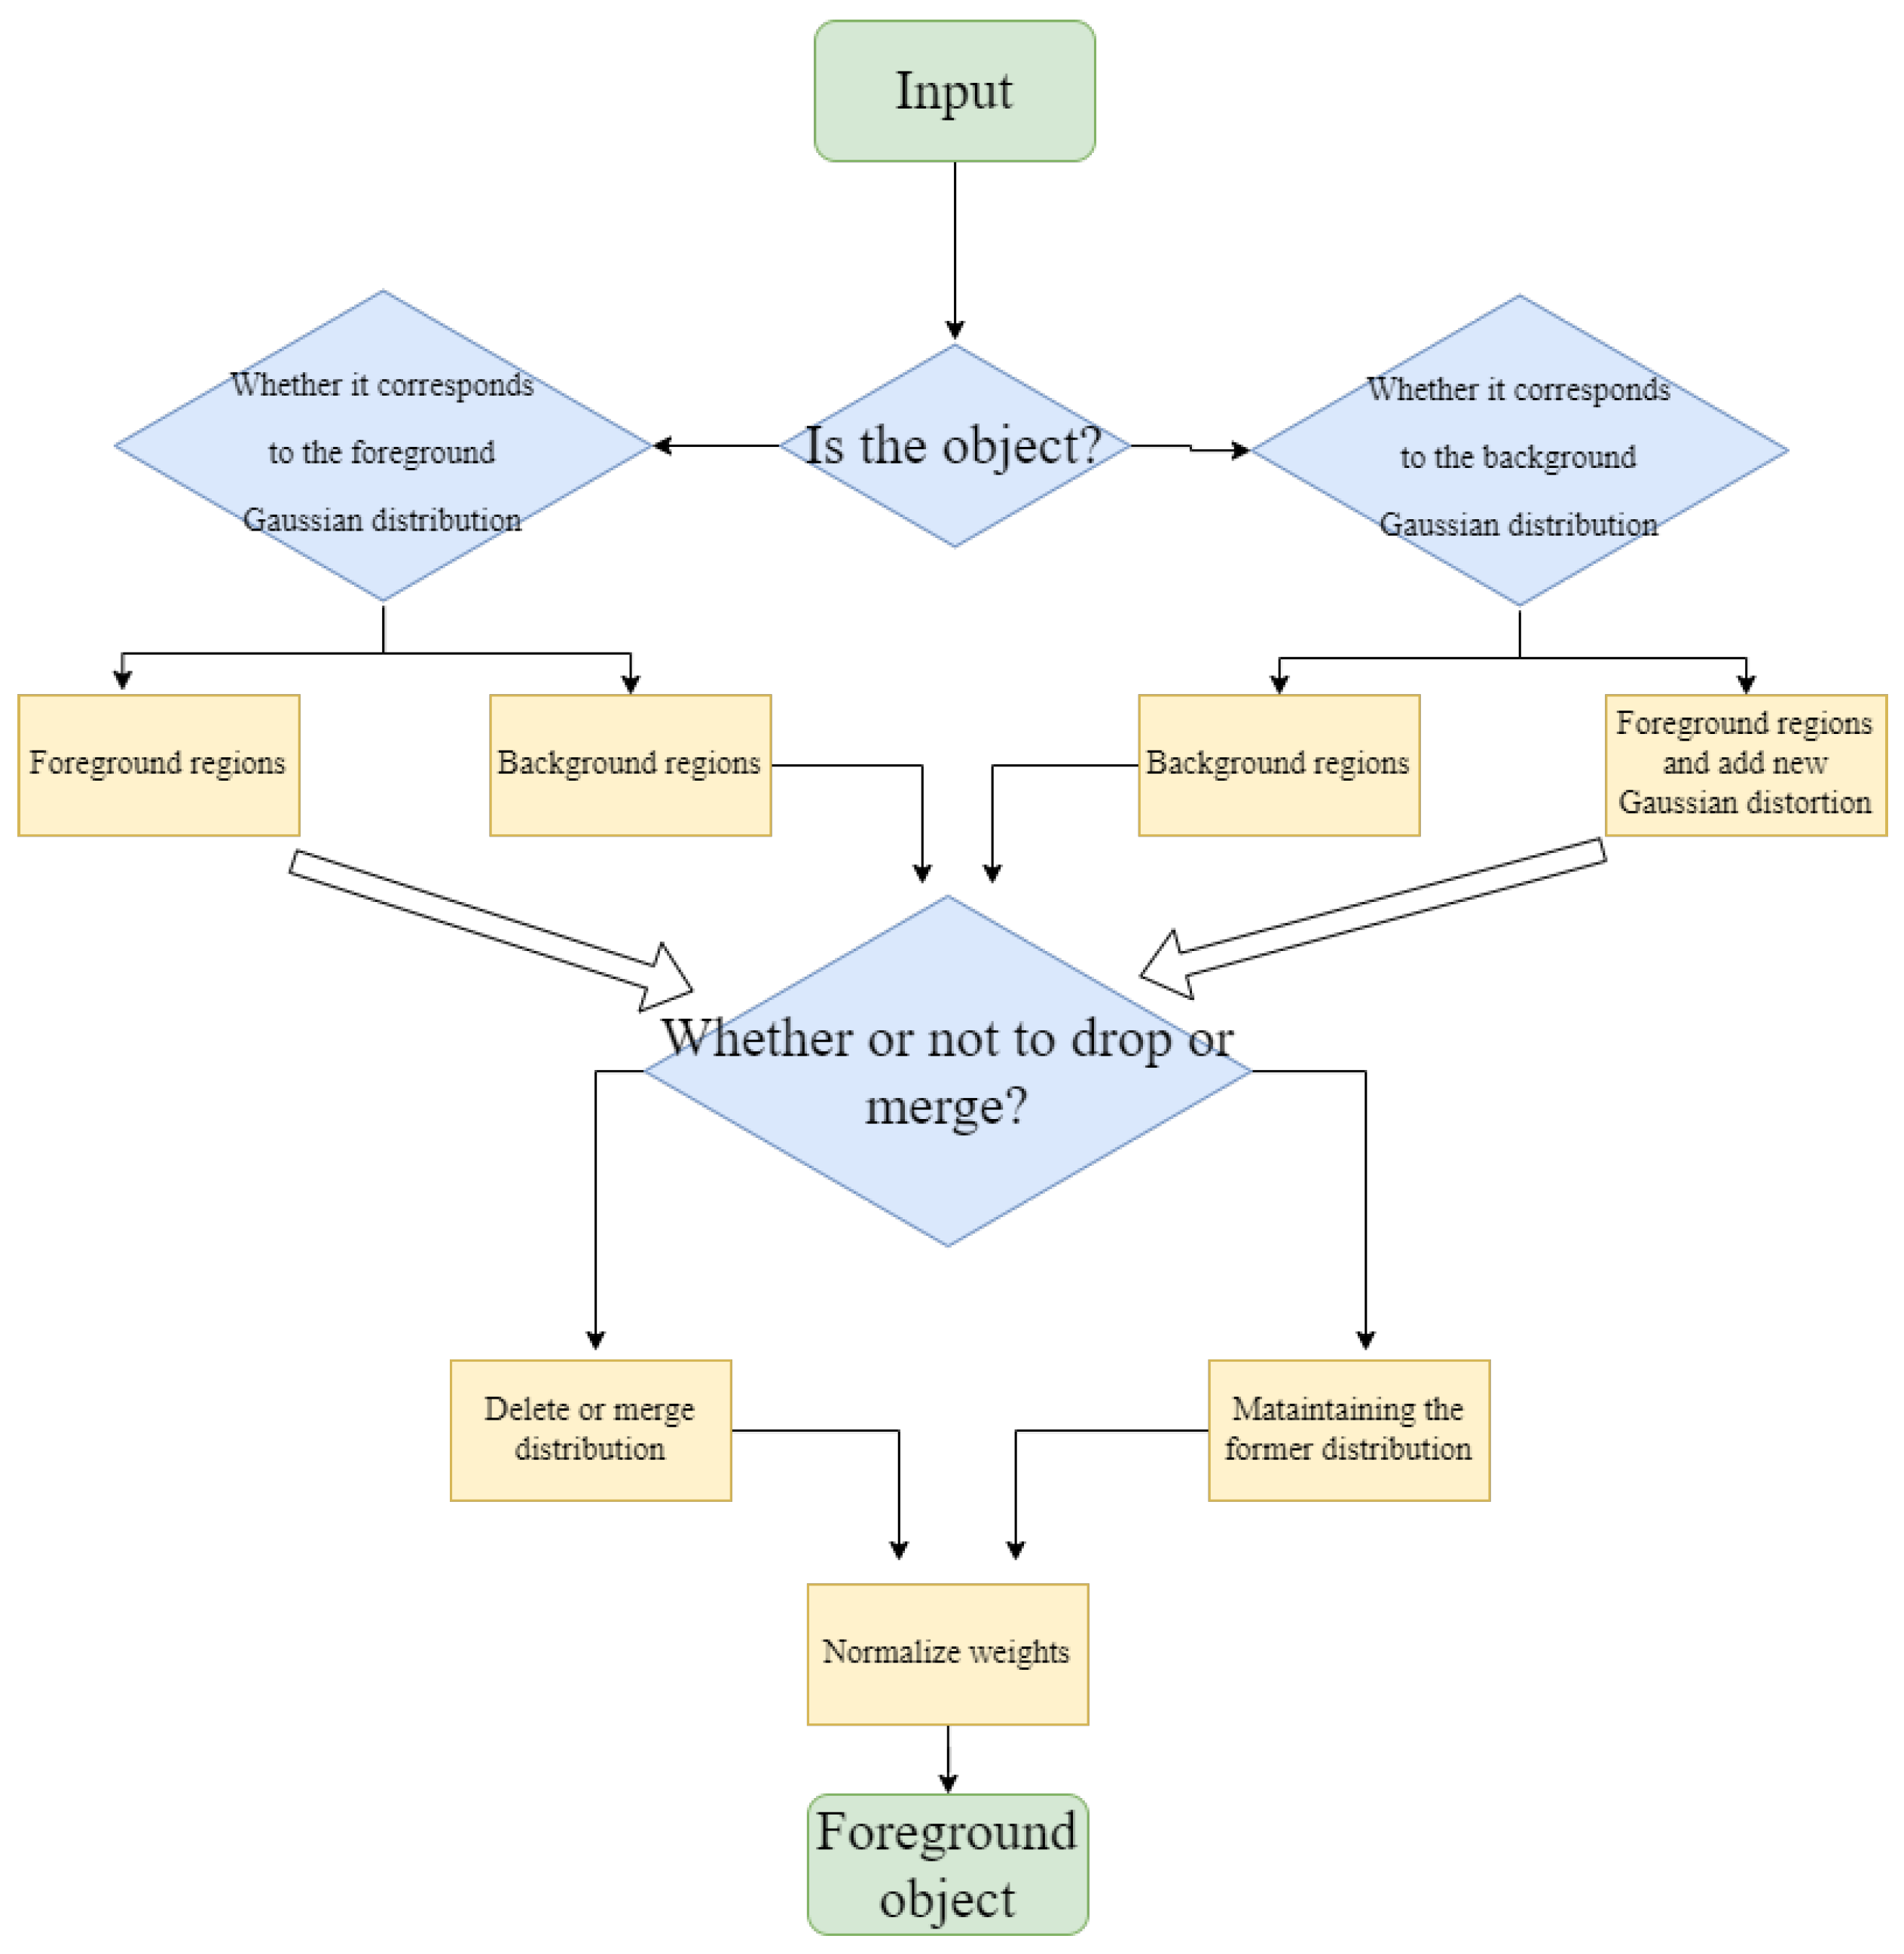
, the foreground mask extraction process using AGMM is illustrated in
Figure 4.
Background subtraction is one of the main components of surveillance video behavior detection and used as the preprocessing of object classification in this paper. The background subtraction method based on AGMM [
55], which has a good antijamming capability, especially the illumination change, is adopted. Thus, we select the AGMM background subtraction scheme to extract foreground images. A suitable time period
T, and time
t are assumed.
represents a sample,
=(
,
, ... ,
). For each new data sample, we both update the model
and re-estimate the density
. These samples may contain values for the background (BG) and foreground (FG) objects, thus the density estimation
. The Gaussian mixture model with
K components is expressed as follows:
Here
represents non-negative estimated mixing weights, and the
GMM is normalized at time
t.
and
are the estimated mean value and variances of the Gaussain components, respectively.
M is an identity matrix. Given a new data sample
at time
t, the recursive update equations are as follows:
Here
,
is the learning rate and the value of
is set. For a new sample, the ownership
is set to 1 for the "close" component with the largest
and the others are set to zero. We define that a sample belongs to a component if its Mahalanobis distance from the component is less than a certain threshold, and the squared distance from the
component is calculated as follows:
In turn, the algorithm will generate a new component
,
and
, here
is a initial value. This method shortens the processing time and improves the segmentation while providing highly specific image features for the next step of object detection. AGMM (Adaptive Gaussian Mixture Model) is a foreground extraction method based on Gaussian mixture model.
For each pixel at location
, calculate the Mahalanobis distance
between the pixel’s color and the mean color of each Gaussian component in the mixture model:
where
is the pixel,
is the mean color of the
Gaussian component, and
is the standard deviation of the
Gaussian component. Then, the pixel is classified as foreground if the minimum Mahalanobis distance is smaller than a threshold:
where
is the threshold. Otherwise, the pixel is classified as background.
After initializing the model parameters, for each frame of the image, the foreground probability of each pixel is first calculated based on the current model parameters, and then the foreground and background pixels are segmented according to a threshold to obtain the foreground map. The foreground mask is detected clearly for the UCSD ped1 [
56] benchmark dataset using AGMM.
3. For the fusion of two foreground graphs, weighted average can be adopted, as shown in the formula. The weight of the YOLACT foreground can be set to a larger value and the weight of the background subtracting foreground can be set to a smaller value to preserve the details of the YOLACT foreground.
where
,
, and
is the fused foreground map.
4. Finally, YOLACT technique can be used again for target detection and instance segmentation for the fused foreground, so as to further improve the accuracy and robustness of target detection and segmentation.
3.2. Feature Learning
After extracting the foreground masks from the video frames, the next step is to perform feature extraction on the foreground images. These features will be used to classify the frames as either normal or abnormal, providing valuable information for anomaly detection analysis. In video anomaly detection, the efficient detection of appropriate features plays an important role in the rapid and accurate identification of normal and abnormal behaviors. Feature extraction can performed in two ways. One is to manually extract features, and the other is to learn the original video frames to obtain deep features. Manual feature extraction methods, despite having numerous theoretical justifications, are often influenced by human factors and may not objectively represent behavior. Moreover, features extracted through this method often depend on the database, meaning that manually designed features may only perform well for certain databases and may not yield the same results for others. Traditional video behavior detection technology has low accuracy, and shallow learning cannot parse big data.
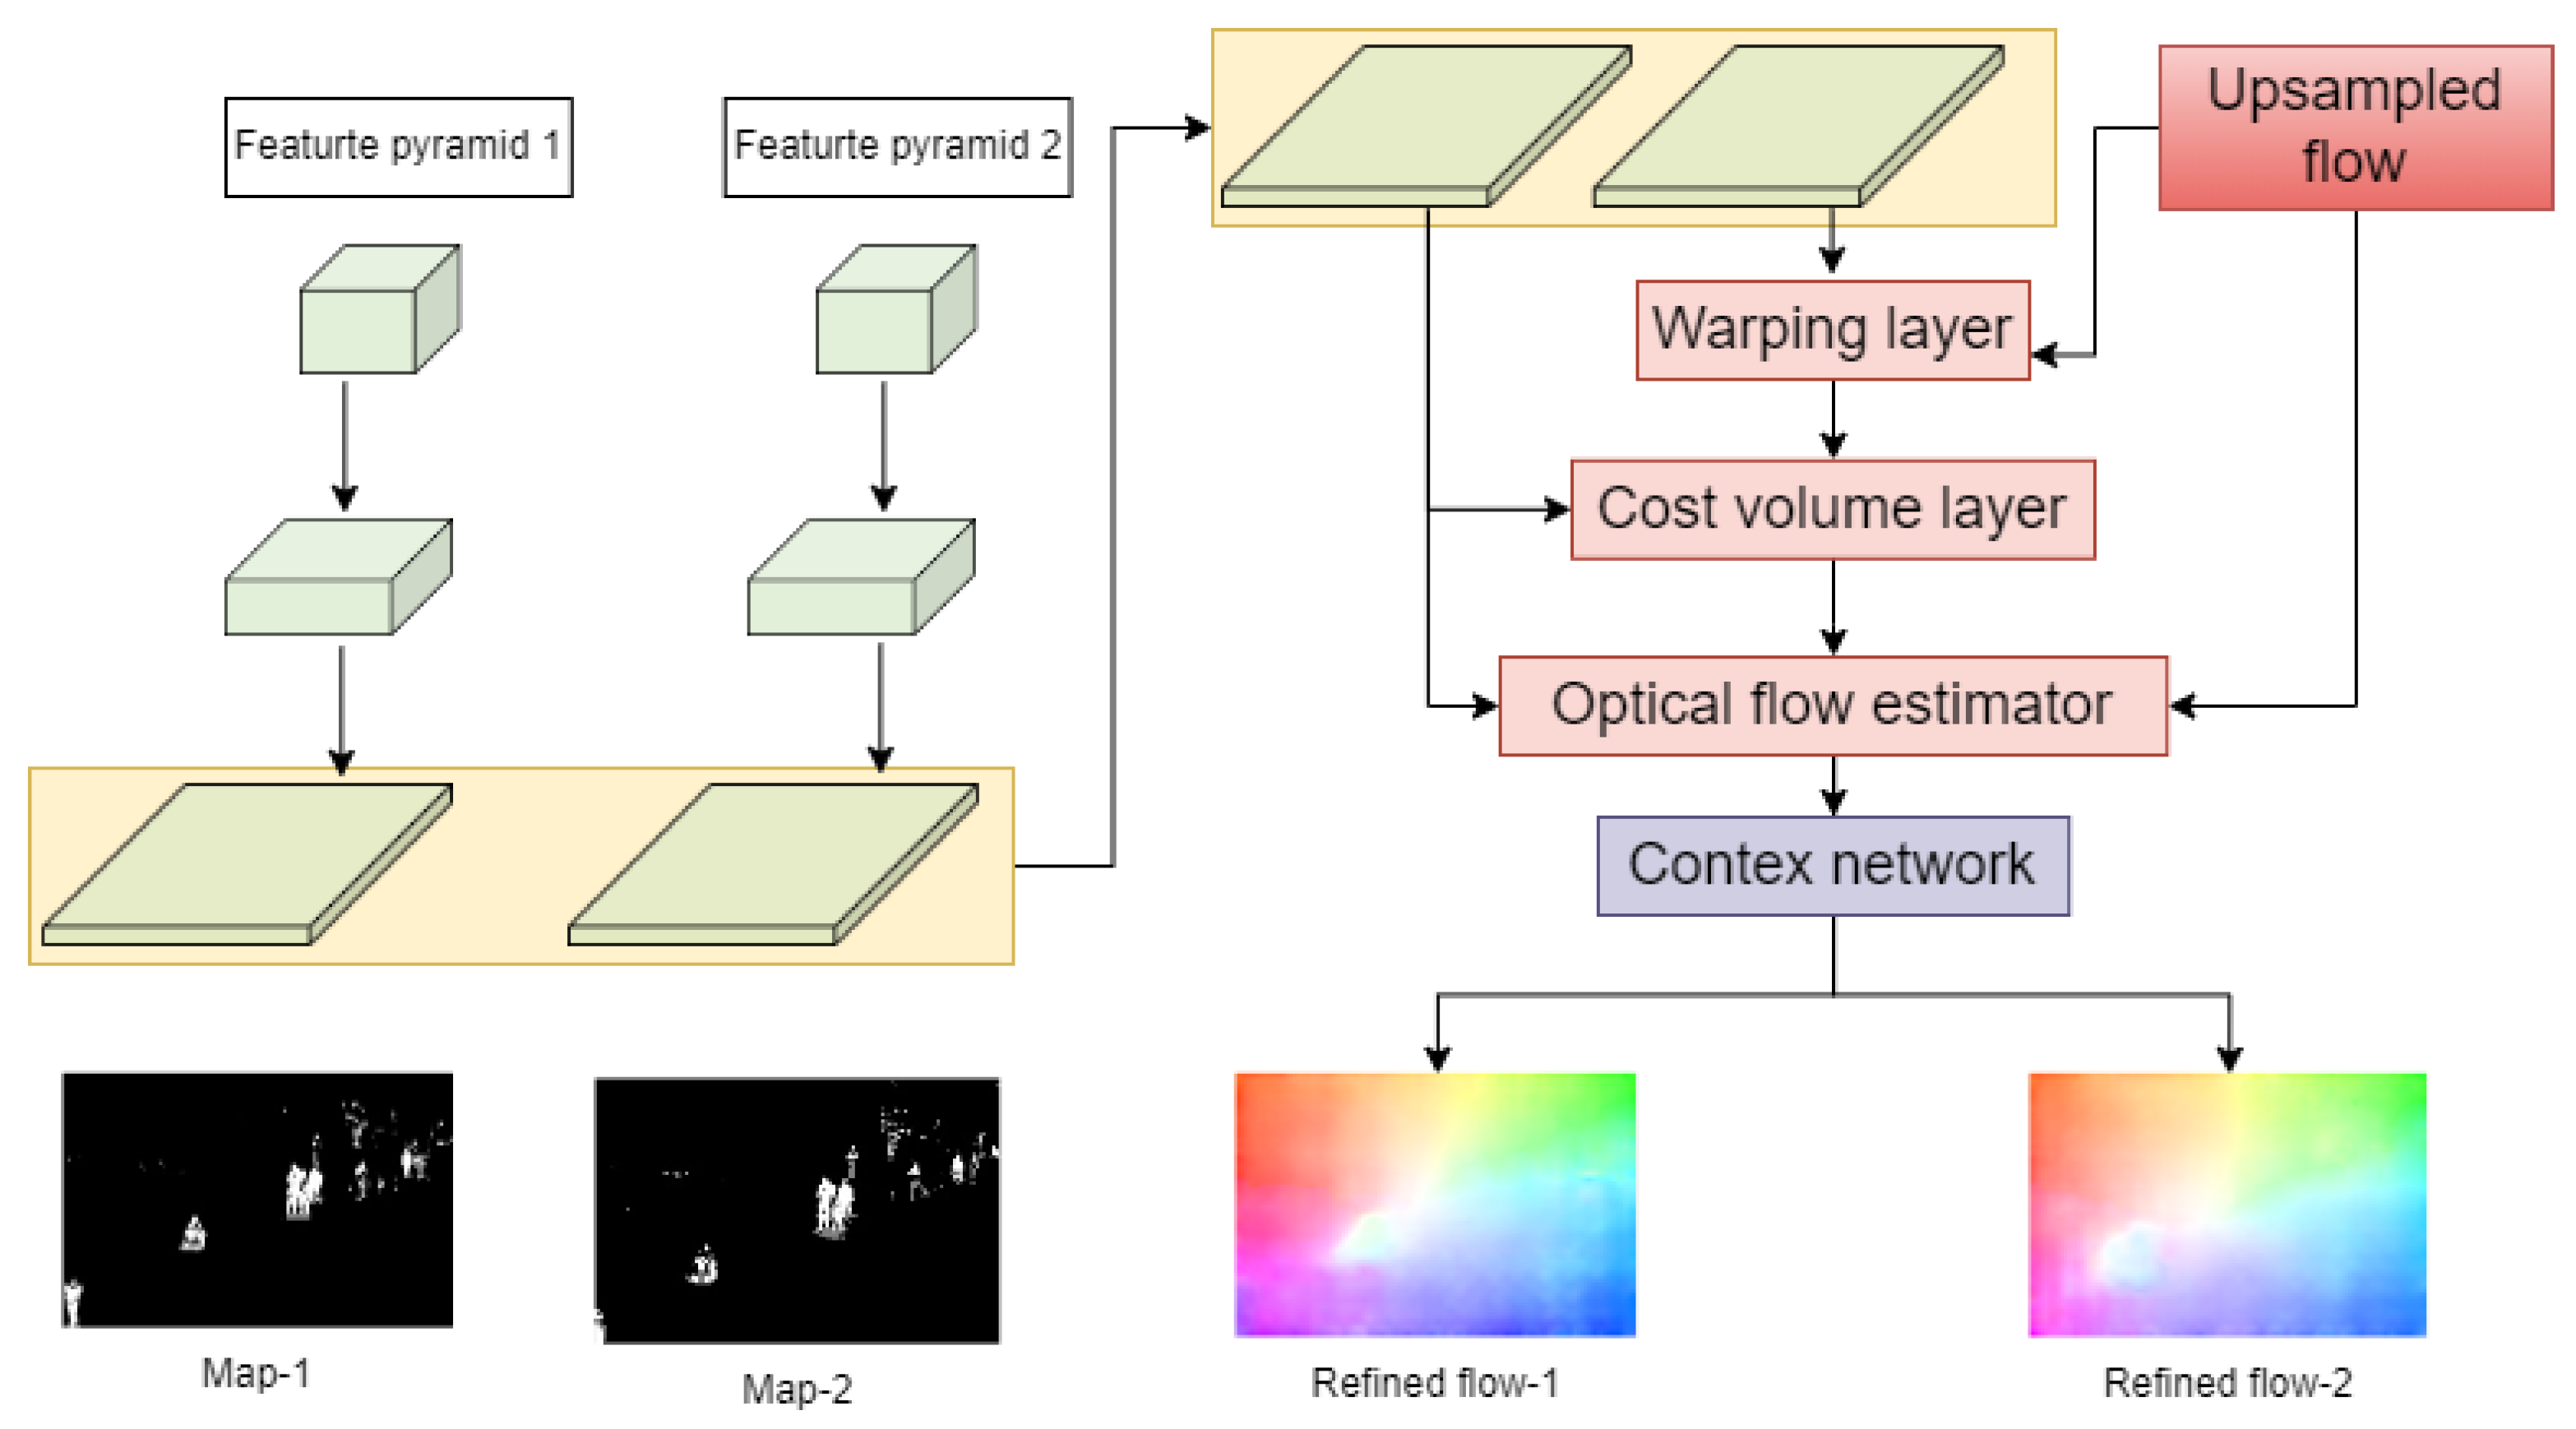
In contrast, deep learning can overcome these problems well. Deep feature extraction through direct learning from data requires only the design of feature extraction rules, the manual design of the network structure, and learning rules to obtain deep model parameters and extract deep features, thus improving the recognition accuracy and the robustness in the process of video behavior detection. The PWC-Net based on deep learning is a kind of optical flow estimation technology used to calculate motion information between adjacent image frames. When combined with classification methods, which can be used for image anomaly detection tasks. PWC-Net (Pyramid, Warping, and Cost Volume, with multi-scale and multi-stage architecture) is a state-of-the-art method for optical flow estimation, proposed by Sun et al. in 2018. It builds upon the FlowNet architecture and introduces several improvements, including: 1). Multi-scale processing: the input images are processed at multiple scales to better capture small-scale and large-scale motion. 2). Multi-stage processing: the network has multiple stages, each of which takes as input the output of the previous stage, allowing for a more fine-grained estimation of flow. 3). Cost volume: instead of concatenating the feature maps of the two input images, PWC-Net computes a cost volume by computing the dot product between each pair of feature vectors. This allows the network to compute the cost of different flow hypotheses, which is then used to estimate the final flow field.
The optical flow vectors can be used as features to construct a classifier, which is used to classify input image frames into normal and abnormal categories. The results of PWC-Net is shown in
Figure 5. During the training of the classifier, image frames with typical motion patterns can be used as normal samples, while image frames with atypical motion patterns can be used as abnormal samples. Then, the trained classifier can be used to classify new input image frames and detect whether anomalies are present.
3.3. Abnormal Behavior Detection
Given a new visual sequence, we select abnormal video frames by adopting the trained classifier model to compute images in the video. And we estimate the likelihood of
by verifying the validity of the corresponding spatio-temporal video.
where
is known feature vector,
is the location.
denotes the feature vector of the observed objection
t, and
denotes its location. To model the relationship between
x,
z from the aspect of spatio-temporal appearance, we estimate the conditional probability
by the cosine similarity between
and
:
The location similarity between
y and
t is modeled using a Gaussian function:
Dimension of the feature vector is
M,
is the
element of
t feature vector,
denotes natural exponential function, and
is a constant. Assuming that the variables
x and
y are conditionally independent and have a uniform prior distribution, it suggests that there is no prior preference for valid samples in the set. Consequently, the joint likelihood of the observed object
t and the hidden variables
x and
y can be factorized in the following way:
The constant
is used to ensure that the maximum value of
is limited to a value smaller than 1. We aim to find the samples
x and
y that maximize the maximum a posteriori probability assignment. This can be achieved by using equation (
15):
The first term in equation (
16) represents the
inference of spatio-temporal appearance, while the second term represents the
inference of spatial location. Based on the
inference, a sample that appeared only once in the normal fixation set is equally likely as samples that appeared multiple times. A large likelihood indicates that it is more likely to find
x and
y in the set to infer the anomaly object
t in terms of spatio-temporal appearance and spatial location.
3.4. Tracking
In addition to anomaly detection, this paper also demonstrated the use of YOLOv5 and DeepSORT for object detection and tracking in videos. In this paper, firstly, YOLOv5 is used to detect the position and class information of each target in each frame of the video. When the target is detected using YOLOv5, its position and class information can be passed to DeepSORT, The DeepSORT parameters are listed in
Table 1. DeepSORT uses a method based on appearance and motion information to determine the identity of the target, using Kalman filtering and the Hungarian technology for multi-object tracking, thereby obtaining the trajectory information of the target in the video. It compares the currently detected targets with the previously tracked targets to determine whether they are the same target and creates new target tracking when necessary. By combining YOLOv5 and DeepSORT, this paper achieves accurate detection and tracking of targets in videos, providing target position and ID information. The results of the object detection and tracking using YOLOv5 and DeepSORT are illustrated in Figure 14 and Figure 15.
In a word, we propose a method for detecting and locating abnormal behavior in a monitoring scene. Firstly, combining the AGMM and YOLACT technologys to obtain more accurate foreground information. Then we use the PWC-Net technology to extract features of the foreground images and input them into an anomaly classification model for classification, which further improves the accuracy of our method. Additionally, we employ YOLOv5 and DeepSORT networks for object detection and tracking in the video, allowing us to detect different objects present in the video and track them for better understanding of the scene. Overall, our proposed method effectively detects and locates abnormal behavior in the monitoring scene.
4. Experiments
The proposed method is evaluated on the UCSD dataset [
57], which means that it has labels and ground truth information for the task of abnormal detection and localization in crowded scenes, the specific experimental analysis is outlined as follows.
4.1. Experimental Basis
We test the performance of the proposed method on the UCSD anomaly detection dataset. The dataset was obtained using a fixed camera mounted at a certain height overlooking the walkway. The UCSD dataset contains two subsets, Ped1 and Ped2. Both subsets contain the training and test sets. Ped1 contains 34 training and 36 test videos, with a frame resolution of
pixels. Each video sequence has a frame length of 200. Ped2 contains 16 training videos and 12 test videos of pedestrian motion videos on the sidewalk with a frame resolution of
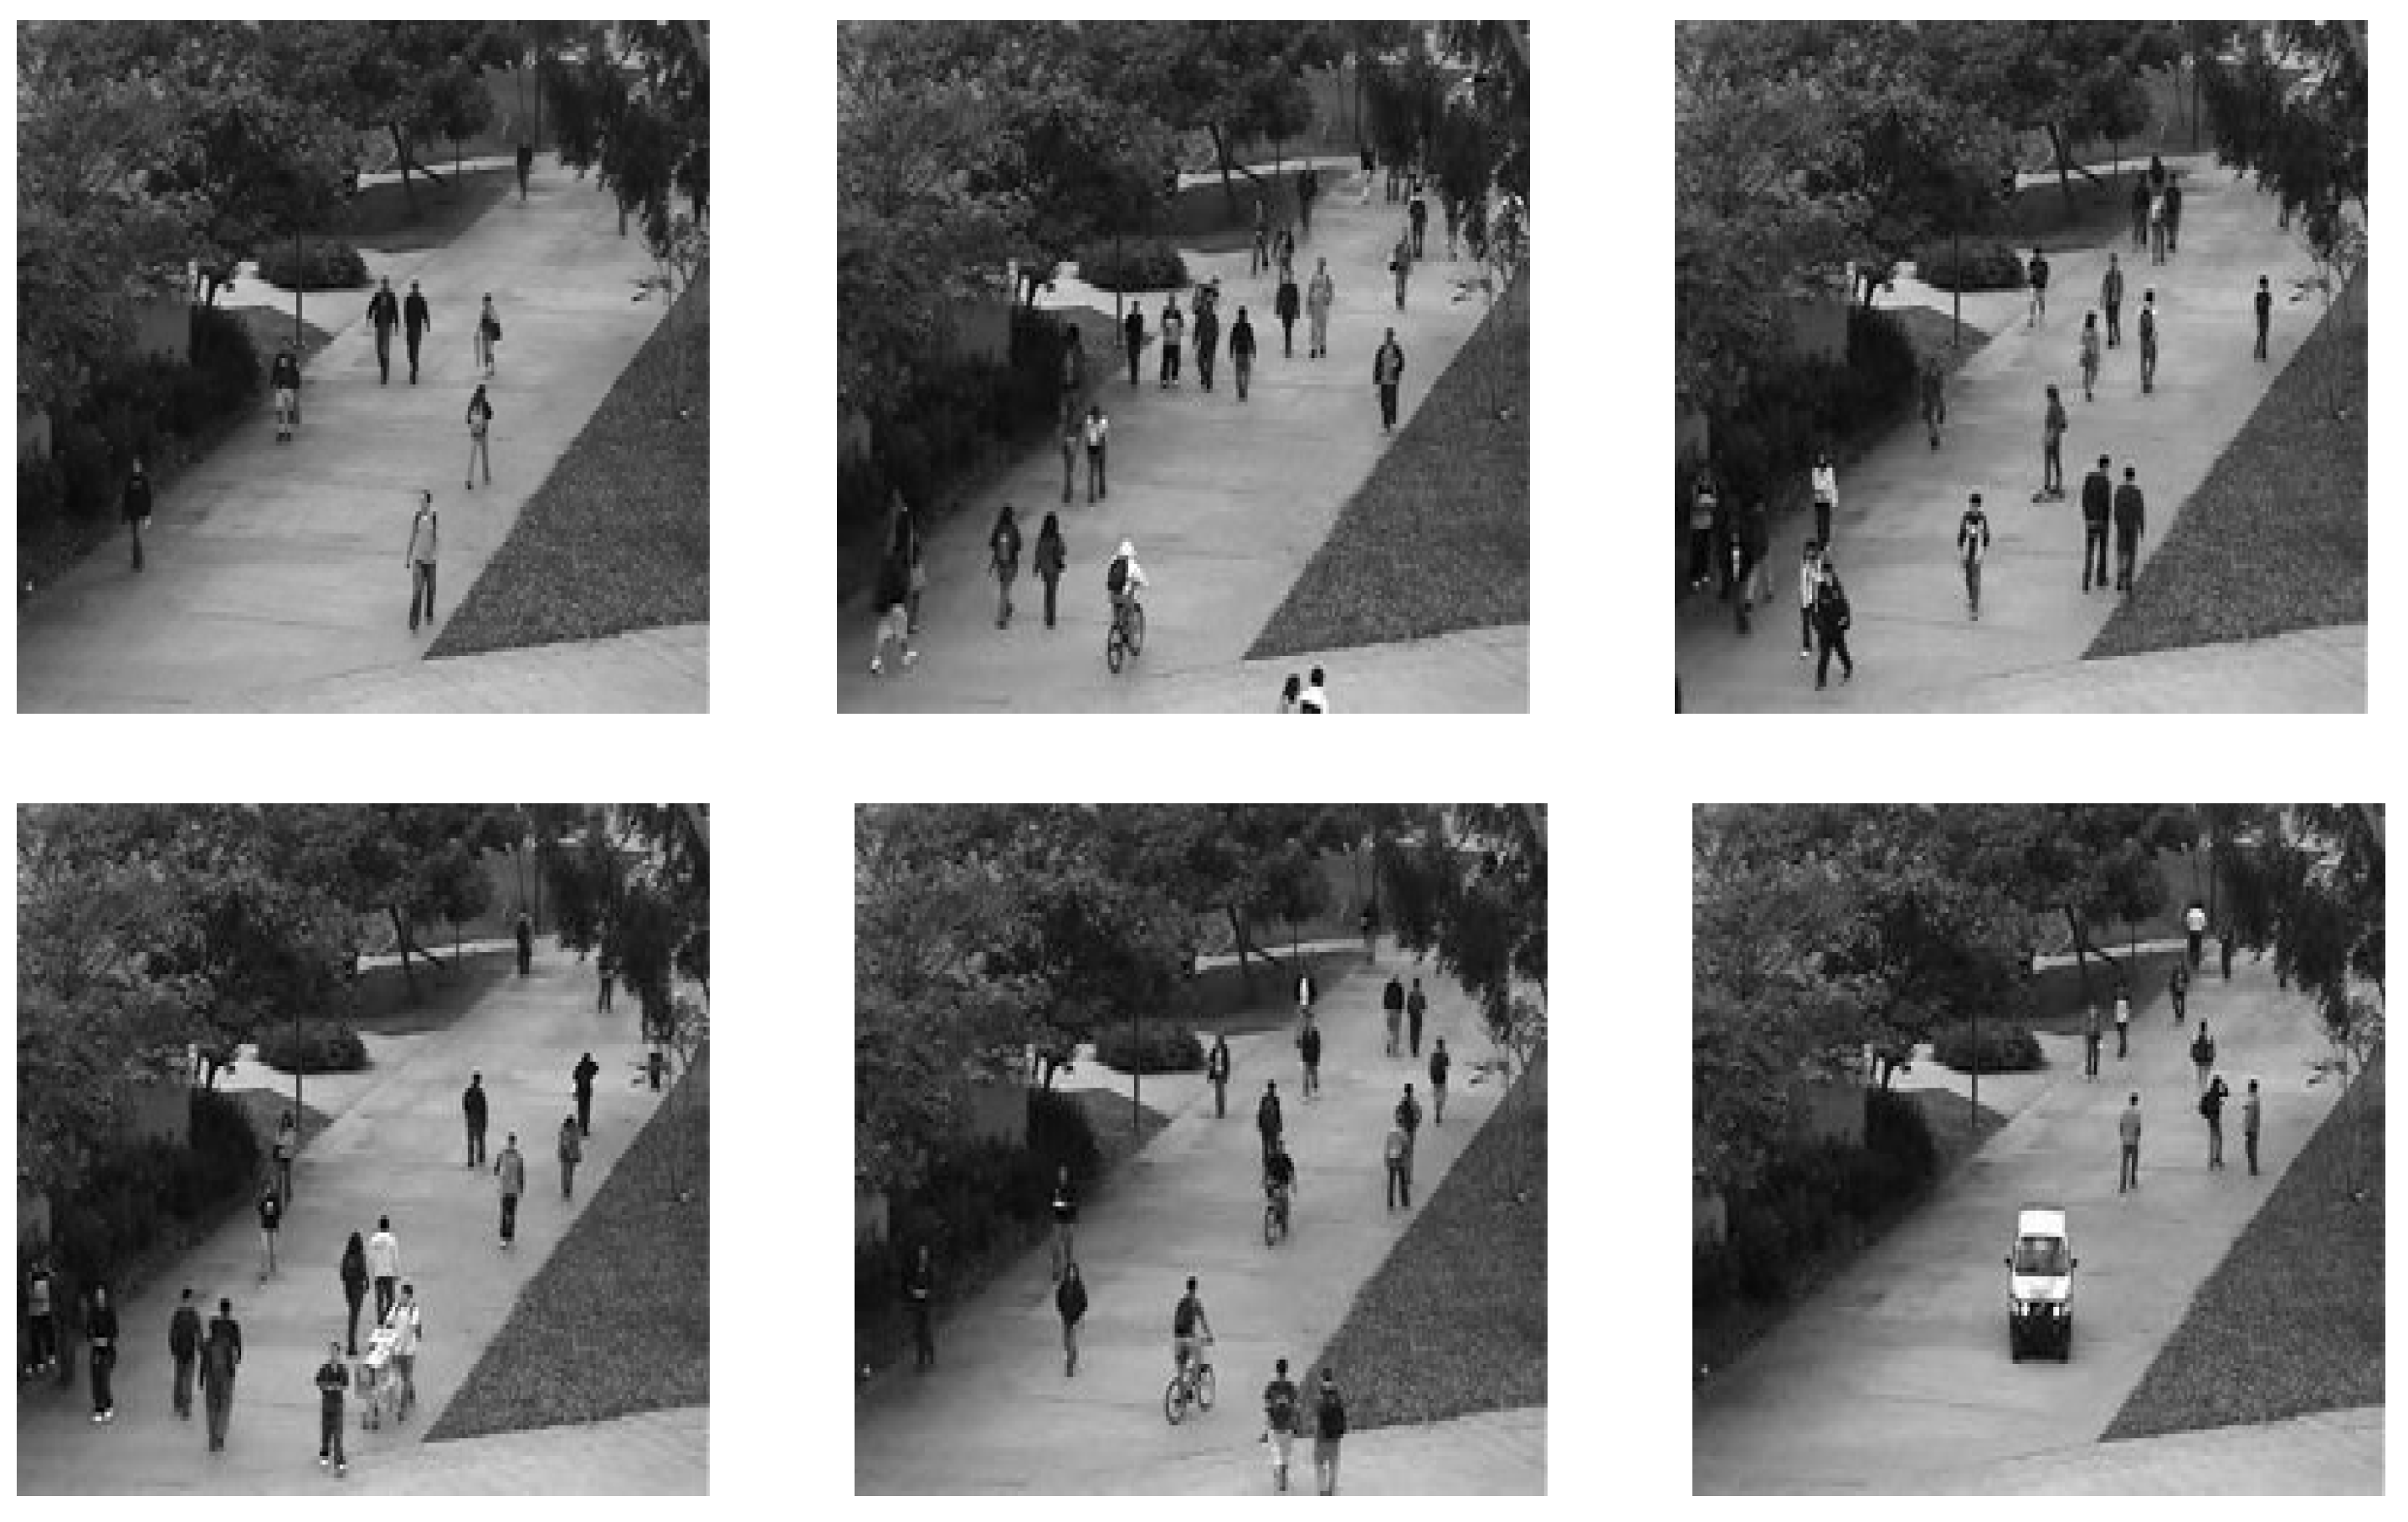
pixels. The frame length of each sequence varies from 120 to 170. Moreover, all the frames in the training set are normal frames, containing only pedestrians. In addition to normal objects, the testing set also contains abnormal objects. The normal object in each frame is the pedestrian walking, and the rest of the behavior is regarded as abnormal behavior, such as cyclists, skateboarders, and cars. The UCSD dataset is a challenging local anomaly dataset in the crowded field. The low resolution of the objects in Ped1 makes them difficult to identify, while the occlusion problem in Ped2 is serious. All the test videos are used in this paper to evaluate the scheme. The sample images from the UCSD dataset are showen in
Figure 6.
For the anomaly detection of the video behavior on the UCSD dataset, we select the commonly accepted criteria for the evaluation of abnormal detection, including the equal error rate (EER) and the area under curve (AUC). Notably, the lower the EER and the higher the AUC are, the better the performance is. The two criteria are derived from the receiver operating characteristic curve (ROC). The ROC is composed of the true positive rate (TPR) and the false positive rate (FPR), where TPR refers to the correctly classified positive samples among all the positive samples during the test period, and FPR defines the number of false positive results among all the negative samples during the test period. TPR and FPR are as shown expressed as follows:
where true positive (TP) is the correctly labeled abnormal samples, true negative (TN) is the correctly labeled abnormal samples, false negative (FN) is the incorrectly labeled normal samples, and false positive (FP) is the incorrectly labeled abnormal samples. In this paper, we calculated the TPR and the FPR for generating the ROC curves.
4.2. Moving Target Detection and Analysis
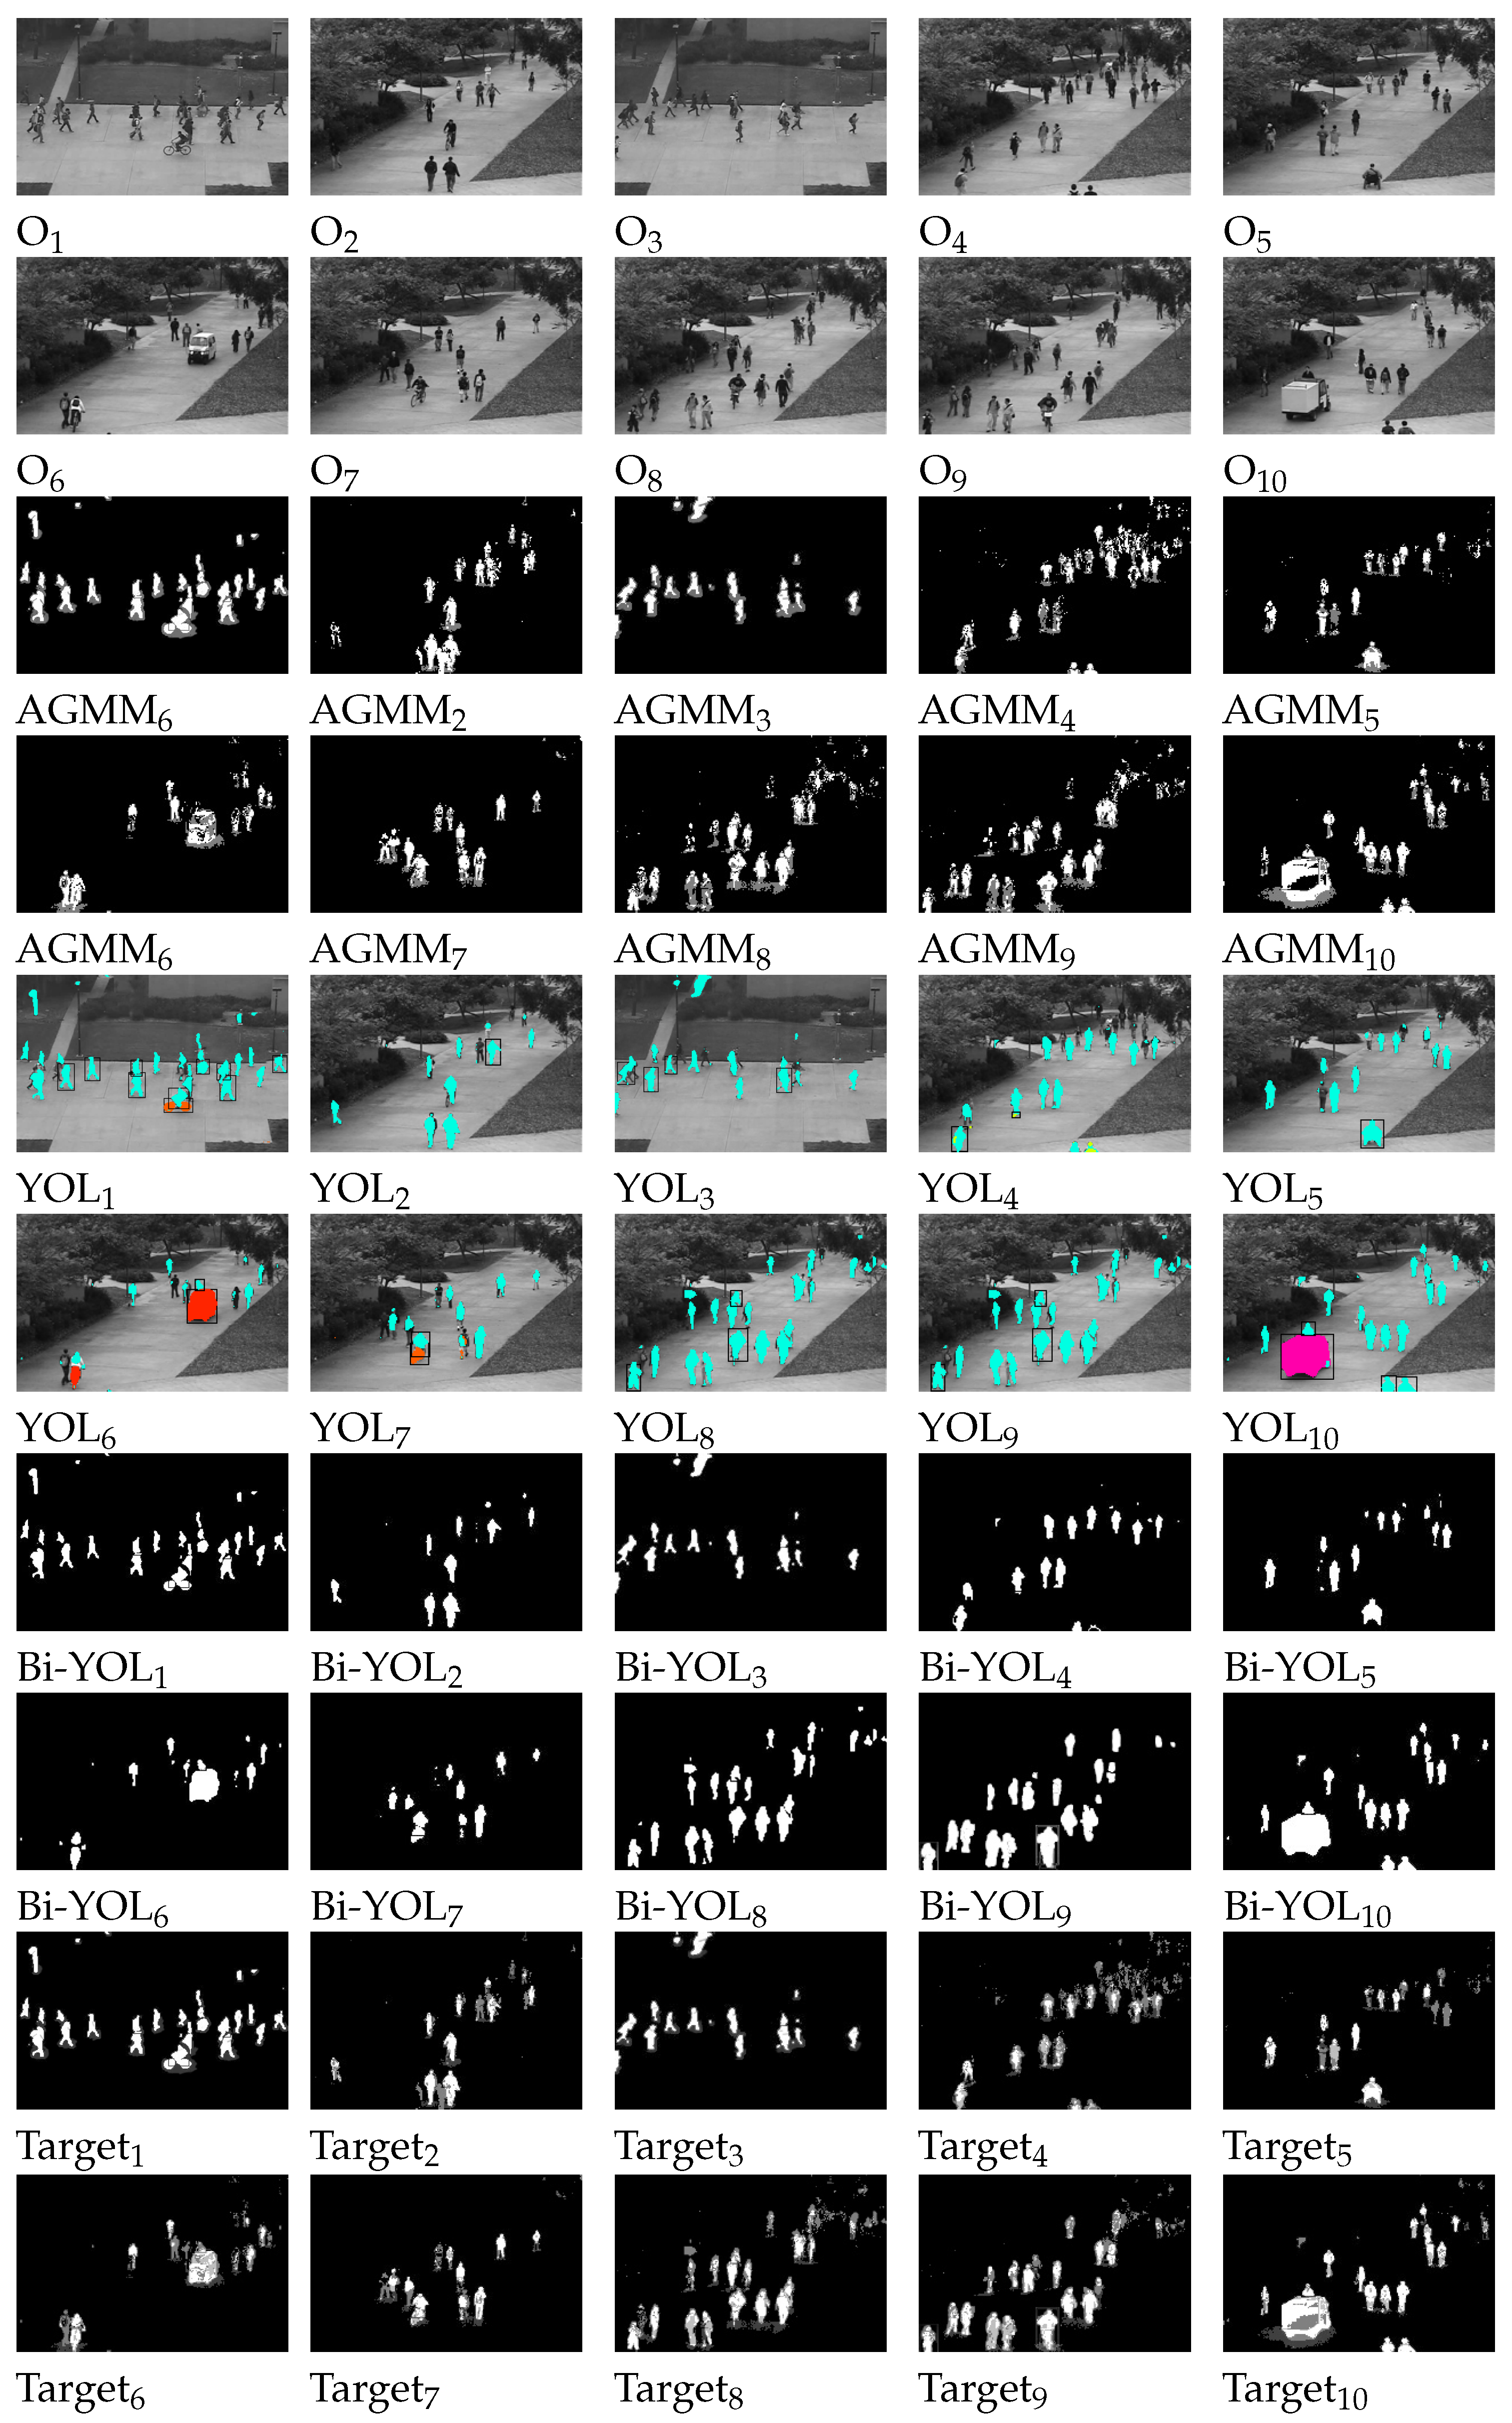
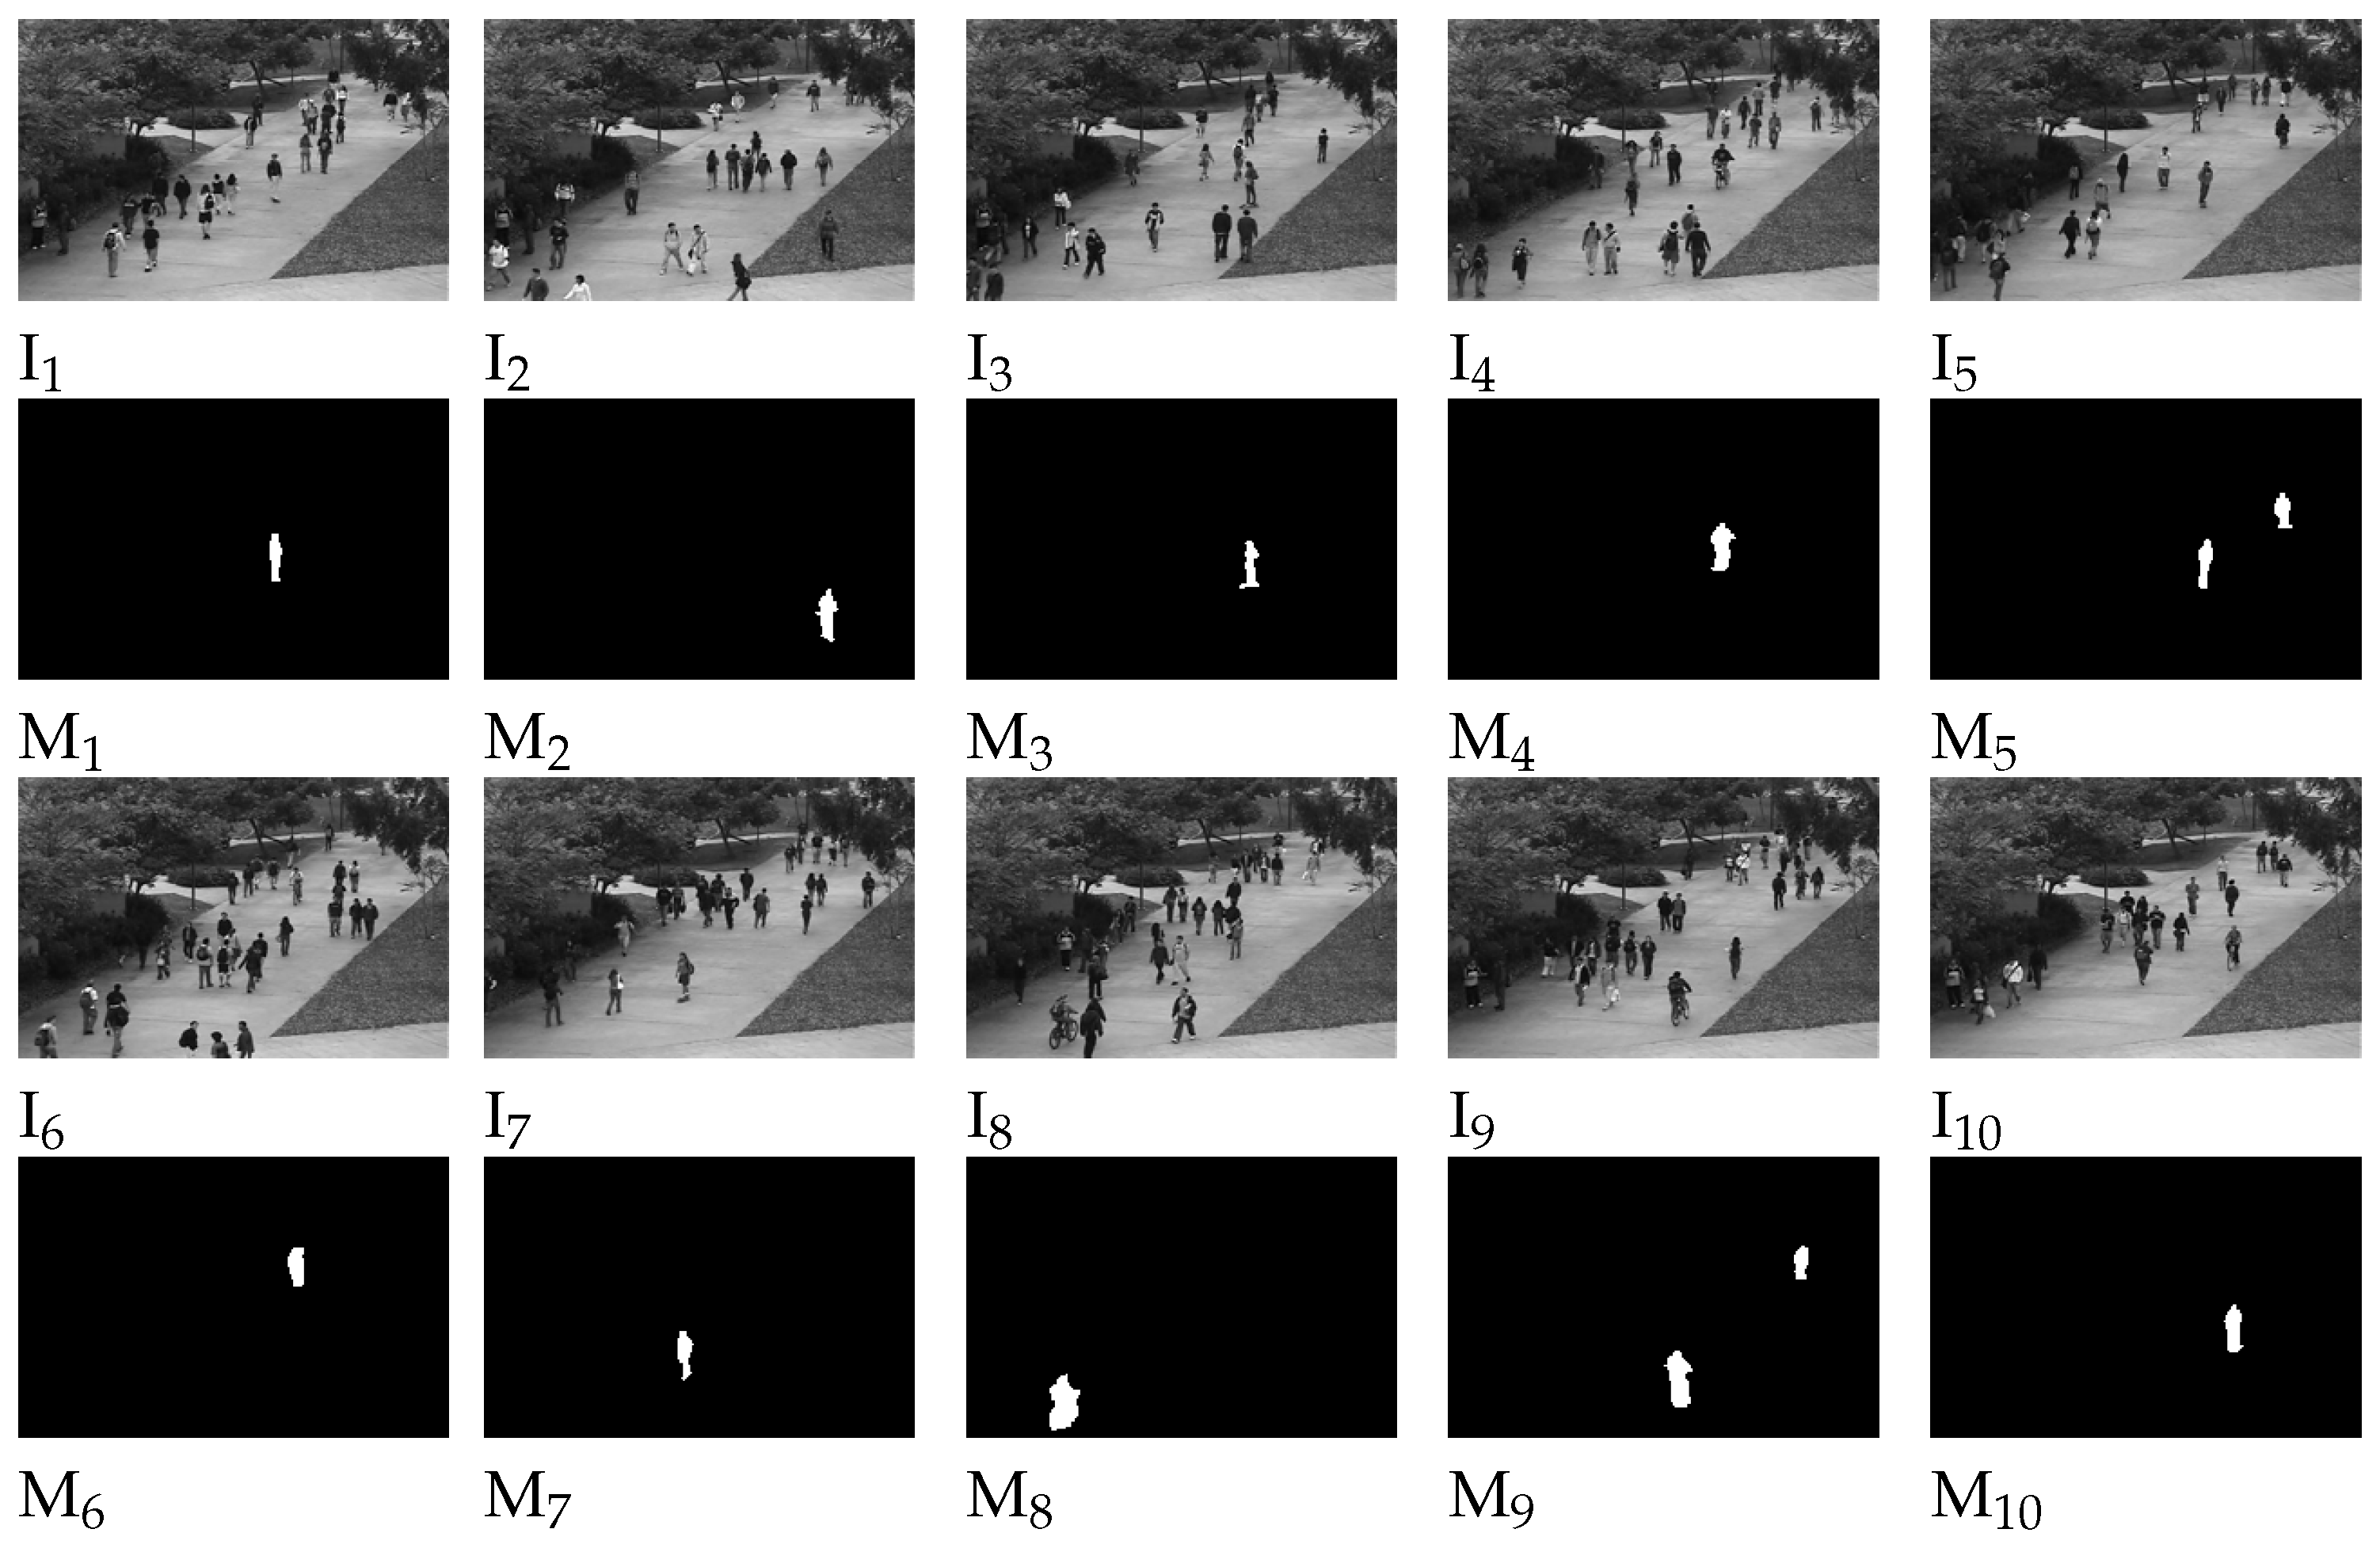
In this paper, the Adaptive Gaussian Mixture Model (AGMM) and YOLACT are combined to extract video targets. To make AGMM more suitable for the scenario in this paper, we select appropriate experimental parameters. We mainly consider the following AGMM parameters for foreground extraction: detect shadows (), frames (F), learning rate (), threshold (T), the number of distributions (K), frame size (), frame per second (), and initial variance (). These parameters are selected to generate a relatively predictable mask for the further processing of object feature detection. For this paper, we perform appropriate adjustments and finally obtain the optimization result. To achieve the goal, the values of , F, , T, K, , , and are set to , 200 frames, 0.005, 25, 5, , 30, and 15, respectively. The specific experimental results are presented in the third and fourth rows of the Figure 8.
In addition to traditional foreground extraction methods, this paper also employs deep learning networks to extract foreground images. The advantage of using YOLACT to extract foreground images from video frames lies in its strong real-time performance, which enables almost real-time foreground extraction. Moreover, YOLACT has high robustness and can adapt to different scenes and complex backgrounds. Using YOLACT for foreground extraction from video frames can produce high-quality foreground images, thus improving the accuracy and efficiency of subsequent processing. Based on the ideas of Mask-RCNN and FCN, YOLACT achieves foreground image extraction through multi-level feature fusion and segmentation. Compared to traditional threshold-based segmentation methods, YOLACT performs better in handling complex scenes and motion blur, resulting in higher quality foreground images. The specific experimental results are presented in the fifth and sixth rows of the Figure 8. This paper fine-tunes the YOLACT network and introduces a mask generation module to meet the requirements of the proposed method. Due to the need for obtaining the foreground mask of grayscale images in this paper, a foreground mask generation module was added to the YOLACT network to meet the requirements of the technique. Additionally, Otsu foreground extraction and adaptive threshold methods were attempted to extract the foreground image generated by YOLACT, but the results were not satisfactory (as shown in the
Figure 7). Therefore, a new foreground mask generation module was designed in this paper to generate more ideal mask images based on image features. The specific experimental results are presented in the seventh and eighth rows of the
Figure 8.
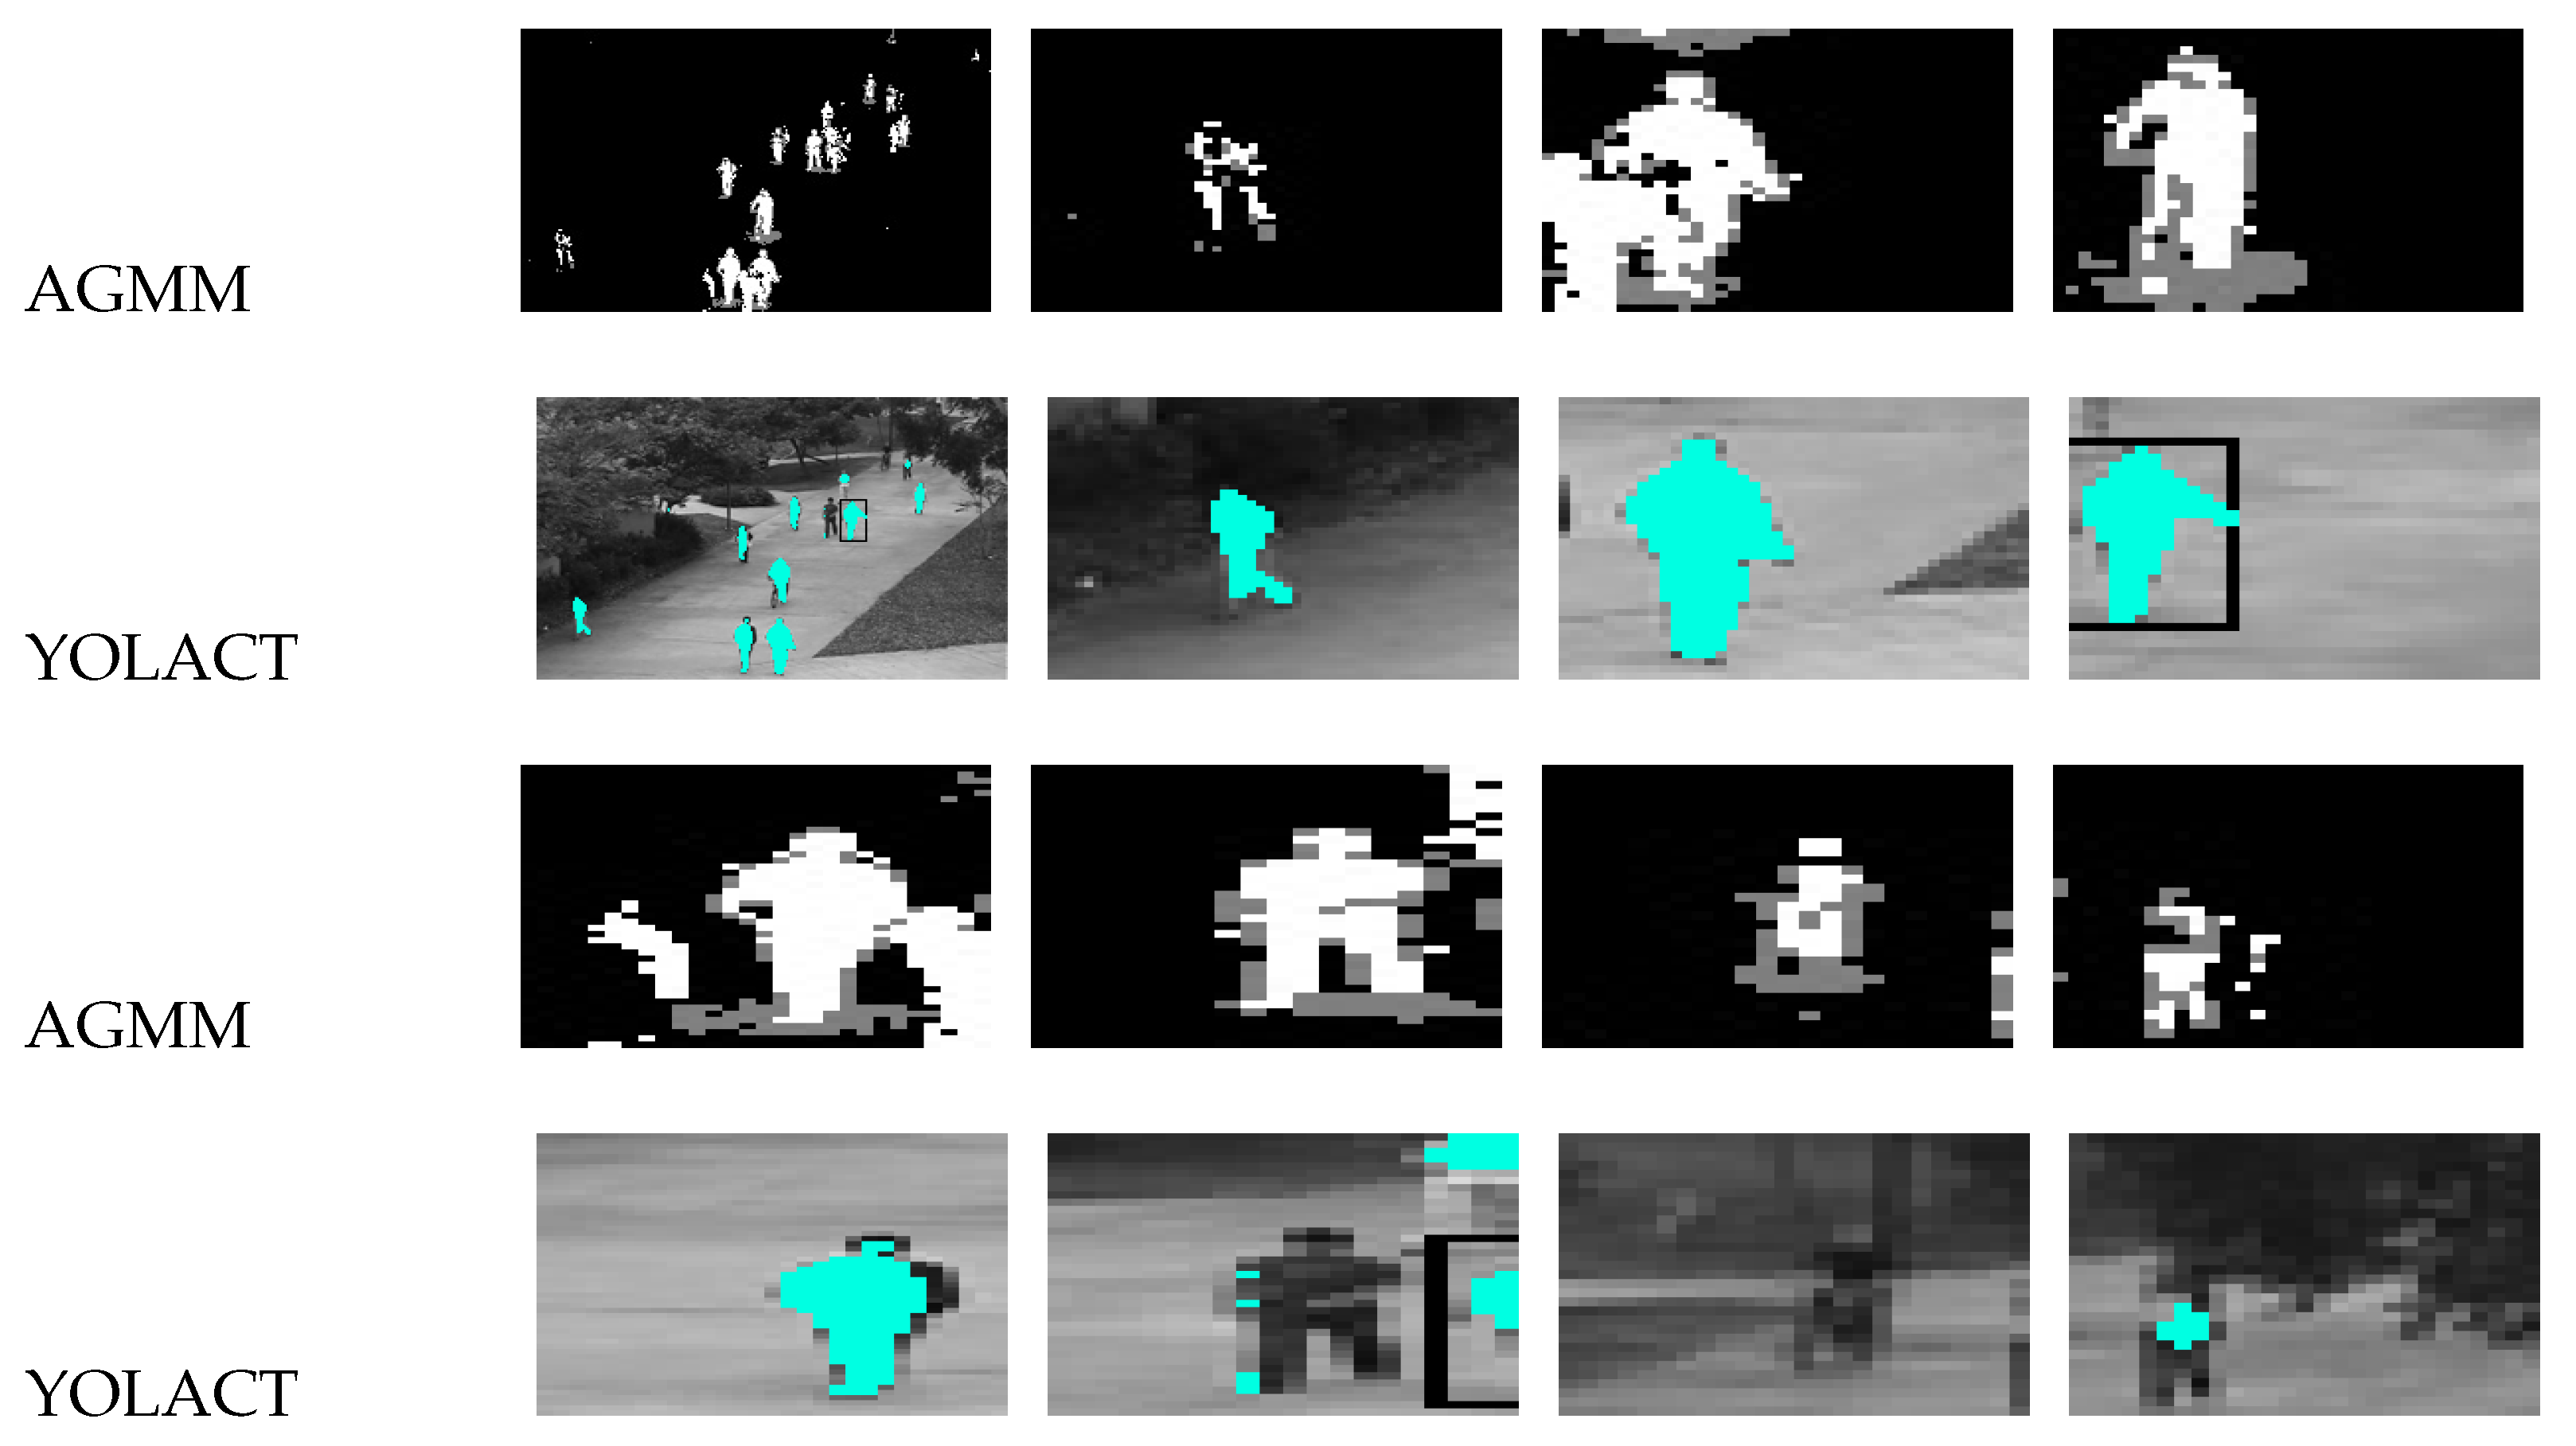
Why do we need to fuse these two types of features? Let’s take a look at the content shown in
Figure 9, both methods have their own limitations. The proposed method in this paper aims to fuse AGMM and YOLACT to obtain a more precise and comprehensive foreground map. From
Figure 8 and
Figure 9, it can be observed that the AGMM technique has robustness to changes in illumination and can effectively handle noise caused by such changes. Moreover, it performs very well for stationary objects or scenes with minimal changes. YOLACT technique utilizes deep learning techniques to achieve more accurate object detection and segmentation, resulting in high-quality foreground images with high precision. As shown in
Figure 9, YOLACT can extract more detailed foreground information during object detection, which enhances its accuracy in foreground extraction. Meanwhile, it can be observed from
Figure 8 that YOLACT has a lower recognition rate and may not even recognize low-light targets. However, although AGMM extracts a relatively rough foreground, it can identify every minor change in the target. Therefore, this paper proposes a fusion of target images extracted by YOLACT and AGMM to obtain a rich foreground image with high quality and accuracy. The specific experimental results are presented in the ninth and tenth rows of the
Figure 8.
Experimental results demonstrate that the proposed method not only enhances the accuracy and completeness of foreground extraction, but also improves the processing speed and efficiency while ensuring real-time performance. In summary, the AGMM and YOLACT fusion method proposed in this paper leverages the strengths of both methods, improves the accuracy and efficiency of foreground extraction, and provides precise target features for video surveillance anomaly detection and localization.
4.3. Target Feature Analysis
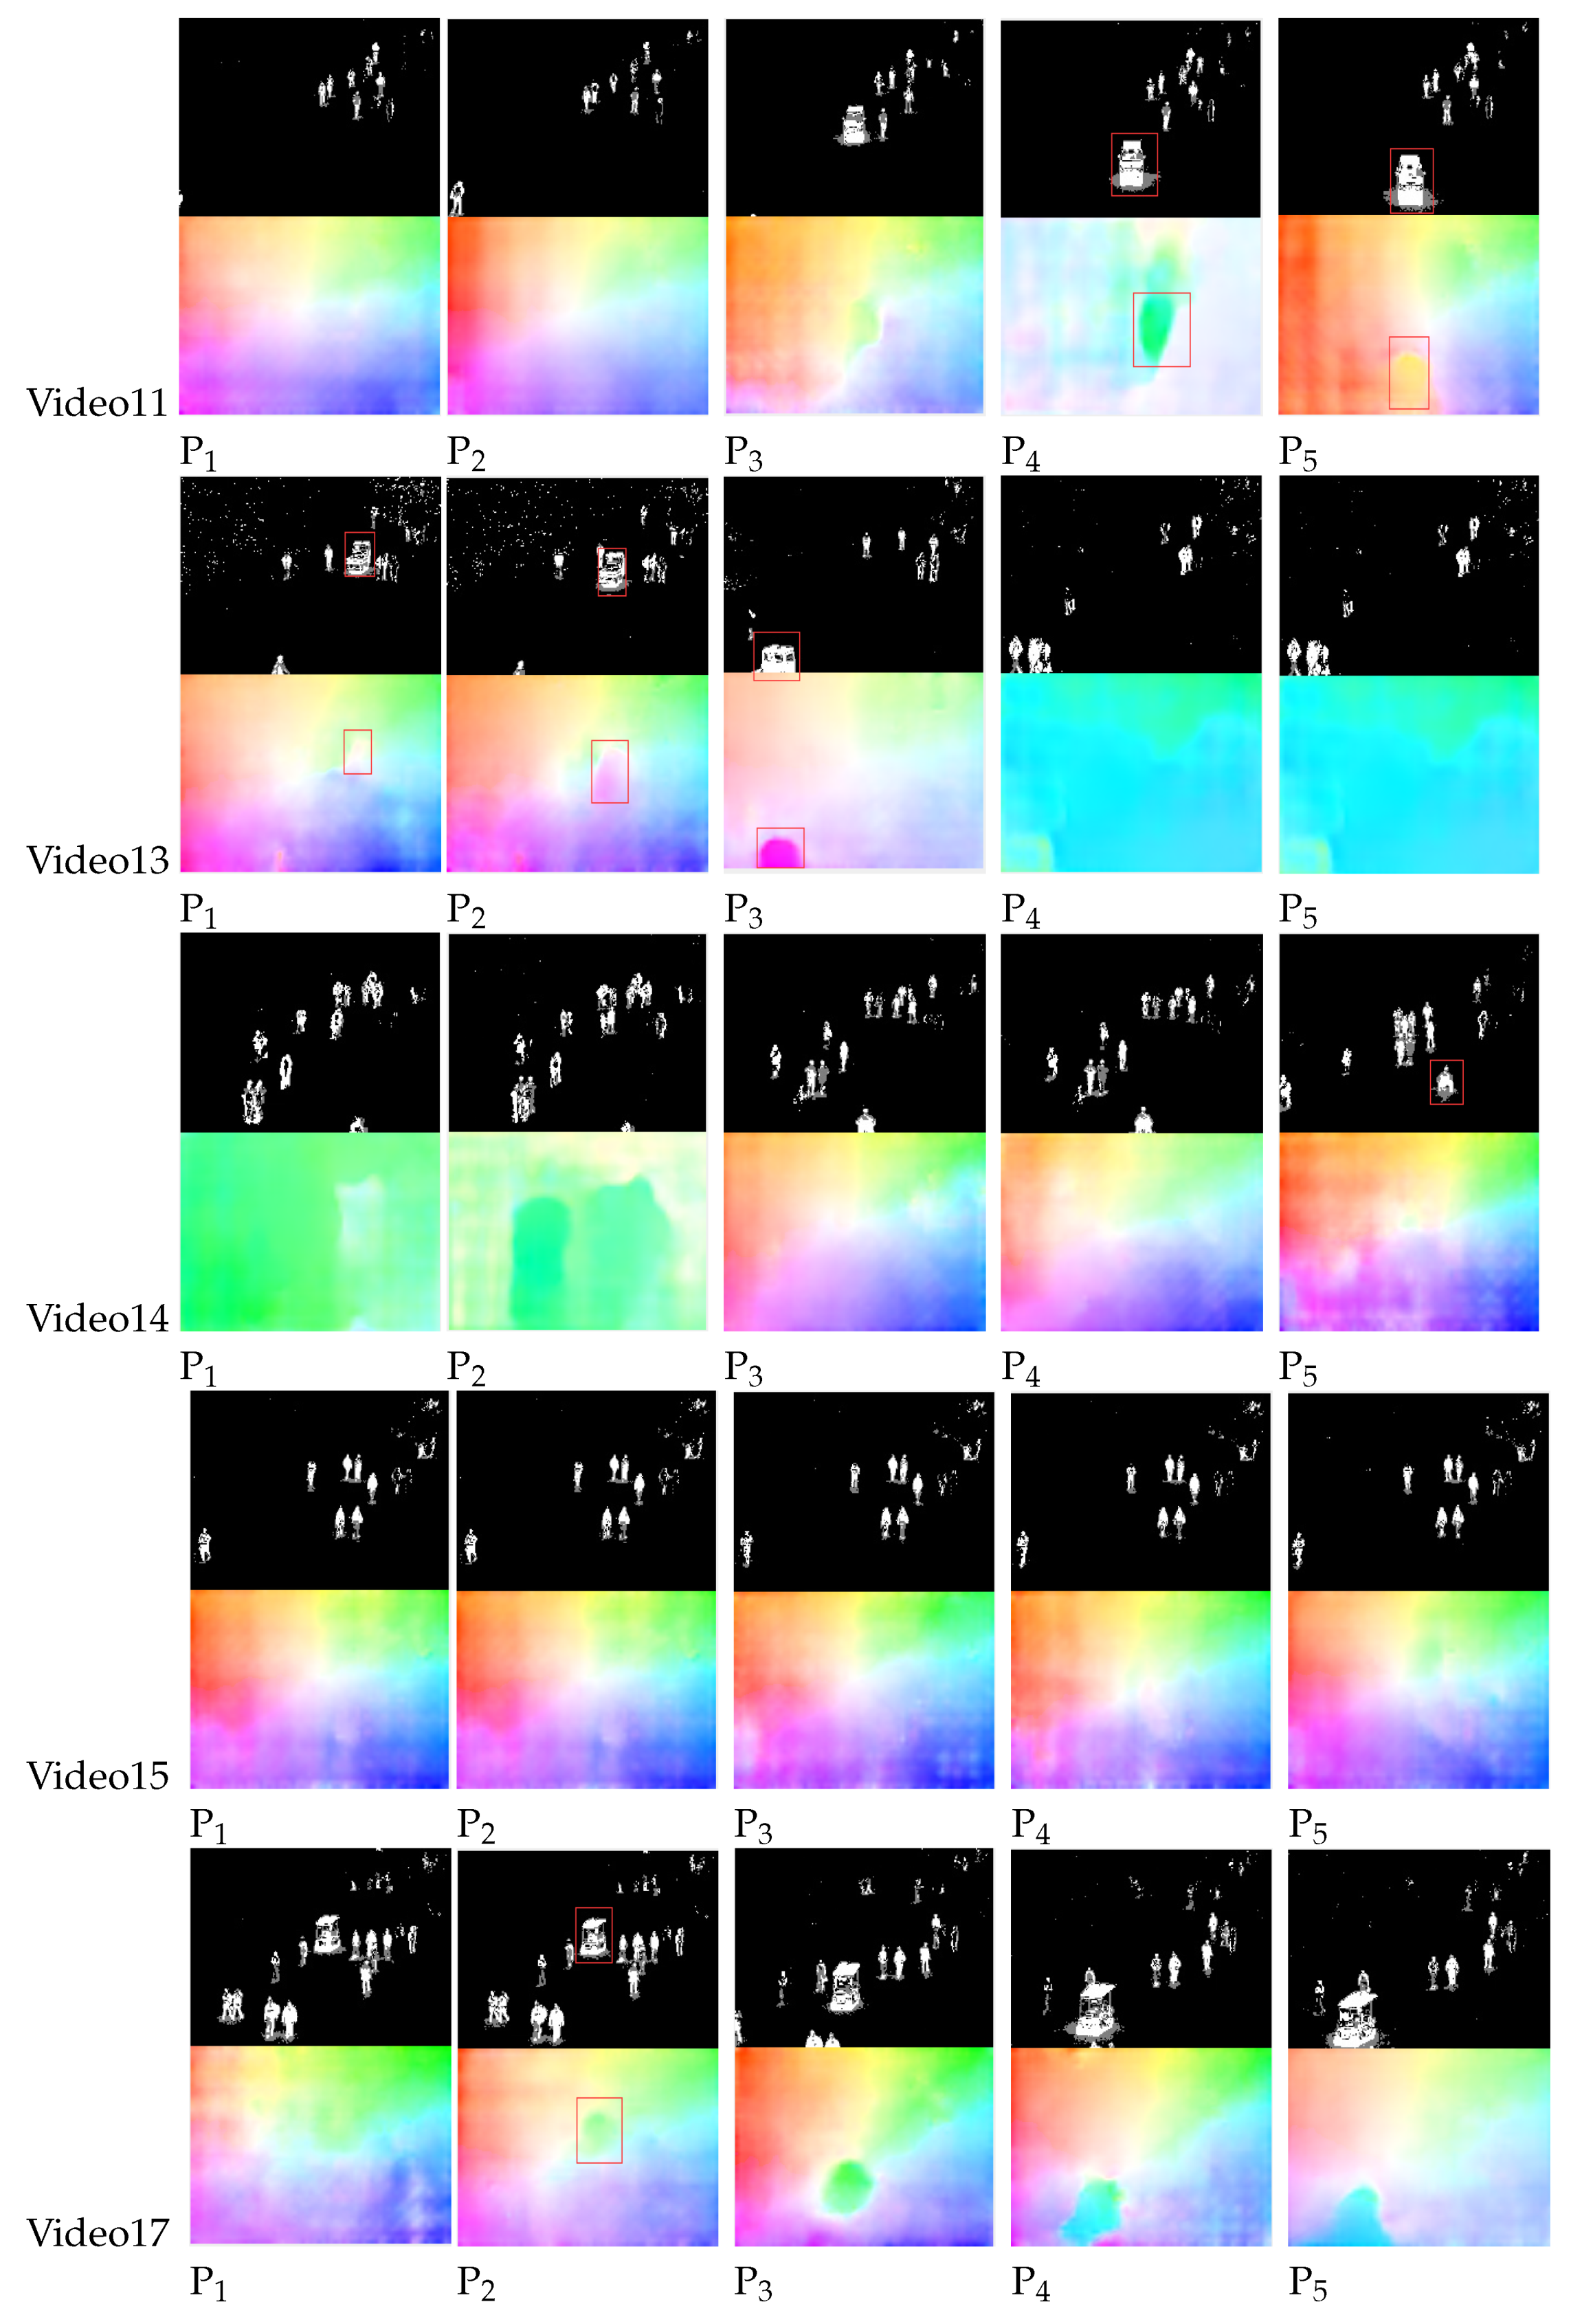
The deep learning model based on PWC-Net optical flow estimation has the characteristics of strong robustness, high accuracy, and fast speed. The design of PWC-Net follows the principles of simplicity and completeness: pyramid processing, image warping using optical flow estimation, and the use of cost volume. Projected onto a learnable feature pyramid, PWC-Net warps the convolutional neural network features of the second image using the current optical flow estimate. It then constructs a cost volume using the warped features of the first image and the features, which is processed by the CNN to estimate the optical flow. In this paper, PWC-Net is used to extract features from the foreground map of video frames, which can obtain more accurate and robust feature representations, thereby improving the accuracy and efficiency of the abnormal classification model. The experimental results are shown in
Figure 10.
Based on the results shown in
Figure 10, PWC-Net demonstrates strong robustness against factors such as changes in lighting, occlusion, and motion blur. Additionally, PWC-Net uses a pyramid structure and flow propagation to improve the accuracy of feature matching and flow estimation. In cases where there is little change between video frames, such as in Video15, the target feature map remains almost unchanged. However, when abnormal objects appear in the video, the feature transformation of moving targets becomes particularly evident, as seen in Video11, Video13, Video14, and Video17. The advantage of such features is that they provide clear feature transformations for the input classifier to make judgments on abnormal frames, thus providing good information to the classifier and improving the classification accuracy.
4.4. Anomaly Detection Analysis
In surveillance video anomaly detection, the UCSD dataset is used, where all anomalies occur naturally and are not staged for dataset assembly. The dataset is divided into two subsets, each corresponding to a different scene. Video clips recorded from each scene are segmented into various segments of approximately 200 frames. In this study, pedestrians walking normally are defined as normal, while abnormal targets include bicyclists, skateboarders, cars, wheelchairs, and small carts, as shown in
Figure 11. To detect anomalous video frames, a ground truth is also created, which includes a binary label for each frame indicating whether an anomaly is present. Specifically, 36 subsets of Peds1 are chosen to provide hand-generated pixel-level binary codes that identify regions containing anomalies, as shown in
Figure 12. This is done to enable performance evaluation of the method’s ability to locate anomalies.
For video anomaly detection, a binary classifier was trained in this study to detect anomalies by using supervised learning to classify behaviors as normal or abnormal and assigning corresponding labels. Before modeling, all normal and abnormal data must be labeled and tagged using supervised classification methods. To improve the accuracy and generalization ability of the video anomaly detection model and enhance its prediction capability, this study used 107,306 datasets to train a classification model. Since videos contain temporal and spatial information, a neural network capable of extracting spatiotemporal features is required for anomaly detection. In this study, PWC-Net was used to extract features for each detection target and assign corresponding labels, which were marked as
for abnormal behavior and
for normal targets. The anomaly detection results for the UCSD dataset are shown in
Figure 13.
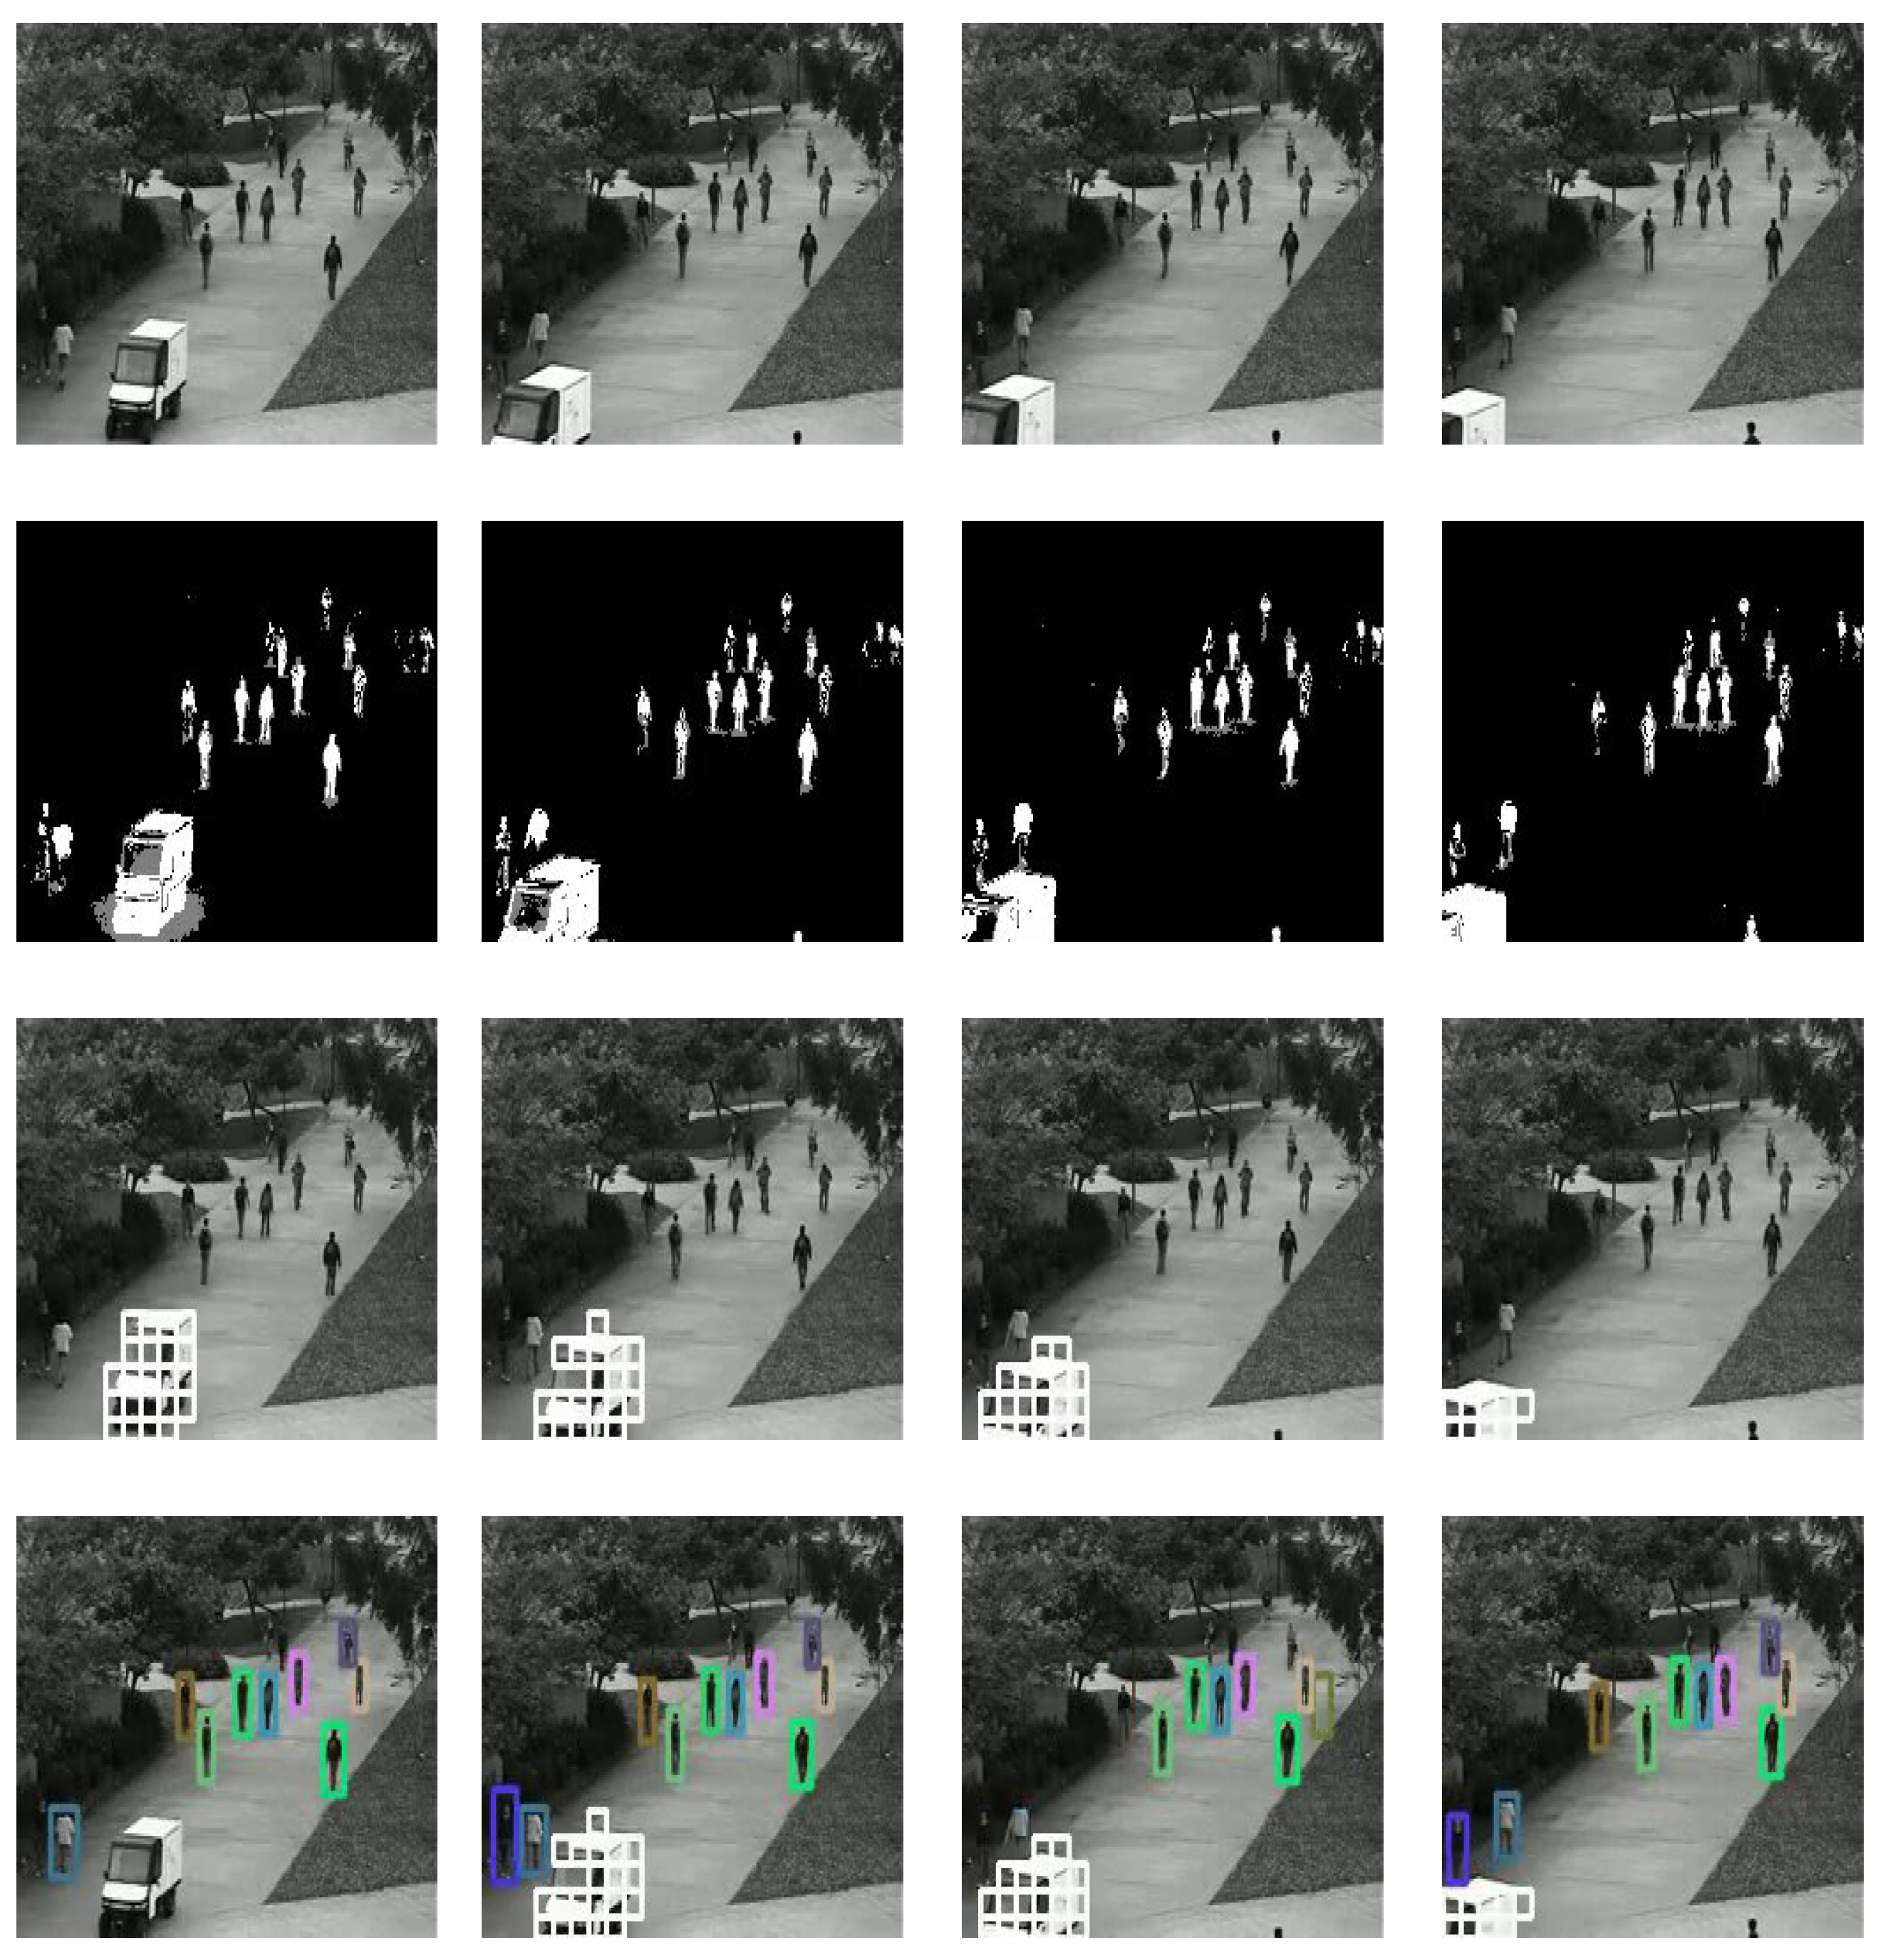
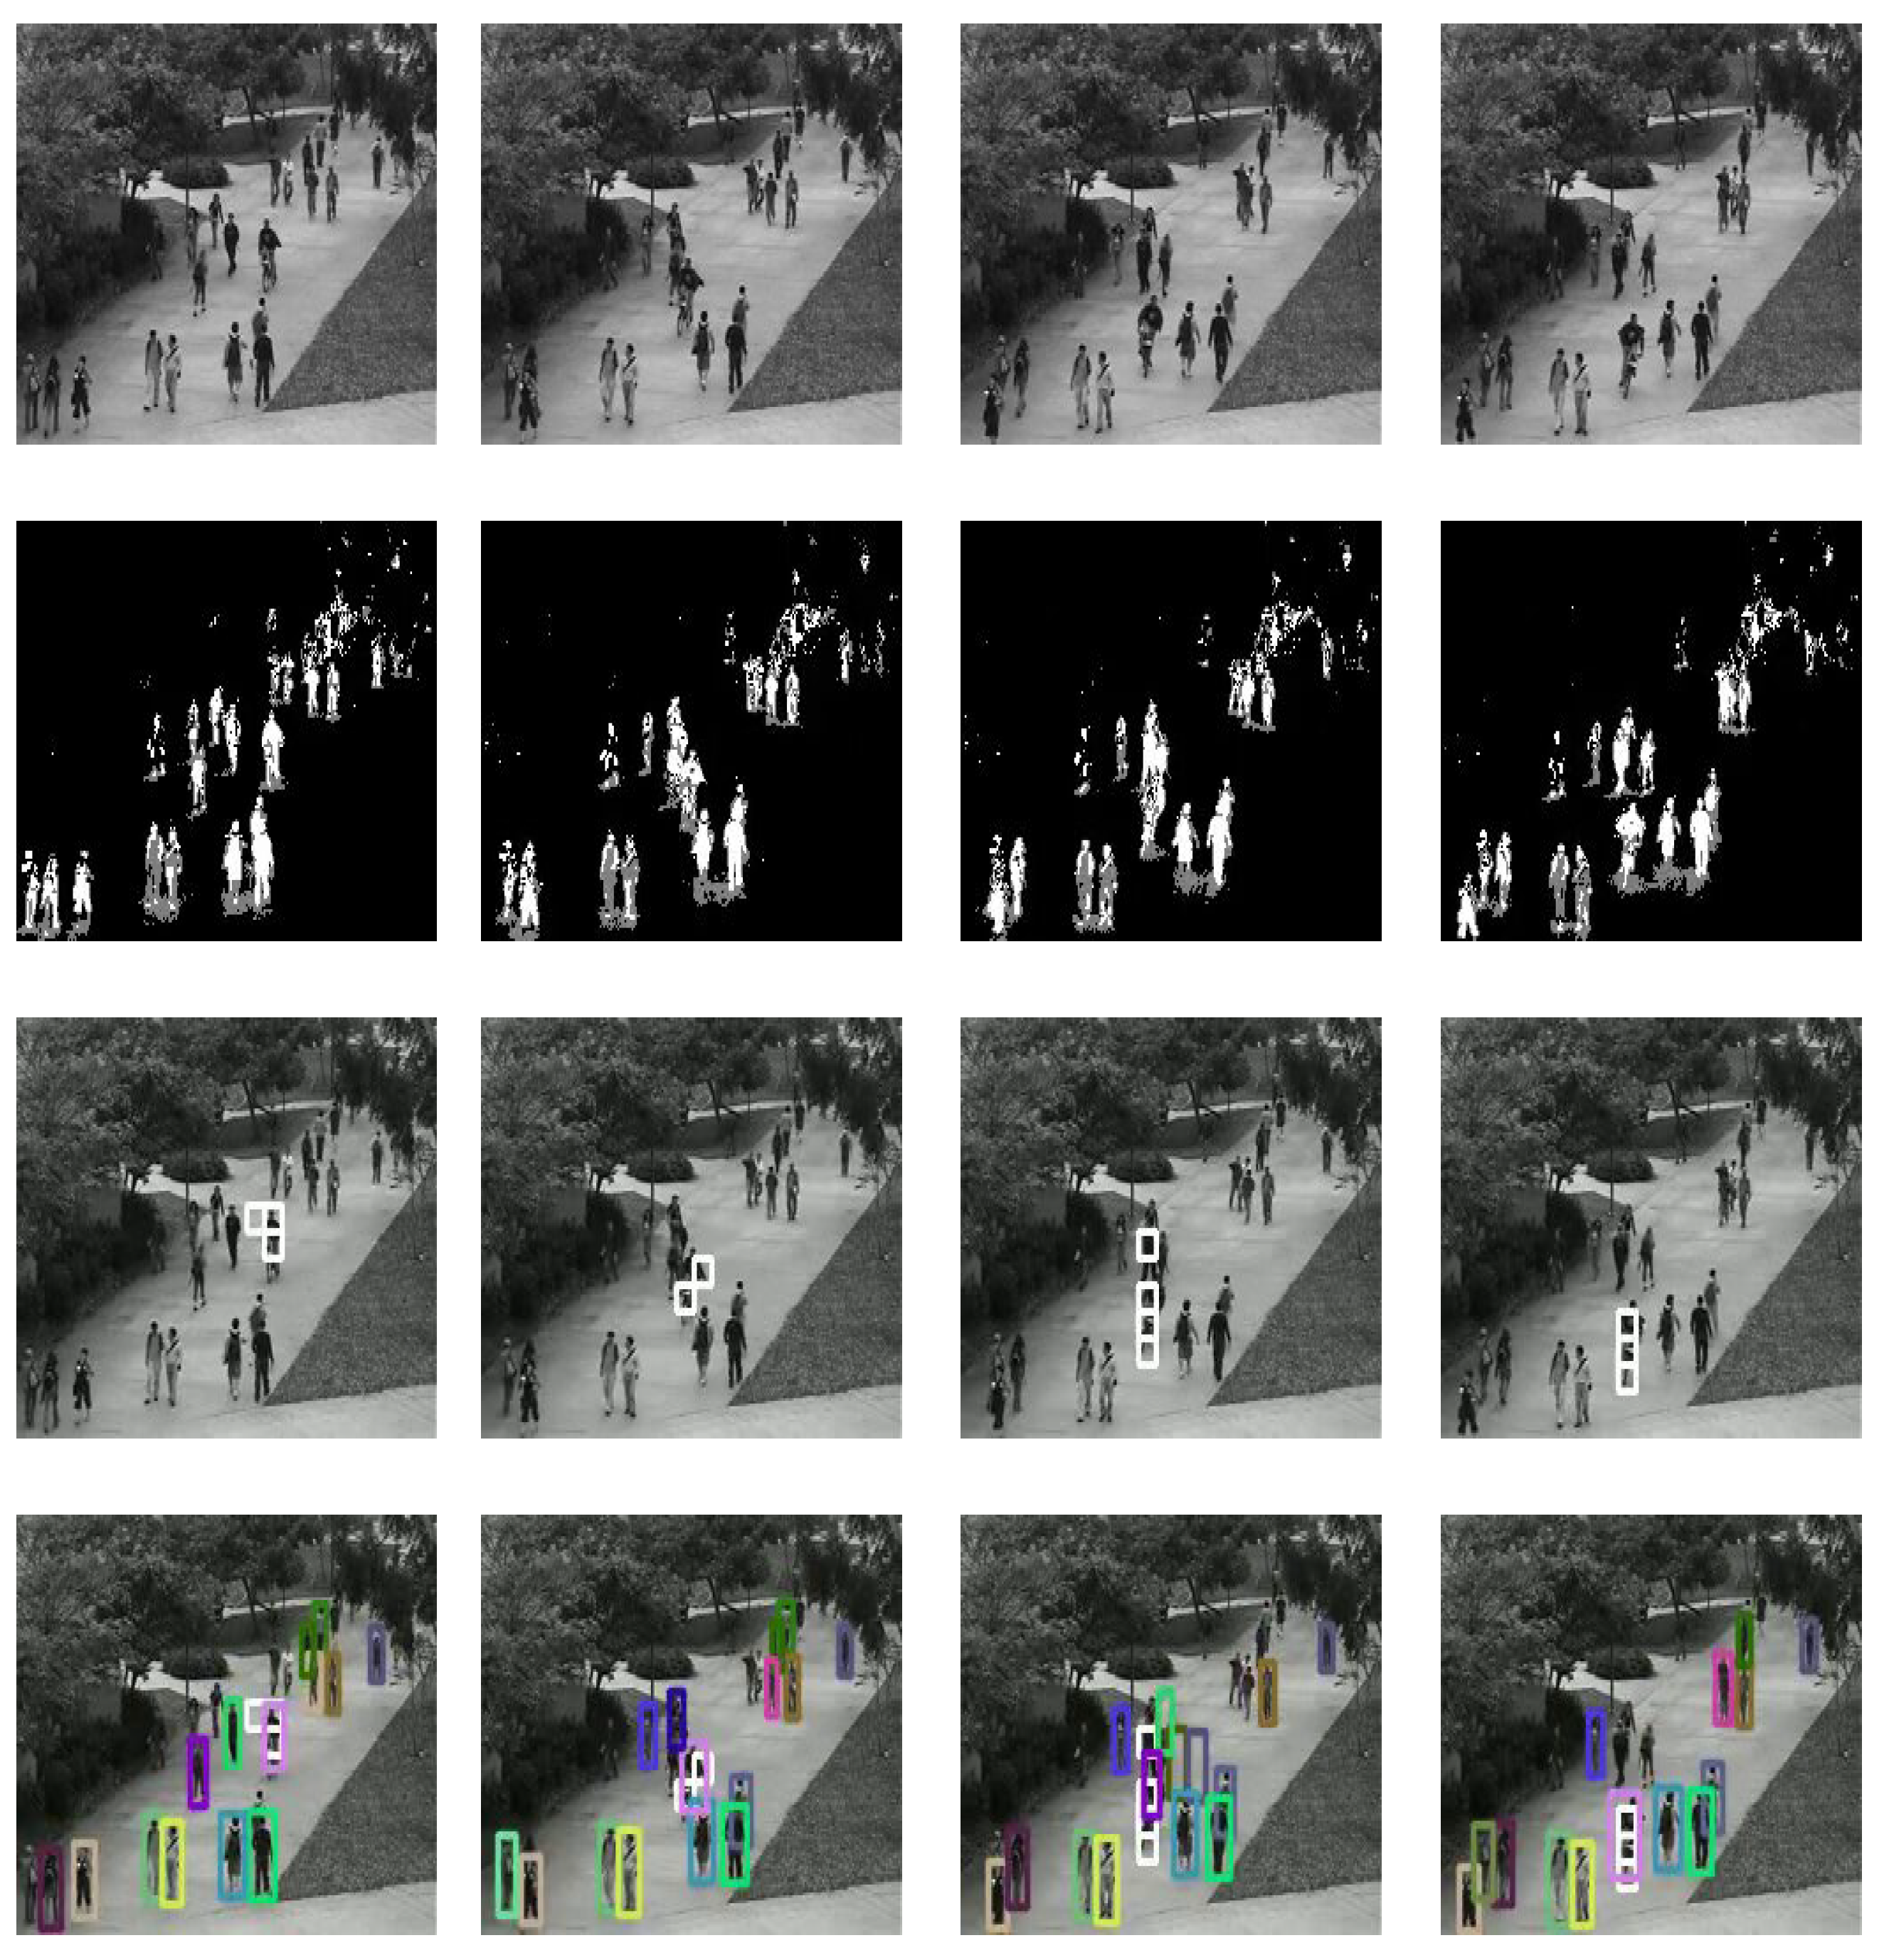
The detection and tracking of moving objects. YOLOv5 focuses on inference speed and accuracy. Considering the excellent performance of YOLOv5 in the object detection task, YOLOv5 is used as the object detection model of the network. The experimental results of YOLOv5-DeepSORT are shown in the fourth row in the
Figure 14 and
Figure 15, the fourth row presents the abnormal detection with tracking.
4.5. Qualitative and Quantitative Analysis
Qualitative analysis.Figure 14 and
Figure 15 show some of the qualitative results of the detection of abnormal scenes. The first row of
Figure 14 and
Figure 15 are the original video sequence, the second row of
Figure 14 and
Figure 15 are foreground mask of raw video frames, the third row of
Figure 14 and
Figure 15 are anomaly frames detected by the classifier and marks them with a white boxes.
Figure 14 shows a case of a truck driving on a sidewalk that the system determines as abnormal behavior.
Figure 15 shows that that a cyclist riding on the sidewalk is also considered an abnormal behavior because they are not allowed to use the sidewalk. As we can see from images in the fourth row, the scheme can track all pedestrians with high accuracy.
The scenes in the UCSD dataset are very diverse, and the people in the scenes have different body shapes and viewpoints, increasing the difficulty of the anomaly detection task. The defined anomaly measure allows us to identify multiple instances of several abnormal events that occur both individually and concurrently with other normal activities in the image. The objects causing the anomaly are marked with white boxes for identification. The experimental results demonstrate that our proposed method achieves high accuracy in classifying various scenes. It can effectively differentiate between normal pedestrian behavior and abnormal behaviors, such as those exhibited by cars, bicycles, wheelchairs, and skateboards.
Quantitative evaluation. In the field of abnormal behavior detection, the performance of method is usually qualitatively evaluated by drawing receiver operating characteristic (ROC) curves with different thresholds on anomaly scores or probabilities, and quantitatively evaluated by metrics such as recognition accuracy (ACC), area under the ROC curve (AUC), and equal error rate (EER). ROC curves use the false positive rate (FPR) as the horizontal axis and the true positive rate (TPR) as the vertical axis. The FPR refers to the probability of predicting a positive sample among all actual negative samples, while the TPR refers to the probability of predicting a positive sample among all actual positive samples. Therefore, the closer the ROC curve is to the upper left corner, the smaller the EER, and the larger the AUC, indicating better algorithm performance.
In the field of abnormal behavior detection, it is necessary to detect the time and spatial location of abnormal behaviors, which are usually evaluated at two levels: frame-level and pixel-level. In the frame-level criterion, if any pixel in a frame is detected as abnormal, the frame is considered as an abnormal frame, regardless of whether the localization of the abnormal region is accurate or not. In contrast, the pixel-level criterion takes into account the spatial localization accuracy, and only when the detected abnormal pixels exceed the threshold of the true abnormal label, is the abnormal behavior considered to have occurred.
Table 2 and
Table 3 show the AUC and EER of different anomaly detection methods on the UCSD dataset under different evaluation criteria.
As shown in
Table 2 and
Table 3, we find that our supervised methods perform much better than the existing schemes.
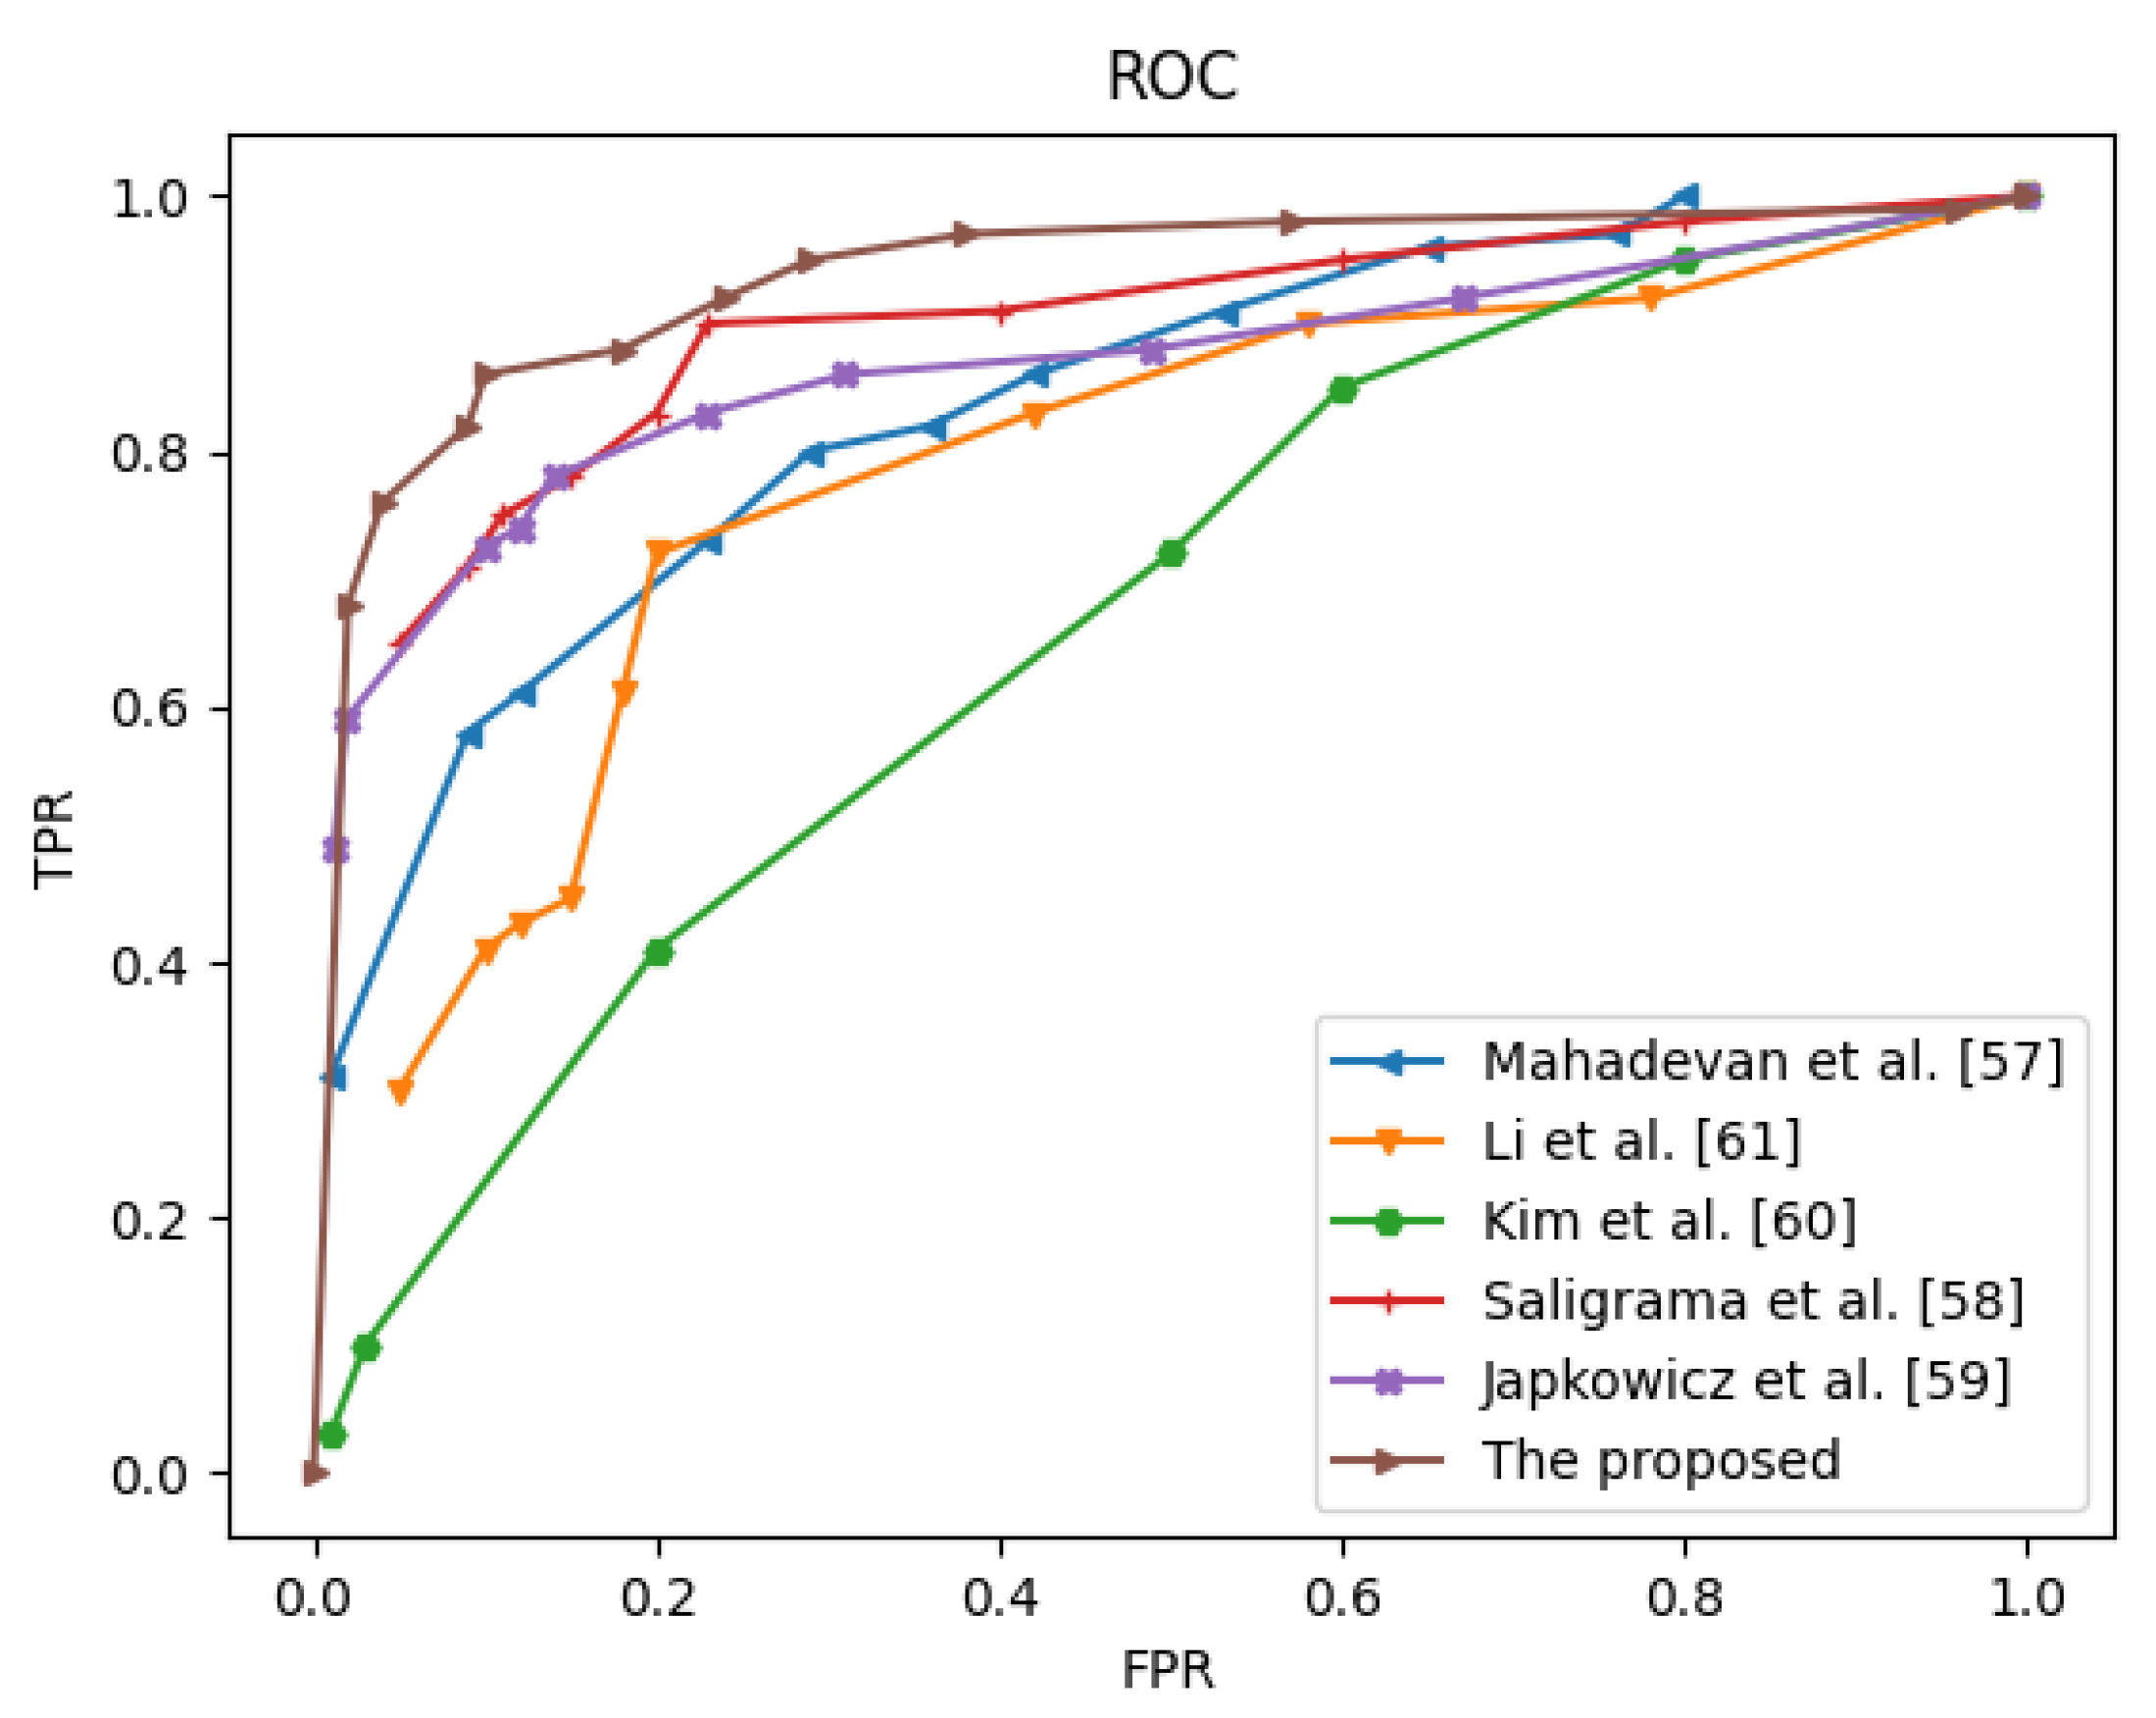
Figure 16 plots the ROC curves of the various methods for comparison. By varying the threshold parameter, we can obtain a series of anomaly detection results and their corresponding FPRs and TPRs. Thus, the ROC curve can be plotted by the series of coordinate points composed of FPRs and TPRs. The ROC curves illustrate that our method outperforms the state-of-the-art methods in [
57,
58,
59,
60,
61] in detecting anomalous events on the frame-level evaluation criteria.
On the basis of the ROC evaluation results, which reflect the accuracy of anomaly localization, our method outperforms all the comparing schemes. In addition to the ROC curves, the evaluation criteria also include two numerical indices, the AUC and EER in the frame-level, and the results are presented in
Table 2 and
Table 3. In terms of detection, the AUC values have increased, indicating that the method can locate anomalies with high accuracy. To evaluate the performance of the proposed anomaly representation, we compared it with five other recently proposed schemes [
57,
58,
59,
60,
61]. Below are the performance results compared with those of other state-of-the-art schemes.
Table 2 and
Table 3 show the comparison results of different algorithms on the UCSD Ped1 dataset at the frame level. The proposed method achieves a large frame-level AUC, which is better than those of the other comparison methods.
In [
60] is just based on temporal anomaly detector is presented. Sikdar et al. [
61] only considered the temporal and lack the spatial feature, thus, the accuracy of abnormal behavior detection is relatively low. Mahadevan et al. [
57] obtained the errors made by the different detector components because anomalies are, by definition, difficult to define a priori, and normal events are either unusual or occur in unusual scenes. The method in [
58] is simpler and requires very little parameter tuning compared with the other methods. The method’s generalization ability is relatively poor, but the problem is relatively easy to solve. As shown in
Figure 16 , we find that our supervised methods perform much better than the existing unsupervised schemes.
Figure 1.
According to CBS New York (1, 2, 3), a red swerves onto the sidewalk, it is a threat to public safety. According to WSAZ News Channel 3 (4, 5), a car collided with pedestrians on the sidewalk and caught fire, causing injuries. According to The Press Democral (6), a vehicle drove onto the sidewalk and hit people.
Figure 2.
The flowchart of abnormal behavior detection and localization.
Figure 2.
The flowchart of abnormal behavior detection and localization.
Figure 3.
Flowchart of the improved YOLACT architecture.
Figure 3.
Flowchart of the improved YOLACT architecture.
Figure 4.
Foreground mask extraction process via AGMM.
Figure 4.
Foreground mask extraction process via AGMM.
Figure 5.
Flowchart of PWC-Net architecture.
Figure 5.
Flowchart of PWC-Net architecture.
Figure 6.
Examples of Ped1 dataset on UCSD.
Figure 6.
Examples of Ped1 dataset on UCSD.
Figure 7.
Foreground mask results display.
Figure 7.
Foreground mask results display.
Figure 8.
Display of the extracted foreground maps from video frames.
Figure 8.
Display of the extracted foreground maps from video frames.
Figure 9.
Comparison of object extraction results using YOLACT and AGMM.
Figure 9.
Comparison of object extraction results using YOLACT and AGMM.
Figure 10.
PWC-Net results on the UCSC dataset.
Figure 10.
PWC-Net results on the UCSC dataset.
Figure 11.
Abnormal samples on UCSD dataset.
Figure 11.
Abnormal samples on UCSD dataset.
Figure 12.
Displaying samples and their corresponding ground truth.
Figure 12.
Displaying samples and their corresponding ground truth.
Figure 13.
Abnormal behavior is marked with a white box. A. Normal video frame. B. Abnormal behavior detection with white box at time t. C. Abnormal behavior detection with white box at time .
Figure 13.
Abnormal behavior is marked with a white box. A. Normal video frame. B. Abnormal behavior detection with white box at time t. C. Abnormal behavior detection with white box at time .
Figure 14.
Example1 : Experimental results of the proposed method.
Figure 14.
Example1 : Experimental results of the proposed method.
Figure 15.
Example2 : Experimental results of the proposed method.
Figure 15.
Example2 : Experimental results of the proposed method.
Figure 16.
ROC curves of frame-level on Ped1.
Figure 16.
ROC curves of frame-level on Ped1.
Table 1.
DeepSORT parameters setting.
Table 1.
DeepSORT parameters setting.
| DeepSORT parameters |
Weight |
| MAX-DIST |
0.2 |
| MIN-CONFIDENCE |
0.3 |
| NMS-MAX-OVERLAP |
0.5 |
| MAX-IOU-DISTANCE |
0.7 |
| MAX-AGE |
70 |
| N-INIT |
3 |
| NN-BUDGET |
100 |
Table 2.
Frame-level performance comparison of different methods on UCSD Ped1.
Table 2.
Frame-level performance comparison of different methods on UCSD Ped1.
| Methods |
[39] |
[18] |
[19] |
[20] |
[22] |
[21] |
[23] |
Ours |
| AUC |
085 |
0.916 |
0.85 |
0.895 |
0.974 |
null |
0.8382 |
0.9616 |
| EER |
0.24 |
0.148 |
0.20 |
null |
8 |
0.143 |
0.223 |
0.15 |
Table 3.
Pixel-level performance comparison of different methods on UCSD Ped1.
Table 3.
Pixel-level performance comparison of different methods on UCSD Ped1.
| Methods |
[39] |
[18] |
[19] |
[20] |
[22] |
[21] |
[23] |
Ours |
| AUC |
0.87 |
0.687 |
0.726 |
null |
0.703 |
0.9425 |
null |
0.8959 |
| EER |
null |
0.357 |
null |
null |
0.35 |
null |
null |
0.39 |
