Submitted:
23 May 2023
Posted:
23 May 2023
You are already at the latest version
Abstract
Keywords:
1. Introduction
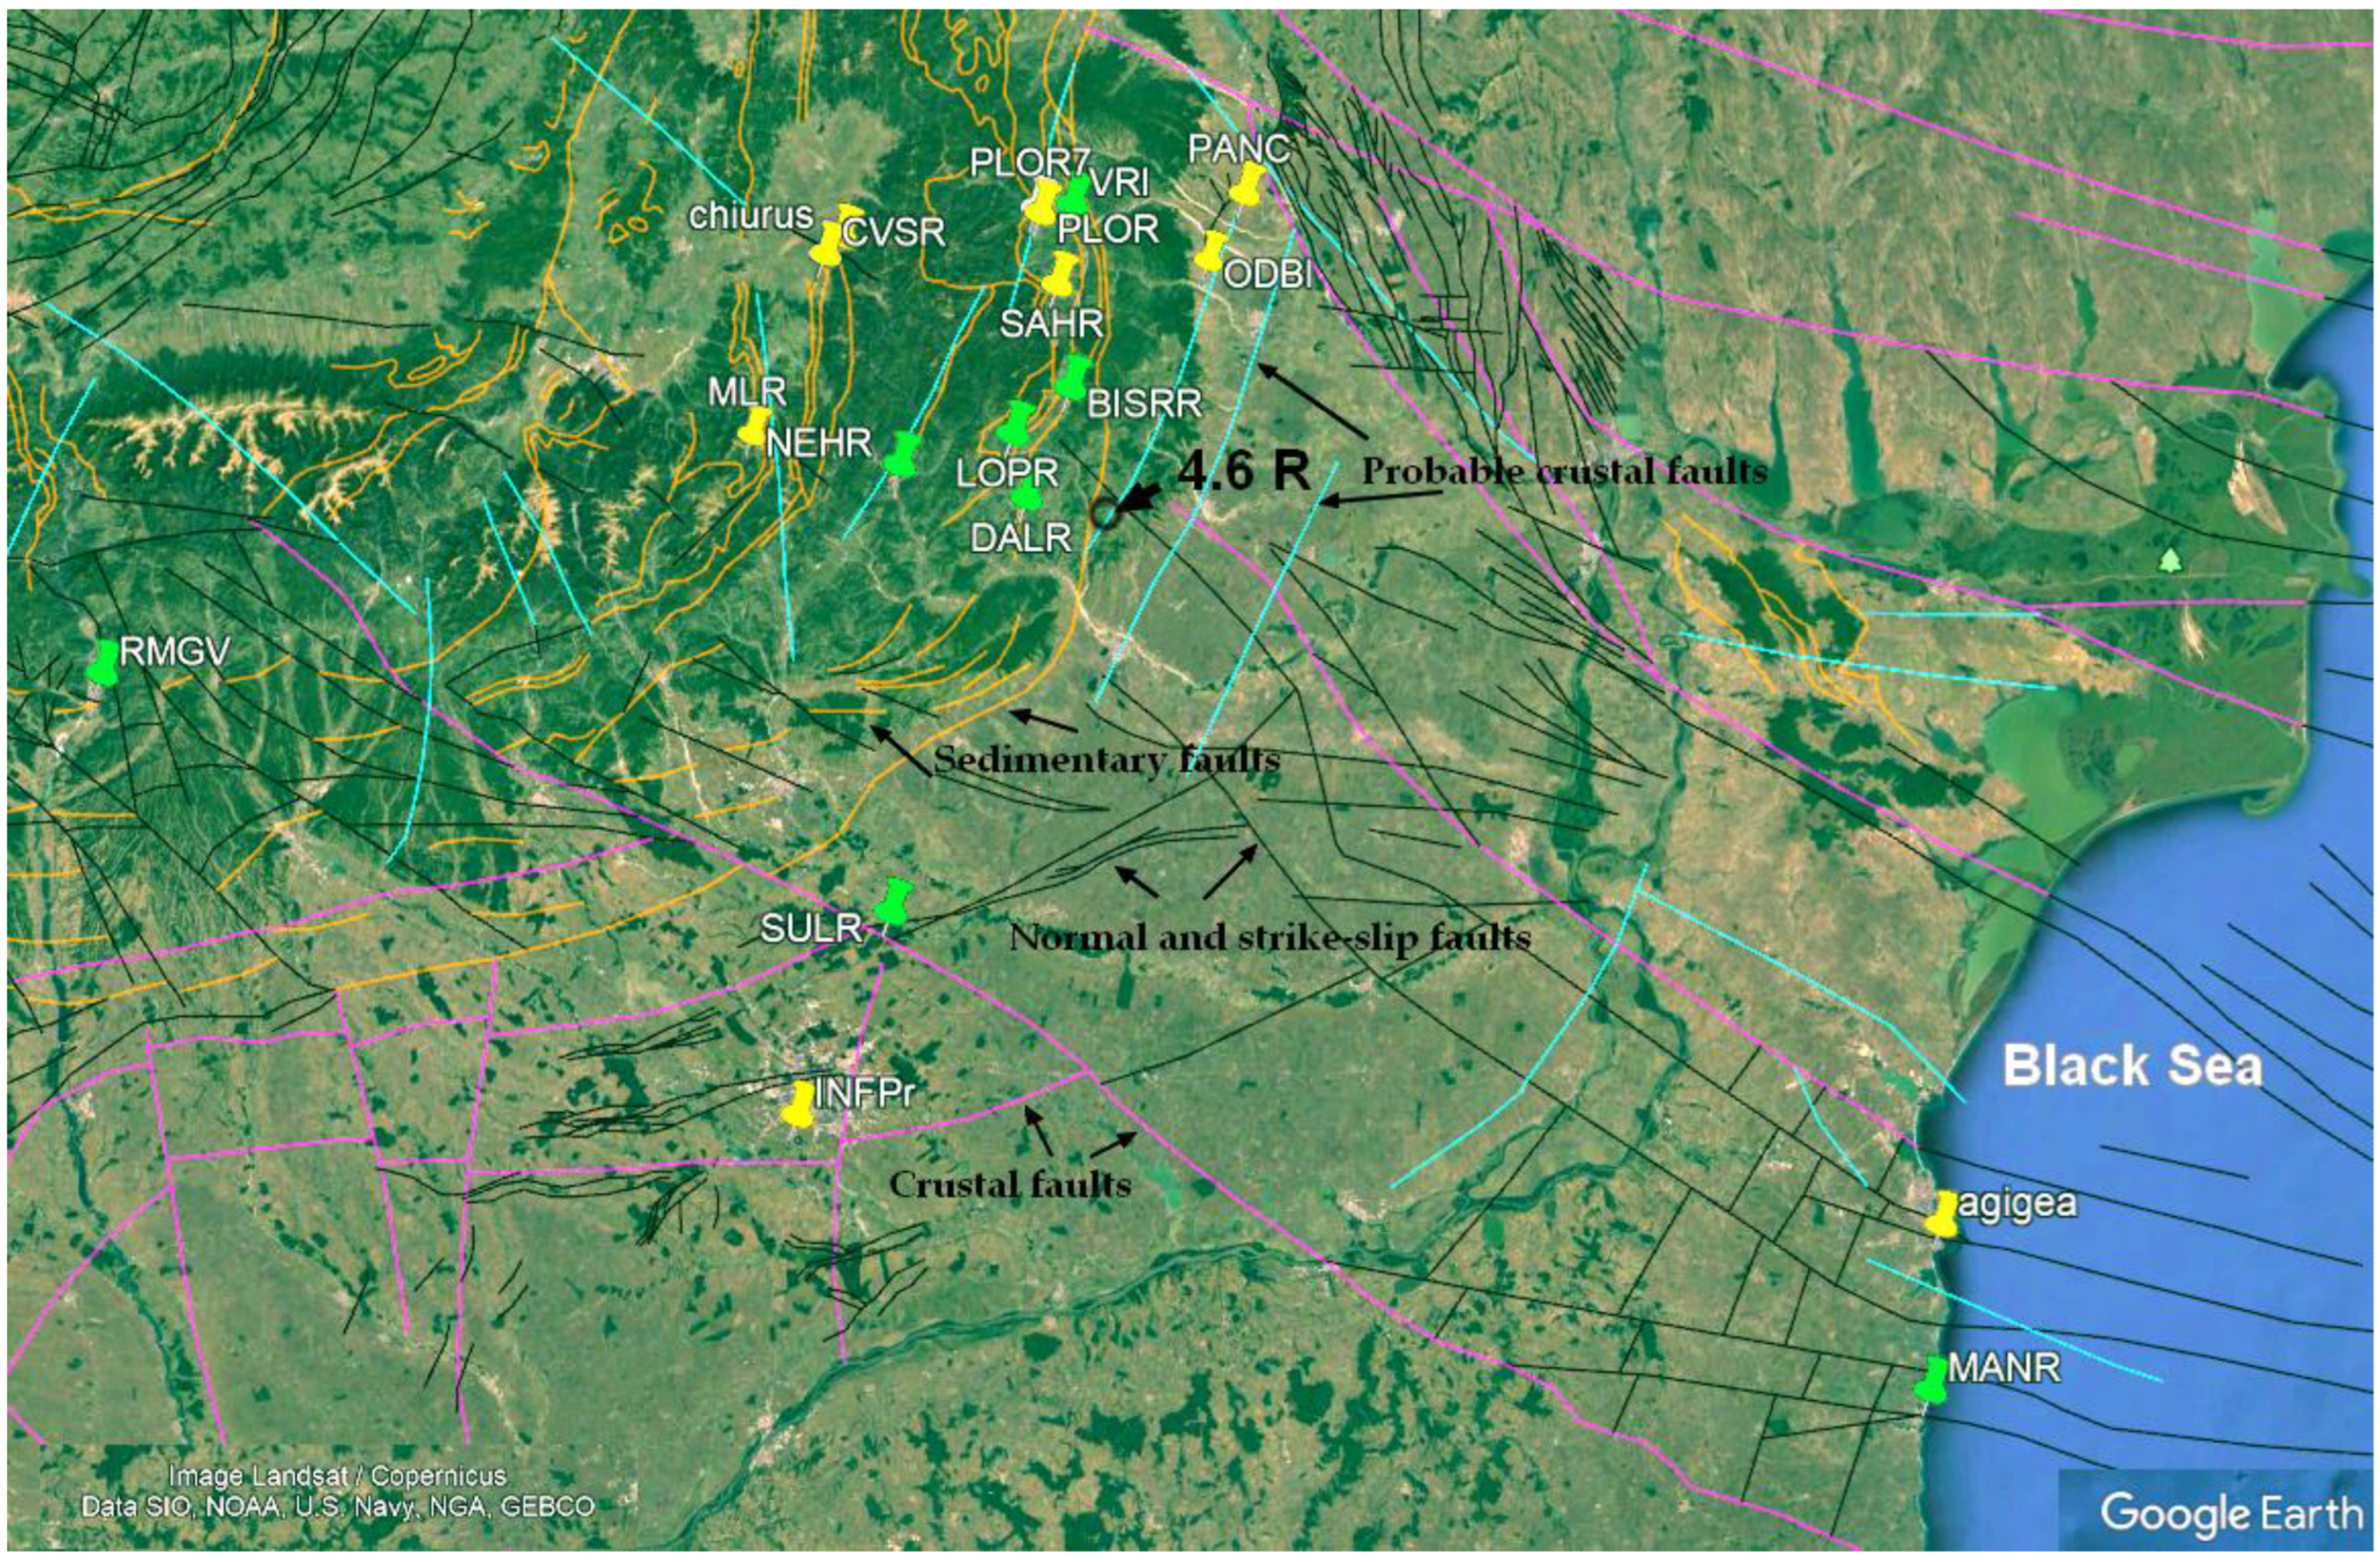
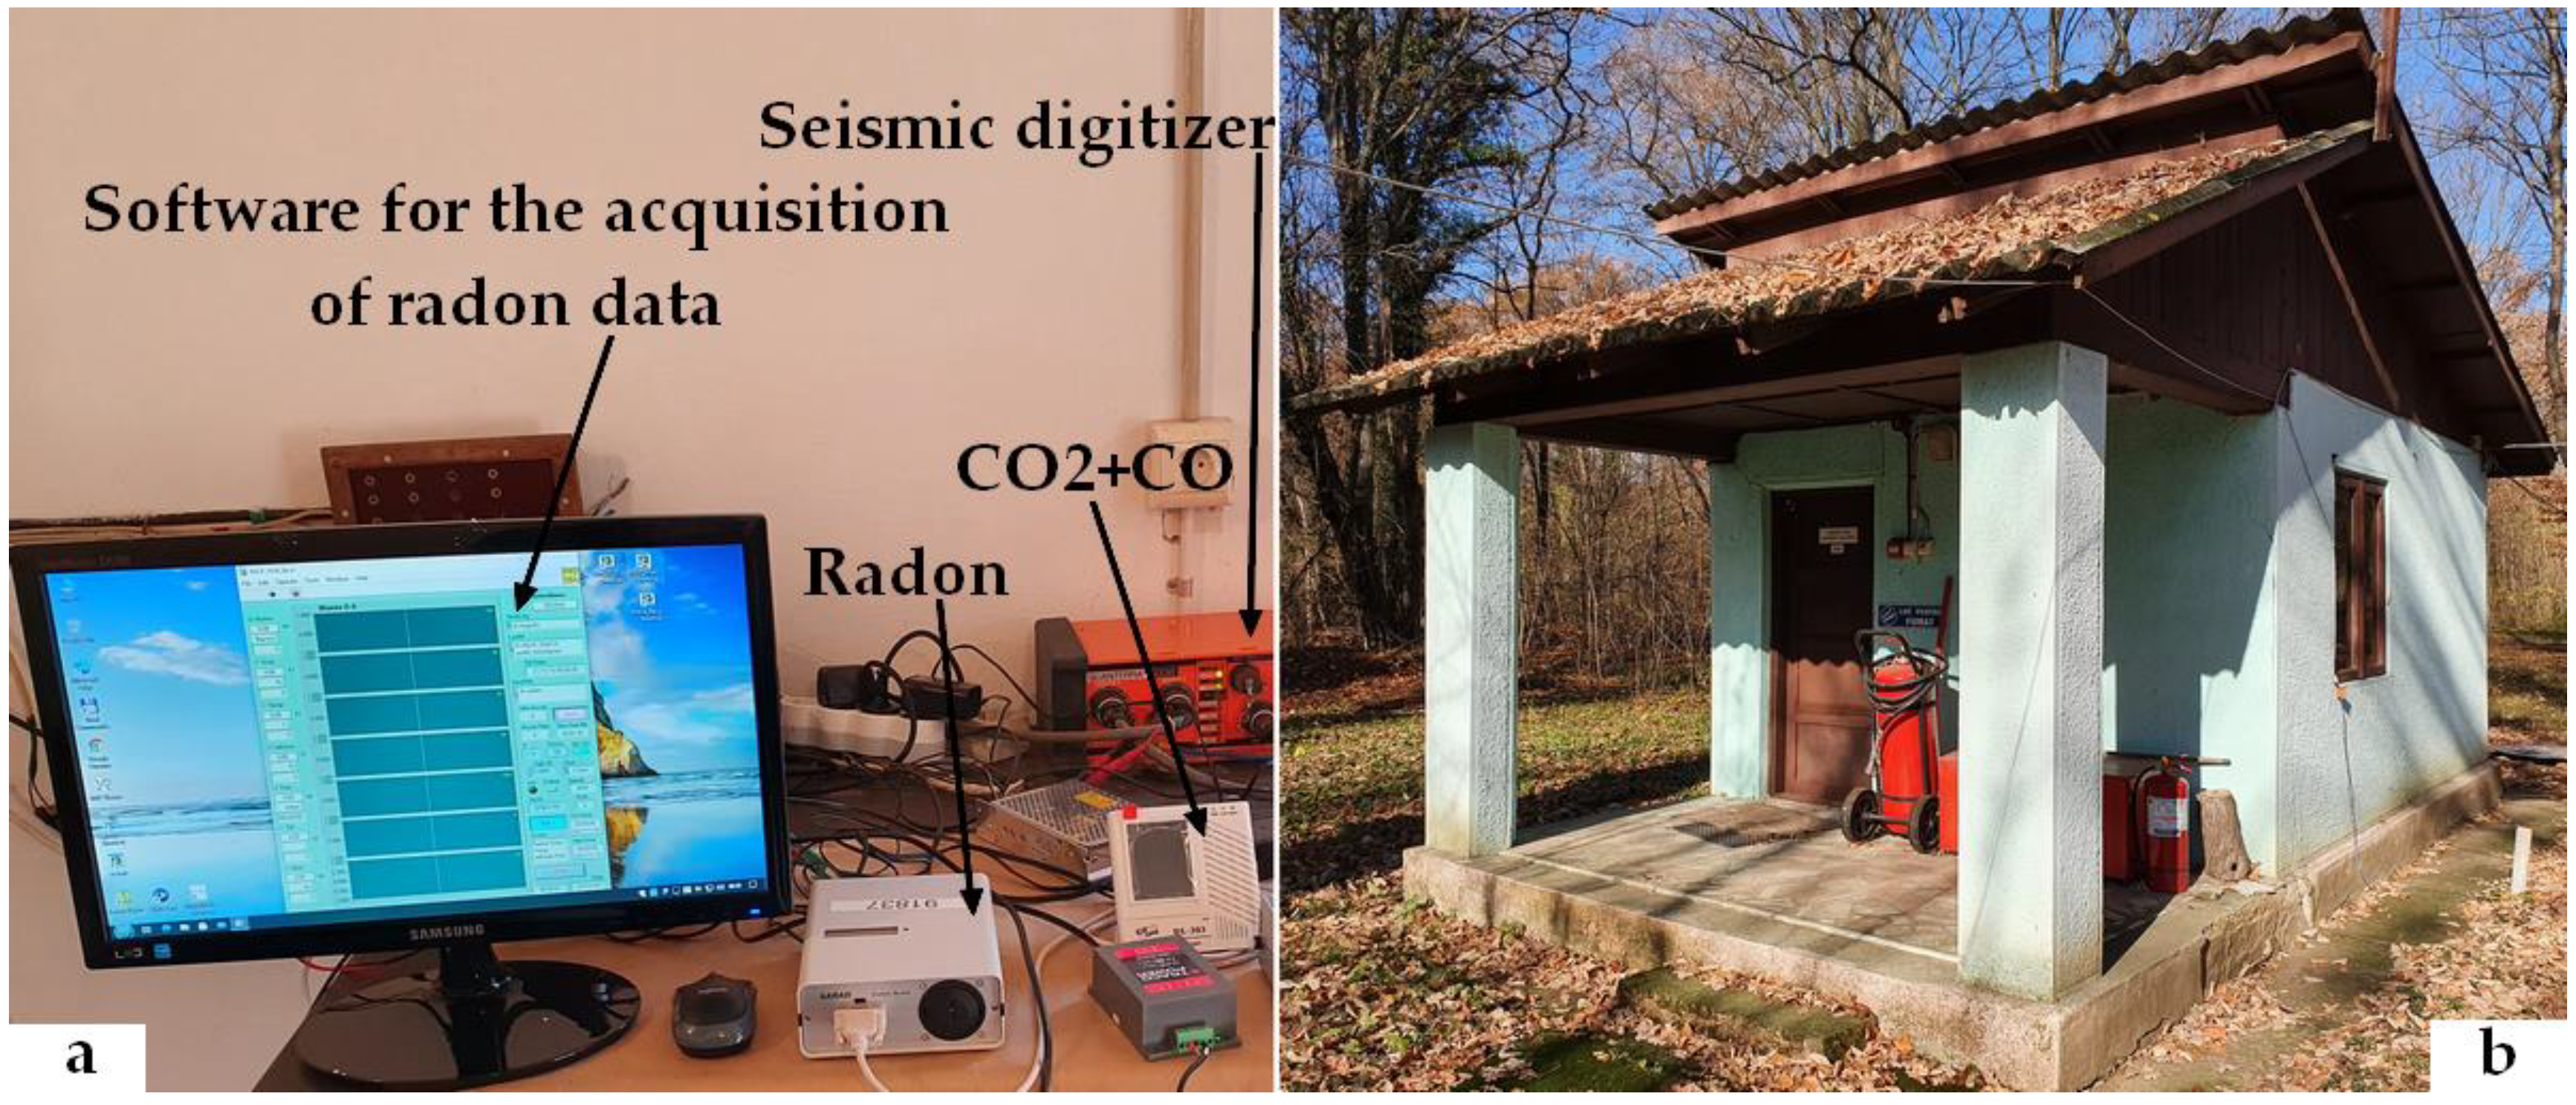
2. The new Radon and CO2 Monitoring Network
| Station | Location | Equipment | North | East | Description | Start | End |
|---|---|---|---|---|---|---|---|
| agigea | Agigea | RADONSCOUT | 44.0838 | 28.6412 | Agigea, radon | 14/08/31 | 14/09/05 |
| chiurus | Chiurus | RADONSCOUT | 45.8233 | 26.1646 | Chiurus, radon | 14/09/18 | 14/09/18 |
| INFPr | Magurele | RADONSCOUT | 44.3479 | 26.0281 | INFP radon | 14/09/12 | 14/09/15 |
| MLRdd | Muntele Rosu | RADONSCOUT | 45.4909 | 25.9450 | MLR, radon | 15/11/02 | 17/03/22 |
| ODBIdd | Odobesti | RADONSCOUT | 45.7633 | 27.0558 | Odbi, radon | 14/10/24 | 15/08/04 |
| PLRdd1 | Plostina 4 | RADONSCOUT | 45.8512 | 26.6498 | PLOR1, radon | 17/08/01 | 17/11/28 |
| PLRdd2 | Plostina 4 | RADONSCOUT | 45.8512 | 26.6498 | PLOR1, radon | 17/11/28 | _ |
| BISRdd | Bisoca | RADONSCOUTp | 45.5481 | 26.7099 | Bisc, radon | 14/10/22 | 21/05/20 |
| BISRAERd | Bisoca | AERC | 45.5481 | 26.7099 | Biscoca, radon | 21/02/25 | |
| DLMdd | Dalma | RADONSCOUTp | 45.3629 | 26.5965 | Dalma, radon | 22/07/04 | _ |
| LOPRdd | Lopatari | RADONSCOUTp | 45.4738 | 26.5680 | Mocearu, radon | 15/08/06 | _ |
| MNGdd | Mangalia | RADONSCOUTp | 43.8168 | 28.5876 | Mangalia, radon | 21/10/20 | 22/04/14 |
| NEHRdd | Nehoiu | RADONSCOUTp | 45.4272 | 26.2952 | NEHR, radon | 15/08/06 | _ |
| PANCdd | Panciu | RADONSCOUTp | 45.8723 | 27.1477 | PANC, radon | 21/09/29 | _ |
| RMGVdd | Râmnicu Vâlcea | RADONSCOUTp | 45.1075 | 24.3770 | Electrovalcea, radon | 20/08/22 | _ |
| SAHRdd | Sahastru | RADONSCOUTp | 45.7266 | 26.6854 | SAHR, radon | 21/05/20 | _ |
| SURLdd | Surlari | RADONSCOUTp | 44.6777 | 26.2526 | Surlari, radon | 21/11/10 | _ |
| VRIdd | Vrancioaia | RADONSCOUTp | 45.8657 | 26.7277 | Vri, radon | 14/10/23 | 20/07/21 |
| Station | Mean Bq/mc |
2SD | Max Bq/mc |
Radon - Max Time (year/month/day) |
Mean T(C) |
Max/ Min T(C) |
Time Interval (year/month/day) |
|
|---|---|---|---|---|---|---|---|---|
| BISRAERd | 70.1835 | 104.1120 | 500.0 | 2020/09/28 | 17.0133 | 29.0/-1.5 | 20/01/01 | 20/12/31 |
| BISRAERd | 55.4286 | 86.2253 | 498.0 | 2021/09/21 | 15.5043 | 29.0/+1.5 | 21/01/01 | 21/12/31 |
| BISRAERd | 74.3684 | 114.6245 | 432.0 | 2022/08/04 | 16.1838 | 29.0/ -0.5 | 22/01/01 | 22/12/31 |
| DLMdd | 50.1785 | 82.1935 | 321.0 | 2022/10/18 | 15.1580 | 26.5/ +1.0 | 22/07/04 | 23/03/12 |
| LOPRdd | 9.5060 | 14.3086 | 51.0 | 2020/10/02 | 16.9339 | 39.5/-3.0 | 20/01/01 | 20/12/31 |
| LOPRdd | 8.6471 | 12.3745 | 40.0 | 2021/06/26 | 16.2484 | 43.5/ -1.0 | 21/01/01 | 21/12/31 |
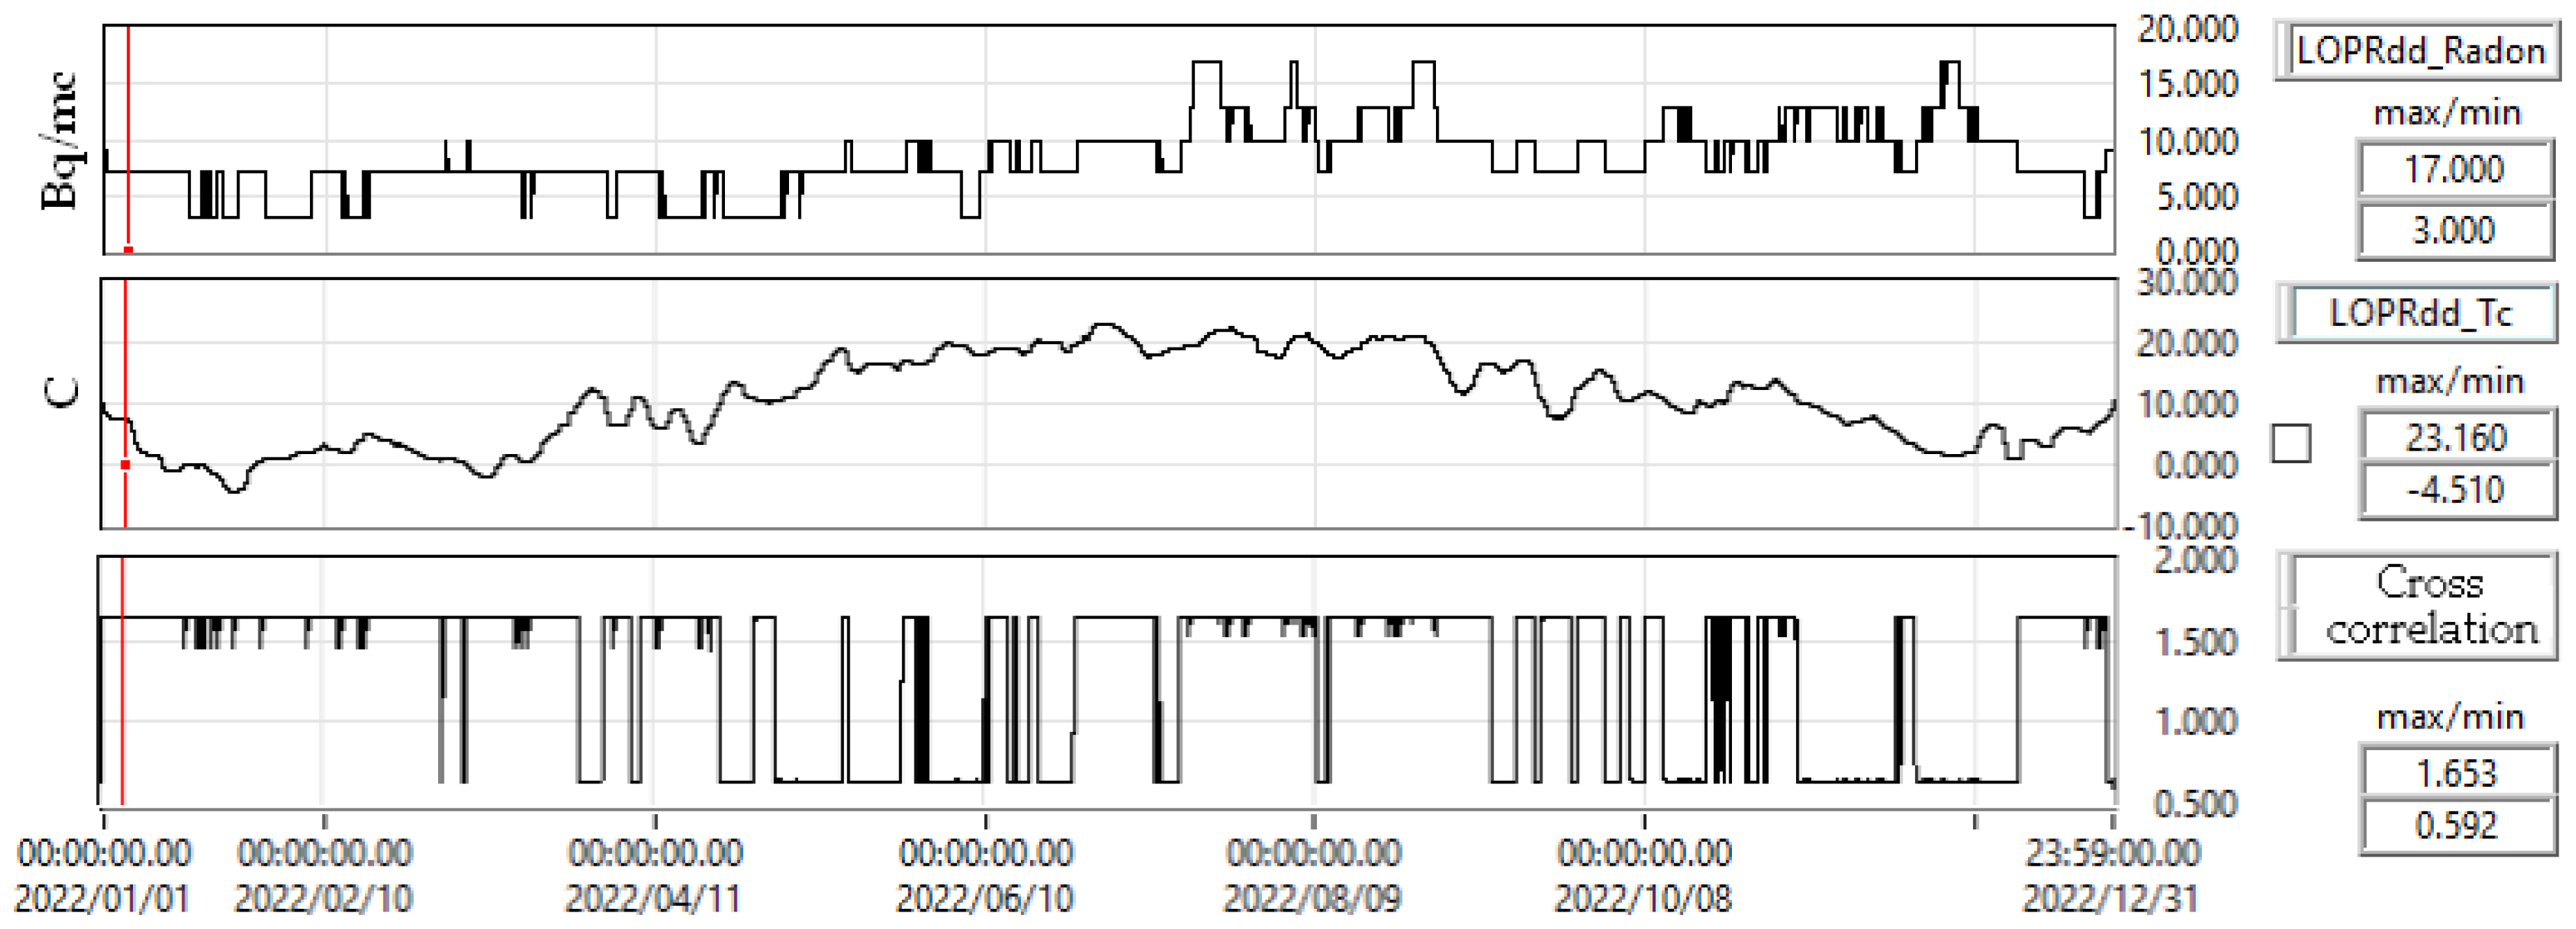
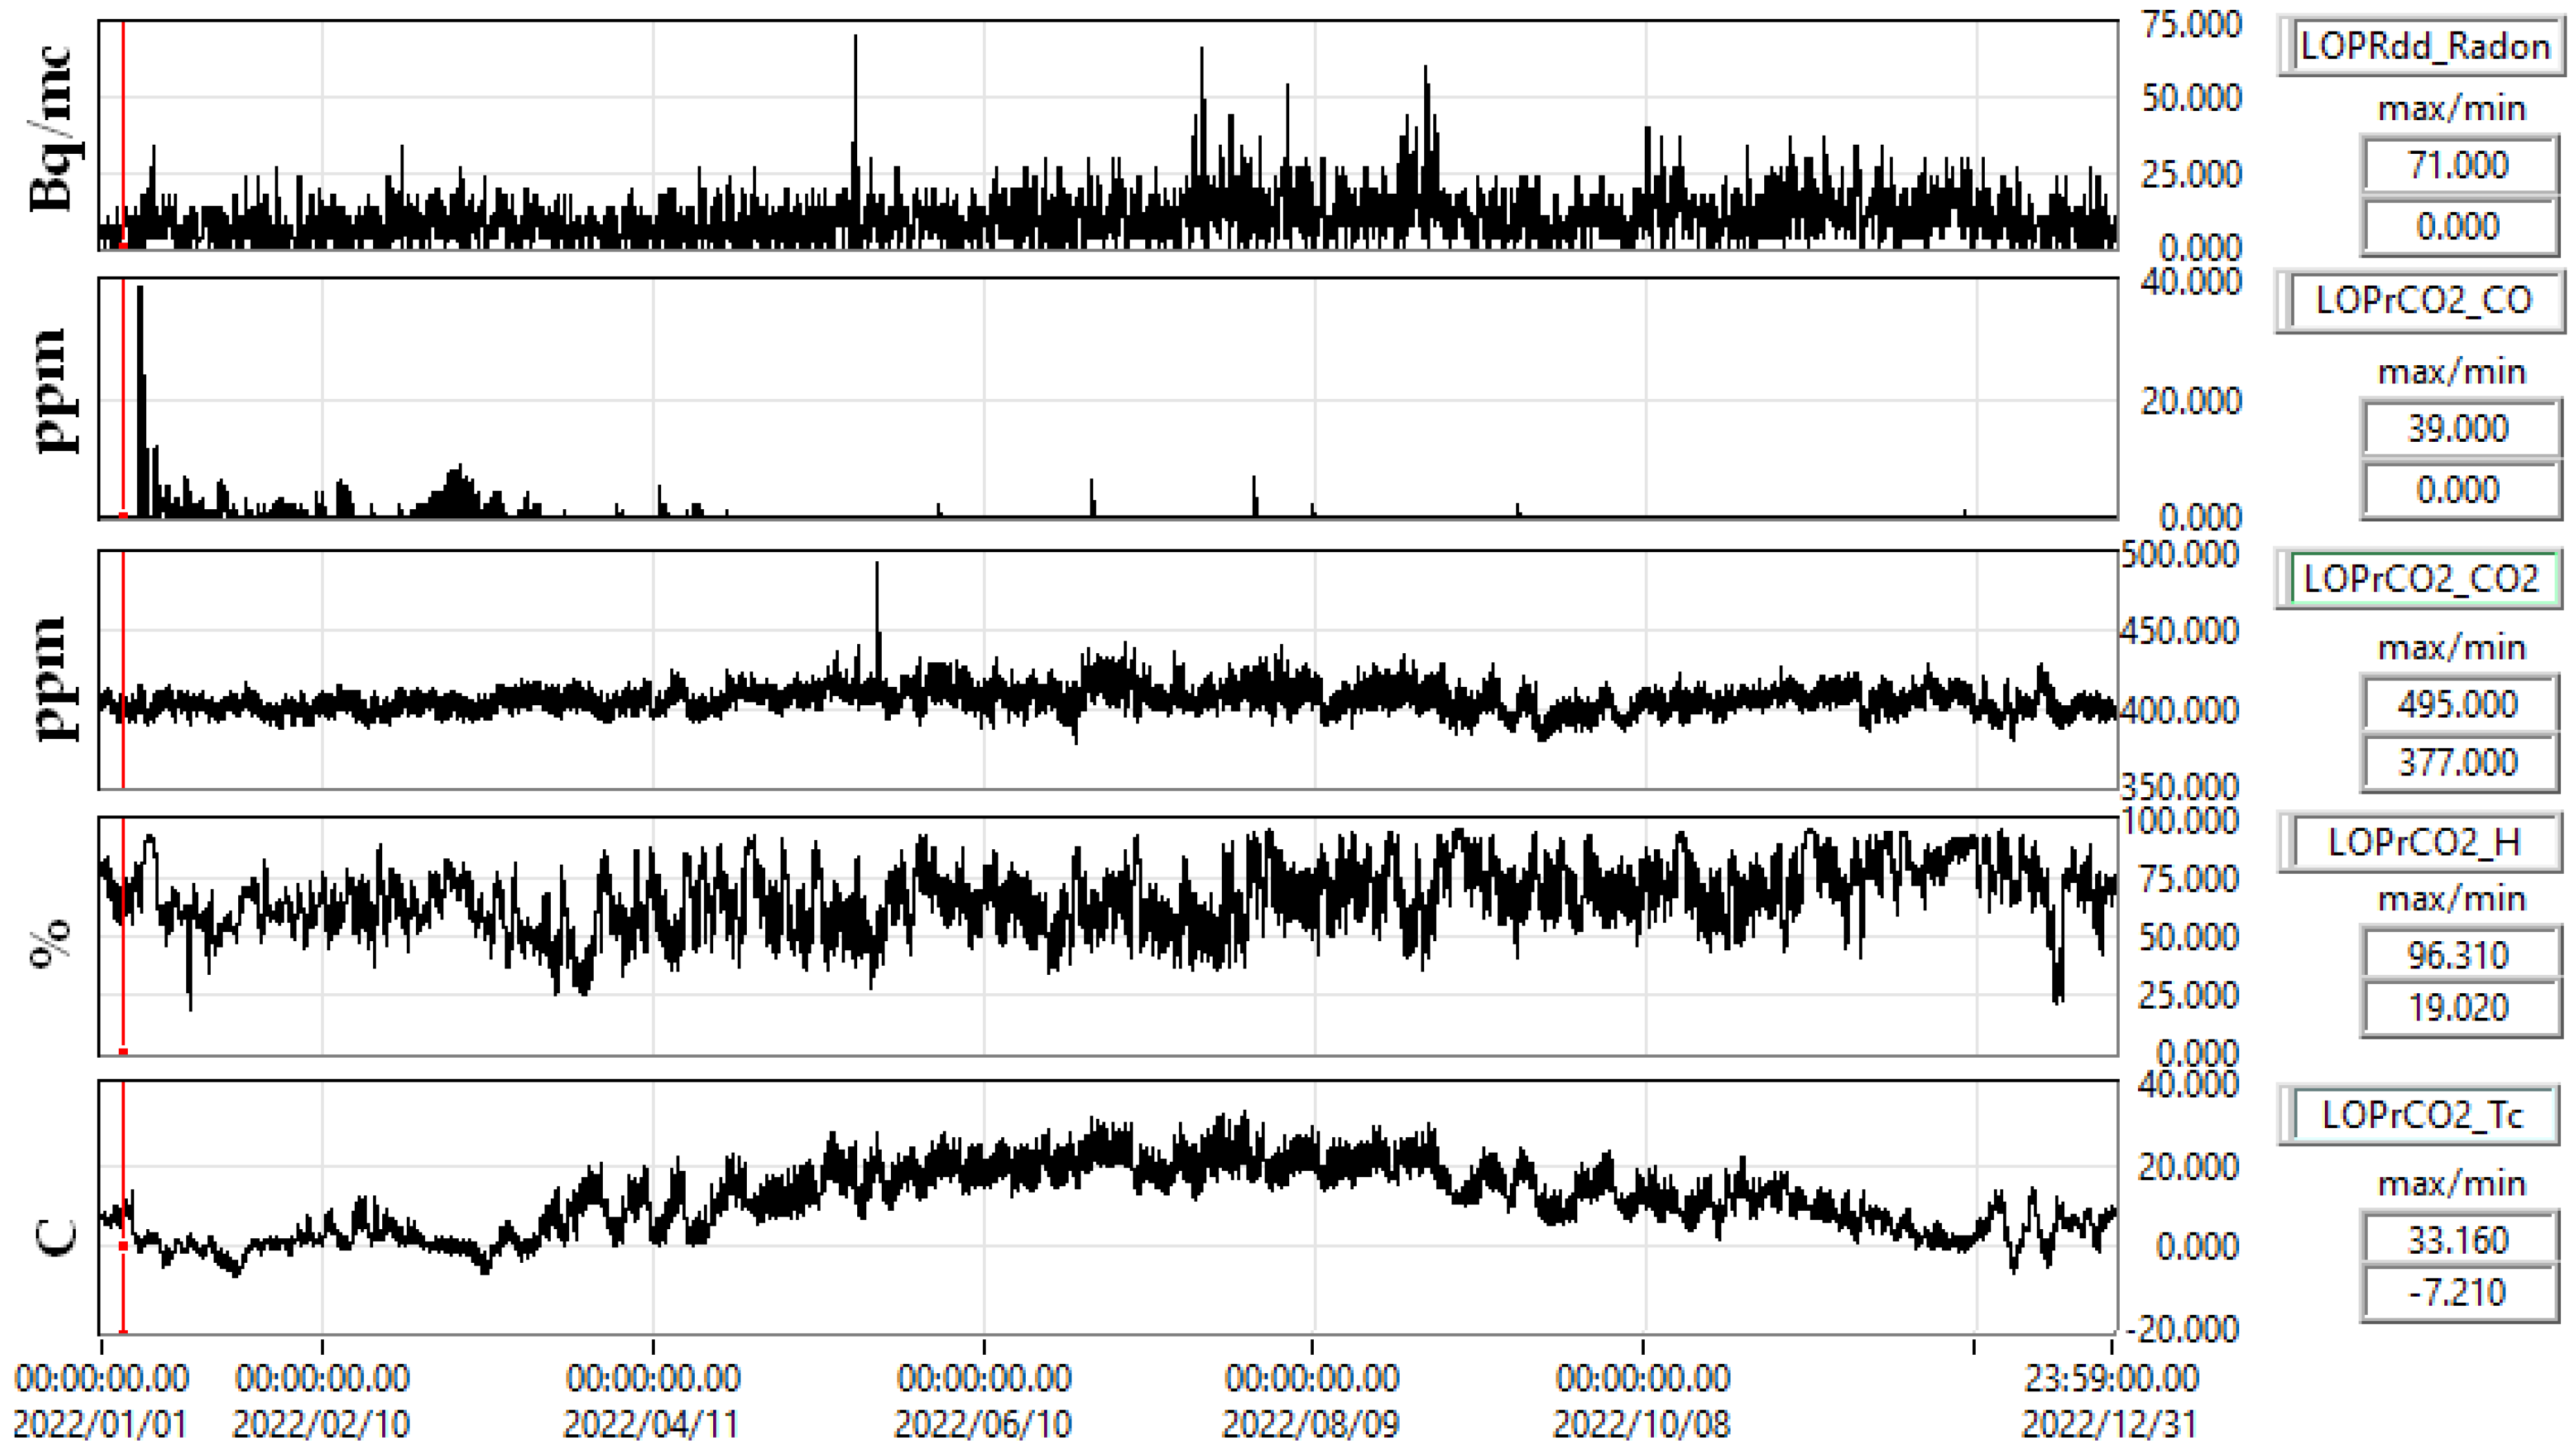
| LOPRdd | 9.1671 | 15.1524 | 71.0 | 2022/05/17 | 14.7775 | 36.5/-1.0 | 22/01/01 | 22/12/31 |
| PLRdd2 | 54.0582 | 66.8106 | 607.0 | 2020/06/18 | 11.5113 | 26.5/-1.0 | 20/01/01 | 20/12/31 |
| PLRdd2 | 51.3739 | 84.3485 | 1068.0 | 2021/12/12 | 10.4853 | 26.5/-2.5 | 21/01/01 | 21/12/31 |
| PLRdd2 | 57.0862 | 135.1785 | 1077.0 | 2022/09/04, 2022/09/05 | 11.2713 | 26.5/-1.0 | 22/01/01 | 22/12/31 |
| MLRdd | 518.3502 | 1090.3606 | 3230.0 | 2016/07/20 | 7.0435 | 8.5/+5.5 | 16/01/01 | 16/12/31 |
| NEHRdd | 17.1800 | 22.7589 | 75.0 | 2020/12/08 | 16.7921 | 37.5/-0.5 | 20/01/01 | 20/12/31 |
| NEHRdd | 17.9657 | 24.0877 | 71.0 | 2021/10/15 | 15.5227 | 36.5/-0.5 | 21/01/01 | 21/12/31 |
| NEHRdd | 18.0120 | 23.9987 | 71.0 | 2022/09/09 | 16.1370 | 38.5/-4.5 | 22/01/01 | 22/12/31 |
| PANCdd | 73.5889 | 216.1618 | 681.0 | 2022/12/10 | 13.2224 | 35.5/-7.0 | 22/01/01 | 22/12/31 |
| RMGVdd | 25.1879 | 26.0728 | 122.0 | 2021/06/18 | 12.3352 | 35.0/-6.5 | 21/10/20 | 22/04/14 |
| RMGVdd | 28.0030 | 25.2148 | 90.0000 | 2022/08/16, 2022/11/17 | 12.8718 | 35.0/-7.0 | 22/01/01 | 22/12/31 |
| SAHRdd | 87.4349 | 137.4242 | 413.0000 | 2022/07/29, 2022/08/18 | 20.4269 | 41.0/+2.5 | 22/01/01 | 22/12/31 |
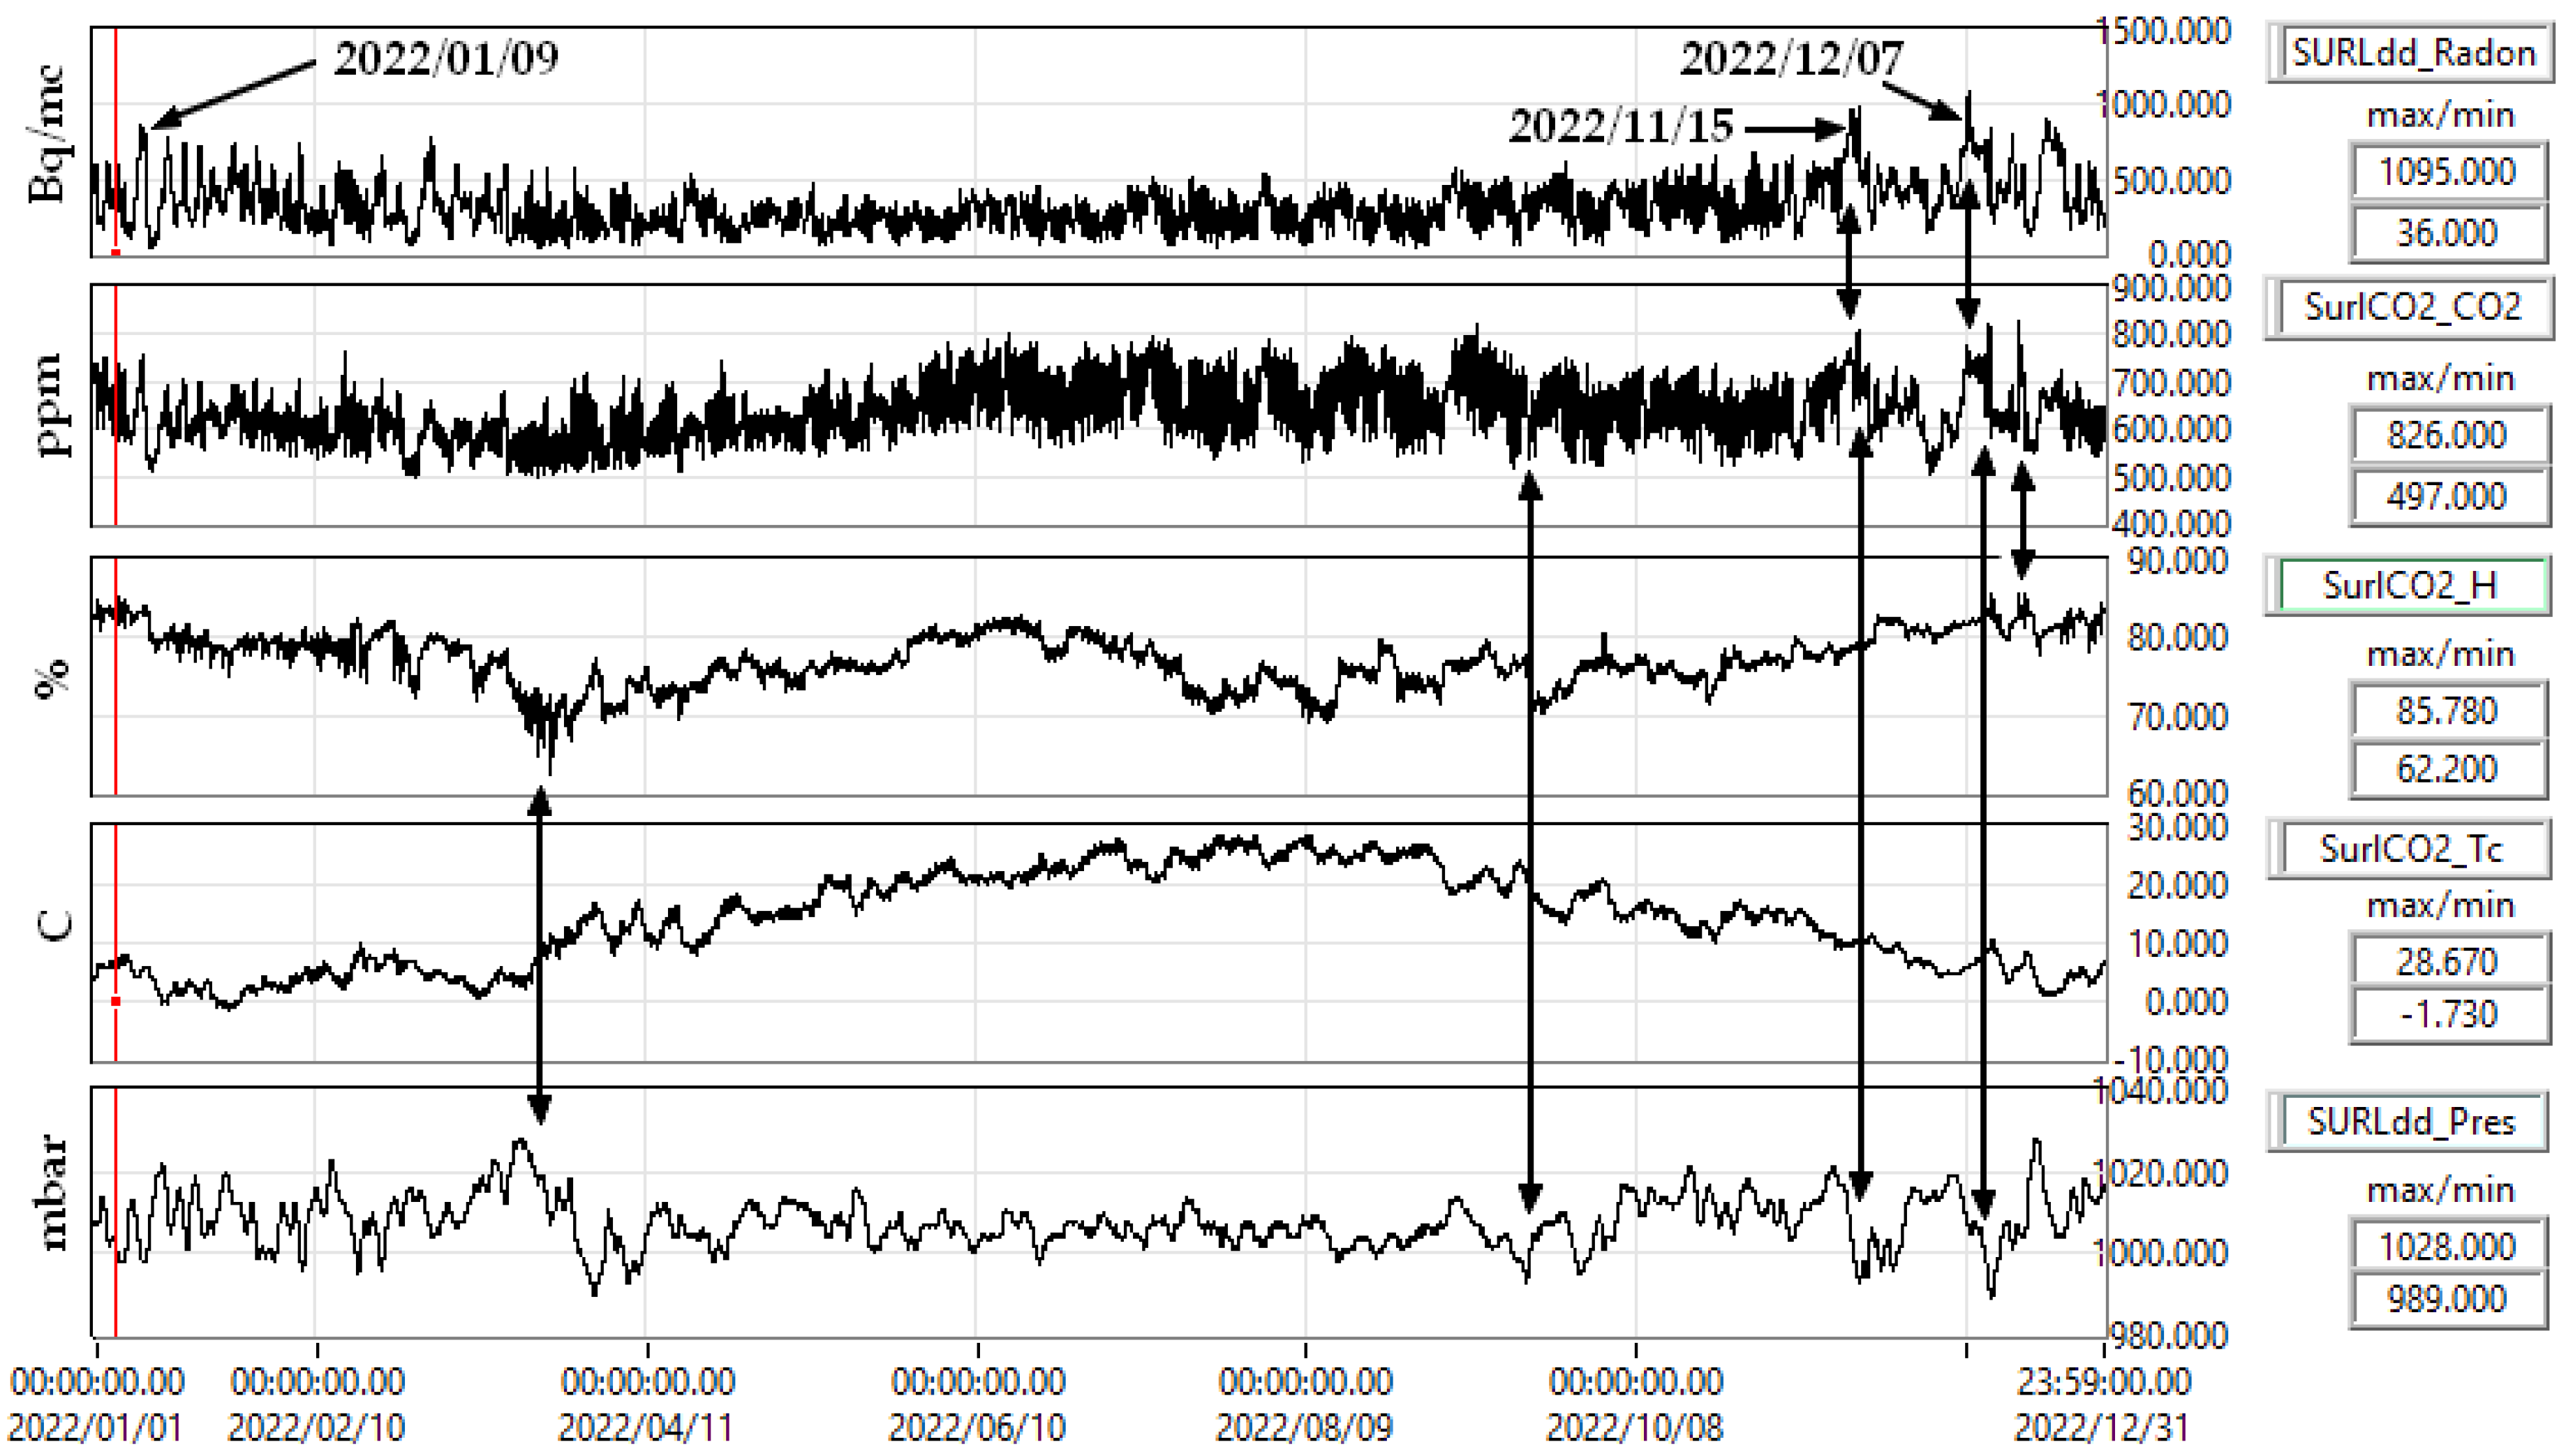
| SURLdd | 316.9367 | 320.4041 | 1095.0000 | 2022/12/07 | 13.8398 | 28.0/-1.5 | 22/01/01 | 22/12/31 |
| VRIdd | 148.8226 | 157.1080 | 413.0000 | 2018/01/25 | 14.7503 | 26.0/-3.0 | 18/01/01 | 18/12/31 |
| VRIdd | 165.6702 | 219.5496 | 622.0000 | 2019/12/05 | 15.7668 | 29.5/+0.5 | 19/01/01 | 19/12/31 |
| VRIdd | 202.7971 | 240.1850 | 642.0000 | 2020/01/07 | 15.3096 | 28.5/+3.0 | 20/01/01 | 20/07/21 |
| agigea | 55.3043 | 51.5058 | 115.0000 | 2014/09/01 | 21.2522 | 22.5/21.0 | 14/08/31 | 14/09/05 |
| MNGdd | 313.7032 | 451.5302 | 1163.0000 | 2021/12/02 | 10.1699 | 25.0/-3.0 | 21/10/20 | 22/04/14 |
| Station | Location | Equipment | North | East | Per (sec) |
Description | Start | End |
|---|---|---|---|---|---|---|---|---|
| MLRttu | Muntele Rosu | DL100 | 45.4909 | 25.945 | 1 | Tunnel MLR temperature and humidity | 19/11/05 | _ |
| LOPrCO2 | Lopatari | DL303 | 45.4738 | 26.568 | 1 | Lopatari Mocearu CO2/CO | 19/06/26 | _ |
| VRIco2 | Vrancioaia | DL303 | 45.8657 | 26.7277 | 1 | Vrancioaia CO2/CO | 19/07/10 | 20/07/21 |
| DLMCO2 | Dalma | DL303 | 45.3629 | 26.5965 | 1 | Dalma CO2/CO | 22/07/04 | _ |
| SurlCO2 | Surlari | DL303 | 44.6777 | 26.2526 | 1 | Surlari CO2/CO | 21/11/10 | _ |
| CVSrCO2 | Covasna | DL303 | 45.7944 | 26.1239 | 1 | Covasna CO2/CO | 22/07/06 | _ |
| RVCO2 | Râmnicu Vâlcea | DL303 | 45.1075 | 24.3770 | 1 | Râmnicu Vâlcea borehole CO2/CO | 21/08/18 | 22/04/13 |
| PL7co2 | Plostina 7 | DL303 | 45.8603 | 26.6405 | 1 | PLOR7 CO2/CO | 20/07/21 | _ |
| MNGCO2 | Mangalia | DL303 | 43.8168 | 28.5876 | 1 | Mangalia CO2/CO | 21/10/20 | 22/03/09 |
| BISRCO2 | Bisoca | DL303 | 45.5481 | 26.7099 | 1 | Bisoca CO2/CO | 19/07/09 | _ |
| PL7S | Plostina 7 | PL7S | 45.8603 | 26.6405 | 1 | PLOR7 solar radiation, K2 | 19/11/14 | _ |
| BURmto | Bucovina | VANTAGE_PRO2p | 47.644 | 25.2002 | 60 | Bucovina Meteo Vantage | 18/10/31 | _ |
| EFORmt2 | Eforie Nord | VANTAGE_PRO2p | 44.075 | 28.6323 | 60 | Eforie Meteo Vantage Pro2 | 18/08/02 | _ |
| INFPmt2 | Magurele | VANTAGE_PRO2p | 44.3479 | 26.0281 | 60 | INFP Magurele Meteo DAVIS Vantage Pro2 | 18/07/12 | _ |
| MetMr2 | Marisel | VANTAGE_PRO2p | 46.676 | 23.1189 | 60 | Meteo Davis Marisel | 18/07/20 | _ |
| MLRmt2 | Muntele Rosu | VANTAGE_PRO2p | 45.4909 | 25.945 | 60 | MLR Meteo DAVIS PRO2+ | 19/11/15 | _ |
| VRImto | Vrancioaia | WS2355 | 45.8657 | 26.7277 | 60 | VRI Meteo, La Crosse 2.0 | 14/02/07 | _ |
| BISRmto | Bisoca | WS2355 | 45.5481 | 26.7099 | 60 | Bisoca, Meteo La Crosse 2.0 | 17/07/25 | _ |
| NEHRmto | Nehoiu | WS2355 | 45.4272 | 26.2952 | 60 | Nehoiu, Meteo La Crosse 20 | 14/05/28 | _ |
| ODBmto | Odobesti | WS2355 | 45.7633 | 27.0558 | 60 | Odobesti, Meteo | 14/07/21 | _ |
| PLORmto | Plostina 4 | WS2355 | 45.8512 | 26.6498 | 60 | PLOR4 Meteo | 01/12/01 | _ |
| Equipment_AERC | ||||
|---|---|---|---|---|
| ID | Field1 | Field2 | Field3 | Field4 |
| 1 | Radon | Temperature (C) | Humidity (%) | Status |
| 2 | Bq/m3 | C | % | _ |
| 3 | %d | %0.1f | %d | %d |
| 4 | radon, Radon, temperature in the equipment - Temperature (C), relative humidity in the equipment - Humidity (%), Sigfox network connection status - Status. |
|||
| Equipment _RADONSCOUTp | |||||||
|---|---|---|---|---|---|---|---|
| ID | Field1 | Field2 | Field3 | Field4 | Field5 | Field6 | Field7 |
| 1 | Radon | Error | Temp | relHum | Pres | Tilt | ROI1 |
| 2 | Bq/m3 | % | C | % | mbar | _ | cts |
| 3 | %d | %d | %0.1f | %d | %d | %d | %d |
| 4 | radon, Radon, error - Error, temperature in the equipment - Temp, relative humidity in the equipment - relHum, atmospheric pressure - Press, inclination - Tilt, region of interest 1 - ROI1. | ||||||
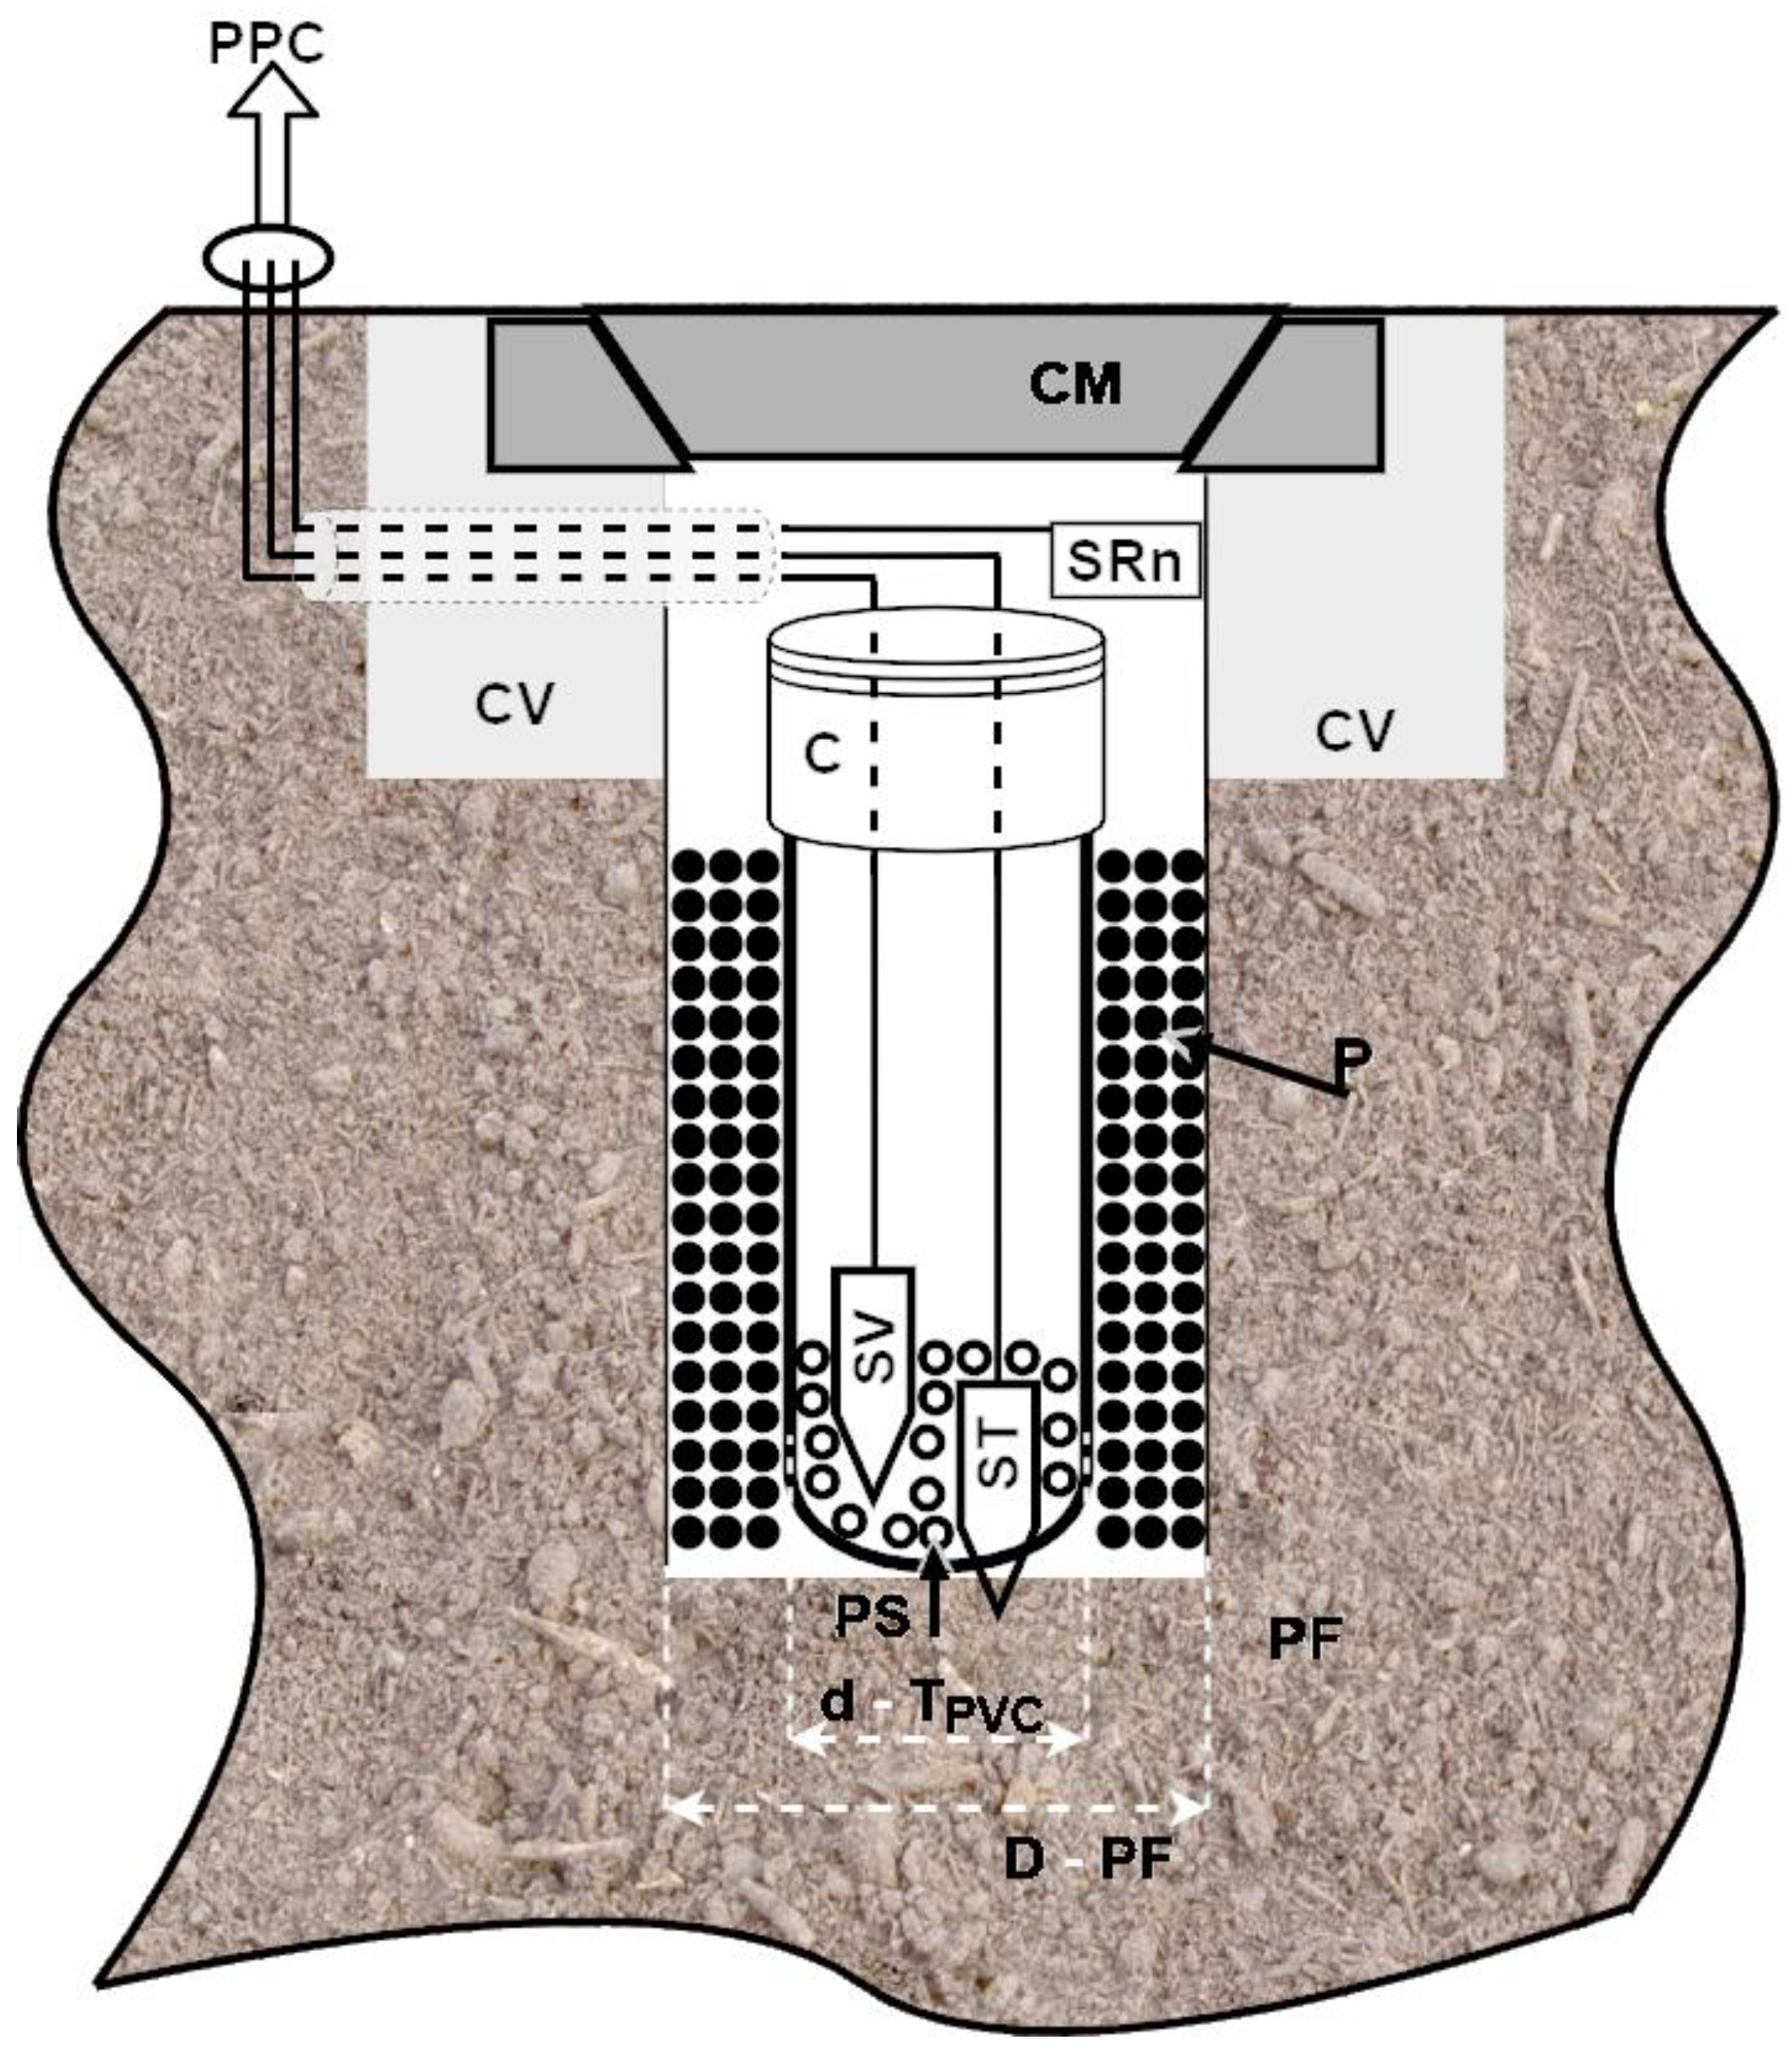
| PF | - | Borehole, 40m deep; |
| D | - | Diameter between 300 and 500mm; |
| SV | - | Vibration sensor (triaxial accelerometer); |
| PS | - | Glass balls for fixing SV; |
| ST | - | Temperature sensor; |
| TPVC | - | PVC tube; |
| C | - | PVC cover; |
| P | - | 10 - 30mm gravel that ensures the diffusion of radon from the bottom of the well to the SRn radon sensor; |
| SRn | - | Radon sensor mounted in the CV visiting space made of reinforced concrete; |
| CV | - | visiting space; |
| CM | - | Metal cover; |
| PPC | - | Precursor parameters of earthquakes. |
3. Analysis methods and case studies
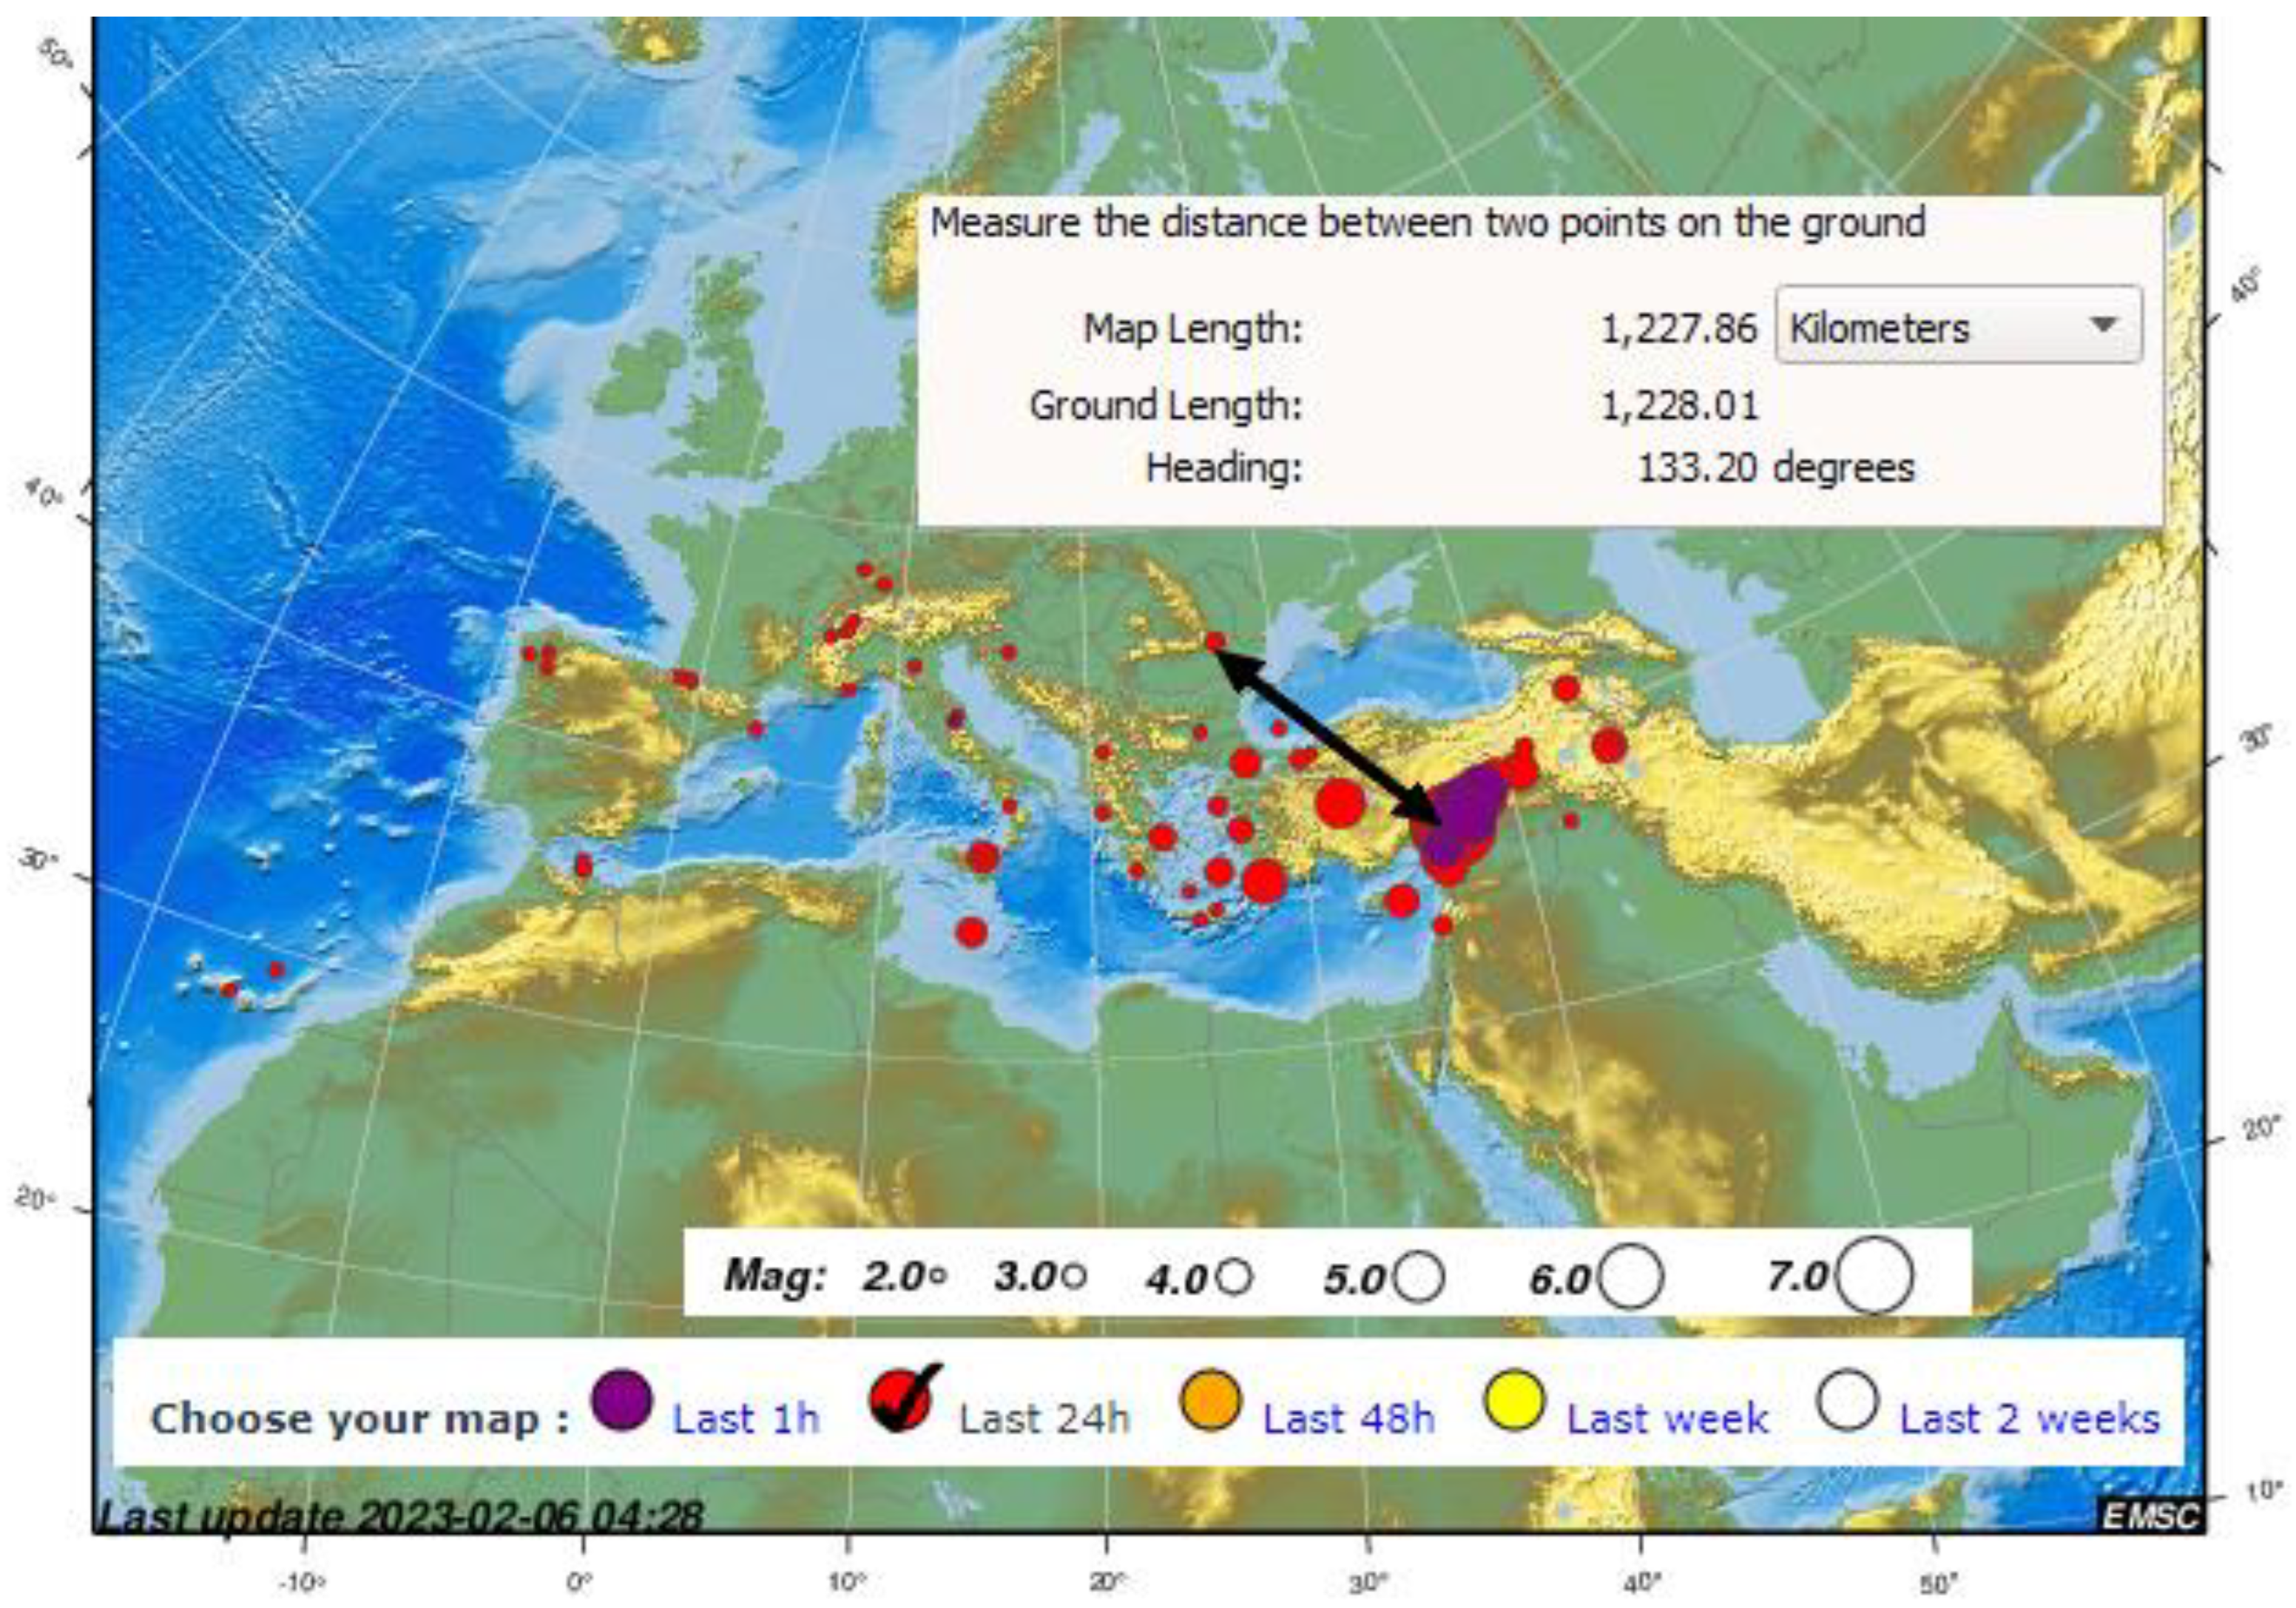
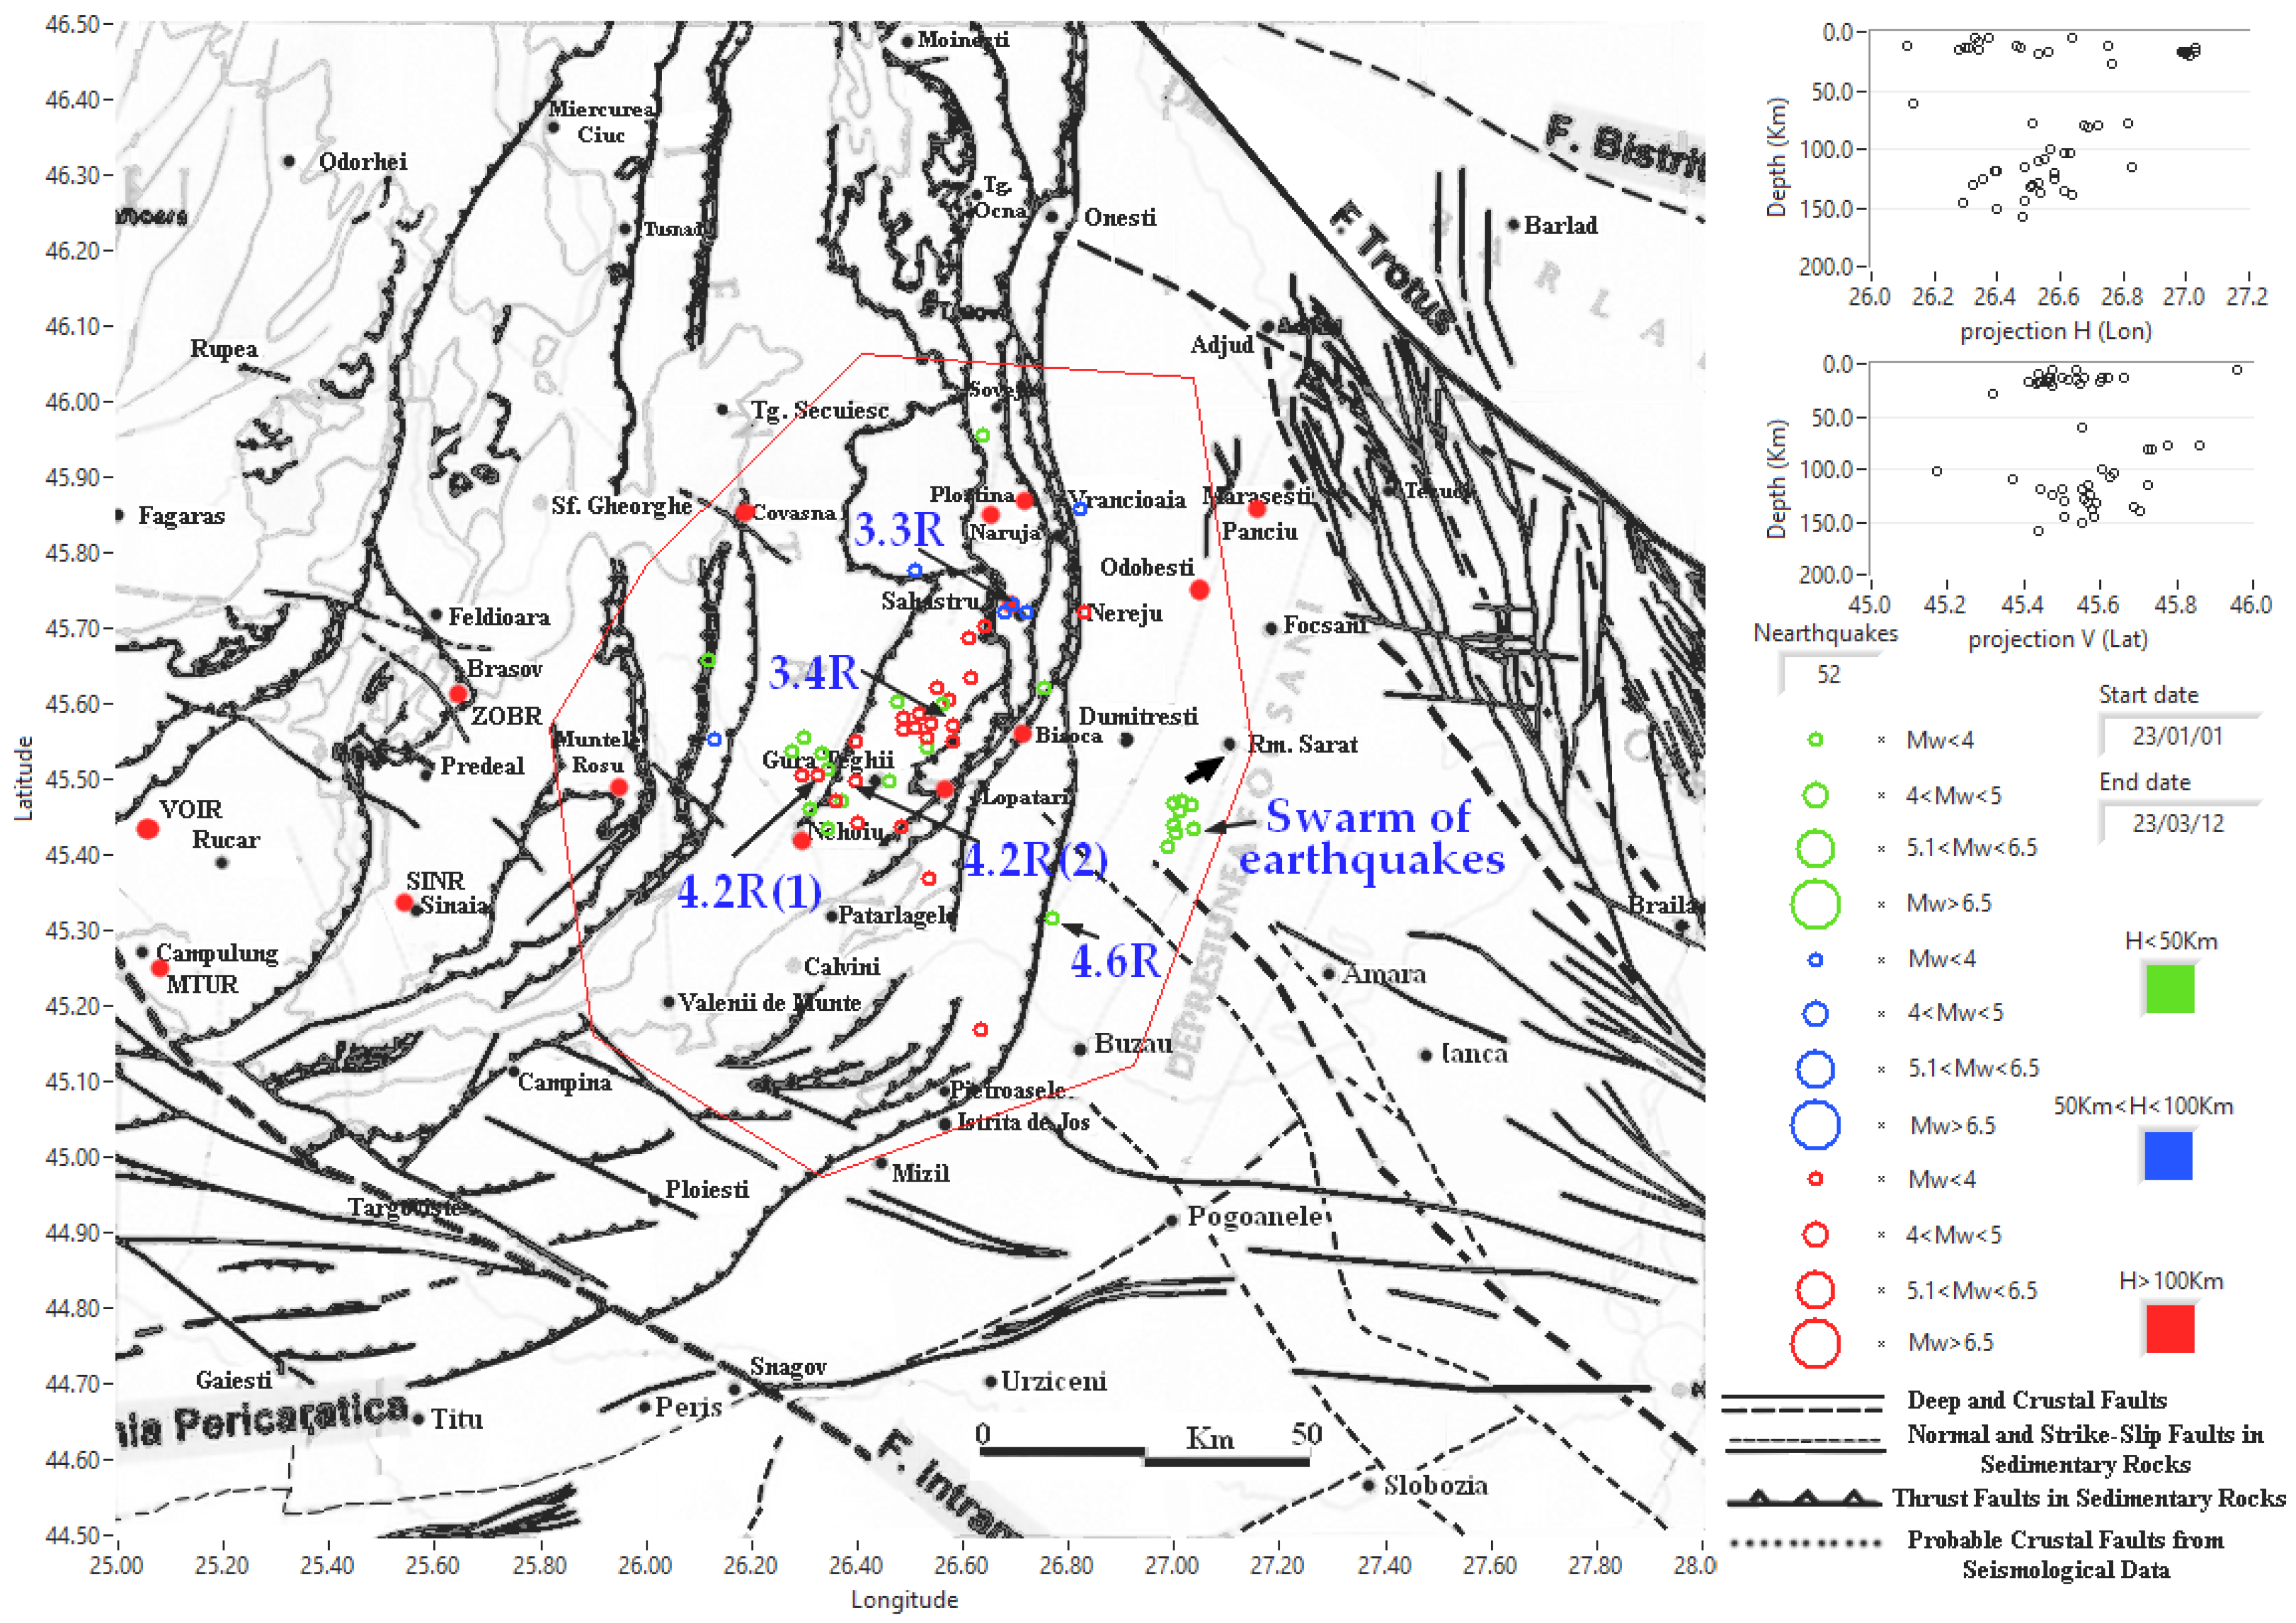
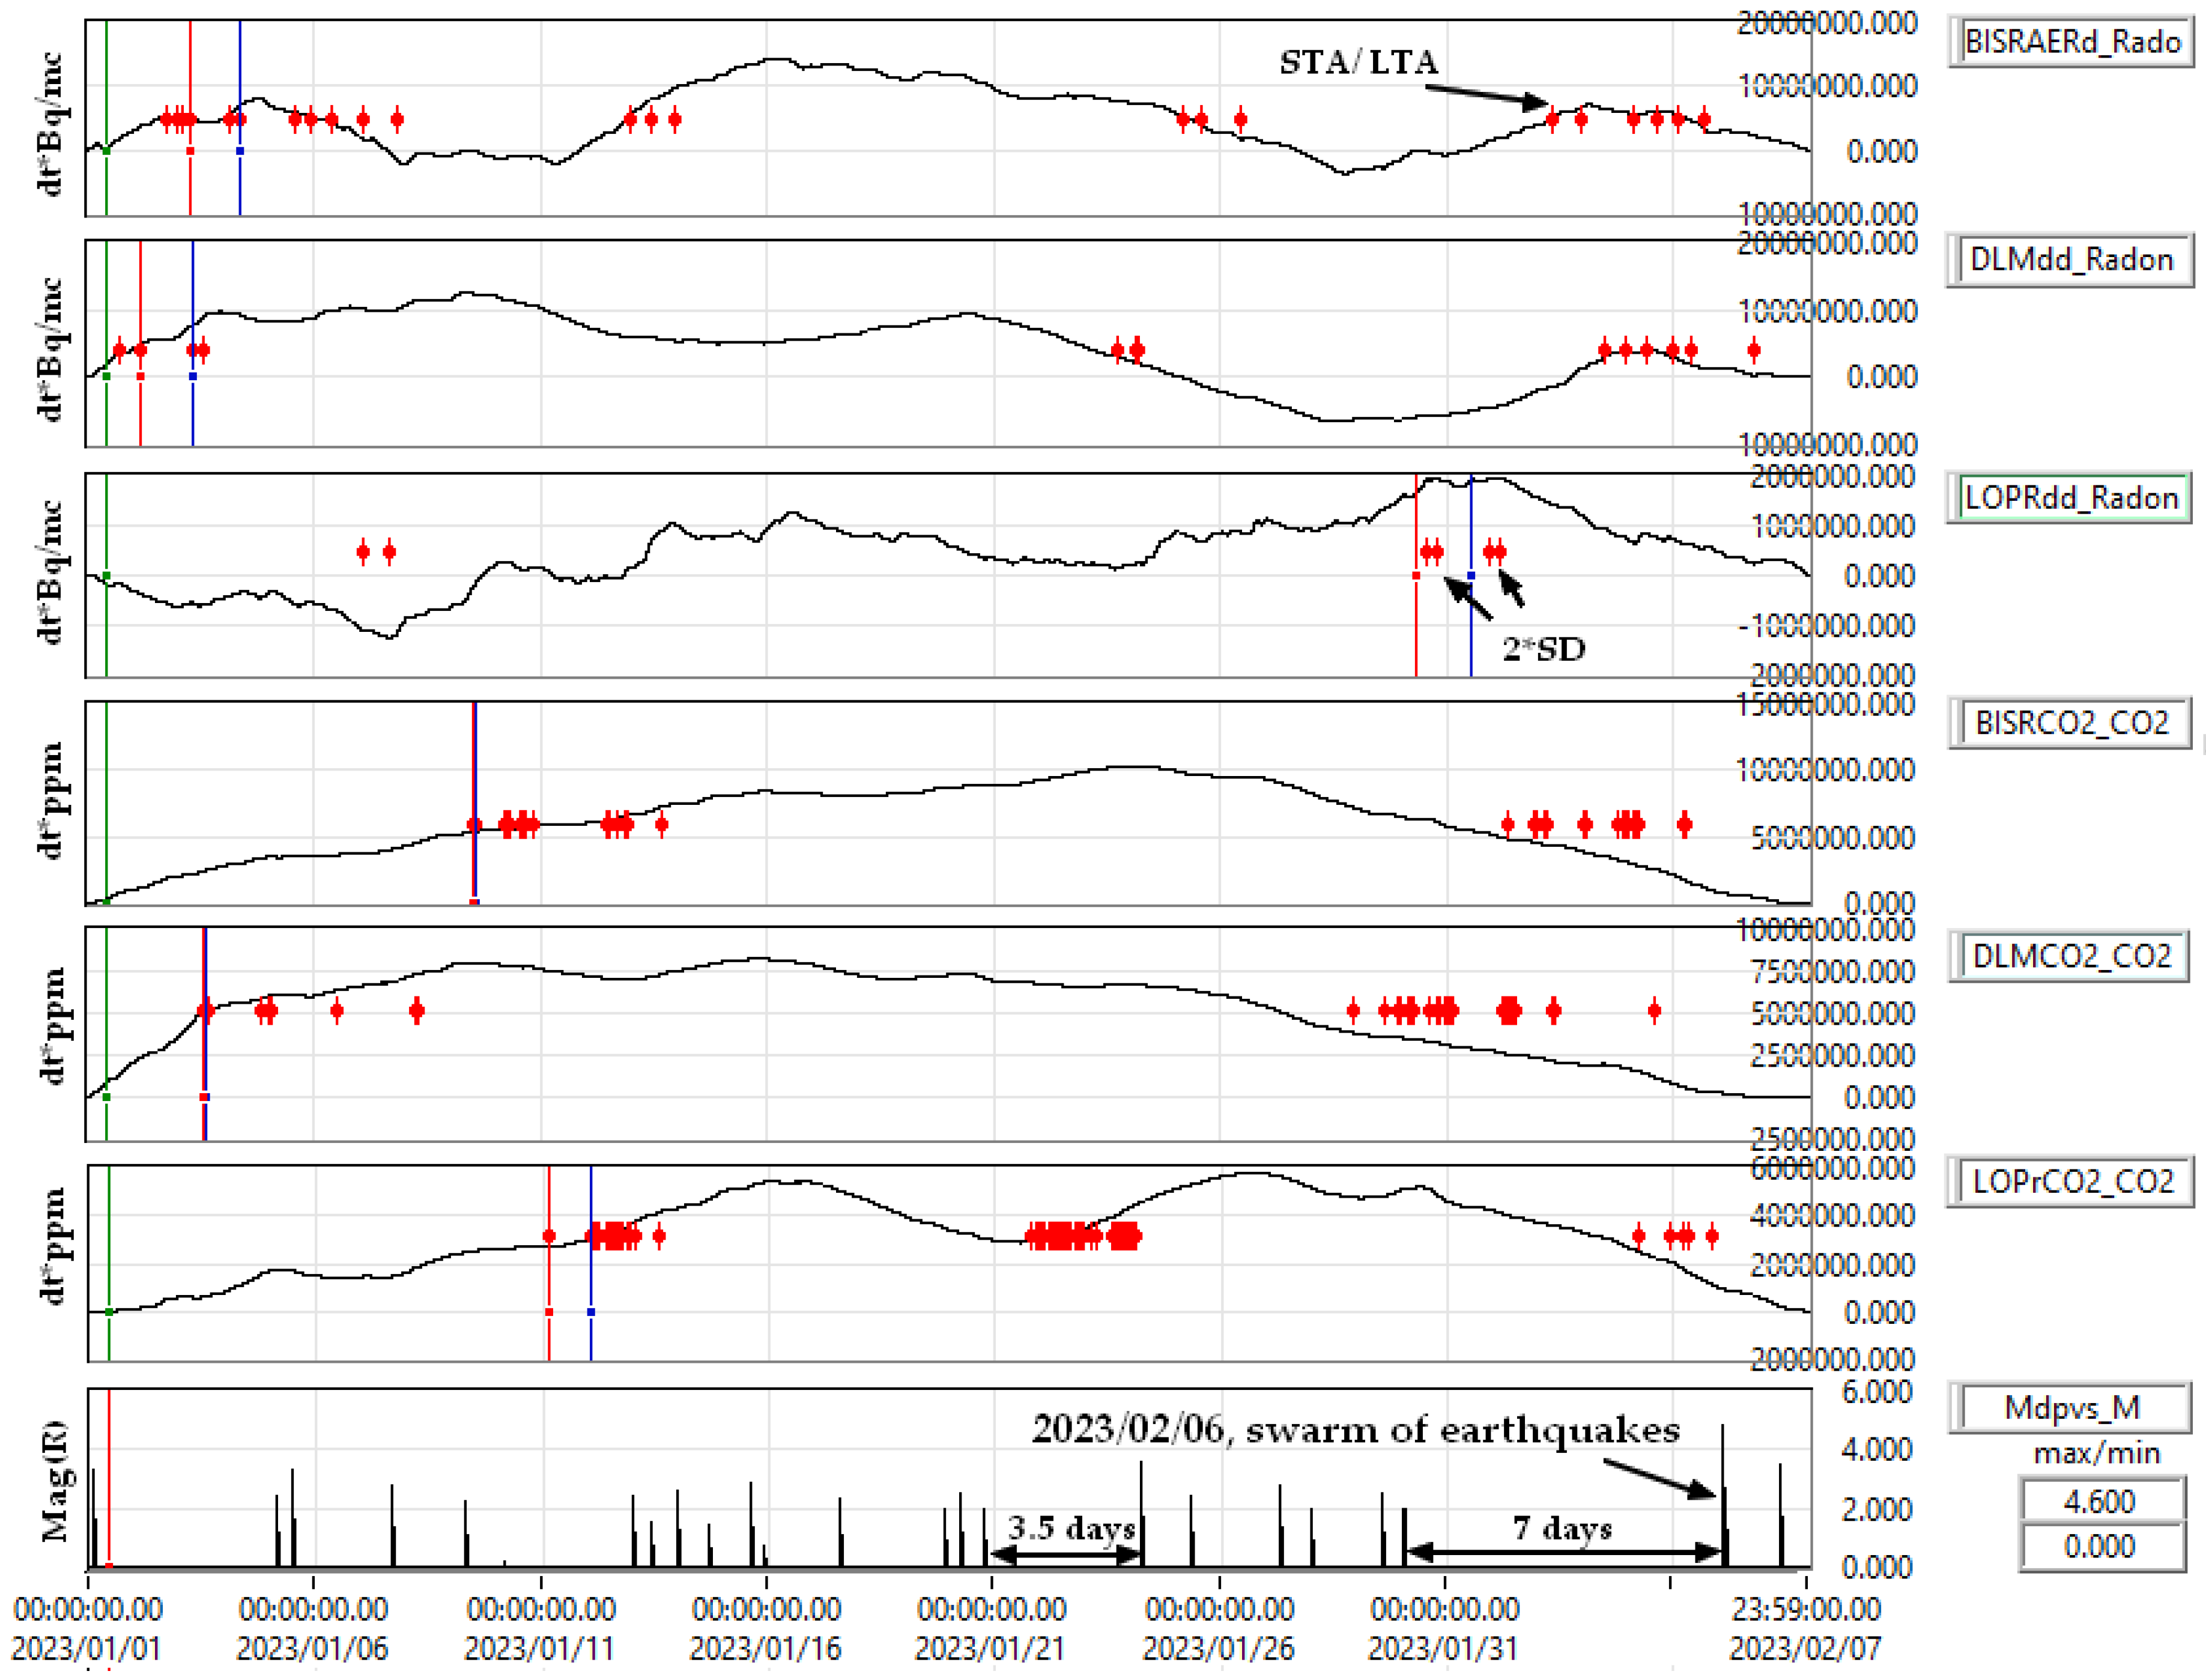
| Data (UTC) | Mag. | Reg. | h(Km) |
|---|---|---|---|
| 2023/02/06, 10:51:41 | 5.6 ml | CENTRAL TURKEY | 10km |
| 2023/02/06, 10:24:53 | 7.5 ml | CENTRAL TURKEY | 10km |
| 2023/02/06, 06:55:14 | 5.0 ml | CENTRAL TURKEY | 10km |
| 2023/02/06, 03:26:19 | 2.0 ml | ZONA SEISMICA VRANCEA, BUZAU | 21km |
| 2023/02/06, 03:01:58 | 2.7 ml | ZONA SEISMICA VRANCEA, BUZAU | 17km |
| 2023/02/06, 02:40:31 | 2.1 ml | ZONA SEISMICA VRANCEA, BUZAU | 13km |
| 2023/02/06, 02:13:10 | 2.9 ml | ZONA SEISMICA VRANCEA, BUZAU | 17km |
| 2023/02/06, 02:09:54 | 2.6 ml | ZONA SEISMICA VRANCEA, BUZAU | 17km |
| 2023/02/06, 01:26:20 | 4.6 ml | ZONA SEISMICA VRANCEA, BUZAU | 22km |
| 2023/02/06, 01:17:36 | 7.8 ml | CENTRAL TURKEY | 10km |
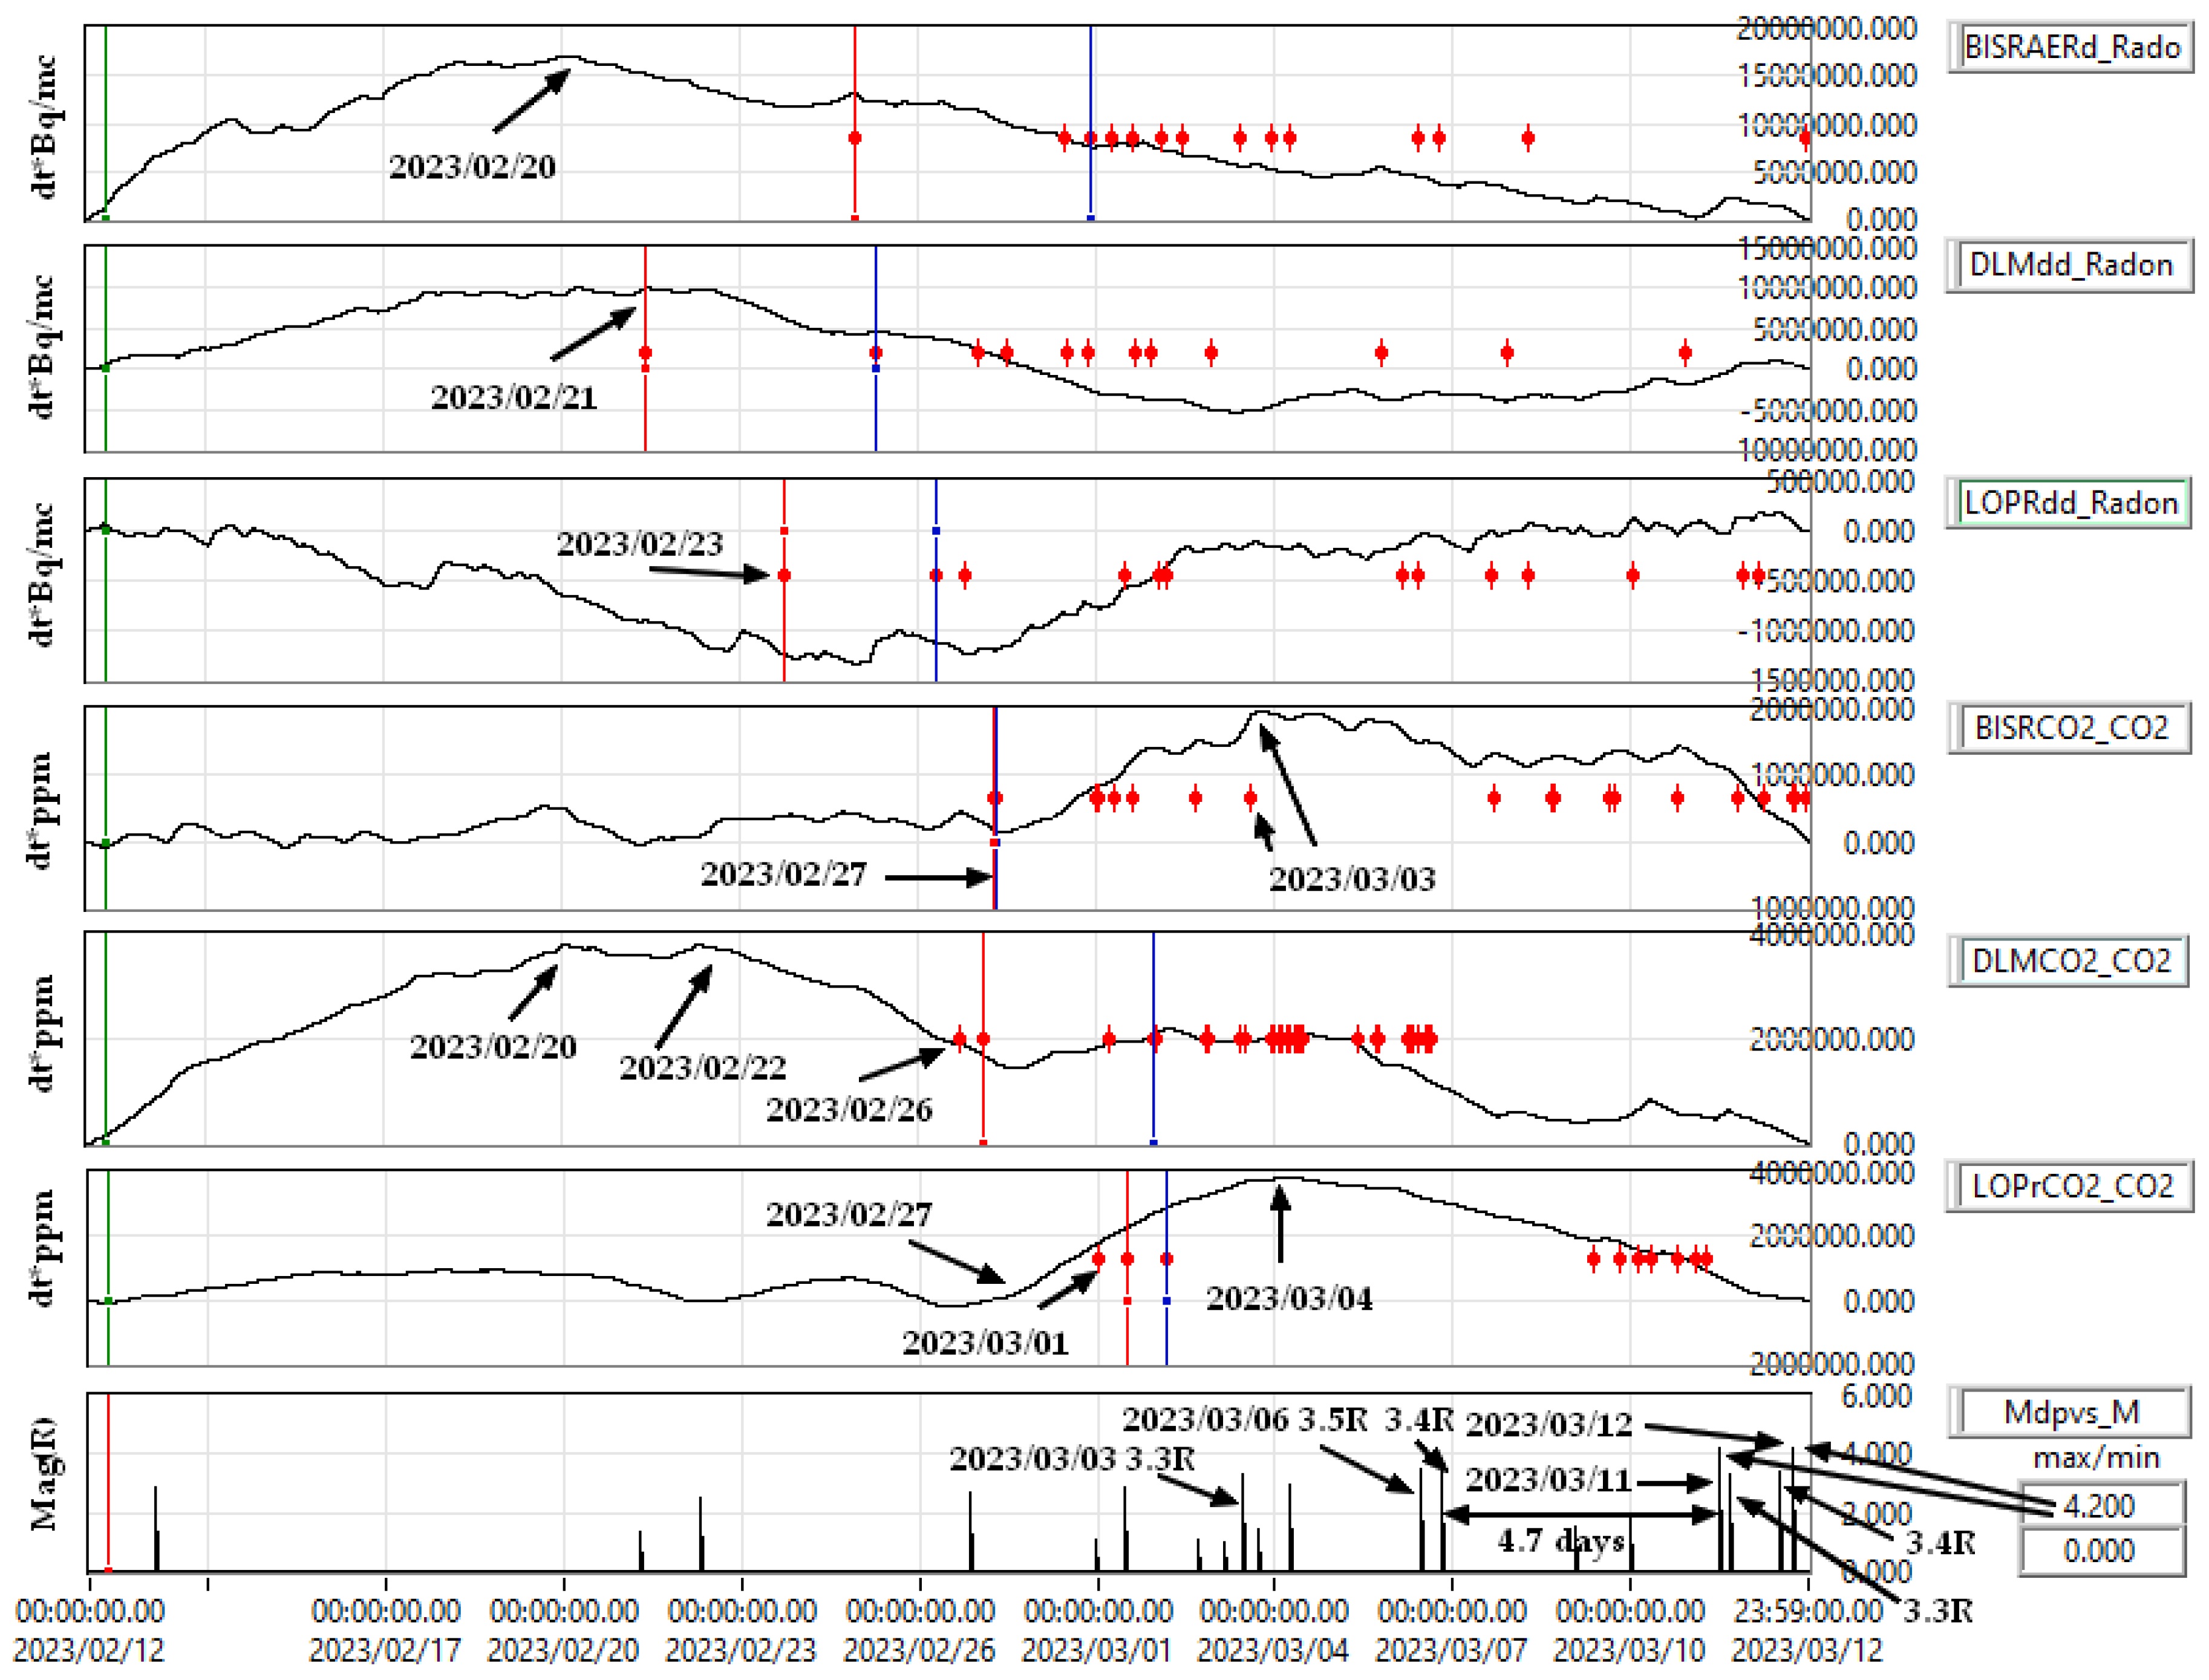
| Data (UTC) | Mag. | Reg. | h(Km) |
|---|---|---|---|
| 2023/03/12, 19:12:12 | 2.5 ml | OLTENIA, GORJ | 13km |
| 2023/03/12, 17:44:22 | 4.2 ml | SEISMIC AREA VRANCEA, BUZAUL | 131km |
| 2023/03/12, 12:15:09 | 3.6 ml | OLTENIA, GORJL | 16km |
| 2023/03/12, 11:49:23 | 3.4 ml | SEISMIC AREA VRANCEA, BUZAU | 125km |
| 2023/03/11, 20:12:55 | 2.2 ml | OLTENIA, GORJ | 15km |
| 2023/03/11, 17:51:56 | 2.6 ml | OLTENIA, GORJ | 14km |
| 2023/03/11, 15:53:22 | 3.3 ml | SEISMIC AREA VRANCEA, VRANCEAL | 82km |
| 2023/03/11, 14:17:06 | 3.5 ml | OLTENIA, GORJL | 17km |
| 2023/03/11, 13:28:57 | 2.5 ml | OLTENIA, GORJ | 16km |
| 2023/03/11, 13:25:46 | 2.4 ml | OLTENIA, GORJ | 15km |
| 2023/03/11, 12:09:20 | 4.2 ml | SEISMIC AREA VRANCEA, BUZAUL | 118km |
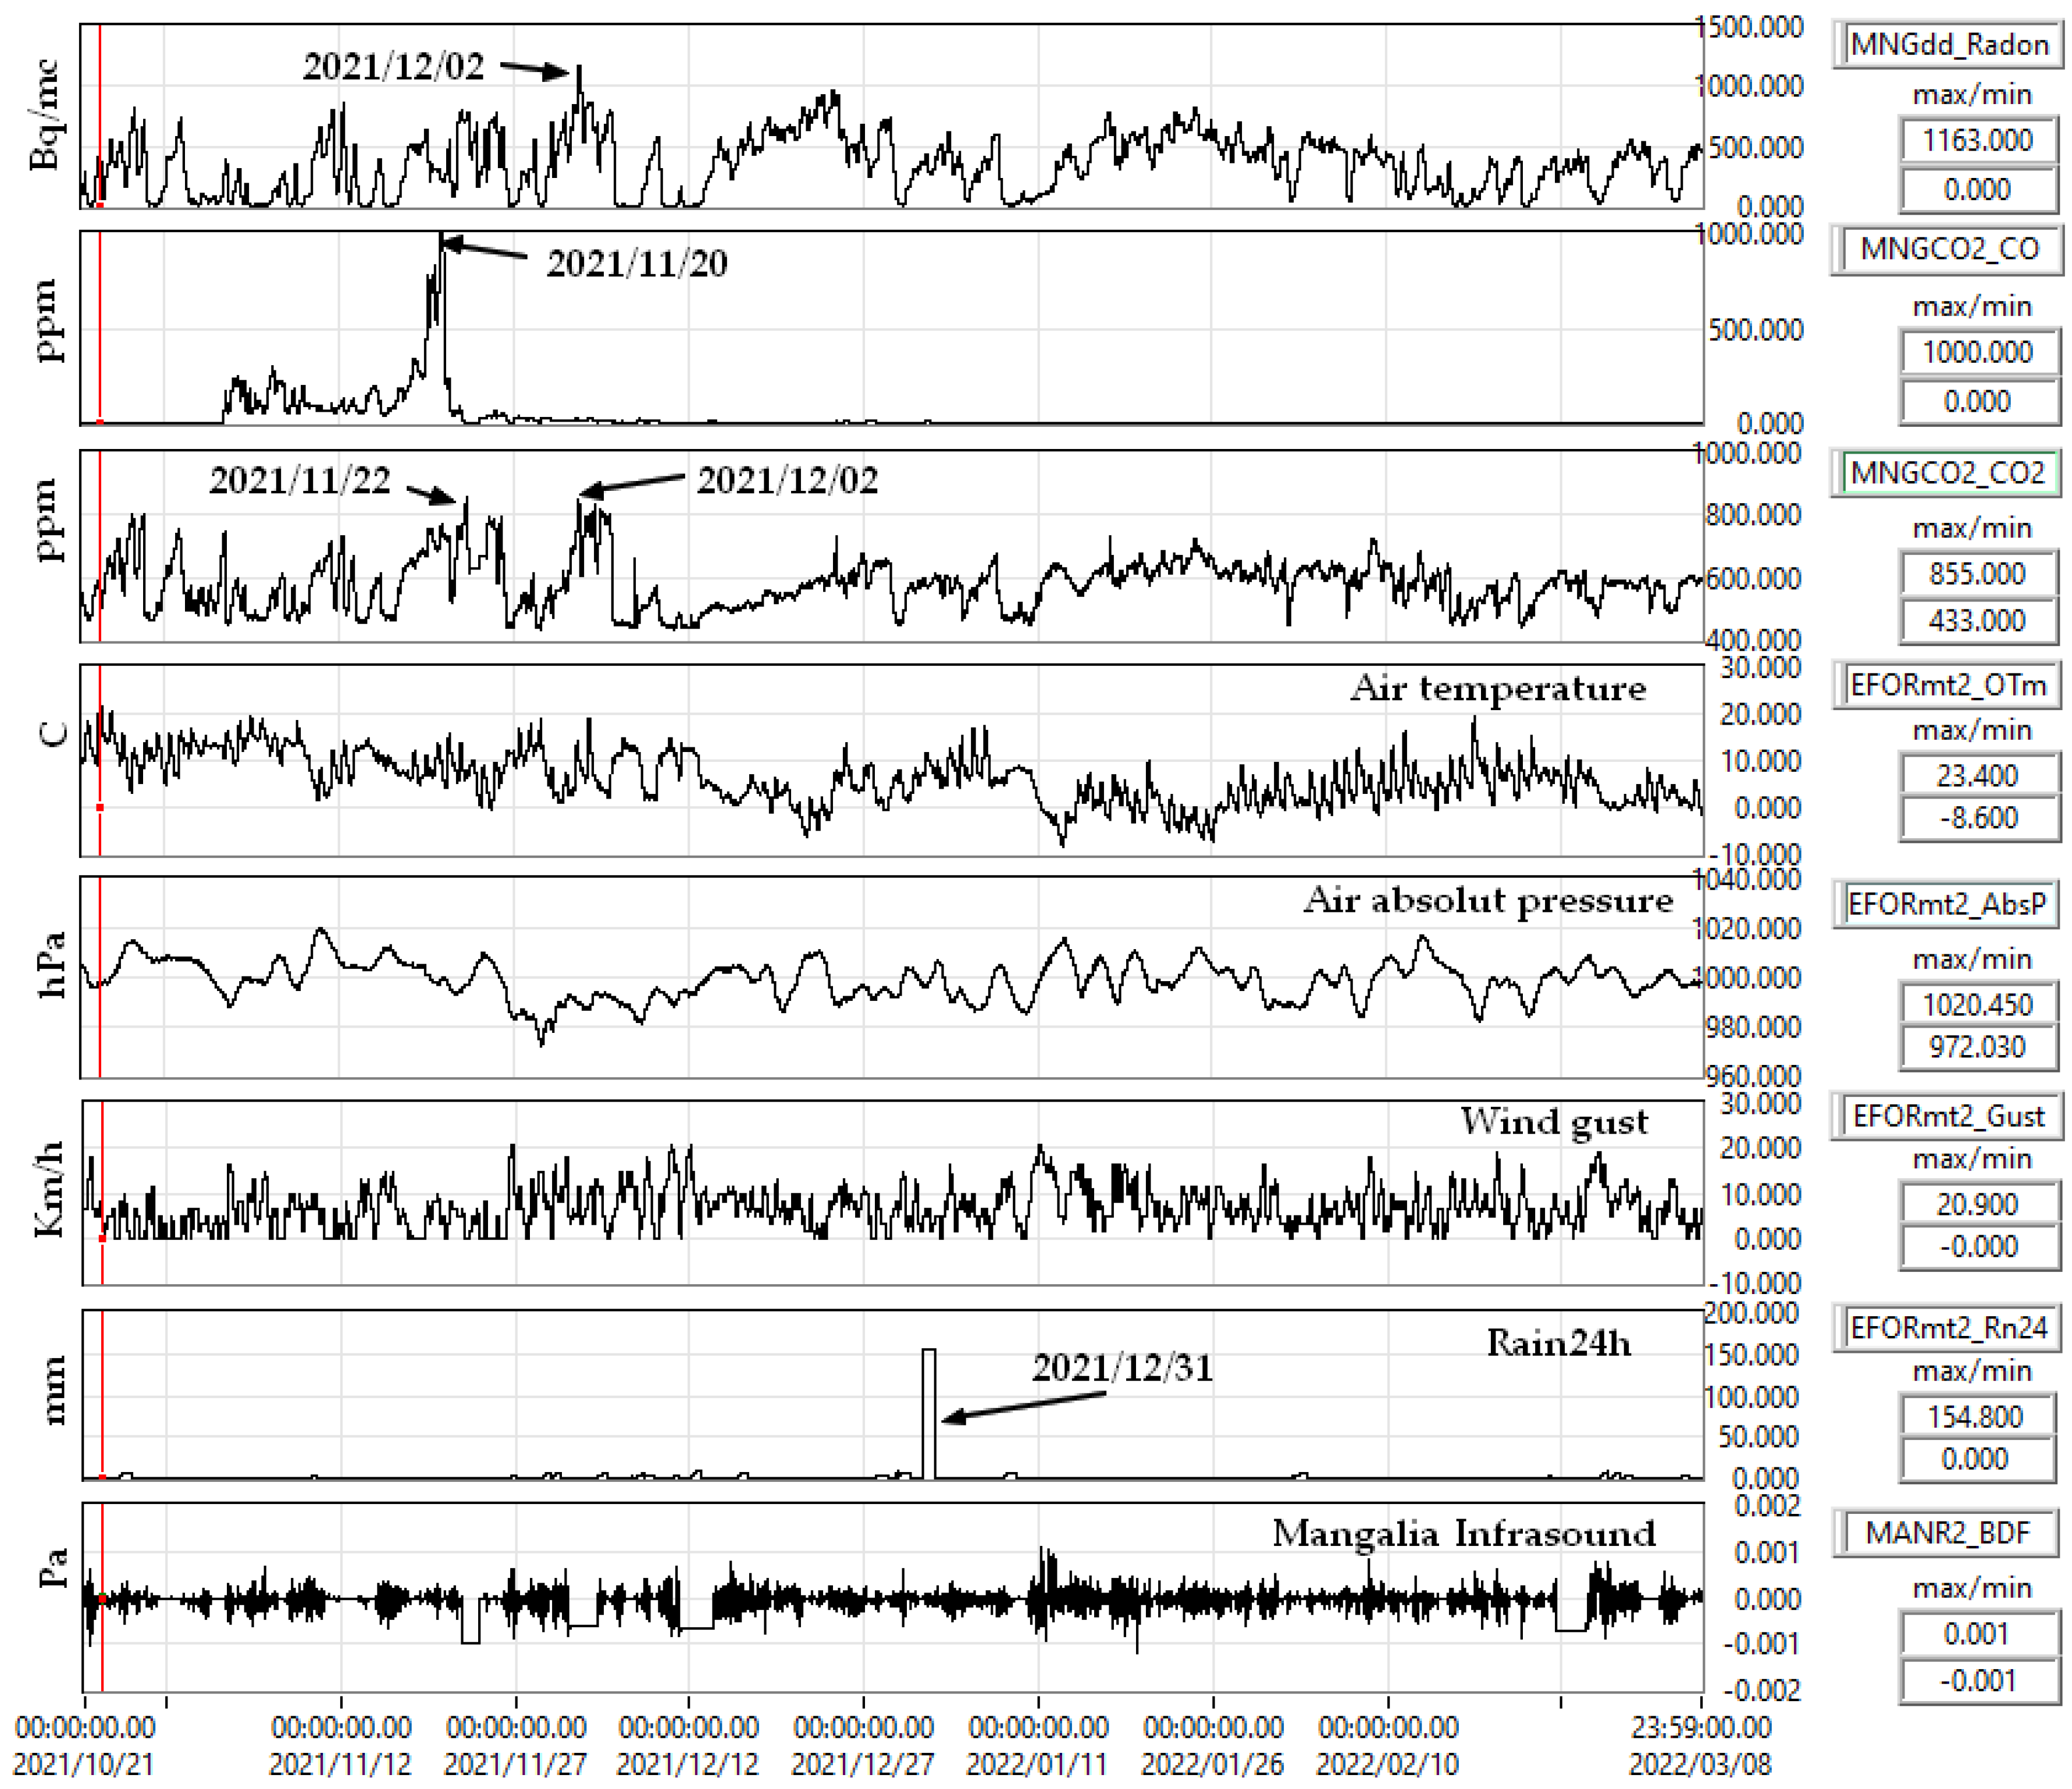
| Radon/ 2022 | Station Code | ||||||
|---|---|---|---|---|---|---|---|
| Mean Cross correlation | SURLdd | LOPRdd | NEHRdd | PANCdd | RMGVdd | SAHRdd | BISRAERd |
| CO2 | 0.3354 | 0.2758 | -0.1701 | - | - | - | 0.1789 |
| Humidity | 0.4430 | 0.3696 | 0.2531 | 0.5708 | 0.1814 | -0.2932 | 0.2504 |
| Temperature | -0.4181 | 0.3900 | 0.1370 | -0.2294 | 0.1467 | 0.7436 | 0.4714 |
| Atmospheric pressure | 0.0797 | 0.2313 | -0.0152 | 0.0088 | -0.0343 | -0.1636 | -0.0946 |
| Radon/ 2022 1h | Station Code | ||||||
|---|---|---|---|---|---|---|---|
| Mean Cross correlation | SURLdd | LOPRdd | NEHRdd | PANCdd | RMGVdd | SAHRdd | BISRAERd |
| CO2 | 0.5257 | 0.6222 | 0.3742 | - | - | - | 0.5791 |
| Humidity | 0.6385 | 0.6959 | 0.6321 | 0.7216 | 0.5371 | 0.3966 | 0.6902 |
| Temperature | 0.3048 | 0.6529 | 0.5702 | 0.3742 | 0.5663 | 0.7545 | 0.6999 |
| Atmospheric pressure | 0.5753 | 0.5892 | 0.4674 | 0.5691 | 0.4569 | 0.3818 | 0.4807 |
| N | Time | Ml>4.5 | Depth | Longitude | Latitude | Mw | PZone |
|---|---|---|---|---|---|---|---|
| yyyy/mm/dd | Richter | Km | Degrees | Degrees | Km | ||
| 1 | 2016/09/23 23:11:20 | 5.8 | 92.0 | 26.6181 | 45.7148 | 5.52 | 236.8 |
| 2 | 2016/12/27 23:20:56 | 5.8 | 96.9 | 26.5987 | 45.7139 | 5.52 | 236.8 |
| 3 | 2017/02/08 15:08:21 | 5.0 | 124 | 26.2886 | 45.4791 | 4.6 | 95.3 |
| 4 | 2017/05/19 20:02:45 | 4.7 | 120.6 | 26.7581 | 45.7249 | 4.32 | 72.3 |
| 5 | 2017/08/01 10:27:52 | 4.6 | 96.6 | 26.4681 | 45.5146 | 4.24 | 66.3 |
| 6 | 2017/08/02 02:32:13 | 4.9 | 132.5 | 26.4014 | 45.5267 | 4.51 | 86.7 |
| 7 | 2018/03/14 10:24:49 | 4.6 | 139.1 | 26.5850 | 45.6759 | 4.24 | 66.3 |
| 8 | 2018/04/25 17:15:49 | 4.6 | 147.3 | 26.4216 | 45.6002 | 4.24 | 66.3 |
| 9 | 2018/10/28 00:38:11 | 5.8 | 151.3 | 26.3986 | 45.6049 | 5.52 | 236.8 |
| 10 | 2019/09/03 11:52:53 | 4.5 | 116.7 | 26.2896 | 45.4712 | 4.15 | 61.0 |
| 11 | 2020/01/31 01:26:48 | 5.2 | 120.6 | 26.7033 | 45.7106 | 4.80 | 116.4 |
| 12 | 2020/04/24 22:04:19 | 5.0 | 21.6 | 27.4651 | 45.8951 | 3.79 | 42.8 |
| 13 | 2020/06/02 11:12:58 | 4.5 | 101.2 | 26.5548 | 45.6239 | 4.15 | 61.0 |
| 14 | 2021/04/09 18:36:47 | 4.5 | 77.1 | 26.6292 | 45.7916 | 4.15 | 61.0 |
| 15 | 2021/05/25 21:30:37 | 4.7 | 130.9 | 26.5226 | 45.5321 | 4.32 | 72.3 |
| 16 | 2021/09/01 10:32:12 | 4.5 | 145.0 | 26.4474 | 45.6413 | 4.15 | 61.0 |
| 17 | 2022/11/03 04:50:26 | 5.3 | 148.8 | 26.5166 | 45.4949 | 4.91 | 129.4 |
| 18 | 2022/12/17 05:42:59 | 4.5 | 140.0 | 26.4668 | 45.6359 | 4.15 | 61.0 |
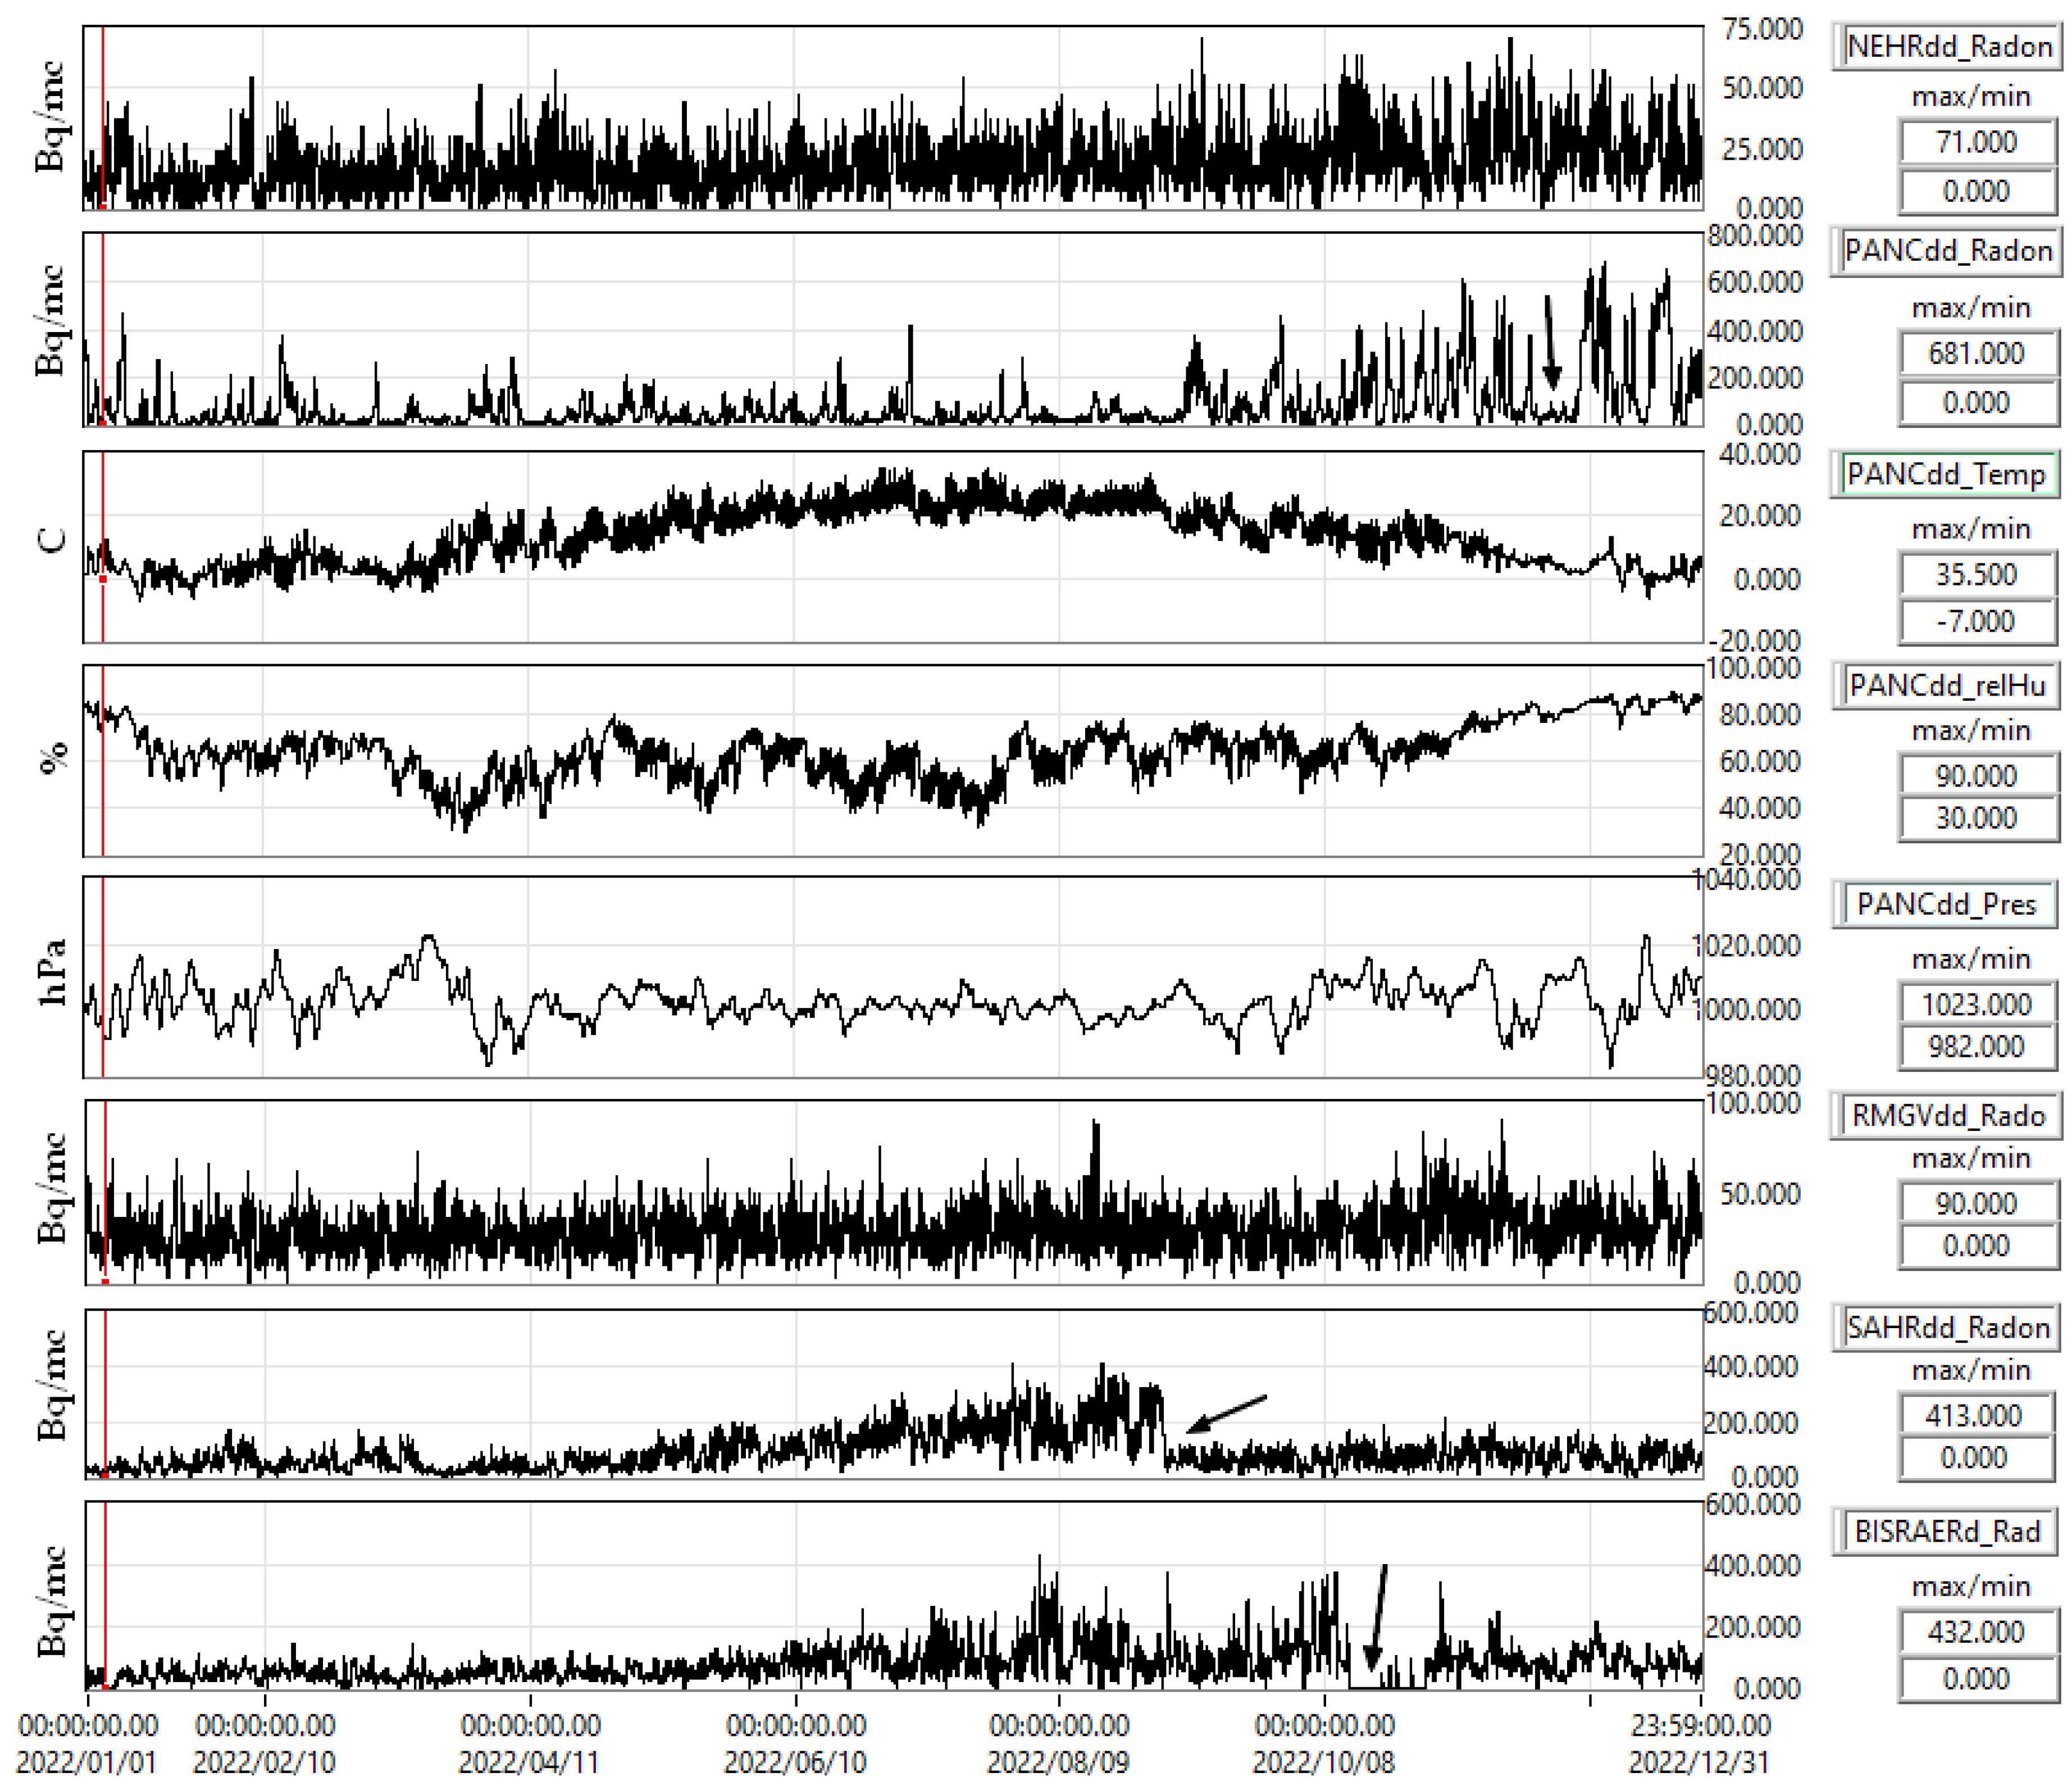
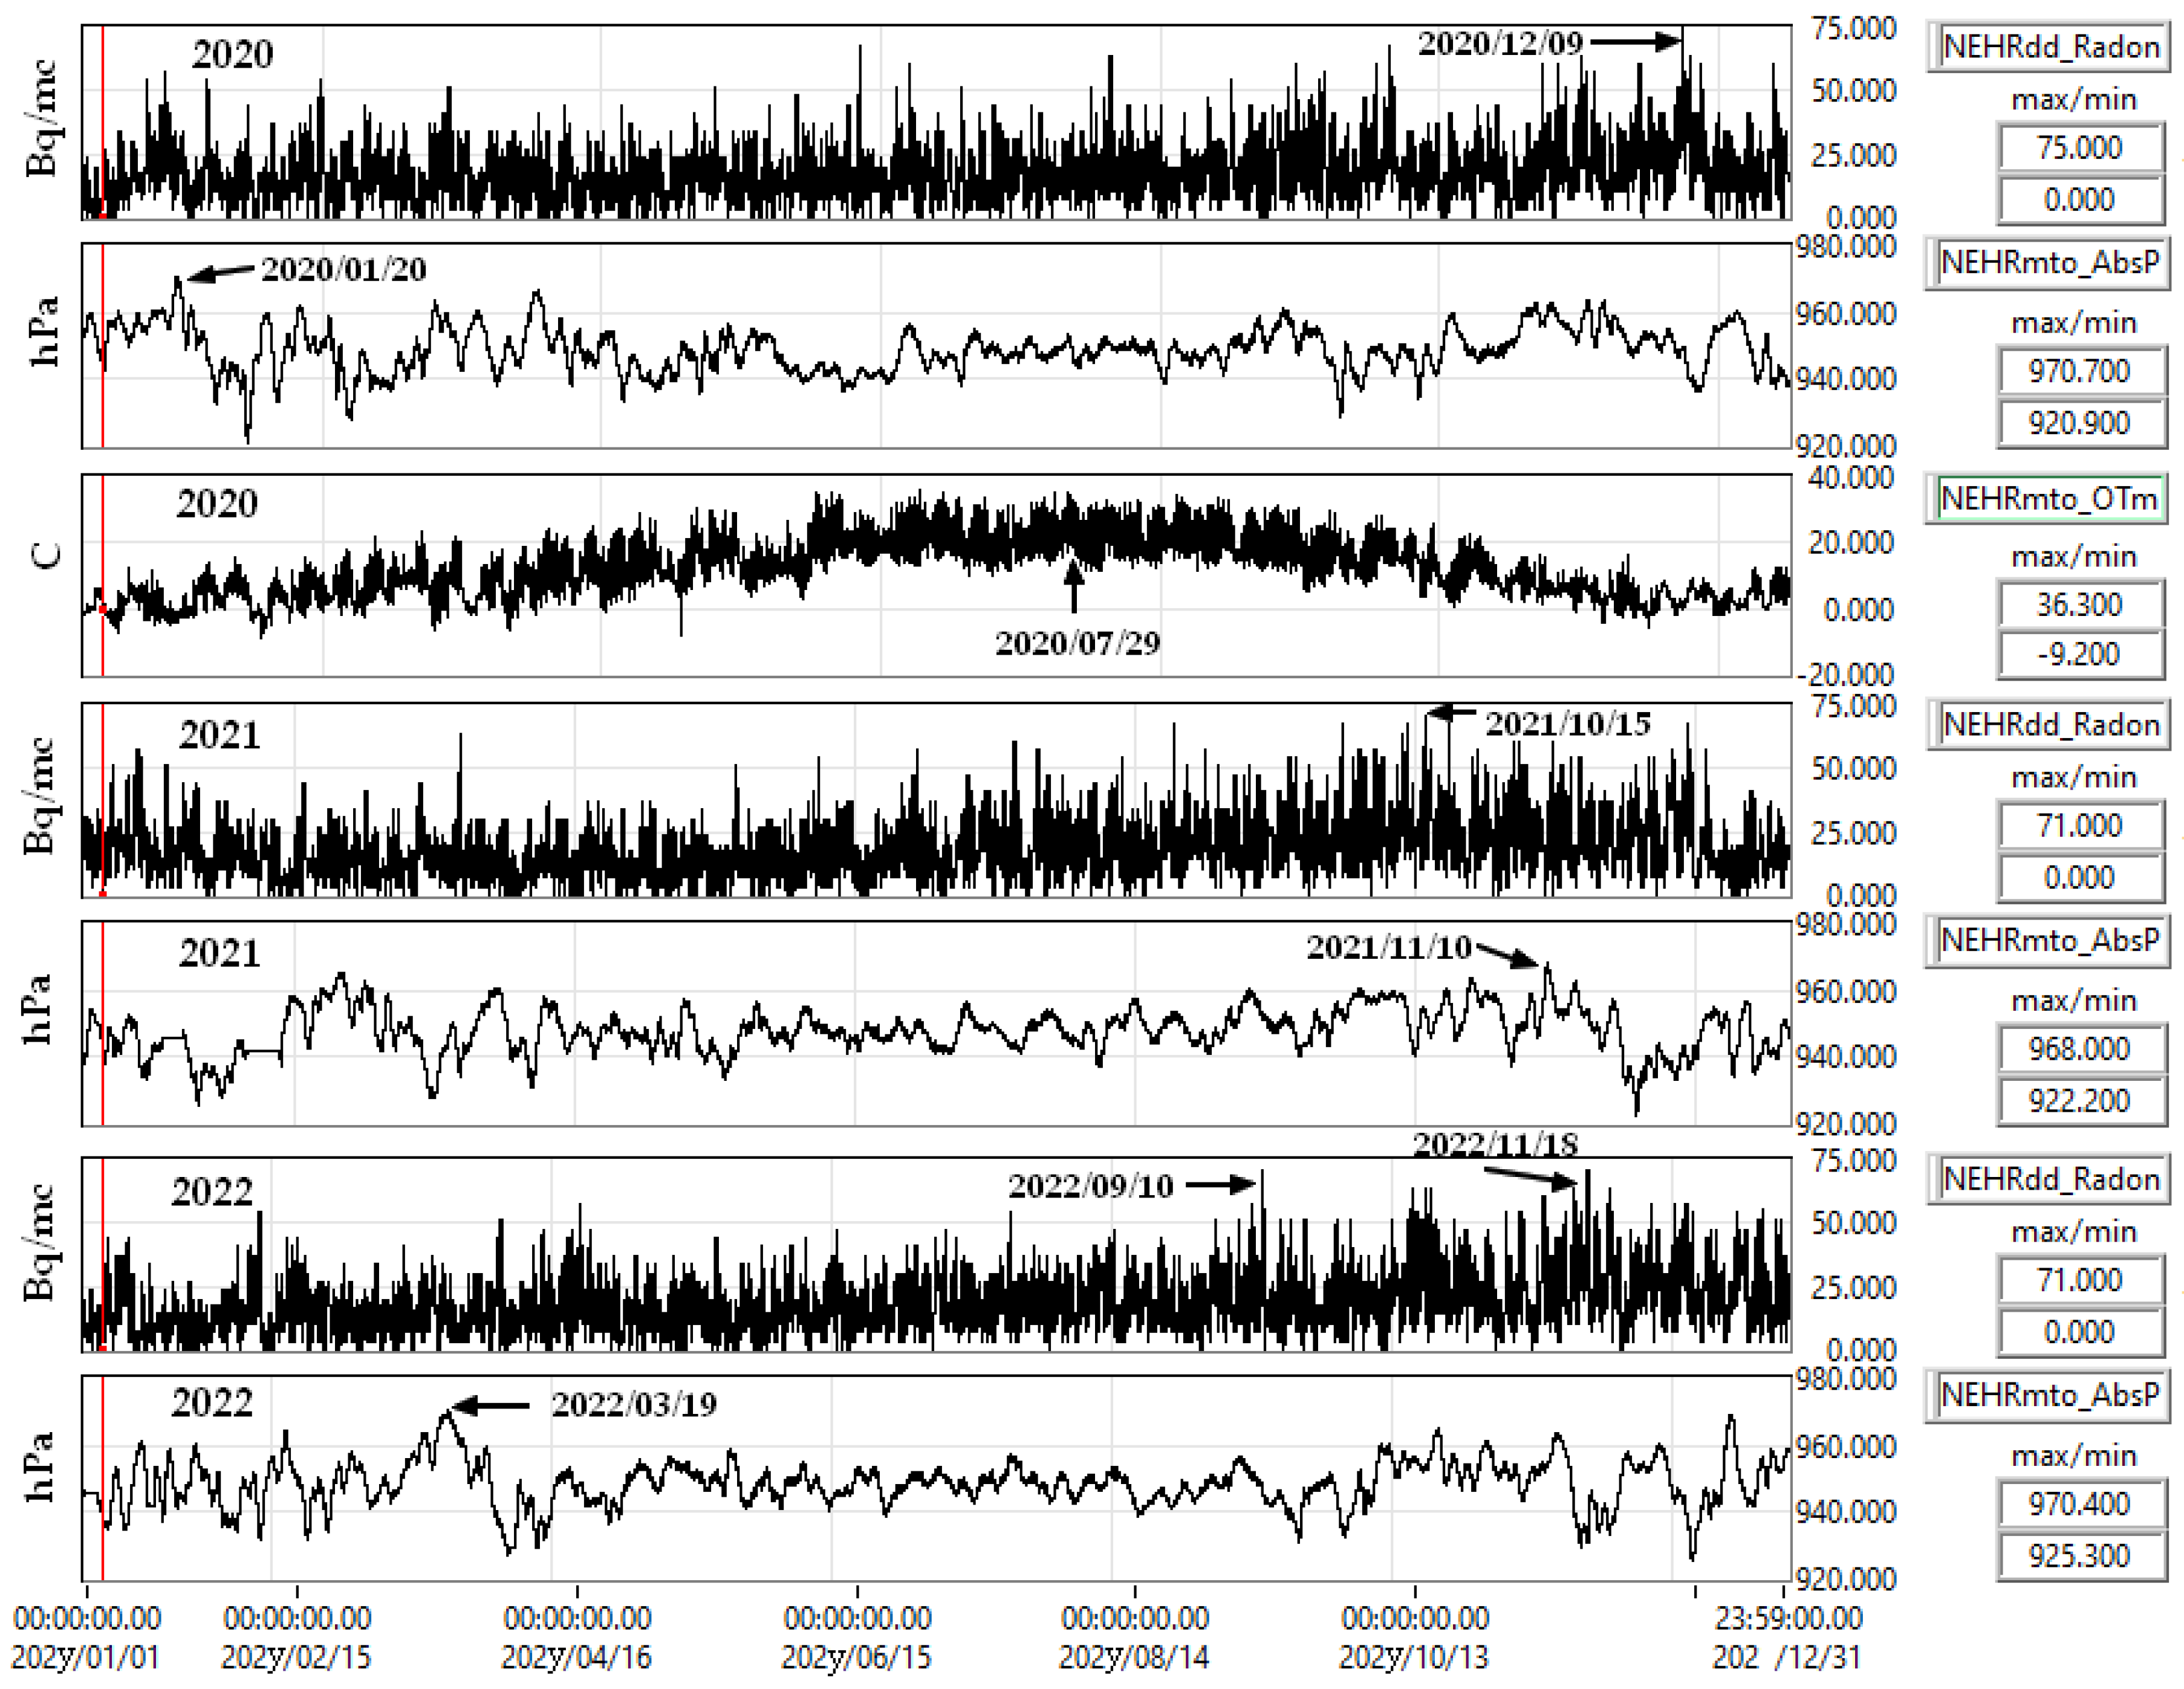
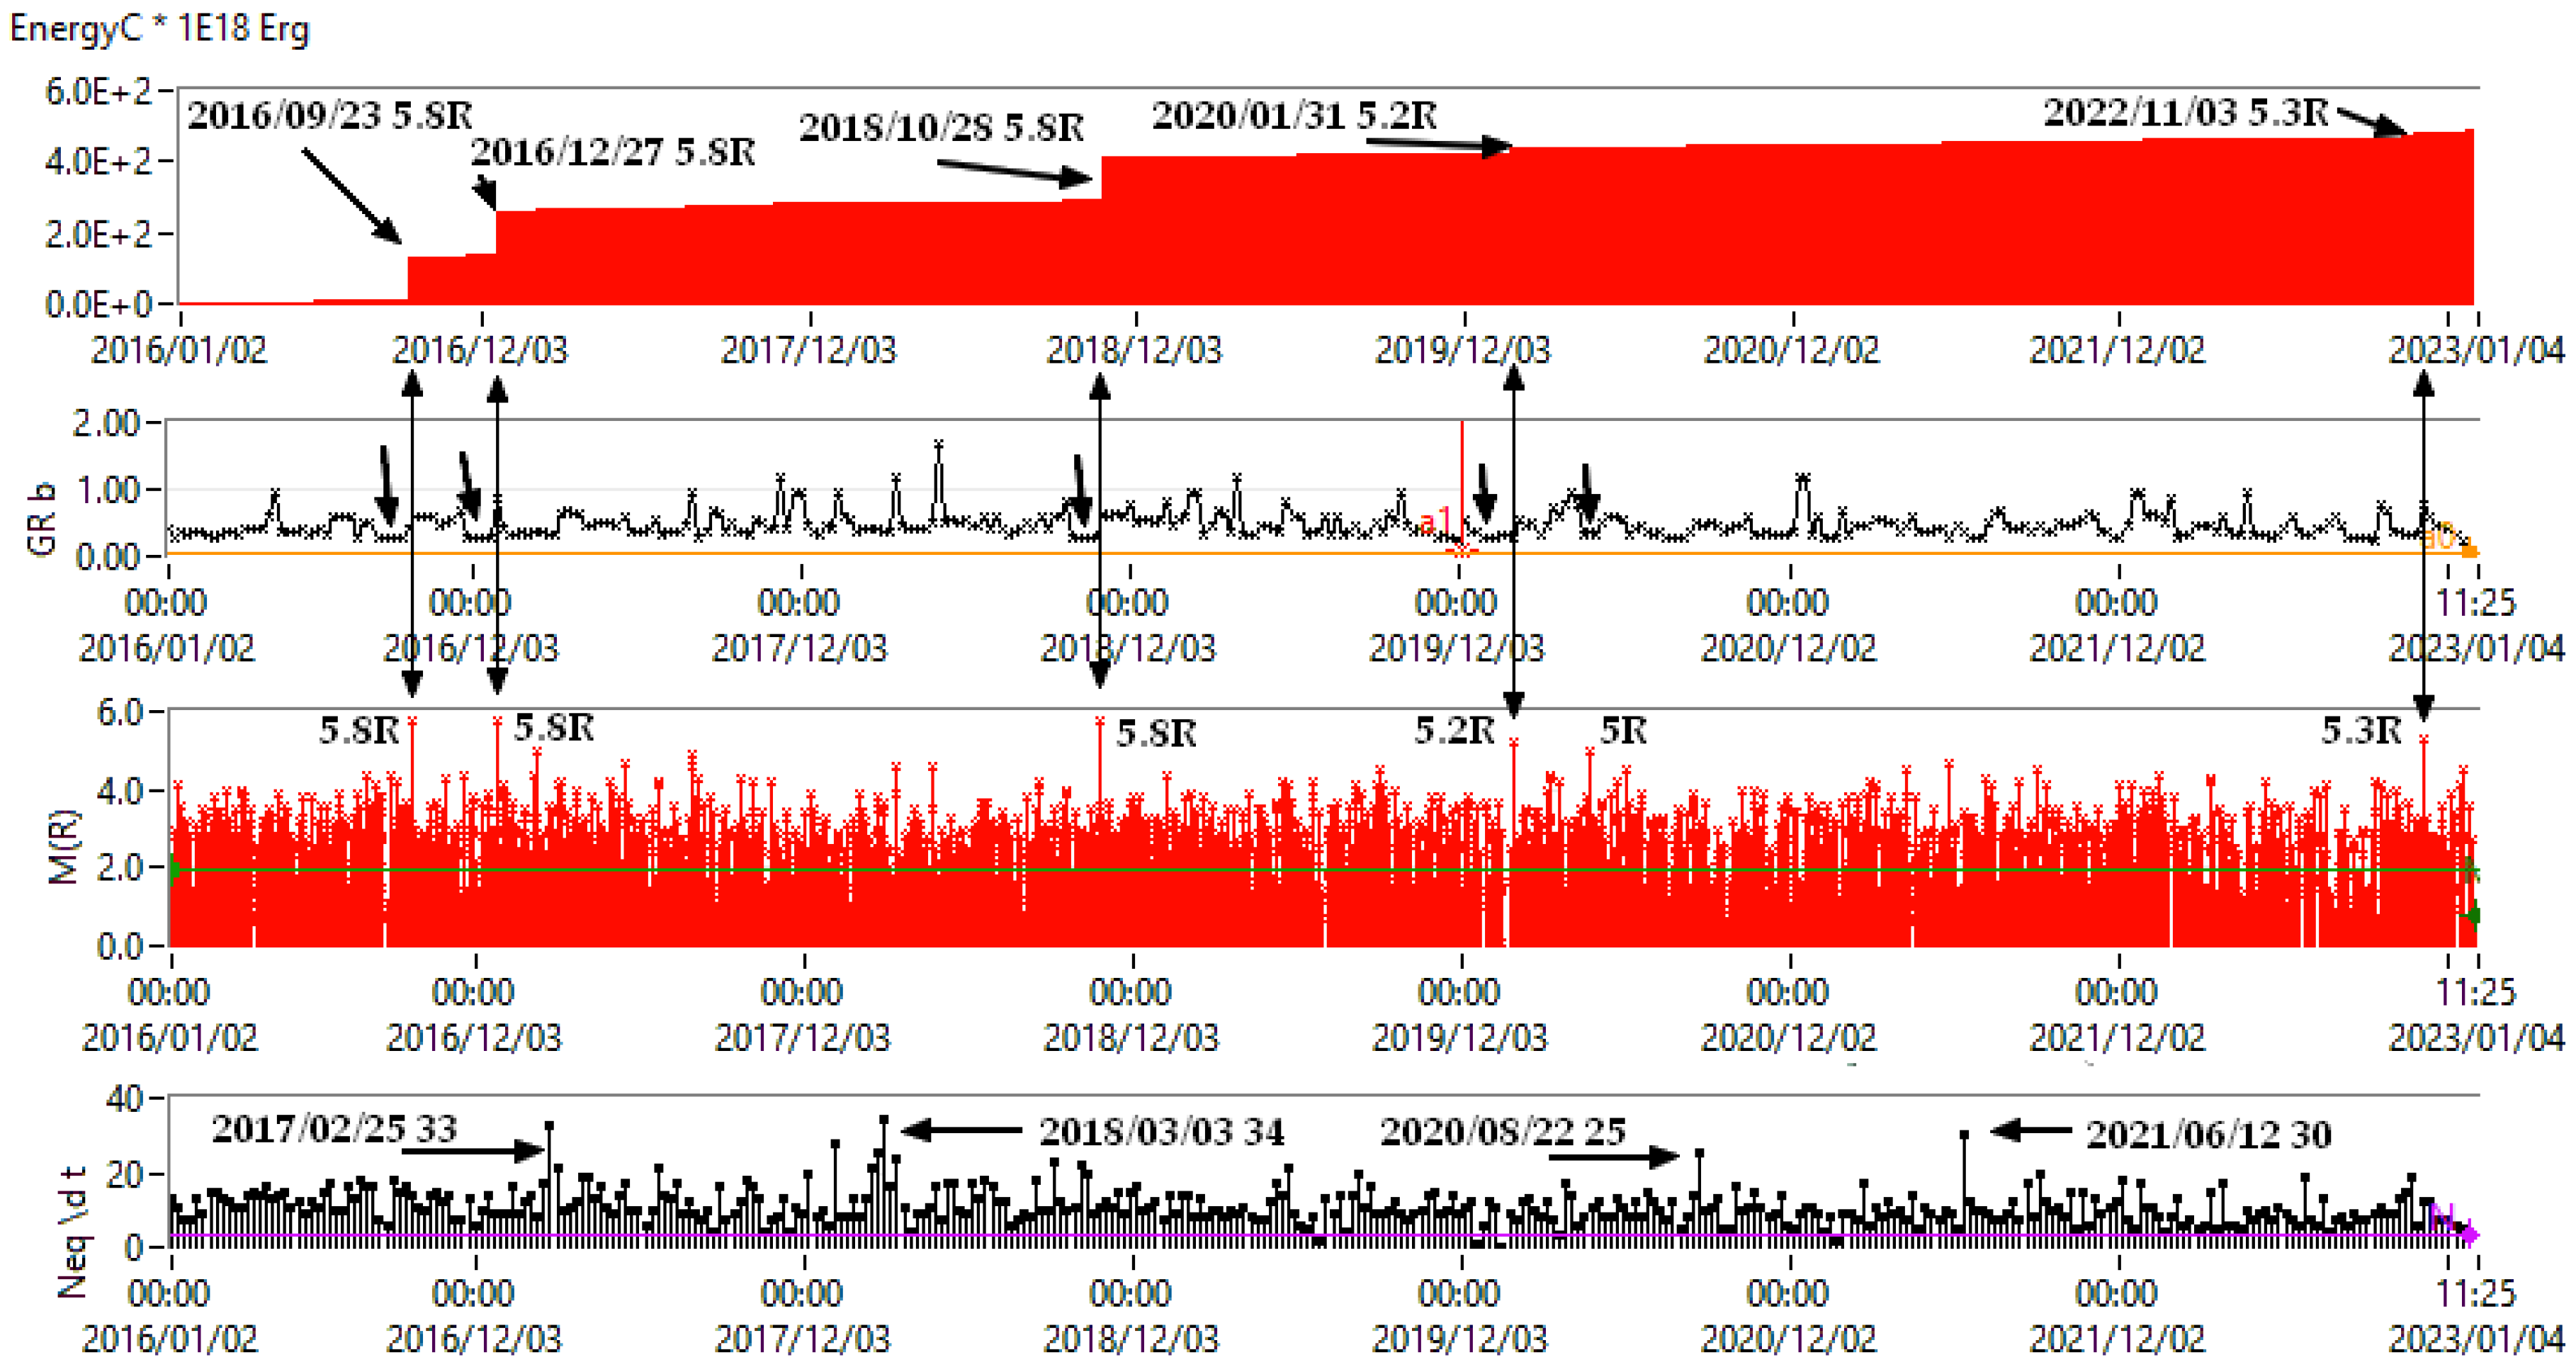
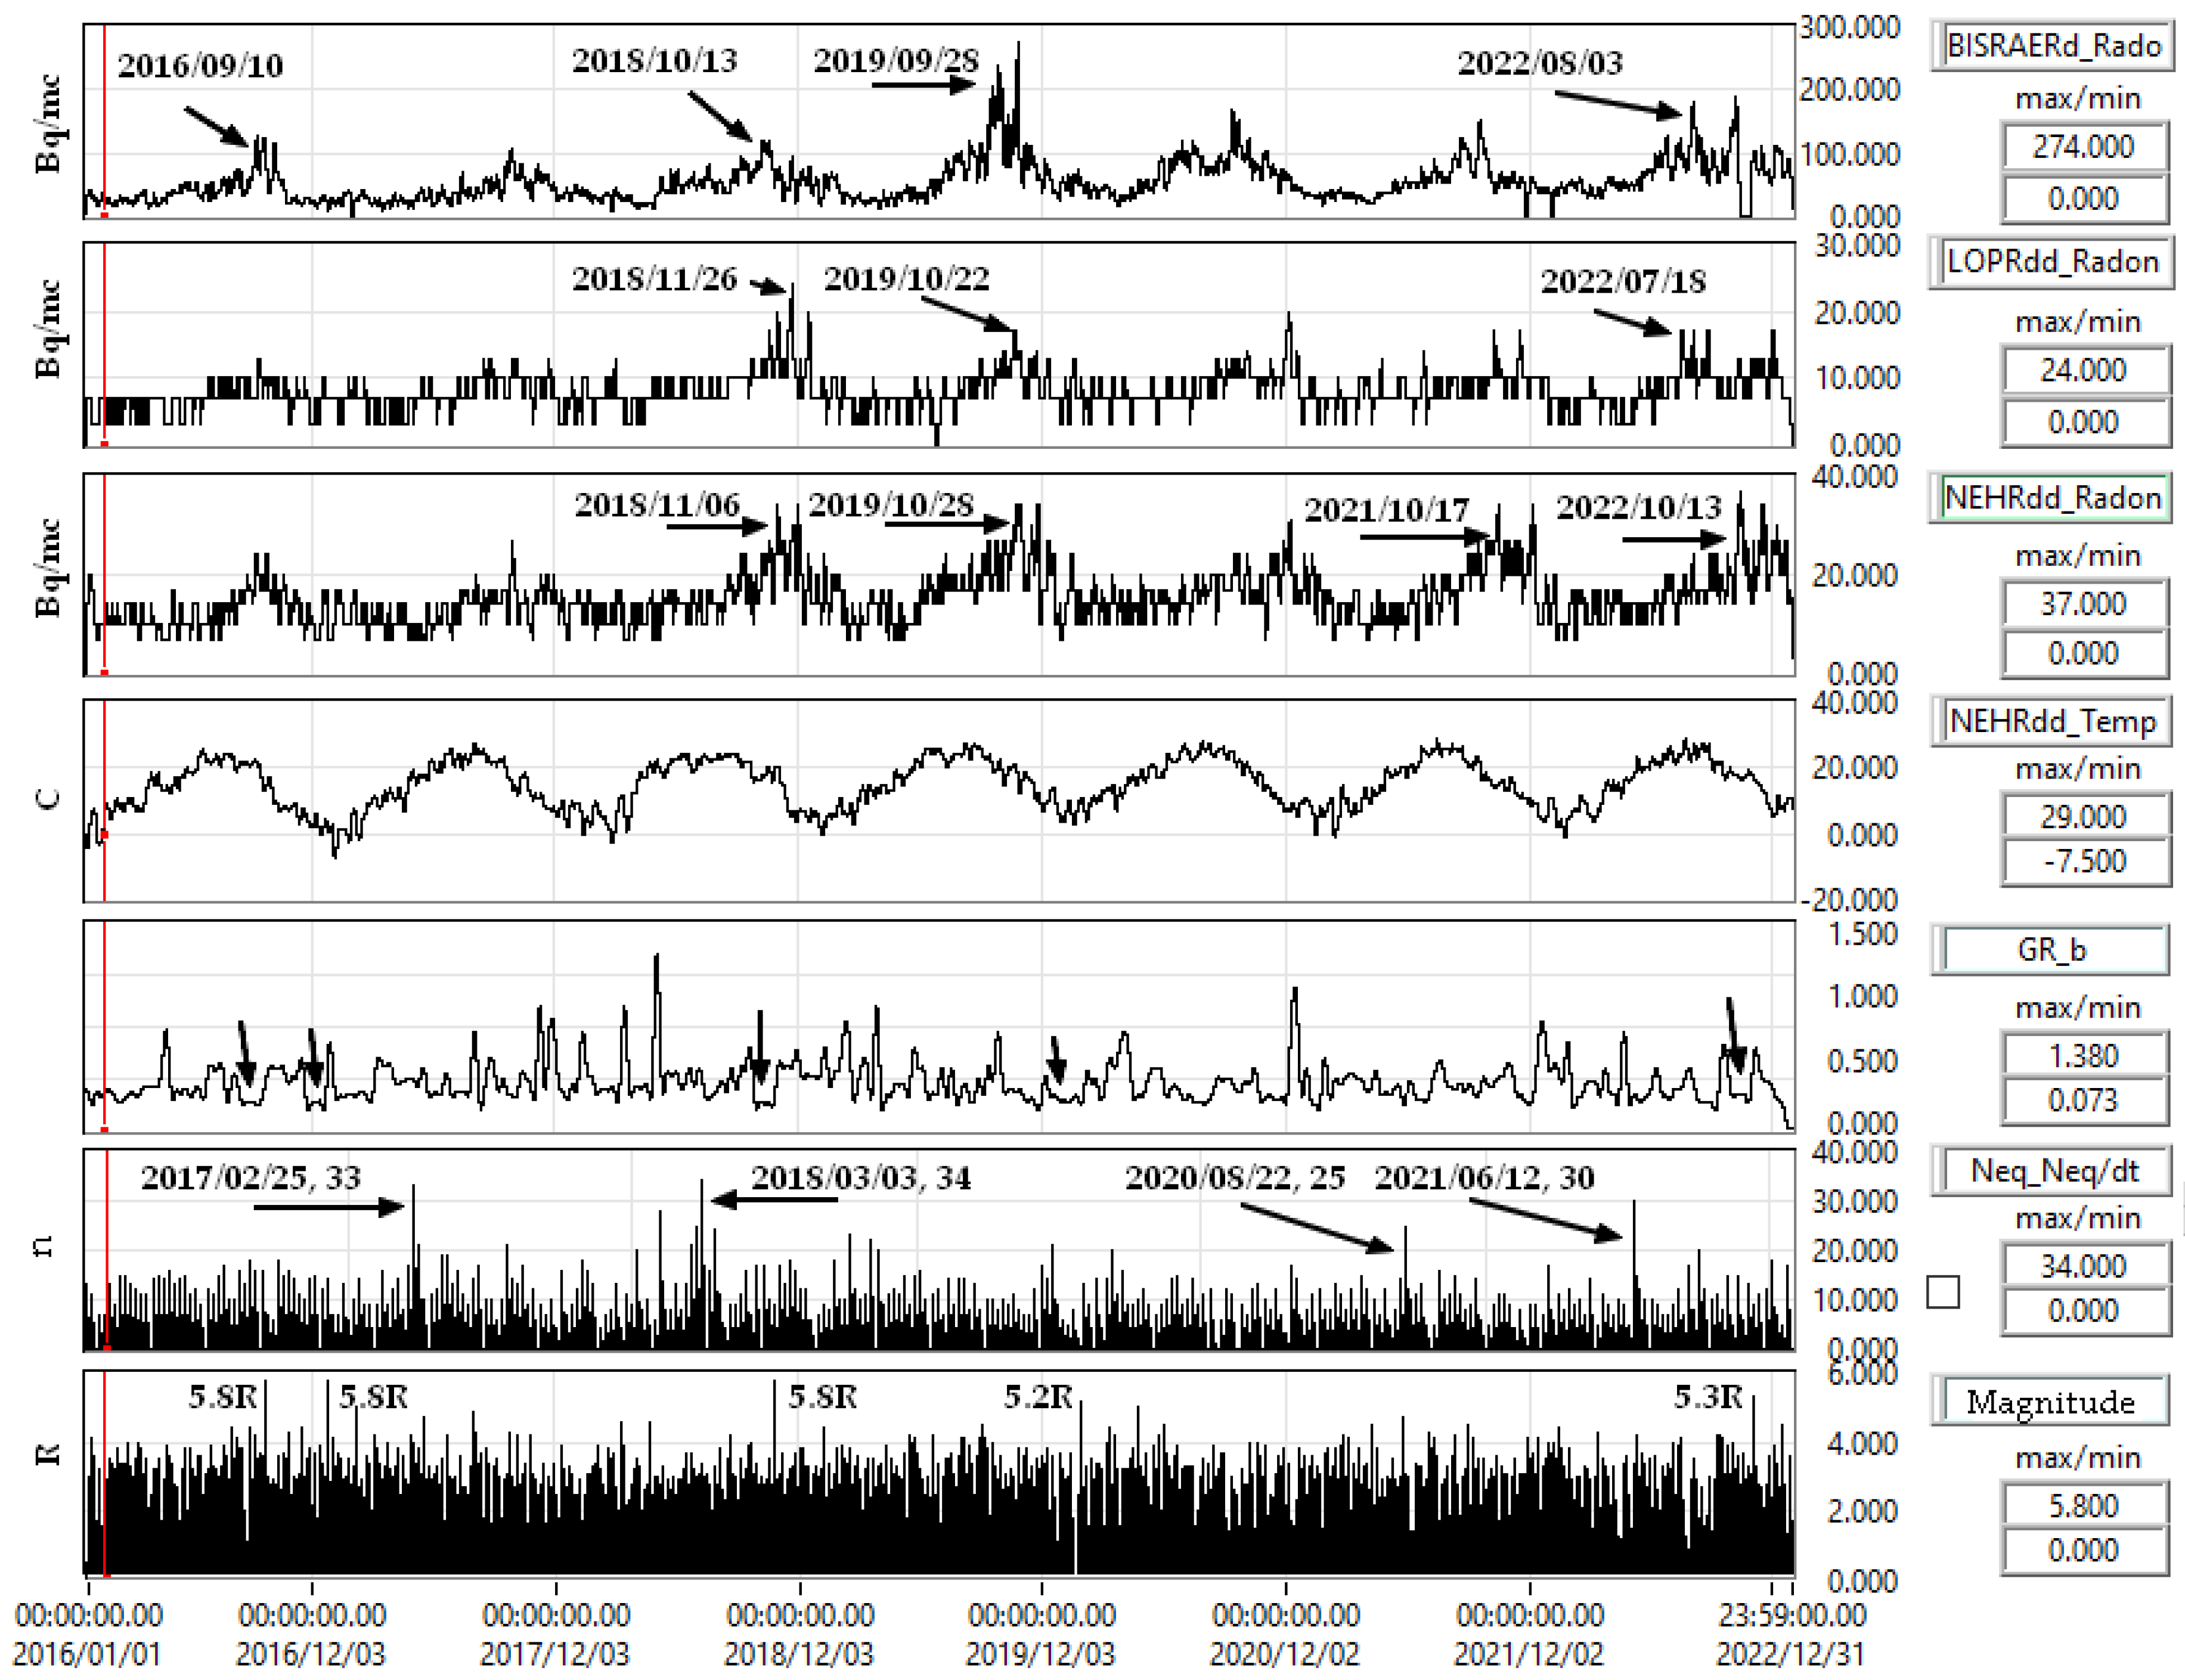
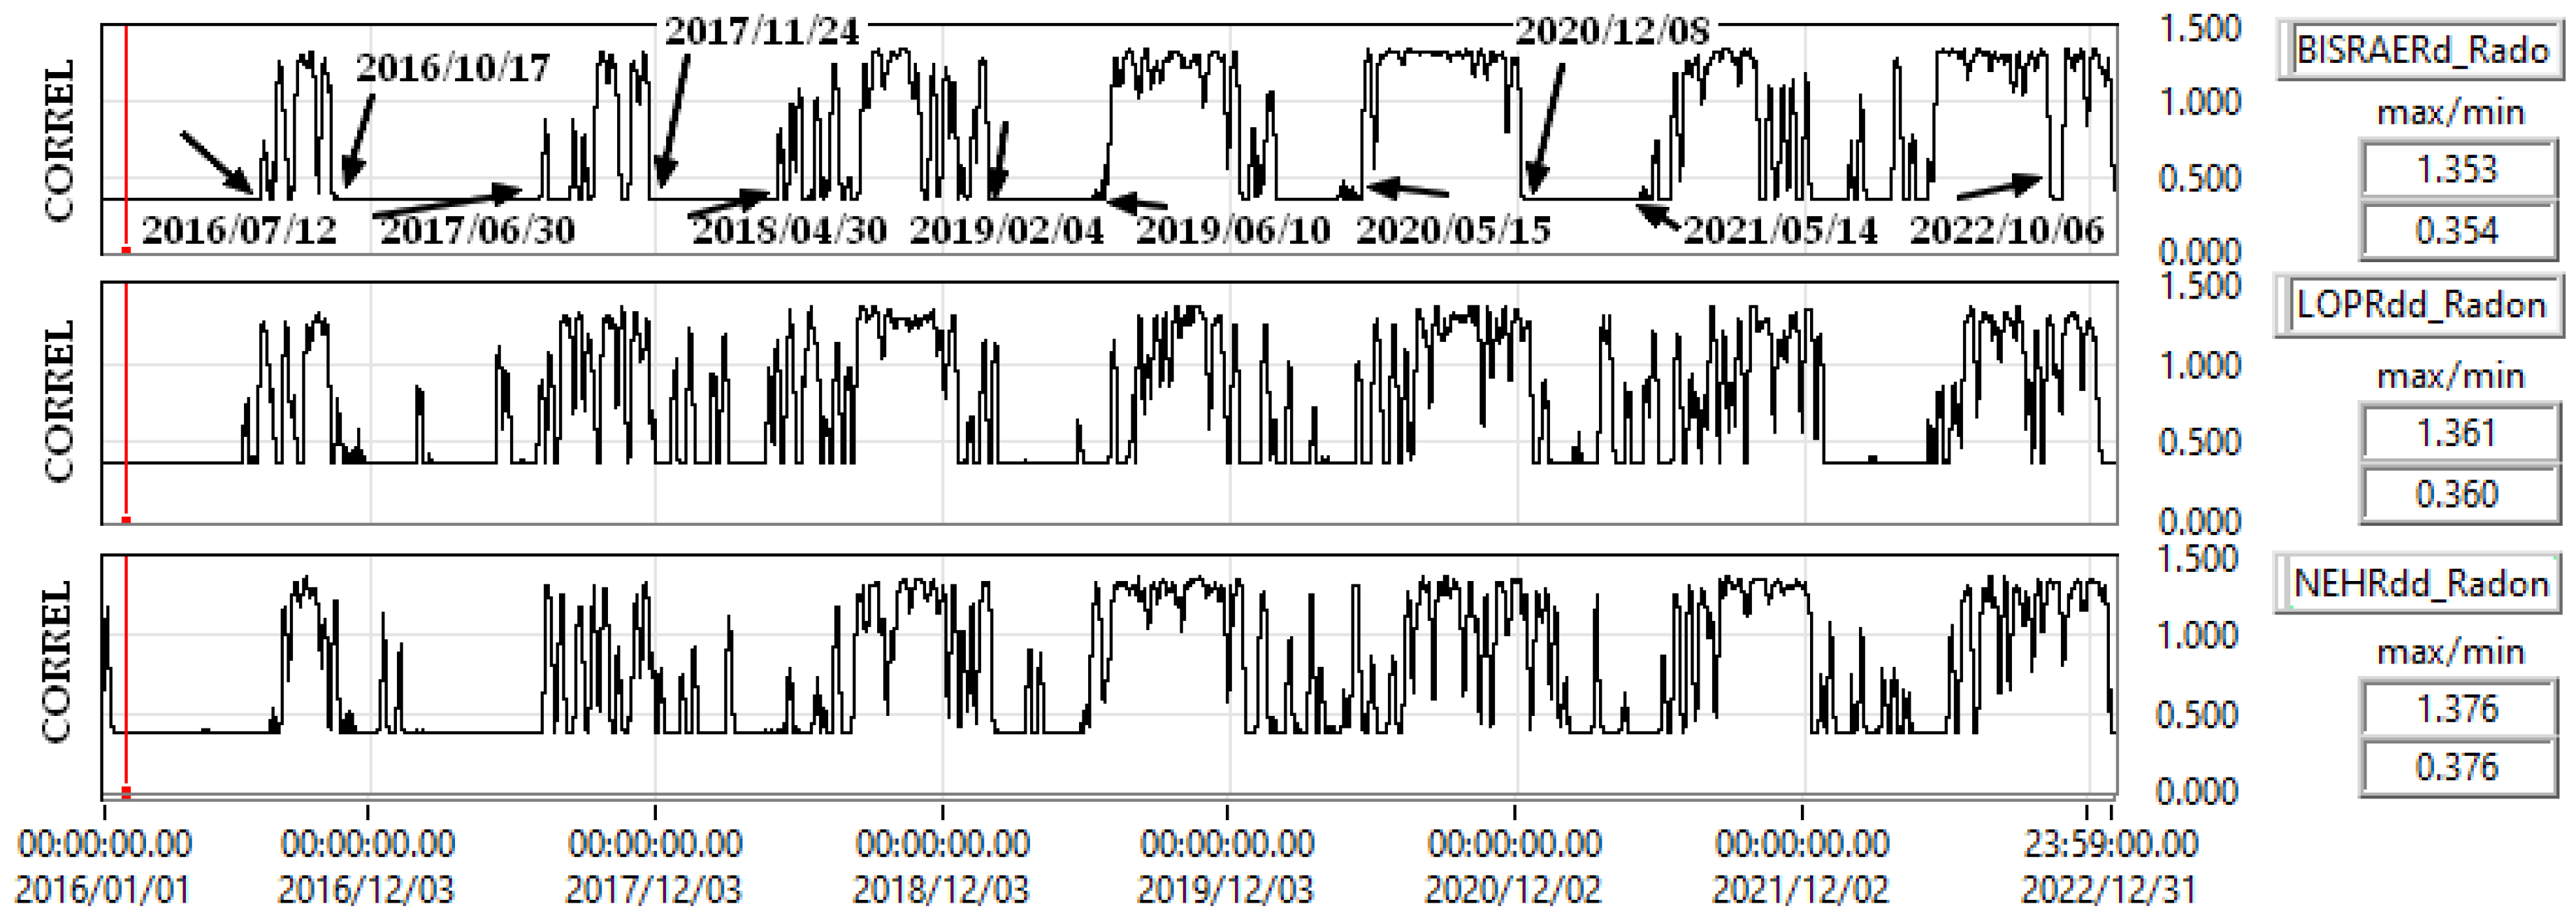
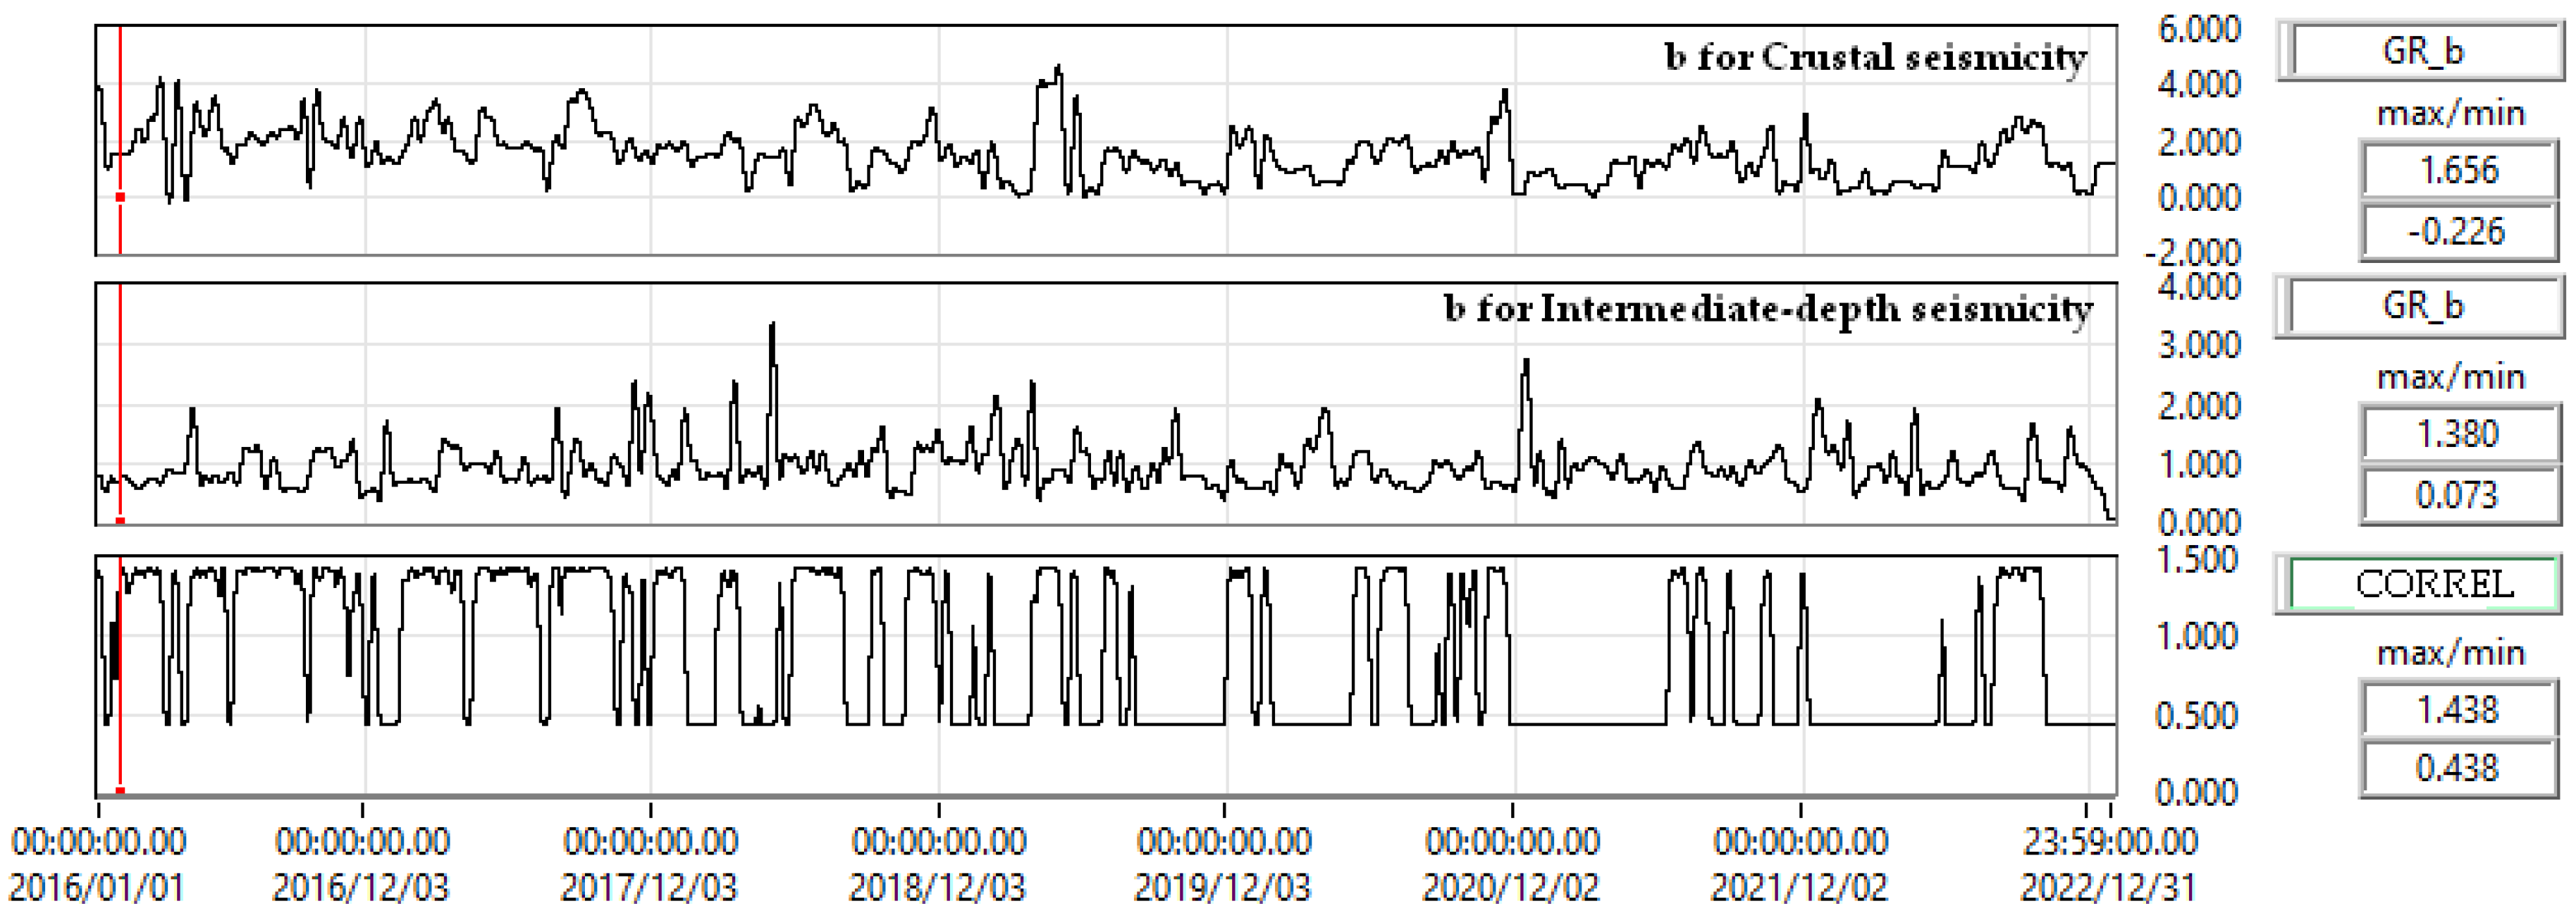
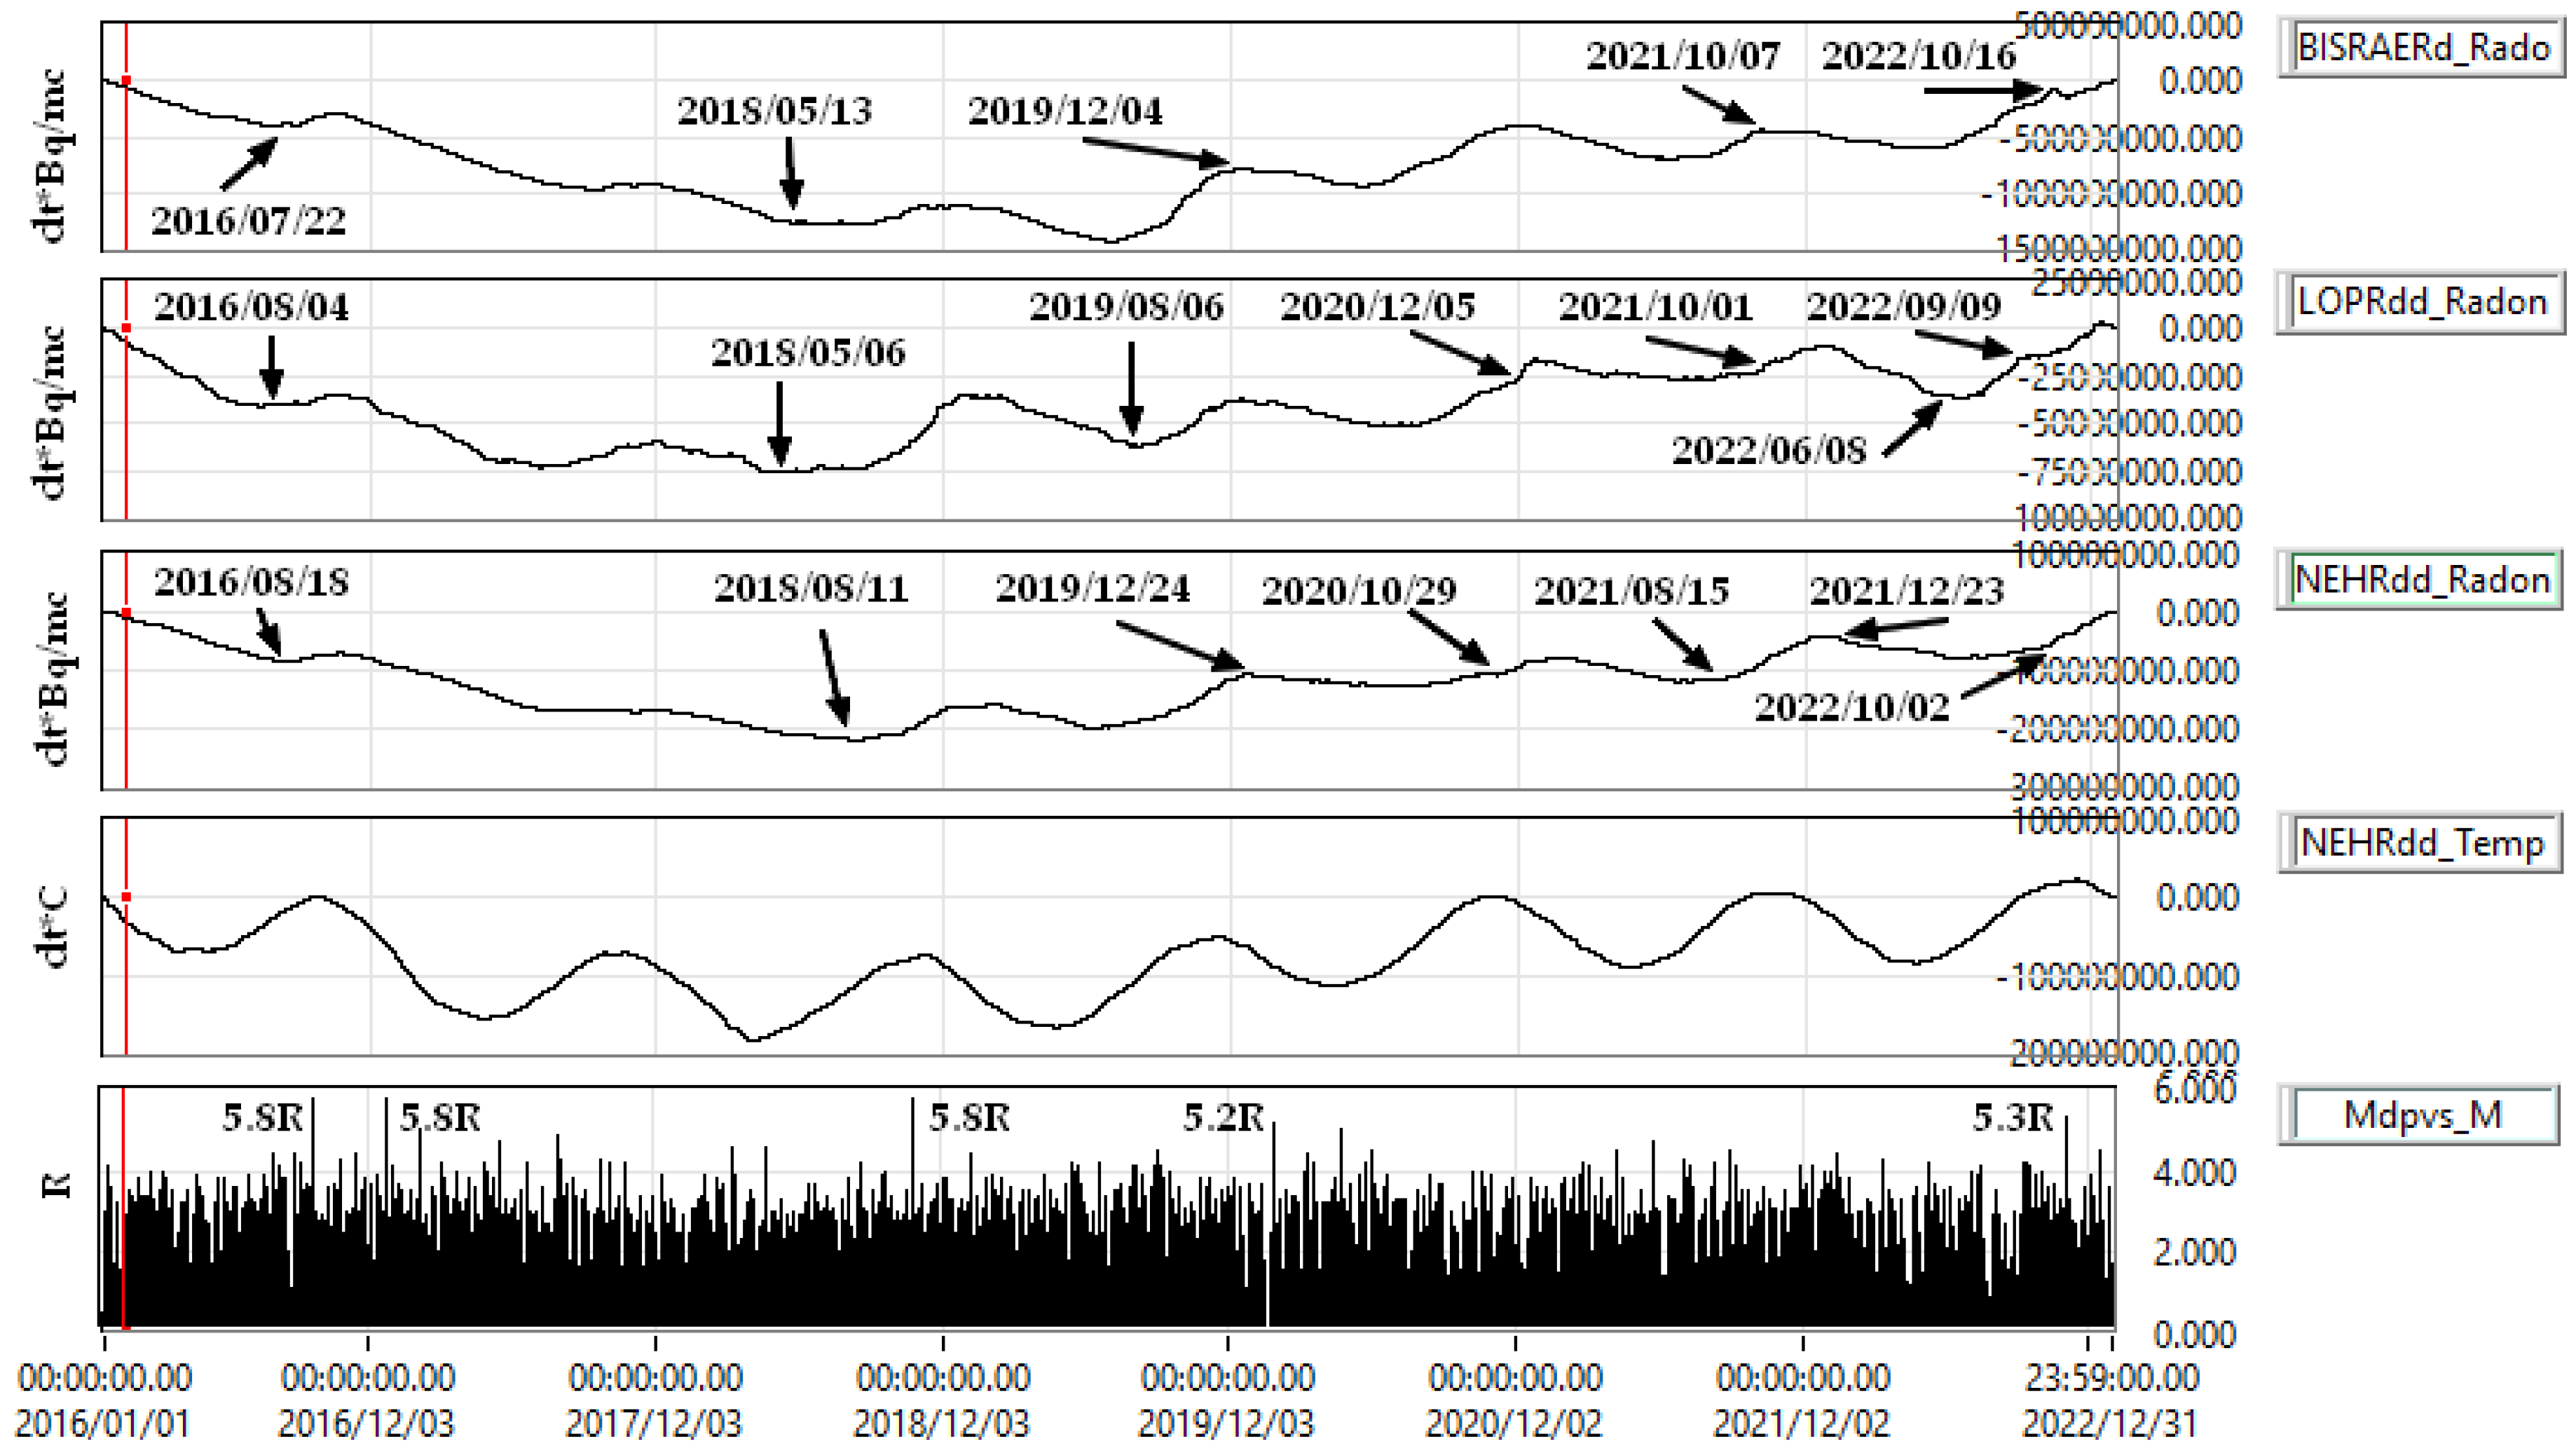
|
Station, 2016 - 2022 |
Mean | Standard Deviation |
Mean | Standard Deviation |
| H>20 Km | H<20 Km | |||
| BISRAERd | 0.3541 | 30.9621 | 0.3562 | 30.9617 |
| LOPRdd | 0.3707 | 2.7410 | 0.3703 | 2.7410 |
| NEHRdd | 0.3766 | 5.1496 | 0.3751 | 5.1495 |
4. Conclusions
Author Contributions
Funding
Data Availability Statement
Acknowledgments
Conflicts of Interest
References
- Toader VE, Moldovan IA, Marmureanu A, Dutta PK, Partheniu R, Nastase E. Monitoring of radon and air ionization in a seismic area. Rom Reports Phys. 2017;69(3):842013.
- Toader VE, Nicolae V, Moldovan IA, Ionescu C, Marmureanu A. Monitoring of Gas Emissions in Light of an OEF Application. Atmosphere (Basel). 2020;12(1):26. doi:10.3390/atmos12010026. [CrossRef]
- Toader VE, Mihai A, Moldovan IA, Ionescu C, Marmureanu A, Lingvay I. Implementation of a radon monitoring network in a seismic area. Atmosphere (Basel). 2021;12(8):1-14. doi:10.3390/atmos12081041. [CrossRef]
- Omi T, Ogata Y, Shiomi K, Enescu B, Sawazaki K, Aihara K. Implementation of a Real-Time System for Automatic Aftershock Forecasting in Japan. Seismol Res Lett. 2019;90(1):242-250. doi:10.1785/0220180213. [CrossRef]
- Toader, VE.; Moldovan, I.A; Mihai, A. Forecast Earthquake Using Acoustic Emission. In: International Multidisciplinary Scientific GeoConference Surveying Geology and Mining Ecology Management, SGEM. Vol 19. ; 2019:803-811. doi:10.5593/sgem2019/1.1/S05.100. [CrossRef]
- Kachakhidze-Murphy N, Kachakhidze M, Biagi PF. Earthquake Forecasting Possible Methodology. GESJ Phys. 2016;1(15):102-111. http://gesj.internet-academy.org.ge/download.php?id=2790.pdf&t=1.
- Zechar JD, Marzocchi W, Wiemer S. Operational earthquake forecasting in Europe: progress, despite challenges. Bull Earthq Eng. 2016;14(9):2459-2469. doi:10.1007/s10518-016-9930-7. [CrossRef]
- Thomas H., Yun-Tai Chen, Paolo Gasparini, et al. OPERATIONAL EARTHQUAKE FORECASTING. State of Knowledge and Guidelines for Utilization. Ann Geophys. 2011;54(4). doi:10.4401/ag-5350. [CrossRef]
- Jordan TH, Marzocchi W, Michael AJ, Gerstenberger MC. Operational earthquake forecasting can enhance earthquake preparedness. Ann Geophys. 2011;54(4):315-391. doi:10.4401/ag-5350. [CrossRef]
- Victorin Toader, Iren-Adelina Moldovan, Constantin Ionescu AM. ULF RADIO MONITORING NETWORK IN A SEISMIC AREA. In: EGU General Assembly Conference. Geophysical Research Abstracts; 2017:18037.
- Ciogescu Ovidiu, Lingvay Daniel, Șchiopu Mihaela, Lingvay Iosif. Toader Victorin Emilian, Ionescu Constantin, Marmureanu Alexandru MA. Complex system for prediction, warning of seismic movements and fire prevention following damage to gas installations caused by major earthquakes. In: BOPI patent application 02/2021; a 2020 00500/10-08-2020, ed. OSIM. Vol 2. Directorat. ; 2021:35.
- Nava FA, Márquez-Ramírez VH, Zúñiga FR, Lomnitz C. Gutenberg–Richter b-value determination and large-magnitudes sampling. Nat Hazards. 2017;87(1). doi:10.1007/s11069-017-2750-5. [CrossRef]
- Toader VE, Popescu IM, Moldovan IA, Constantin I. Vrancea seismicity analysis based on cumulative seismic energy. UPB Sci Bull Ser A Appl Math Phys. 2015;77(2):297-308.
- D’Incecco S, Petraki E, Priniotakis G, Papoutsidakis M, Yannakopoulos P, Nikolopoulos D. CO2 and Radon Emissions as Precursors of Seismic Activity. Earth Syst Environ. 2021;5(3):655-666. doi:10.1007/s41748-021-00229-2. [CrossRef]
- Zafrir H, Barbosa S, Levintal E, Weisbrod N, Ben Horin Y, Zalevsky Z. The Impact of Atmospheric and Tectonic Constraints on Radon-222 and Carbon Dioxide Flow in Geological Porous Media - A Dozen-Year Research Summary. Front Earth Sci. 2020;8(October):1-28. doi:10.3389/feart.2020.559298. [CrossRef]
- Chen Z, Li Y, Liu Z, Wang J, Zhou X, Du J. Radon emission from soil gases in the active fault zones in the Capital of China and its environmental effects. Sci Rep. 2018;8(1):16772. doi:10.1038/s41598-018-35262-1. [CrossRef]
- Khan MA, Khattak NU, Hanif M. Radon emission along faults: a case study from district Karak, Sub-Himalayas, Pakistan. J Radioanal Nucl Chem. 2022;331(5):1995-2003. doi:10.1007/s10967-022-08283-4. [CrossRef]
- Ioannides K, Papachristodoulou C, Stamoulis K, et al. Soil gas radon: a tool for exploring active fault zones. Appl Radiat Isot. 2003;59(2-3):205-213. doi:10.1016/S0969-8043(03)00164-7. [CrossRef]
- Xuan PT, Duong NA, Chinh V Van, Dang PT, Qua NX, Pho N Van. Soil Gas Radon Measurement for Identifying Active Faults in Thua Thien Hue (Vietnam). J Geosci Environ Prot. 2020;08(07):44-64. doi:10.4236/gep.2020.87003. [CrossRef]
- Haquin G, Zafrir H, Ilzycer D, Weisbrod N. Effect of atmospheric temperature on underground radon: A laboratory experiment. J Environ Radioact. 2022;253-254:106992. doi:10.1016/j.jenvrad.2022.106992. [CrossRef]
- Kulali F, Akkurt I, Özgür N. The Effect of Meteorological Parameters on Radon Concentration in Soil Gas. Acta Phys Pol A. 2017;132(3-II):999-1001. doi:10.12693/APhysPolA.132.999. [CrossRef]
- Ivanova K, Stojanovska Z, Djunakova D, Djounova J. Analysis of the spatial distribution of the indoor radon concentration in school’s buildings in Plovdiv province, Bulgaria. Build Environ. 2021;204:108122. doi:10.1016/j.buildenv.2021.108122. [CrossRef]
- Bem H, Janiak S, Przybył B. Survey of indoor radon (Rn-222) entry and concentrations in different types of building in Kalisz, Poland. J Radioanal Nucl Chem. 2020;326(2):1299-1306. doi:10.1007/s10967-020-07394-0. [CrossRef]
- Al-Hilal M, Abdul-Wahed MK. Soil gas radon measurements for investigating the actual status of seismic quiescence along the bounding fault of the Ghab pull-apart basin in western Syria. Geofis Int. 2018;57(3):177-187.
- Ptiček Siročić A, Kovač S, Stanko D, Pejak I. Dependence of concentration of radon on environmental parameters. Environ Eng. 2021;8(1-2):17-25. doi:10.37023/ee.8.1-2.3. [CrossRef]
- Shahrokhi A, Burghele BD, Fábián F, Kovács T. New study on the correlation between carbon dioxide concentration in the environment and radon monitor devices. J Environ Radioact. 2015;150:57-61. doi:10.1016/j.jenvrad.2015.07.028. [CrossRef]
- Allen VREX. AUTOMATIC EARTHQUAKE RECOGNITION AND TIMING FROM Single Traces. Bull Seismol Soc Americ. 1978;68(5):1521-1532.
- Allen R. Automatic phase pickers: Their present use and future prospects. Bull Seismol Soc Am | Geosci. 1982;72(6B):225–S242. Accessed April 28, 2020. https://pubs.geoscienceworld.org/ssa/bssa/article-abstract/72/6B/S225/102172/Automatic-phase-pickers-Their-present-use-and?redirectedFrom=fulltext.
- Bull Seismol Soc Am, 1606. [CrossRef]
- Geofis Int.
- J Environ Radioact. [CrossRef]
- Radiat Meas. [CrossRef]
- Environ Monit Assess. [CrossRef]
- New Phytol, 1470. [CrossRef]
- Environ Sci Technol, 6350. [CrossRef]
- J Environ Pollut Control.
- Sci Total Environ. [CrossRef]
- Geosci Instrumentation, Methods Data Syst. [CrossRef]
- Pure Appl Geophys PAGEOPH, 1025. [CrossRef]
- S.J. Bauer, W.P. Gardner HL. Real Time Degassing of Rock during Deformation. In: 50th US Rock Mechanics / Geomechanics Symposium Held in Houston, TX, USA. ; 2016:1-7. file:///C:/Users/C57.DESKTOP-ML0C8QK.000/Downloads/Bauer et al.%252c2016_ARMA.pdf.
- Ambrosino F, Thinová L, Briestenský M, Giudicepietro F, Roca V, Sabbarese C. Analysis of geophysical and meteorological parameters influencing 222Rn activity concentration in Mladeč caves (Czech Republic) and in soils of Phlegrean Fields caldera (Italy). Appl Radiat Isot. 2020;160. doi:10.1016/j.apradiso.2020.109140. [CrossRef]
- Morales-Simfors N, Wyss RA, Bundschuh J. Recent progress in radon-based monitoring as seismic and volcanic precursor: A critical review. Crit Rev Environ Sci Technol. 2020;50(10):979-1012. doi:10.1080/10643389.2019.1642833. [CrossRef]
Disclaimer/Publisher’s Note: The statements, opinions and data contained in all publications are solely those of the individual author(s) and contributor(s) and not of MDPI and/or the editor(s). MDPI and/or the editor(s) disclaim responsibility for any injury to people or property resulting from any ideas, methods, instructions or products referred to in the content. |
© 2023 by the authors. Licensee MDPI, Basel, Switzerland. This article is an open access article distributed under the terms and conditions of the Creative Commons Attribution (CC BY) license (http://creativecommons.org/licenses/by/4.0/).


