Submitted:
23 May 2023
Posted:
24 May 2023
You are already at the latest version
Abstract
Keywords:
1. Introduction
2. Materials and methods
2.1. Culture and quantification of bacterial strains
2.2. Animal experiments
2.3. Analysis serum biochemical indicators
2.4. Determination of total bile acids (TBAs)
2.5. Histopathology
2.6. RNA extraction and quantitative real-time PCR
2.7. Extraction of tissue protein and western blot analysis
2.8. 16S rRNA sequencing
2.9. Bacterial labeling with fluorescent probe
2.10. Statistical analysis
3. Results
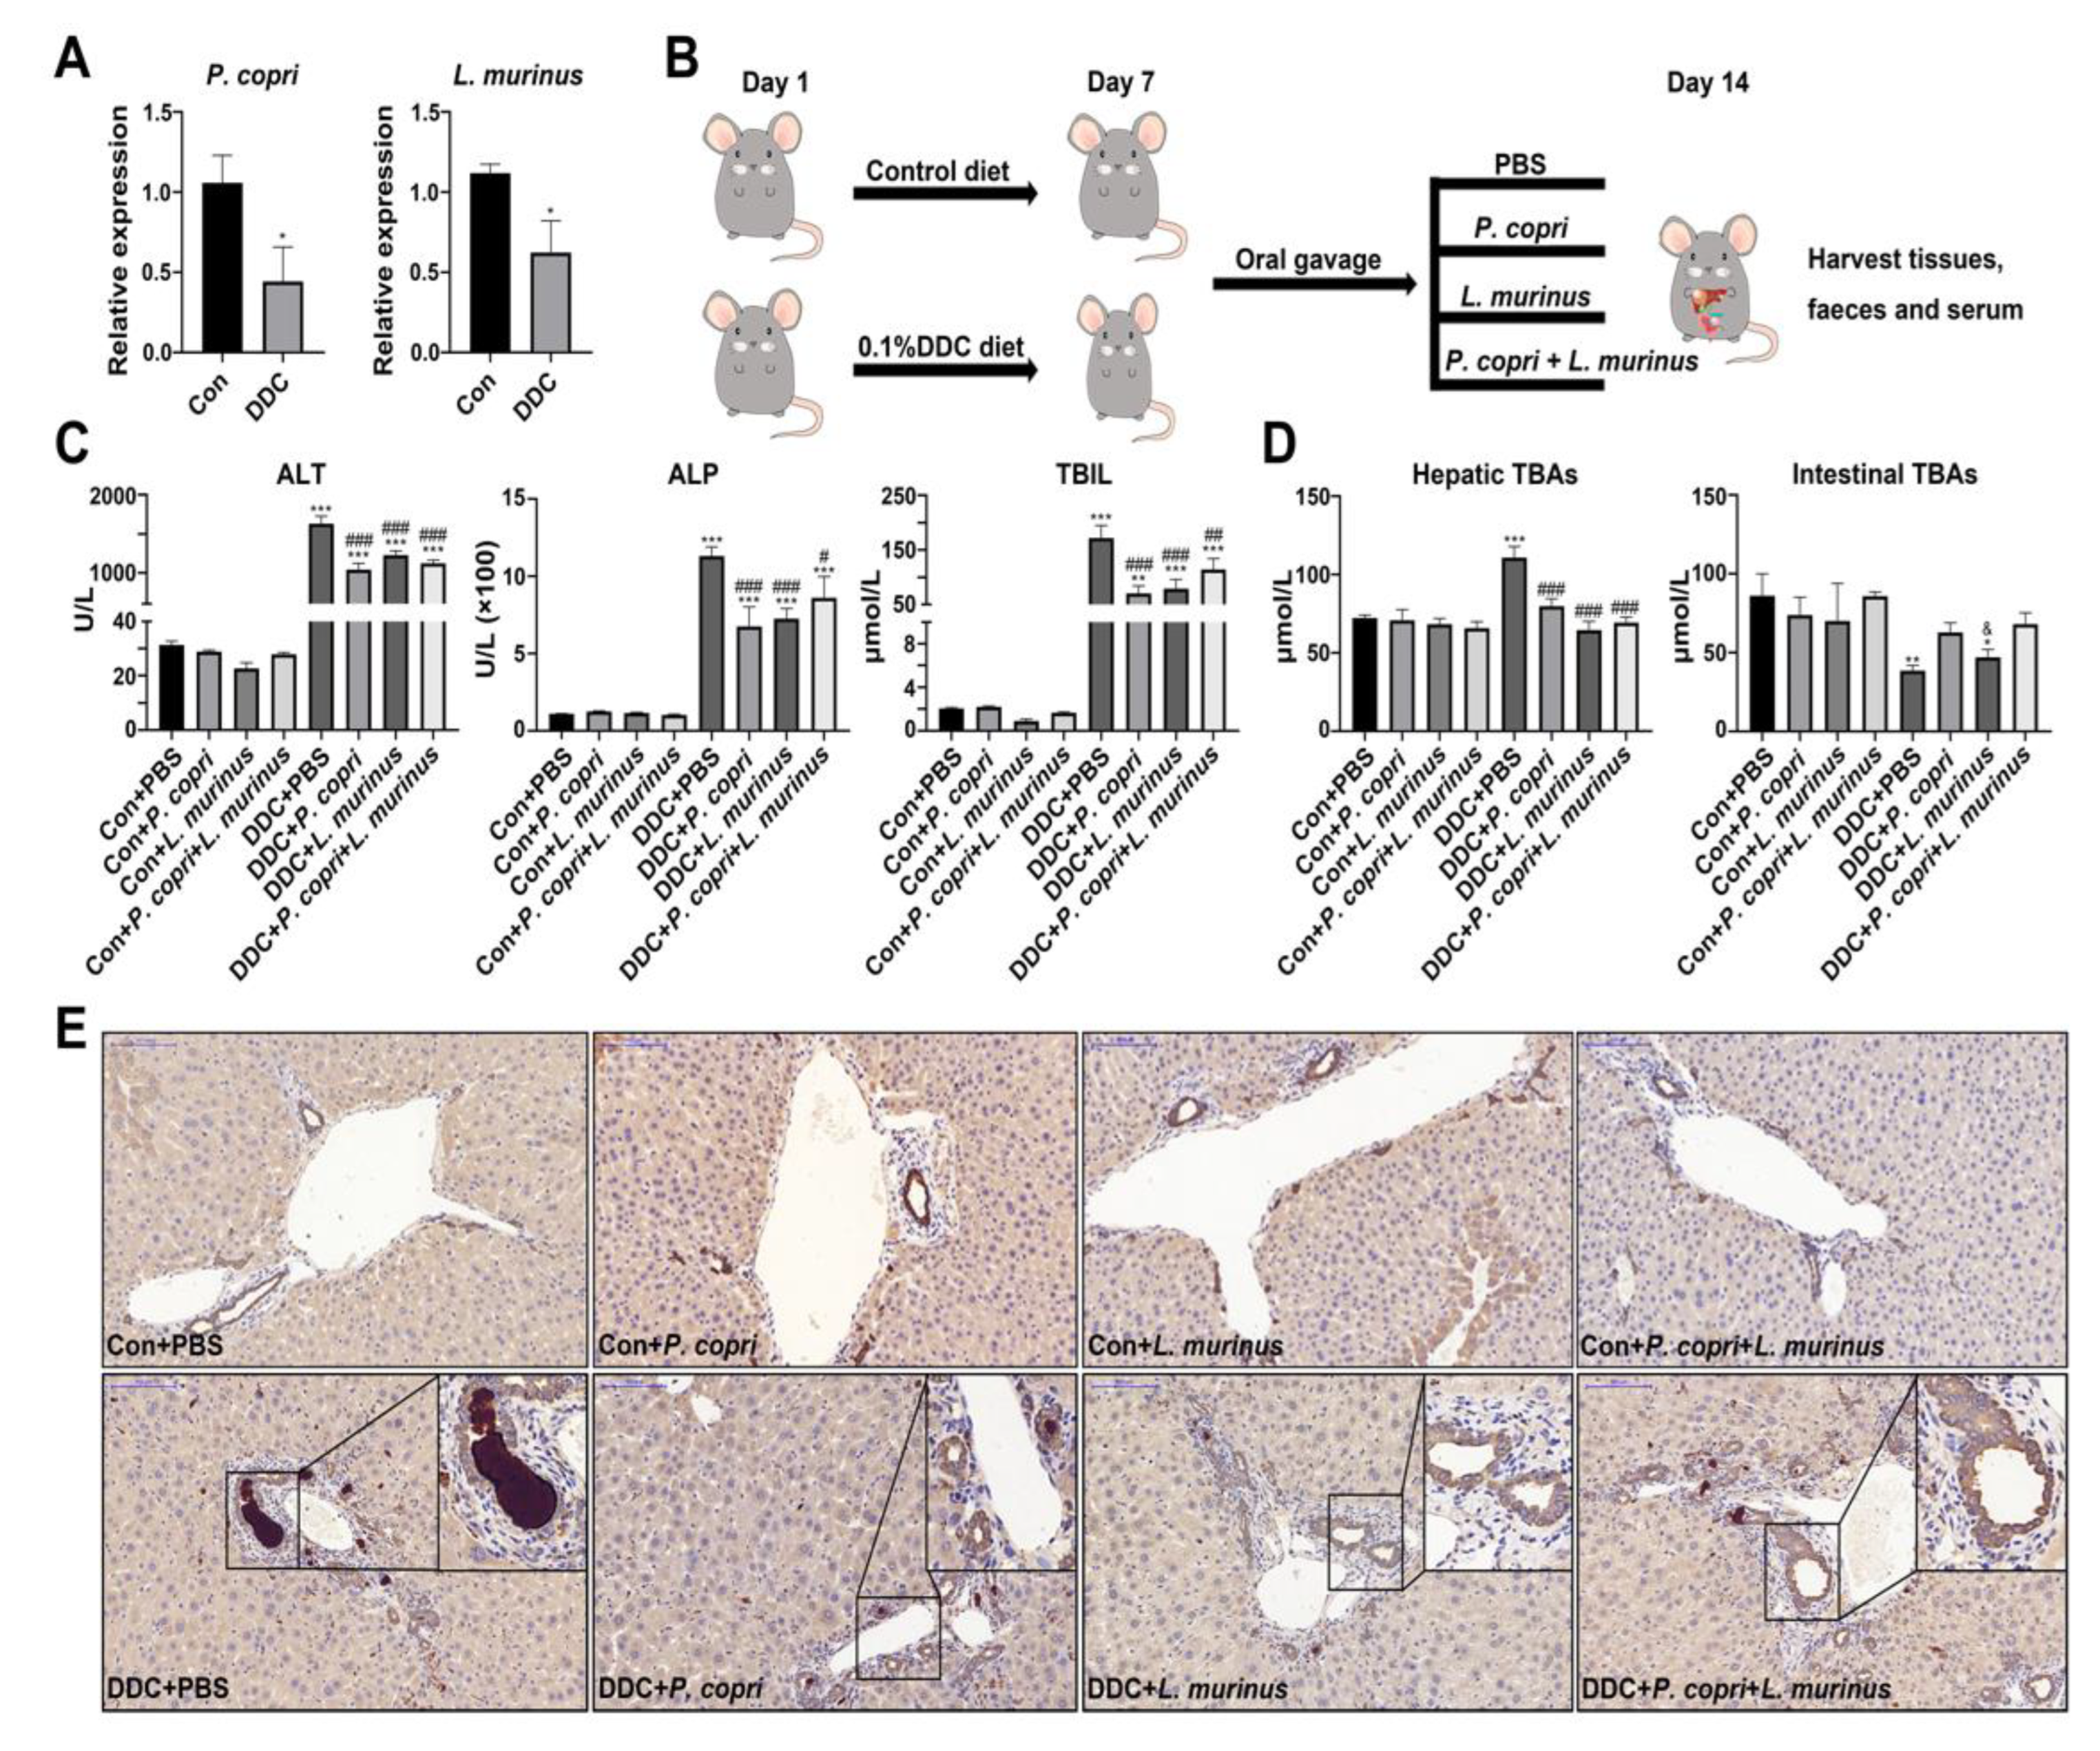
- P. copri and L. murinus coordinately improved DDC-induced liver damage, bile duct obstruction and cholestasis.
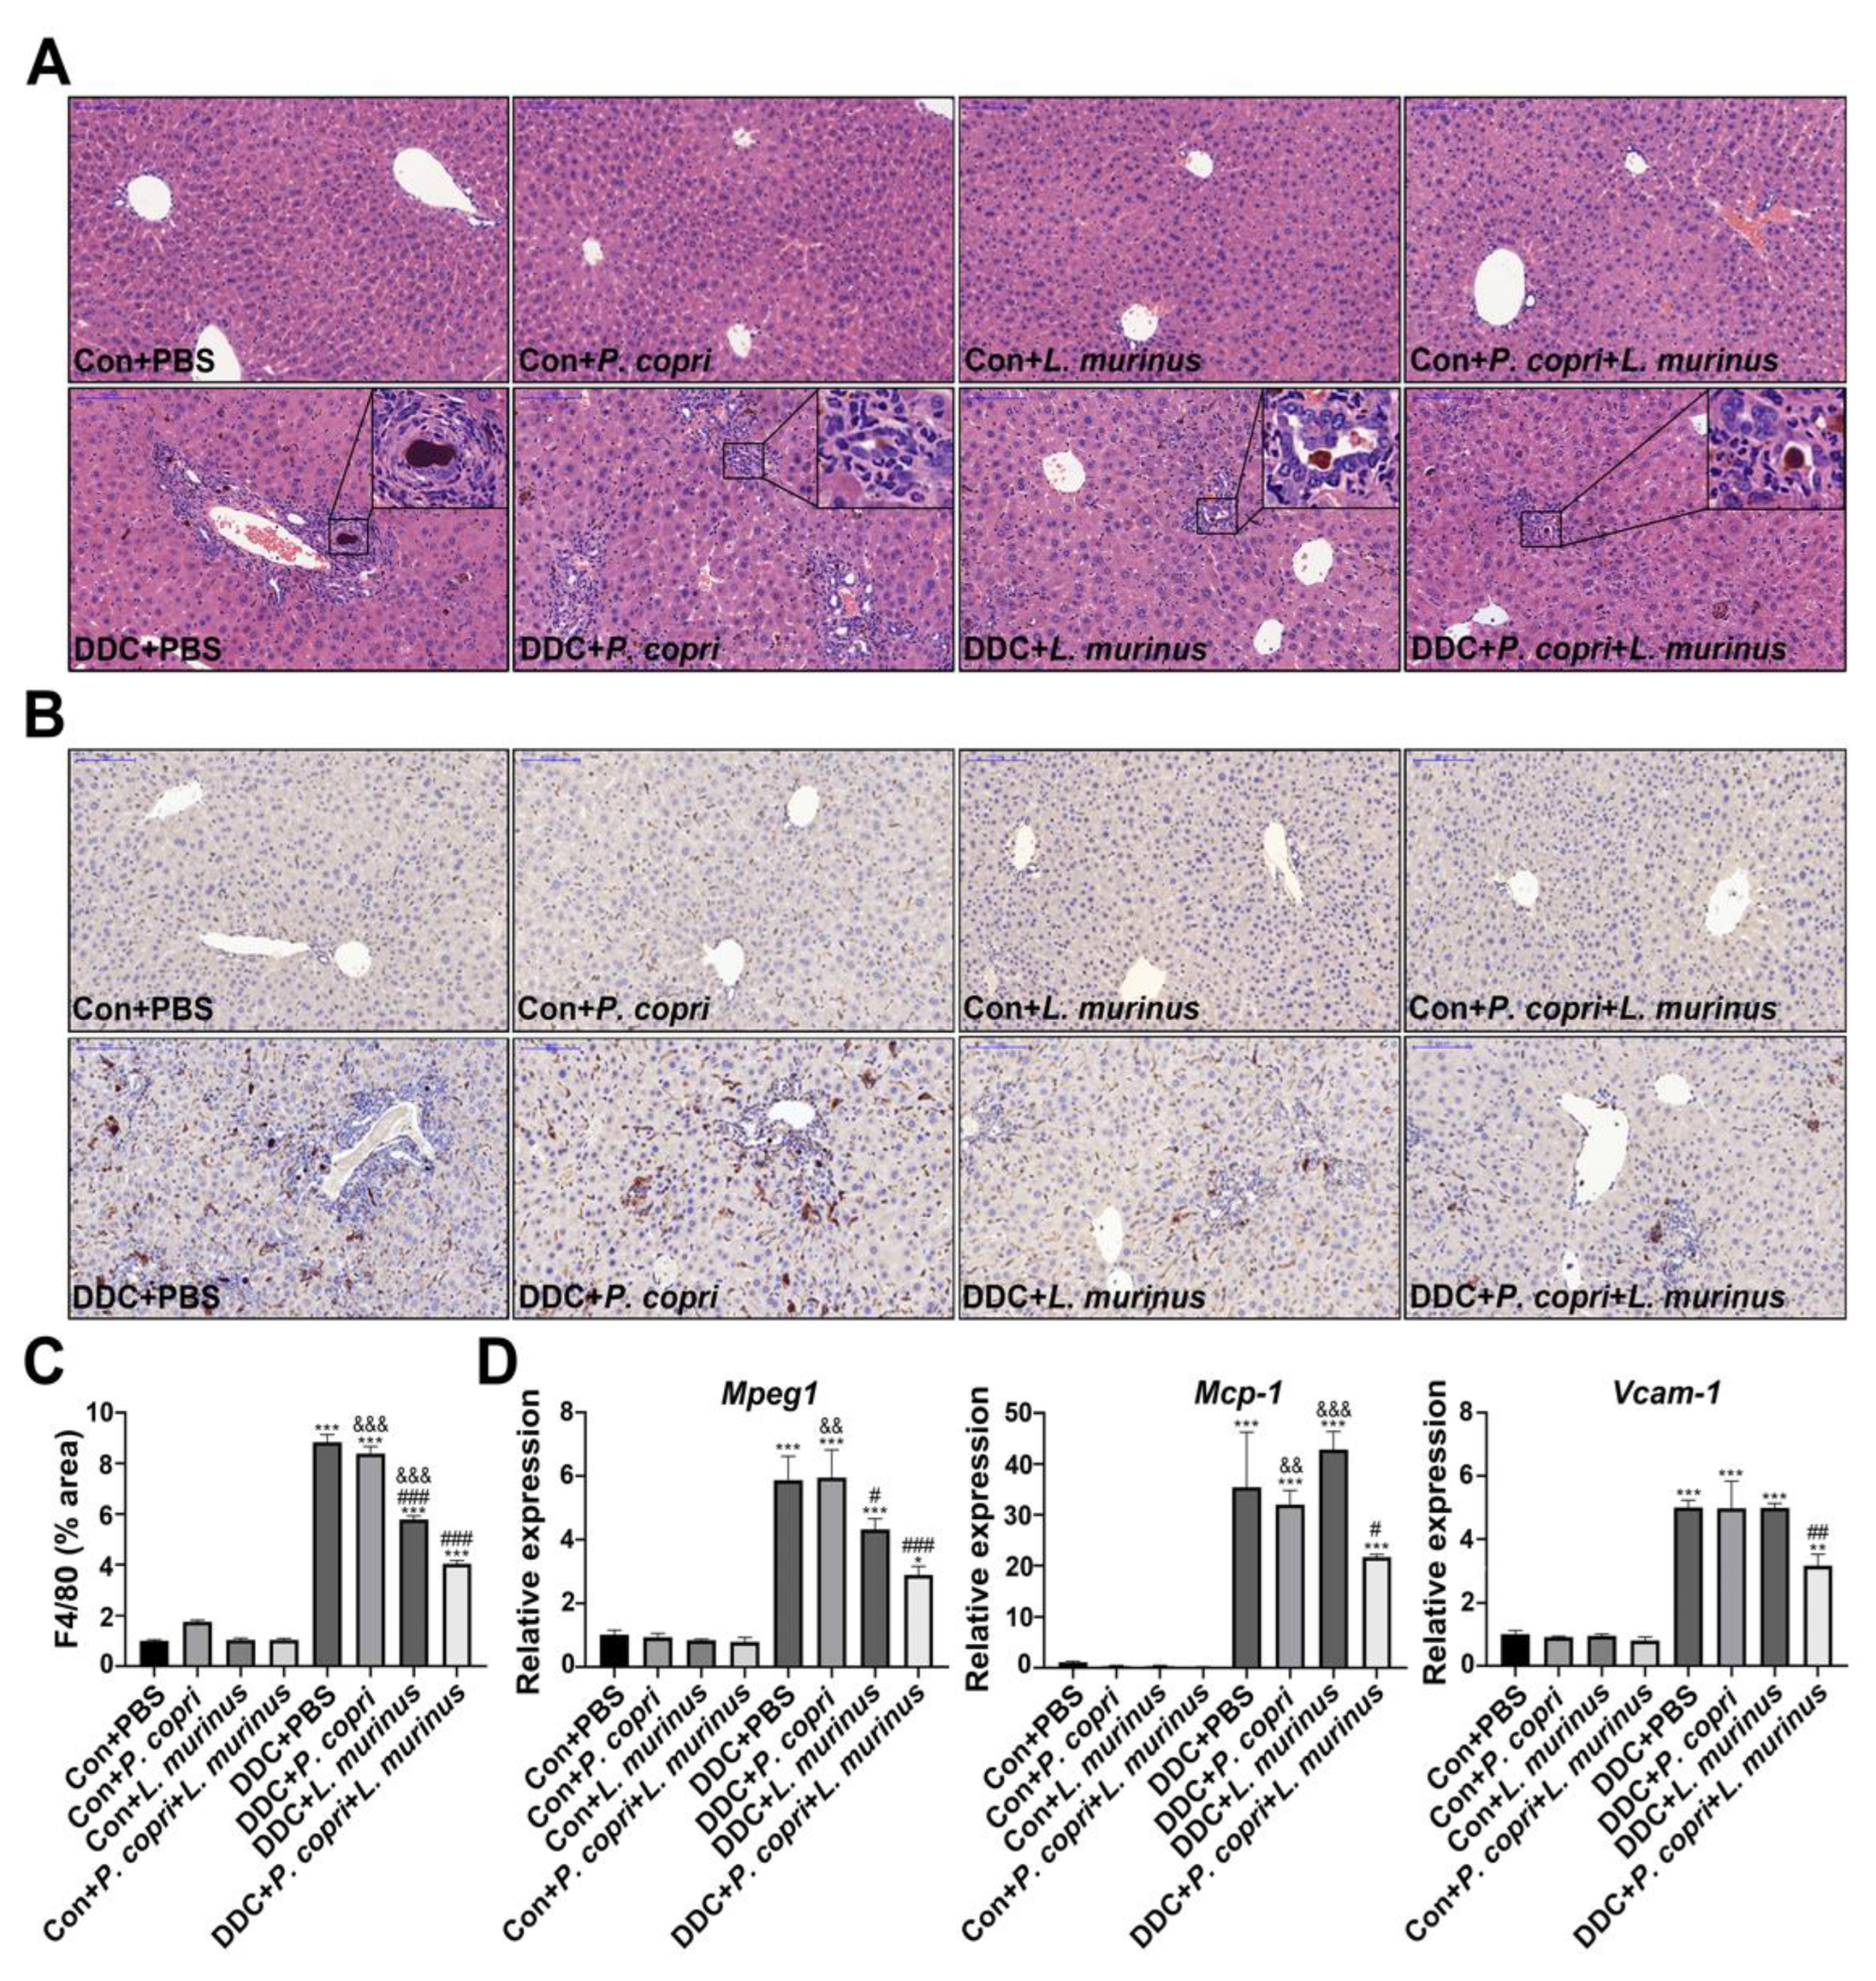
- Supplementation with P. copri accelerate the improvement of L. murinus on inflammation of PSC mice.
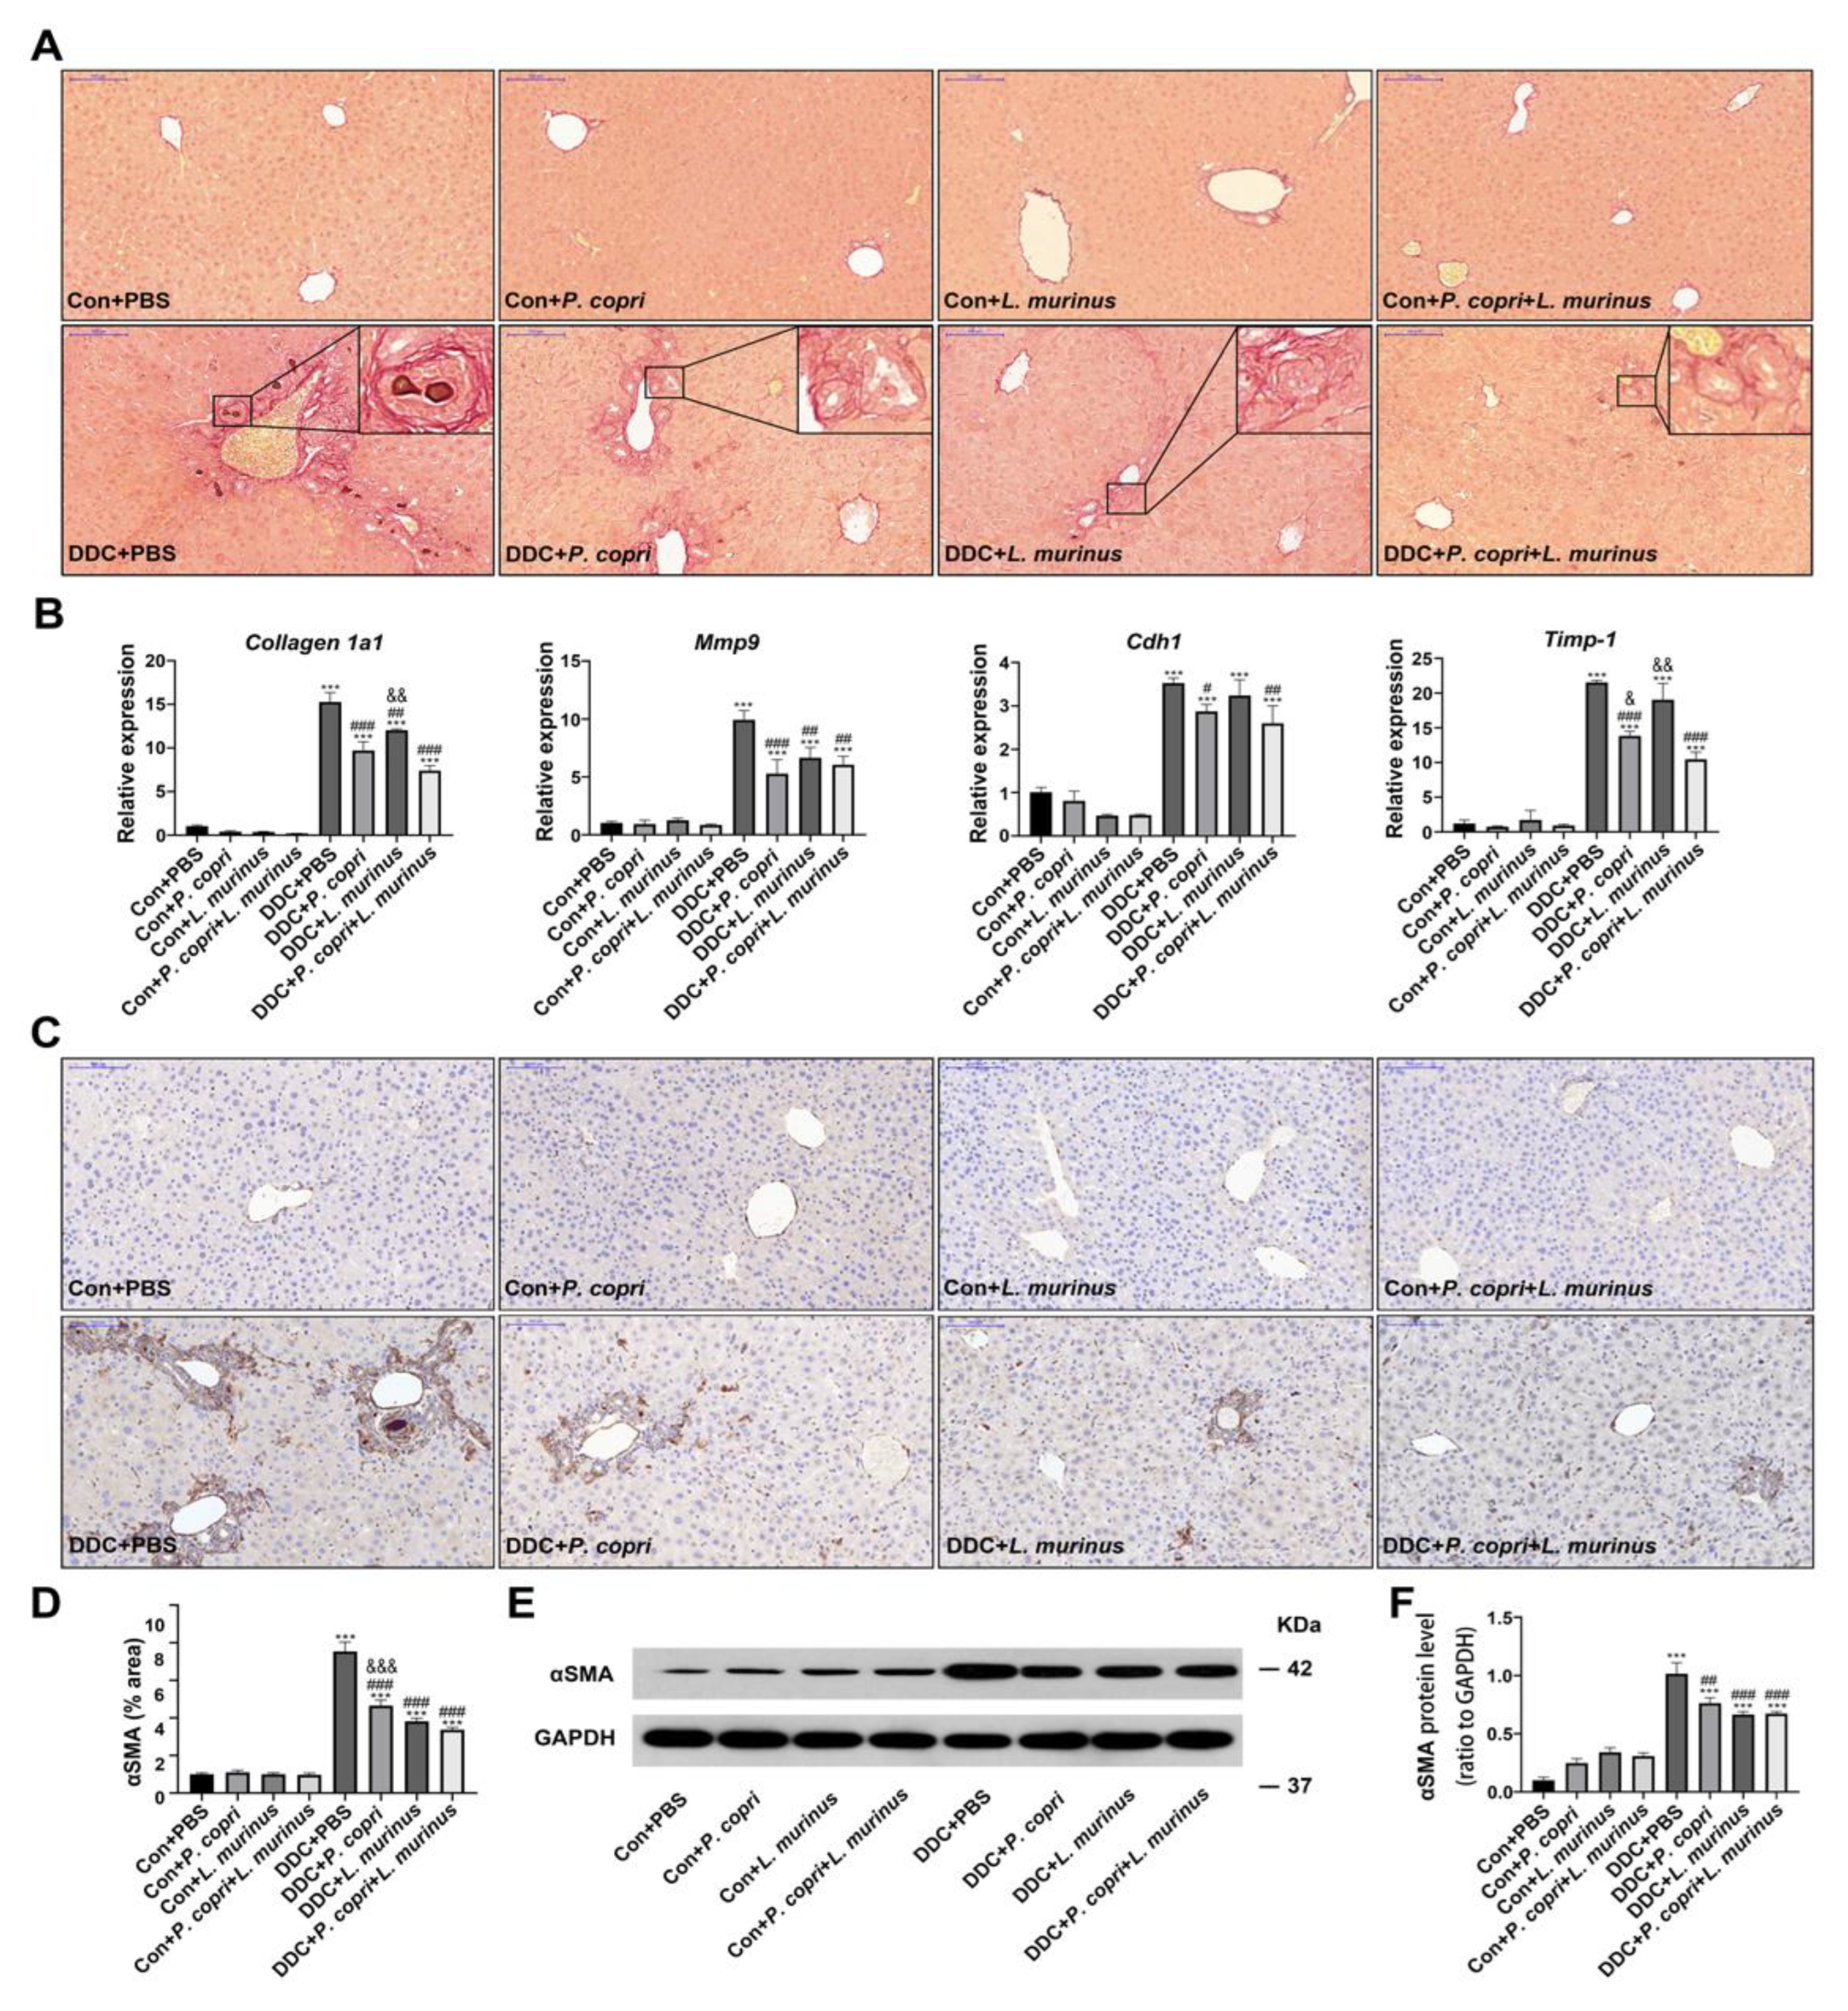
- Coordination between P. copri and L. murinus downregulated DDC-induced liver fibrosis.
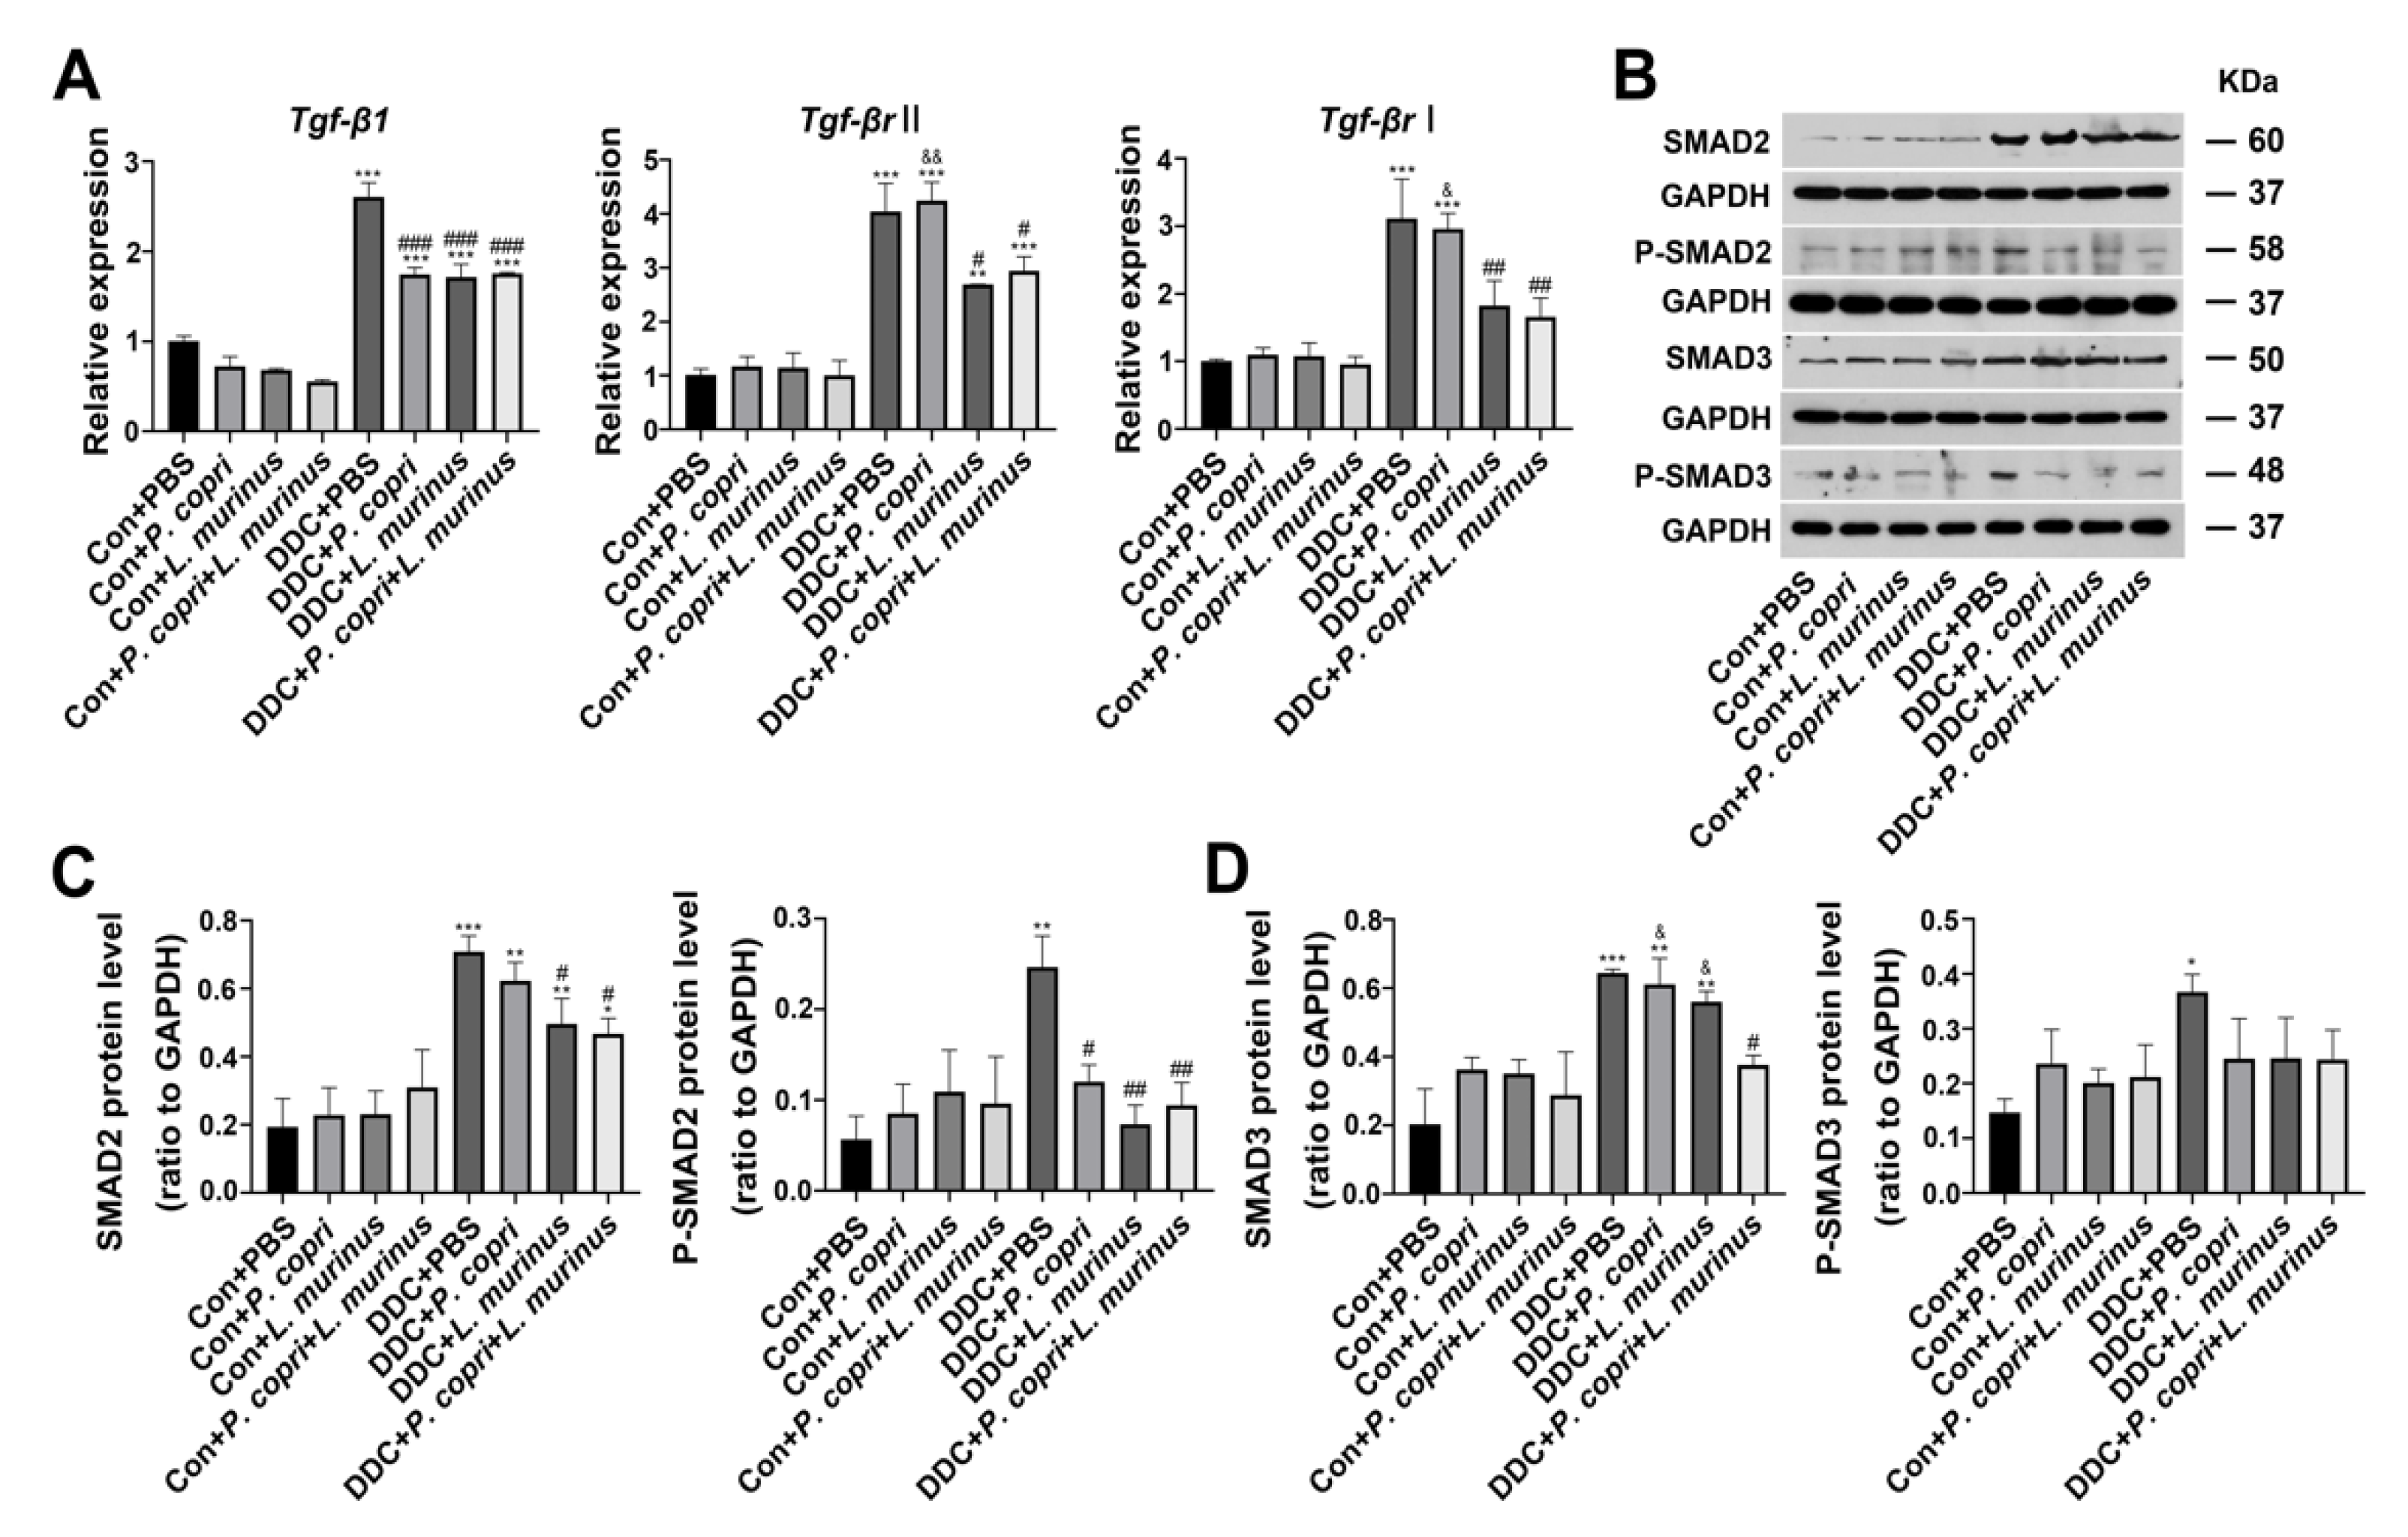
- Either P. copri, L. murinus or both treatment alleviate DDC-induced liver fibrosis by inhibiting TGF-β1/Smad signaling.
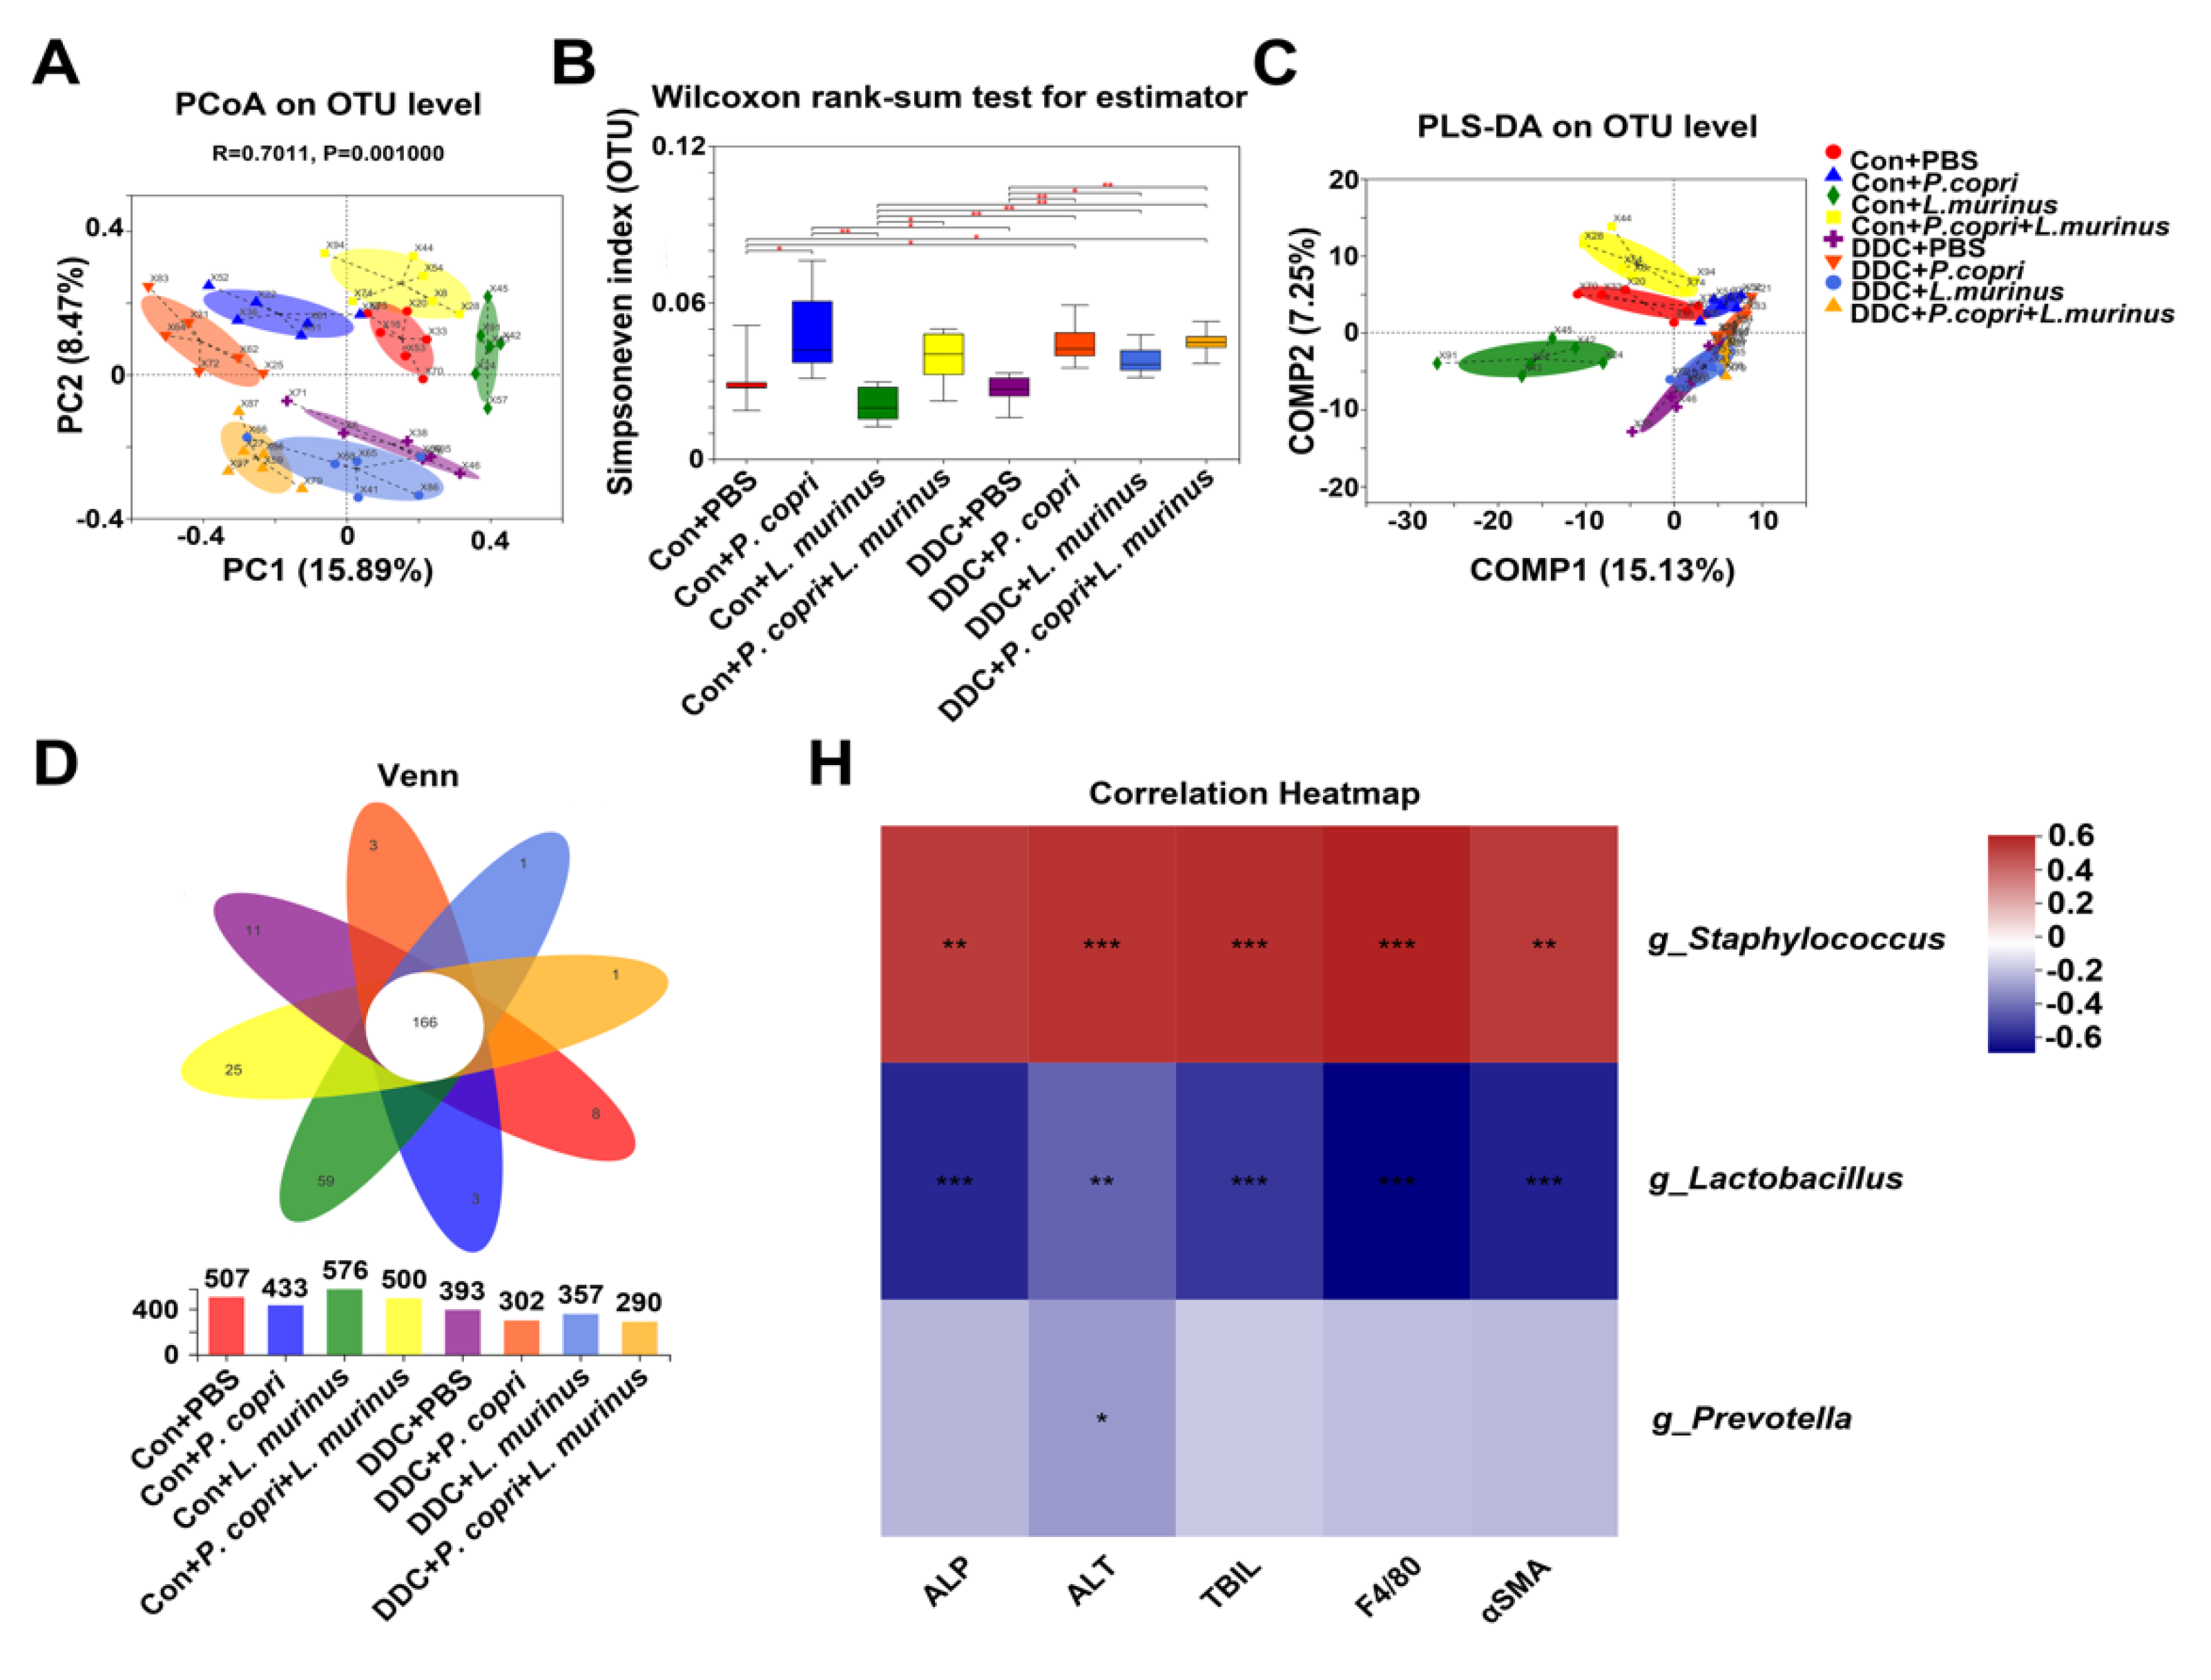
- Changes in the microbiome of mice in different treatment groups related to P. copri and L. murinus interventions and correlations between different bacterial genera and indicators.
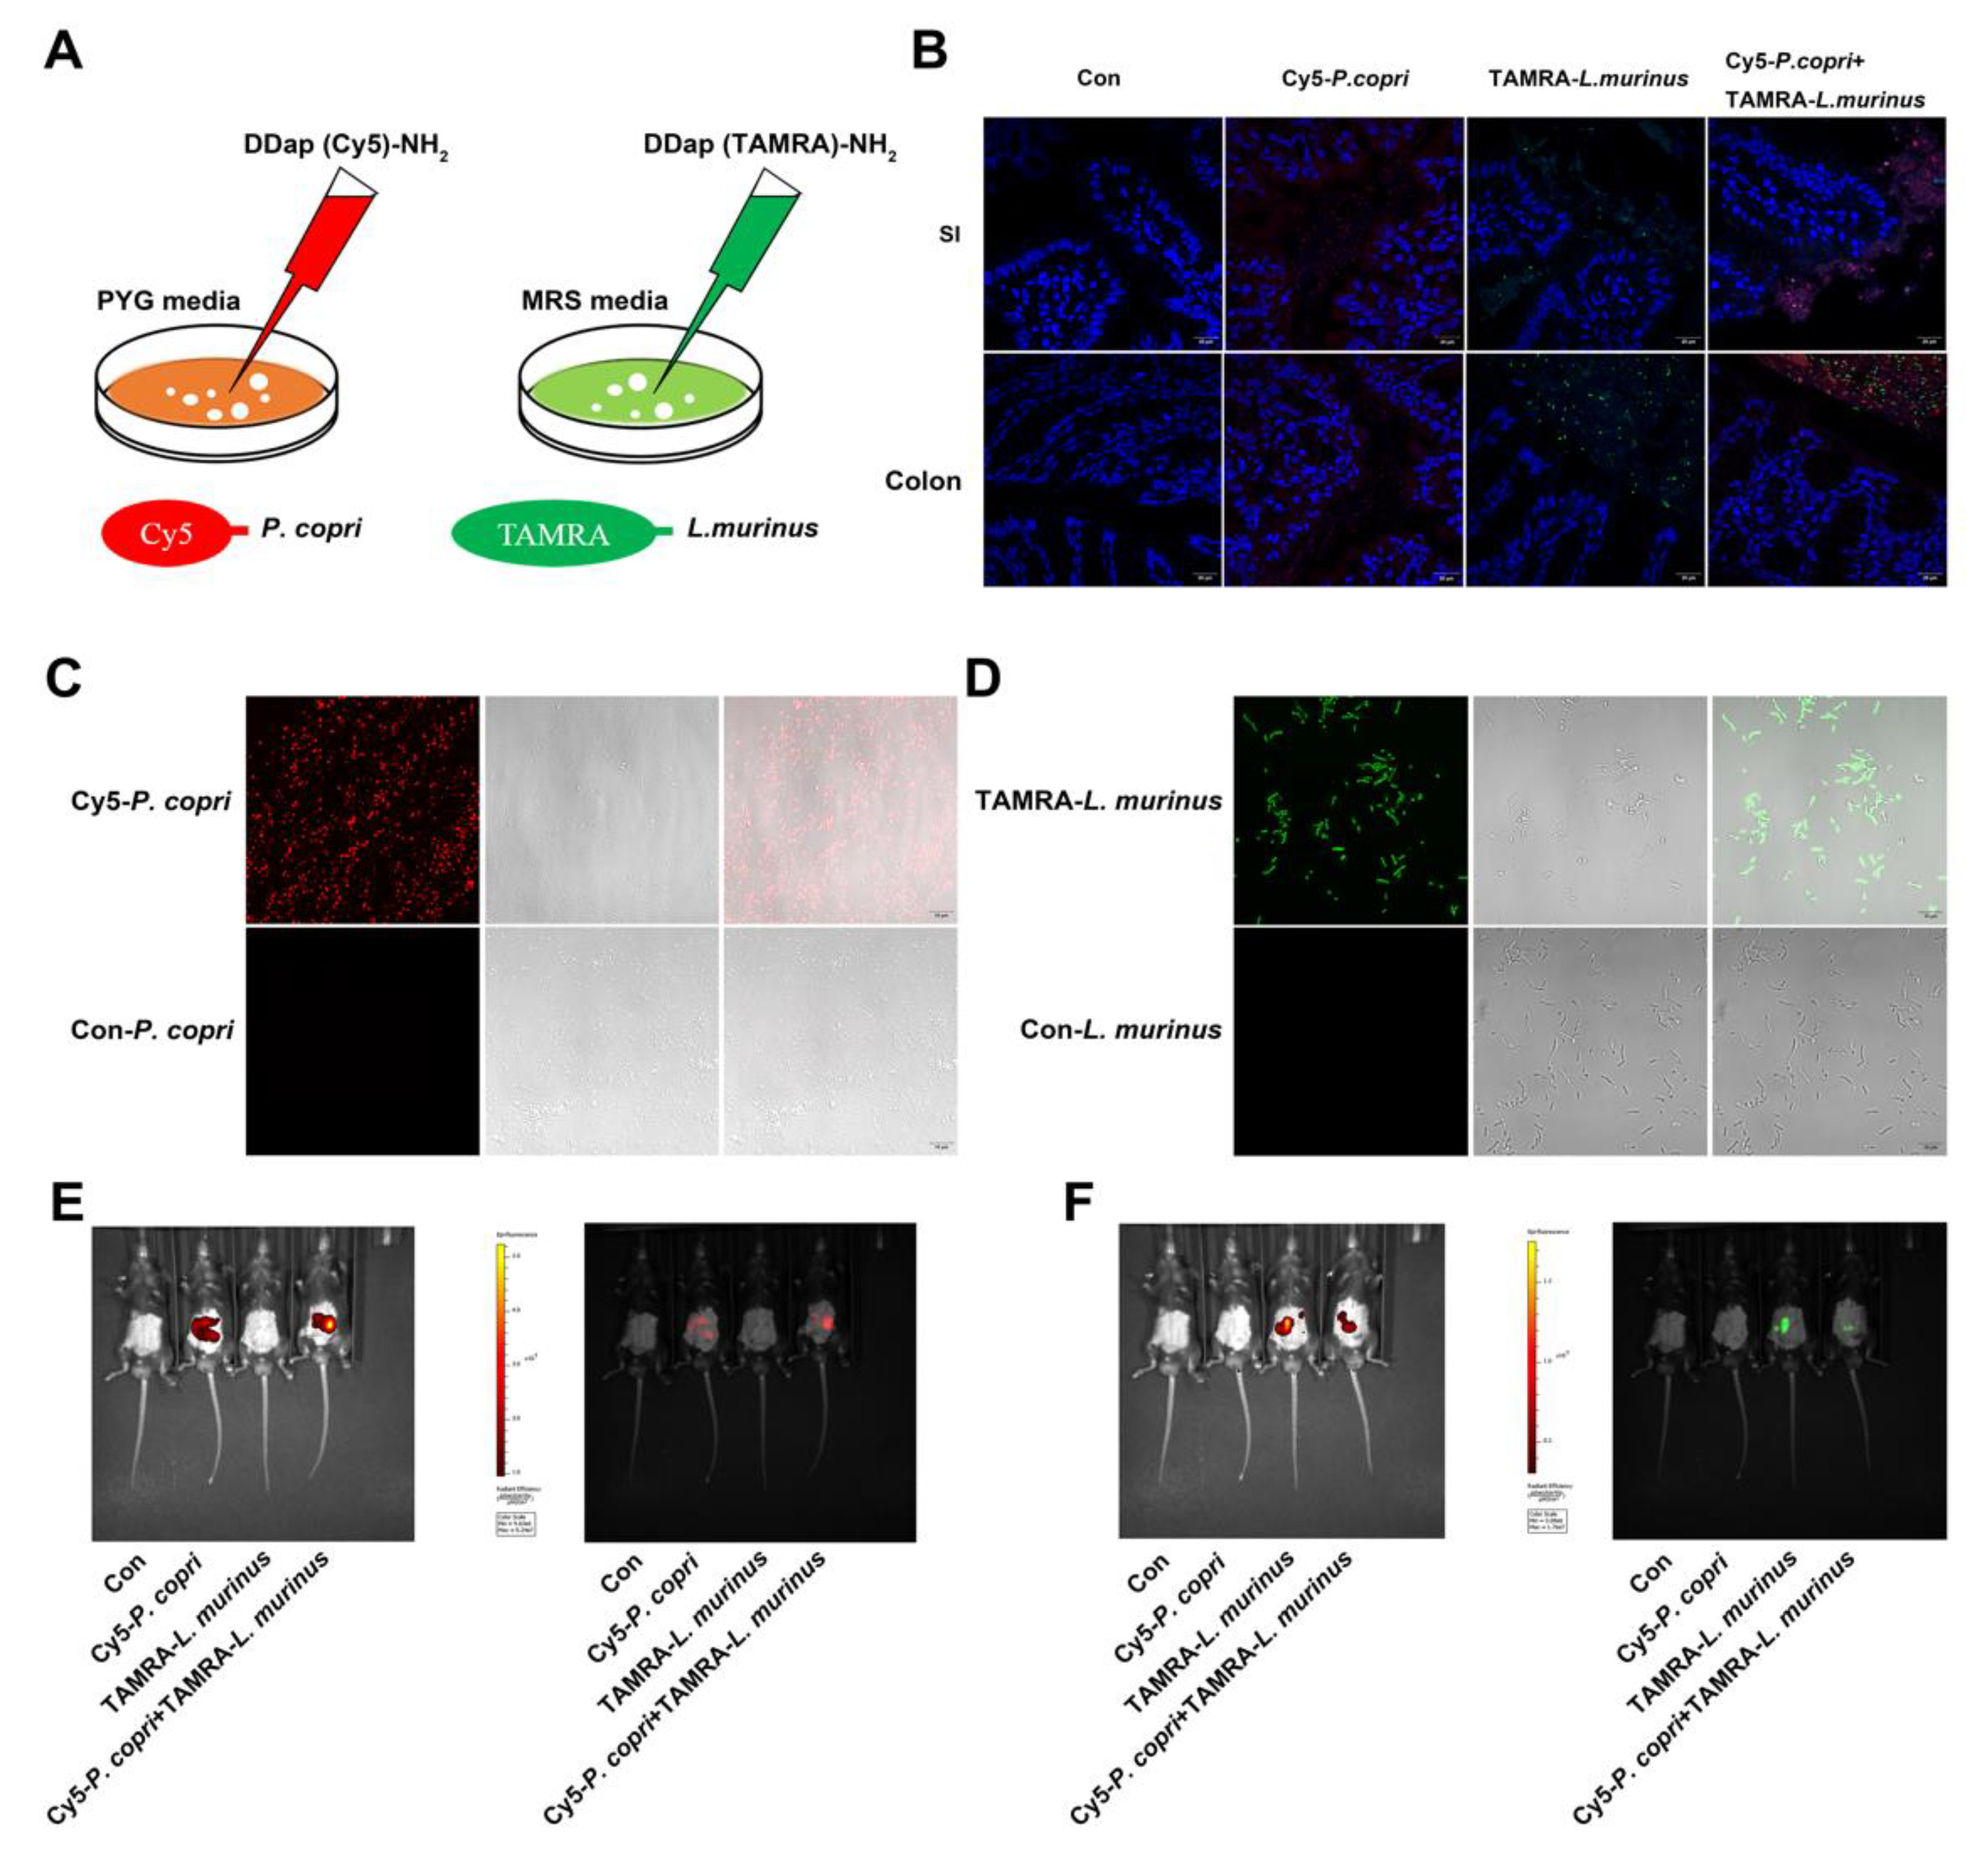
- Inner communication and fluorescence localization of P. copri and L. murinus in the intestine of mice.
4. Discussion
Supplementary Materials
Author Contributions
Acknowledgments
Conflicts of Interest
References
- Rabiee, A.; Silveira, M. G. , Primary sclerosing cholangitis. Transl Gastroenterol Hepatol 2021, 6, 29. [Google Scholar] [CrossRef]
- Dyson, J. K.; Beuers, U.; Jones, D. E. J.; Lohse, A. W.; Hudson, M. , Primary sclerosing cholangitis. Lancet 2018, 391, 2547–2559. [Google Scholar] [CrossRef] [PubMed]
- Lazaridis, K. N.; LaRusso, N. F. , Primary Sclerosing Cholangitis. N Engl J Med 2016, 375, 1161–70. [Google Scholar] [CrossRef]
- Nicoletti, A.; Maurice, J.B.; Thorburn, D. Guideline review: British Society of Gastroenterology/UK-PSC guidelines for the diagnosis and management of primary sclerosing cholangitis. Front. Gastroenterol. 2020, 12, 62–66. [Google Scholar] [CrossRef] [PubMed]
- Karlsen, T. H.; Folseraas, T.; Thorburn, D.; Vesterhus, M. , Primary sclerosing cholangitis—a comprehensive review. J Hepatol 2017, 67, 1298–1323. [Google Scholar] [CrossRef]
- Vieira-Silva, S.; Sabino, J.; Valles-Colomer, M.; Falony, G.; Kathagen, G.; Caenepeel, C.; Cleynen, I.; van der Merwe, S.; Vermeire, S.; Raes, J. Quantitative microbiome profiling disentangles inflammation- and bile duct obstruction-associated microbiota alterations across PSC/IBD diagnoses. Nat. Microbiol. 2019, 4, 1826–1831. [Google Scholar] [CrossRef]
- Quraishi, M.N.; Acharjee, A.; Beggs, A.D.; Horniblow, R.; Tselepis, C.; Gkoutos, G.; Ghosh, S.; E Rossiter, A.; Loman, N.; van Schaik, W.; et al. A Pilot Integrative Analysis of Colonic Gene Expression, Gut Microbiota, and Immune Infiltration in Primary Sclerosing Cholangitis-Inflammatory Bowel Disease: Association of Disease With Bile Acid Pathways. J. Crohn’s Colitis 2020, 14, 935–947. [Google Scholar] [CrossRef]
- Chapman, M.H.; Thorburn, D.; Hirschfield, G.M.; Webster, G.G.J.; Rushbrook, S.M.; Alexander, G.; Collier, J.; Dyson, J.K.; Jones, D.E.; Patanwala, I.; et al. British Society of Gastroenterology and UK-PSC guidelines for the diagnosis and management of primary sclerosing cholangitis. Gut 2019, 68, 1356–1378. [Google Scholar] [CrossRef] [PubMed]
- Jiang, B.; Yuan, G.; Wu, J.; Wu, Q.; Li, L.; Jiang, P. Prevotella copri ameliorates cholestasis and liver fibrosis in primary sclerosing cholangitis by enhancing the FXR signalling pathway. Biochim. et Biophys. Acta (BBA) - Mol. Basis Dis. 2021, 1868, 166320. [Google Scholar] [CrossRef]
- Hu, J.; Deng, F.; Zhao, B.; Lin, Z.; Sun, Q.; Yang, X.; Wu, M.; Qiu, S.; Chen, Y.; Yan, Z.; et al. Lactobacillus murinus alleviate intestinal ischemia/reperfusion injury through promoting the release of interleukin-10 from M2 macrophages via Toll-like receptor 2 signaling. Microbiome 2022, 10, 1–21. [Google Scholar] [CrossRef]
- Pan, F.; Zhang, L.; Li, M.; Hu, Y.; Zeng, B.; Yuan, H.; Zhao, L.; Zhang, C. Predominant gut Lactobacillus murinus strain mediates anti-inflammaging effects in calorie-restricted mice. Microbiome 2018, 6, 1–17. [Google Scholar] [CrossRef]
- Kim, W.-K.; Jang, Y.J.; Han, D.H.; Jeon, K.; Lee, C.; Han, H.S.; Ko, G. Lactobacillus paracasei KBL382 administration attenuates atopic dermatitis by modulating immune response and gut microbiota. Gut Microbes 2020, 12, 1–14. [Google Scholar] [CrossRef]
- Hong, F.; Ji, J.; Ze, X.; Zhou, Y.; Ze, Y. Liver Inflammation and Fibrosis Induced by Long-Term Exposure to Nano Titanium Dioxide (TiO2) Nanoparticles in Mice and Its Molecular Mechanism. J. Biomed. Nanotechnol. 2020, 16, 616–625. [Google Scholar] [CrossRef]
- Guo, J.; Fang, Y.; Jiang, F.; Li, L.; Zhou, H.; Xu, X.; Ning, W. , Neohesperidin inhibits TGF-beta1/Smad3 signaling and alleviates bleomycin-induced pulmonary fibrosis in mice. Eur J Pharmacol 2019, 864, 172712. [Google Scholar] [CrossRef]
- Zhang, Y. G.; Singhal, M.; Lin, Z.; Manzella, C.; Kumar, A.; Alrefai, W. A.; Dudeja, P. K.; Saksena, S.; Sun, J.; Gill, R. K. , Infection with enteric pathogens Salmonella typhimurium and Citrobacter rodentium modulate TGF-beta/Smad signaling pathways in the intestine. Gut Microbes 2018, 9, 326–337. [Google Scholar]
- Guo, X. X.; Yang, W. N.; Dong, B. S.; Shang, J. W.; Su, S. B.; Yan, X. L.; Zhang, H. , Glycyrrhetinic Acid-Induced MiR-663a Alleviates Hepatic Stellate Cell Activation by Attenuating the TGF-beta/Smad Signaling Pathway. Evid Based Complement Alternat Med 2020, 2020, 3156267. [Google Scholar] [CrossRef]
- Tee, J. K.; Peng, F.; Tan, Y. L.; Yu, B.; Ho, H. K. , Magnesium Isoglycyrrhizinate Ameliorates Fibrosis and Disrupts TGF-beta-Mediated SMAD Pathway in Activated Hepatic Stellate Cell Line LX2. Front Pharmacol 2018, 9, 1018. [Google Scholar] [CrossRef]
- Xiang, D.; Zou, J.; Zhu, X.; Chen, X.; Luo, J.; Kong, L.; Zhang, H. Physalin D attenuates hepatic stellate cell activation and liver fibrosis by blocking TGF-β/Smad and YAP signaling. Phytomedicine 2020, 78, 153294. [Google Scholar] [CrossRef] [PubMed]
- Cho, S.S.; Lee, J.H.; Kim, K.M.; Park, E.Y.; Ku, S.K.; Cho, I.J.; Yang, J.H.; Ki, S.H. REDD1 attenuates hepatic stellate cell activation and liver fibrosis via inhibiting of TGF-β/Smad signaling pathway. Free. Radic. Biol. Med. 2021, 176, 246–256. [Google Scholar] [CrossRef] [PubMed]
- Wang, W.; Lin, L.; Du, Y.; Song, Y.; Peng, X.; Chen, X.; Yang, C.J. Assessing the viability of transplanted gut microbiota by sequential tagging with D-amino acid-based metabolic probes. Nat. Commun. 2019, 10, 1–7. [Google Scholar] [CrossRef] [PubMed]
- Geervliet, E.; Moreno, S.; Baiamonte, L.; Booijink, R.; Boye, S.; Wang, P.; Voit, B.; Lederer, A.; Appelhans, D.; Bansal, R. Matrix metalloproteinase-1 decorated polymersomes, a surface-active extracellular matrix therapeutic, potentiates collagen degradation and attenuates early liver fibrosis. J. Control. Release 2021, 332, 594–607. [Google Scholar] [CrossRef] [PubMed]
- Nikolov, A.; Popovski, N. Extracellular Matrix in Heart Disease: Focus on Circulating Collagen Type I and III Derived Peptides as Biomarkers of Myocardial Fibrosis and Their Potential in the Prognosis of Heart Failure: A Concise Review. Metabolites 2022, 12, 297. [Google Scholar] [CrossRef]
- Galié, S.; Papandreou, C.; Arcelin, P.; Garcia, D.; Palau-Galindo, A.; Gutiérrez-Tordera, L.; Folch. ; Bulló, M. Examining the Interaction of the Gut Microbiome with Host Metabolism and Cardiometabolic Health in Metabolic Syndrome. Nutrients 2021, 13, 4318. [Google Scholar] [CrossRef] [PubMed]
- Garcia, W.L.; Miller, C.J.; Lomas, G.X.; Gaither, K.A.; Tyrrell, K.J.; Smith, J.N.; Brandvold, K.R.; Wright, A.T. Profiling How the Gut Microbiome Modulates Host Xenobiotic Metabolism in Response to Benzo[a]pyrene and 1-Nitropyrene Exposure. Chem. Res. Toxicol. 2022, 35, 585–596. [Google Scholar] [CrossRef] [PubMed]
- Foley, M.H.; Walker, M.E.; Stewart, A.K.; O’flaherty, S.; Gentry, E.C.; Patel, S.; Beaty, V.V.; Allen, G.; Pan, M.; Simpson, J.B.; et al. Bile salt hydrolases shape the bile acid landscape and restrict Clostridioides difficile growth in the murine gut. Nat. Microbiol. 2023, 8, 611–628. [Google Scholar] [CrossRef] [PubMed]
- Visconti, A.; Le Roy, C.I.; Rosa, F.; Rossi, N.; Martin, T.C.; Mohney, R.P.; Li, W.; de Rinaldis, E.; Bell, J.T.; Venter, J.C.; et al. Interplay between the human gut microbiome and host metabolism. Nat. Commun. 2019, 10, 1–10. [Google Scholar] [CrossRef]
- Bayly-Jones, C.; Pang, S.S.; Spicer, B.A.; Whisstock, J.C.; Dunstone, M.A. Ancient but Not Forgotten: New Insights Into MPEG1, a Macrophage Perforin-Like Immune Effector. Front. Immunol. 2020, 11, 581906. [Google Scholar] [CrossRef]
- Benard, E.L.; Racz, P.I.; Rougeot, J.; Nezhinsky, A.E.; Verbeek, F.J.; Spaink, H.P.; Meijer, A.H. Macrophage-Expressed Perforins Mpeg1 and Mpeg1.2 Have an Anti-Bacterial Function in Zebrafish. J. Innate Immun. 2014, 7, 136–152. [Google Scholar] [CrossRef]
- Bardou, M.; Hadi, T.; Mace, G.; Pesant, M.; Debermont, J.; Barrichon, M.; Wendremaire, M.; Laurent, N.; Sagot, P.; Lirussi, F. Systemic increase in human maternal circulating CD14+CD16− MCP-1+ monocytes as a marker of labor. Am. J. Obstet. Gynecol. 2014, 210, 70–e1. [Google Scholar] [CrossRef]
- Yoshimura, T. , The chemokine MCP-1 (CCL2) in the host interaction with cancer: a foe or ally? Cell Mol Immunol 2018, 15, 335–345. [Google Scholar] [CrossRef]
- Bresser, K.; Logtenberg, M.E.W.; Toebes, M.; Proost, N.; Sprengers, J.; Siteur, B.; Boeije, M.; Kroese, L.J.; Schumacher, T.N. QPCTL regulates macrophage and monocyte abundance and inflammatory signatures in the tumor microenvironment. OncoImmunology 2022, 11, 2049486. [Google Scholar] [CrossRef] [PubMed]
- Dander, E.; Fallati, A.; Gulić, T.; Pagni, F.; Gaspari, S.; Silvestri, D.; Cricrì, G.; Bedini, G.; Portale, F.; Buracchi, C.; et al. Monocyte–macrophage polarization and recruitment pathways in the tumour microenvironment of B-cell acute lymphoblastic leukaemia. Br. J. Haematol. 2021, 193, 1157–1171. [Google Scholar] [CrossRef] [PubMed]
- Li, X.; Zhang, Z.; Guo, Z.; Zhao, L.; Liu, Y.; Ma, X.; He, Q. , Macrophage immunomodulatory activity of Acanthopanax senticousus polysaccharide nanoemulsion via activation of P65/JNK/ikkalphasignaling pathway and regulation of Th1/Th2 Cytokines. PeerJ 2021, 9, e12575. [Google Scholar] [CrossRef] [PubMed]
- Wu, U. I.; Olivier, K. N.; Kuhns, D. B.; Fink, D. L.; Sampaio, E. P.; Zelazny, A. M.; Shallom, S. J.; Marciano, B. E.; Lionakis, M. S.; Holland, S. M. , Patients with Idiopathic Pulmonary Nontuberculous Mycobacterial Disease Have Normal Th1/Th2 Cytokine Responses but Diminished Th17 Cytokine and Enhanced Granulocyte-Macrophage Colony-Stimulating Factor Production. Open Forum Infect Dis 2019, 6, ofz484. [Google Scholar] [CrossRef] [PubMed]
- Chan, L.C.; Rossetti, M.; Miller, L.S.; Filler, S.G.; Johnson, C.W.; Lee, H.K.; Wang, H.; Gjertson, D.; Fowler, V.G.; Reed, E.F.; et al. Protective immunity in recurrent Staphylococcus aureus infection reflects localized immune signatures and macrophage-conferred memory. Proc. Natl. Acad. Sci. 2018, 115, 201808353–E11119. [Google Scholar] [CrossRef]
- Ricciardi, B.F.; Muthukrishnan, G.; Masters, E.; Ninomiya, M.; Lee, C.C.; Schwarz, E.M. Staphylococcus aureus Evasion of Host Immunity in the Setting of Prosthetic Joint Infection: Biofilm and Beyond. Curr. Rev. Musculoskelet. Med. 2018, 11, 389–400. [Google Scholar] [CrossRef] [PubMed]
- Orfali, R.L.; Sato, M.N.; Takaoka, R.; Azor, M.H.; Rivitti, E.A.; Hanifin, J.M.; Aoki, V. Atopic dermatitis in adults: evaluation of peripheral blood mononuclear cells proliferation response to Staphylococcus aureus enterotoxins A and B and analysis of interleukin-18 secretion. Exp. Dermatol. 2009, 18, 628–633. [Google Scholar] [CrossRef]
- Huang, F.; Sardari, R.R.R.; Jasilionis, A.; Böök, O.; Öste, R.; Rascón, A.; Heyman-Lindén, L.; Holst, O.; Karlsson, E.N. Cultivation of the gut bacterium Prevotella copri DSM 18205T using glucose and xylose as carbon sources. Microbiologyopen 2021, 10, e1213. [Google Scholar] [CrossRef]
- Verbrugghe, P.; Brynjólfsson, J.; Jing, X.; Björck, I.; Hållenius, F.; Nilsson, A. Evaluation of hypoglycemic effect, safety and immunomodulation of Prevotella copri in mice. Sci. Rep. 2021, 11, 1–12. [Google Scholar] [CrossRef]
- Bernard-Raichon, L.; Colom, A.; Monard, S. C.; Namouchi, A.; Cescato, M.; Garnier, H.; Leon-Icaza, S. A.; Metais, A.; Dumas, A.; Corral, D.; Ghebrendrias, N.; Guilloton, P.; Verollet, C.; Hudrisier, D.; Remot, A.; Langella, P.; Thomas, M.; Cougoule, C.; Neyrolles, O.; Lugo-Villarino, G. , A Pulmonary Lactobacillus murinus Strain Induces Th17 and RORgammat(+) Regulatory T Cells and Reduces Lung Inflammation in Tuberculosis. J Immunol 2021, 207, 1857–1870. [Google Scholar] [CrossRef]
- I Bahr, H.; Hamad, R.; A A Ismail, S. The impact of Lactobacillus acidophilus on hepatic and colonic fibrosis induced by ethephon in a rat model. 2019, 22, 956–962. [CrossRef]
- Fangous, M.-S.; Lazzouni, I.; Alexandre, Y.; Gouriou, S.; Boisramé, S.; Vallet, S.; Le Bihan, J.; Ramel, S.; Héry-Arnaud, G.; Le Berre, R. Prevalence and dynamics of Lactobacillus sp. in the lower respiratory tract of patients with cystic fibrosis. Res. Microbiol. 2018, 169, 222–226. [Google Scholar] [CrossRef]
- Liu, Y.; Chen, K.; Li, F.; Gu, Z.; Liu, Q.; He, L.; Shao, T.; Song, Q.; Zhu, F.; Zhang, L.; et al. Probiotic Lactobacillus rhamnosus GG Prevents Liver Fibrosis Through Inhibiting Hepatic Bile Acid Synthesis and Enhancing Bile Acid Excretion in Mice. Hepatology 2019, 71, 2050–2066. [Google Scholar] [CrossRef]
- Dias, A.M.M.; Douhard, R.; Hermetet, F.; Regimbeau, M.; Lopez, T.E.; Gonzalez, D.; Masson, S.; Marcion, G.; Chaumonnot, K.; Uyanik, B.; et al. Lactobacillus stress protein GroEL prevents colonic inflammation. J. Gastroenterol. 2021, 56, 442–455. [Google Scholar] [CrossRef]
- Miyazawa, K.; Miyazono, K. , Regulation of TGF-beta Family Signaling by Inhibitory Smads. Cold Spring Harb Perspect Biol 2017, 9. [Google Scholar] [CrossRef] [PubMed]
- Sun, Y.; Liu, B.; Xie, J.; Jiang, X.; Xiao, B.; Hu, X.; Xiang, J. , Aspirin attenuates liver fibrosis by suppressing TGFbeta1/Smad signaling. Mol Med Rep 2022, 25. [Google Scholar]
- Lee, E. H.; Park, K. I.; Kim, K. Y.; Lee, J. H.; Jang, E. J.; Ku, S. K.; Kim, S. C.; Suk, H. Y.; Park, J. Y.; Baek, S. Y.; Kim, Y. W. , Liquiritigenin inhibits hepatic fibrogenesis and TGF-β1/Smad with Hippo/YAP signal. Phytomedicine 2019, 62, 152780. [Google Scholar] [CrossRef] [PubMed]
- Shu, G.; Yusuf, A.; Dai, C.; Sun, H.; Deng, X. , Piperine inhibits AML-12 hepatocyte EMT and LX-2 HSC activation and alleviates mouse liver fibrosis provoked by CCl(4): roles in the activation of the Nrf2 cascade and subsequent suppression of the TGF-β1/Smad axis. Food Funct 2021, 12, 11686–11703. [Google Scholar] [CrossRef] [PubMed]
- Karpec, D.; Rudys, R.; Leonaviciene, L.; Mackiewicz, Z.; Bradunaite, R.; Kirdaite, G.; Venalis, A. The impact of high-dose narrowband ultraviolet A1 on dermal thickness, collagen and matrix-metalloproteinases in animal model of scleroderma. J. Photochem. Photobiol. B: Biol. 2017, 173, 448–455. [Google Scholar] [CrossRef] [PubMed]
- Machha, V.R.; Tischer, A.; Moon-Tasson, L.; Auton, M. The Von Willebrand Factor A1–Collagen III Interaction Is Independent of Conformation and Type 2 Von Willebrand Disease Phenotype. J. Mol. Biol. 2016, 429, 32–47. [Google Scholar] [CrossRef] [PubMed]
- Tian, D.; Li, J.; Zou, L.; Lin, M.; Shi, X.; Hu, Y.; Lang, J.; Xu, L.; Ye, W.; Li, X.; et al. Adenosine A1 Receptor Deficiency Aggravates Extracellular Matrix Accumulation in Diabetic Nephropathy through Disturbance of Peritubular Microenvironment. J. Diabetes Res. 2021, 2021, 1–13. [Google Scholar] [CrossRef] [PubMed]
- Wang, Y.; Wang, W.; Wang, L.; Bao, Y.; Lu, J.; Lu, Y.; Zhang, C.; Li, W.; Sun, K.; Ying, H. Extracellular matrix remodeling effects of serum amyloid A1 in the human amnion: Implications for fetal membrane rupture. Am. J. Reprod. Immunol. 2018, 81, e13073. [Google Scholar] [CrossRef] [PubMed]
- Zhang, L.; Han, C.; Ye, F.; He, Y.; Jin, Y.; Wang, T.; Wu, Y.; Jiang, Y.; Zhang, F.; Jin, X. , Plasma Gelsolin Induced Glomerular Fibrosis via the TGF-beta1/Smads Signal Transduction Pathway in IgA Nephropathy. Int J Mol Sci 2017, 18. [Google Scholar] [CrossRef] [PubMed]
- Meng, X.-M.; Nikolic-Paterson, D.J.; Lan, H.Y. TGF-β: the master regulator of fibrosis. Nat. Rev. Nephrol. 2016, 12, 325–338. [Google Scholar] [CrossRef] [PubMed]
- Gough, N.R.; Xiang, X.; Mishra, L. TGF-β Signaling in Liver, Pancreas, and Gastrointestinal Diseases and Cancer. Gastroenterology 2021, 161, 434–452. [Google Scholar] [CrossRef] [PubMed]
- Ullah, I.; Sun, W.; Tang, L.; Feng, J. Roles of Smads Family and Alternative Splicing Variants of Smad4 in Different Cancers. J. Cancer 2018, 9, 4018–4028. [Google Scholar] [CrossRef]
- Wang, Y.; Zhang, X.; Mao, Y.; Liang, L.; Liu, L.; Peng, W.; Liu, H.; Xiao, Y.; Zhang, Y.; Zhang, F.; et al. Smad2 and Smad3 play antagonistic roles in high glucose-induced renal tubular fibrosis via the regulation of SnoN. Exp. Mol. Pathol. 2020, 113, 104375. [Google Scholar] [CrossRef]
- Li, A.G.; Lu, S.-L.; Zhang, M.-X.; Deng, C.; Wang, X.-J. Smad3 Knockout Mice Exhibit a Resistance to Skin Chemical Carcinogenesis. Cancer Res 2004, 64, 7836–7845. [Google Scholar] [CrossRef]
- Lee, D. K.; Park, S. H.; Yi, Y.; Choi, S. G.; Lee, C.; Parks, W. T.; Cho, H.; de Caestecker, M. P.; Shaul, Y.; Roberts, A. B.; Kim, S. J. , The hepatitis B virus encoded oncoprotein pX amplifies TGF-beta family signaling through direct interaction with Smad4: potential mechanism of hepatitis B virus-induced liver fibrosis. Genes Dev 2001, 15, 455–66. [Google Scholar] [CrossRef]
- Ma, L.; Jiang, H.; Xu, X.; Zhang, C.; Niu, Y.; Wang, Z.; Tao, Y.; Li, Y.; Cai, F.; Zhang, X.; et al. Tanshinone IIA mediates SMAD7-YAP interaction to inhibit liver cancer growth by inactivating the transforming growth factor beta signaling pathway. Aging 2019, 11, 9719–9737. [Google Scholar] [CrossRef]
| Gene | Gene name | Sequence |
|---|---|---|
| Mpeg1 | Macrophage-expressed gene 1 | CGAAGATGGCCACCTACCTGGCAGA |
| GAAGGCAATCCCTGCAGAAGCGGTC | ||
| Mcp-1 | Monocyte chemoattractant protein-1 | GATGCAGTTAACGCCCCACT |
| CCCATTCCTTCTTGGGGTCA | ||
| Vcam-1 | Vascular cell adhesion molecule-1 | GCTCTGTGGGTTTTGAGGATGA |
| GGATCTTCAGGGAATGAGTAGACC | ||
| Cdh1 | Cadherin 1 | CGTCCTGCCAATCCTGATGA |
| ACCACTGCCCTCGTAATCGAAC | ||
| Collagen 1a1 | Collagen type I alpha 1 | GAATGCAATGAAGAACTGGACTGT |
| TCCTACATCTTCTGAGTTTGGTGA | ||
| Timp-1 | Tissue inhibitor of metalloproteinase 1 | CATGGAAAGCCTCTGTGGAT |
| AAGCTGCAGGCATTGATGTG | ||
| Mmp9 | Matrix metalloproteinase 9 | CGCCTTGGTGTAGCACAACA |
| ACAGGGTTTGCCTTCTCCGTT | ||
| Tgf-β1 | Transforming growth factor-beta 1 | TCAGACATTCGGGAAGCAGT |
| ACGCCAGGAATTGTTGCTAT | ||
| Tgf-βrⅡ | Transforming growth factor-beta receptor Ⅱ | GGCTCTGGTACTCTGGGAAA |
| AATGGGGGCTCGTAATCCT | ||
| Tgf-βrⅠ | Transforming growth factor-beta receptorⅠ | GGCGAAGGCATTACAGTGTT |
| TGCACATACAAATGGCCTGT | ||
| Smad2 | Mothers against decapentaplegic homolog 2 | TGTAGACGGCTTCACAGACC |
| TCACTTAGGCACTCAGCAAAC | ||
| P. copri | Prevotella copri | CCGGACTCCTGCCTGCAA |
| GTTGCGCCAGGCACTGCGAT | ||
| L. murinus | Lactobacillus murinus | TAGGATTGTCAAAAGATGTC |
| AGCTAGTTGGTGGGGTAAAG | ||
| Eub | The universal primer sequence of 16S for bacteria | AGAGTTTGATCCTGGCTC |
| TGCTGCCTCCCGTAGGAGT | ||
| 338F806R | Bacterial-targeting universal primers (MiSeq sequencing platform) | ACTCCTACGGGAGGCAGCAG |
| GGACTACHVGGGTWTCTAAT |
Disclaimer/Publisher’s Note: The statements, opinions and data contained in all publications are solely those of the individual author(s) and contributor(s) and not of MDPI and/or the editor(s). MDPI and/or the editor(s) disclaim responsibility for any injury to people or property resulting from any ideas, methods, instructions or products referred to in the content. |
© 2023 by the authors. Licensee MDPI, Basel, Switzerland. This article is an open access article distributed under the terms and conditions of the Creative Commons Attribution (CC BY) license (http://creativecommons.org/licenses/by/4.0/).


