Submitted:
19 May 2023
Posted:
25 May 2023
You are already at the latest version
Abstract
Keywords:
1. Introduction
2. Model development and perovskite solar cell structure
2.1. Numerical modeling
2.2. PSC structure and material charateristics
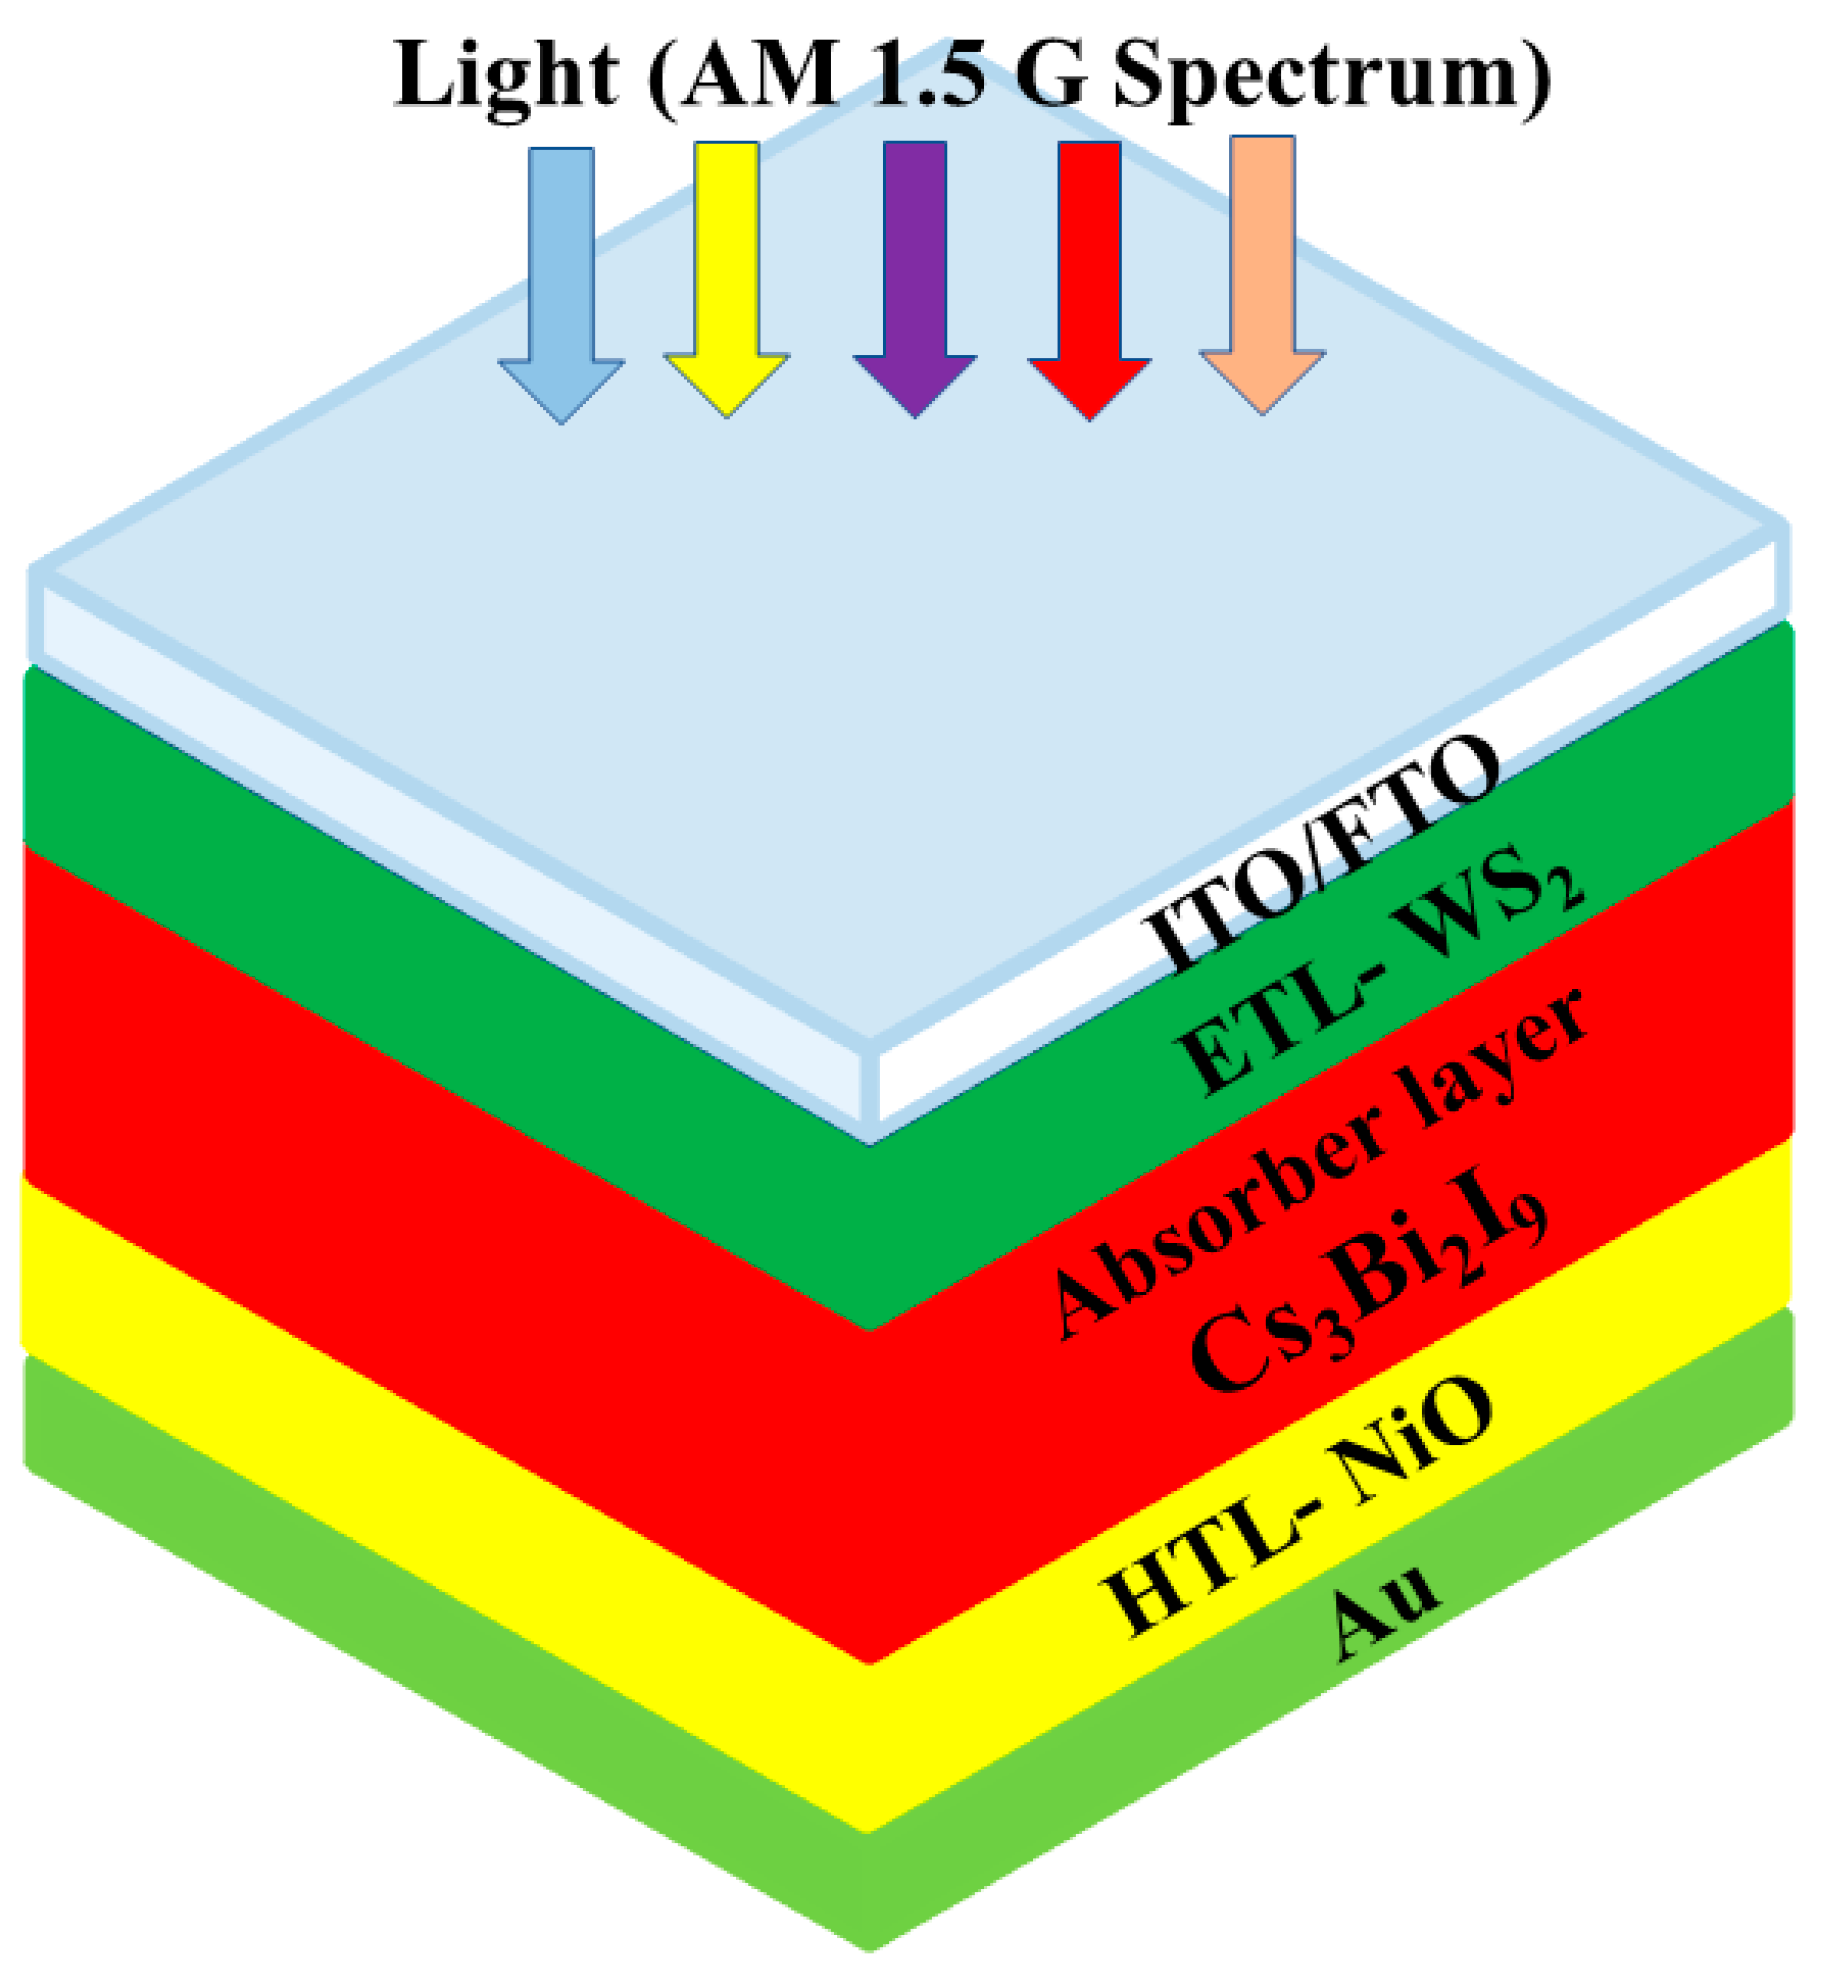
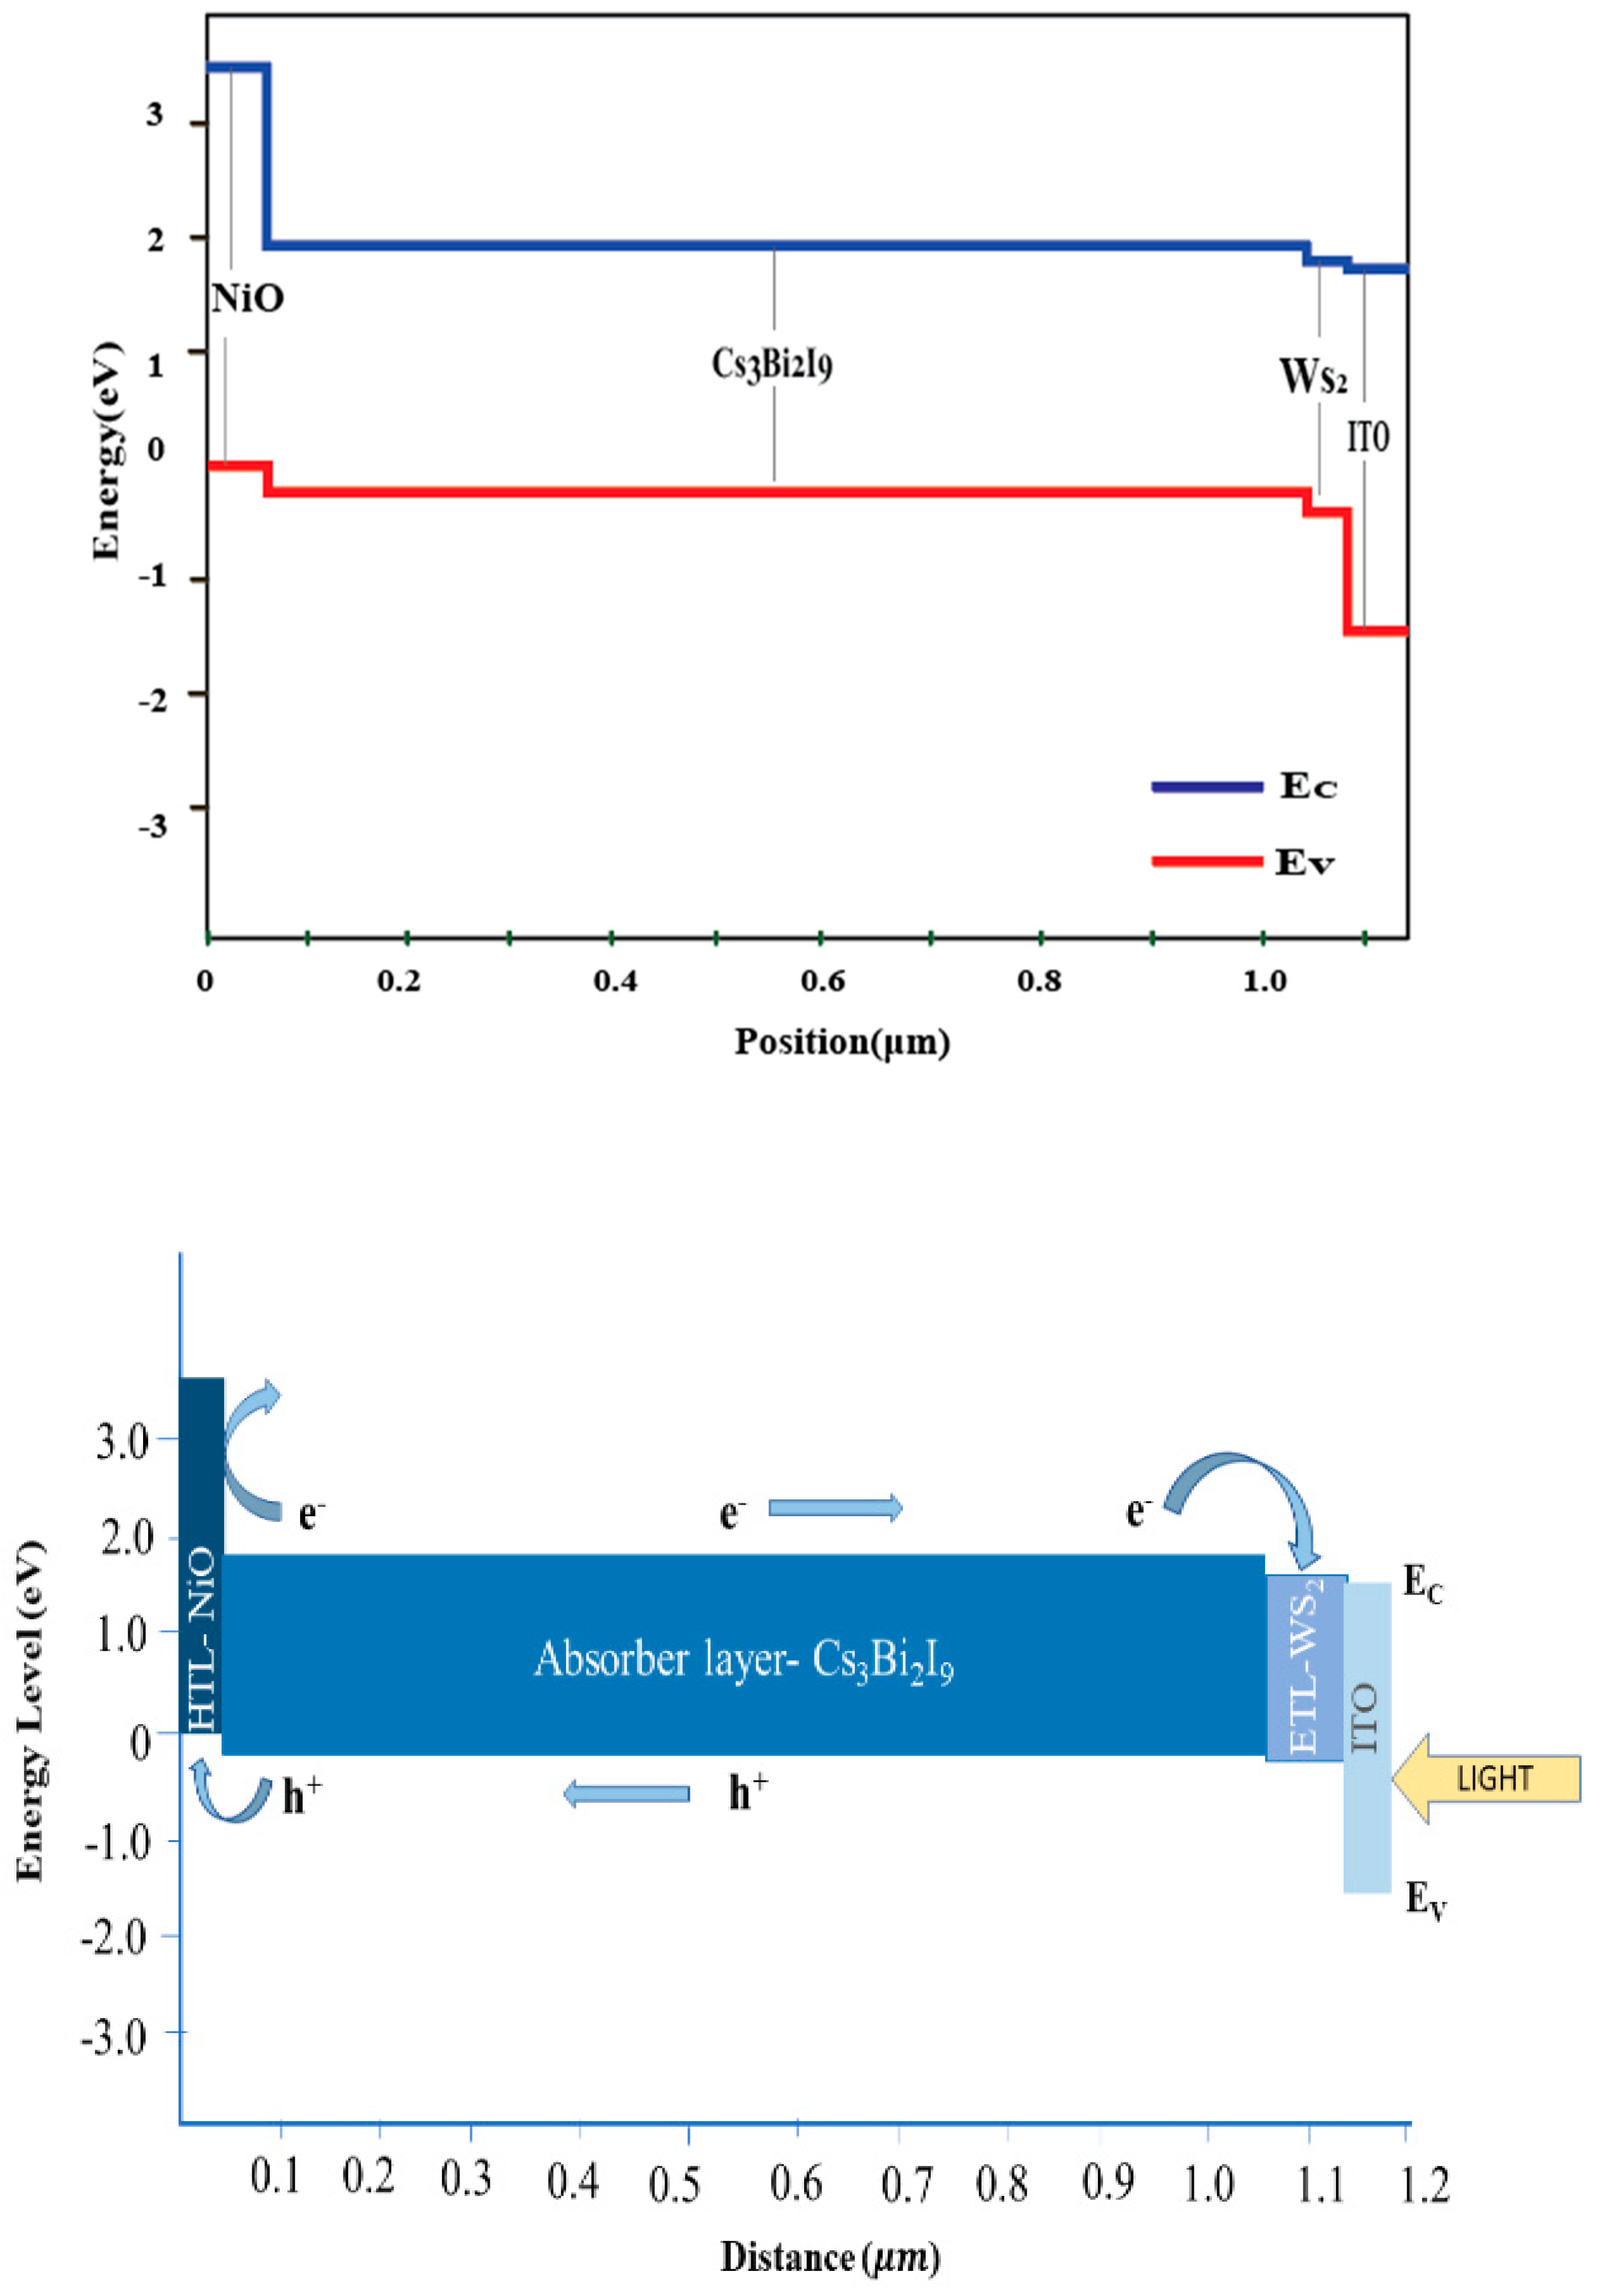
2.2.1. PSC structure
2.2.2. Physical input parameters and methodology
3. Results and discussion
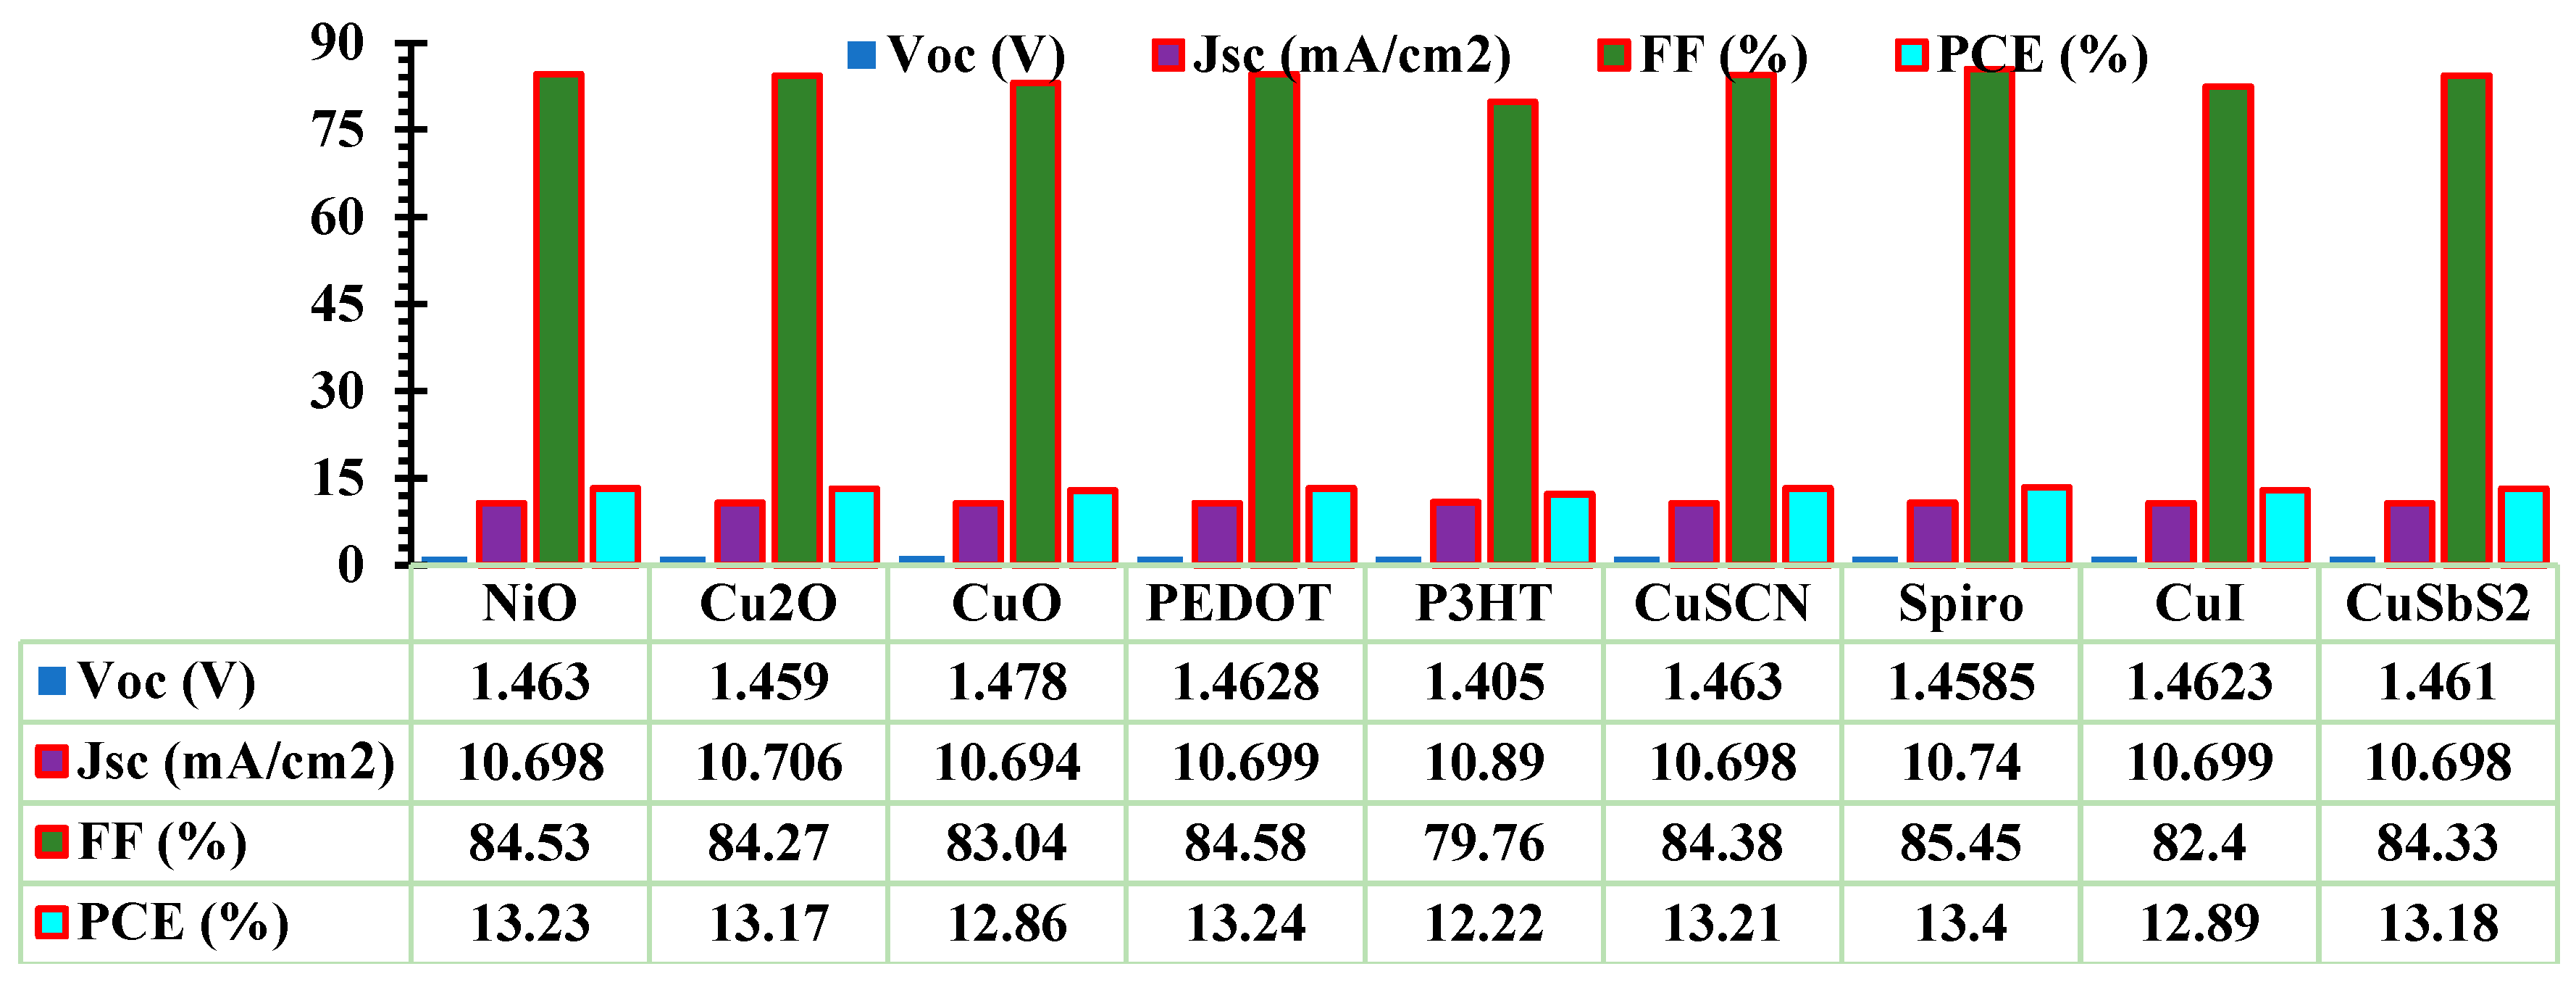
3.1. Optimization of ETL and HTL
3.2. Effect of absorber layer thickness
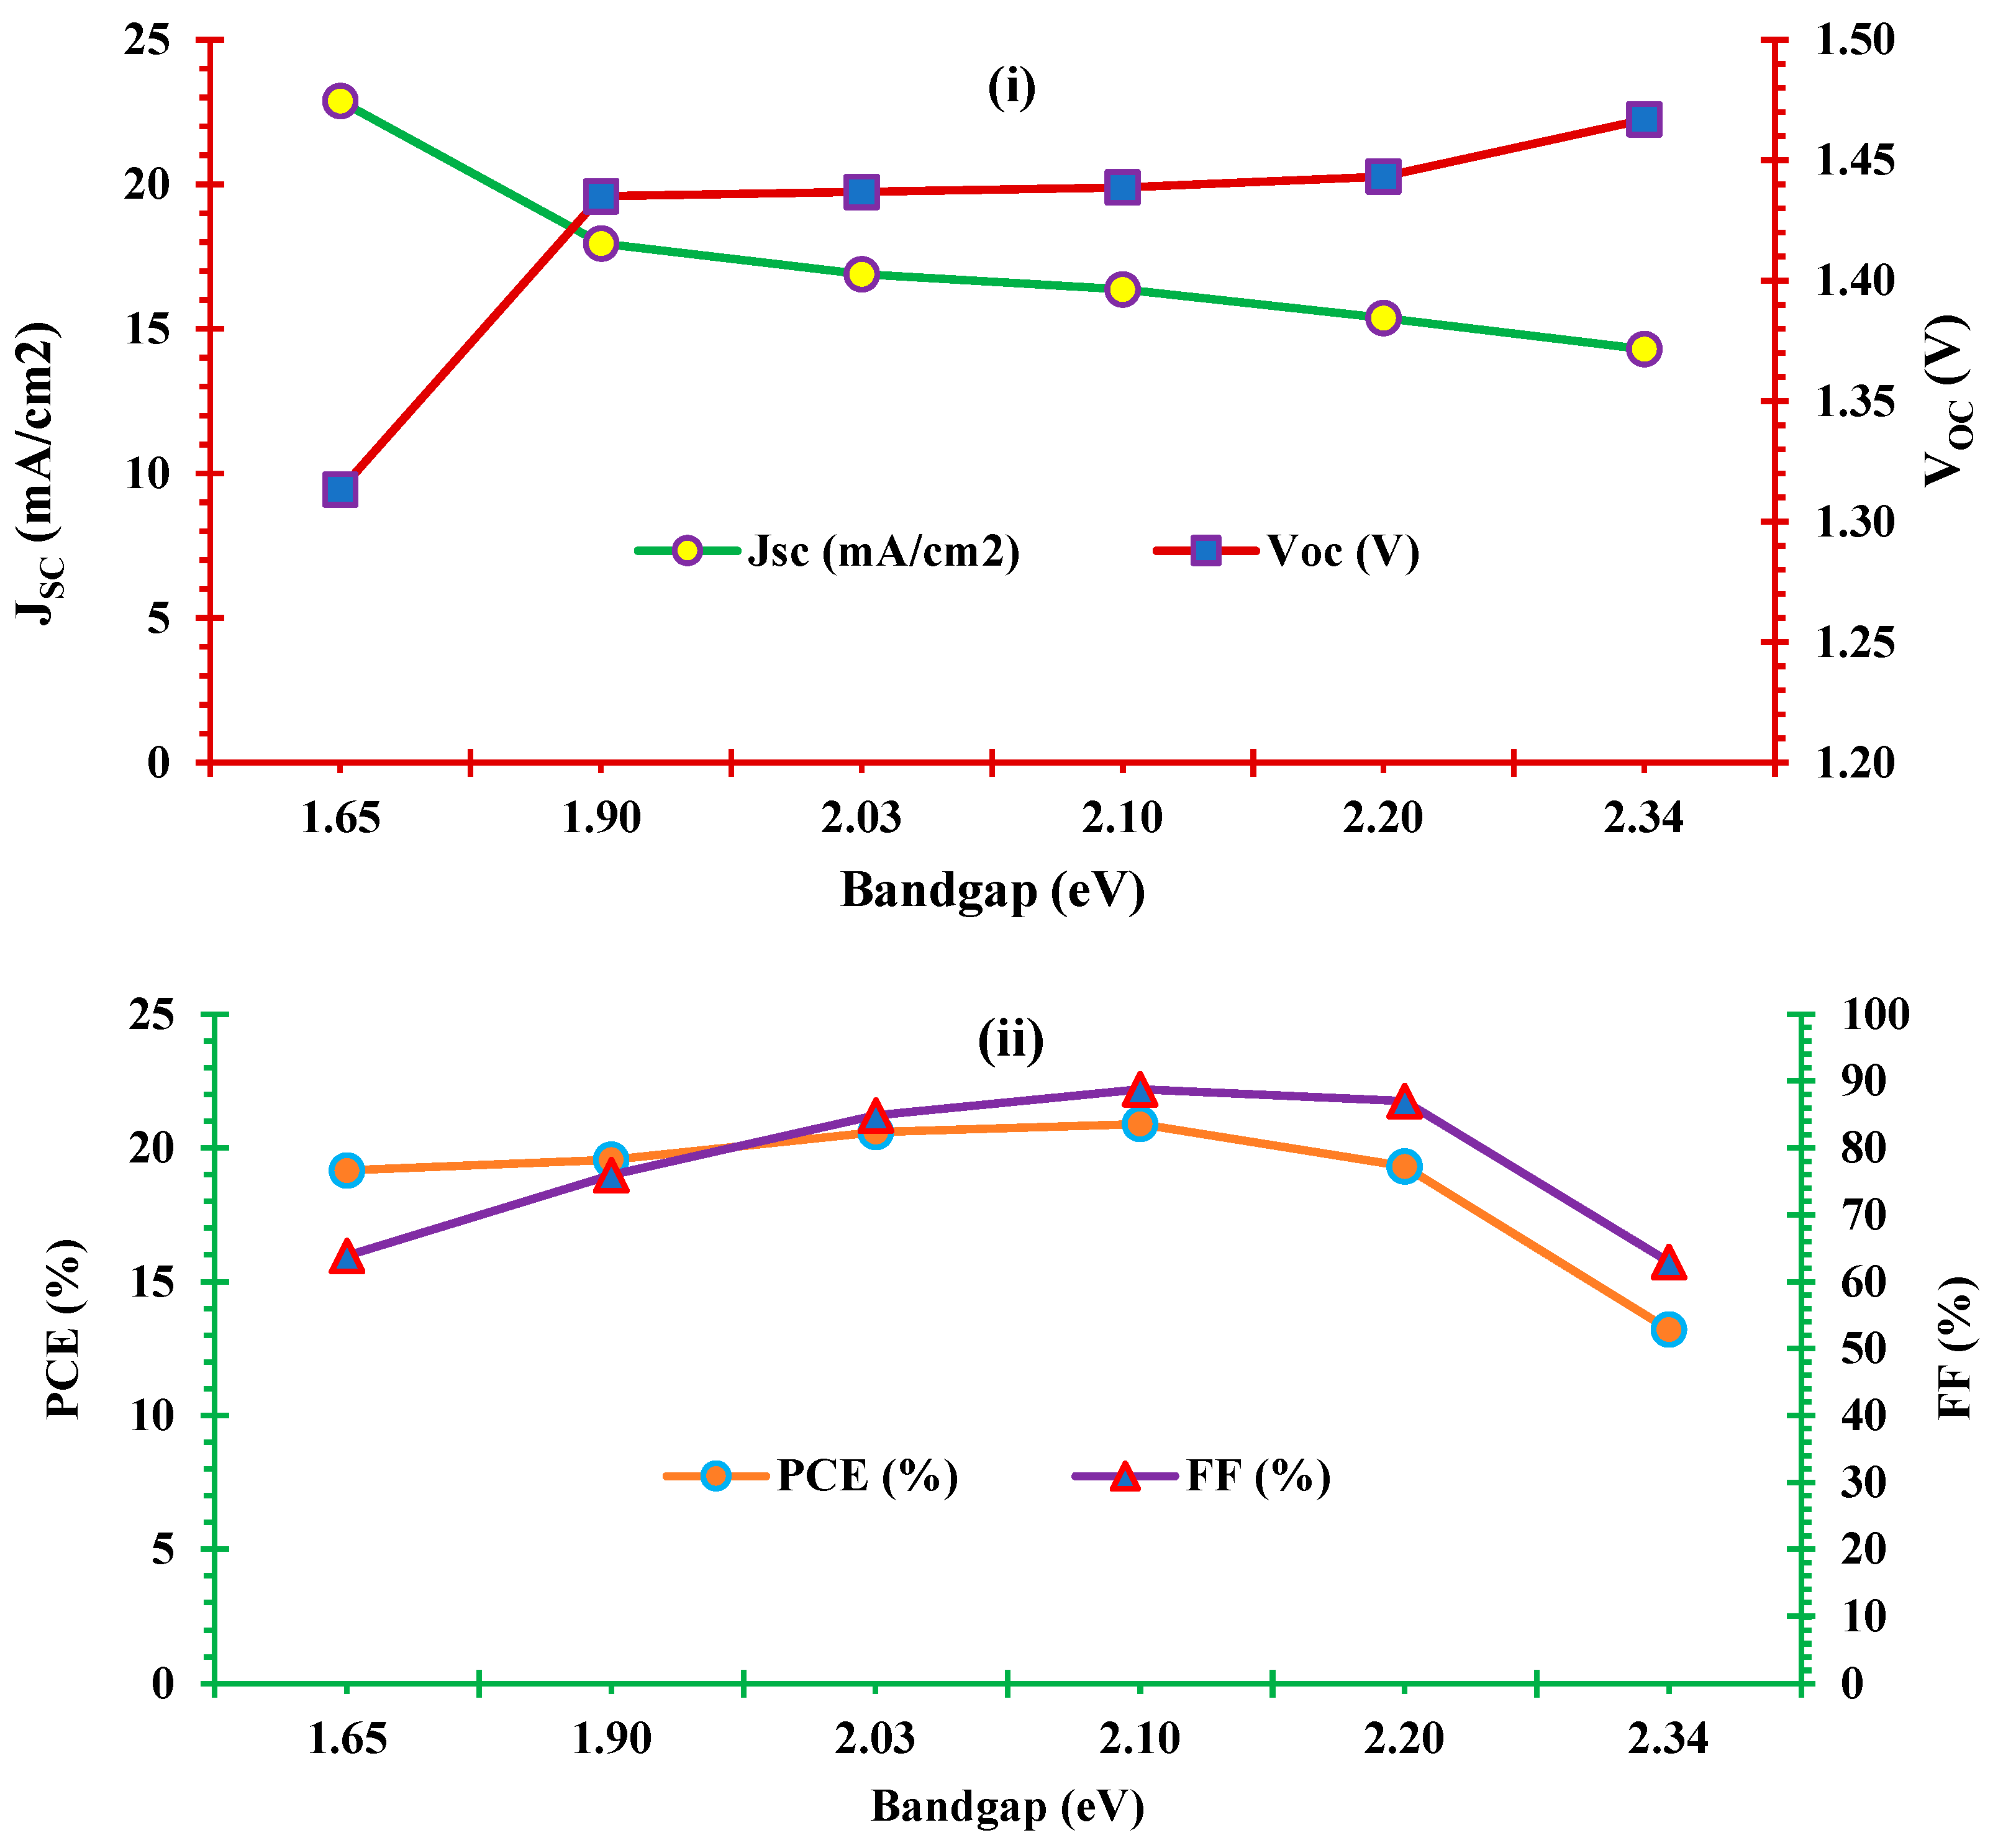
3.3. Effect of absorber layer band gap
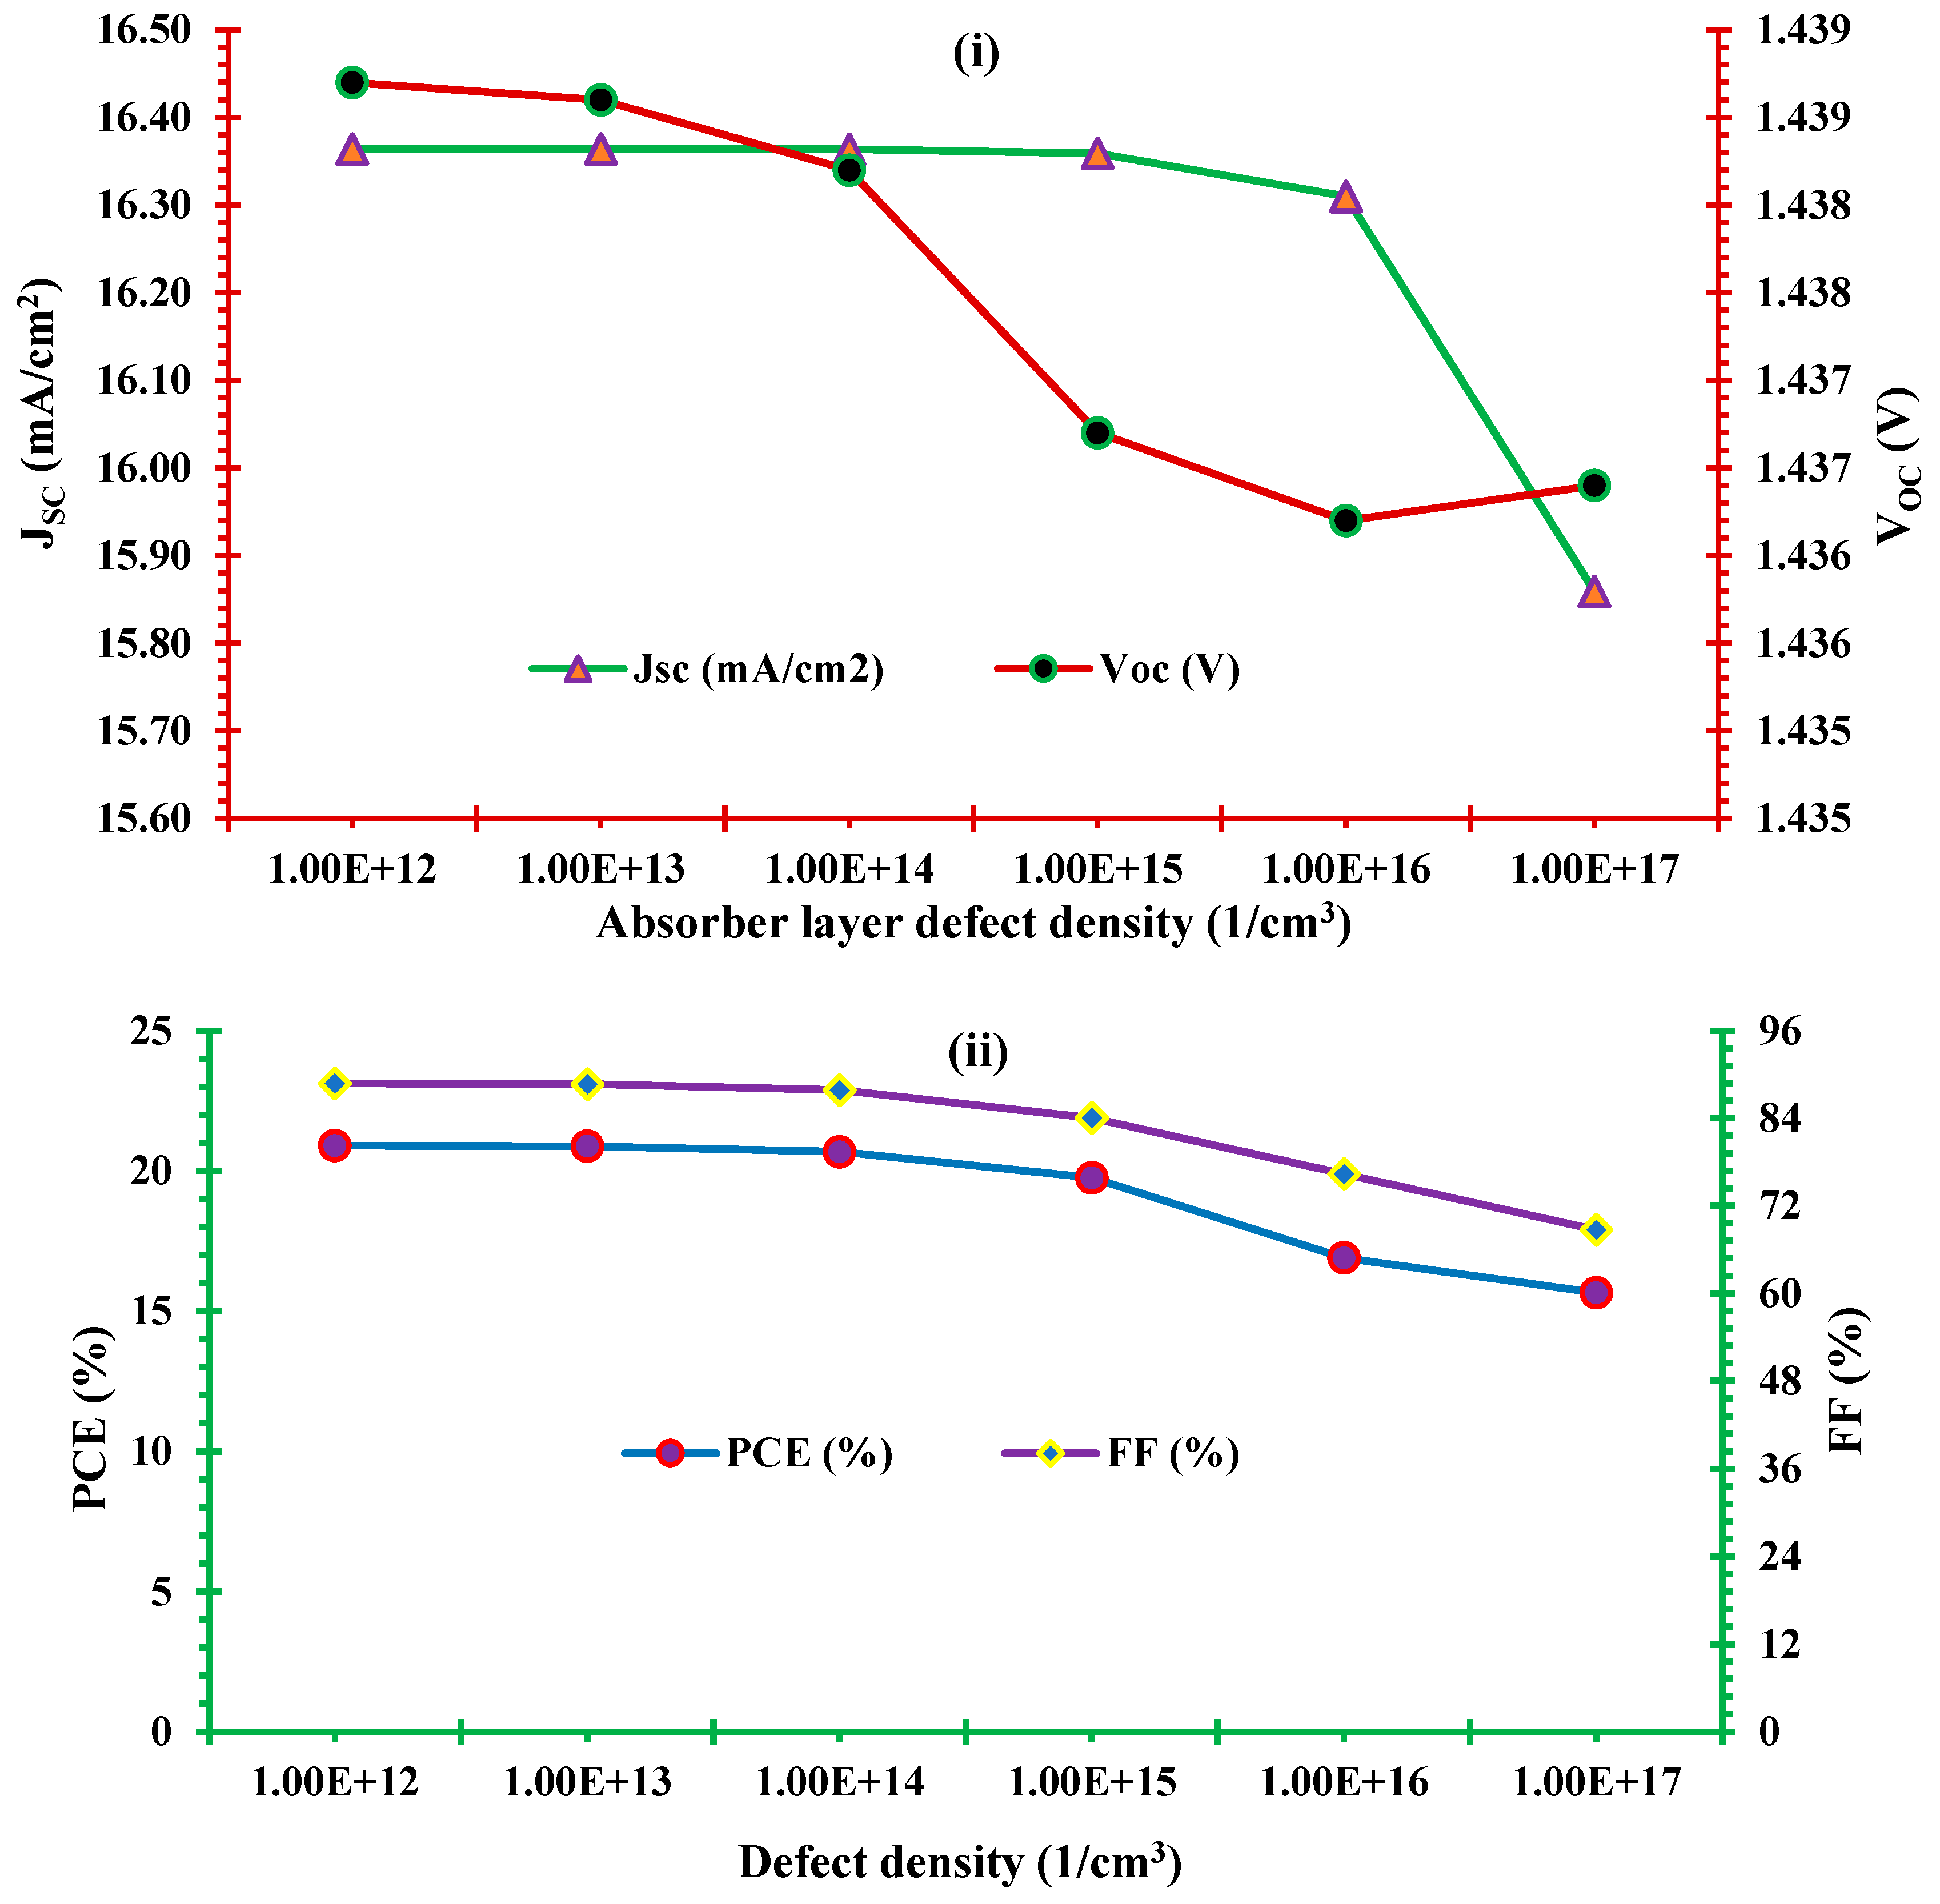
3.4. Effect of absorber layer defect density
3.5. Effect of carrier density
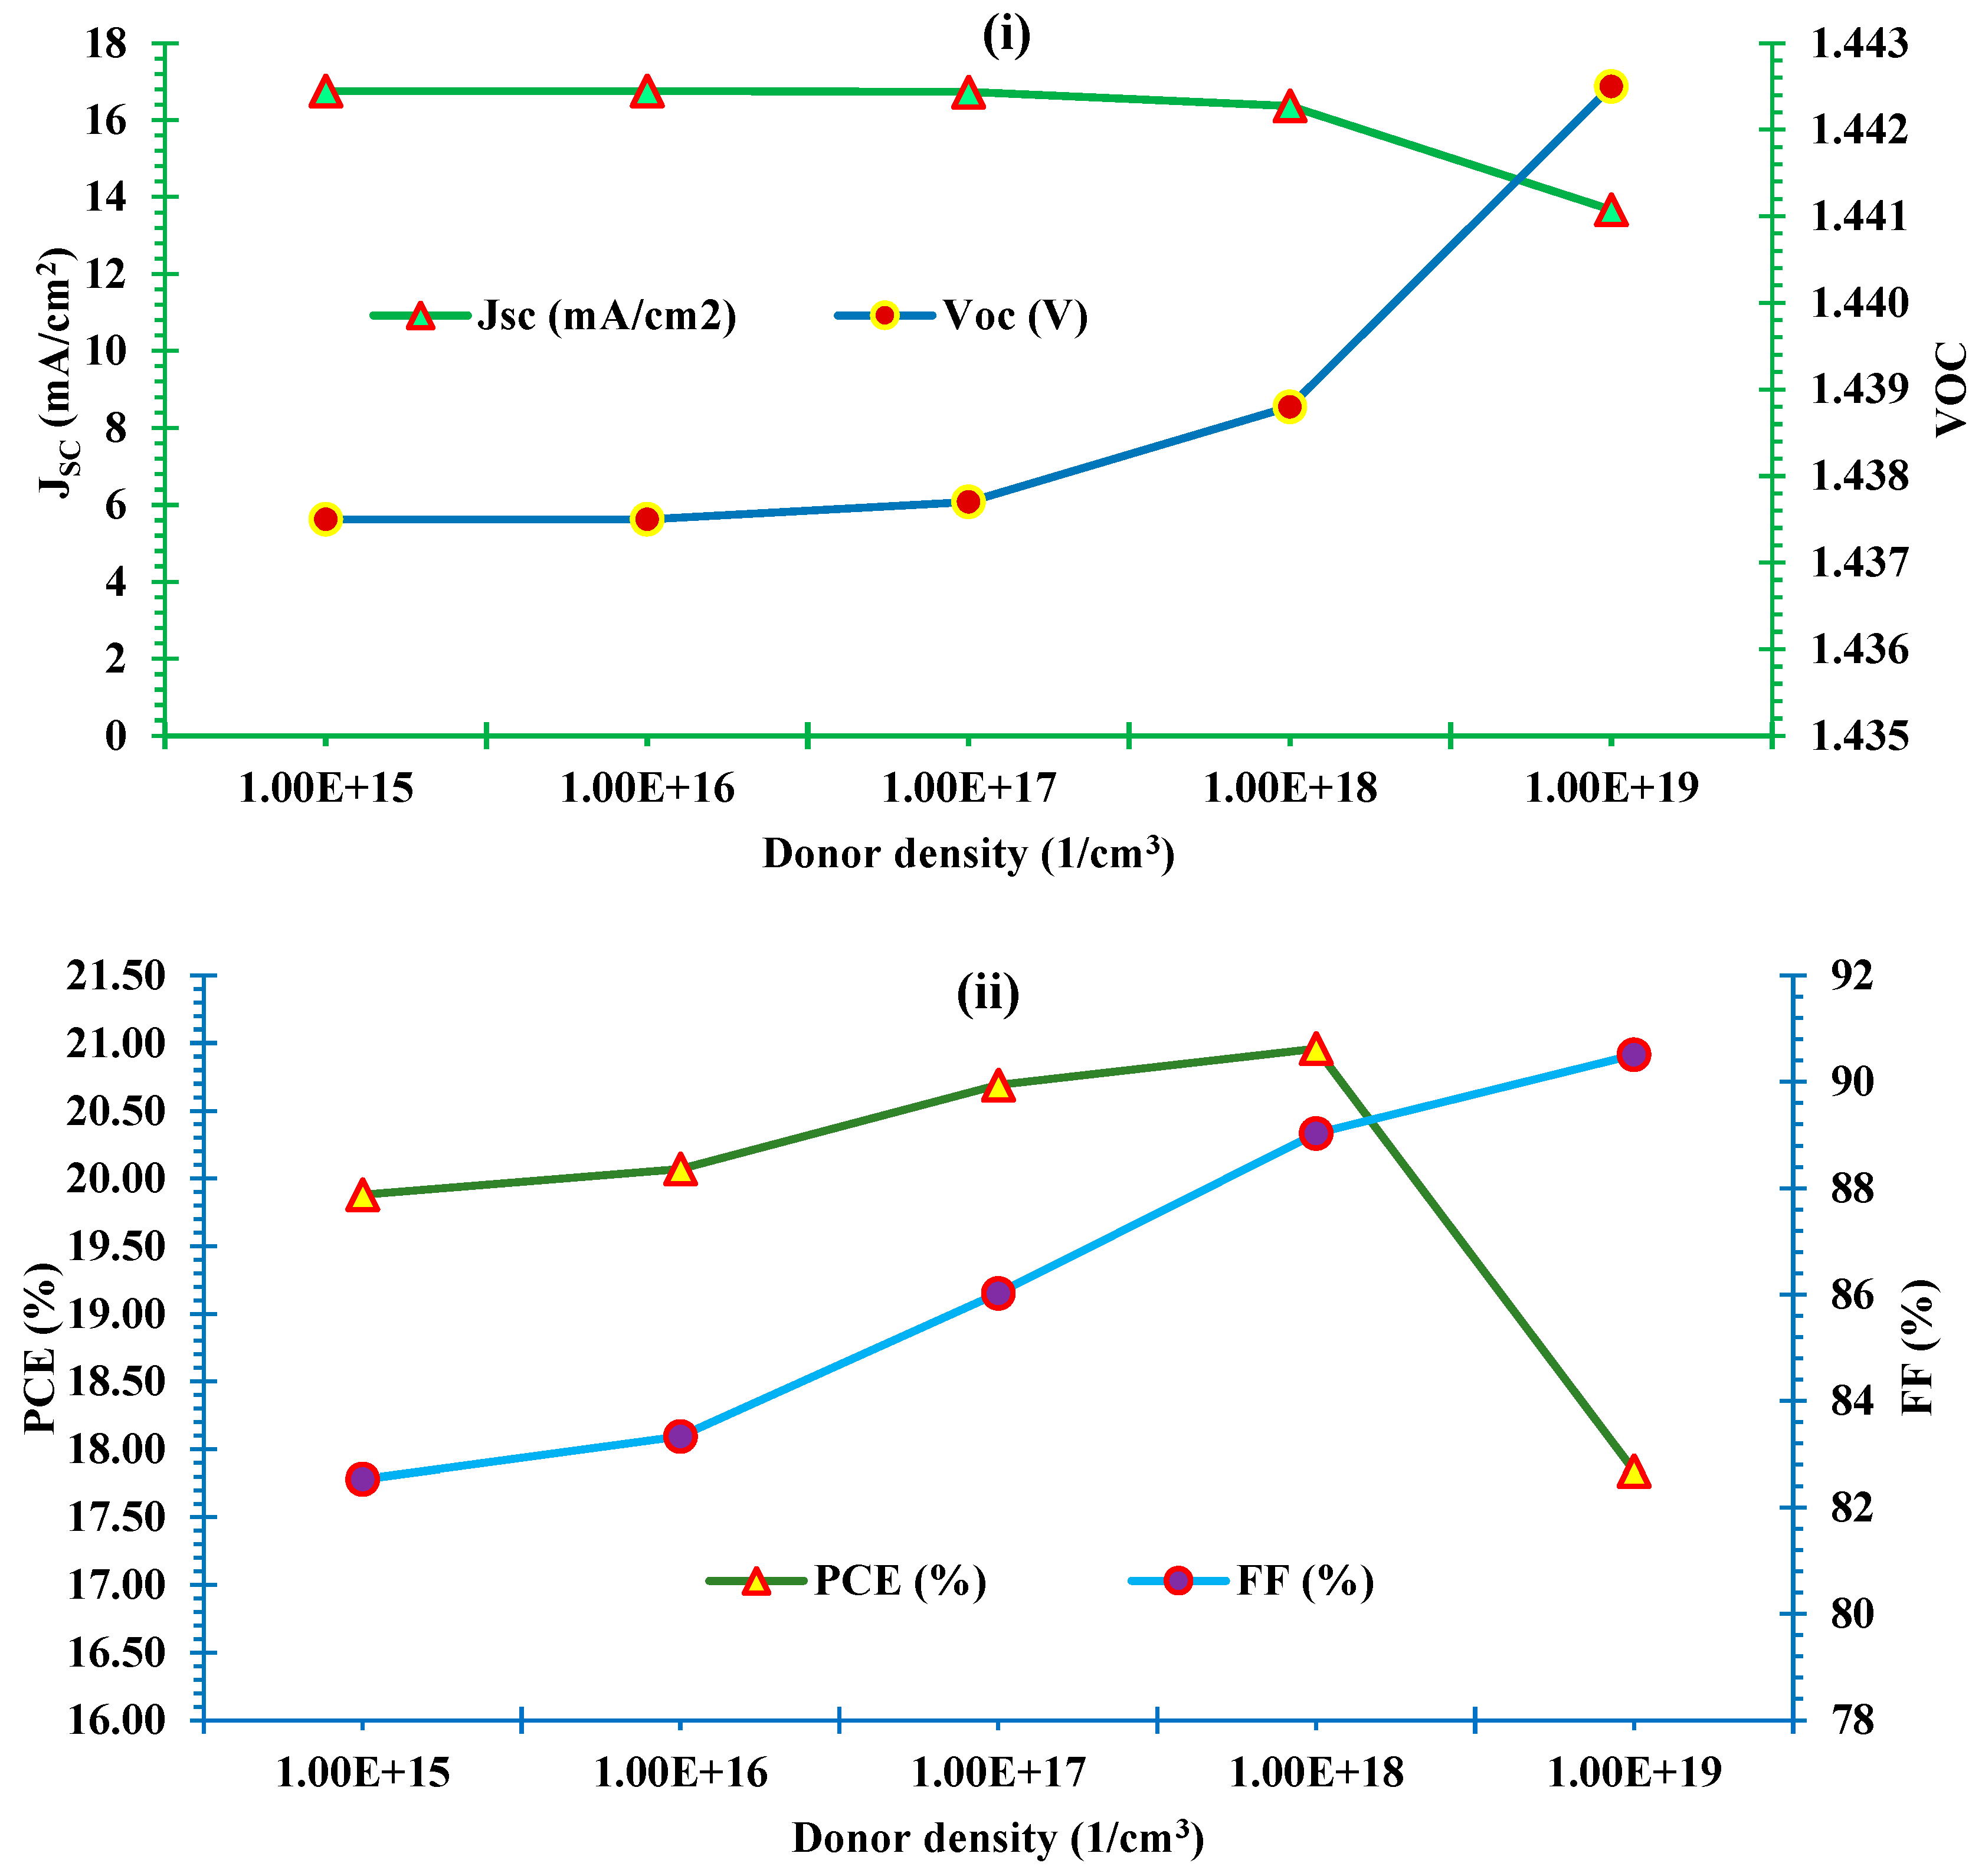
3.5.1. Effect of donor density of ETL
3.5.2. Effect of acceptor density of HTL
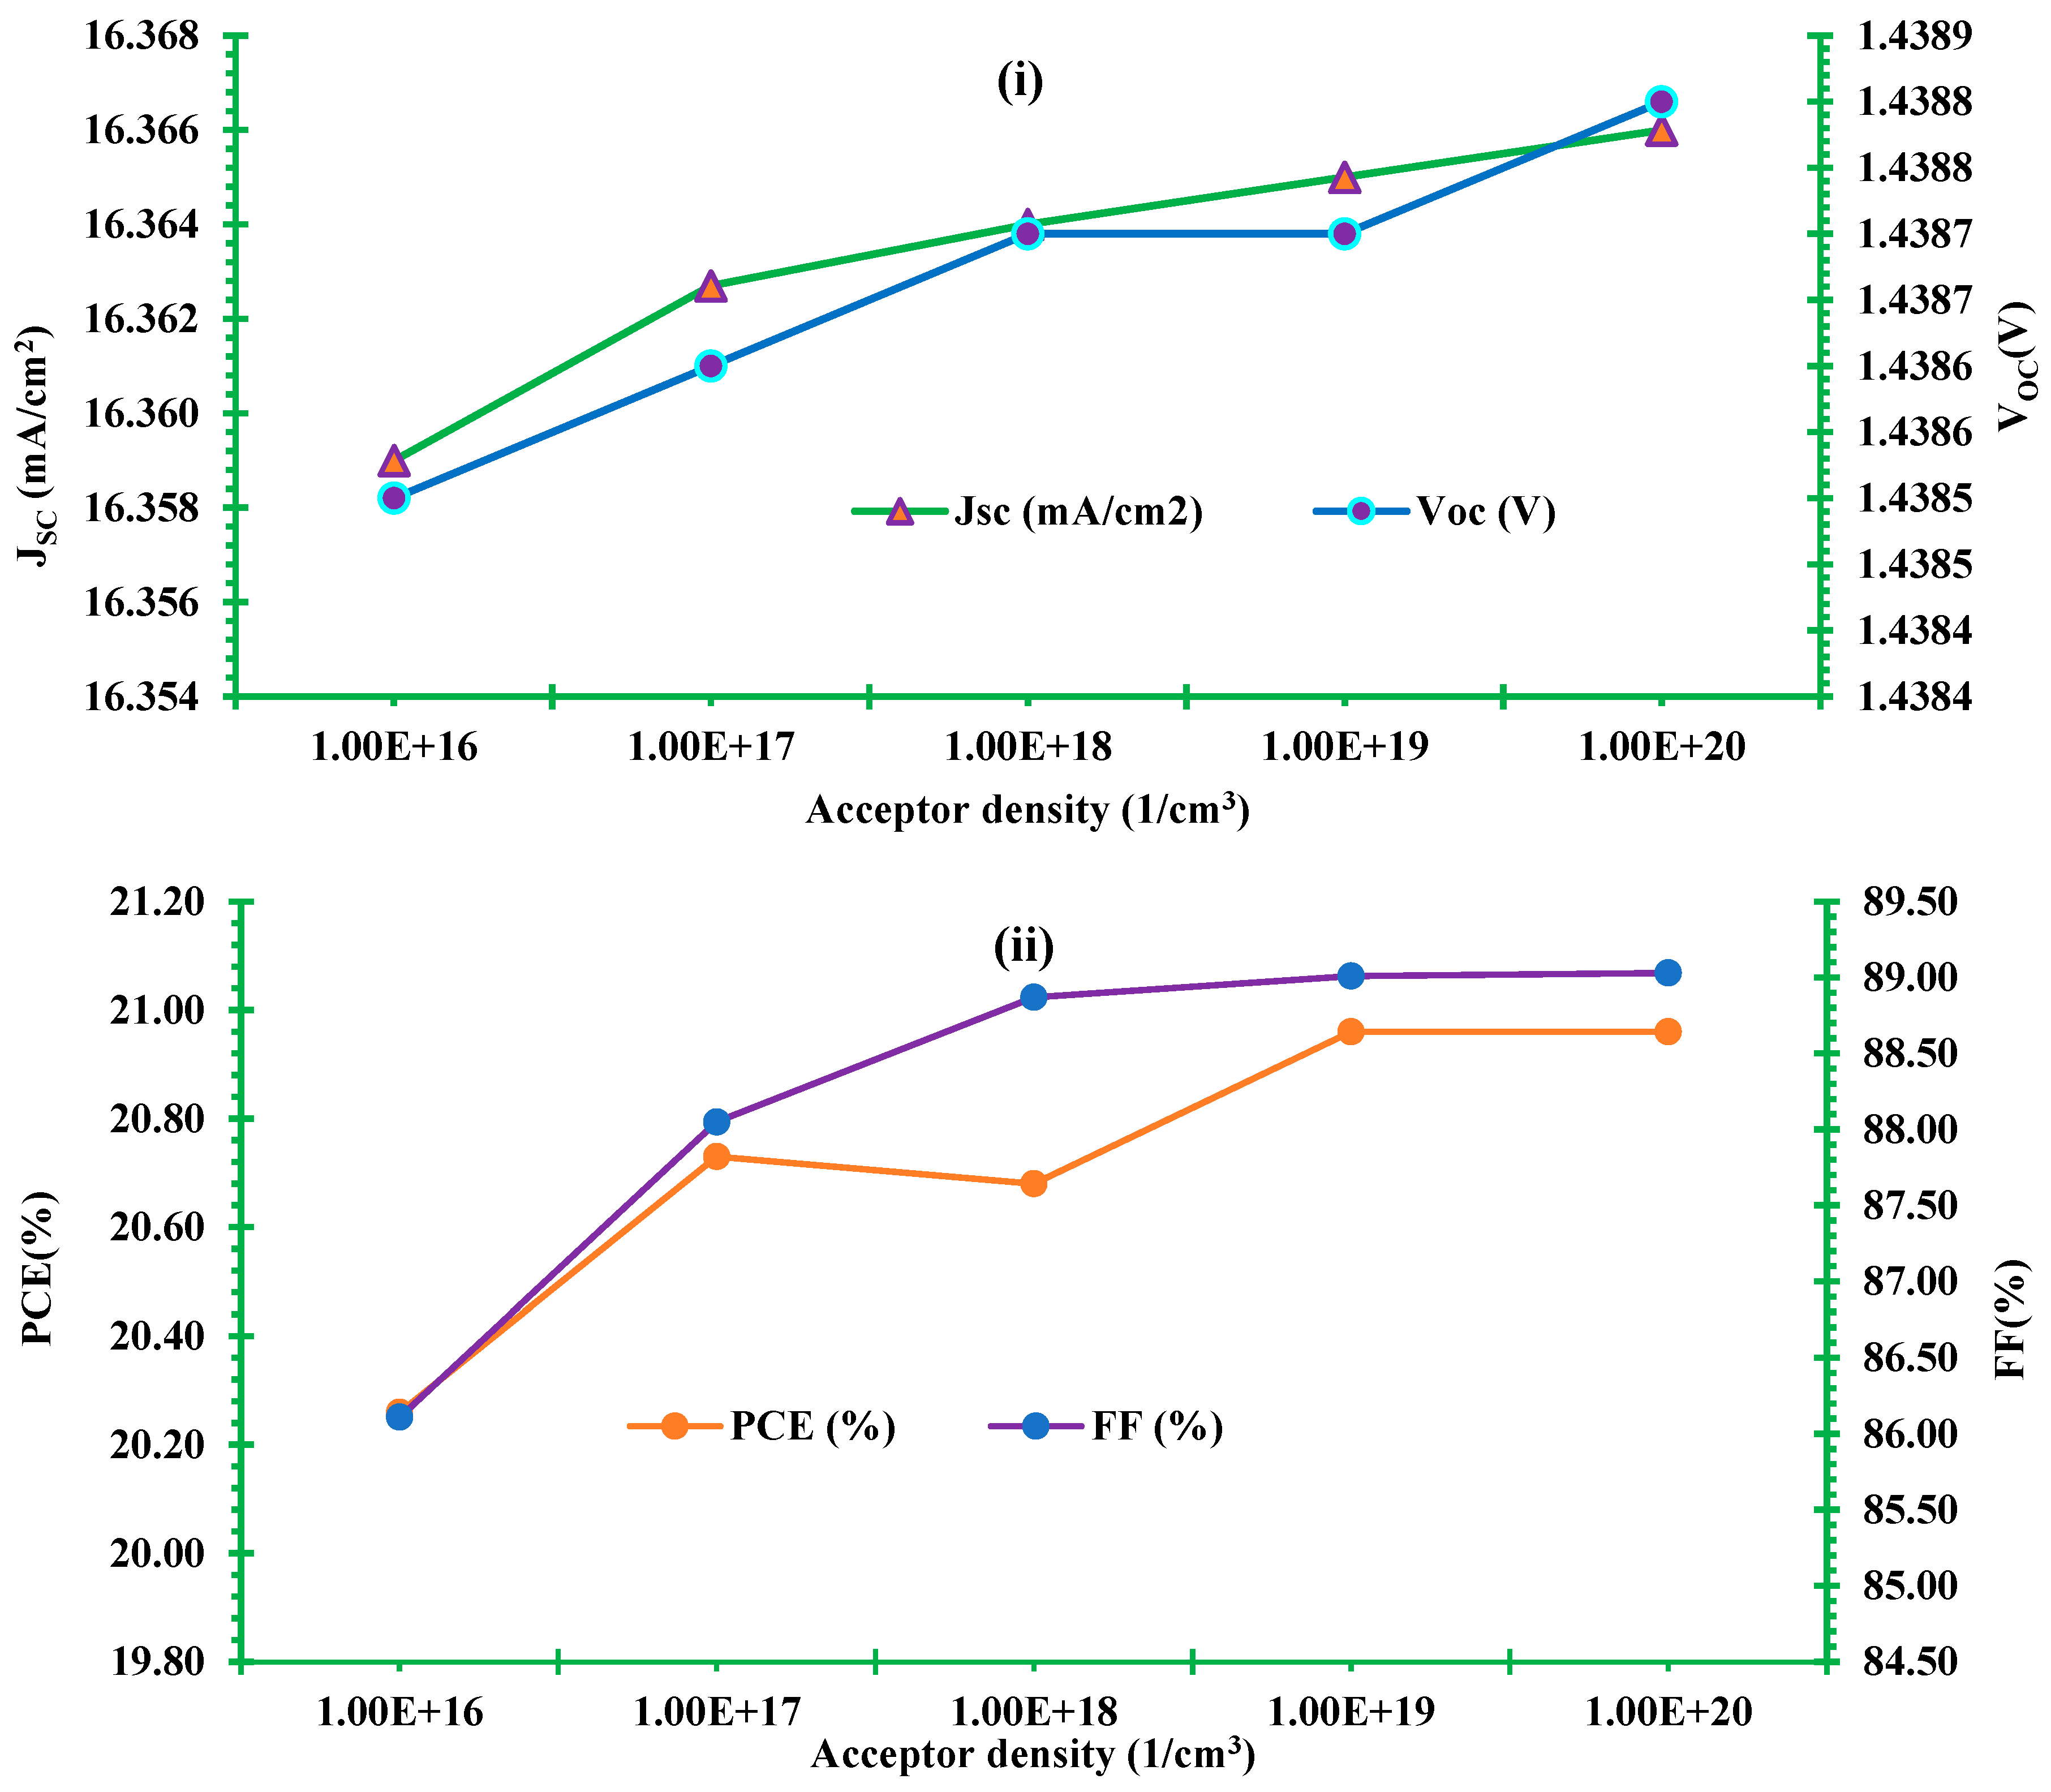
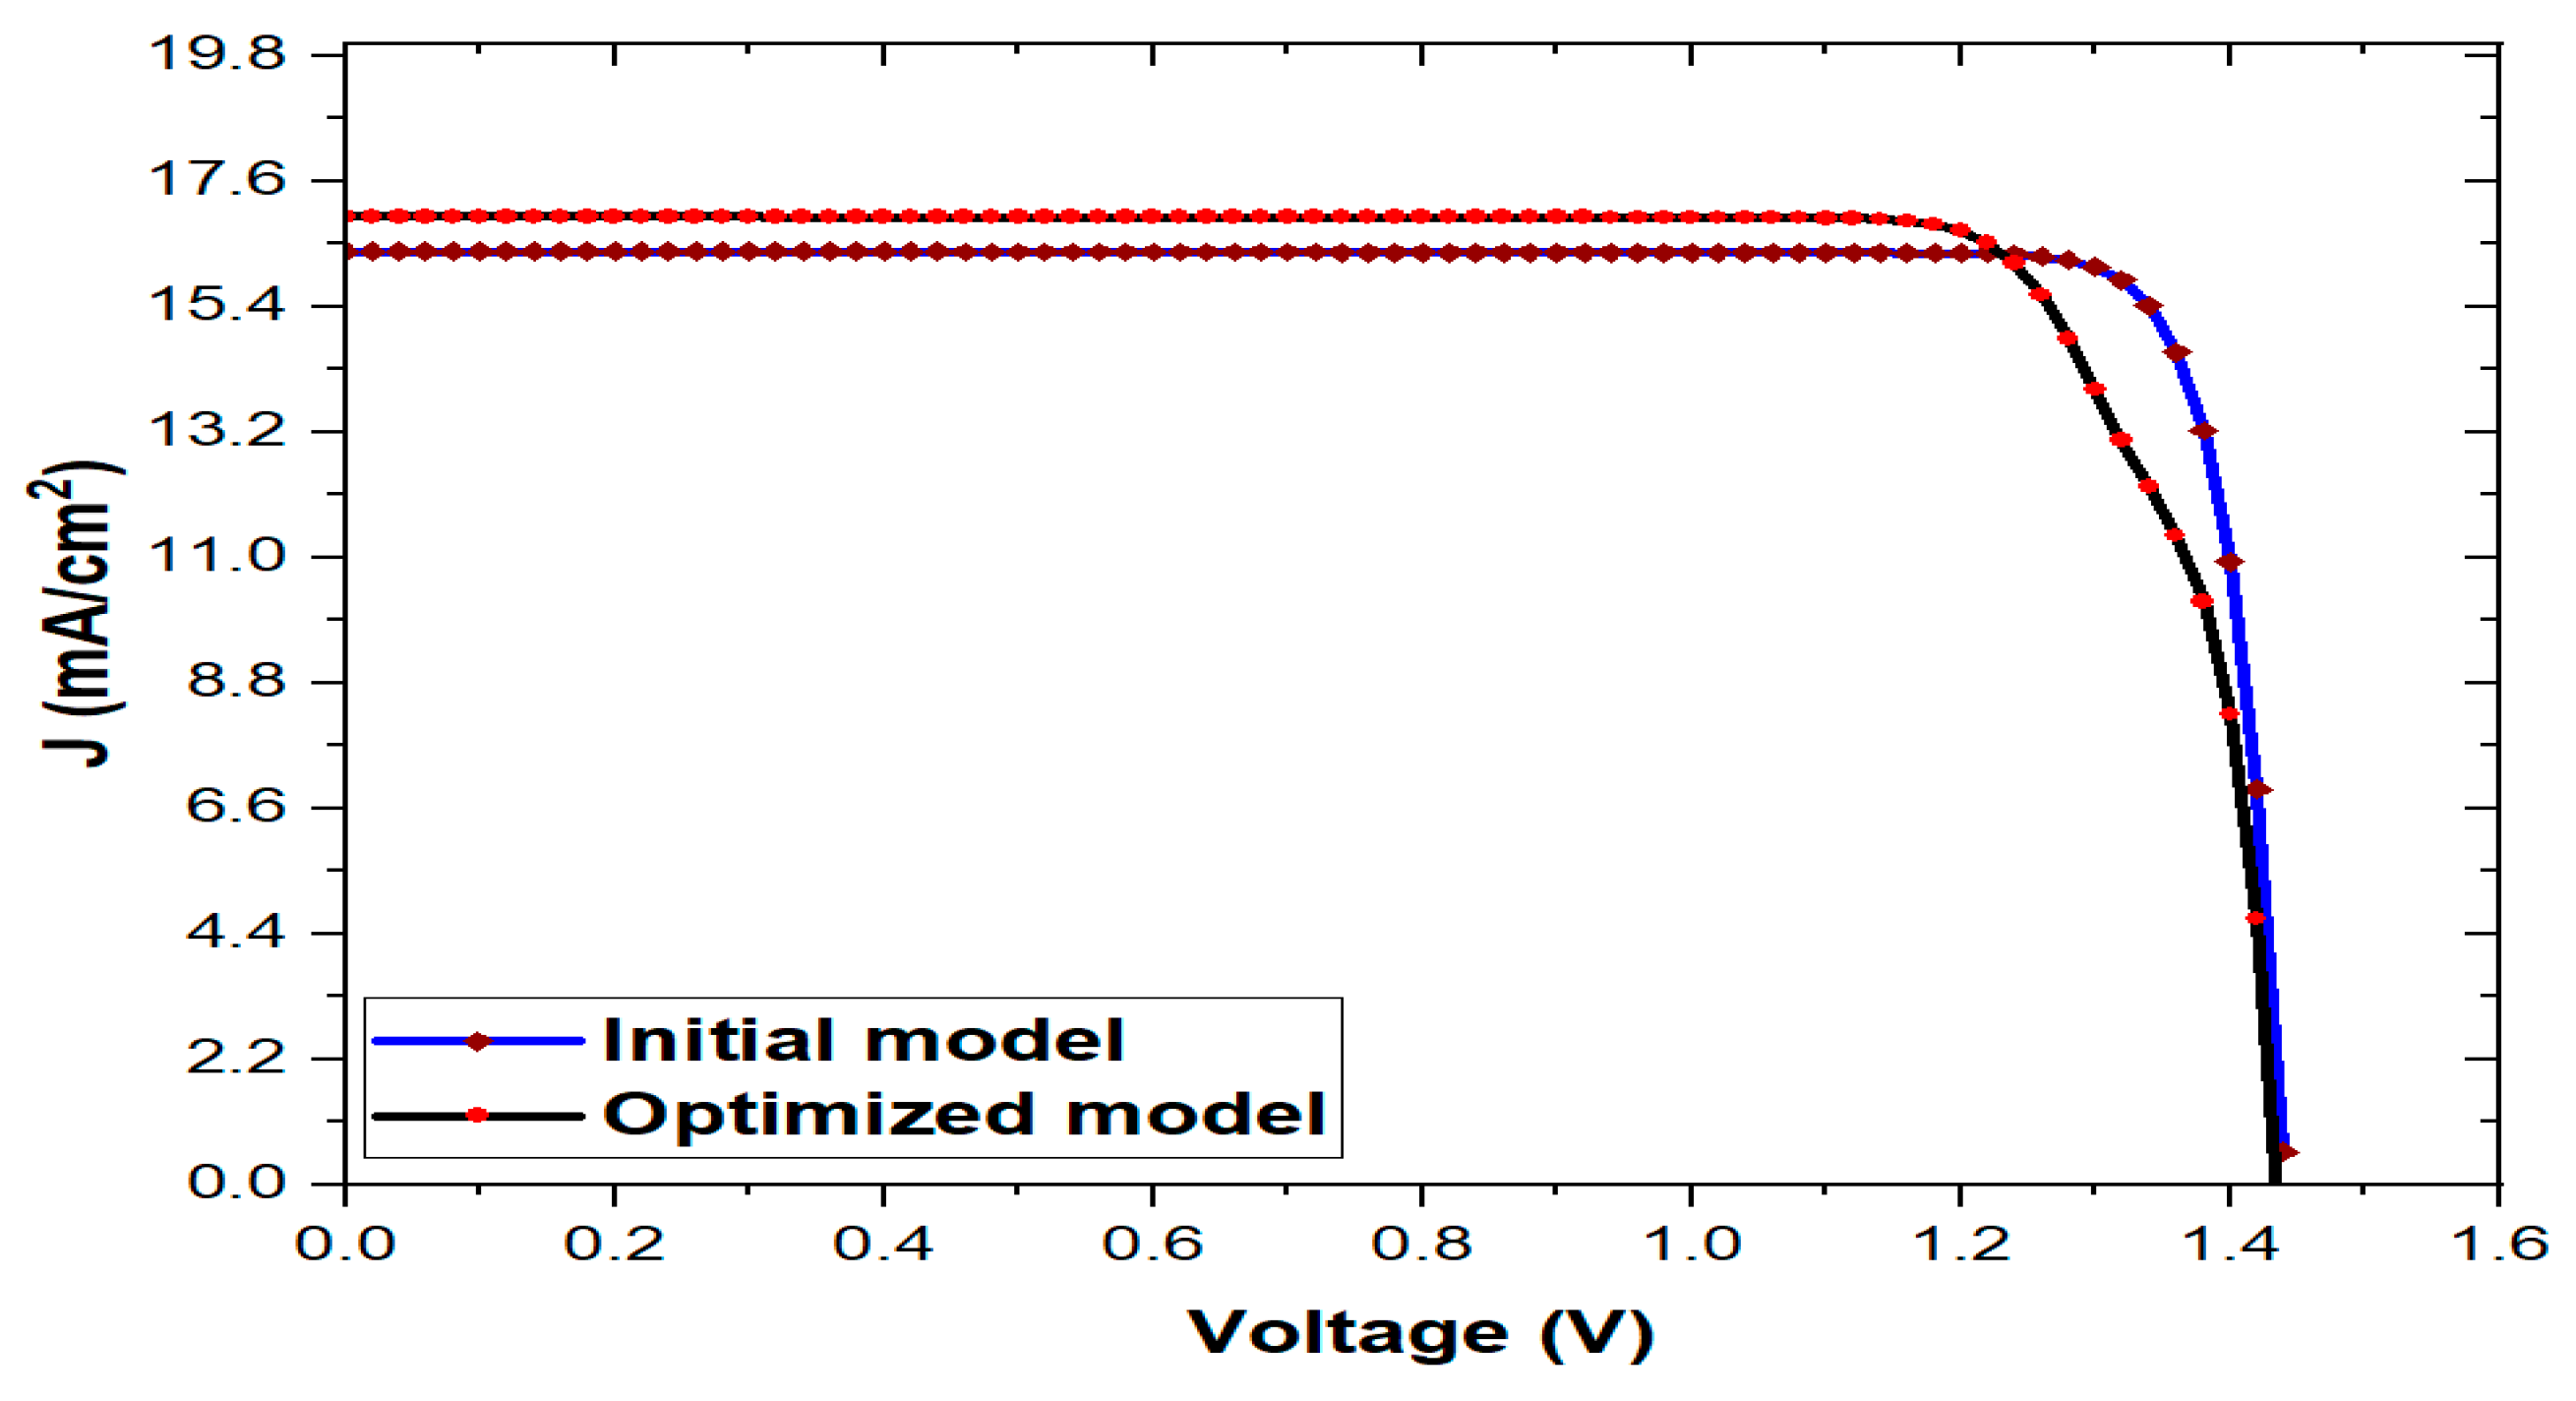
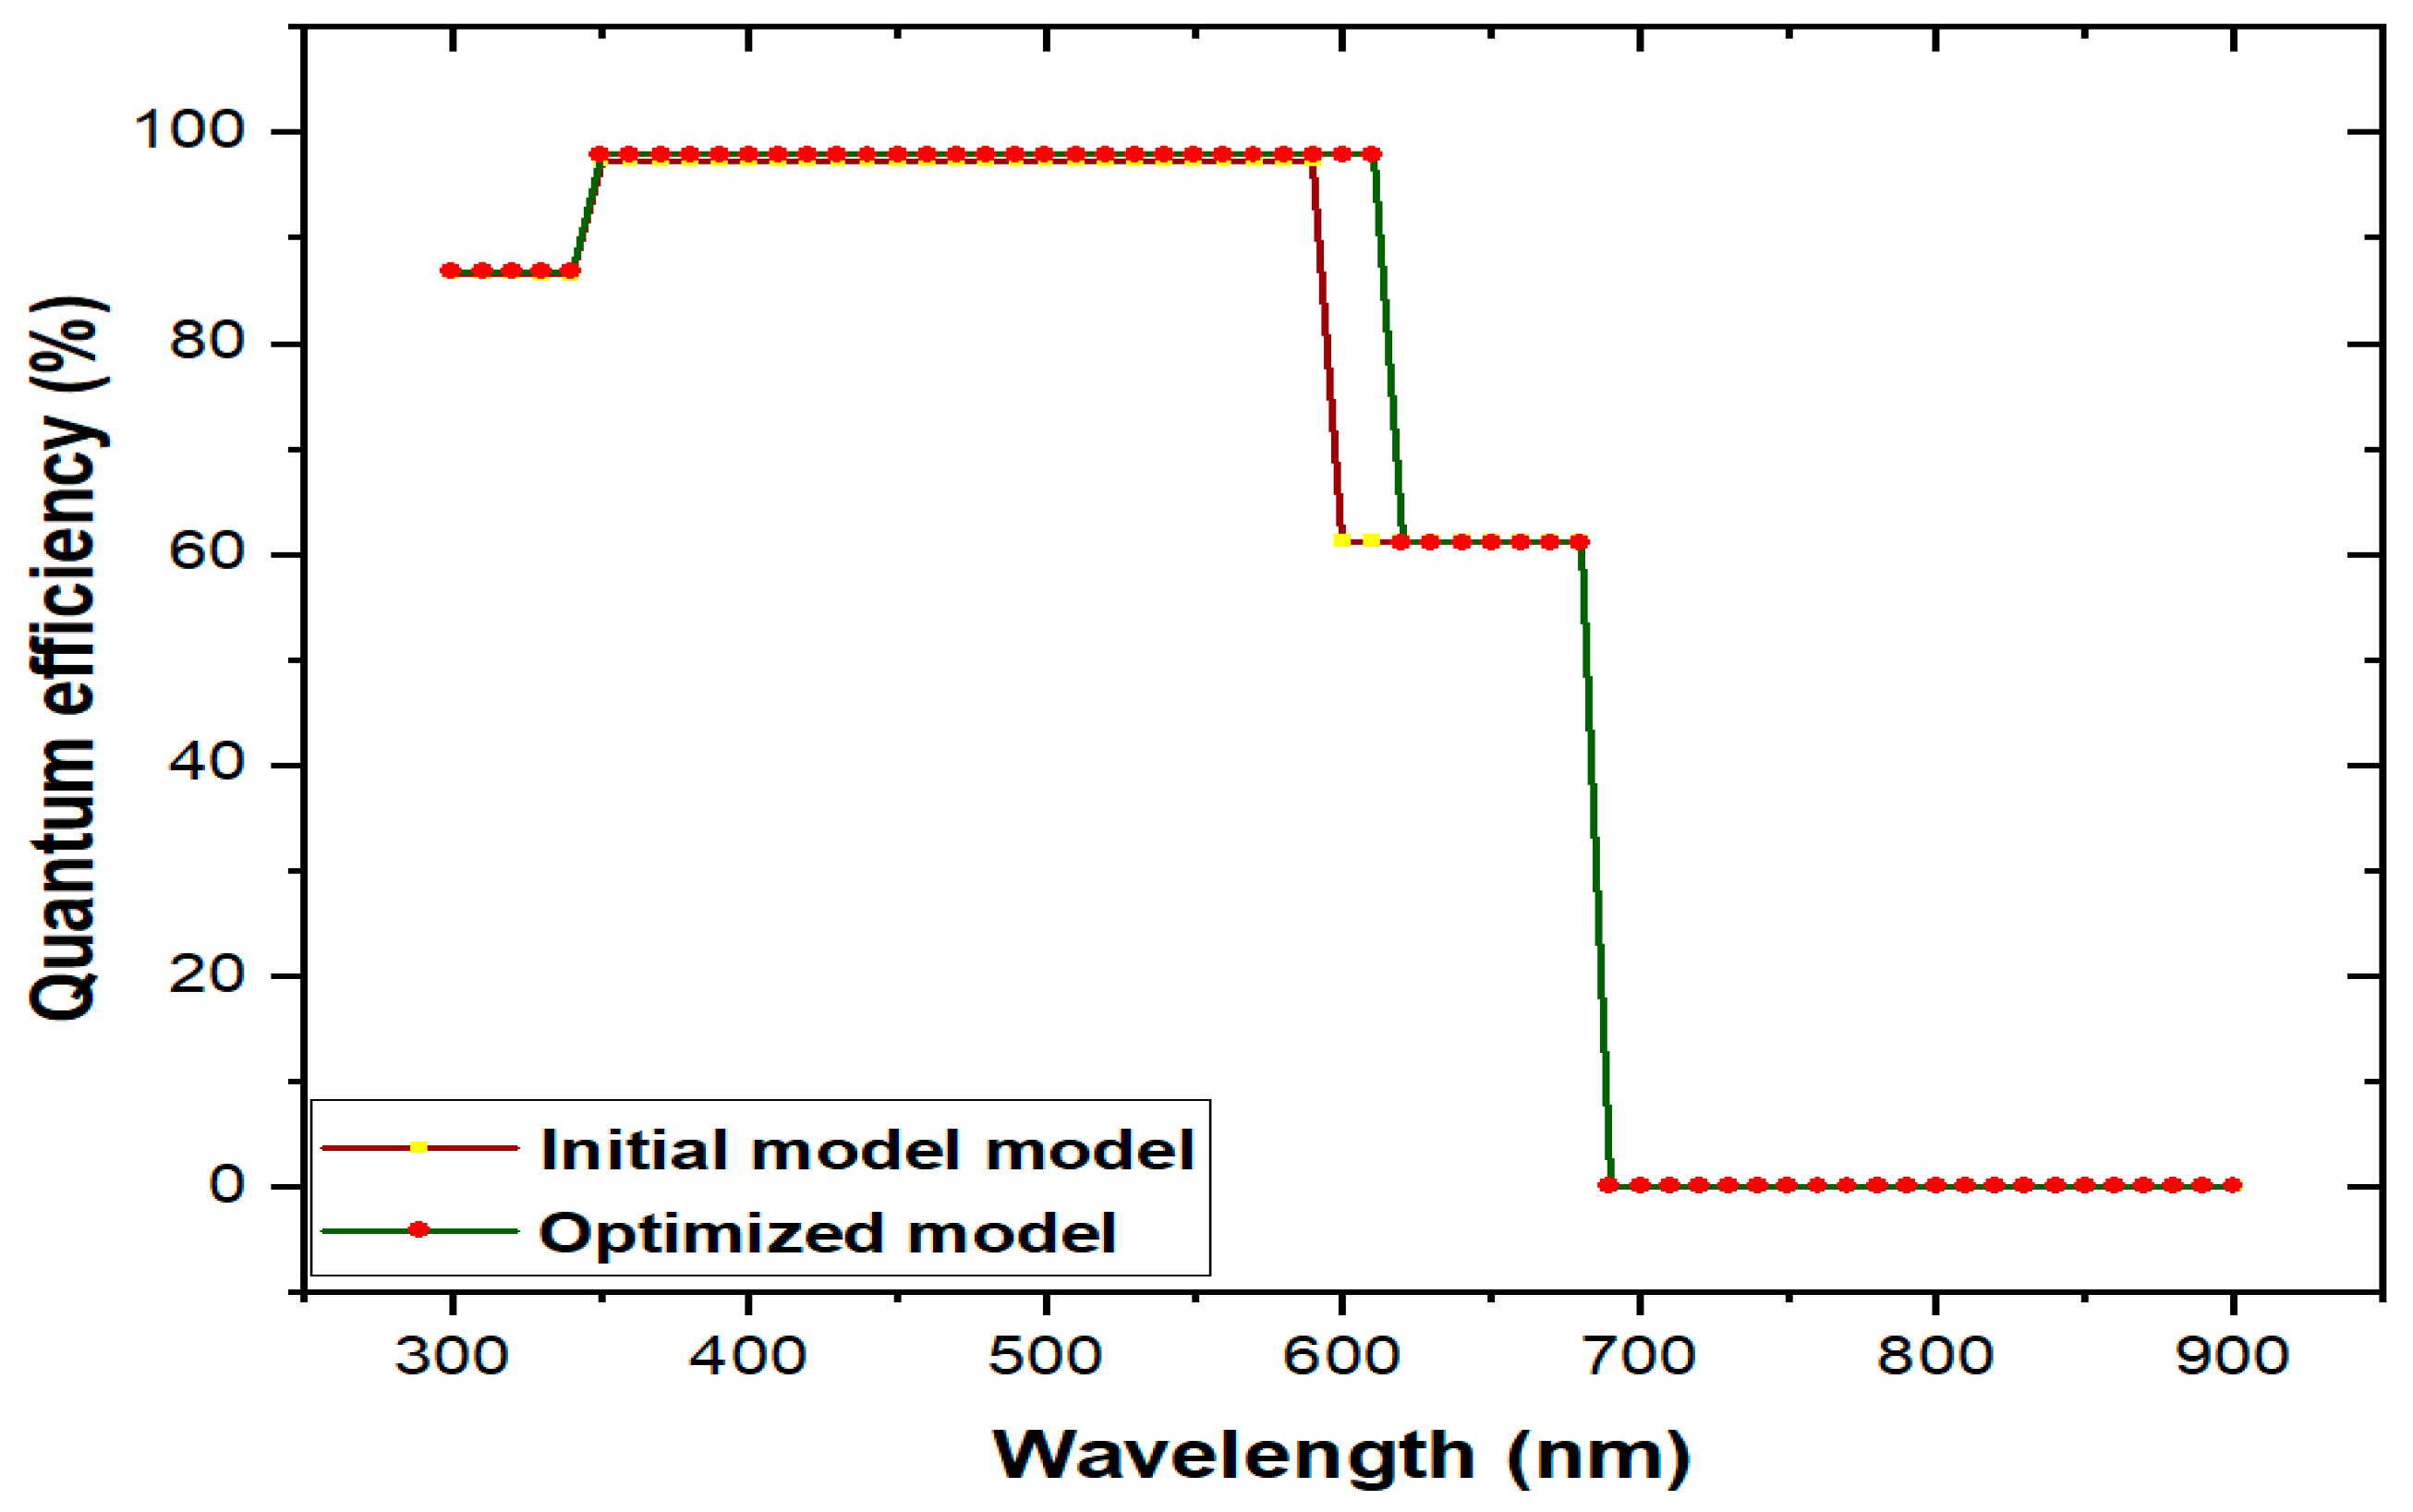
3.6. Comparison of initial and optimized final model
3.7. Comparison with literature
4. Conclusions
Acknowledgement
References
- Fichera, A.; Samanta, S.; Datta Peu, S.; Das, A.; Sanowar Hossain, M.; Abdul Mannan Akanda, M.; et al. A Comprehensive Review on Recent Advancements in Absorption-Based Post Combustion Carbon Capture Technologies to Obtain a Sustainable Energy Sector with Clean Environment. Sustainability 2023, 15, 5827. [Google Scholar] [CrossRef]
- Azam, W.; Khan, I.; Ali, S.A. Alternative energy and natural resources in determining environmental sustainability: a look at the role of government final consumption expenditures in France. Environmental Science and Pollution Research 2022, 1, 1–17. [Google Scholar] [CrossRef]
- Tofu, D.A.; Wolka, K.; Woldeamanuel, T. The impact of alternative energy technology investment on environment and food security in northern Ethiopia. Scientific Reports 2022, 12, 1–11. [Google Scholar] [CrossRef]
- Das, A.; Peu, S.D. A Comprehensive Review on Recent Advancements in Thermochemical Processes for Clean Hydrogen Production to Decarbonize the Energy Sector. Sustainability 2022, 14, 11206. [Google Scholar] [CrossRef]
- Das, A.; Peu, S.D.; Hossain, M.d.S.; Akanda, M.A.M.; Salah, M.M.; Akanda, M.M.H.; et al. Metal Oxide Nanosheet: Synthesis Approaches and Applications in Energy Storage Devices (Batteries, Fuel Cells, and Supercapacitors). Nanomaterials 2023, 13, 1066. [Google Scholar] [CrossRef]
- Zafeiriou, E.; Sariannidis, N.; Tsiantikoudis, S.; Das, A.; Datta Peu, S.; Abdul Mannan Akanda, M.; et al. Peer-to-Peer Energy Trading Pricing Mechanisms: Towards a Comprehensive Analysis of Energy and Network Service Pricing (NSP) Mechanisms to Get Sustainable Enviro-Economical Energy Sector. Energies 2023, 16, 2198. [Google Scholar] [CrossRef]
- Ma, S.; Yuan, G.; Zhang, Y.; Yang, N.; Li, Y.; Chen, Q. Development of encapsulation strategies towards the commercialization of perovskite solar cells. Energy Environ Sci 2022, 15, 13–55. [Google Scholar] [CrossRef]
- Kim, Y.H.; Cho, H.; Heo, J.H.; Kim, T.S.; Myoung, N.S.; Lee, C.L.; et al. Multicolored Organic/Inorganic Hybrid Perovskite Light-Emitting Diodes. Advanced Materials 2015, 27, 1248–1254. [Google Scholar] [CrossRef]
- Dou, L.; Yang, Y.M.; You, J.; Hong, Z.; Chang, W.H.; Li, G.; et al. Solution-processed hybrid perovskite photodetectors with high detectivity. Nature Communications 2014, 5, 1–6. [Google Scholar] [CrossRef]
- Australian manufacturer achieves 32% efficiency for inorganic perovskite solar cell – pv magazine Australia n.d. Available online: https://www.pv-magazine-australia.com/2022/10/18/australian-manufacturer-achieves-32-efficiency-for-inorganic-perovskite-solar-cell/ (accessed on 18 October 2022).
- Kojima, A.; Teshima, K.; Shirai, Y.; Miyasaka, T. Organometal halide perovskites as visible-light sensitizers for photovoltaic cells. J Am Chem Soc 2009, 131, 6050–6051. [Google Scholar] [CrossRef]
- Ameri, M.; Ghaffarkani, M.; Ghahrizjani, R.T.; Safari, N.; Mohajerani, E. Phenomenological morphology design of hybrid organic-inorganic perovskite solar cell for high efficiency and less hysteresis. Solar Energy Materials and Solar Cells 2020, 205, 110251. [Google Scholar] [CrossRef]
- Xiang, T.; Zhang, Y.; Wu, H.; Li, J.; Yang, L.; Wang, K.; et al. Universal defects elimination for high performance thermally evaporated CsPbBr3 perovskite solar cells. Solar Energy Materials and Solar Cells 2020, 206, 110317. [Google Scholar] [CrossRef]
- Bi, H.; Han, G.; Guo, M.; Ding, C.; Zou, H.; Shen, Q.; et al. Multistrategy Preparation of Efficient and Stable Environment-Friendly Lead-Based Perovskite Solar Cells. ACS Appl Mater Interfaces 2022, 14, 35513–35521. [Google Scholar] [CrossRef]
- Shivesh, K.; Alam, I.; Kushwaha, A.K.; Kumar, M.; Singh, S.V. Investigating the theoretical performance of Cs2TiBr6-based perovskite solar cell with La-doped BaSnO3 and CuSbS2 as the charge transport layers. Int J Energy Res 2022, 46, 6045–6064. [Google Scholar] [CrossRef]
- Shi, Z.; Guo, J.; Chen, Y.; Li, Q.; Pan, Y.; Zhang, H.; et al. Lead-Free Organic–Inorganic Hybrid Perovskites for Photovoltaic Applications: Recent Advances and Perspectives. Advanced Materials 2017, 29, 1605005. [Google Scholar] [CrossRef]
- Ustinova, M.I.; Babenko, S.D.; Luchkin, S.Y.; Talalaev, F.S.; Anokhin D v Olthof, S.; et al. Experimental evaluation of indium(I) iodide as a lead-free perovskite-inspired material for photovoltaic applications. J Mater Chem C Mater 2022, 10, 3435–3439. [Google Scholar] [CrossRef]
- Romani, L.; Speltini, A.; Dibenedetto, C.N.; Listorti, A.; Ambrosio, F.; Mosconi, E.; et al. Experimental Strategy and Mechanistic View to Boost the Photocatalytic Activity of Cs3Bi2Br9 Lead-Free Perovskite Derivative by g-C3N4 Composite Engineering. Adv Funct Mater 2021, 31, 2104428. [Google Scholar] [CrossRef]
- Ahmad, K.; Khan, M.Q.; Khan, R.A.; Kim, H. Numerical simulation and fabrication of Pb-free perovskite solar cells (FTO/TiO2/Cs3Bi2I9/spiro-MeOTAD/Au). Opt Mater (Amst) 2022, 128, 112458. [Google Scholar] [CrossRef]
- Hamukwaya, S.L.; Hao, H.; Mashingaidze, M.M.; Zhong, T.; Tang, S.; Dong, J.; et al. Potassium Iodide-Modified Lead-Free Cs3Bi2I9 Perovskites for Enhanced High-Efficiency Solar Cells. Nanomaterials 2022, 12, 3751. [Google Scholar] [CrossRef]
- Koh, T.M.; Krishnamoorthy, T.; Yantara, N.; Shi, C.; Leong, W.L.; Boix, P.P.; et al. Formamidinium tin-based perovskite with low Eg for photovoltaic applications. J Mater Chem A Mater 2015, 3, 14996–15000. [Google Scholar] [CrossRef]
- Noel, N.K.; Stranks, S.D.; Abate, A.; Wehrenfennig, C.; Guarnera, S.; Haghighirad, A.A.; et al. Lead-free organic–inorganic tin halide perovskites for photovoltaic applications. Energy Environ Sci 2014, 7, 3061–3068. [Google Scholar] [CrossRef]
- Krishnamoorthy, T.; Ding, H.; Yan, C.; Leong, W.L.; Baikie, T.; Zhang, Z.; et al. Lead-free germanium iodide perovskite materials for photovoltaic applications. J Mater Chem A Mater 2015, 3, 23829–23832. [Google Scholar] [CrossRef]
- Das, A.; Peu, S.D.; Akanda, M.A.M.; Salah, M.M.; Hossain, M.S.; Das, B.K. Numerical Simulation and Optimization of Inorganic Lead-Free Cs3Bi2I9-Based Perovskite Photovoltaic Cell: Impact of Various Design Parameters. Energies 2023, 16, 2328. [Google Scholar] [CrossRef]
- Lehner, A.J.; Fabini, D.H.; Evans, H.A.; Hébert, C.A.; Smock, S.R.; Hu, J.; et al. Crystal and Electronic Structures of Complex Bismuth Iodides A3Bi2I9 (A = K, Rb, Cs) Related to Perovskite: Aiding the Rational Design of Photovoltaics. Chemistry of Materials 2015, 27, 7137–7148. [Google Scholar] [CrossRef]
- Park, B.W.; Philippe, B.; Zhang, X.; Rensmo, H.; Boschloo, G.; Johansson, E.M.J. Bismuth Based Hybrid Perovskites A3Bi2I9 (A: Methylammonium or Cesium) for Solar Cell Application. Advanced Materials 2015, 27, 6806–6813. [Google Scholar] [CrossRef]
- Ahmad, K.; Khan, M.Q.; Kim, H. Simulation and fabrication of all-inorganic antimony halide perovskite-like material based Pb-free perovskite solar cells. Opt Mater (Amst) 2022, 128, 112374. [Google Scholar] [CrossRef]
- Feng, X.; Guo, Q.; Xiu, J.; Ying, Z.; Ng, K.W.; Huang, L.; et al. Close-loop recycling of perovskite solar cells through dissolution-recrystallization of perovskite by butylamine. Cell Rep Phys Sci 2021, 2, 100341. [Google Scholar] [CrossRef]
- Cacovich, S.; Vidon, G.; Degani, M.; Legrand, M.; Gouda, L.; Puel, J.B.; et al. Imaging and quantifying non-radiative losses at 23% efficient inverted perovskite solar cells interfaces. Nature Communications 2022, 13, 1–9. [Google Scholar] [CrossRef]
- Zheng, X.; Hou, Y.; Bao, C.; Yin, J.; Yuan, F.; Huang, Z.; et al. Managing grains and interfaces via ligand anchoring enables 22. 3%-efficiency inverted perovskite solar cells. Nature Energy 2020, 5, 131–140. [Google Scholar] [CrossRef]
- Chen, M.; Ju, M.G.; Garces, H.F.; Carl, A.D.; Ono, L.K.; Hawash, Z.; et al. Highly stable and efficient all-inorganic lead-free perovskite solar cells with native-oxide passivation. Nature Communications 2019, 10, 1–8. [Google Scholar] [CrossRef]
- Tai, Q.; Guo, X.; Tang, G.; You, P.; Ng, T.W.; Shen, D.; et al. Antioxidant Grain Passivation for Air-Stable Tin-Based Perovskite Solar Cells. Angewandte Chemie International Edition 2019, 58, 806–810. [Google Scholar] [CrossRef] [PubMed]
- Lee, S.; Kang, D.W. Highly Efficient and Stable Sn-Rich Perovskite Solar Cells by Introducing Bromine. ACS Appl Mater Interfaces 2017, 9, 22432–22439. [Google Scholar] [CrossRef]
- Fievez, M.; Singh Rana, P.J.; Koh, T.M.; Manceau, M.; Lew, J.H.; Jamaludin, N.F.; et al. Slot-die coated methylammonium-free perovskite solar cells with 18% efficiency. Solar Energy Materials and Solar Cells 2021;230. [CrossRef]
- Wang, J.T.W.; Wang, Z.; Pathak, S.; Zhang, W.; Dequilettes, D.W.; Wisnivesky-Rocca-Rivarola, F.; et al. Efficient perovskite solar cells by metal ion doping. Energy Environ Sci 2016, 9, 2892–2901. [Google Scholar] [CrossRef]
- Bansode, U.; Naphade, R.; Game, O.; Agarkar, S.; Ogale, S. Hybrid perovskite films by a new variant of pulsed excimer laser deposition: A roomerature dry process. Journal of Physical Chemistry C 2015, 119, 9177–9185. [Google Scholar] [CrossRef]
- Noel, N.K.; Stranks, S.D.; Abate, A.; Wehrenfennig, C.; Guarnera, S.; Haghighirad, A.A.; et al. Lead-free organic–inorganic tin halide perovskites for photovoltaic applications. Energy Environ Sci 2014, 7, 3061–3068. [Google Scholar] [CrossRef]
- Doroody, C.; Rahman, K.S.; Kiong, T.S.; Amin, N. Optoelectrical impact of alternative window layer composition in CdTe thin film solar cells performance. Solar Energy 2022, 233, 523–530. [Google Scholar] [CrossRef]
- Zuo, C.; Ding, L. Solution-Processed Cu2O and CuO as Hole Transport Materials for Efficient Perovskite Solar Cells. Small 2015, 11, 5528–5532. [Google Scholar] [CrossRef]
- Burgelman, M.; Nollet, P.; Degrave, S. Modelling polycrystalline semiconductor solar cells. Thin Solid Films 2000, 361–362, 527–532. [CrossRef]
- Burgelman, M.; Nollet, P.; Degrave, S. Modelling polycrystalline semiconductor solar cells. Thin Solid Films 2000, 361–362, 527–532. [CrossRef]
- Burgelman, M.; Decock, K.; Khelifi, S.; Abass, A. Advanced electrical simulation of thin film solar cells. Thin Solid Films 2013, 535, 296–301. [Google Scholar] [CrossRef]
- Xiao, Z.; Yuan, Y.; Wang, Q.; Shao, Y.; Bai, Y.; Deng, Y.; et al. Thin-film semiconductor perspective of organometal trihalide perovskite materials for high-efficiency solar cells. Materials Science and Engineering: R: Reports 2016, 101, 1–38. [Google Scholar] [CrossRef]
- Burgelman, M.; Verschraegen, J.; Degrave, S.; Nollet, P. Modeling thin-film PV devices. Progress in Photovoltaics: Research and Applications 2004, 12, 143–153. [Google Scholar] [CrossRef]
- Verschraegen, J.; Burgelman, M. Numerical modeling of intra-band tunneling for heterojunction solar cells in scaps. Thin Solid Films 2007, 515, 6276–6279. [Google Scholar] [CrossRef]
- Moiz, S.A.; Alahmadi, A.N.M.; Aljohani, A.J. Design of a Novel Lead-Free Perovskite Solar Cell for 17. 83% Efficiency. IEEE Access 2021, 9, 54254–54263. [Google Scholar] [CrossRef]
- Sobayel, K.; Akhtaruzzaman, M.; Rahman, K.S.; Ferdaous, M.T.; Al-Mutairi, Z.A.; Alharbi, H.F.; et al. A comprehensive defect study of tungsten disulfide (WS2) as electron transport layer in perovskite solar cells by numerical simulation. Results Phys 2019, 12, 1097–1103. [Google Scholar] [CrossRef]
- Islam, M.T.; Jani, M.R.; Shorowordi, K.M.; Hoque, Z.; Gokcek, A.M.; Vattipally, V.; et al. Numerical simulation studies of Cs3Bi2I9 perovskite solar device with optimal selection of electron and hole transport layers. Optik (Stuttg) 2021, 231, 166417. [Google Scholar] [CrossRef]
- Lakhdar, N.; Hima, A. Electron transport material effect on performance of perovskite solar cells based on CH3NH3GeI3. Opt Mater (Amst) 2020, 99, 109517. [Google Scholar] [CrossRef]
- Wang, Y.; Xia, Z.; Liu, Y.; Zhou, H. Simulation of perovskite solar cells with inorganic hole transporting materials. 2015 IEEE 42nd Photovoltaic Specialist Conference, PVSC 2015 2015. [CrossRef]
- Stamate, M.D. On the dielectric properties of dc magnetron TiO2 thin films. Appl Surf Sci 2003, 218, 318–323. [Google Scholar] [CrossRef]
- Niemegeers, A.; Burgelman, M. Numerical modelling of ac-characteristics of CdTe and CIS solar cells. Conference Record of the IEEE Photovoltaic Specialists Conference 1996, 901–904. [Google Scholar] [CrossRef]
- Husainat, A.; Ali, W.; Cofie, P.; Attia, J.; Fuller, J. Simulation and Analysis of Methylammonium Lead Iodide (CH3NH3PbI3) Perovskite Solar Cell with Au Contact Using SCAPS 1D Simulator. Http://WwwSciencepublishinggroupCom 2019, 7, 33. [Google Scholar] [CrossRef]
- Sobayel, K.; Akhtaruzzaman, M.; Rahman, K.S.; Ferdaous, M.T.; Al-Mutairi, Z.A.; Alharbi, H.F.; et al. A comprehensive defect study of tungsten disulfide (WS2) as electron transport layer in perovskite solar cells by numerical simulation. Results Phys 2019, 12, 1097–1103. [Google Scholar] [CrossRef]
- Wojciechowski, K.; Leijtens, T.; Siprova, S.; Schlueter, C.; Hörantner, M.T.; Wang, J.T.W.; et al. C60 as an efficient n-type compact layer in perovskite solar cells. Journal of Physical Chemistry Letters 2015, 6, 2399–2405. [Google Scholar] [CrossRef]
- Islam, A.M.; Islam, S.; Sobayel, K.; Emon, E.I.; Jhuma, F.A.; Shahiduzzaman, M.; et al. Performance analysis of tungsten disulfide (WS2) as an alternative buffer layer for CdTe solar cell through numerical modeling. Opt Mater (Amst) 2021, 120, 111296. [Google Scholar] [CrossRef]
- Zuo, C.; Ding, L. Solution-Processed Cu2O and CuO as Hole Transport Materials for Efficient Perovskite Solar Cells. Small 2015, 11, 5528–5532. [Google Scholar] [CrossRef]
- Raoui, Y.; Ez-Zahraouy, H.; Tahiri, N.; el Bounagui, O.; Ahmad, S.; Kazim, S. Performance analysis of MAPbI3 based perovskite solar cells employing diverse charge selective contacts: Simulation study. Solar Energy 2019, 193, 948–955. [Google Scholar] [CrossRef]
- Kumar, M.H.; Dharani, S.; Leong, W.L.; Boix, P.P.; Prabhakar, R.R.; Baikie, T.; et al. Lead-Free Halide Perovskite Solar Cells with High Photocurrents Realized Through Vacancy Modulation. Advanced Materials 2014, 26, 7122–7127. [Google Scholar] [CrossRef] [PubMed]
- Chen, D.; Wang, Y.; Lin, Z.; Huang, J.; Chen, X.; Pan, D.; et al. Growth strategy and physical properties of the high mobility p-type cui crystal. Cryst Growth Des 2010, 10, 2057–2060. [Google Scholar] [CrossRef]
- Hodes, G. Perovskite-Based Solar Cells. Science (1979) 2013, 342, 317–318. [Google Scholar] [CrossRef]
- Liu, D.; Gangishetty, M.K.; Kelly, T.L. Effect of CH3NH3PbI3 thickness on device efficiency in planar heterojunction perovskite solar cells. J Mater Chem A Mater 2014, 2, 19873–19881. [Google Scholar] [CrossRef]
- Wu, H.; Wang, L.S. A study of nickel monoxide (NiO), nickel dioxide (ONiO), and Ni(O2) complex by anion photoelectron spectroscopy. J Chem Phys 1998, 107, 16. [Google Scholar] [CrossRef]
- Hock, R.; Mayer, T.; Jaegermann, W. P-type doping of spiro-MeOTAD with WO 3 and the spiro-MeOTAD/WO 3 interface investigated by synchrotron-induced photoelectron spectroscopy. Journal of Physical Chemistry C 2012, 116, 18146–18154. [Google Scholar] [CrossRef]
- Du, H.-J.; Wang, W.-C.; Zhu, J.-Z.; Du, H.-J.; Wang, W.-C.; Zhu, J.-Z. Device simulation of lead-free CH3NH3SnI3 perovskite solar cells with high efficiency. Chinese Physics B 2016, 25, 108802–108802. [Google Scholar] [CrossRef]
- Anwar, F.; Mahbub, R.; Satter, S.S.; Ullah, S.M. Effect of Different HTM Layers and Electrical Parameters on ZnO Nanorod-Based Lead-Free Perovskite Solar Cell for High-Efficiency Performance. International Journal of Photoenergy 2017, 2017. [Google Scholar] [CrossRef]
- Ameri, M.; Mohajerani, E.; Ghafarkani, M.; Safari, N.; Alavi, S.A. The investigation of the unseen interrelationship of grain size, ionic defects, device physics and performance of perovskite solar cells. J Phys D Appl Phys 2019, 52, 125501. [Google Scholar] [CrossRef]
- Bag, A.; Radhakrishnan, R.; Nekovei, R.; Jeyakumar, R. Effect of absorber layer, hole transport layer thicknesses, and its doping density on the performance of perovskite solar cells by device simulation. Solar Energy 2020, 196, 177–182. [Google Scholar] [CrossRef]
- Lin, L.; Jiang, L.; Li, P.; Fan, B.; Qiu, Y. A modeled perovskite solar cell structure with a Cu2O hole-transporting layer enabling over 20% efficiency by low-cost low-temperature processing. Journal of Physics and Chemistry of Solids 2019, 124, 205–211. [Google Scholar] [CrossRef]
- Alam, I.; Ashraf, M.A. Effect of different device parameters on tin-based perovskite solar cell coupled with In2S3 electron transport layer and CuSCN and Spiro-OMeTAD alternative hole transport layers for high-efficiency performance. [CrossRef]
- Sadanand Dwivedi, D.K. Modeling of photovoltaic solar cell based on CuSbS absorber for the enhancement of performance. IEEE Trans Electron Devices 2021, 68, 1121–1128. [Google Scholar] [CrossRef]
- He, Y.; Xu, L.; Yang, C.; Guo, X.; Li, S. Design and Numerical Investigation of a Lead-Free Inorganic Layered Double Perovskite Cs4CuSb2Cl12 Nanocrystal Solar Cell by SCAPS-1D. Nanomaterials 2021, 11, 2321. [Google Scholar] [CrossRef]
- Chen, Y.; Shen, H.; Altermatt, P.P. Analysis of recombination losses in screen-printed aluminum-alloyed back surface fields of silicon solar cells by numerical device simulation. Solar Energy Materials and Solar Cells 2014, 120, 356–362. [Google Scholar] [CrossRef]
- Mohandes, A.; Moradi, M.; Nadgaran, H. Numerical simulation of inorganic Cs2AgBiBr6 as a lead-free perovskite using device simulation SCAPS-1D. Optical and Quantum Electronics 2021, 53, 1–22. [Google Scholar] [CrossRef]
- Salah, M.M.; Abouelatta, M.; Shaker, A.; Hassan, K.M.; Saeed, A. A comprehensive simulation study of hybrid halide perovskite solar cell with copper oxide as HTM. Semicond Sci Technol 2019, 34, 115009. [Google Scholar] [CrossRef]
- Alam, I.; Mollick, R.; Ashraf, M.A. Numerical simulation of Cs2AgBiBr6-based perovskite solar cell with ZnO nanorod and P3HT as the charge transport layers. Physica B Condens Matter 2021, 618, 413187. [Google Scholar] [CrossRef]
- Ghrib, T.; AL-Saleem, N.K.; AL-Naghmaish, A.; Elshekhipy, A.A.; Brini, S.; Briki, K.; et al. Annealing effect on the microstructural, optical, electrical, and thermal properties of Cu2O/TiO2/Cu2O/TiO2/Si heterojunction prepared by sol-gel technique. Micro and Nanostructures 2022, 164, 107119. [Google Scholar] [CrossRef]
- Khattak, Y.H.; Vega, E.; Baig, F.; Soucase, B.M. Performance investigation of experimentally fabricated lead iodide perovskite solar cell via numerical analysis. Mater Res Bull 2022, 151, 111802. [Google Scholar] [CrossRef]
- Jeon, Y.J.; Lee, S.; Kang, R.; Kim, J.E.; Yeo, J.S.; Lee, S.H.; et al. Planar heterojunction perovskite solar cells with superior reproducibility. Scientific Reports 2014, 4, 1–7. [Google Scholar] [CrossRef] [PubMed]
- Azri, F.; Meftah, A.; Sengouga, N.; Meftah, A. Electron and hole transport layers optimization by numerical simulation of a perovskite solar cell. Solar Energy 2019, 181, 372–378. [Google Scholar] [CrossRef]
- Ahn, N.; Son, D.Y.; Jang, I.H.; Kang, S.M.; Choi, M.; Park, N.G. Highly Reproducible Perovskite Solar Cells with Average Efficiency of 18. 3% and Best Efficiency of 19.7% Fabricated via Lewis Base Adduct of Lead(II) Iodide. J Am Chem Soc 2015, 137, 8696–8699. [Google Scholar] [CrossRef] [PubMed]
- Christians, J.A.; Fung, R.C.M.; Kamat P, v. An inorganic hole conductor for Organo-lead halide perovskite solar cells. improved hole conductivity with copper iodide. J Am Chem Soc 2014, 136, 758–764. [Google Scholar] [CrossRef] [PubMed]
- Zhang, H.; Ren, X.; Chen, X.; Mao, J.; Cheng, J.; Zhao, Y.; et al. Improving the stability and performance of perovskite solar cells via off-the-shelf post-device ligand treatment. Energy Environ Sci 2018, 11, 2253–2262. [Google Scholar] [CrossRef]
- Islam, M.T.; Jani, M.R.; Shorowordi, K.M.; Hoque, Z.; Gokcek, A.M.; Vattipally, V.; et al. Numerical simulation studies of Cs3Bi2I9 perovskite solar device with optimal selection of electron and hole transport layers. Optik (Stuttg) 2021, 231, 166417. [Google Scholar] [CrossRef]
- Chaudhary, D.K.; Sharma, A.; Kumar, A.; Chauhan, U.; Bhasker, D.r.H.a.r.i.P.; Dhawan, D.r.P.K.; et al. Solvent Engineering of Cs3bi2i9 Perovskite Films for Lead-Free Flexible Semi-Transparent Perovskite Solar Cell Devices with Enhanced Efficiency. SSRN Electronic Journal 2022. [CrossRef]

| Device structure | Year | PCE(%) | VOC(V) | JSC(mA/cm2) | FF(%) | Ref |
|---|---|---|---|---|---|---|
| Au/spiro-OMeTAD/ FTO/TiO2 | 2022 | 12.54 | 1.32 | 13.13 | 72.01 | [27] |
| HTL/back contact /MAPbBr3/SnO2/ FTO | 2021 | 25.40 | 1.19 | 25.09 | 84 | [28] |
| Ag/BCP/PCBM/(Cs0.05(FA5/MAI) 0.95Pb(I0.9Br0.1)3)/PTAA/TTO/Glass | 2021 | 23 | 1.16 | 24 | 82 | [29] |
| Cu/BCP/ITUC60/Cs0.05(FA0.92MA0.08)0.95Pb(I0.92Br0.08)3/ PTAA/ITO | 2020 | 22.30 | 1.71 | 24.10 | 81 | [30] |
| Au/ Spiro-OMeTAD/CsSn0.5Ge0.5I3/PCBM/FTO | 2019 | 7.11 | 0.63 | 18.61 | 60.6 | [31] |
| ITO/NiOx/FASnI3/PCBM/Ag | 2018 | 6.70 | 0.60 | 17.53 | 65 | [32] |
| Ag/PCBM/MASn0.6Pb0.4I3-xBrx/PEDOT:PSS/ITO | 2017 | 12.10 | 0.78 | 20.65 | 75 | [33] |
| Au/Spiro-OMeTAD/Cs0.16FA0.84Pb(I0.88Br0.12)3/SnO2/FTO | 2016 | 18 | 1.02 | 22.40 | 78 | [34] |
| Ag/BCP/PCBM/0.15 mol% Al3+-dopedCH3NH3PbI3/ Poly-TPD/FTO | 2016 | 19.10 | 1.01 | 22.40 | 78 | [35] |
| Au/spiro-OMeTAD /MASnI3/ ZnO/ITO | 2015 | 7.66 | 0.97 | 11.10 | 66 | [36] |
| Au/SpiroOMeTAD + LiTFSI + tBP /MASnI3/ m-TiO2/ TiO2 | 2014 | 6.40 | 0.88 | 16.80 | 42 | [37] |
| Parameter | Cs3Bi2I9 [48] |
PCBM[49,50] | TiO2 [51,52,53] | WS2 [54] | IGZO [49] | C60 [55] | ITO [56] |
|---|---|---|---|---|---|---|---|
| Electron affinity, X (eV) | 3.40 | 3.90 | 4.26 | 3.95 | 4 | 3.90 | 4.1 |
| Relative permittivity () | 9.68 | 4 | 100 | 13.60 | 9 | 4.20 | 10 |
| Thickness(nm) | 1000 | 30 | 30 | 100 | 30 | 50 | 60 |
| Bandgap, Eg (eV) | 2.1 | 2 | 3.20 | 1.80 | 3.50 | 1.70 | 3.6 |
| State density of conduction band, NC (1/cm3) | 4.98×10¹⁹ | 107 | |||||
| State density of valence band, NV (1/cm3) | 2.11×10¹⁹ | 107 | |||||
| AL defect density, Nt (1/cm3) | 1014 | 1015 | - | ||||
| Mobility of electron, (cm2/Vs) | 107 | 100 | 15 | 107 | |||
| Mobility of hole, (cm2/Vs) | 107 | 100 | 0.20 | 107 | |||
| AD, NA(1/cm3) | 1019 | - | - | - | - | - | - |
| DD, ND(1/cm3) | 1019 | 1018 | 1019 |
| Parameter | NiO [50] | CuO [57] | Cu2O [58] | PEDOT [59] | P3HT [58] | CuSCN [58] | CuI [60,61,62,63] | Spiro-OMeTAD [64] | CuSbS2 [65,66,67] |
|---|---|---|---|---|---|---|---|---|---|
| Relative permittivity () | 11.75 | 18.1 | 7.1 | 3 | 3 | 10 | 6.5 | 3 | 14.6 |
| Bandgap, Eg(eV) | 3.6 | 31.5 | 2.17 | 3.6 | 1.7 | 3.4 | 2.98 | 2.9 | 1.58 |
| Electron affinity, X(eV) | 2.1 | 4.07 | 3.2 | 1.57 | 3.5 | 2.1 | 2.1 | 2.2 | 4.2 |
| Thickness(nm) | 50 | 50 | 50 | 50 | 50 | 50 | 50 | 350 | 50 |
| AL defect density, Nt (1/cm3) | |||||||||
| State density of conduction band, NC (1/cm3) | |||||||||
| State density of valence band, NV (1/cm3) | |||||||||
| Mobility of electron, (cm2/Vs) | 100 | 200 | 100 | 49 | |||||
| Mobility of hole, (cm2/Vs) | 0.1 | 8600 | 4 | 49 | |||||
| AD, NA(1/cm3) | 1 | ||||||||
| DD, ND(1/cm3) | - | - | - | - | - | - | - | - | - |
| Parameters | ITO | WS2 | Cs3Bi2I9 | NiO |
|---|---|---|---|---|
| Electron affinity (eV) | 4.1 | 3.95 | 3.4 | 2.1 |
| Bandgap (eV) | 3.6 | 1.8 | 2.10 | 3.6 |
| Thickness (nm) | 60 | 100 | 400 | 150 |
| Dielectric permittivity (relative) | 10 | 13.6 | 9.68 | 11.75 |
| Thermal velocity of hole (cm/s) | 107 | 107 | 107 | 107 |
| Mobility of electron (cm2/Vs) | 50 | 100 | 4.3 | 10-3 |
| CB effective density of states (cm-3) | 2.21018 | 21018 | 4.981019 | |
| VB effective density of states (cm-3) | 1.81019 | 21018 | 2.111019 | |
| Thermal velocity of electron (cm/s) | 107 | 2105 | 107 | 107 |
| Mobility of hole (cm2/Vs) | 75 | 100 | 1.7 | 10-3 |
| Shallow uniform DD, ND (cm-3) | 1019 | 1018 | 1019 | - |
| Shallow uniform AD, NA (cm-3) | - | - | 1019 | |
| Defect density of AL, Nt (cm-3) | - | 1013 | 1012 |
| Models | Methods | VOC(V) | JSC(mA/cm2) | FF(%) | PCE(%) | Ref |
| FTO/TiO2/Cs3Sb2I9/spiro-OMeTAD/Au | Simulation | 1.32 | 13.13 | 72.01 | 12.54 | [27] |
| CZTSe/MAPbI3/Cd1-xZnxS/FTO | Simulation | 1.12 | 26.45 | 88.90 | 27.13 | [78] |
| PTAA/MAPbI3/TiO2 | Experimental | 1.11 | 19.58 | 76 | 16.46 | [79] |
| Spiro − OMeTAD/MAPbI3/TiO2 | Simulation | 1.27 | 21.87 | 79.58 | 22.13 | [80] |
| Spiro − OMeTAD/MAPbI3/TiO2 | Experimental | 1.09 | 23.83 | 76.2 | 19.71 | [81] |
| CuI /MAPbI3/TiO2 | Simulation | 1.27 | 21.89 | 83.12 | 23.14 | [80] |
| CuI /MAPbI3/TiO2 | Experimental | 0.55 | 17.8 | 62 | 6 | [82] |
| NiOx/MAPbI3/PCBM : C60/Zr | Experimental | 1.08 | 23.47 | 79.4 | 20.13 | [83] |
| FTO/TiO2/Cs3Bi2I9/spiro-MeOTAD/Au | Simulation | 1.03 | 21.02 | 73.4 | 11.14 | [84] |
| FTO/TiO2/Cs3Bi2I9/NiO | Simulation | 0.92 | 22.07 | 68.21 | 13.82 | [84] |
| ITO/WS2/Cs3Bi2I9 /NiO/Au | Simulation | 1.438 | 16.366 | 89.03 | 20.96 | [Present work] |
Disclaimer/Publisher’s Note: The statements, opinions and data contained in all publications are solely those of the individual author(s) and contributor(s) and not of MDPI and/or the editor(s). MDPI and/or the editor(s) disclaim responsibility for any injury to people or property resulting from any ideas, methods, instructions or products referred to in the content. |
© 2024 by the authors. Licensee MDPI, Basel, Switzerland. This article is an open access article distributed under the terms and conditions of the Creative Commons Attribution (CC BY) license (https://creativecommons.org/licenses/by/4.0/).


