1. Introduction
Colorectal cancer (CRC) is among the top three cancers with a higher incidence and mortality rate worldwide1–3. This is mainly because the predominant treatment of cancer focuses on inhibiting the growth of cancer, with little emphasis on metastasis4. Limited success has been achieved in terms of treating cancer metastasis5 to face this, target therapy seems to be a new option that has successfully prolonged overall survival for CRC patients6.
Among the biocompatible materials, the one that deserves special attention is EVs. EVs have many of the desirable features of an ideal drug delivery system, such as a long-circulating half-life, the intrinsic ability to target tissues, biocompatibility, biodegradability, and minimal or no inherent toxicity issues7–9. The EVs can deliver conventional chemotherapeutic drugs, increase bioavailability and concentration around tumor tissues, and improve their release profile10. They have also been efficiently used as carriers and tissue-specific drug delivery systems for antitumor agents11,12.
EVs derived from immune cells can activate the immune system by exposing tumor antigens or immune-enhancing molecules and can further be modified to potentiate or redirect its antitumor effects, an interesting concept known as “tumor vaccines”13–15. In addition to their biomedical advantages and immunomodulatory properties, some EVs have also demonstrated intrinsic antitumor activity, due to specific molecules and tumor suppressor agents that they contain12,13,16.
As an important component of innate and adaptive immunity, macrophages may polarize into different functional phenotypes, such as the classically activated M1 and the alternatively activated M2 macrophages (M2-TAM), depending on the external stimulus17. In the context of cancer, M1 macrophages are reportedly associated with tumoricidal activities18–20. Increasing evidence suggests that M2 macrophages could perform immunosuppressive functions and promote tumor progression and metastasis19.
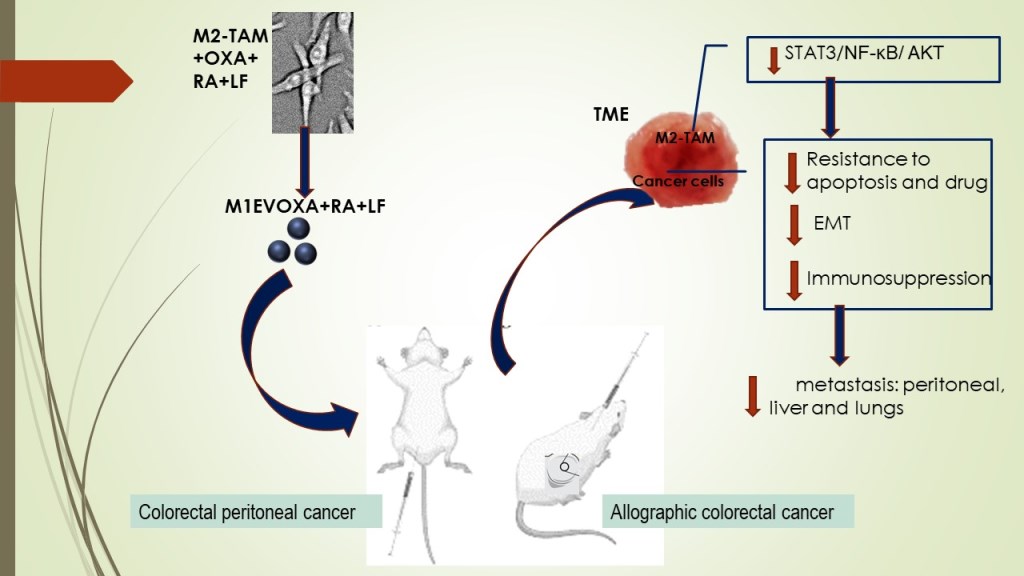
Based on scientific findings, M1 Macrophages are important targets in tumor immunotherapy, especially for potentiating the antitumor response in TME by blocking M2TAM-stimulated STAT3/NF-κB signaling pathways10,21–24. In this context, finding strategies beyond the state-of-the-art in cancer management makes it urgent. There are reports that retinoic acid (RA) generated from vitamin A-derivative retinol acts the innate immunity by binding to intracellular receptors of immune cells25, inhibiting M2-macrophage polarization26,27. Our group has shown that polyphenols, ellagic acid, and gallic acid, present in Libidibia ferrea (LF), a native and endemic species of Brazil, promote antiproliferative activity with induction of intrinsic apoptosis in colorectal cancer cells as well as acting in the decreased of oxygen-reactive species and pro-inflammatory cytokines28,29. Furthermore, ellagic acid reduces the expression of immunosuppressive cytokines by downregulating proficiently NF-κB and STAT330,31 in hepatocarcinoma. In the present work, we analyzed the combination of OXA with EVs of M1 Macrophages loaded with RA and LF to understand their antitumor and antimetastatic properties in colorectal cancer models. For this proposal, the EVs were used as nanocarriers for OXA, RA, and LF to evaluate the antitumor effect in the progression of colorectal cancer.
2. Material and Methods
2.1. Antibodies and reagents
The cytotoxic agent Oxaliplatin used in the experiments (50mg injectable lyophilized powder in a package containing vials) was acquired from LIBBS Pharmaceutical Ltd.a (Sigma-Aldrich, St. Louis, MO, USA). Retinoic acid was purchased from Sigma. The crude extracts of fruits from Libidibia ferrea (LF) using ethanol as solvent at 60% (60T) were obtained from the Therapeutic Innovation laboratory at the Department of Pharmaceutical Sciences-Federal University of Pernambuco (UFPE)28. 1.65g Ellagic acid (EA) and 0.66g gallic acid were quantified from 60T LF by high-performance liquid chromatography (HPLC)28. The EVs were produced and supplied by the Department of Nanobiomaterials and Imaging at Leiden University Medical Center10. The list of antibodies used, and basic information is summarized in table 01S.
2.2. Cell Culture and Cell Lines
Murine colon carcinoma undifferentiated cell lines (CT-26 e MC-38) and macrophage cell lines (RAW 264.7) were obtained from American Type Culture Collection (Rock-Ville, MD, USA). Cell lines were cultivated in Dulbecco’s modified Eagle’s medium (DMEM, Gibco Laboratories, Grand Island, NY, USA) supplemented with 1% antibiotics (penicillin/streptomycin) and 10% fetal bovine serum (FBS). Cells were kept under maintenance until the end of the experiment in a humidified incubator with 5% CO2 at a temperature of 37°C. Cell passage was done 3 times a week by removing the adherent cells with trypsin/EDTA in phosphate-buffered saline (PBS).
2.3. Animals
Male Balb/c mice approximately 7-9 weeks of age weighing 21-28g were purchased at Keizo Asami Immunology Laboratory Facility (FIOCRUZ-PE) and used for the experimental xenographic tumor growth model using undifferentiated carcinoma cell lines from the colon (CT-26). The animals were housed in cages with free access to food and water and treated according to ethical principles for animal experimentation. All surgical and experimental procedures were approved by the ethics committee of the Federal University of Rio Grande do Norte (Nº 222.011/2020 and 265.025/2021).
2.4. Dosage, administration, and group distribution of EVs
The concentrations used in all in vitro experiments corresponded to the quantification of M1EV proteins identified in the nanodrop (µg of protein per mL). For the M1EV protein concentration loaded with RA and L. ferrea without OXA, 20µg/mL was considered. The concentration of OXA in the M1EVs was confirmed by HPLC as described below. For in vivo experiments, the concentration of 2mg/kg of oxaliplatin was standardized.
For the in vivo assays, the respective groups were used: saline group, OXA: 5mg/kg oxaliplatin, 20µg/mL M1EV: M1-EVs, M1EV1: M1EV+OXA, M1EV2: M1EV+OXA+RA, M1EV3: M1EV+OXA+LF, and M1EV4: M1EV+OXA+RA+LF.
For the in vitro assays, cell lines were treated with M1EVs loaded with OXA, RA, and LF (M1EV1; M1EV2 and M1EV3), respectively, or treated with M1EV without OXA but loaded with RA, LF, and RA+LF (M1EVRA: M1EV+RA; M1EVLF: M1EV+LF and M1EVRALF: M1EV+RA+LF), respectively.
2.5. Preparation of EV and OXA loading
To obtain EVs from M1 macrophages, the RAW 264.7 cells were stimulated according to10 to induce their polarization towards an antitumor M1 phenotype 23. Briefly, the RAW cells 264.7 were seeded in medium culture flasks in DMEM and FBS to contribute cell adhesion and growth until 18.4 × 10⁶ cells. The medium was then replaced by DMEM without FBS supplemented with lipopolysaccharides + interferon-gamma (IFN-γ) both at 0.1μg/mL for 48h. Cells were washed and incubated for an additional 48 h with either serum-free media for M1EVs, 100 μg/mL RA, 75 μg/mL L.F, or a combination of both (RA + LF). EVs were collected and purified using a standardized protocol32 of differential centrifugation 33,34 followed by size exclusion separation1 to obtain a monodisperse population enriched in nanosized EVs of around 120nm. The resulting systems (PS-M1-EVs) were characterized by HPLC for analysis of the amount of oxaliplatin incorporated in EVs. The obtained EV fraction was resuspended in PBS (500µl, 1 mg/mL total protein), and characterized for size and polydispersity as described below.
To incorporate OXA, freshly isolated EVs (M1) were incubated with 10 mM solution of OXA (LIBBS Pharmaceutical Ltd.a) in 100% Dimethyl Sulfoxide (DMSO, Sigma Aldrich, cat# D2650-100ML), in a 2:8 ratio, at 4°C for 1 hour. The EVs were centrifuged using size exclusion columns as previously described by our team 35–37and stored at -80°C until used.
2.6. Characterization of EVs
For EVs size distribution and concentration, an aliquot of EVs was diluted in 1mL in sterile PBS and aspirated with a syringe for nanoparticle tracking analysis (NTA) by NanoSight NS300 (Malvern) using an automated syringe pump, camera level of 9 and a detection threshold of 3 for the measurements.
To analyze shape and size, samples were measured by transmission electron microscope (TEM) as previously described 1. Briefly, 20μl EVs were dropped onto a 200-mesh copper grid and incubated at room temperature for 1 min. After fixing with 2% paraformaldehyde for 5 min, EVs were stained with 2% uranyl acetate for 15 min. Rinsed the grids with PBS and dried the grid by contacting the back of the grid with filter paper. Finally, EVs were visualized via a TEM (JEM- 1010, JEOL, Japan). All images were recorded at 18.000× magnification (pixel size 1.2 nm) operating the microscope at 120 kV.
2.7. HPLC
The OXA concentration was then determined using the supernatant after the membrane lysis process on the EVs. The analyzes were performed on a Prominence UFLC-XR chromatographic system (Shimadzu®), consisting of a binary pump (model LC-20AD), online degasser (model DGU-20A3), ALS autosampler (model SIL-20AHT), column oven (model CTO-20A), PDA detector (model SPD-20A) and communication module (model CBM-20A). The data were collected by Shimadzu LC-Solution®software. The oven temperature was set at 30°C with 10μL of injection volume. The wavelength was set at 255 nm. The mobile phase consisted of 10 mM phosphoric acid and acetonitrile (95:5), pumped at 0.5 mL.min-1 in isocratic mode. Due to the high polarity of oxaliplatin, a 10 mM sodium 1-butane sulfonate as a pair was used.
The quantitative analysis was made by a calibration curve (linearity) in a range of 0.3μg/mL-1 to 3.0μg/mL-1. The linearity was determined from three analytical curves in triplicate of the standards. Oxaliplatin concentrations were 0.3, 0.6, 0.9, 1.2, 2.4, and 3.0μg/mL-1. The results were evaluated from the regression coefficient. The limits of detection (LODs) and quantification (LOQs) were calculated with the standard deviation of the slope (σ) and mean value of the slope (S) of the analytical curves.
2.8. Cell uptake
EVs were labeled with a green, fluorescent Vybrant™ Multicolor Cell-Labeling Kit (DiR TermoFisher SCIENTIFIC) by incubation followed by size exclusion separation as previously shown by our group36 . Cells were seeded at 5x10³ cells/well in a cover glass and incubated overnight. After the cells adhered to the cover glass, the medium was changed, and the cells were incubated for 24 hours with DIR-labelled EVs. The cell membrane was marked with DIL and the nuclei with DAPI. The cover glasses were mounted on slides with VECTASHIELD Mounting Medium. Samples were examined with a Leica DM5500 B fluorescence microscope and a Leica DFC365 FX digital camera. Digital images were made, analyzed, and stored using Leica Application Suite X (LAS X) software.
2.9. Polarization of RAW 264.7 cells
RAW 264.7 cells were seeded in a 12-well plate at a density of 5 × 10⁵ cells and supplemented with DMEM as described above for 24 h. For stimulation of M2-like polarization, RAW 264.7 cells were cultured with 0.04 µg/mL of IL-4 for 48 h in a serum-free medium as previously described by Araujo et al.23. To evaluate the effect of M1EVs on polarization of the M2-polarized tumor-associated macrophages (M2-TAMs), the RAW 264.7 cells were incubated with M1EVRALF, M1EVLF, M1EVRA, and M1EV after the M2 polarization for 48h. Likewise, M2-polarized TAMs (5 × 10⁴ cells/well) were seeded in 12-well plates (BD Bioscience) in DMEM medium supplemented with 10% FBS. CT-26 cells (1 × 10⁴ cells/insert) were seeded into the upper chamber of the transwell insert with an 8 μm pore size (Corning Inc., Corning, NY, USA) in DMEM with 10% FBS. The following day, the culture inserts with M2-polarized TAMs were treated with M1EVRALF, M1EVLF, M1EVRA and M1EV, and cells were cultured for another 48 h in a humidified incubator with 5% CO2 at a temperature of 37 °C.
The cells were harvested and blocked with 0.5% BSA in PBS for 45 min and then labeled with anti-CD163-PerCP (1:1000) or anti-CD68-FITC (1:1000) antibodies. The cells were protected from light until analyzed by the flow cytometer FACSCalibur (BD Biosciences). All groups were analyzed in duplicates and the experiment was repeated 3 times to confirm the results.
2.10. Enzyme-linked immunosorbent assay for IL-10
RAW 264.7 cells were seeded in a 12-well plate at a density of 5×10⁵ cells and supplemented with DMEM as previously 10 above for 24h. For stimulation of M2-like polarization, RAW 264.7 cells were cultured with 0.04 µg/mL of IL-4 (20 ng·ml−1) for 48 h in a serum-free medium. Afterward, RAW 264.7 cells were treated with M1EV, M1EVRA, M1EVLF, and M1EVRALF for 48h. For M1-like polarization, RAW 264.7 cells were incubated with 0.1 μg/mL lipopolysaccharides (LPS) and 0.1 μg interferon-gamma (IFN-γ) for 48h.
The M2-conditioned medium (CM) from RAW 264.7 cells treated with IL-4, M1EV, M1EVRA, M1EVLF, and M1EVRALF was collected and stored at −80°C to analyze the IL-10 levels. The levels of IL-10 and IL-12 were measured in the CM using a LEGEND MAX™ IL-12 ELISA Kit (BioLegend, Cat#430607, and Cat#430707, respectively) according to the manufacturer's instructions as described previously. Three independent assays with at least three replicates were performed for each experiment.
2.11. Cell Viability assays
CT-26 cells were plated in 96-well flat-bottom plates at a density of 5x10³ per 100μL overnight and then treated for 24 and 48hs with tested compounds. Following previously published protocols, to calculate the 50% inhibitory concentrations (IC50) colorectal cells were treated using 5µg/mL, 10µg/mL, and 20µg/mL concentrations of M1EVs. As controls, CT-26 in the DMEM without treatment and CT-26 treated with 50µg/mL, 25µg/mL, and 12.5µg/mL of OXA were analyzed. After incubation, the medium was refreshed for both cell lines and cells were incubated with CellTiter 96 AQueous One Solution (MTS) solution (Promega, Madison, WI, USA) according to the manufacturer’s guidelines. Absorbance was measured at 490 nm using a (SpectraMax ID3 microplate reader, Molecular Devices).
2.12. Detection of Cell Death by Flow Cytometry
The apoptotic profile of CT-26 cells was measured by flow cytometry from Annexin V-FITC Apoptosis Detection Kit (ab 14085). CT-26 was plated in 96 well plates and treated with OXA 25µg/mL, M1EV, M1EVRA, M1EVLF, M1EV1, M1EV2, and M1EV3 for 24 and 48h.
The cells were processed according to the manufacturer's guidelines, double-labeled with Annexin V/FITC and PI, and analyzed by flow cytometer BD FACSCalibur (Biosciences, Franklin Lakes, NJ, USA) for 10.000 events. Data analysis was performed on FlowJo software (BD Biosciences). Annexin V/FITC-only labeled cell populations indicate the early apoptosis stage, while Annexin V/FITC and PI double-labeled cells indicate the advanced apoptosis stage.
2.13. EMT Analysis by Immunofluorescence
Immunostaining was performed to identify proteins involved in epithelial-mesenchymal-transition (EMT), such as: E-cadherin and Vimentin. On a cover glass, CT-26 were seeded at 2x10⁴ cells/well density and placed in a 24-well plate containing DMEM supplemented with 10% FBS. After complete adhesion, cells were treated with 20 µg/mL of M1EV, M1EVRA, M1EVLF e M1EVRALF and maintained for 48h. After this time, cells were washed with PBS, fixed in 4% buffered paraformaldehyde, permeated with TritonX-100 (0.3%), and then incubated with anti-E-Cadherin and Vimentin antibodies overnight in a humid chamber. Antibodies were diluted (1:200) in Diamond antibody diluent (Cell Marque, Rocklin, CA, USA). The cells were then washed and incubated with Alexa®Fluor 488 at 1:300 in blocking solution for another 60 min and 1:1000 DAPI (Life Technologies) for nuclear staining. Samples were analyzed using a Leica DM5500 B fluorescence microscope (Leica Microsystems, Wetzlar, Germany) using an appropriate filter to detect the excitation of the staining.
2.14. Analysis of gene expression in CT-26 and MC38 cell lines by qRT-PCR
CT-26 and MC-38 cell lines were observed by indirect co-culture tests with M2-polarized macrophage cell lines RAW 264.7. In a 12-well plate, MC38 cells and CT-26 cells were plated at a density of 2x10⁵ cells/well in DMEM supplemented with 10% FBS. At the same time, M2-polarized were plated at a density of (1x10⁴ cells/insert) into the 5 µm pore size transwell insert chamber (Corning Inc., Corning, NY, USA) in DMEM supplemented with 10% of FBS.
After 24h the MC38 cells and CT-26 within the insert were treated with 20µg/mL of M1EV, M1EVRA, M1EVLF, and M1EVRALF and maintained for another 48h. After treatment, MC38 and CT-26 were harvested with TRIzol® reagent (Invitrogen, CA, USA). 48hs later the cells were processed into chloroform and absolute ethanol for complete RNA extraction. Then total RNA was purified using SV Total RNA Isolation System (Promega, WI, USA) according to the manufacturer's instructions. Then, the RNA was immediately converted to cDNA by reverse transcriptase using a High-capacity RNA-to-cDNA™ kit (Applied Biosystems, Waltham, MA, USA).
Were evaluated the expression of genes: STAT3 (F, 5-’GGGCCTGGTGTGAACTACTC-3’ and R, 5-′GGTATTGCTGCAGGTCGTTG-3’ 59.8°C), SURVIVIN (F, 5-’AGAACAAAATTGCAAAGGAGACCA-3’ and R, 5-’GGCATGTCACTCAGGTCCAA-3’,59.8°C), MDR1 (F, 5-’TCAGCAACAGCAGTCTGGAG-3’ and R, 5-’ACTATGAGCACACCAGCACC-3’, 60°C), FAAD (F, 5-’AGAAGAAGAACGCCTCGGTG-3’ and R, 5-’GCTCACAGATTCCTGGGCTT-3’; 55.5°C), APAF-1 (F, 5-’TTCCAGTGGCAAGGACACAG-3’ and R, 5-’CCACTCTCCACAGGGACAAC-3’;60°C), NF-κB (F, 5-’CCGTCTGTCTGCTCTCTCT-3’ and R, 5-’CGTAGGGATCATCGTCTGCC-3’; 59.1°C), Cadherin (F, 5-’TGATGATGCCCCCAACACTC-3’ and R, 5’CCAAGCCCTTGGCTGTTTTC3’; 60°C), and Vimentin (F, 5-’TCCAGAGAGAGGAAGCCGAA-3’ and R, 5-’CTTTCATACTGCTGGCGCAC-3’ 59.93°C).
Real-time quantitative PCR analysis of genes of interest was performed using PowerUp™ SYBR® Green Master Mix (Applied Biosystems). The experiments were performed in triplicate. The standard qRT-PCR conditions and relative expression were calculated using the 2−ΔΔCt as previously described (33).
2.15. In Vivo2.16. Colorectal cancer allographic model and treatment regimens
To assess the potential for inhibiting tumor growth by M1EVs in the animal model (34) of allographic colorectal cancer tumor growth, CT-26 cells (1x10⁶/mice) were inoculated subcutaneously injected into the right flank of male Balb/c mice. When the tumor volume achieved 3-4mm (35), the animals were organized into seven groups: Saline, M1EV, OXA, M1EV1, M1EV2, M1EV3, and M1EV4 with five animals each and treated intratumorally. The treatments were readministered every 5 days (3 treatments in 15 days). The tumor size was measured following the description (36,37). The equation mm3 = (width × length2)×0.52 (38) was used to calculate their volume.
At the end of the experiment the animals were euthanized (80mg/kg, I.P.) 2% thiopental (Cristália, São Paulo, Brazil), and the subcutaneous tumor was removed and collected, half of the tumor was stored at -80°C for qPCR analysis and the other part were placed in 10% paraformaldehyde for histopathological analysis.
All animal protocols have been carried out in accordance with the Guide for the Care and Use of Laboratory Animals as adopted by the U.S. National Institutes of Health and were approved by our institutional Animal Use Ethics Committee CEUA N. 222.011/2020.
2.17. Immunofluorescence
To order to understand tumor immunity, activation of the immune response via immunological control points as well as modulation of the metastatic process, expression of cytokines such as IL-10, PD-L1, and MMP-2 was studied. The expression of these targets was analyzed through immunofluorescence in tumor fragments collected from the mice used in the CRC allographic model. Three random fragments of the tumor tissue sections from each animal (three animals per group) were deparaffinized as previously described (24).
The sections were incubated overnight with mouse anti-MMP2, PDL-1, and IL-10 primary antibodies (1:300 in blocking solution 1% normal goat serum; Abcam, USA and Santa Cruz Biotechnology, USA, respectively) at 4°C, washed three times in PBS/0,2% triton X-100 for 5 min and incubated with Alexa®Fluor 555 goat anti-rabbit or goat anti-mouse secondary antibody (1:400 in BSA 1%). After washing, the glass coverslips were removed and rested on a mounting medium containing DAPI (Abcam) on glass slides for labeling the colors. The cells were analyzed using a fluorescence microscope (ZEISS), and digital images were collected to assess the average fluorescence intensity using the ZEN blue software (ZEISS).
2.18. Immunohistochemistry
Immunohistochemical staining of thin sections of the allographic tumors and peritoneal tumors (3μm) from three animals per group was obtained from each group. The tissue fragments were prepared as previously described (24). Tissue sections were incubated overnight at 4°C with primary antibodies anti-AKT (Santa Cruz Biotechnology, Cat# sc-5298), anti-PI3K (Santa Cruz Biotechnology, Cat# sc-1737), anti-E-cadherin (Cat # MA1-06304) (all 1:400; Cell Marque, Rocklin, CA, USA), anti-AKT (Santa Cruz Biotechnology, Cat# sc-5298), anti-CD163 (ProteinTech, Cat#16646-1-AP), anti-CXCL12 (RD Systems, Cat# COJ0519041) and anti-NF-kB((Santa Cruz Biotechnology, Cat#sc-8008) (all 1:400)). Slices were washed with phosphate buffer and incubated with a streptavidin/HRP-conjugated secondary antibody (VECTASTAIN Universal Quick HRP Kit) for 30 min. Immunoreactivity to the various proteins was visualized with a colorimetric-based detection kit following the protocol provided by the manufacturer. The cell nucleus was differentiated with Mayer's hematoxylin for 5 min.
The immunoreactivity was analyzed based on the scores of Charafe-Jauffret(35). The slides were analyzed under a microscope (Nikon E200 LED, Department of Morphology/UFRN) with objectives (40x and 100x). The intensity of cell immunostaining was scored as follows: 1 = absence of positive cells, 2 = small number of positive cells or isolated cells, 3 = moderate number of positive cells, and 4 = large number of positive cells10,27. Marking intensity was assessed by two examiners previously trained in a double-blind manner.
2.19. Peritoneal colorectal cancer model
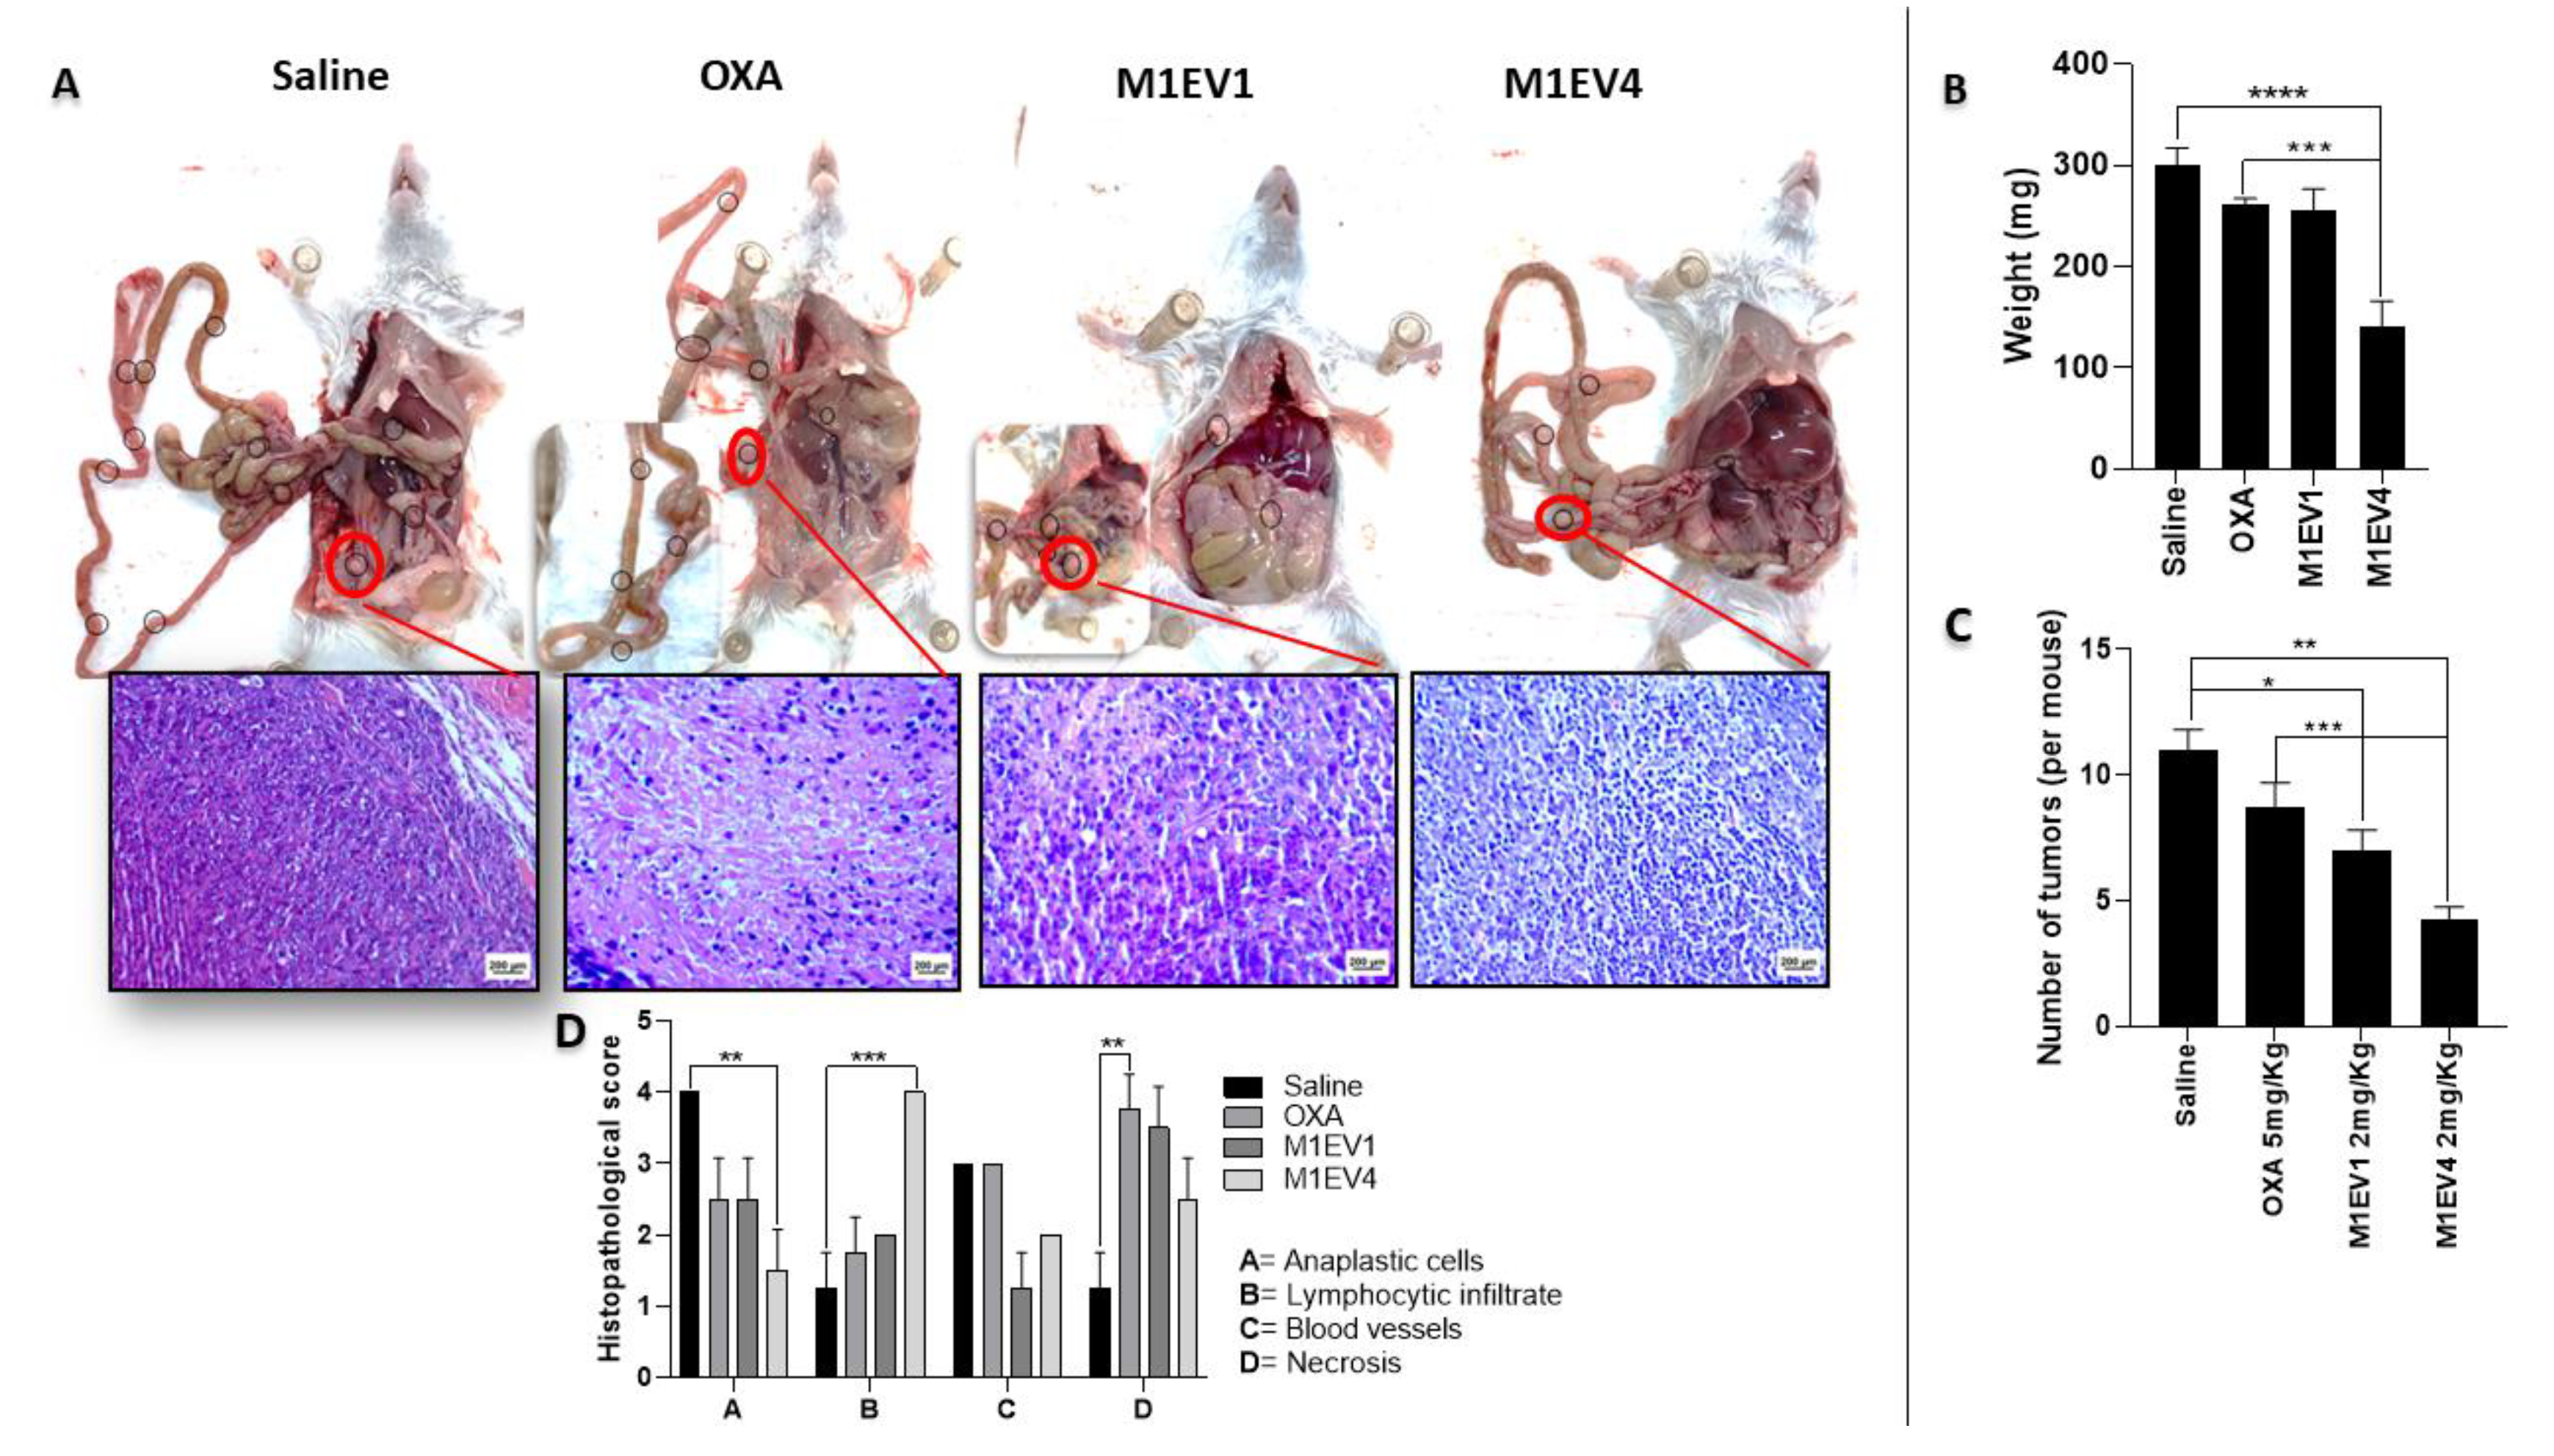
The aggressive metastatic disseminated peritoneal colorectal carcinoma model was developed by intraperitoneal injection of 1x10⁶ CT-26 colon cancer cells (per mice) into the peritoneal cavity of male Balb/c mice to generate peritoneal tumors, as previously described (39). After 03 days, mice were divided into four groups: Saline, OXA, M1EV1, and M1EV4 with five animals each and treated intraperitoneally. The treatments were readministered every 4 days (3 treatments in 12 days). Animals were euthanized with (80 mg/kg, I.P.) 2% thiopental (Cristália, São Paulo, Brazil) on the day. According to diameter under 1.0mm or over 3.0 mm by microscopy, the number of peritoneal nodules was counted, and data are shown from representative experiments.
Part of the peritoneal tumor masse was harvested and immediately frozen at −80°C for qPCR analysis. Other tumor fragments, liver, and lungs were immersed in 10% paraformaldehyde for histopathological analysis. The protocol was approved by the Committee on the Ethics of Animal Experiments (CEUA) of the Federal University of Rio Grande do Norte (UFRN) (permit number: 265.025/2021).
2.20. Metastasis Analysis of the liver and lungs from mice with peritoneal colorectal cancer
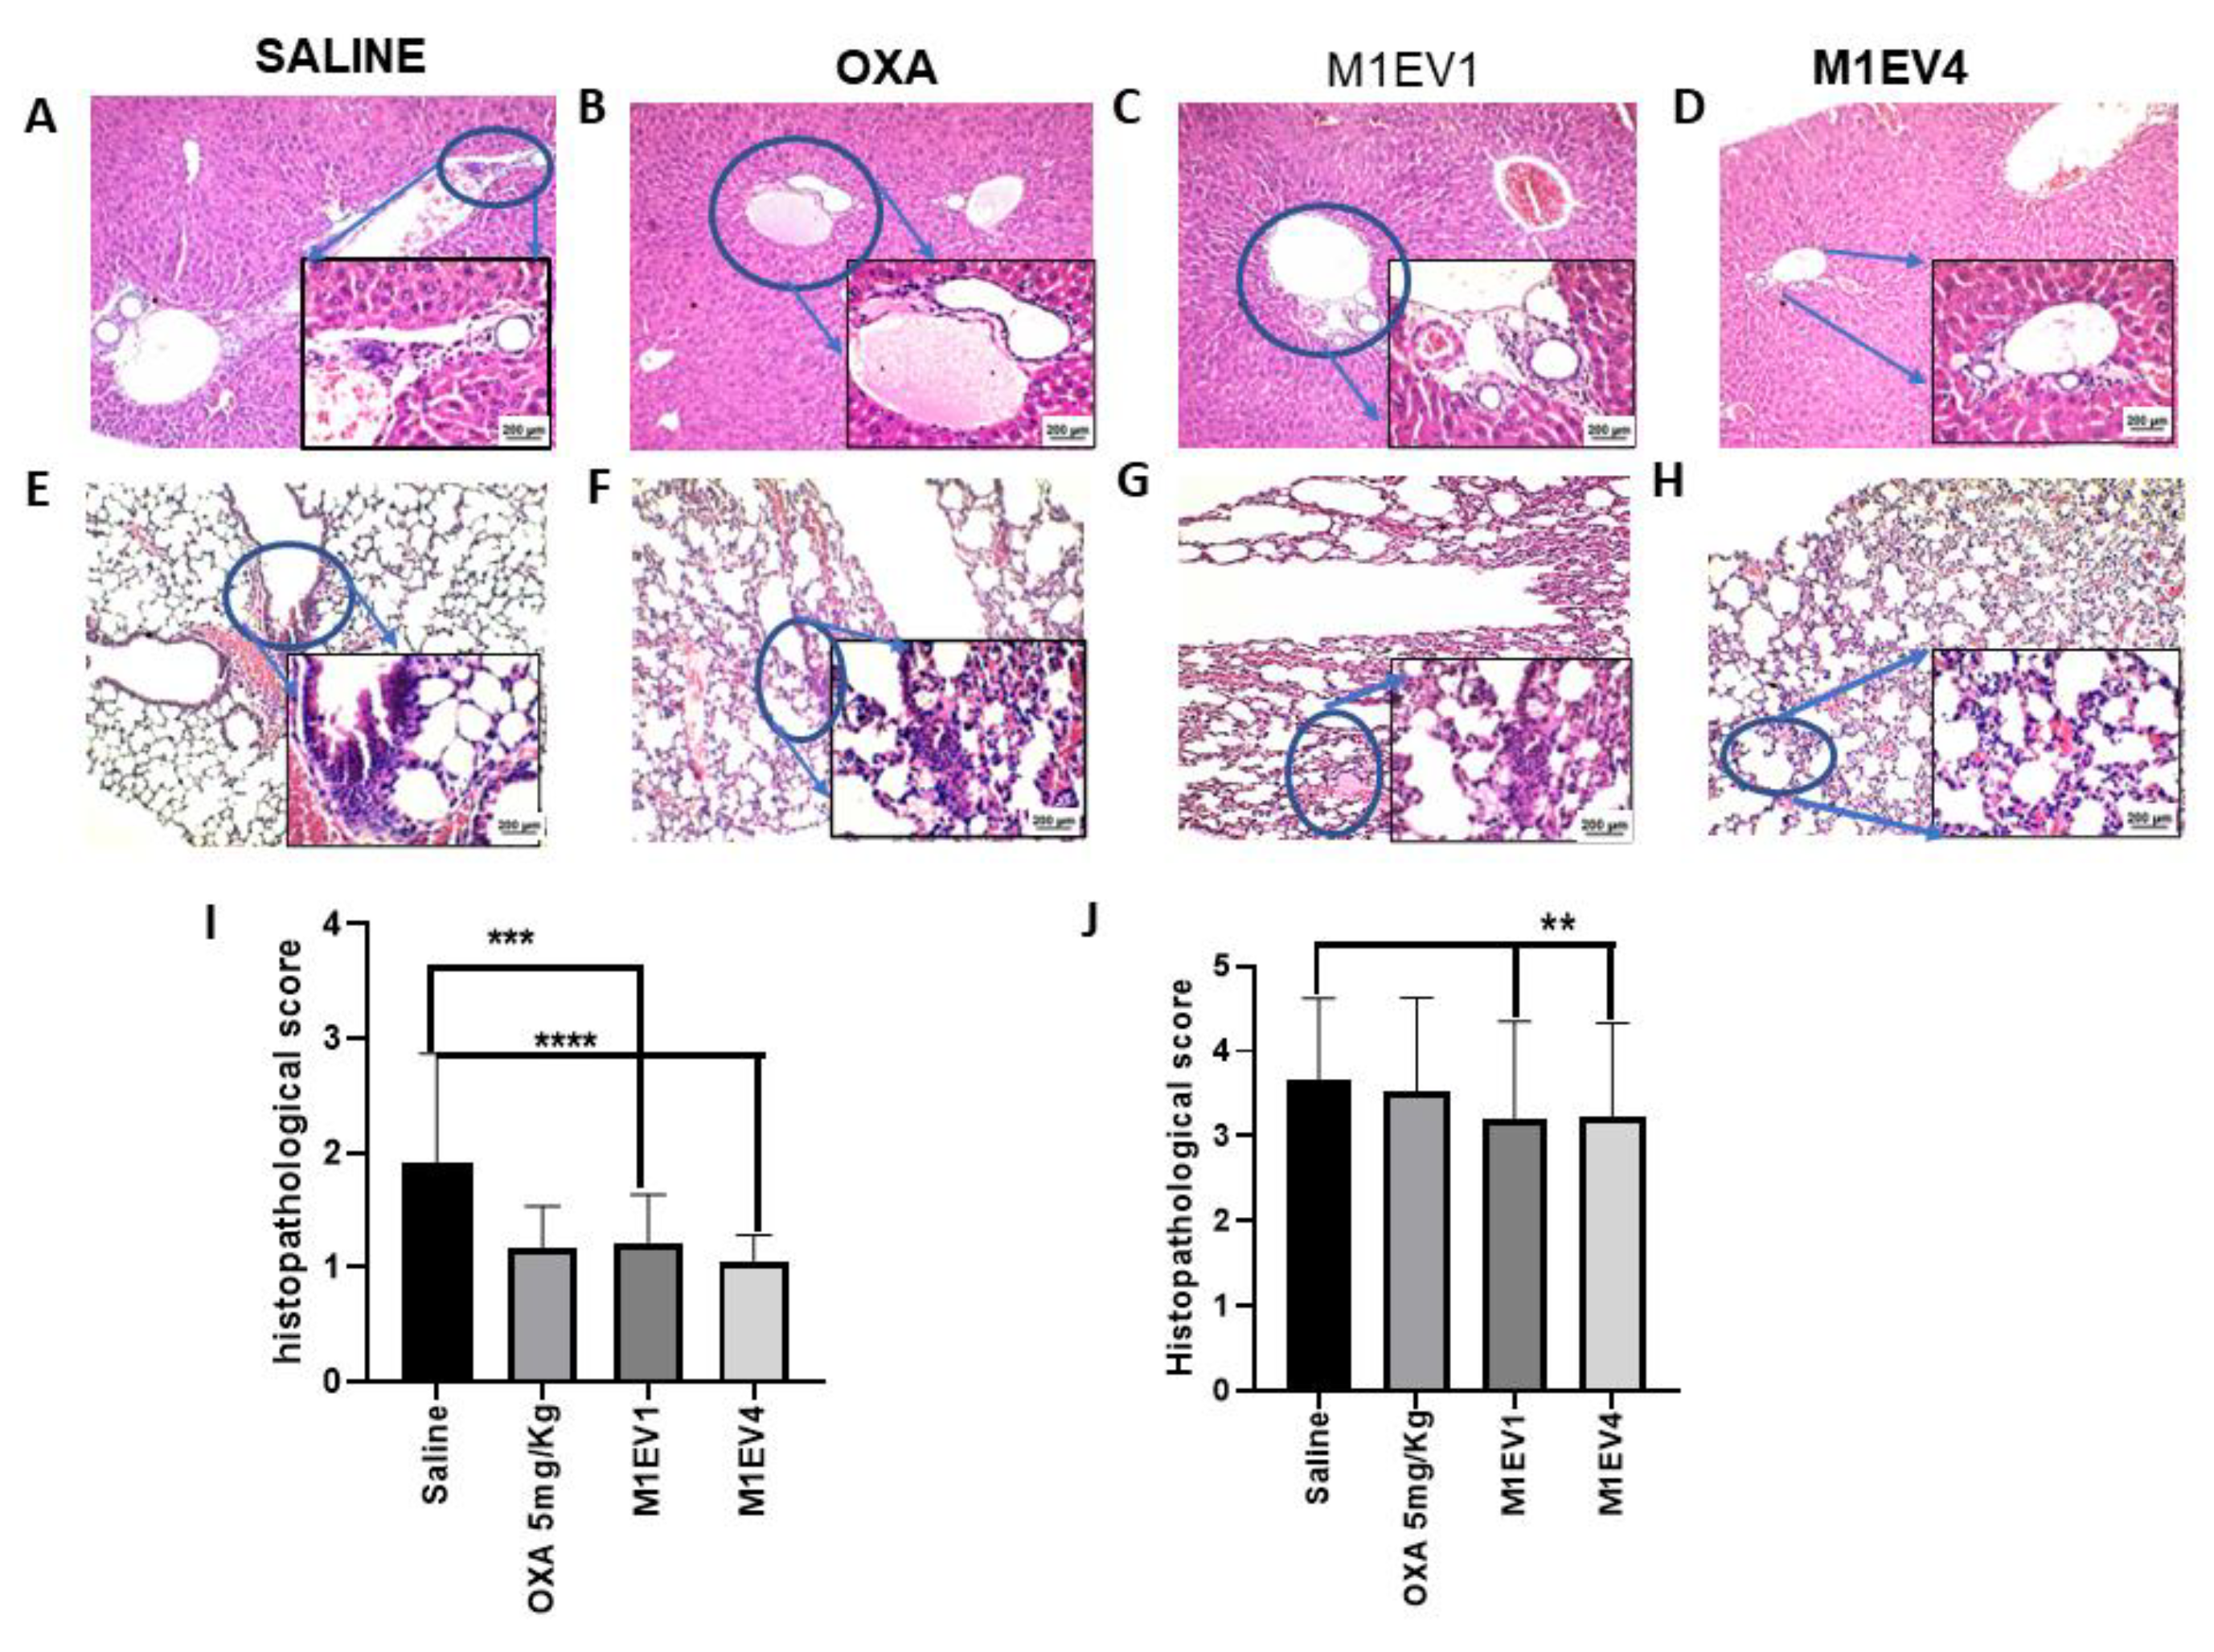
Livers and lungs were collected from all animals from the Intraperitoneal colorectal cancer model and included in the study for microscopic analysis to evaluate the effect of metastases by the proposed treatment. As previously described24, the liver and lungs were prepared for histological analysis. Sections of 5μm thickness were obtained for H&E staining and examined by light microscopy (Nikon Eclipse 2000 equipped with Nikon DS-Fi2; Nikon Corporation, Tokyo, Japan). For histopathological analysis of the liver and lungs, the number of metastatic niches and lymphocytic infiltrates were considered as previously described by Cavalcante et al.24. The values obtained from this analysis were evaluated in two aspects: proportion of the score vs. intensity of the score24. Likewise, histological analysis of peritoneal tumors was performed with emphasis on 4 criteria: anaplastic cells, lymphocytic infiltrate, blood vessels, and necrosis. Each specimen was scored according to Feng 38.
2.21. Gene expression of resistance to apoptosis and drug, EMT and immunosuppression by qRT-PCR
Gene expression analysis was performed with tumor fragments from both animal models performed. The standard qRT-PCR conditions and relative expression were calculated using the 2−ΔΔCt as previously described27.
For tumor fragments of mice with allographic colorectal cancer, the quantitative real-time PCR analysis in this study evaluated the expression of genes: β-actin (F, 5′-CCACCATGTACCCAGGCATT-3′ and R, 5′-CGGACTCATCGTACTCCTGC-3′, 60°C); FAAD (F, 5′-AGAAGAAGAACGCCTCGGTG-3′, and R, 5′-GCTCACAGATTCCTGGGCTT-3′, 56°C), APAF-1 (F,5′-TTCCAGTGGCAAGGACACAG-3′, and R, 5′-CCACTCTCCACAGGGACAAC-3′, 60°C); NF-κB (F, 5′CCGTCTGTCTGCTCTCTCT-3′, and R, 5′-CGTAGGGATCATCGTCTGCC-3′, 60°C); SURVIVIN (F, 5′-AGAACAAAATTGCAAAGGAGACCA-3′, and R, 5′-GGCATGTCACTCAGGTCCAA-3′, 60°C); STAT-3 (F, 5′-GGGCCTGGTGTGAACTACTC-3′ and R, 5′GGTATTGCTGCAGGTCGTTG-3′ 60°C); CXCR4 (F, 5′-CATGGAACCGATCAGTGTGAG-3′, and R, 5′-TGAAGGCCAGGATGAGAACG-3, 60°C); CD8 (F, 5′-GCTCAGTCATCAGCAACTCG-3′, and R, 5′-ATCACAGGCGAAGTCCAATC-3′, 58°C); CD68 (F, 5′CCCCTACTCCAACGTCCAAC-3′, and R, 5′-CAACTCTCCCTTCTCACCCA-3′, 60°C) and SNAIL (F, 5′-GACTCCTTCCAGCCTTGGTC-3′, and R, 5′-CCAGTAACCACCCTGCTGAG-3′, 60°C).
For tumors collected from animals submitted to the intraperitoneal colorectal cancer model, the quantitative real-time PCR analysis in this study evaluated the expression of genes: β-actin (F, 5′-CCACCATGTACCCAGGCATT-3′ and R, 5′-CGGACTCATCGTACTCCTGC-3′, 60°C); STAT-3 (F, 5′-GGGCCTGGTGTGAACTACTC-3′ and R, 5′-GGTATTGCTGCAGGTCGTTG-3′ 60°C); CXCR4 (F, 5′-CATGGAACCGATCAGTGTGAG-3′, and R, 5′-TGAAGGCCAGGATGAGAACG-3; PD-L1 (F, 5’-CCAGCCACTTCTGAGCATGA-3’ and R, 5’-CAGACAGCAAGAGCCTGTCA-3’, 60°C).
2.22. Statistical Analysis
All the experiments were performed in triplicate. Results were analyzed by two-way ANOVA and Bonferroni post-test. Values of p<0.05 were considered indicative of statistical significance (*p<0.05, **p<0.01, ***p<0.001, and ****p<0.0001). The Kruskal-Wallis and Dunn tests were used to compare medians for non-parametric tests (Graph Pad Prism 5.0 Software, La Jolla, CA, USA).
4. Discussion
Important signaling pathway crosstalk, especially between STAT3 and NF-κB, has been implicated in the cancer hallmarks, such as resistance to apoptosis and drug, EMT, and immunosuppression (23,24,27,39. In this work, OXA-coated extracellular vesicles from macrophages 1 (M1EVs) combined with retinoic acid and Libidia Ferrea were demonstrated to modulate the tumor progression of colorectal cancer. Gene and protein profiles correlated to the tumor progression were significantly altered. Our results showed that NF-κB, STAT3, and AKT were the most importantly downregulated signaling pathways due to their crucial role in the crosstalk between malignant cells and tumor-associated immune cells.
In this line, the interaction between the stroma and cancer cells in the primary TME is a fundamental key point to understanding the factors involved in cancer metastasis 40. In TME, M2-TAMs are alternatively activated cells by IL-4 and IL-13, which eventually activate the JAK/STAT-3 pathway to induce the production of immunosuppressor cytokines like IL-10 and PD-L1, favoring resistance to apoptosis and drug as well as invasion 41–44. Furthermore, the NF-kB pathway inhibited by PI3K-AKT signaling in M2-TAMs causes activation of an immunosuppressive transcriptional sequence in the inflammatory course of tumor progression 45. There are several reports that the transcription factor Foxo1, which is a key gene in M1 macrophages is inhibited by Akt signaling 46,47.
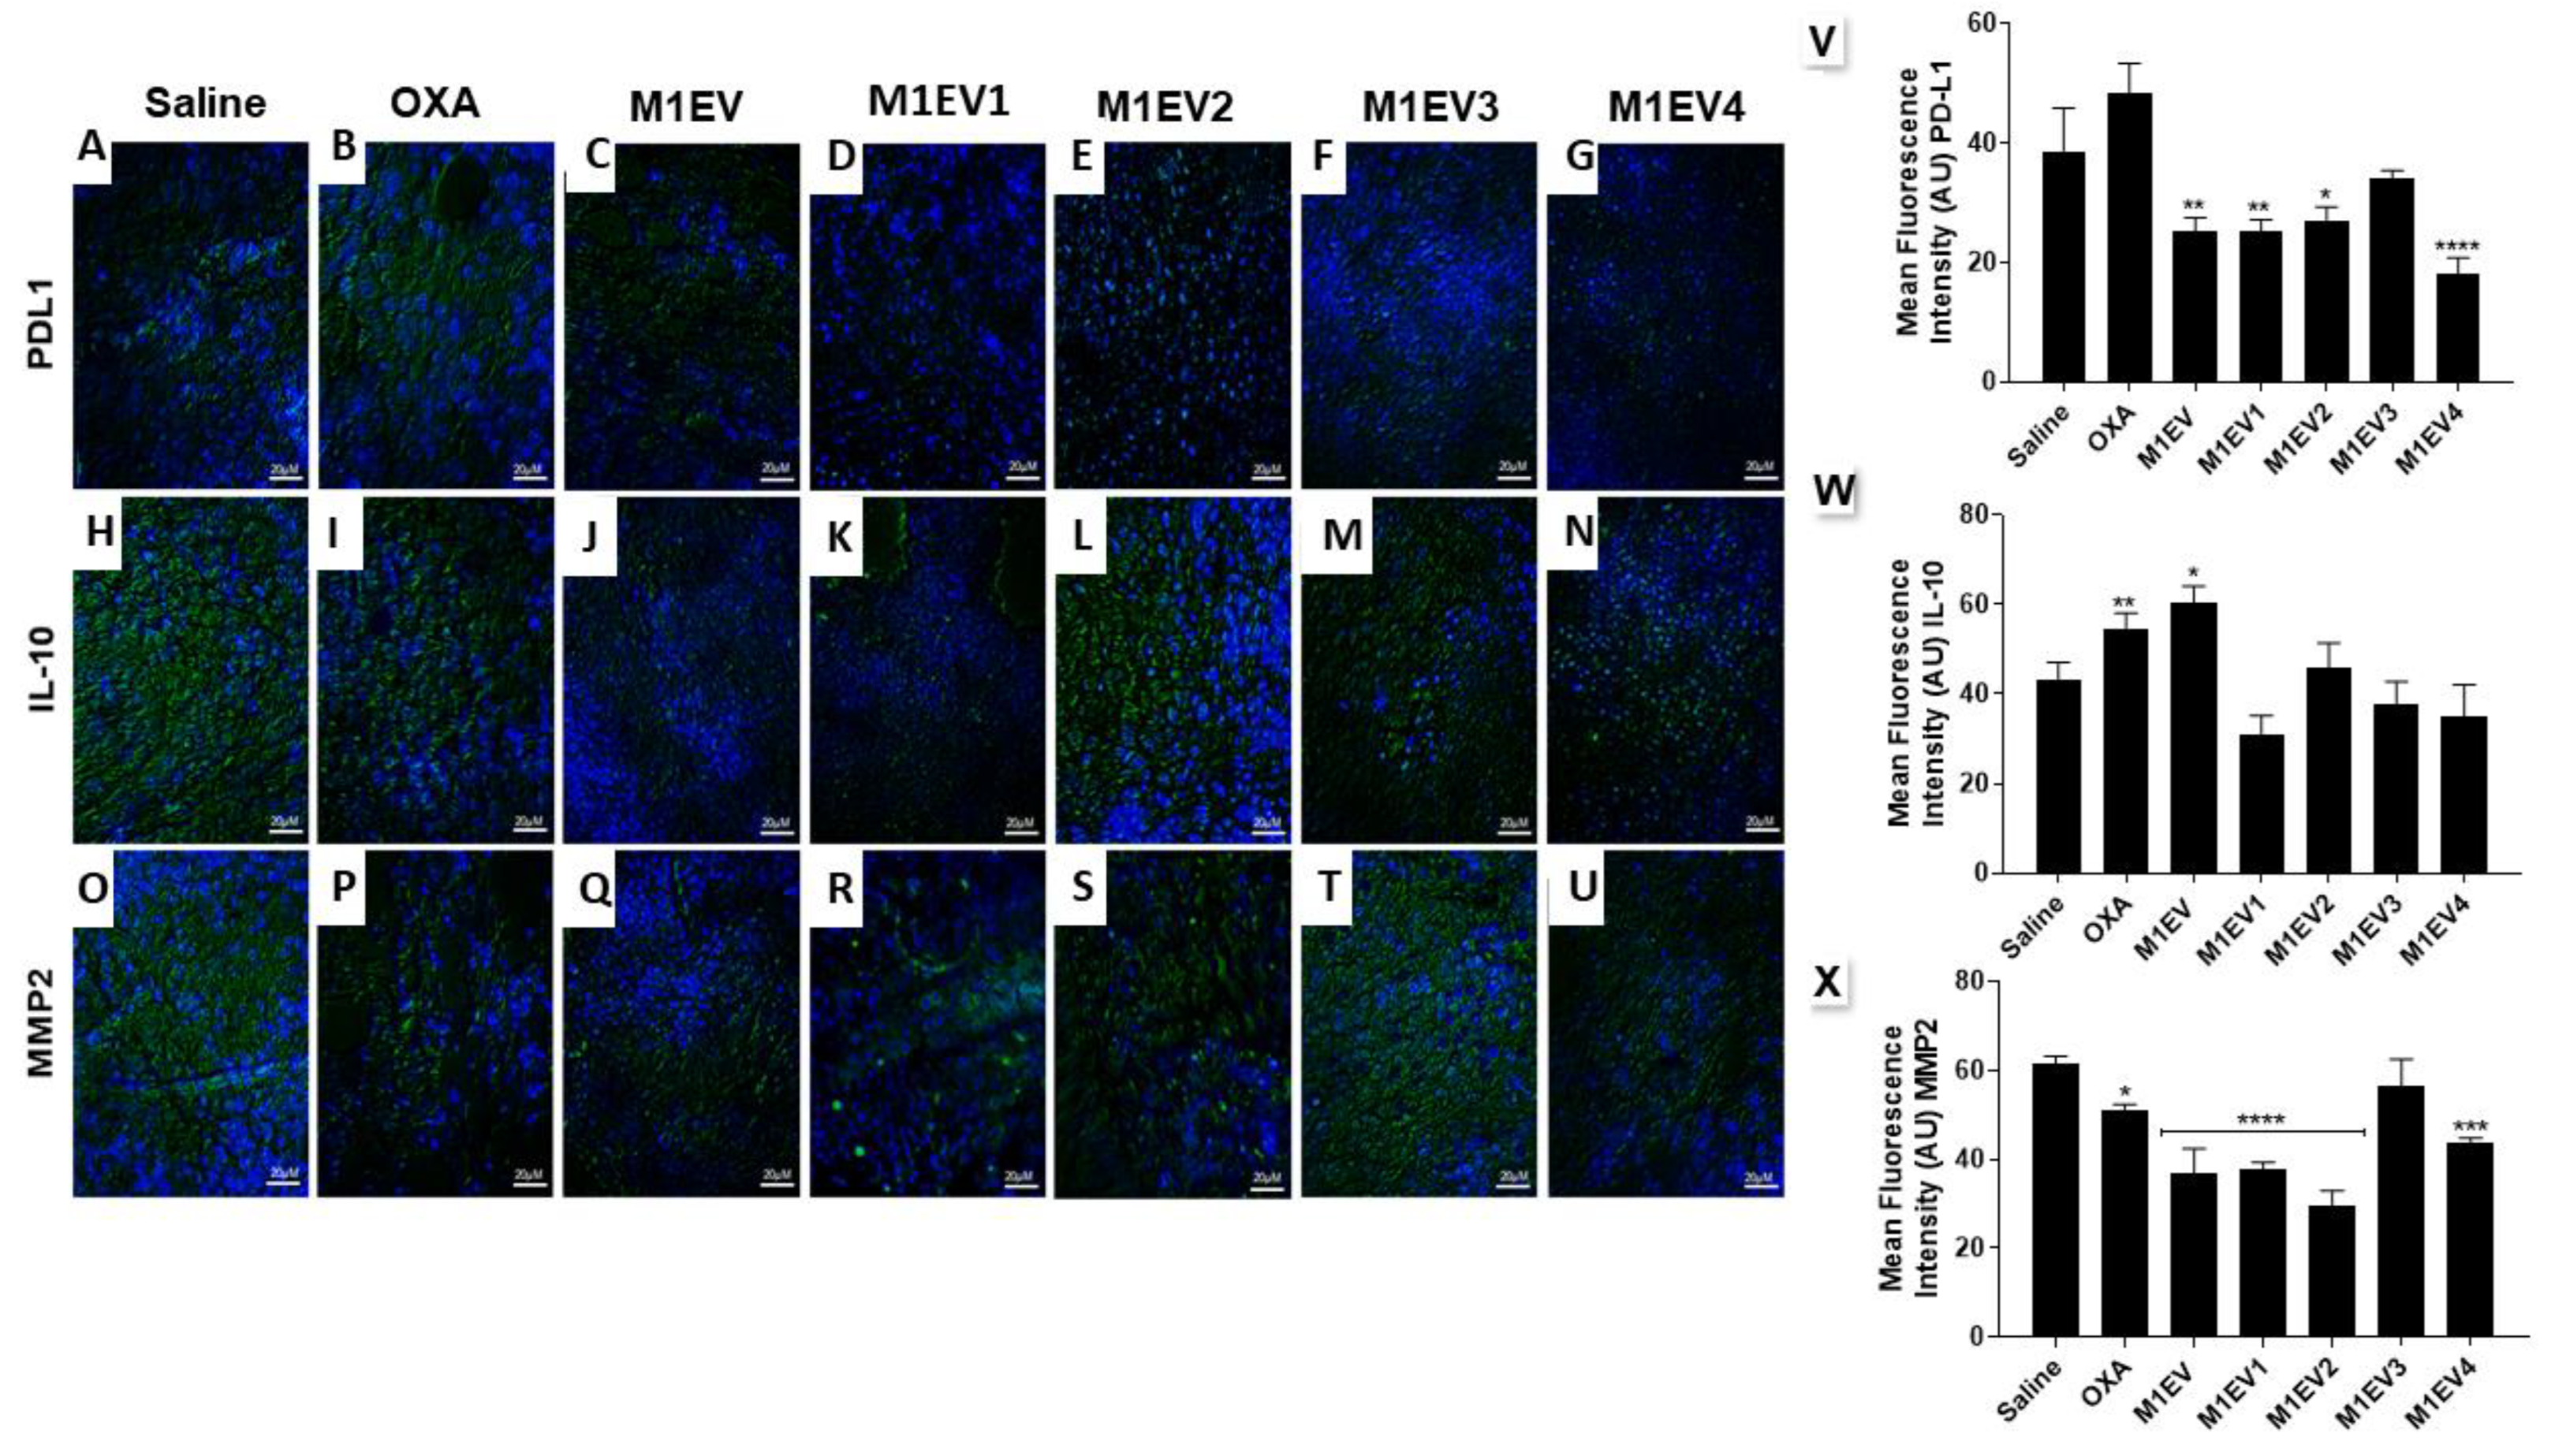
In this context, TAMs polarization course towards M2 disrupted by NP-mediated NF-κB, STAT3, and AKT downregulation seems to have triggered the reduced expression of PD-L1 and IL-10, chemokines released by M2-polarized TAM. M2-TAMs PD-L1 and IL-10 expression upregulates the crosstalk of AKT/NF-kB pathways in tumor cells resulting in epithelial-mesenchymal transition 27,48,49, as well as down-regulates CD8+ T cells by upregulating the STAT3 expression in TME 27,50.
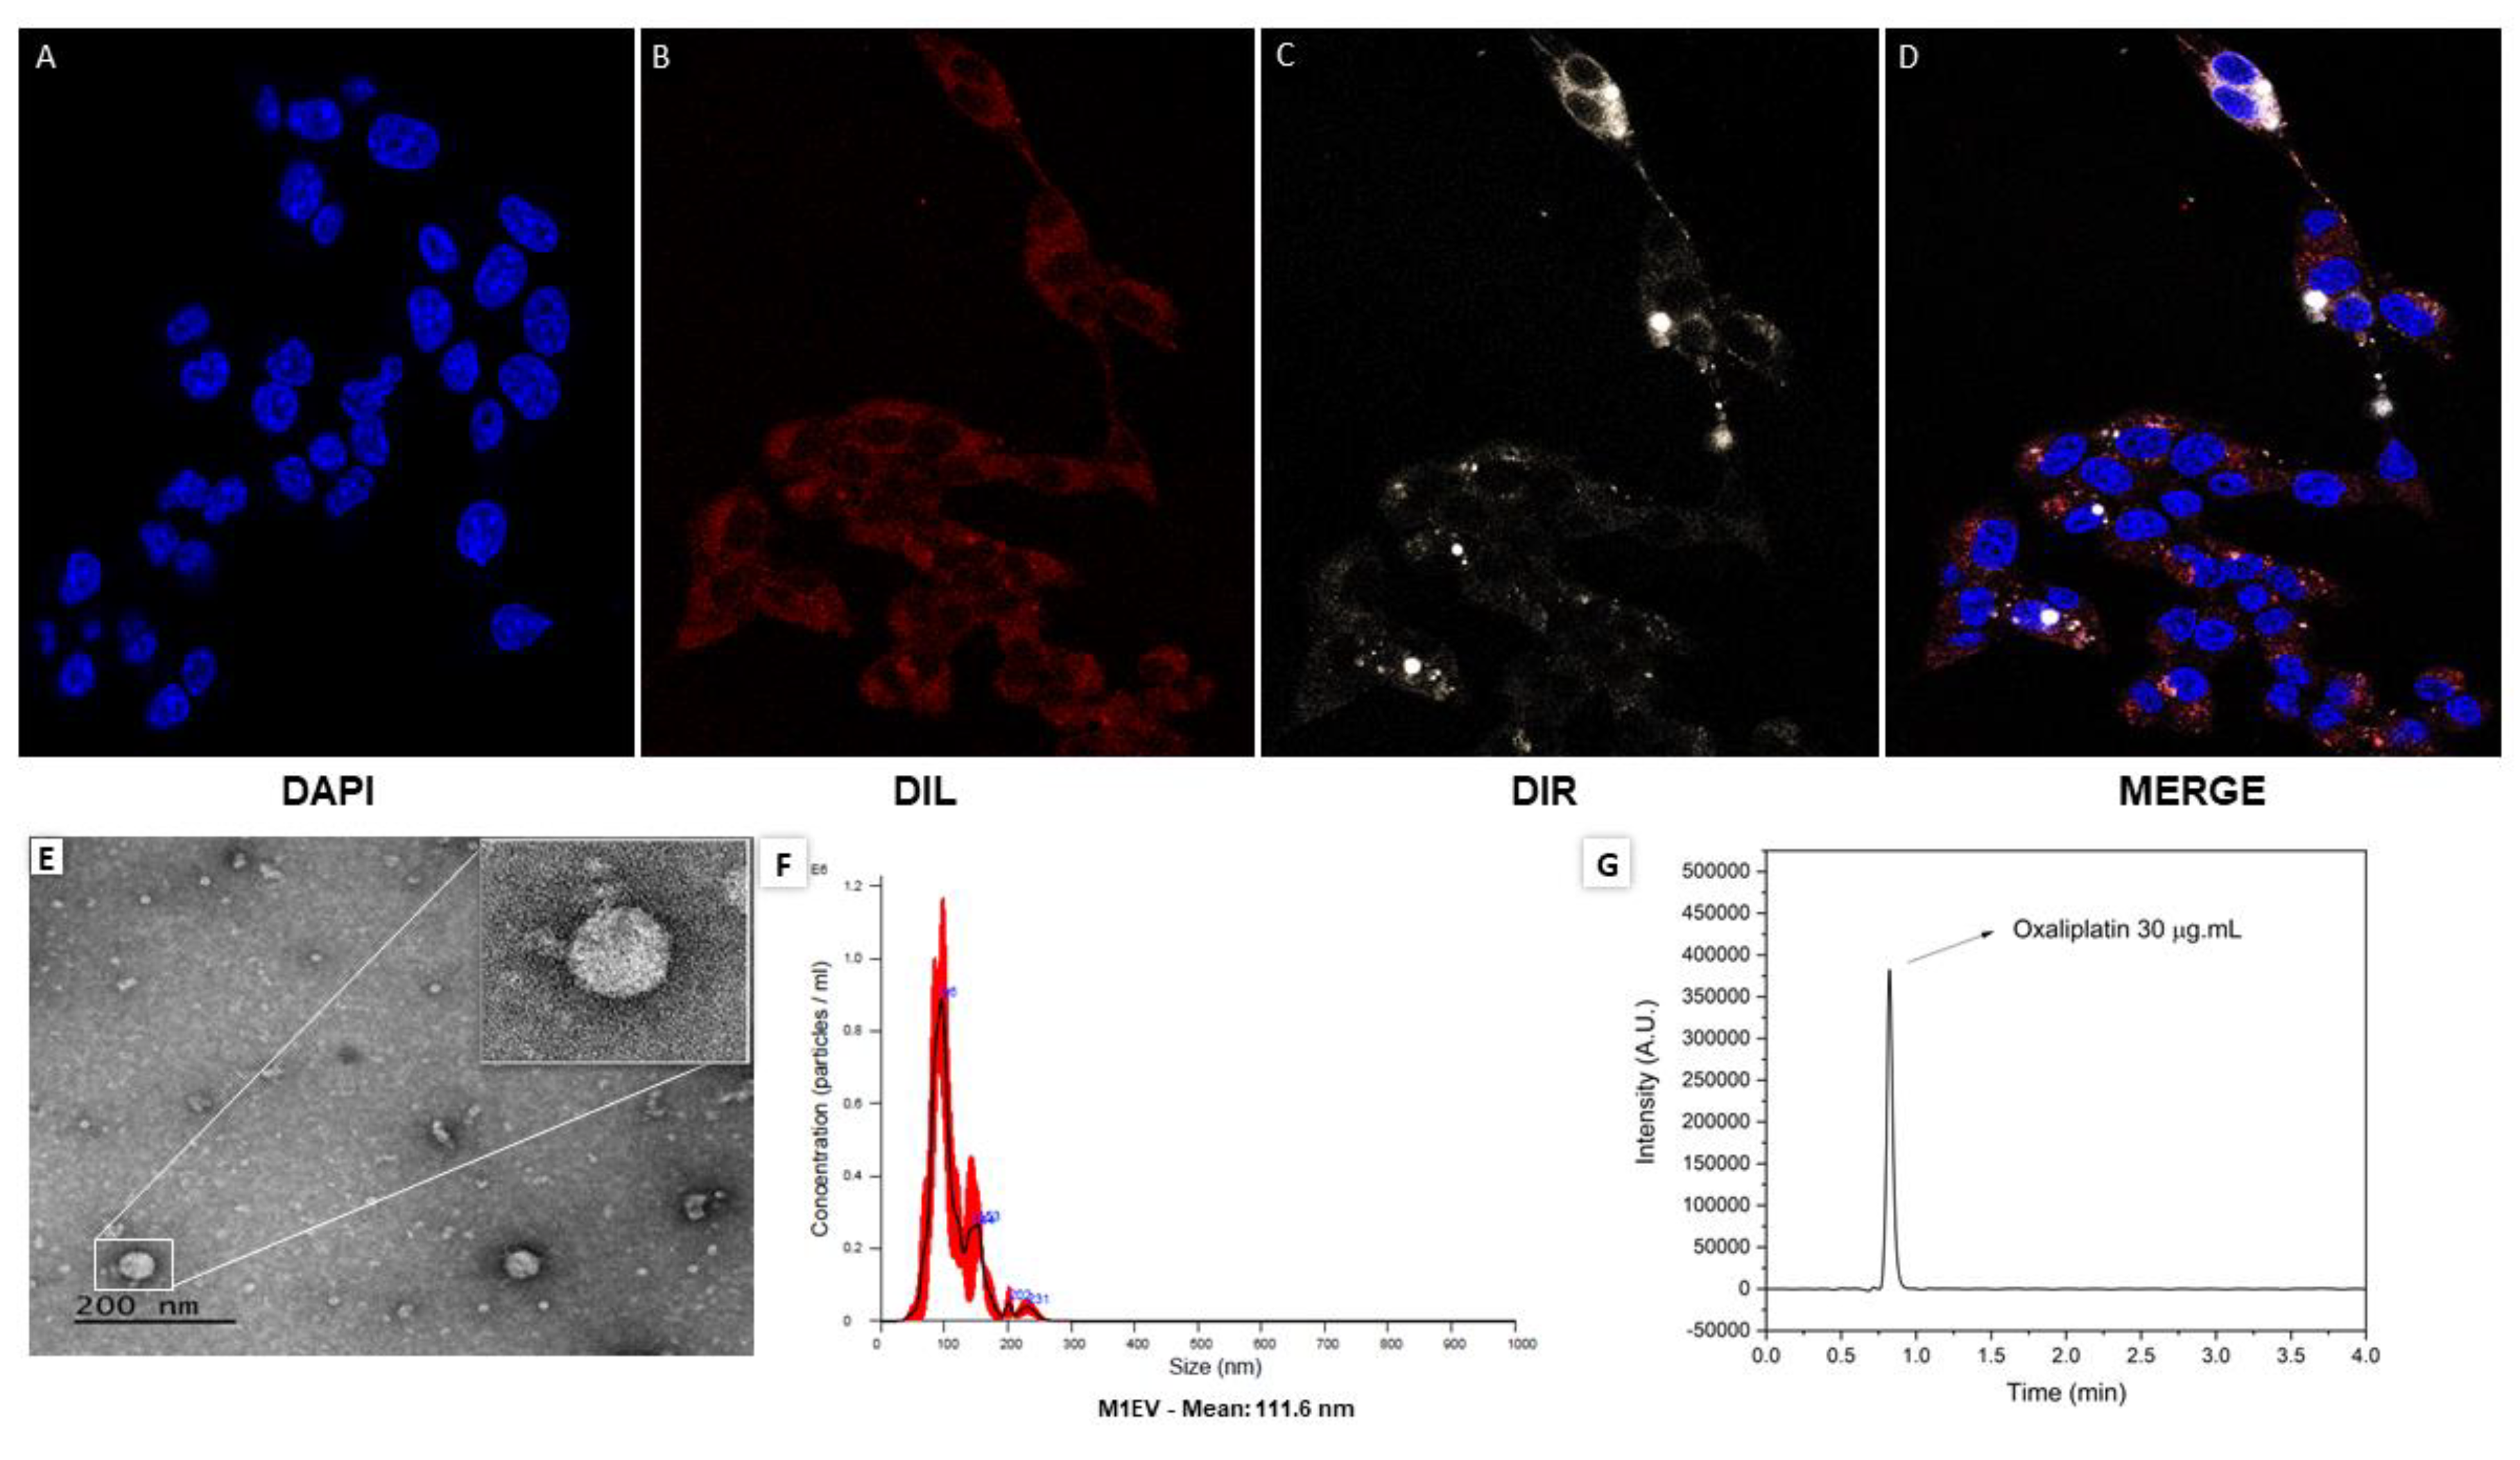
In this study, to order to activate the immune system and down-regulate the tumor progression of colorectal cancer, we used extracellular vesicles (EV) from M1-like macrophages as drug carriers. Similar studies demonstrated that EV-mediated endocytosis can promote the delivery of different drugs such as doxorubicin10,51,52, paclitaxel53,54, and curcumin55,56 and are known as EVs or exosome-like vesicles carriers of drugs (41,42). EVs from different cells, especially immune and cancer cells, can regulate the TME by exposing cell antigens or immune-enhancing receptors, promoting effects as "tumor vaccines" 49,50,57. It has been reported that EVs are internalized into cells by way of fusion and/or receptor-mediated endocytosis (41,42). Our results showed that CT-26 cells internalized EVs very efficiently within 24h after the exposure to them corroborating with other reports of EV uptake in literature (10,43,44). This result strengthens the hypothesis that EVs is an important vehicle for releasing drugs inside the cells due to their biocompatibility (9), representing the beyond of “state-of-art” in cancer treatment due to their endogenous origin, which minimizes their immunogenicity and toxicity58.
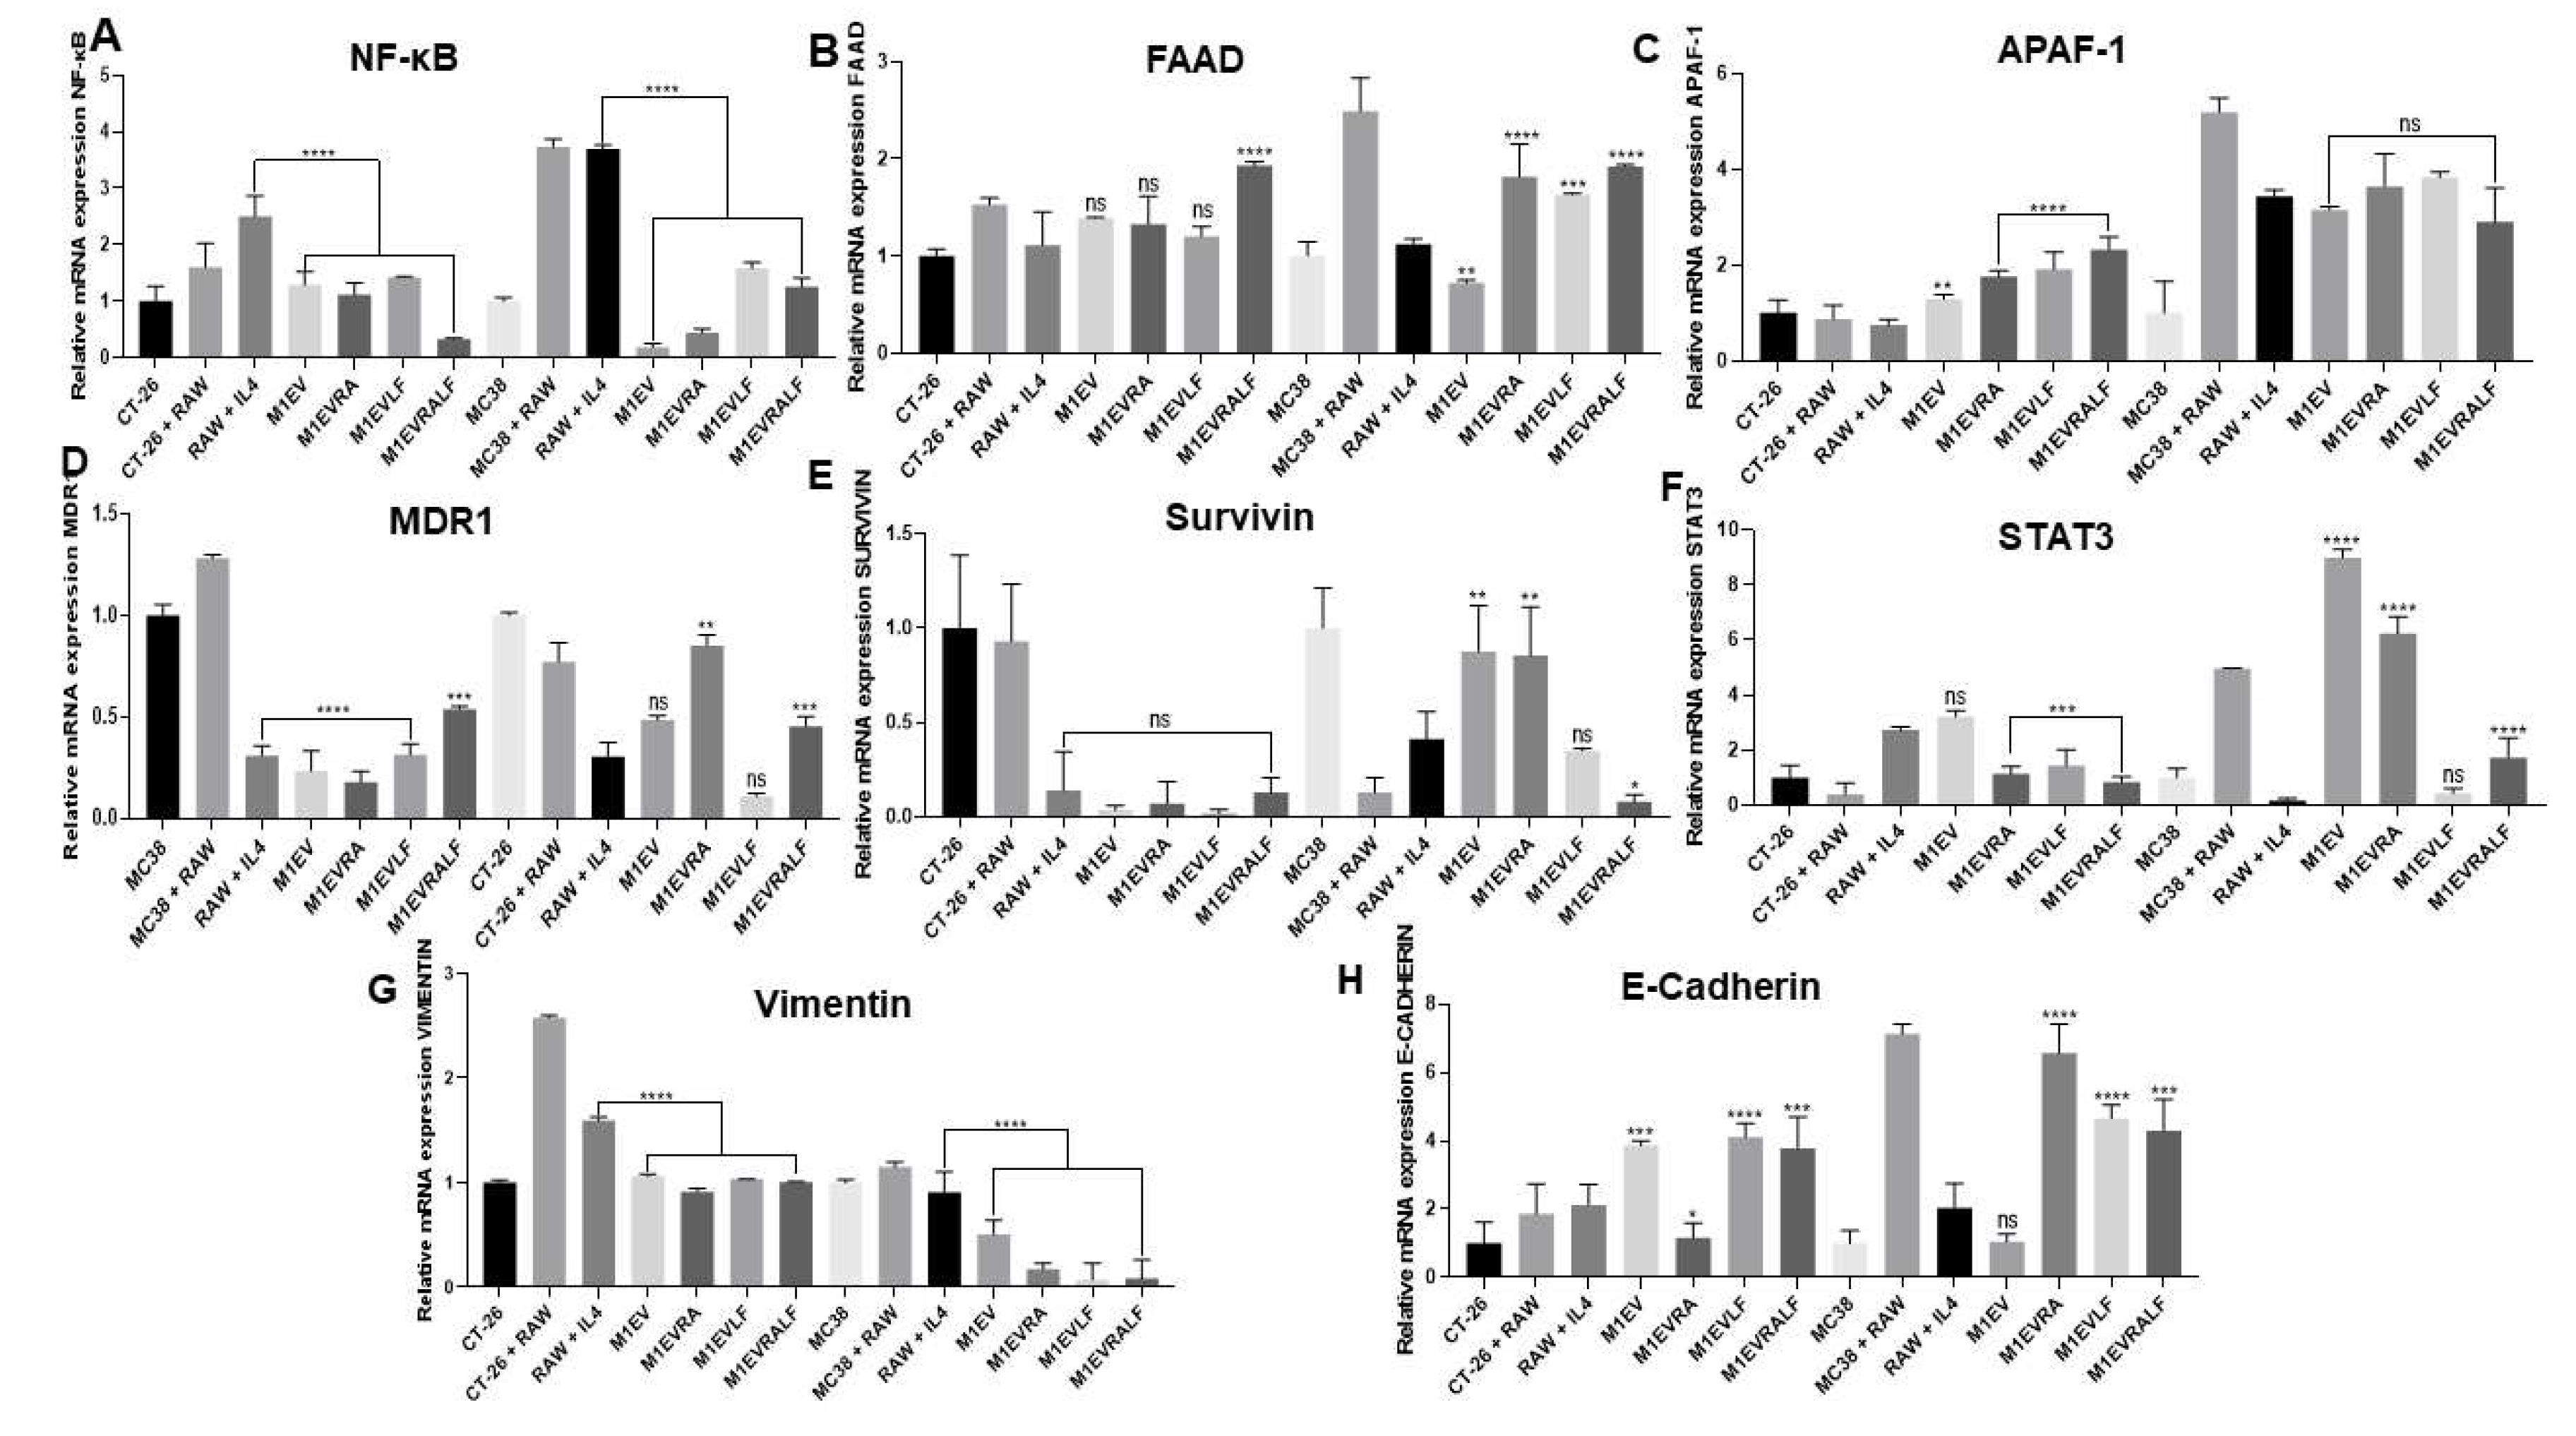
Our in vitro and in vivo results suggested that different systems of M1EVs had a strong apoptotic effect, corroborating with other studies that used EVs as drug carriers 10,51,59. However, the apoptotic effect in both signaling pathways, intrinsic and extrinsic ways, was higher when M1EVs were loaded with OXA, RA, and LF (M1EV4). Interestingly, when CT-26 and MC38 cell lines were co-cultured with M2-TAM and treated with M1EVs without OXA but loaded with RA and LF, the gene expression of P-glycoprotein (MDR1) and Survivin was down-regulated significantly. MDR1 is localized on the plasma membrane of resistant cancer cells to several antitumor drugs, such as vinblastine, vincristine, doxorubicin, daunorubicin, oxaliplatin, teniposide and paclitaxel 60,61 while Survivin is a gene that inhibits the intrinsic apoptosis pathway by accumulating in the mitochondria, enhancing cell resistance to apoptosis 62,63. Together, these results showed that M1EVs with or without OXA but loaded with RA and LF had a significant effect in down-regulating the resistance to the drug and apoptosis.
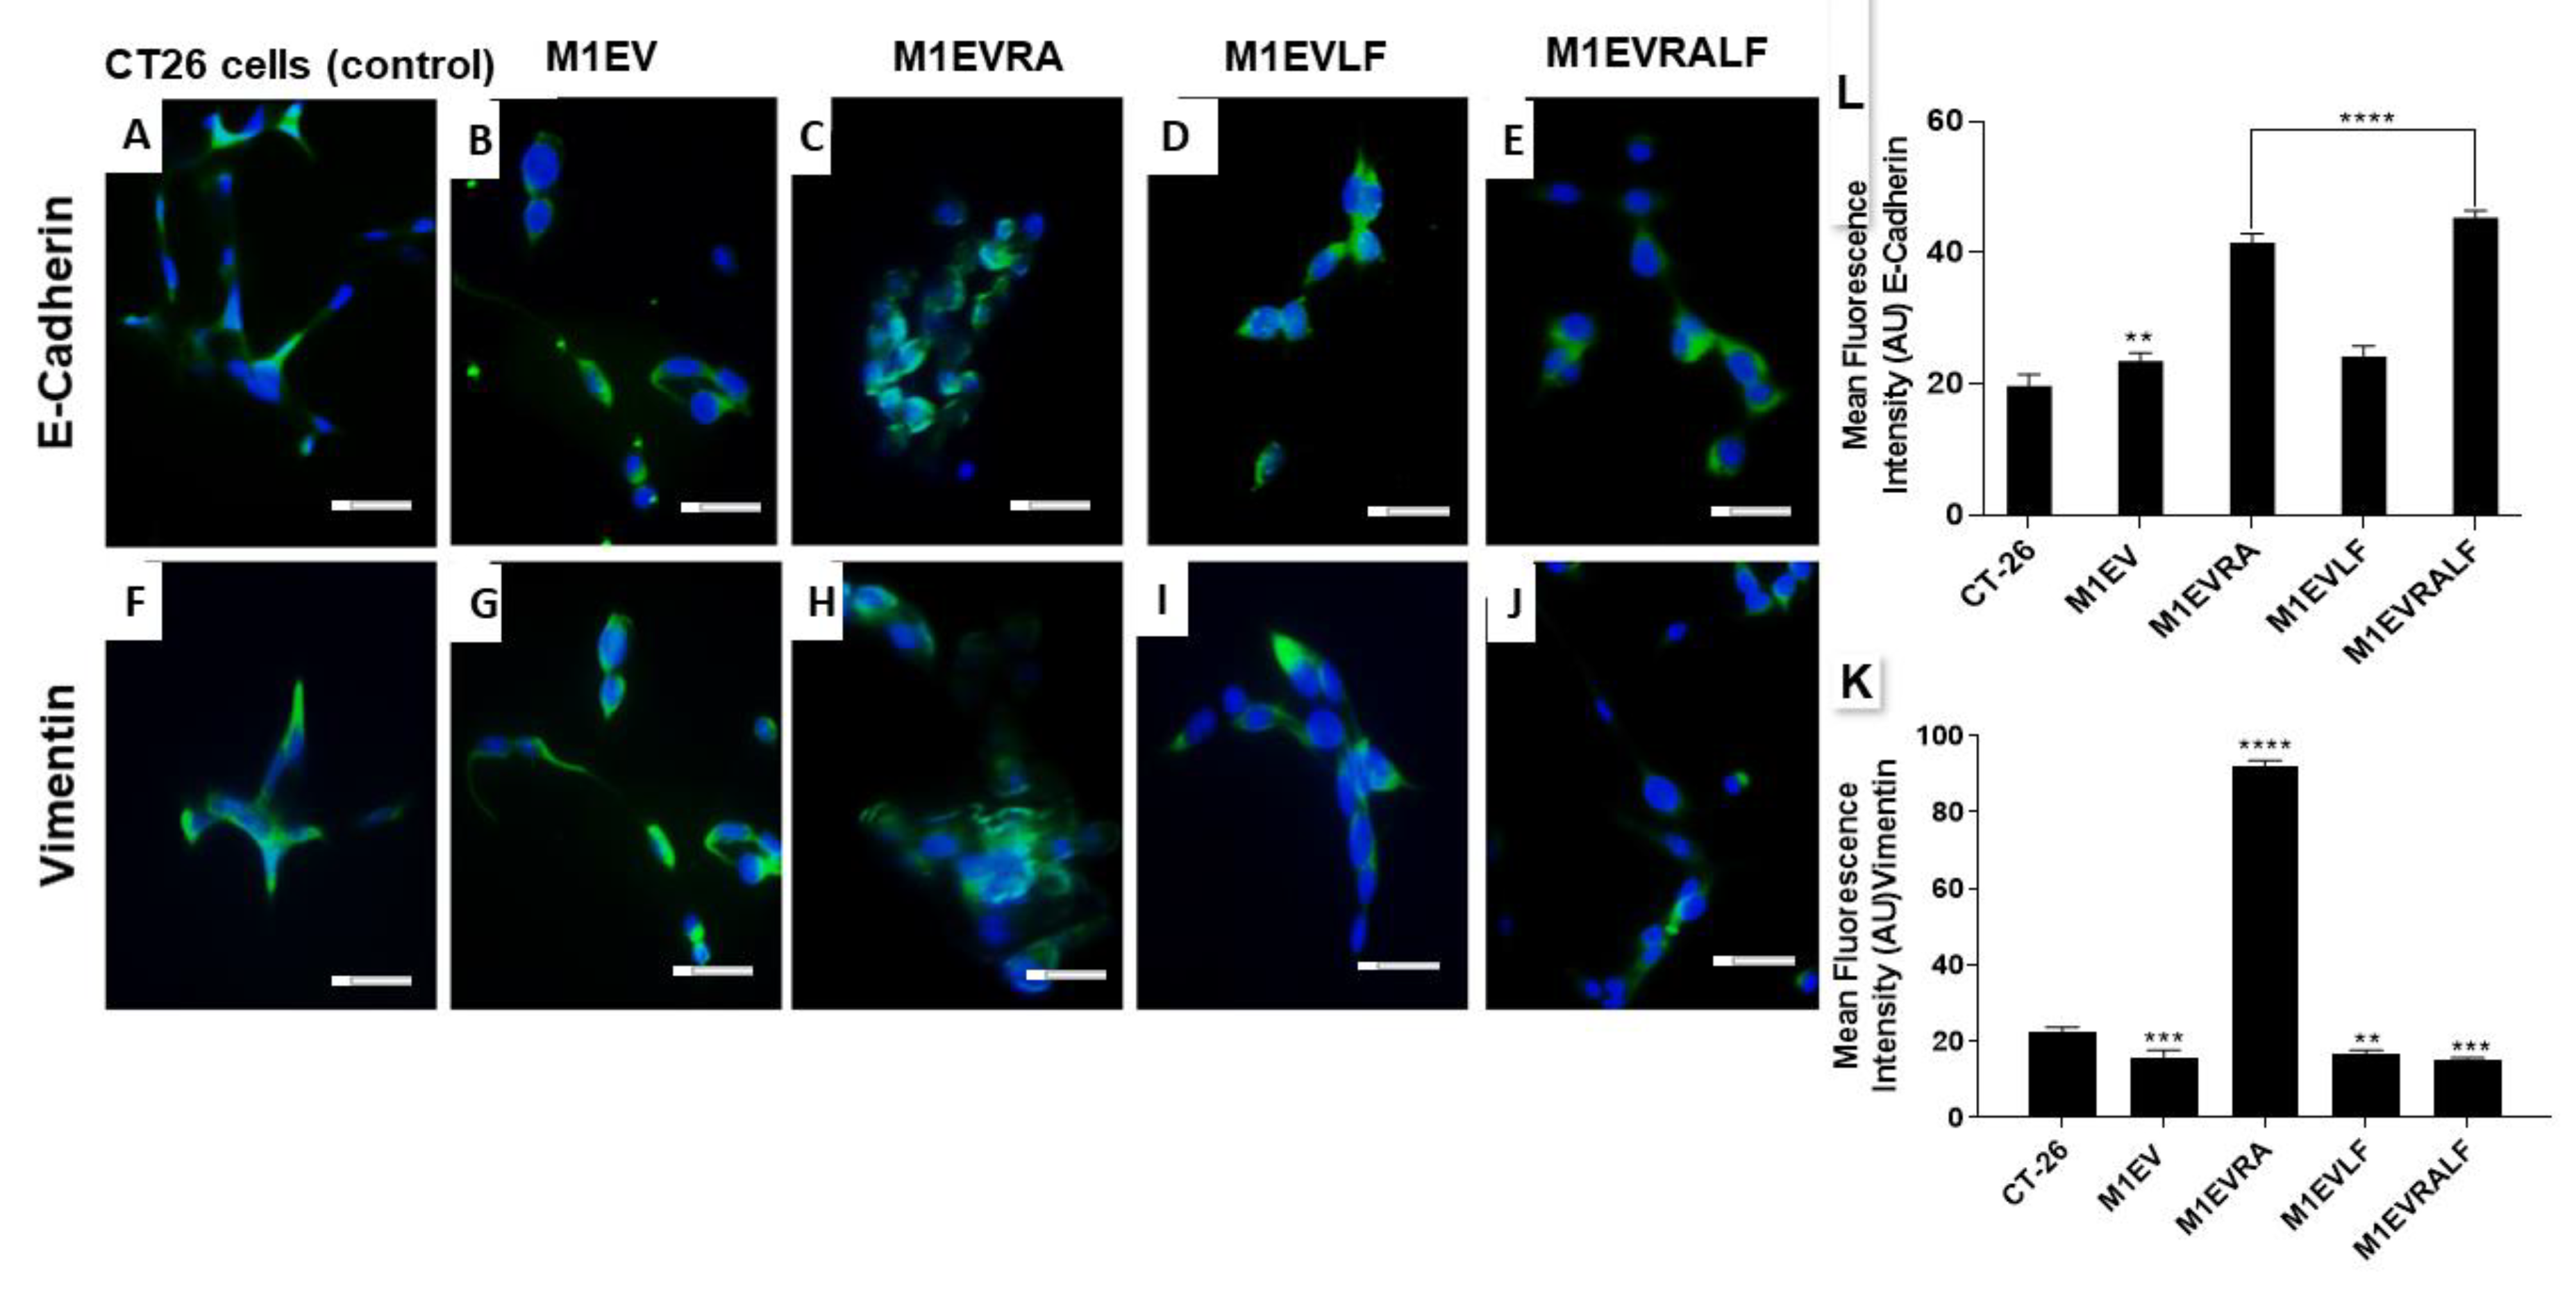
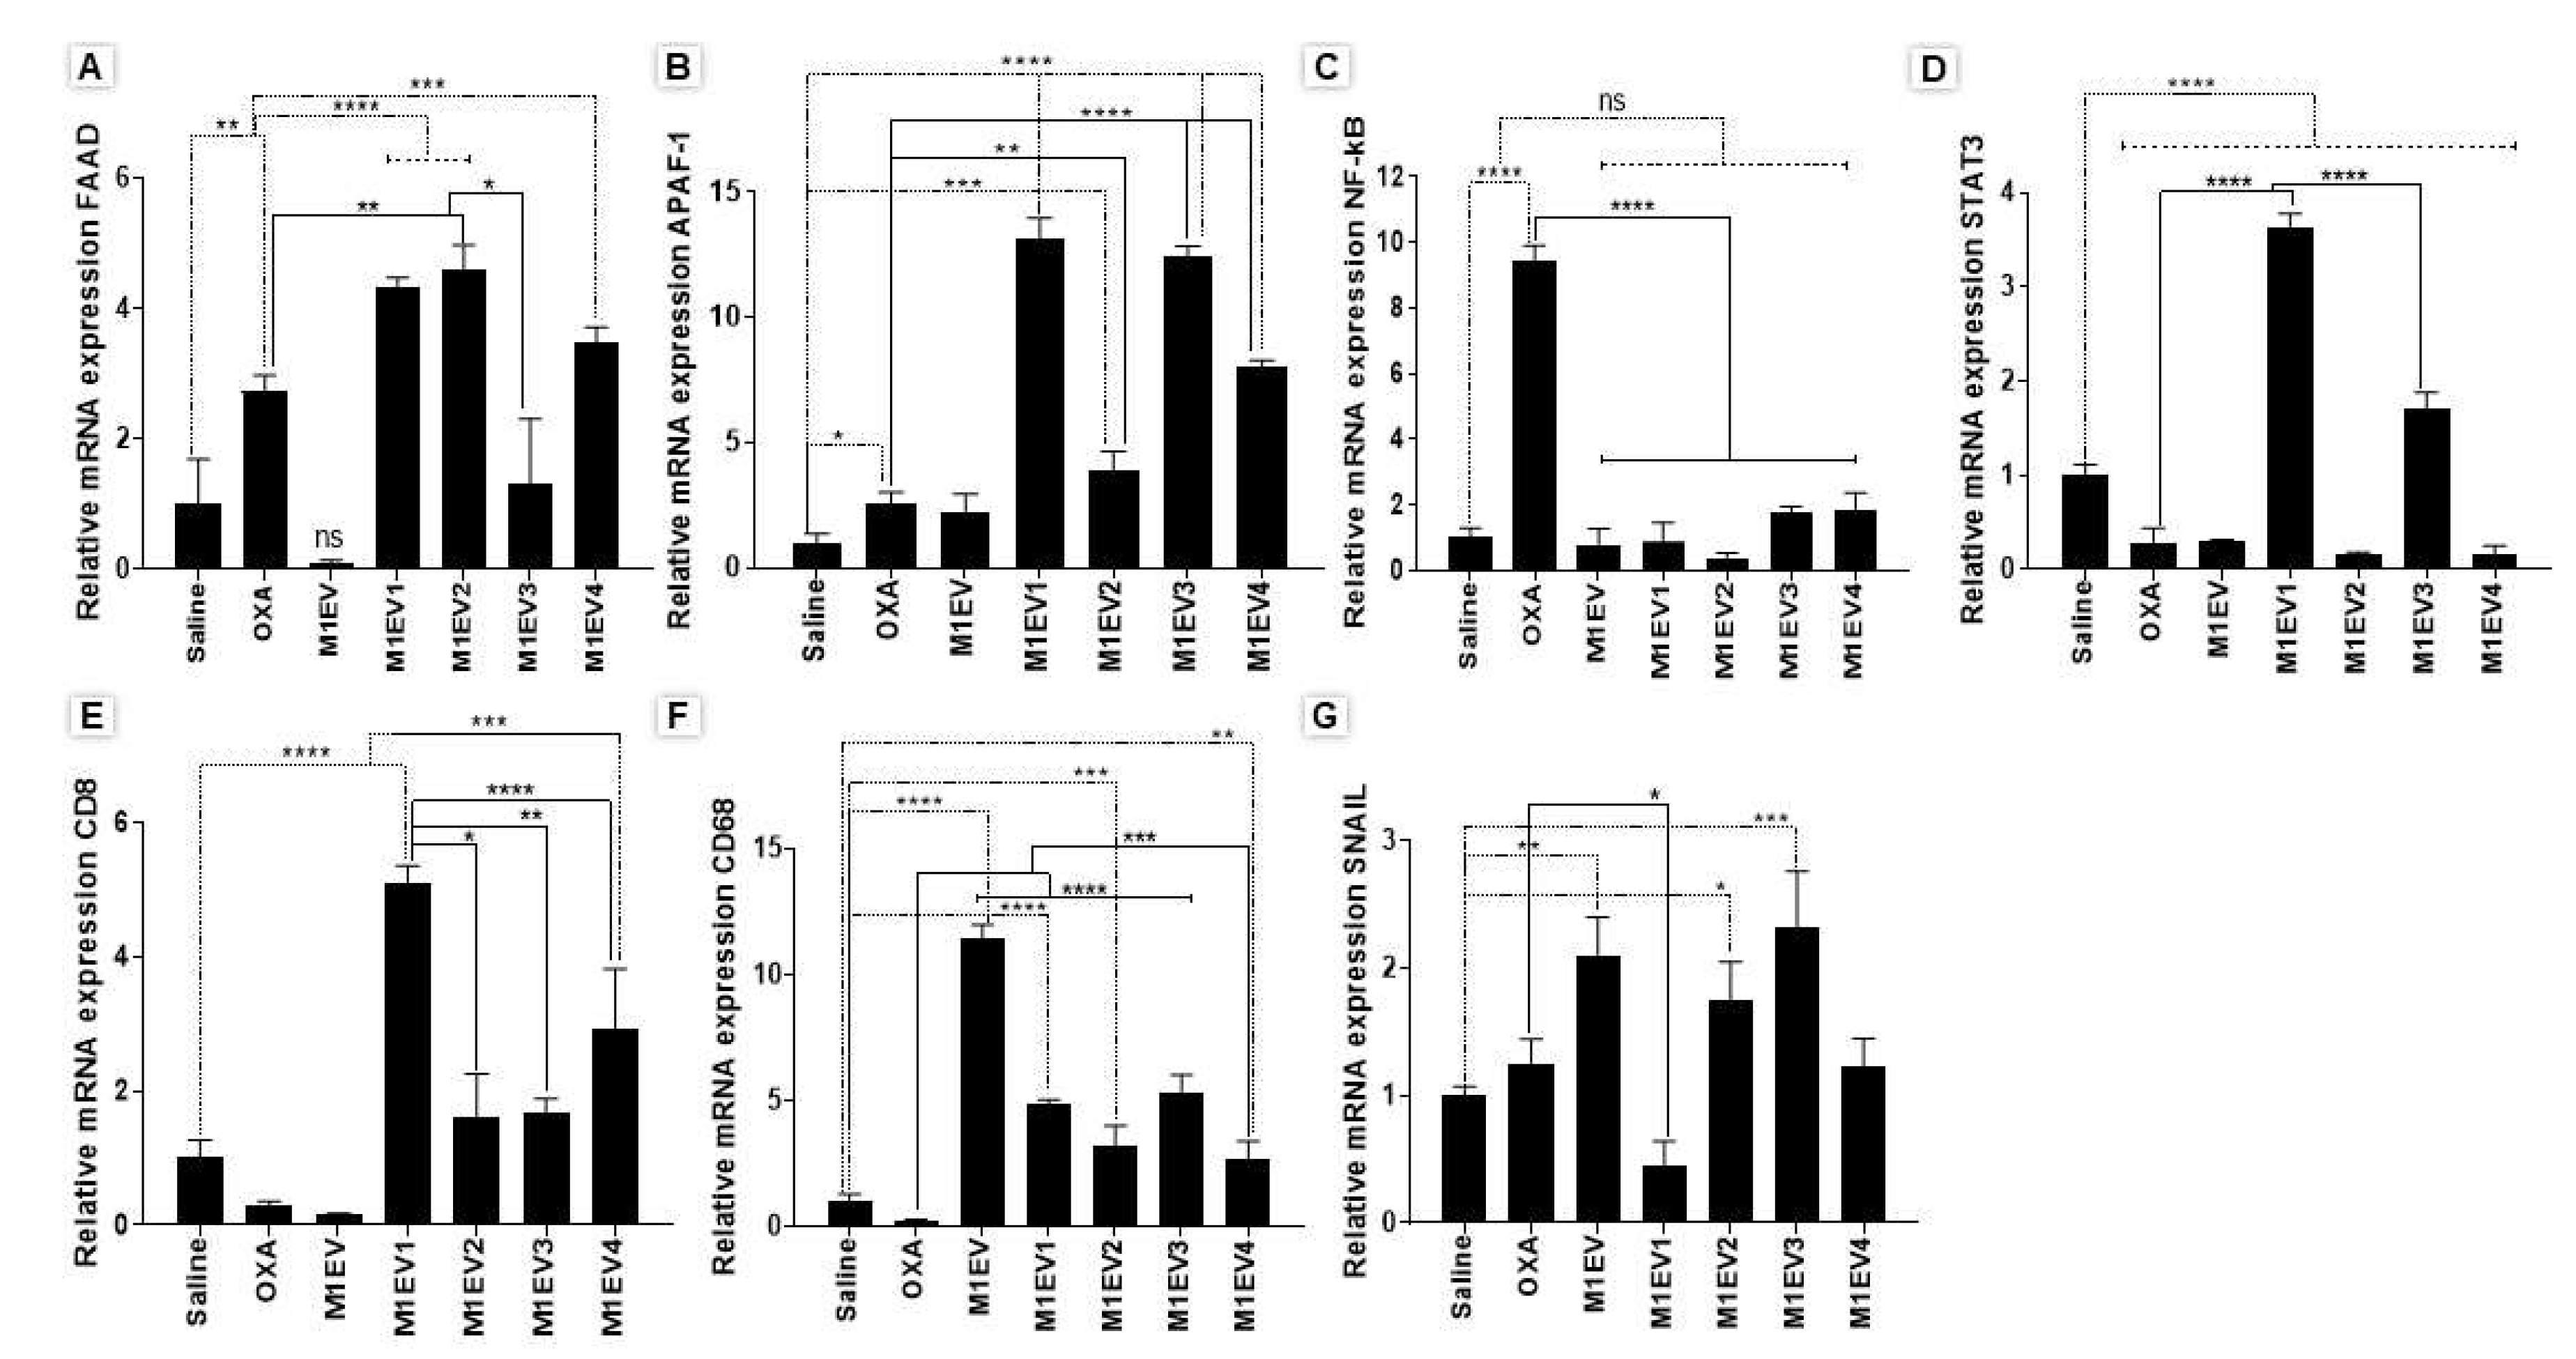
In primary TME of colorectal cancer allographic tumors in mice, a modulatory loop of immunosuppressive cytokines is fed by the interaction between stromal cells, specifically M2-TAM, and cancer cells resulting in the immune escape and EMT 24,27 In this line, we investigated the expression of different markers of immunosuppression (PD-L1 and IL-10), Immunocompetence (CD8 and CD68), and EMT (E-cadherin, SNAIL, and MMP-2). Different systems of M1EVs loaded with OXA, RA, and LF showed a high efficiency in reducing immunosuppression and EMT. On the other hand, different systems of M1EV upregulated the immunocompetence by increasing the expression of CD8 lymphocytes and CD68 M1 macrophages in TME. When we analyzed our results deeply, we concluded that M1EV4 which loaded all compounds had a higher antitumor effect when compared with other systems of M1EVs. More importantly, in vitro, assays demonstrated that the protein and gene expression of E-cadherin increased, and Vimentin reduced significantly in cancer cell lines after treatment with M1EVs without OXA but loaded with RA and LF, especially when RA and LF were combined.
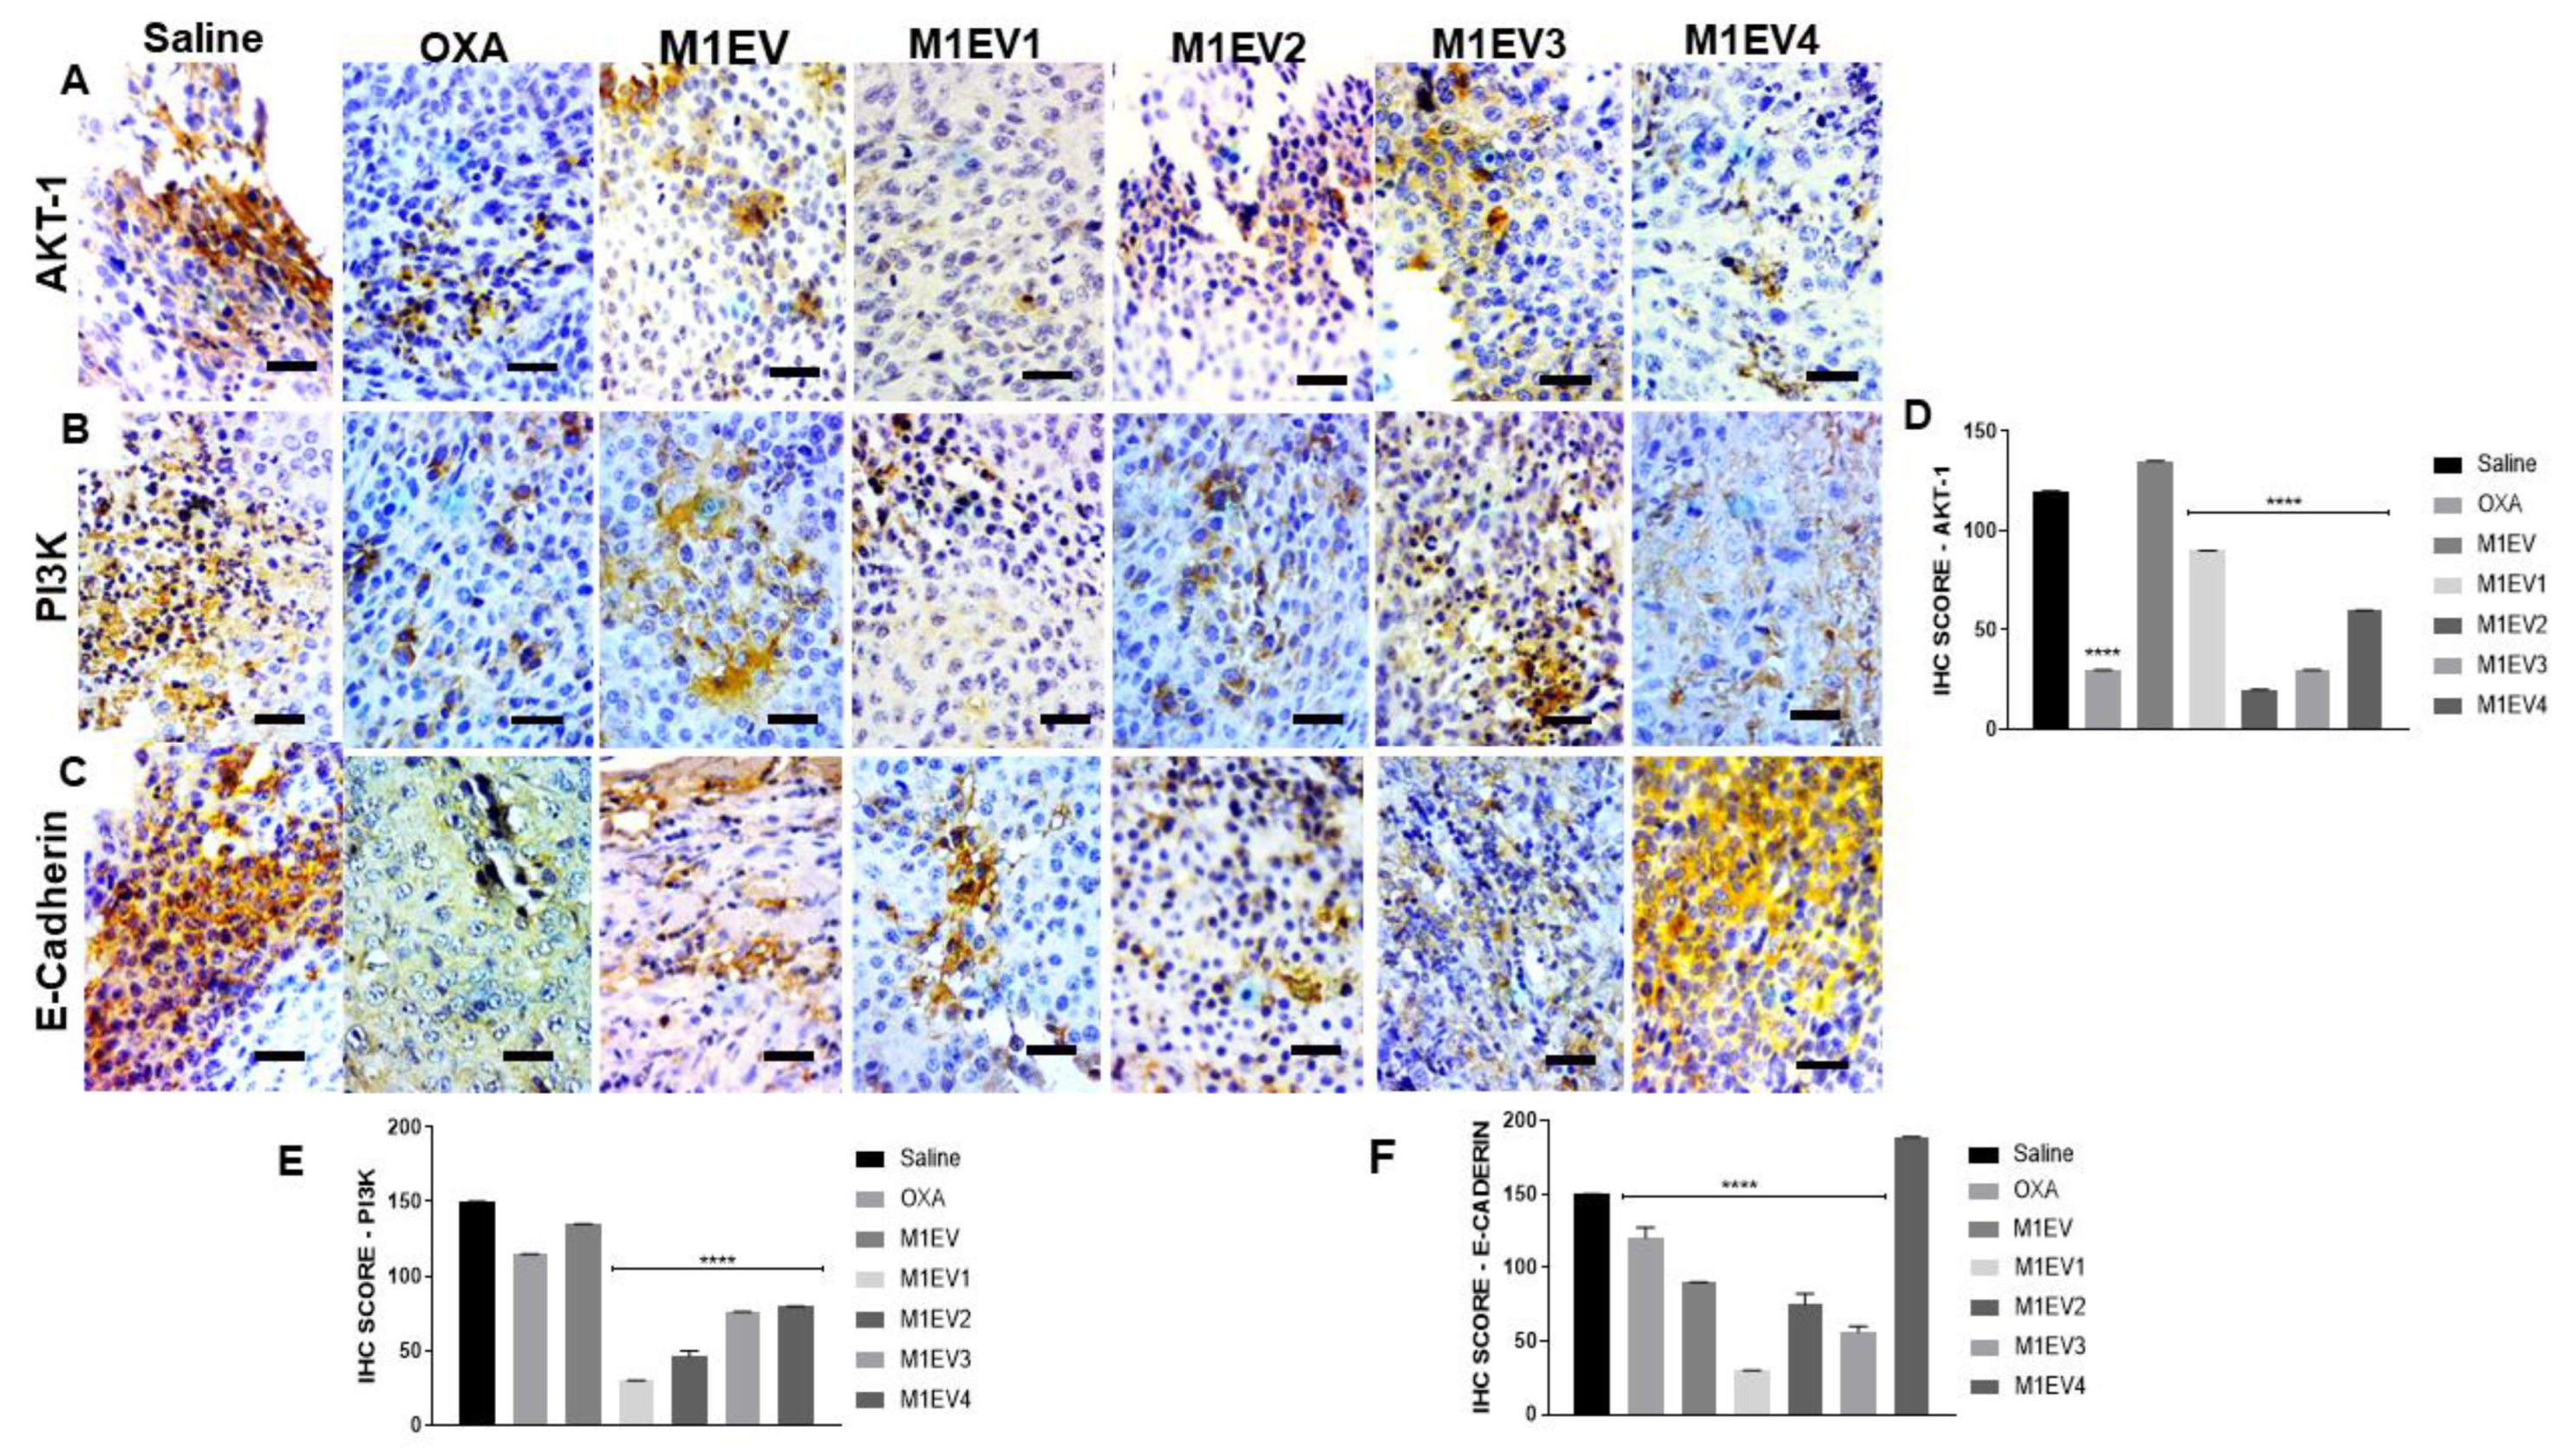
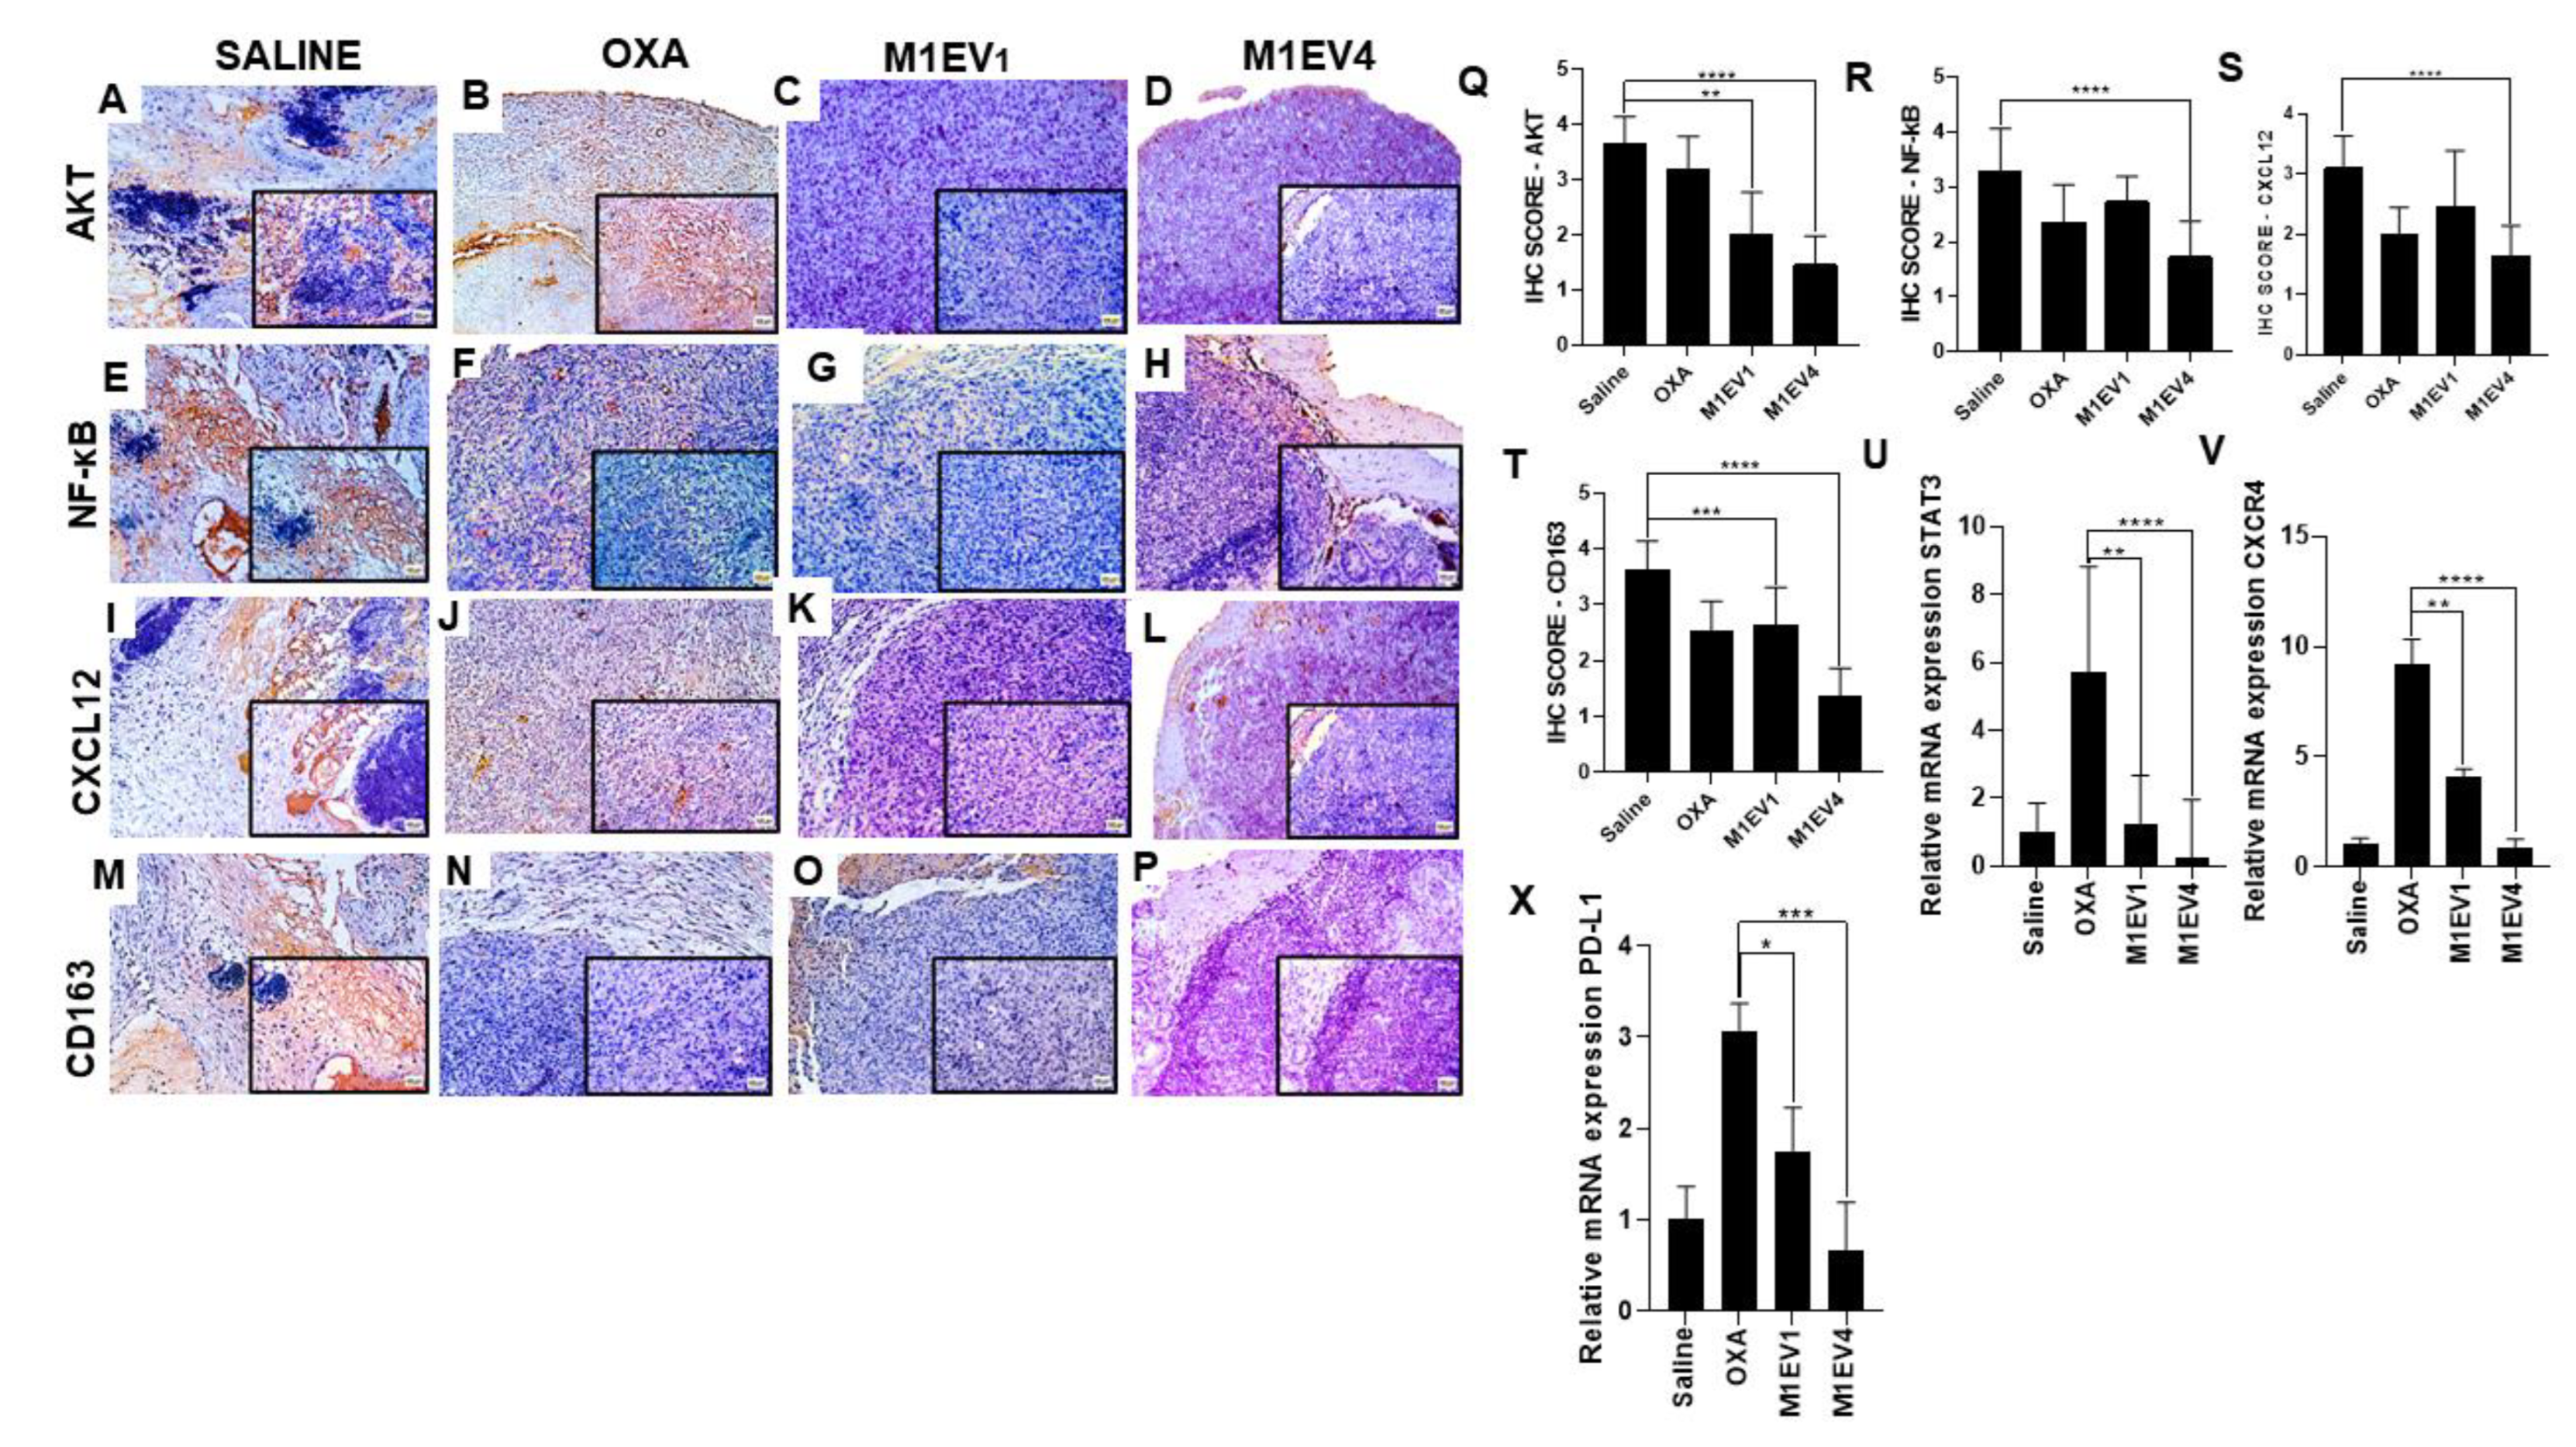
According to the “Seed and Soil” hypothesis, metastatic capacity is determined in two ways, such as an internal oncogenic driving force and a pro-tumor environment for tumor cells64. Based on the results of primary tumors described previously, we moved forward for investigating the expression of different hallmarks of metastasis in mice peritoneal cancer, and more importantly, we tested the antitumor effect of M1EV4 in these hallmarks. Several studies have reported that tumor progression and metastasis are regulated by several factors related to M2-TAM, immunosuppressive cytokines, metastatic regulators, and dysregulated transcription factors in TME (24,27,64. In this context, upregulation of STAT3, NF-kB, and AKT signaling pathways seemed to stimulate the CXCL12/CXCR4 axis that promotes tumor progression and metastasis as well as regulates M2-TAM recruitment and immunosuppression24,27,64,65. The expression of genes coding for transcription factor (STAT3) as well as metastasis regulators (CXCR4) and immunosuppression (PD-L1) in the TME was markedly downregulated by M1EV4 loaded with OXA, RA, and LF in metastatic peritoneal tumors. Likewise, protein expression of transcription factors (AKT and NF-kB), metastatic factors (CXCL12), and M2-TAM immunosuppression (CD163) also were reduced after treatment with M1EV4. Reinforcing these molecular findings, clinically M1EV4 was able to reduce metastatic niches in peritoneum, liver and lungs in mice treated for two weeks.
This study proposes a sophisticated engineering of extracellular vesicles as drug carriers to control primary tumors and metastatic disease. In this study, we provided evidence that EVs from M1 Macrophages increase (I) anti-tumor activity in TME by (I) immunomodulatory molecule carrier (II) potentialize and increase the bioavailability of oxaliplatin in lower dose and/or (II) stimulating the activation or blocking of signaling pathways involved in cell proliferation, migration, and survival processes.
Figure 1.
Characterization of EVs derived from M1-polarized RAW 264.7. Representative photomicrographs of the uptake analysis in CT-26 cells over 24 hours (A-D). In blue the nucleus marked with DAPI (A), in red the cytoplasmic marking of CT-26 with DIL (B), in white, the EVs marked inside the cells (C), and in figure (D) merged cells stained with all dyes. Analysis of the EVs morphology by transmission electron microscopy (TEM) (E). Analysis of the size of the EVs obtained after completing the process of obtaining and standardizing the EVs (F). This image represents the quantitative analysis of the concentration of oxaliplatin detected by HPLC (G).
Figure 2.
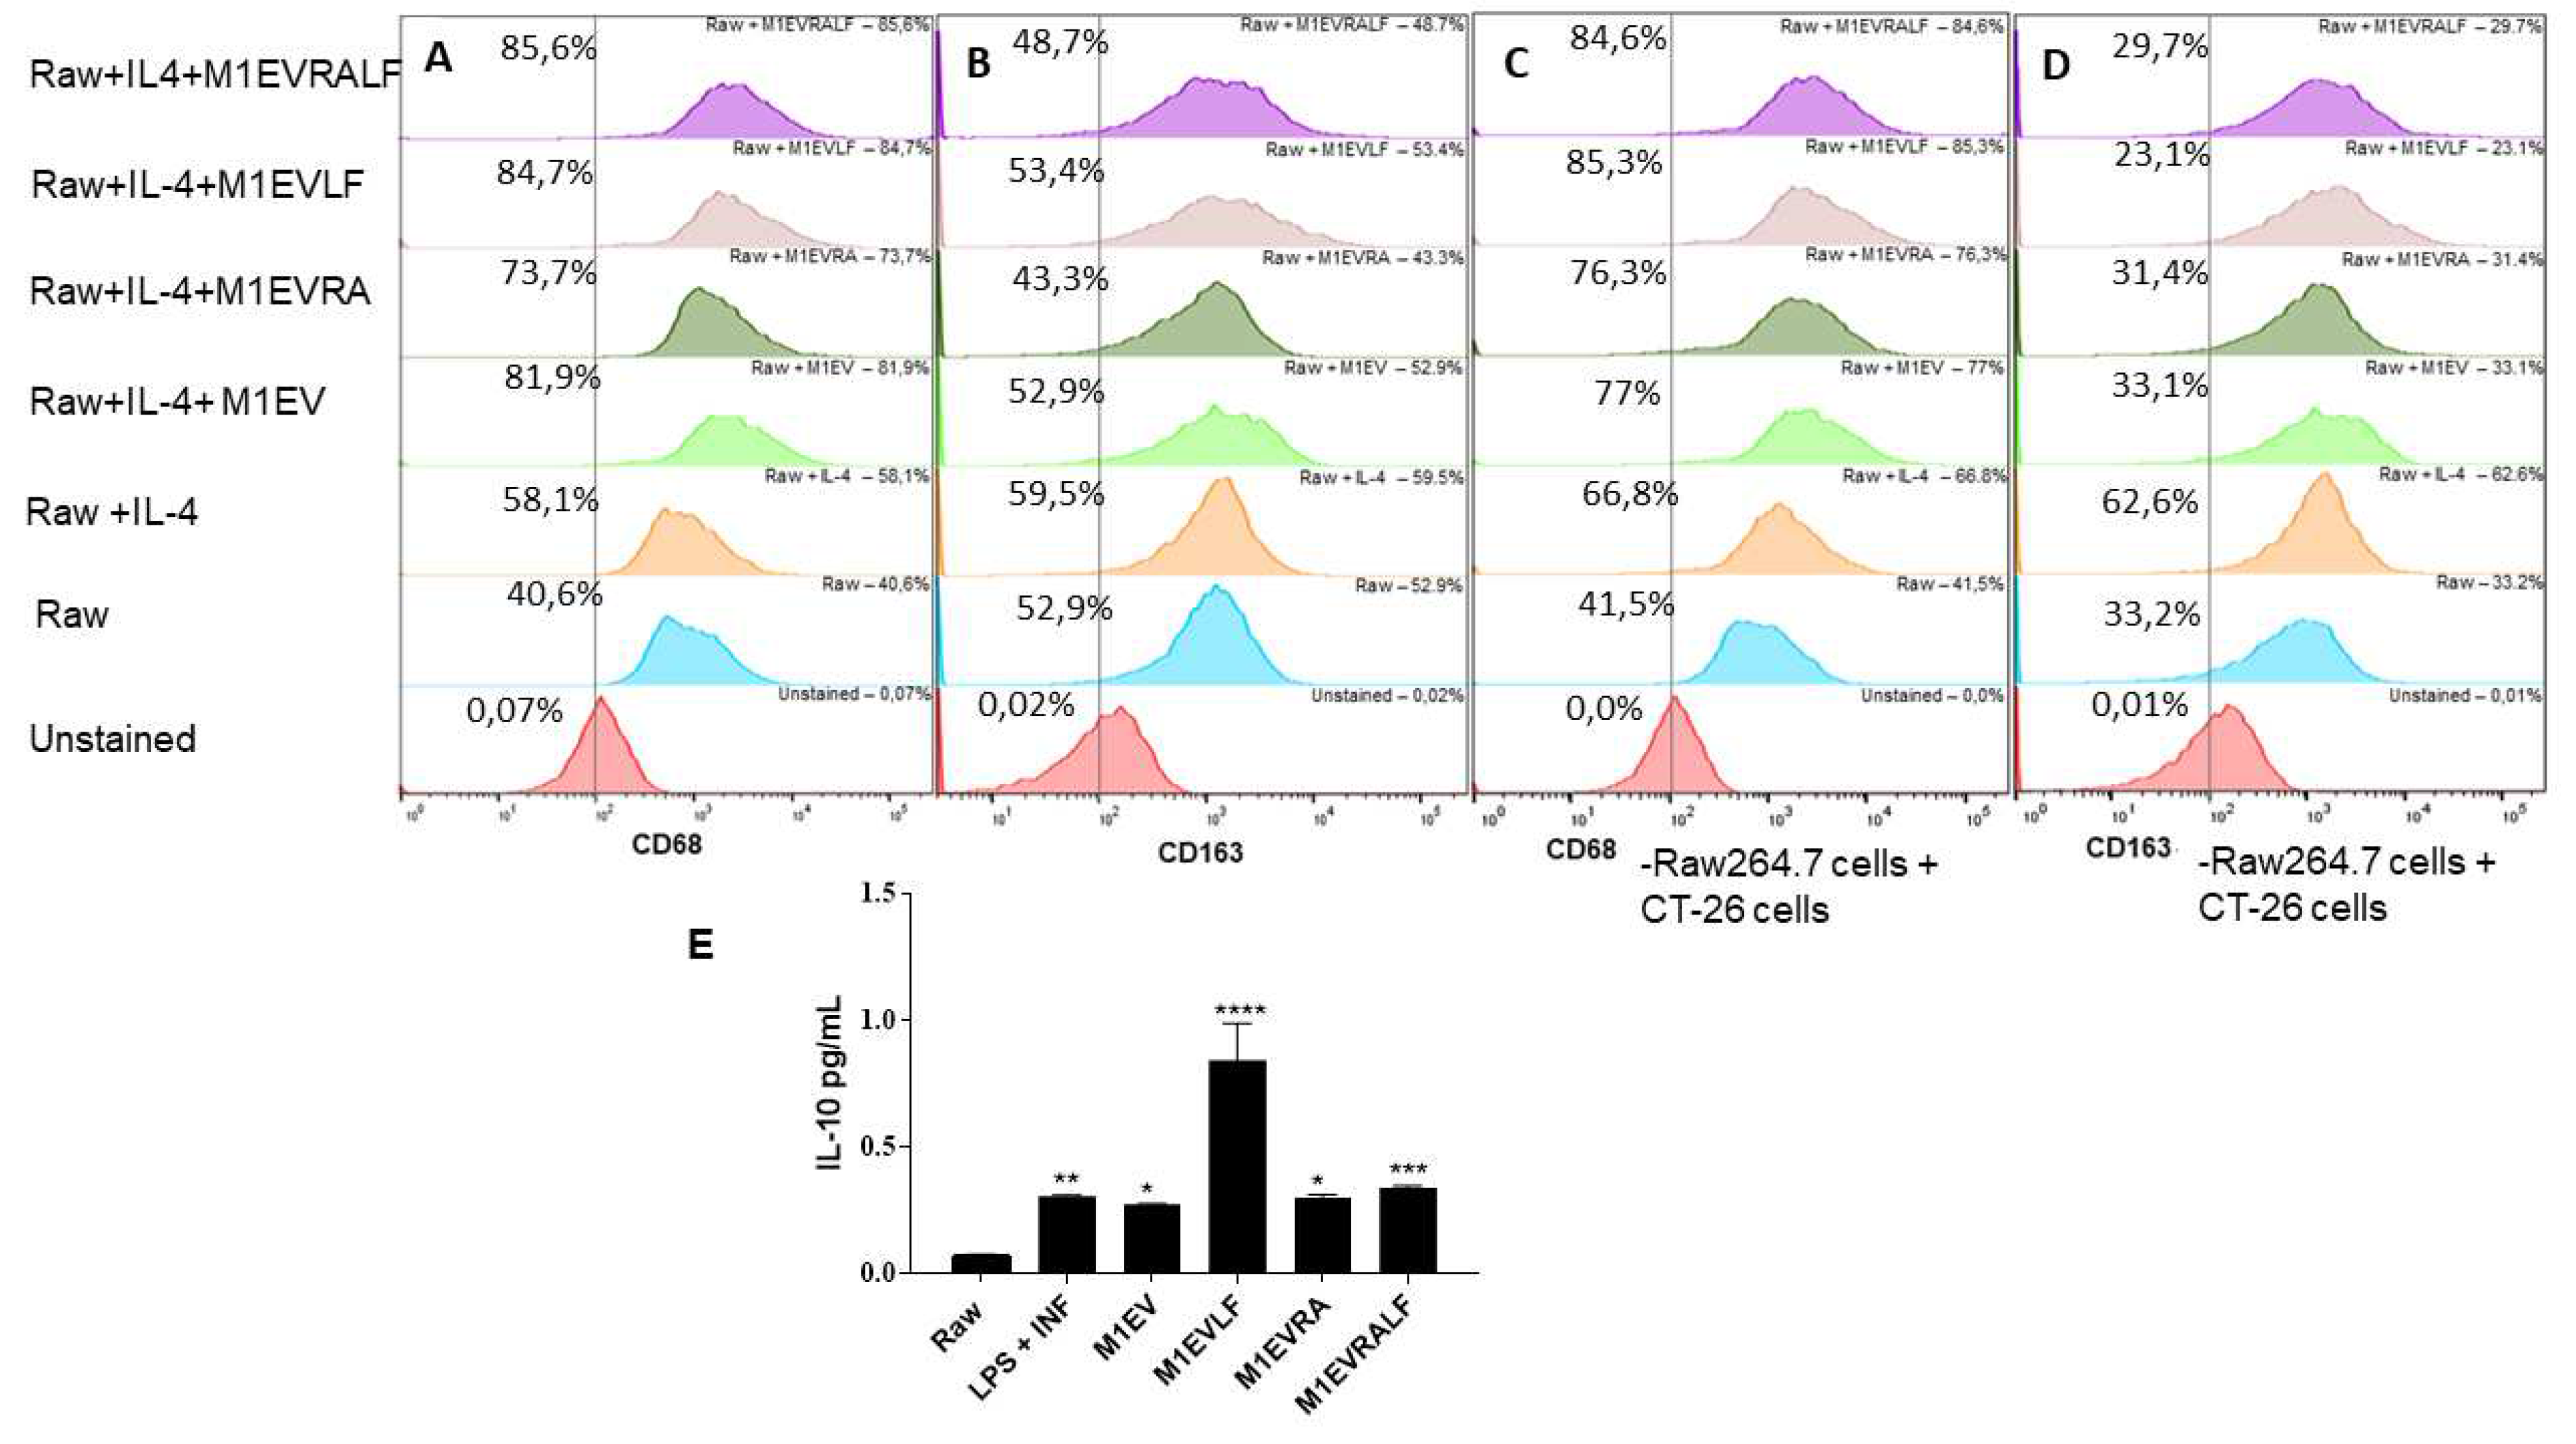
M1EV, M1EVRA, M1EVLF, and M1EVRALF decreased M2-TAM polarization. (A-B) Representative flow cytometry profile of CD68 and CD163 expression on RAW 264.7 control cells and upon treatment with IL-4, or IL-4 and M1EV, M1EVRA, M1EVLF, and M1EVRALF. (C-D) Expression of CD68 and CD163 in Raw 264.7 cells treated with IL-4, or IL-4 and M1EV, M1EVRA, M1EVLF, and M1EVRALF in co-culture with CT-26 cells. (E) Level of IL-10 from cell culture supernatants of IL-4-polarized RAW 264.7 cells, in the presence and absence of M1EV, M1EVRA, M1EVLF, and M1EVRALF. Unstained (CT-26 control cells), RAW: RAW 264.7 cells (control cells), RAW+IL4: RAW 264.7 cells with IL-4, M1EV: M1-EVs 20µg/mL, M1EVRA: M1-EVs with retinoic acid, M1EVLF: M1-EVs with L. ferrea, and M1EVRALF: M1-EVs with retinoic acid and L. ferrea. For analyses of the cytokines, all treatment groups were compared to the RAW + IL-4 group (**p<0.01, ***p<0.001, and ****p<0.0001).
Figure 3.
M1EVs, M1EVRA, M1EVLF and M1EVRALF up-regulated the expression of E-cadherin and down-regulated the expression of Vimentin in CT-26 cells. Immunofluorescence of expression of E-Cadherin and Vimentin in response to the M1EV systems without OXA but loaded with RA, LF and RA+LF (A-J). Graphical representation of the mean Fluorescence Intensity (AU) for the anti-E-Cadherin (K) and anti-Vimentin (L) immunoreactivity in CT-26 cells from each group (green) with DAPI nuclear stained (blue). CT-26 (control cells), M1EVRA: M1-EVs with retinoic acid, M1EV: M1-EVs, M1EVLF: M1-EVs with L. ferrea, and M1EVRALF: M1-EVs with retinoic acid and L. ferrea. Results are presented expressed by mean ± SEM. All treated cells were compared to the CT-26 control group (**p<0.01, ***p<0.001, and ****p<0.0001). Magnification 400x (Scale Bars are 20µM).
Figure 4.
Relative mRNA expression from NF-κB (A), FAAD (B), Apaf-1 (C), MDR1 (D), SURVIVIN (E), STAT3 (F), Vimentin (G), and E-Cadherin (H) genes in CT-26 cell line co-cultured with Raw 264.7 cells and treated with M1EV systems without OXA but loaded with RA, LF and RA+LF. CT-26 (control cells), MC38 (control cells), RAW: RAW 264.7 cells (control cells), RAW+IL4: RAW 264.7 cells with IL-4, M1EV: M1-EVs 20µg/mL, M1EVRA: M1-EVs with retinoic acid, M1EVLF: M1-EVs with L. ferrea, and M1EVRALF: M1-EVs with retinoic acid and L. ferrea. Results are presented as a fold-change of the media values, normalized to Beta-actin (β-actin), and expressed by mean ± SEM. All treated cells were compared to the RAW+IL-4 group (ns: non-significant, *p<0.05, **p<0.01, ***p<0.001, and ****p<0.0001).
Figure 5.
Inhibition of tumor growth. The excised tumors were presented on a panel for comparative analysis of tumor size. Saline group (A.1), OXA (B.1), M1EV (C.1), M1EV1 (D.1), M1EV2 (E.1), M1EV3 (F.1), and M1EV4 (G.1). The growth curve of allographic colorectal tumors in BALB/c mice shows a reduction in tumor volumes after treatment with M1EV, M1EV1, and M1EV4 (B). Arrows indicate therapeutic interventions via peritumor administration. Graphical representation of the analysis of the collected tumor mass (C). The arrows indicate the days on which the animals received the treatments. OXA: 5mg/kg oxaliplatin, M1EV: 20µg/Kg M1-EVs, M1EV1: M1-EVs with 2mg/Kg oxaliplatin, M1EV2: M1-EVs with 2mg/Kg oxaliplatin and retinoic acid, M1EV3: M1-EVs with 2mg/Kg oxaliplatin and L. ferrea, and M1EV4: M1-EVs with 2mg/Kg oxaliplatin, retinoic acid, and L. ferrea. Results are presented expressed by mean ± SEM. All treated groups were compared to the saline control group (*p<0.05, **p<0.01, ***p<0.001, and ****p<0.0001).
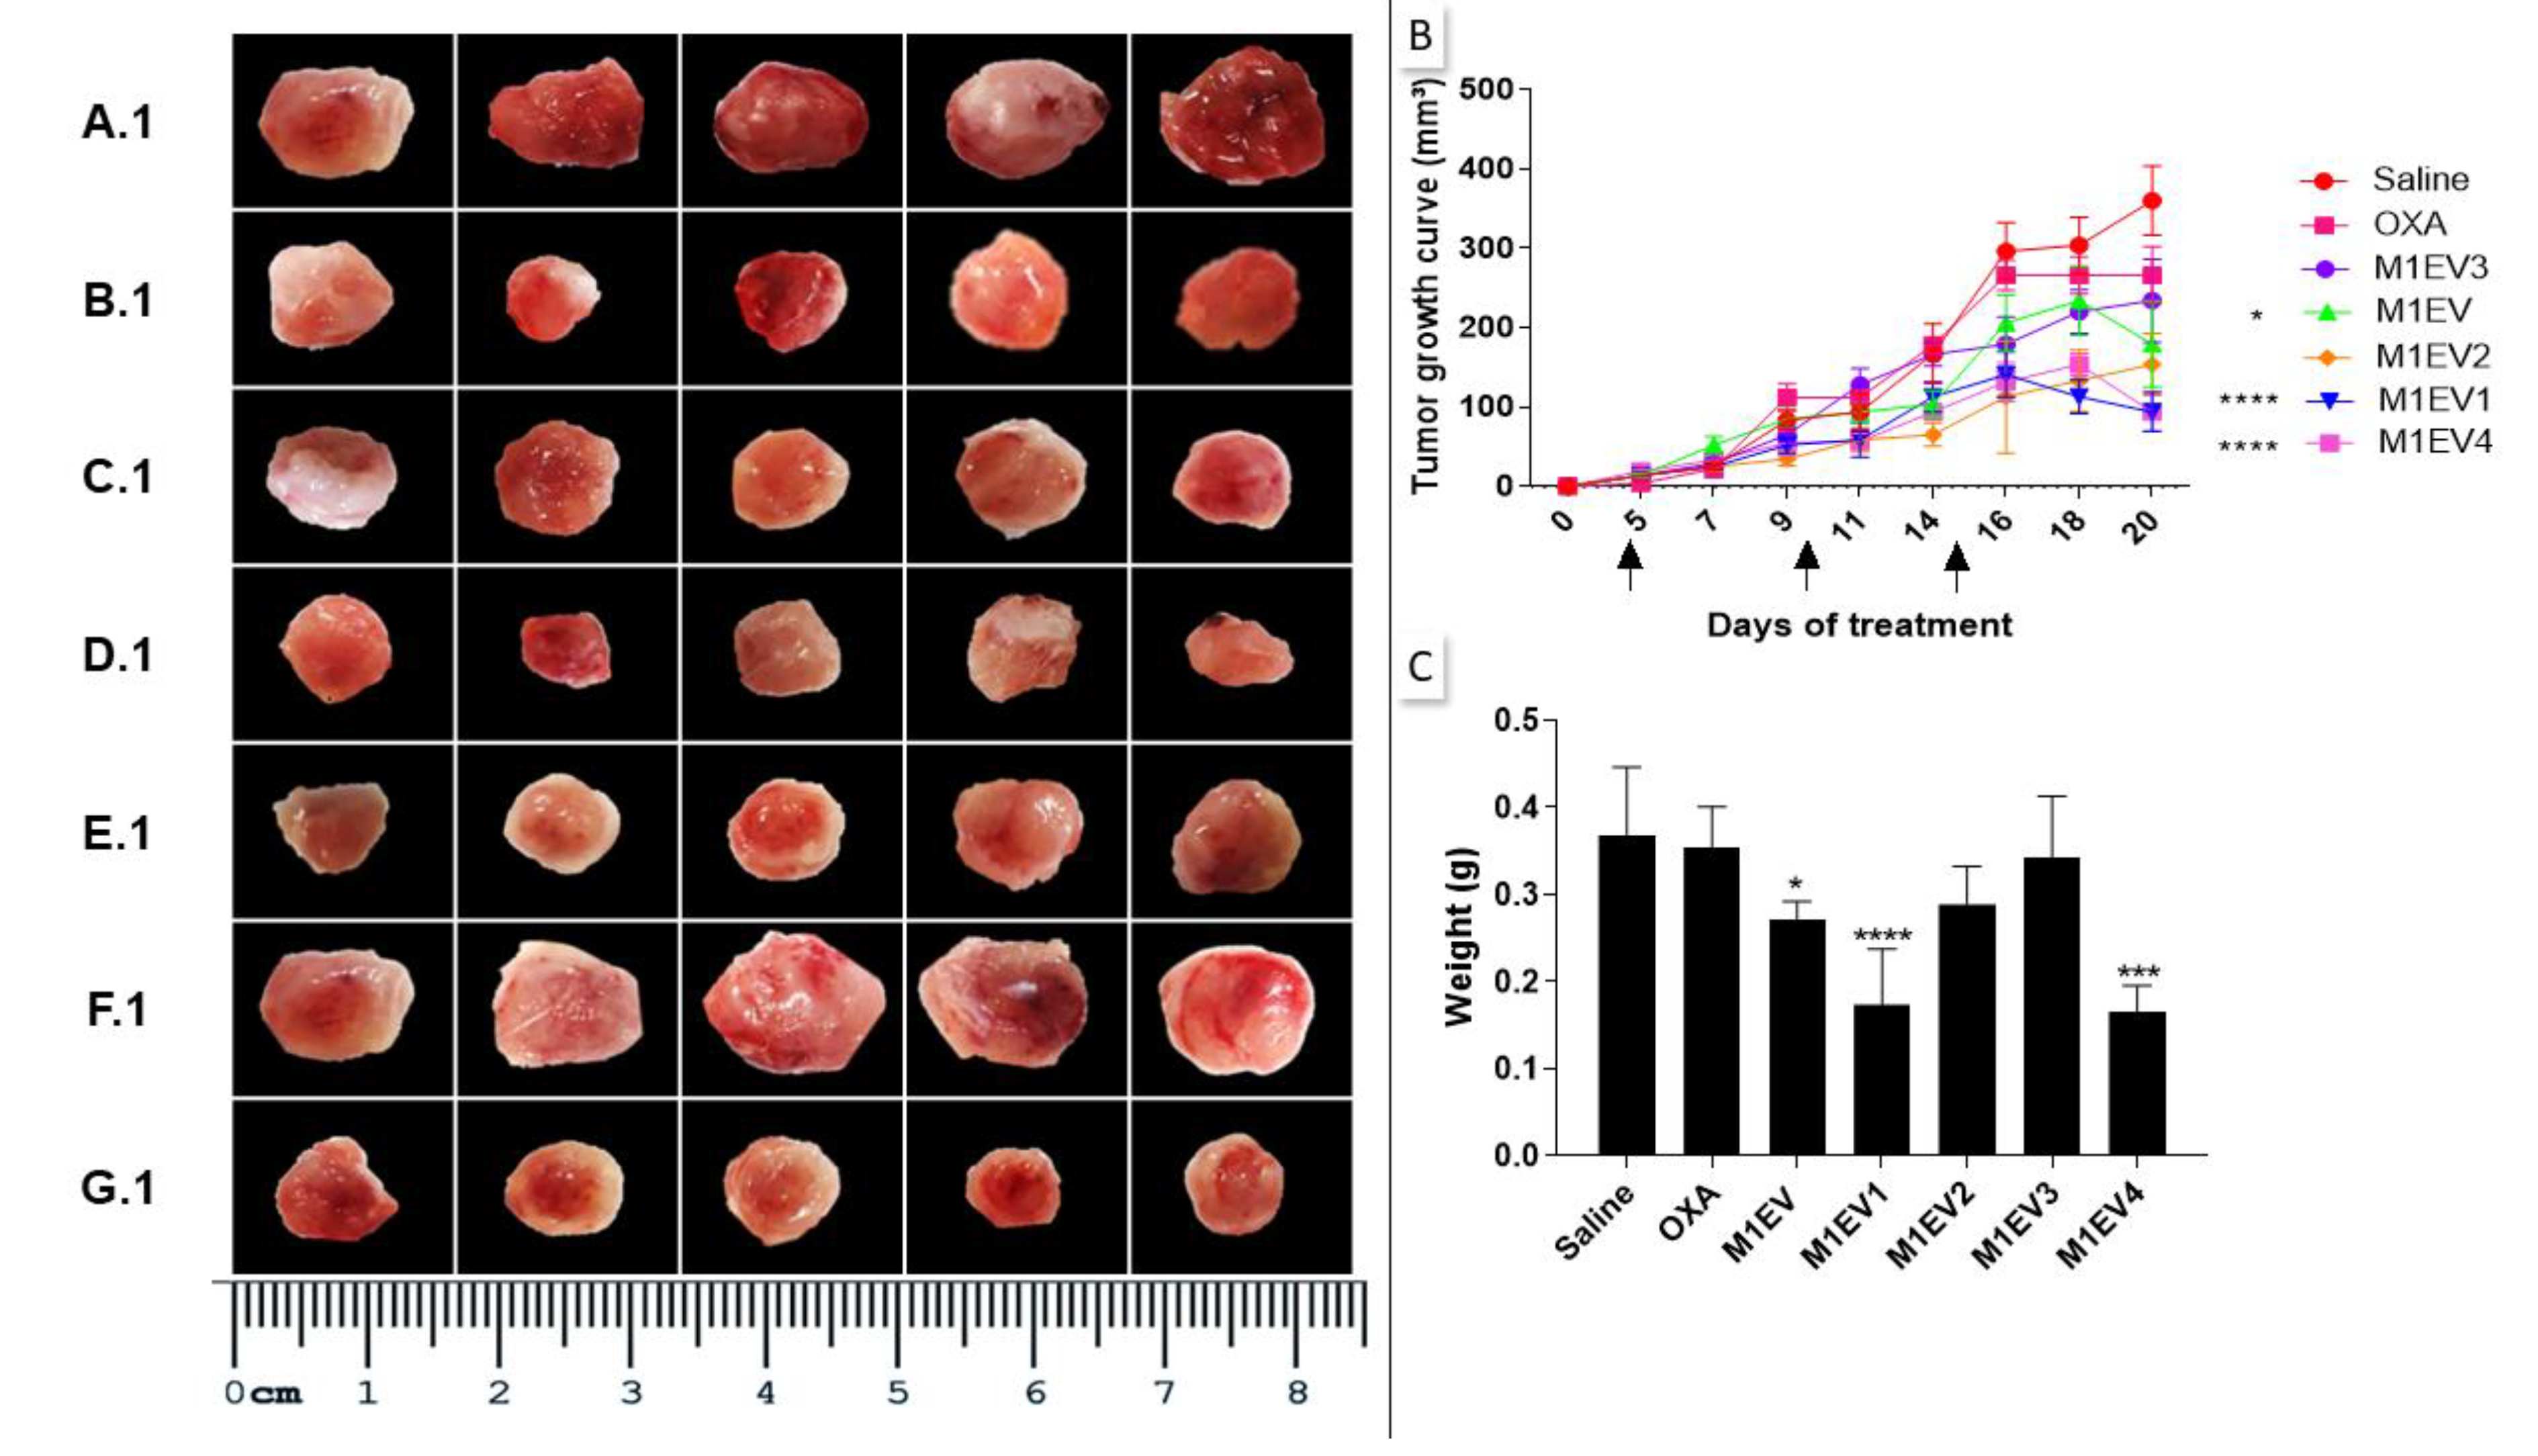
Figure 6.
Evaluation of immunosuppression and invasion in the TME. Representative photomicrographs of Immunofluorescence analysis of tumors collected from colorectal cancer allographic model (A-U), 400x, Bar scale: 20µM. Graphical representation of the mean fluorescence intensity (AU) for anti-PD-L1 (V), anti-IL-10 (W), and anti-MMP2 (X) immunoreactivity in tumor fragments from each group (green) with DAPI nuclear counterstained (blue). OXA: 5mg/kg oxaliplatin, M1EV: 20µg/Kg M1-EVs, M1EV1: M1-EVs with 2mg/Kg oxaliplatin, M1EV2: M1-EVs with 2mg/Kg oxaliplatin and retinoic acid, M1EV3: M1-EVs with 2mg/Kg oxaliplatin and L. ferrea, and M1EV4: M1-EVs with 2mg/Kg oxaliplatin, retinoic acid, and L. ferrea. Results are presented expressed by mean ± SEM. All treated groups were compared to the saline control group (*p<0.05, **p<0.01, ***p<0.001, and ****p<0.0001).
Figure 7.
Influence of RA and LF on in vivo invasion properties of M1-derived EVs loaded with OXA in allographic CT-26 colorectal cancer-bearing mice. The groups were stained for evaluation of AKT-1 (A), PI3K (B), and E-Cadherin (C). Graphical representation of the scores for immunoreactivity in tumor fragments from each group stained for AKT-1 (D), PI3K (E) and E-Cadherin (F). Magnification 400x, Bar scale- 200 µM. OXA: 5mg/kg oxaliplatin, M1EV: 20µg/Kg M1-EVs, M1EV1: M1-EVs with 2mg/Kg oxaliplatin, M1EV2: M1-EV with 2mg/Kg oxaliplatin and retinoic acid, M1EV3: M1-EV with 2mg/Kg oxaliplatin and L. ferrea, and M1EV4: M1-EV with 2mg/Kg oxaliplatin, retinoic acid, and L. ferrea. Results are presented expressed by mean ± SEM. All treatment groups were compared to the saline control group (*p<0.05, **p<0.01, ***p<0.001, and ****p<0.0001).
Figure 8.
Relative mRNA expression from analyses of gene expression in tumor fragments from allographic tumor model. FAAD (A), APAF-1 (B), NF-κB (C), STAT3 (D), CD8 (E), CD68 (F), and SNAIL (G) genes. OXA: oxaliplatin 5mg/kg, M1EV: M1-EVs 20µg/mL, M1EV1: M1-EVs with oxaliplatin 2mg/Kg, M1EV2: M1-EVs with oxaliplatin 2mg/Kg and retinoic acid 4mg/mL, M1EV3: M1-EVs with oxaliplatin 2mg/Kg and L. ferrea 2.5mg/mL, and M1EV4: M1-EVs with oxaliplatin 2mg/Kg, retinoic acid 4mg/mL, and L. ferrea 2.5mg/mL. Results are presented as fold-change of the media values, normalized to Beta-actin (β-actin), and expressed by mean ± SEM (*p<0.5, **p<0.01, ***p<0.001, and ****p<0.0001). All treatment groups were compared to the OXA group and the saline control group.
Figure 9.
M1EV holding OXA, RA, and LF may inhibit nodule formation of colon cancer peritoneal metastasis in mice. (A) Visible tumor nodules were present in the abdominal cavity in representative photos of mice sacrificed 2 weeks after IP injection with CT-26 cells and treatment with 5mg/Kg OXA. (B) Graphical representation of the weight in mg of the tumors collected. (C) Graphical representation from the quantification of tumors per mouse. (D) Histopathological scores of peritoneal tumors. 400x, Bar scale: 200µm OXA: 5mg/kg oxaliplatin, M1EV1: M1-EVs with 2mg/Kg oxaliplatin, M1EV4: M1-EVs with 2mg/Kg oxaliplatin, retinoic acid, and L. ferrea. Results are presented expressed by mean ± SD. All treatment groups were compared to the saline control group. In B and C, treated groups were compared to the OXA group (*p<0.05, **p<0.01, ***p<0.001, and ****p<0.0001).
Figure 10.
Evaluation of immunosuppression in colon cancer peritoneal metastasis. The tumors excised from the previously treated BALB/c mice were analyzed for immunostaining by immunohistochemistry (A–T) and relative gene expression (U-X). Images with 100× magnification; 400× magnification is shown in the lower right corner of each image (Bar scale: 200µM). Scores were applied to each image to represent them graphically. The saline (A, E, I, and M), OXA 5mg/kg (B, F, J, and N), M1EV1 (C, G, K, and O), and M1EV4 (D, H, L, and P) groups were stained for evaluation of AKT (A-D), NF-κB (E-H), CXCL12 (I-L), and CD163 (M-P). OXA: 5mg/kg oxaliplatin, M1EV1: M1-EV with 2mg/Kg oxaliplatin, M1EV4: M1-EV with 2mg/Kg oxaliplatin, retinoic acid, and L. ferrea. Magnification 400x. Results are presented expressed by mean ± SD. All treatment groups were compared to the saline control group (*p<0.05, **p<0.01, ***p<0.001, and ****p<0.0001).
Figure 11.
Evaluation of metastatic niches in liver and Lungs. The evaluation of tumor cell migration to secondary sites was observed in the liver (A-D, 100× and 400×) and lung (E-H, 100× and 400×) from previously treated BALB/c mice. The arrowheads indicate the presence of metastatic niches (A-H), which are best seen in greater magnification (400x). Metastatic niches in the liver (I) and lung (J) were assessed semi-quantitatively by applying scores representing the tumor cells percentage in the tissue parenchyma. OXA: 5mg/kg oxaliplatin, M1EV1: M1-EV with 2mg/Kg oxaliplatin, M1EV4: M1-EV with 2mg/Kg oxaliplatin, retinoic acid, and L. ferrea. Results are presented expressed by mean ± SD. All treatment groups were compared to the saline control group (*p<0.05, **p<0.01, ***p<0.001, and ****p<0.0001). Bar scale: 200µM.
