Preprint
Article

First Assessment of the Observed Meteorological Data in the Lousã/Seia Region in the Framework of the FireStorm Project

Altmetrics

Downloads

101

Views

25

Comments

0

This version is not peer-reviewed

Submitted:

24 May 2023

Posted:

26 May 2023

You are already at the latest version

Alerts
Abstract
In the framework of the FireStorm project, four portable weather stations were installed in the Lousã/Estrela mountain range. Given that the Portuguese Institute for Sea and Atmosphere’s sur-face network has two weather stations installed in this region, the new data allows an improved monitoring of the vertical variability of near-surface variables in this mountainous region. As most of the wildfires in mainland Portugal affect areas with complex terrain with elevations below 1200 m and major fires continue to burn overnight, it is also relevant to monitor the vertical changes of meteorological variables in the nighttime period, as these may exhibit large variability. This study provides the first assessment of the available data, with focus on the summer seasons of 2021 and 2022. The results highlight the large variability that was observed in the region and suggest that the risk of extreme fire behaviour in the nighttime period may be underestimated.
Keywords: 
Subject: Environmental and Earth Sciences  -   Atmospheric Science and Meteorology

1. Introduction

Mainland Portugal is located within the transitional region between the subtropical anticyclone and the subpolar low-pressure system. The climate has characteristics of a mild Mediterranean, which includes a warm and dry summer, strong seasonality and large interannual variability [1]. In a simplified approach, the climate of mainland Portugal can be described as having two main seasons: a mild autumn and winter periods when most of the precipitation falls and a long and dry warm summer season [2]. Therefore, with other factors being equal, the climate in mainland Portugal is a key factor in explaining why it is a region prone to wildfires, as the vegetation is very dry in summer. Several studies have been made in mainland Portugal addressing the link between large-scale weather patterns and the summer fire season [3,4,5,6]. Results show that drought in spring and summer increases the risk of the fire season [7] and that warm and dry weather spells, with an easterly flow and low levels of fuel moisture, increase the likelihood of severe wildfires [8].
Most of the wildfires occur in summer and early autumn during the daytime. In this period of the day the risk of extreme fire behaviour is frequently linked to atmospheric instability [9,10]. If the conditions to trigger deep convection are present, severe weather may occur [11,12] and this may lead to large and unpredictable changes in the local weather conditions. The severe wildfire in Pedrógão Grande, on 17 June 2017 is an example of the extreme fire behaviour modifications due to the influence of atmospheric convective processes [13]. In the case of a warm and dry lower troposphere, the likelihood of dry thunderstorms is enhanced and may contribute to destructive wildfires [14,15]. Dry thunderstorms occur in mainland Portugal mainly in the summer season and, despite fewer than 5% of the total ignitions are identified as “natural causes” [16,17], these events are known to have caused multiple ignitions in an area as large as half of the country in a single afternoon and evening [18].
In mainland Portugal, mainly between June and September, the summer sea breeze is a well-known circulation that leads to low level convergence [19,20]. In the early afternoon the sea breeze starts moving inland and may be detected as far as 200 km from the west coast. The formation of stratocumulus decks, caused by cool sea surface temperatures and strong low-troposphere stability, is rather common off the Iberian coast. These cloud decks frequently move inland during nighttime, along with the marine boundary layer, and dissipate during the morning [21]. Overcast and foggy conditions in coastal regions are therefore frequent overnight. The extent to which the cloud deck moves inland is closely related to the orography and when it penetrates further it is blocked by the Lousã/Estrela mountain ridge. Moreover, in summer large-scale weather fronts have limited relevance in mainland Portugal, as these systems are usually weak, only influence the northwestern areas and are associated with a cool and humid westerly flow, conditions that are not favourable to wildfires.
On the other hand, as the northern half of mainland Portugal is a mountainous area, the effects of complex terrain on the flow must be addressed, particularly in the case of dynamically driven winds, which tend to be stronger. Well known effects [22,23,24,25,26,27,28,29] include flow over mountains with speeding/blocked flow, gap or corner winds, mountain wakes and channelling effects. When compared to other regions in the world, the mountain ranges in mainland Portugal have a limited size, hence it is unlikely that thermally driven winds will have a significant role in extreme fire behaviour. Low-level jets [30,31,32], which are located a few hundred metres above the surface and are associated with large values of wind shear, are additional features that may influence the vertical variability of weather conditions in the nighttime period in flat areas.
In summer the Azores subtropical high-pressure system frequently intensifies and extends towards Western Europe, which leads to nights with clear skies, light winds and warm weather. Elevated temperature inversions (EI) in summer are a prevailing feature of the weather in mainland Portugal, with a frequency over 60% at 00 UTC [33]. Its average base is below 1000 m asl, which is within the critical range of elevations where most of the wildfires occur in mainland Portugal. Furthermore, western Iberia is affected by an EI that is one of the deepest and the strongest in Europe [34].
In the absence of strong advection, the planetary boundary layer [35,36] becomes stable at night due to the cooling of the surface, which leads to the formation of a shallow surface layer, with a temperature inversion [37]. Above this shallow surface layer lies the residual layer which has average state variables that depend on the convective mixing that occurred previously in the daytime period. During events with prolonged warm weather conditions and light winds, this residual layer will get warmer and drier on consecutive days and this will ultimately affect the nighttime weather conditions in the hilly regions of mainland Portugal where most of the wildfires occur.
Light winds, lower temperatures and the nighttime humidity recovery provide a set of weather conditions that contributes to lower rates of fire spread and reduced fire intensity [38]. However, recent work suggests that fire intensity in the nighttime has increased globally, which is linked to warmer and drier nights [39]. This work suggests that monitoring the variability of the weather conditions during nighttime, particularly in areas that are prone to large wildfires and where extreme fire behaviour may play a relevant role, should not be overlooked. This becomes even more pertinent as studies [40,41] suggest that downslope winds may have played a significant role in the severe wildfires in the nighttime on 15-16 October 2017 in central mainland Portugal.
In the framework of the FireStorm project, a task was devised to improve the monitoring of the weather conditions in a region with complex terrain. Therefore, four portable weather stations were installed in the largest mountain range in mainland Portugal, which is within the area where frequently large and severe wildfires occur. Unlike large field campaigns that require a large array of equipment for a limited time [42], the goal in this project is to contribute to the continuous monitoring of the weather conditions in the area. In this paper an overview of the observed weather conditions is given in section 3 and a discussion of several events with large vertical variability of the weather conditions during the nighttime period is provided in section 4. Despite this study is focused on the summer seasons of 2021 and 2022, the discussion also addresses a case observed in late May 2022, as the weather conditions were extreme for the nighttime and time of the year. Moreover, recent work suggests a trend, detected approximately in the last twenty years, for an early onset of the fire season of wildfires in mainland Portugal [43].

2. Materials and Methods

2.1 Study area

The study area is the Lousã/Seia region, in the Lousã/Estrela mountain range, which is located in central mainland Portugal (Figure 1). This mountain range has a southwest-northeast orientation and the ridge has an altitude typically around 1400-1500 m above sea level (asl), with a peak elevation of 1993 m. Even though Seia (northeast region) and Lousã (southwest region) are roughly 60 km apart, they are sufficiently close enough to be affected by the same large-scale features.
In this area four new portable surface automatic weather stations (AWS) were installed, two close to Seia and the remaining near Lousã. Furthermore, the Portuguese Institute for Sea and Atmosphere (IPMA) manages two AWS in this area, one in a small plateau on the ridge (Penhas Douradas), while the other one in a valley (Lousã). These six weather stations (Table 1) allow the monitoring of the ridge and the north-western slope of the mountain range, from the valley (elevations around 150 m) up to an altitude of 1400 m asl. When taken together in both regions (Lousã and Seia), the six AWS allow a vertical discretization around 200-300 m.

2.2 Data

The portable weather stations in Seia were installed in March 2020, but in Lousã it was only possible to install the equipment in October 2020, namely due to the pandemic restrictions. Unexpected issues with the power supply and communication systems in the stations installed in Lousã led to further delays, hence full availability of data from the weather stations started only in February 2021.
The data from the AWS managed by IPMA is observed at default heights (wind at 10 m, temperature and relative humidity at 2 m) and the sample frequency is 1 second. In the case of the portable weather stations all the variables are observed at 2 m using a compact all-in-one weather sensor from Lufft, with ultrasonic wind. The sample frequency is set to 10 seconds, as they are not connected to an external power supply. To make the wind observations comparable, the 2 m wind speed was extrapolated to the 10 m level using the conservative value of 0.1 as the exponential constant for the logarithmic profile. Given the high surface roughness in Candal, this extrapolation is most likely underestimating the 10 m wind speed at this site.
The data from all the weather stations is available with a ten-minute frequency and is then processed into hourly data. In this procedure the hourly values of instantaneous variables are given by the previous 10-minute value, hence they are not the average values of the 10-minute data observed during the entire previous hour. In this study only hourly data is used. A quality-control application is applied to the data and includes both time and spatial consistency checks to remove or minimize the likelihood of outliers. The data used in this study covers the summer seasons (June 1st – August 31st) of 2021 and 2022 and its availability is above 95% in all the weather stations.
Given that in mainland Portugal local time matches the Universal Time Coordinate (UTC) in winter and is equal to UTC+1 in summer, the hour reference in this study is UTC. Even though sunrise in late June occurs, at the earliest, around 05h15 UTC, it was deemed appropriate, for the goals of this study, to define nighttime as the period between 00 and 06 UTC, all inclusive.
To provide insight into the large-scale weather pattern and the vertical variability of the lower-troposphere, this study uses data from the high-resolution operational forecasts (ECMWF-HRES) from the European Centre for Medium-range Weather Forecasts (ECMWF). While pressure level data is used to provide a view of the large-scale atmospheric circulation, for the vertical variability, which requires cross-sections and/or vertical profiles, only model level data is used, as it has a much higher vertical resolution than what is achievable with mandatory pressure levels. Only data from the 00 UTC run is used and the horizontal resolution of ECMWF-HRES is 0.1°x0.1°.

2.3 Inversion frequency

In this study the frequency of “inversion days” is shown and was computed using the following definitions:
  • A day comprises the nighttime hourly observations between 00 and 06 UTC, all inclusive.
  • At a given hour, an inversion is detected if the difference of the 2 m temperature between stations A and B is positive, with A having a higher altitude than B.
  • A dry day is one in which the hourly precipitation in all the surface weather stations in the Lousã/Seia region during nighttime is lower or equal to 0.2 mm/1h.
The criteria for considering an “inversion day” requires a dry day, a temperature inversion detected at least once in the nighttime period and missing data is occurs in less than half of the nighttime hourly sample.

2.4 Downslope windstorms

Downslope windstorms are events that are particularly relevant in extreme fire-behaviour as the atmospheric flow is turbulent and there is large variability in the wind speed, temperature and relative humidity. Given that downslope windstorm events were identified using a set of criteria that was only applied to observed data and that the AWS are installed in the northwest facing slopes, it should be stressed that downslope winds of interest to this study require a southerly or southeasterly flow. The criteria used is as follows and assumes any set of three weather stations (A, B, C) with decreasing elevation:
  • 2 m temperature must be equal or increase when going from A to C.
  • 2 m relative humidity must be equal or lower when going from A to C.
  • Wind direction is from the south, southeast or east.
  • 10 m wind gust must be above a given threshold. The threshold was set after a thorough review of the observed data and is site dependent. After reviewing the observed data, the values used are 10 m/s in Lousã and Seia and 8 m/s in Candal and provide a balanced cut-off to identify events on which downslope wind were strong.
The three events that comply with the criteria above and had the highest values of 10 m wind gust (above or equal to 15 m/s observed in, at least, one of the valley stations) occurred on 31 March 2021, 28 March 2022 and 21 May 2022. None of these dates is in the summer season and this is consistent with the fact that in this period a southeasterly flow in western Iberia has a frequency below 5% [44].
Regardless of the season, downslope windstorms were detected in at least one of the valley stations in, approximately, 20 days since March 2021. Moreover, there were roughly another 15 days that met the criteria, but only down to the medium slope (Candal). In these latter cases, there is a surface temperature inversion, with light winds in the valley stations (Seia and Lousã) (not shown). Despite the number of windstorm events detected may change slightly depending on the criteria used, this issue does not influence the intended goal of identifying the strongest events.

2.5 Daily cycle

The hourly daily cycle of the observed data is shown for the 10 m wind speed and 2 m temperature, relative humidity and dew point and is computed as the average value of all the observed data at a given hour. In the case of the wind direction, the hourly daily cycle is highlighted by computing the frequency of westerly winds, which are defined by the west and southwest directions. However, after assessing the data, some adjustments were made to account for the deflection of flow by the topography. Therefore, in Seia and Espinheiro westerly winds are defined as south and southwest and in Candal as west and northwest.

3. Results

3.1 Seasonal Statistics

The daily cycle of the 10 m wind speed and the 2 m temperature, relative humidity and dew point temperature were computed in the six weather stations during the summer period. This data provides both the average and the extreme values (depending on the variable), hence gives an insight on the intraday variability and the full range of the observed values.
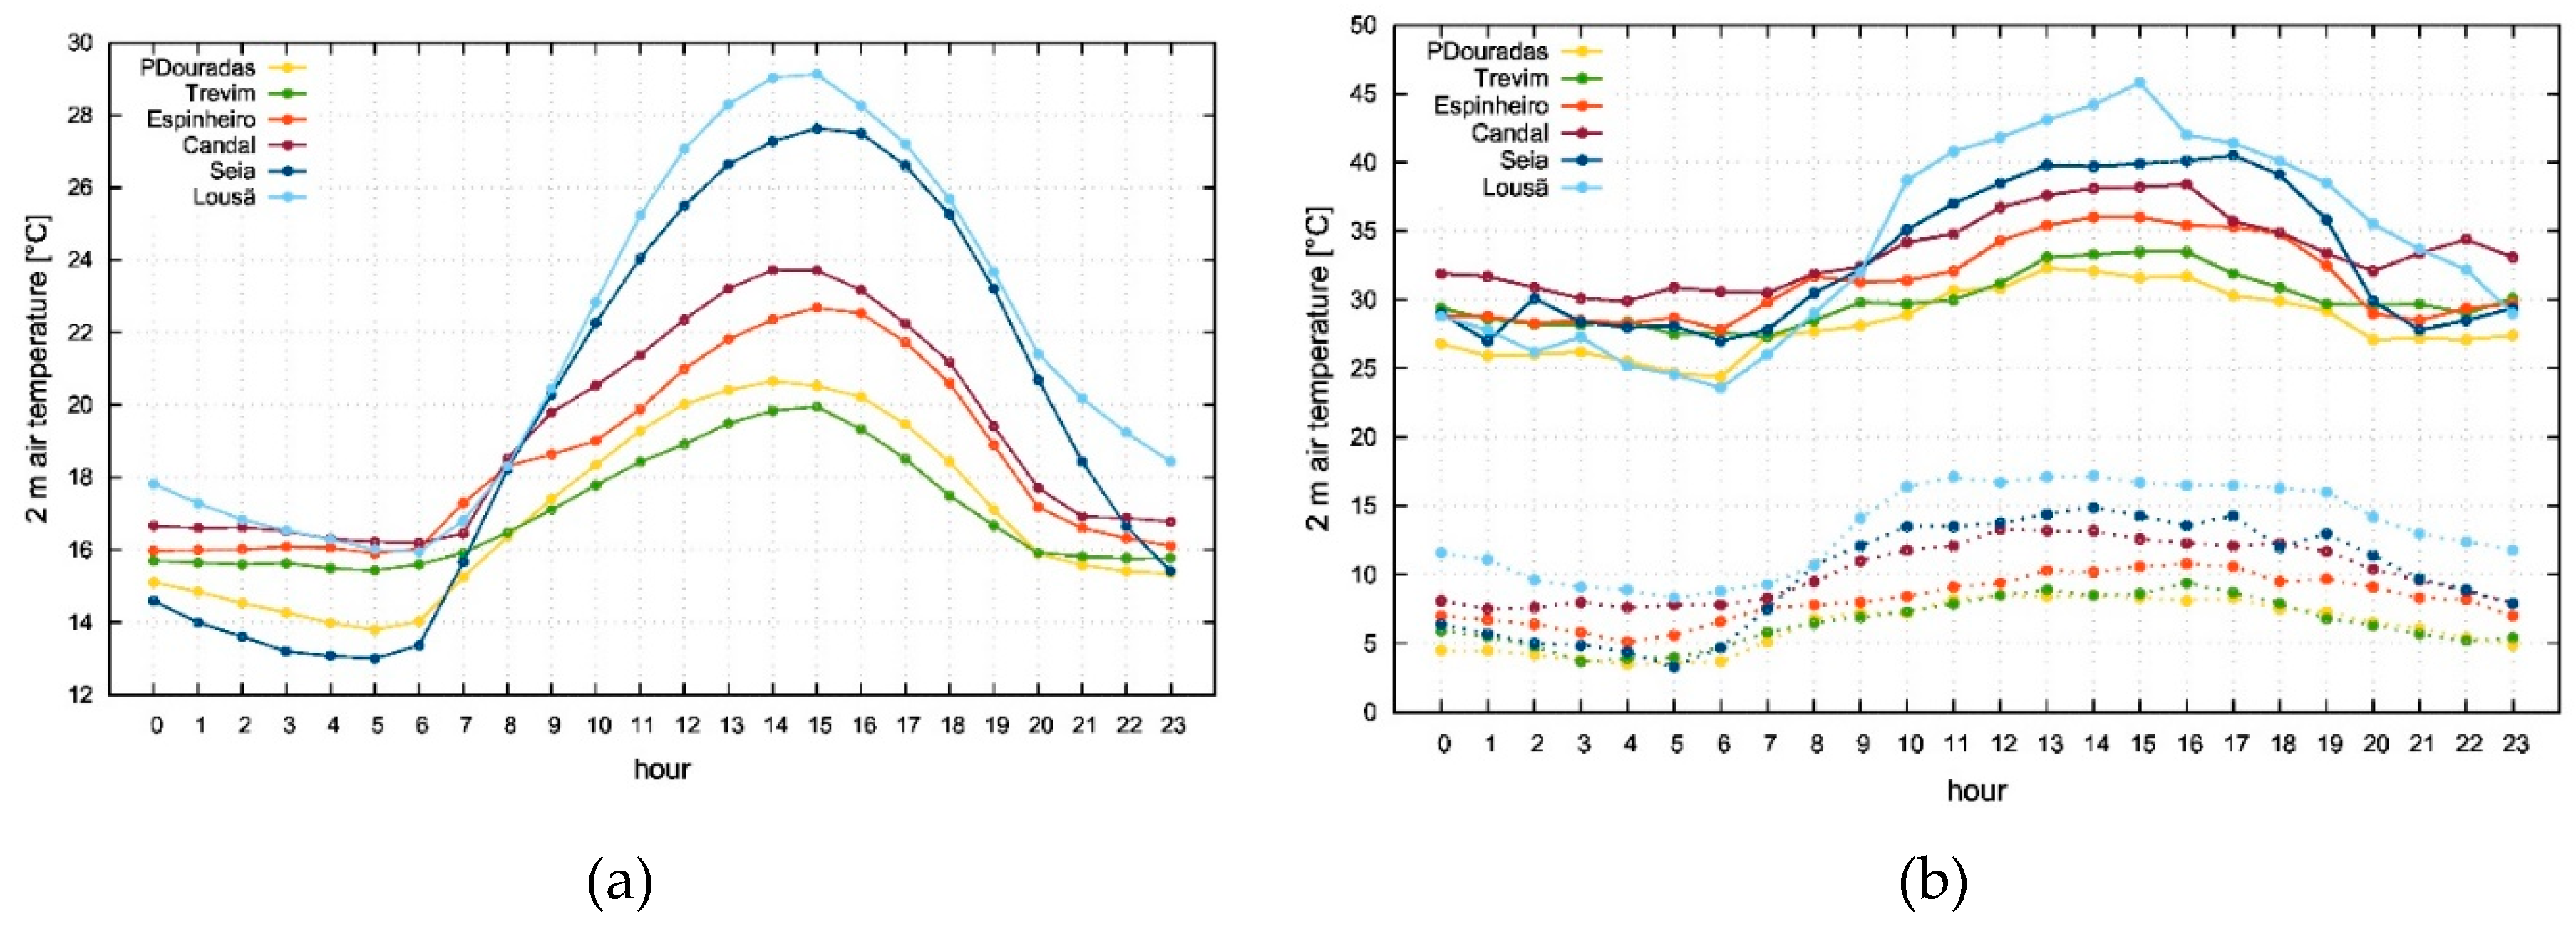
The daily cycle of the 2 m temperature (Figure 2) shows that it is more pronounced in the valley and decreases with elevation. During the daytime, the average values decrease with increasing altitude, except in the two AWS with highest elevations (Trevim - 1167 m and Penhas Douradas - 1380 m), which may be attributed to local effects. During the nighttime Seia shows the lowest 2 m temperature average of all the sites and Lousã has similar values to stations with elevations around 600-900 m. The lowest 2 m temperatures were observed in the stations with higher elevations and in Seia, with values around 4°C. The highest 2 m temperature values occurred in the afternoon, with the valley stations reaching at least 40°C and around 32-34°C at elevations above 1200 m. During the nighttime the highest values were observed in Candal (621 m asl).
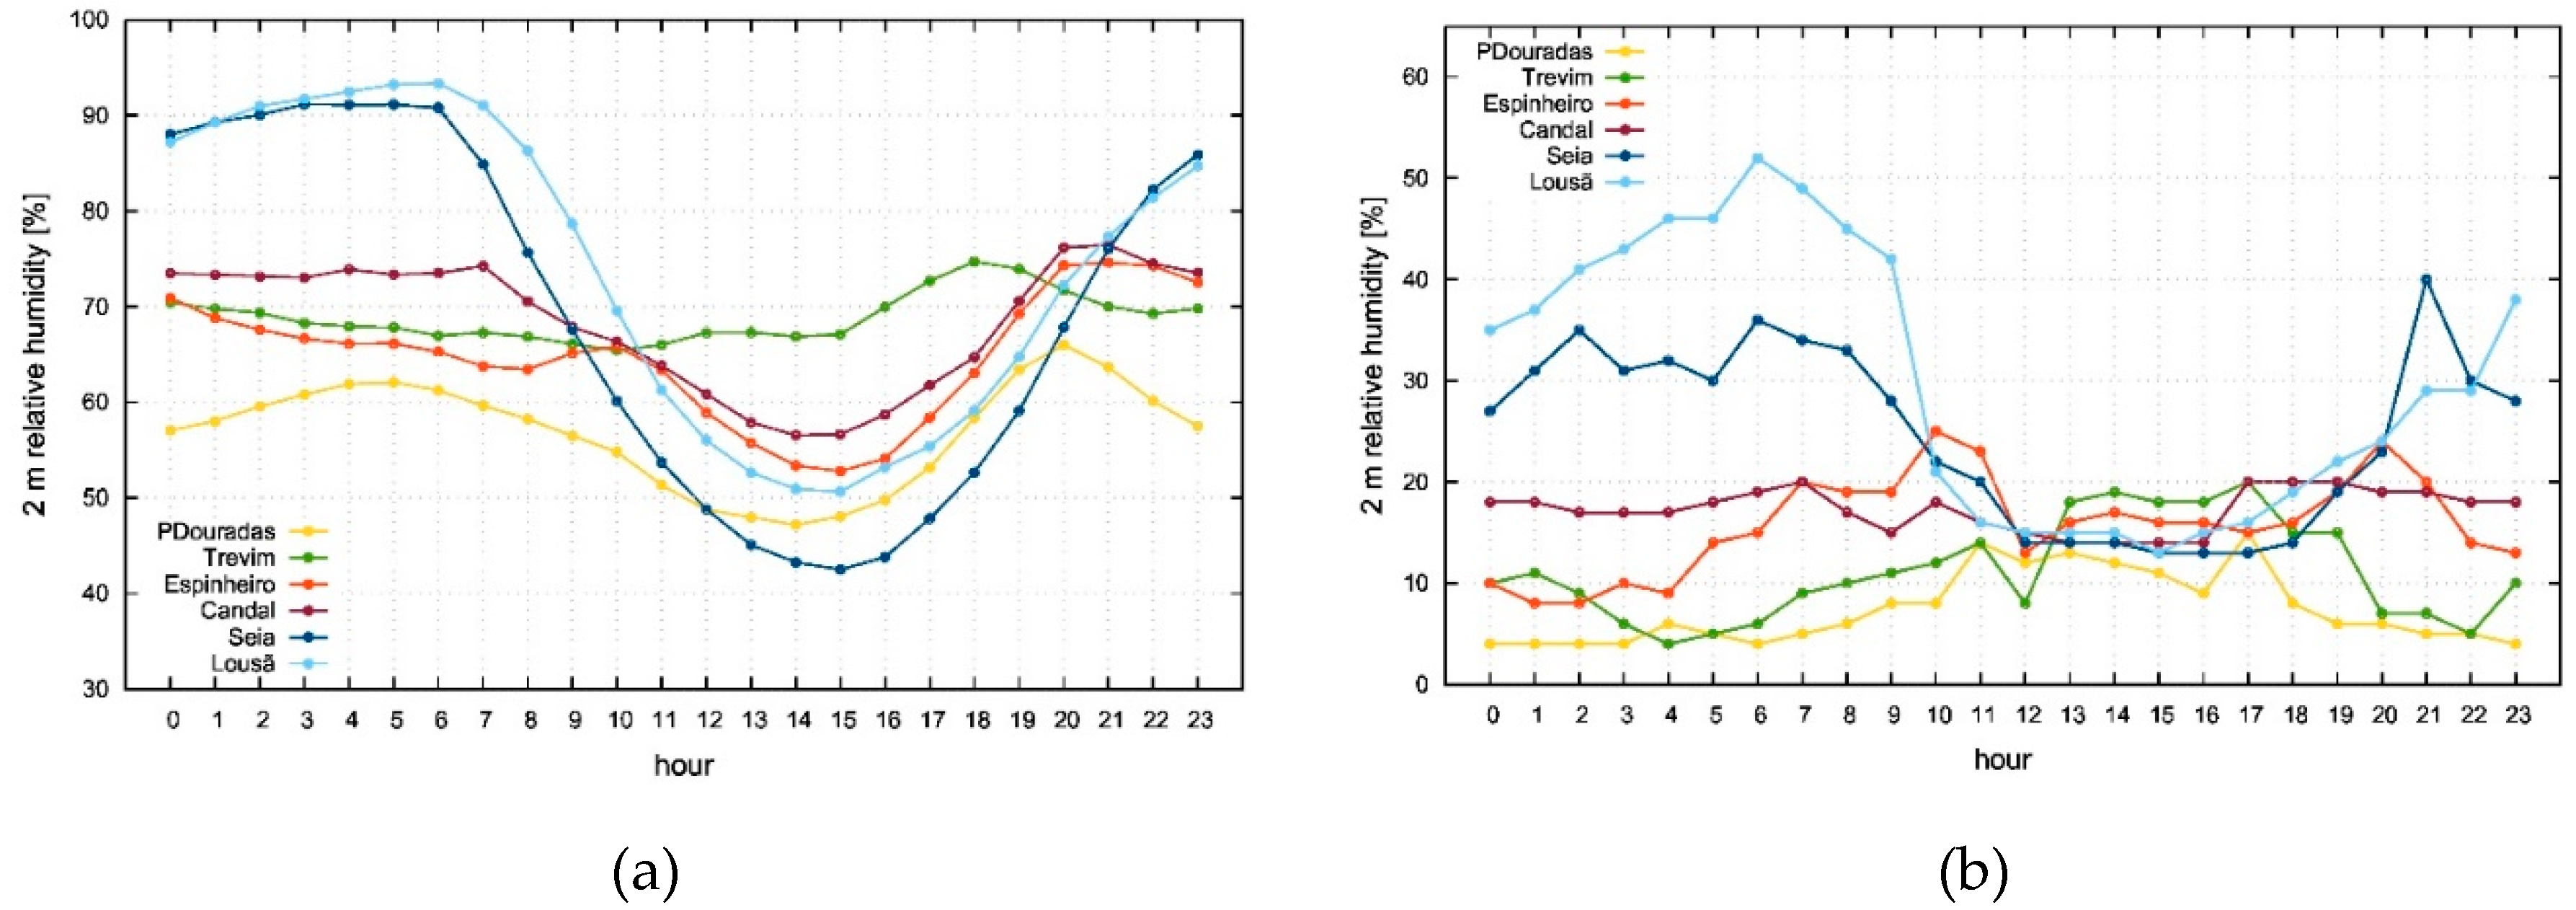
The daily cycle of the 2 m relative humidity (Figure 3) shows a large range in the valley stations. The average values are the highest during nighttime (around 90%) and the lowest 40-60% during daytime (40-60%), in the valley stations and in the highest elevation site (Penhas Douradas). In the remaining sites the range of the diurnal cycle typically decreases with increasing elevation. Overall, the average values of 2 m relative humidity decrease with increasing elevation during nighttime. During daytime the minimum values of relative humidity were similar in all sites, with values below 20%, while in the nighttime the lowest values were observed in the stations with the highest elevations, with observations as low as 5-10%.
The average values of 2 m dew point temperature (Figure S1) decrease as the altitude increases and the daily cycle of the AWS installed at higher elevations has a higher range than the one observed in the valley stations. The minimum values of 2 m dew point temperature were observed during the nighttime on the ridge, with values around -20°C above 1200 m asl. On the other hand, in these sites there is a sharp increase in the minimum values during daytime, which is likely due to the strong vertical mixing in the afternoon.
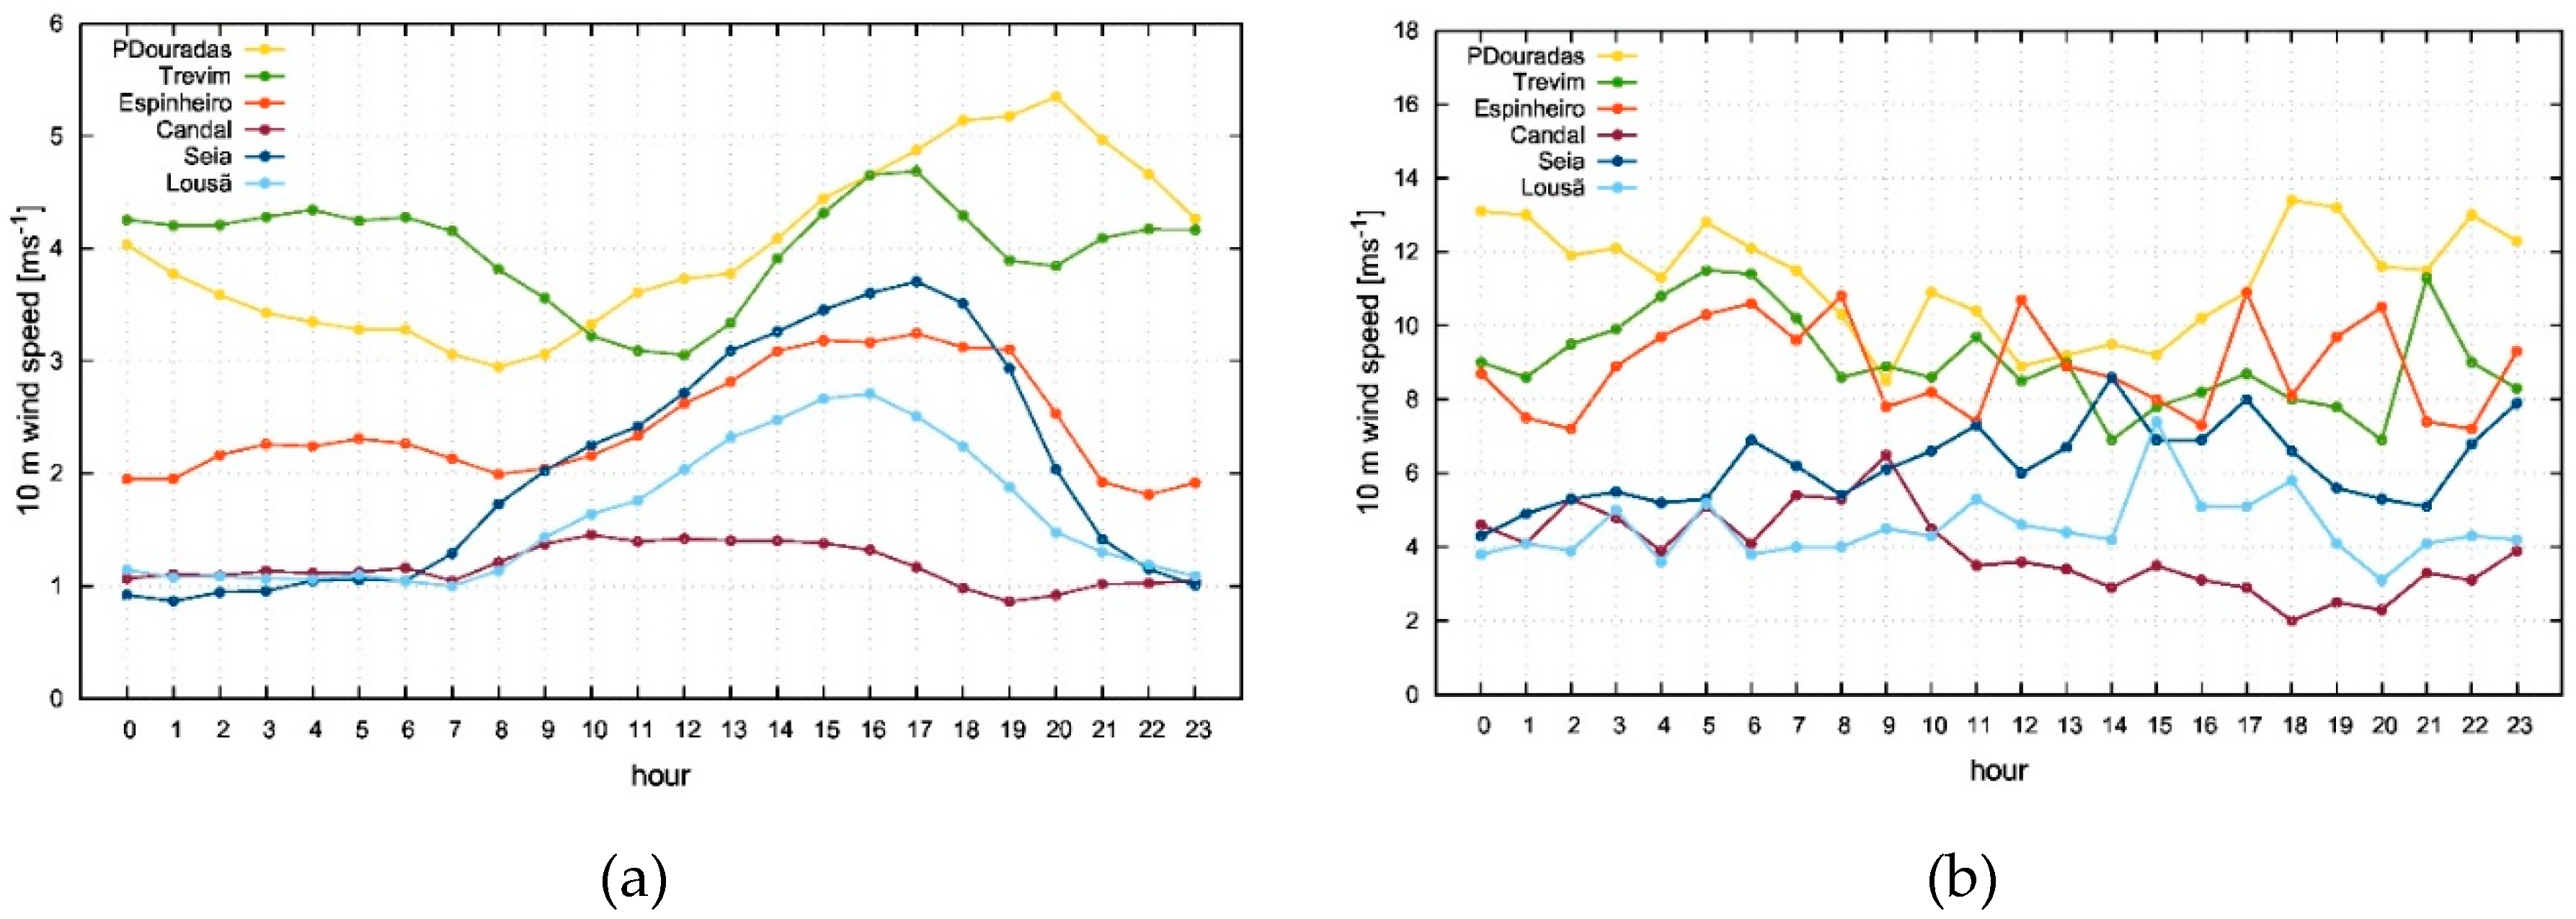
The daily cycle of the 10 m wind speed shows that it typically increases with altitude (Figure 4) and that the highest average values are observed in the afternoon, usually between 15 and 18 UTC. In Penhas Douradas there is a lag, hence the highest average values are observed in the evening. Given its location in a sheltered and narrow valley, Candal has the lowest average values of 10 m wind speed and does not show a discernible daily cycle. The minimum values of 10 m wind speed in all sites are below 1 m/s (not shown), while the maximum values are observed in the AWS on the ridge and upper slope. In Penhas Douradas and Trevim the maximum values are observed during nighttime, while the opposite is observed in the valley stations. Therefore, the average wind shear between the AWS in the valley and the ridge is higher during nighttime and lowest during daytime.
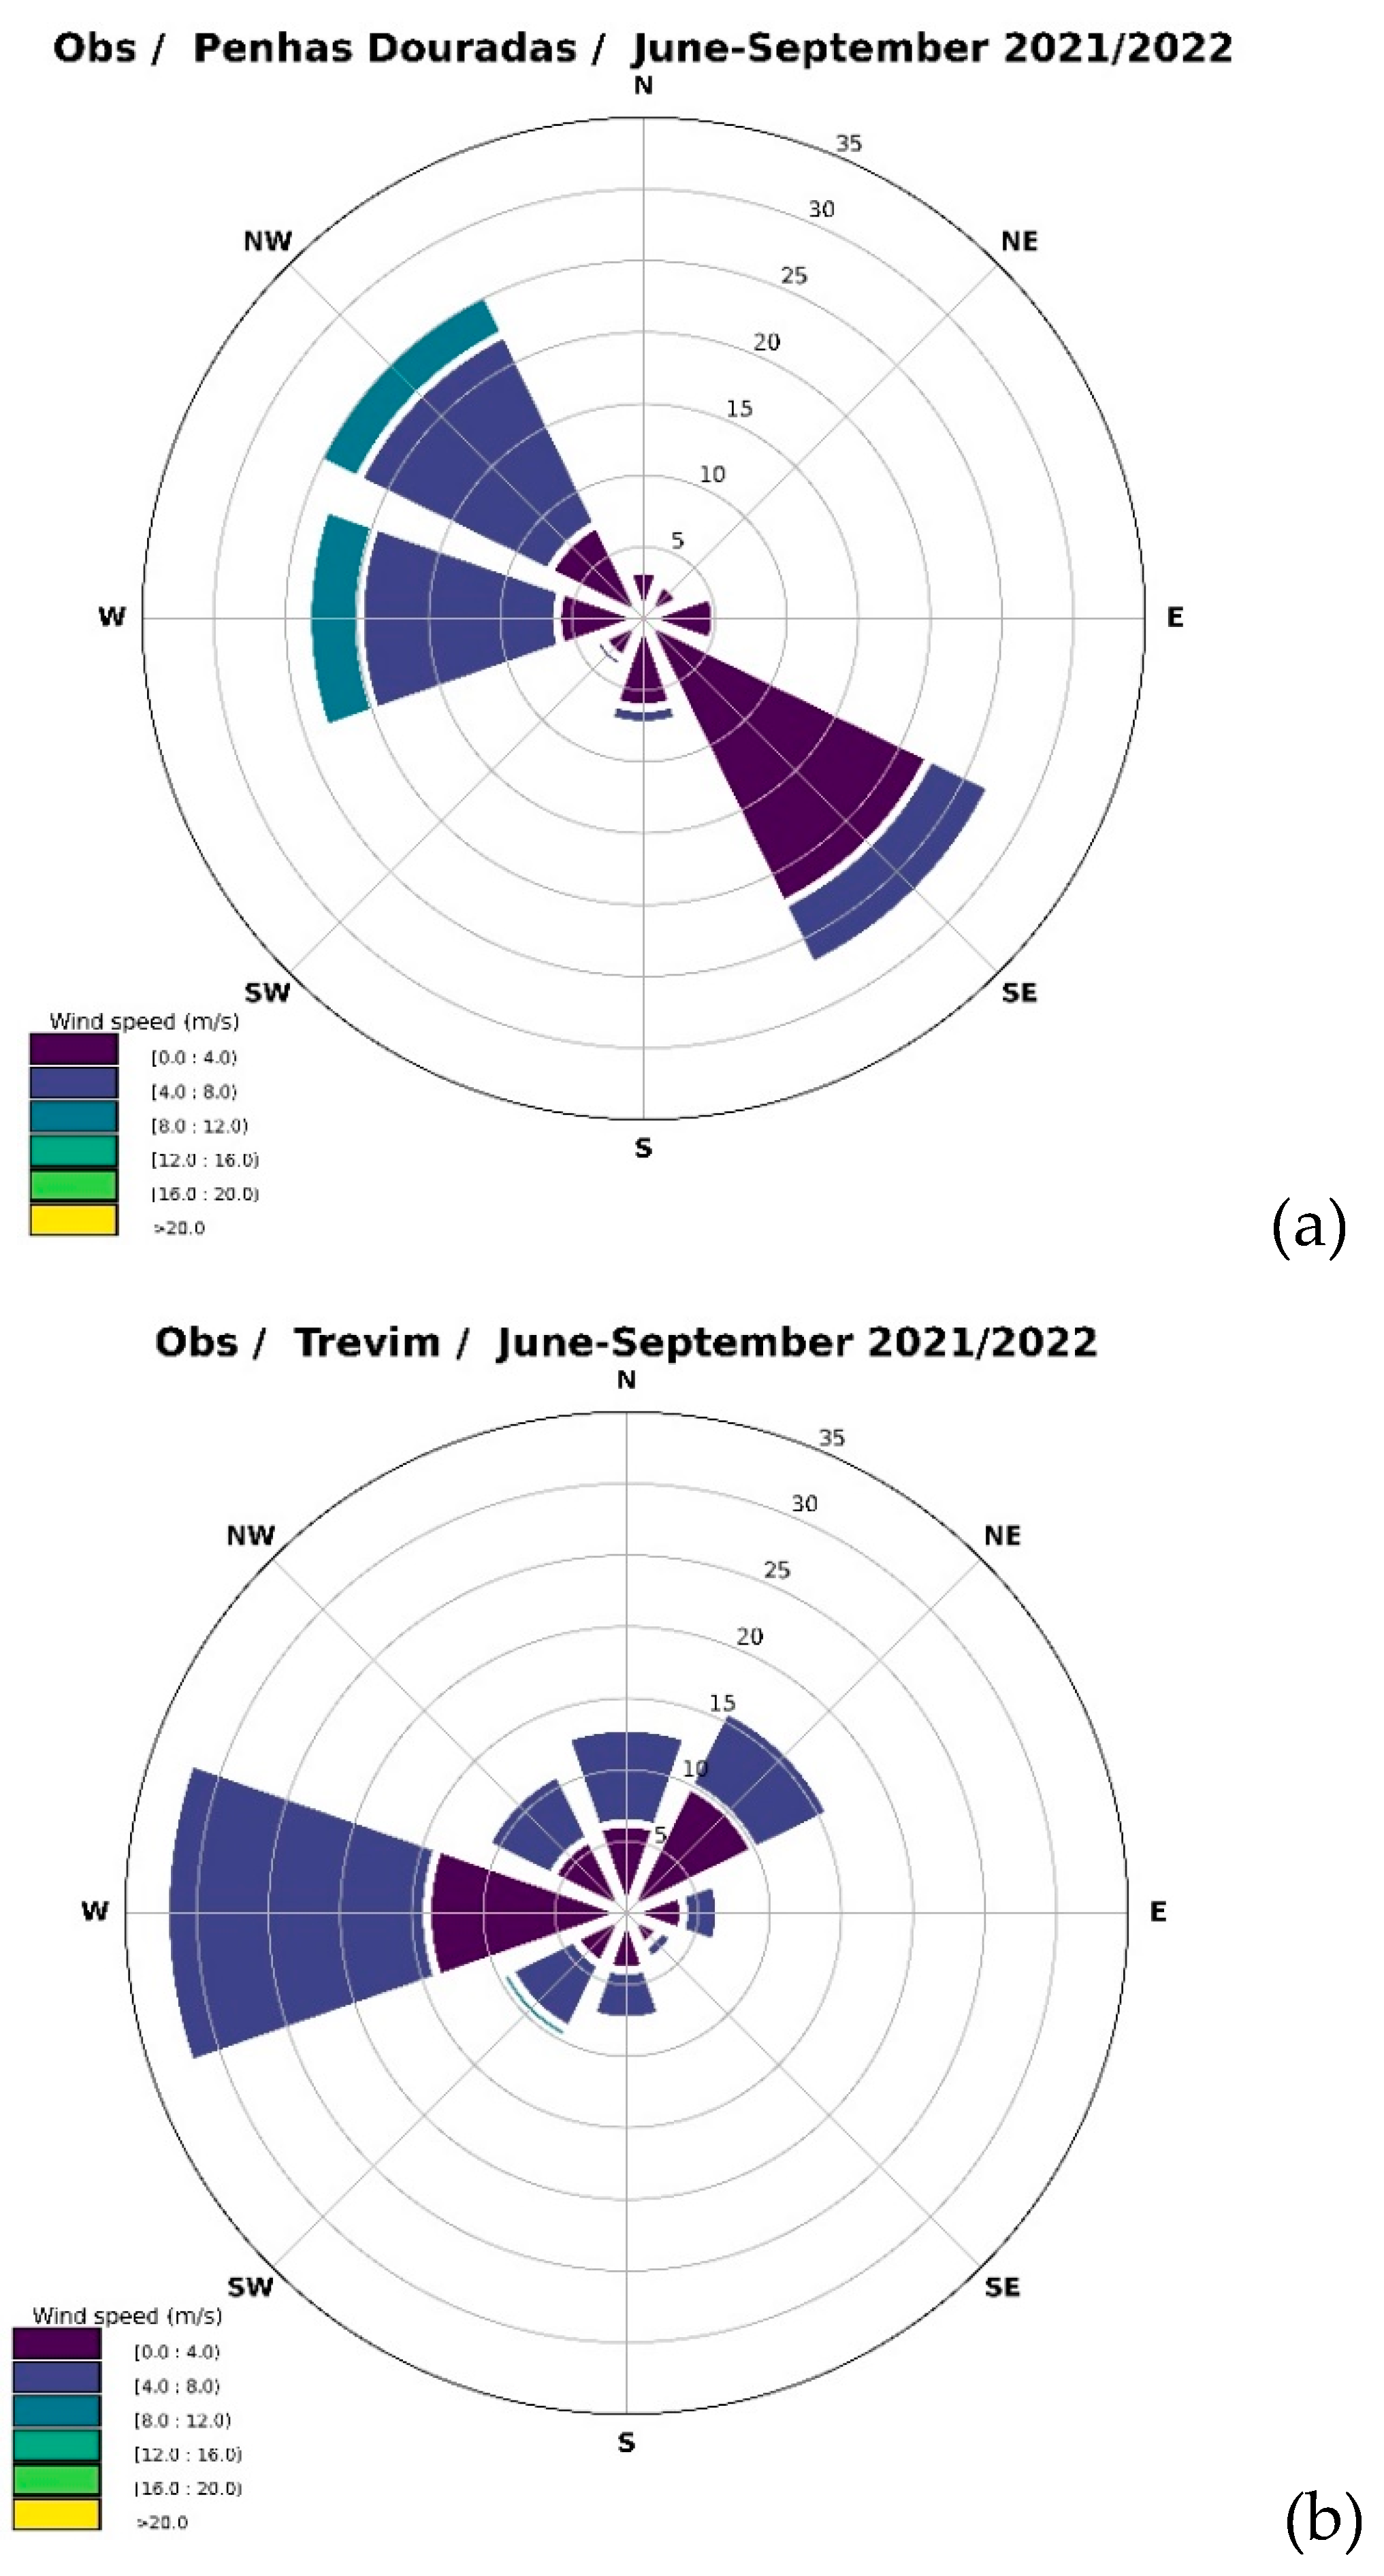
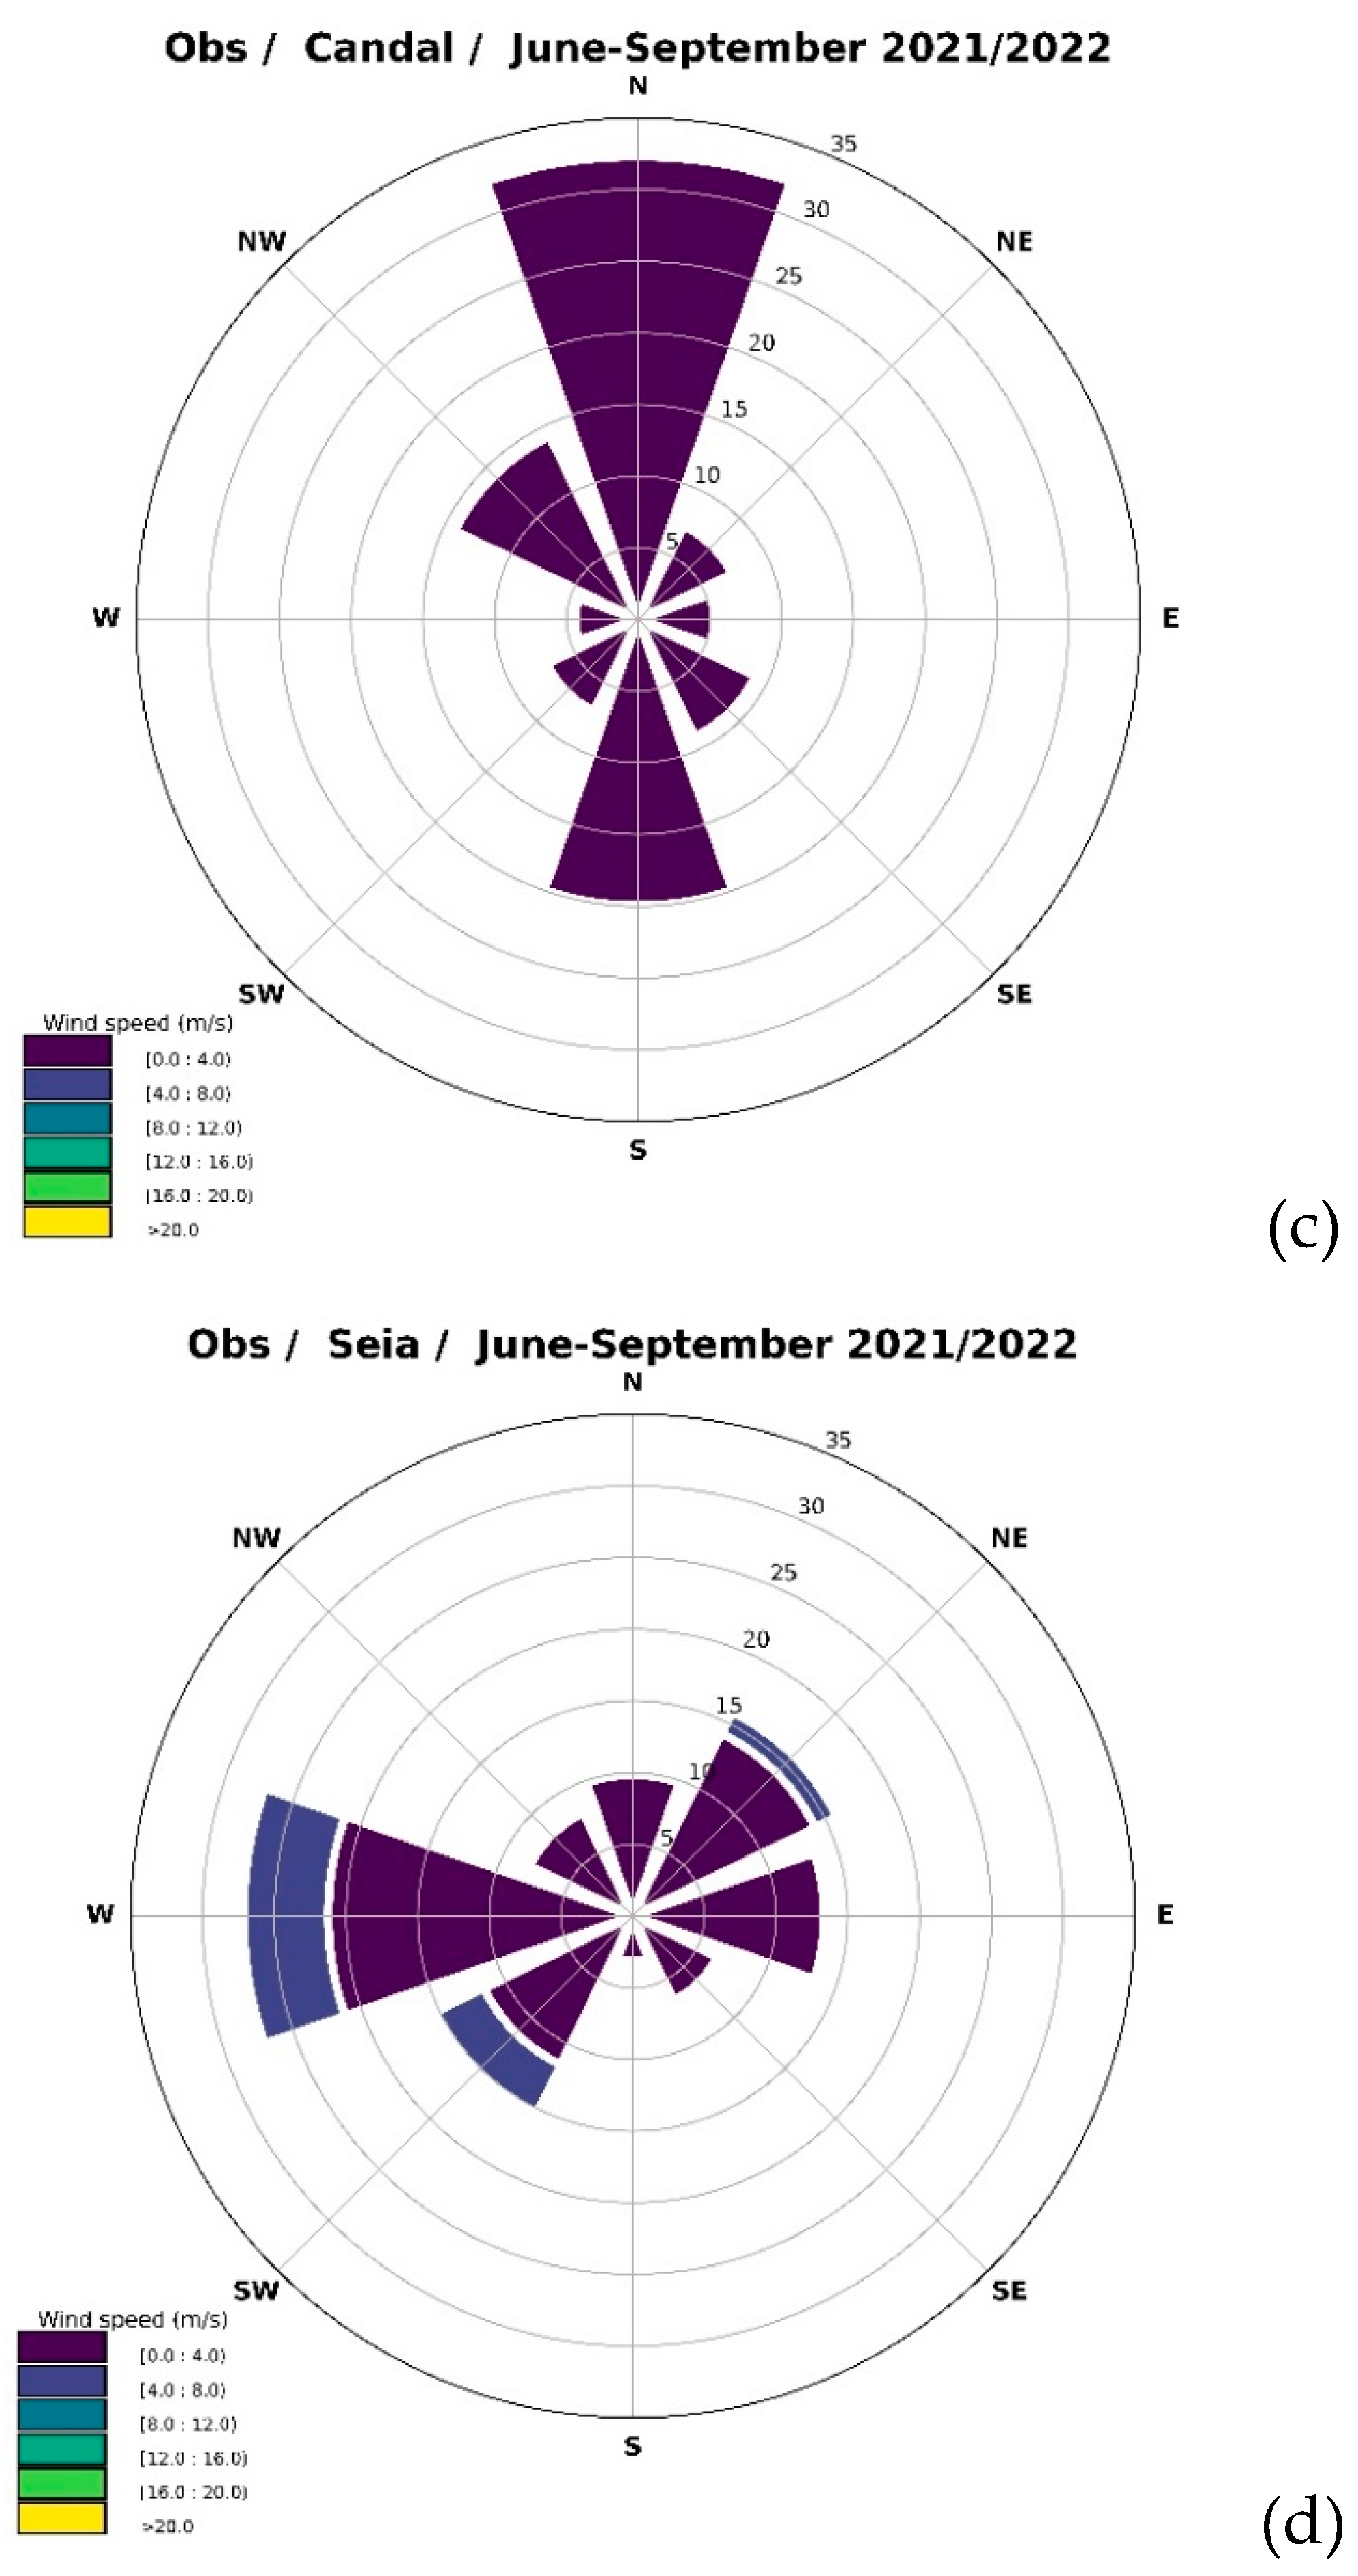
The wind roses (Figure 5), shown only in selected weather stations, provide an overview of the observed prevailing wind direction (and the associated wind speed) from the mountain ridge (Penhas Douradas and Trevim) to the valley (Seia). In the middle slope, Candal is also presented because of its unique location.
In Penhas Douradas the wind directions with the highest frequencies are west/northwest and southeast, while in Trevim are from the west and northeast. This result highlights the strong influence of the topography as both stations are located on the ridge. In Seia the wind speed is mainly below 4 m/s and the most frequent directions are west/southwest, which shows that the flow is predominantly along the main orientation of the Lousã/Estrela mountain range (southwest/northeast). In Candal the wind speed is the lowest and there is a high frequency of northern/southern winds, which may be evidence of a thermal circulation (slope winds). The other two directions with the highest frequencies are parallel to the orientation of the narrow valley where the AWS is installed.
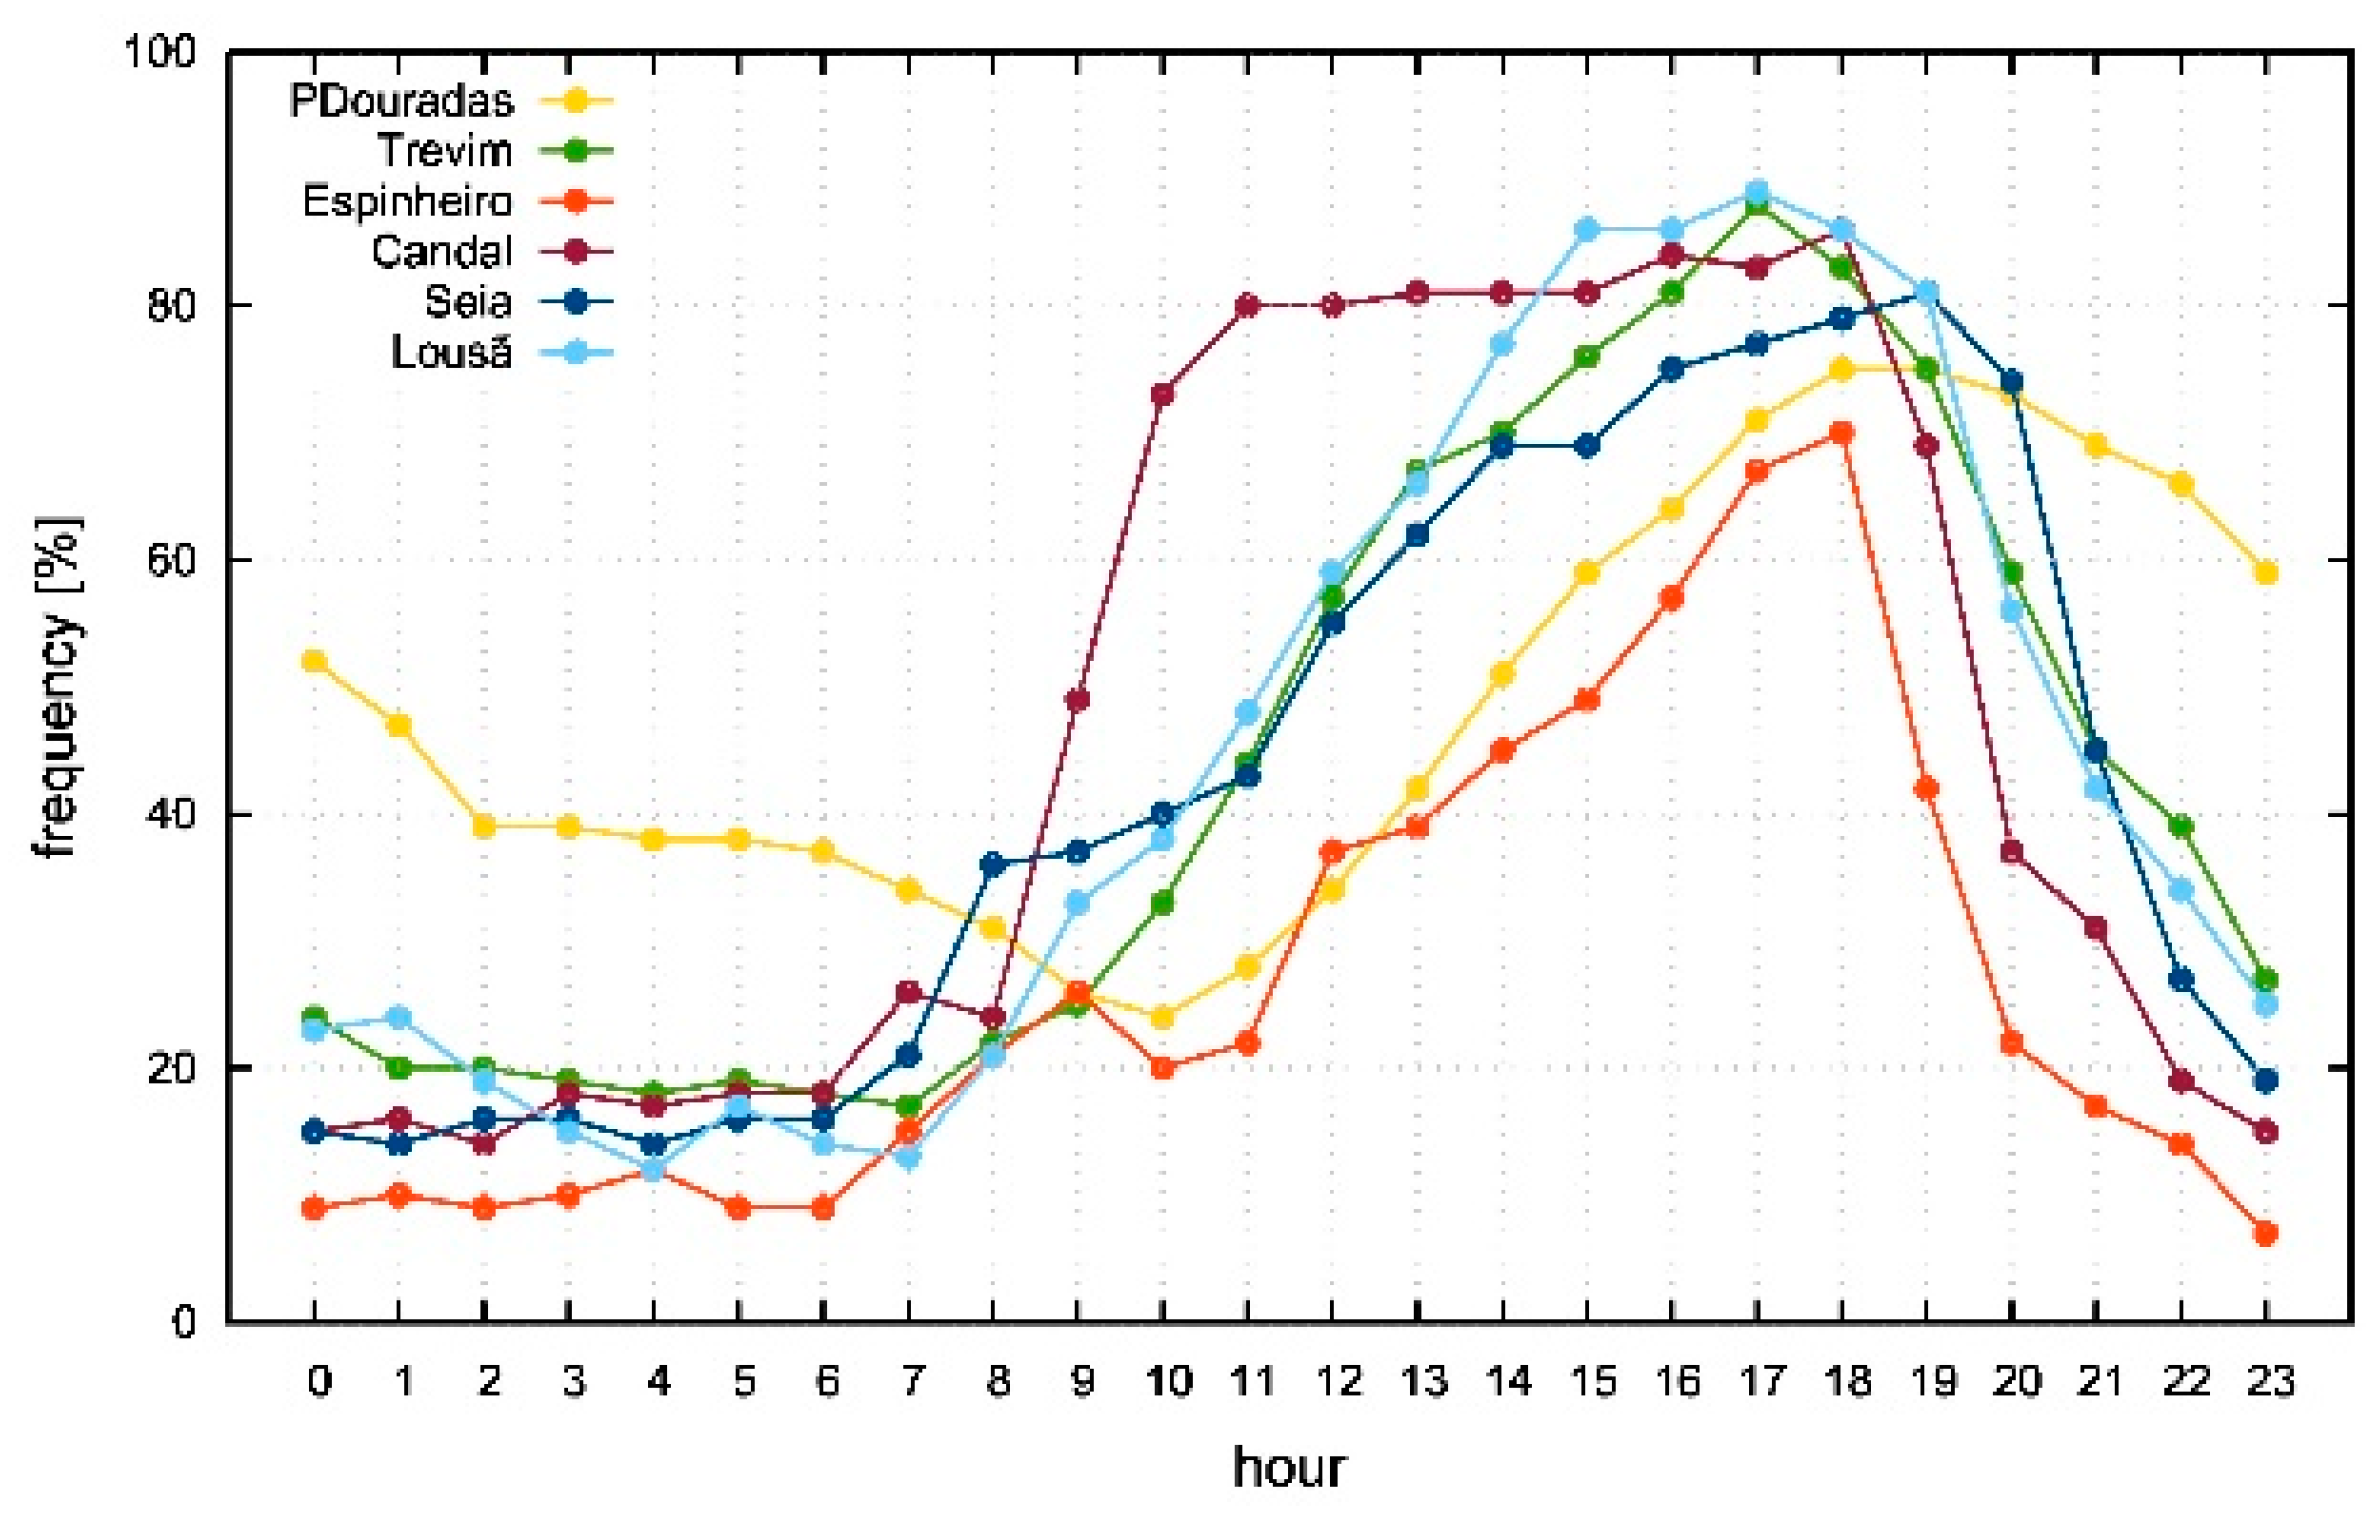
In summer the wind breeze is a prevailing feature of the weather in mainland Portugal and Figure S2 shows an example of its progression inland during the afternoon. The effect of this mesoscale circulation is seen in the daily cycle of the wind direction (Figure 6), namely when assessing the frequency of westerly and non-westerly winds. In all AWS, except Penhas Douradas, westerly winds have a frequency below 30% during the nighttime. This frequency increases during the day, with values reaching 70-90% in the period 16-18 UTC, after which they drop rapidly in the evening.
Even though most of the sites exhibit a similar pattern, Candal shows a faster transition of the prevailing wind direction during the morning, which leads to a frequency of westerly winds around 80% from 10 UTC onwards. In Penhas Douradas the daily cycle is the least pronounced, as the frequency of westerly winds is already high during nighttime, around 40-50%. This site also exhibits a lag, when compared to the other AWS, regarding the timing of the increase of the frequency of westerly winds in the morning.
3.2 Vertical variability: timeseries overview
From the hourly observed data in the AWS, the timeseries of the differences in the meteorological variables were computed in the nighttime period. A filter was applied to the data as only dry days were considered, according to the definition in section 2.3. The differences are computed for distinct layers, starting from the two stations located at higher elevations down to the valley. The stations used are Penhas Douradas and the ones installed in the Lousã region. In spite Lousã and Seia regions are 60 km apart, as the observed weather conditions are similar in the whole area, the weather station in Espinheiro is also used to increase the number of vertical layers. Given that Seia is in a valley and the data from this AWS showed that a strong surface inversion is a common feature, this site was disregarded in this section.
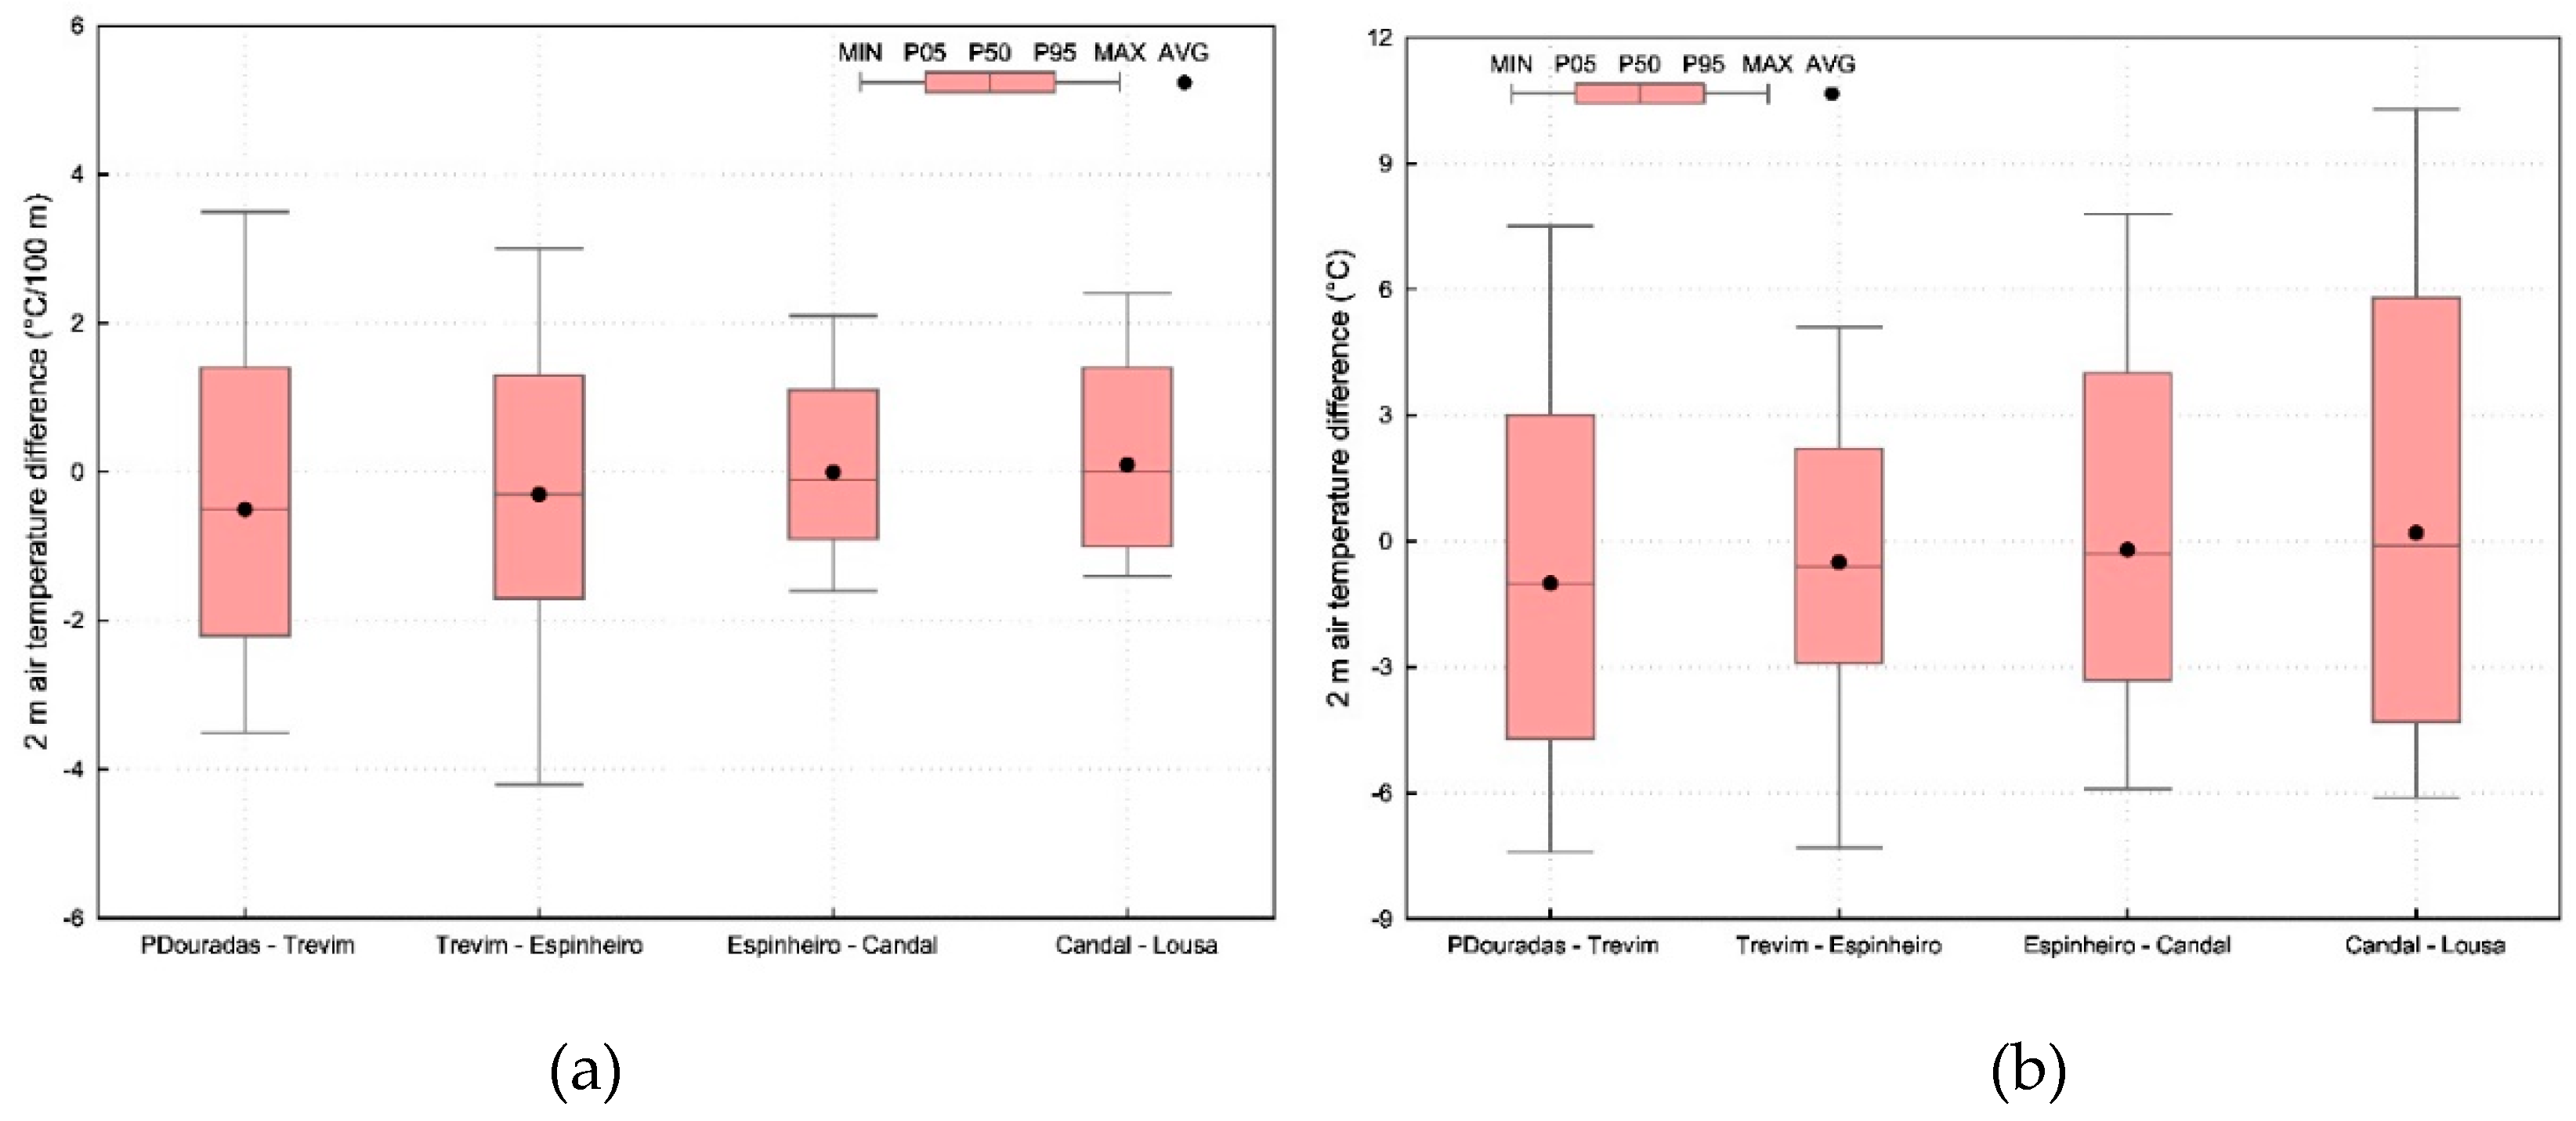
The vertical variability in the Lousã/Seia region is assessed by the vertical gradient and the difference between the observed data at four different layers. In the case of the 2 m temperature, in 90% of the cases the differences between the sites with an altitude above 995 m asl are, approximately, comprised between +/-2°C/100 m, but the extreme values may exceed +/-3.5°C/100 m (Figure 7a). In the layers with AWS with elevations below 995 m, the vertical gradient is smaller and the difference between the extremes of the distribution and the percentiles 5 and 95 is lower. The differences in the 2 m temperature may exceed +/-5°C in all the layers (Figure 7b). Considering all the layers, the maximum difference observed was recorded between Candal and Lousã, with a value exceeding 9°C.
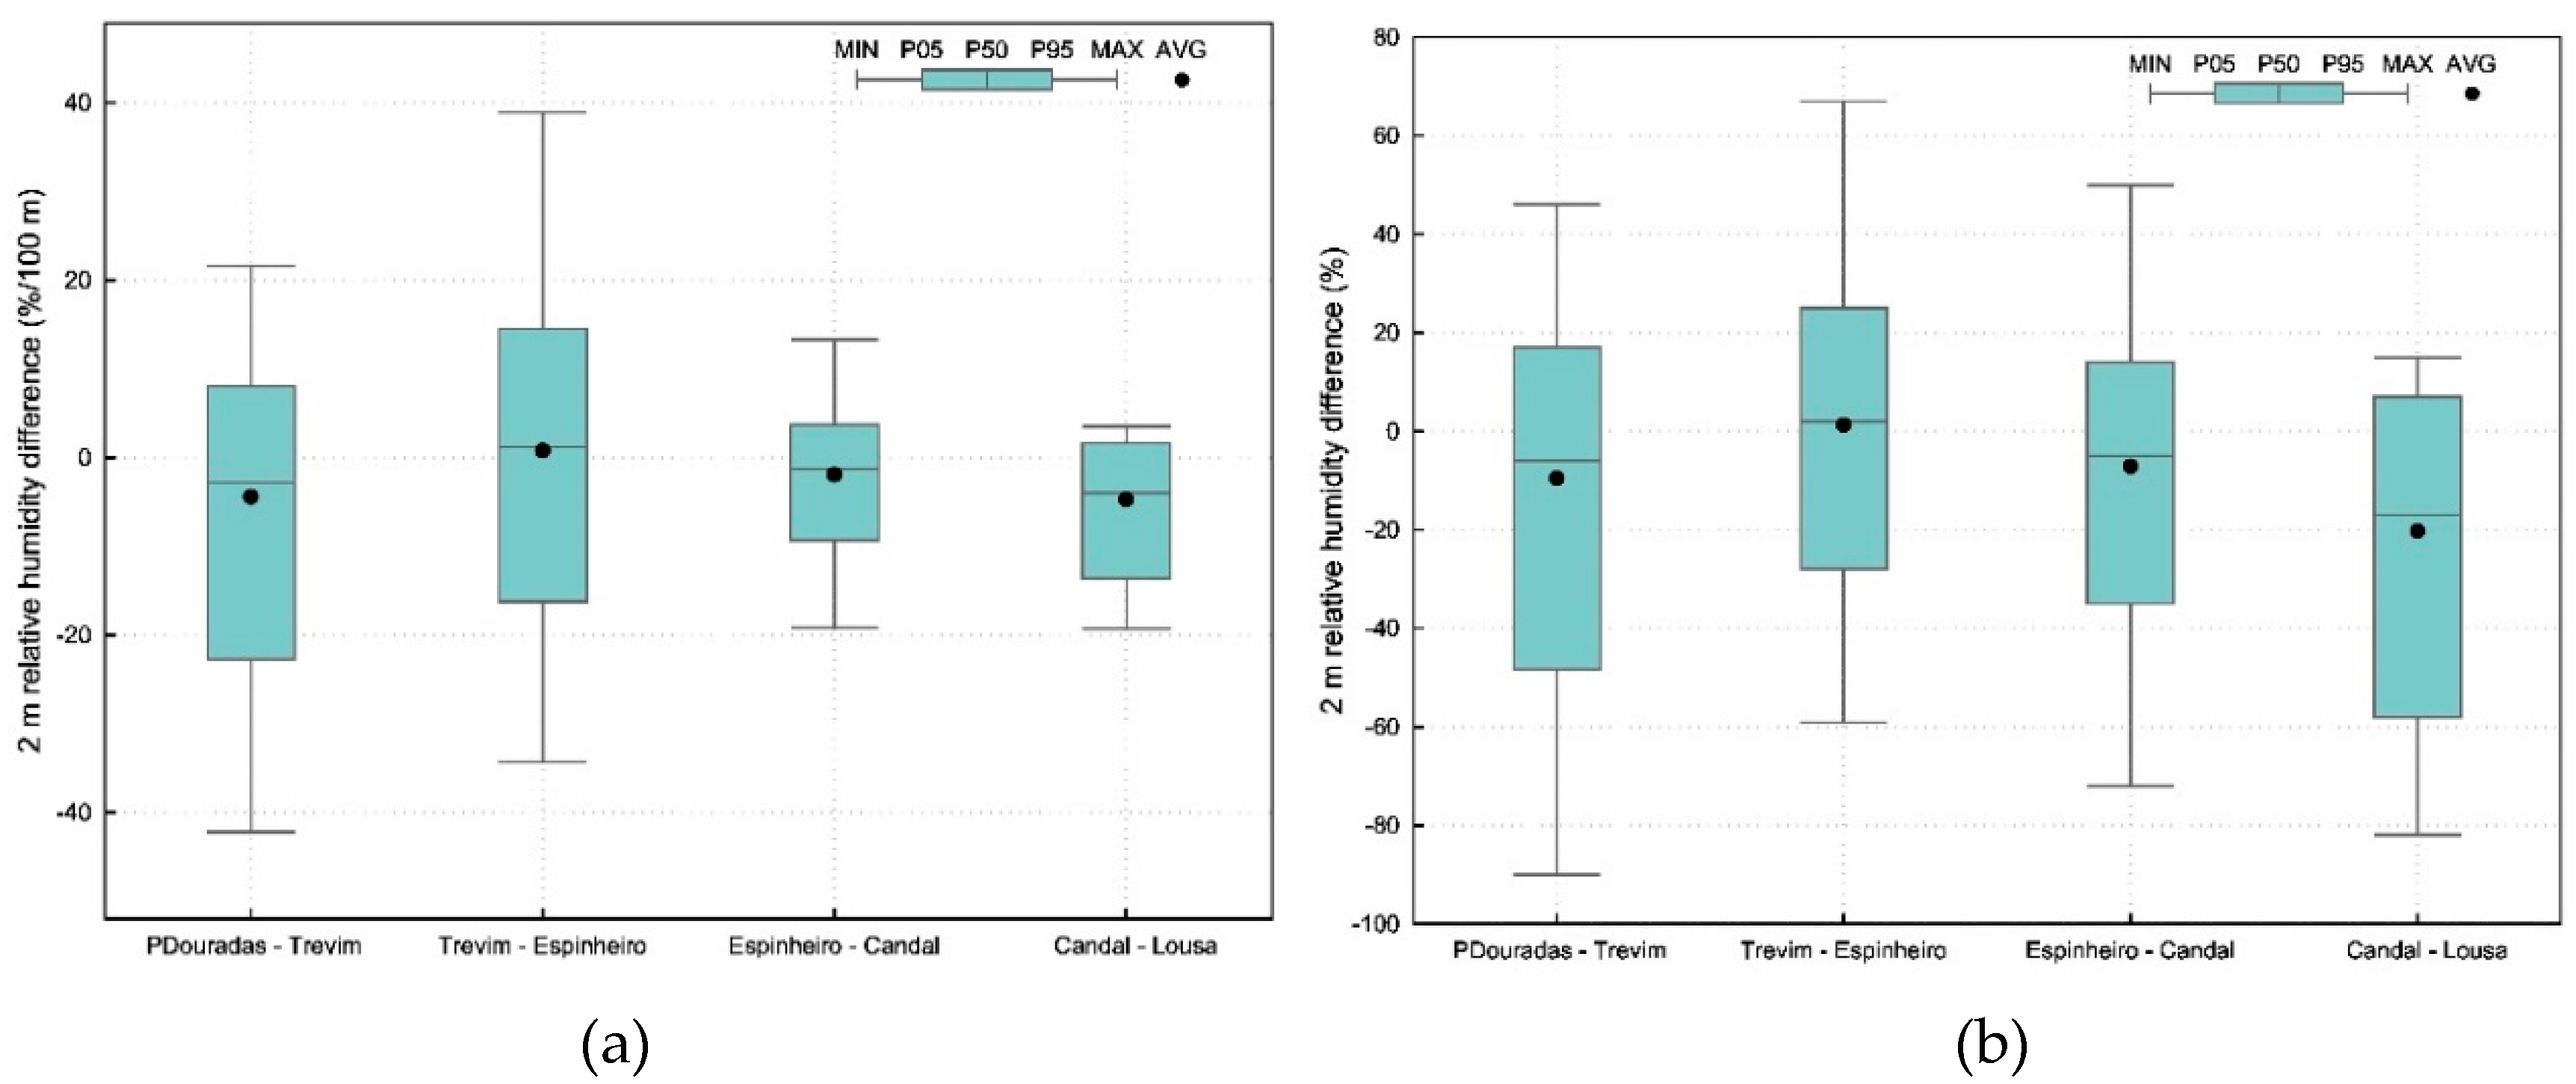
The variability of the 2 m relative humidity is higher in the layers with weather stations above 995 m asl, when compared to the lower ones (Figure 8a). At higher levels the vertical gradient may reach -40%/100 m, while in the layer Trevim-Espinheiro it may attain values close to 40%/100 m. The layer Candal-Lousã is the only one where positive values of the vertical gradient are the least frequent. Overall, the differences between the stations may exceed -60% and +40% (Figure 8b), except for the lower layer, as the difference in 2 m relative humidity in Candal does not exceed a value 18% above the one observed in Lousã.
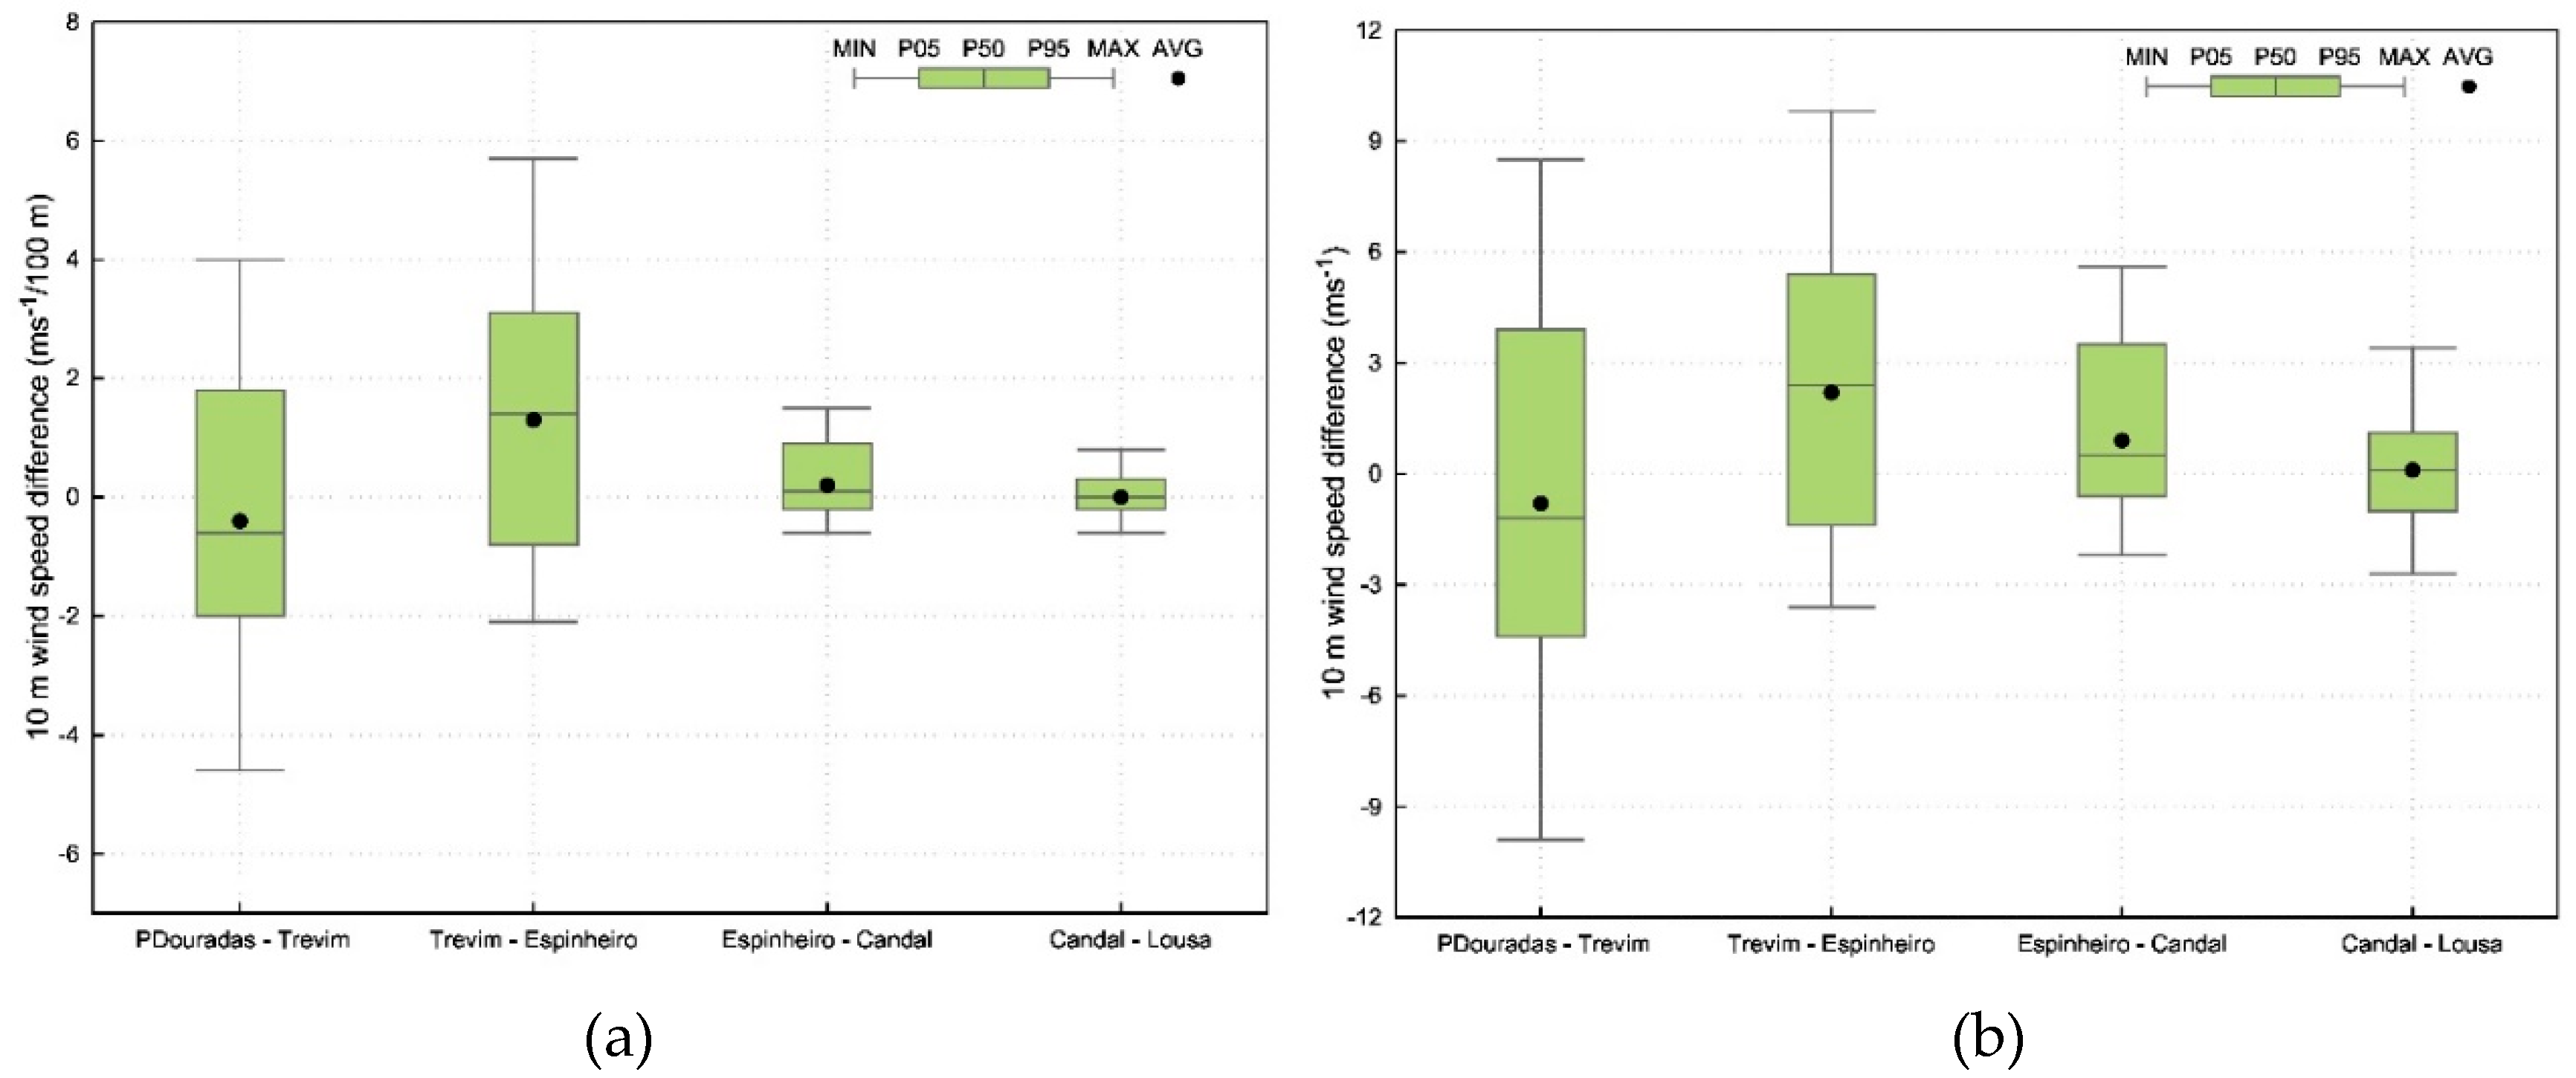
The vertical variability of the 10 m wind speed drops significantly in the lower two layers and the distributions are less symmetrical than in the other variables (Figure 9a). While the wind shear between Penhas Douradas and Trevim is comprised between +/-9 m/s (Figure 9b), positive values are more frequent in the layer immediately below. In the lowest layer the wind shear is the smallest, with the extremes of the distribution comprised between +/-3 m/s. However, in the case of the 10 m wind gust (not shown), which is likely a preferable measure of the turbulence between Candal and Lousã in strong downslope wind events, one finds that it may reach values up to 7 m/s.
A thorough assessment of the timeseries of the differences in the 2 m temperature and relative humidity and 10 m wind speed/gusts (Figures S3–S6), along with model data from ECMWF-HRES (not shown), shows that large variability in the aforementioned layers occurs in preferred weather conditions. Some of the most significant conclusions are summarized below.
a)
Between Penhas Douradas (1380 m asl) and Trevim (1167 m asl) there were seven events with a 2 m temperature difference equal or above 5°C. These events occurred with a west/northwesterly flow in both AWS and positive differences in the 10 m wind speed. In these periods, the values of 2 m relative humidity in Penhas Douradas were frequently 40% lower than in Trevim and the extreme minimum differences reached -80%.
b)
Between Penhas Douradas and Trevim there were 16 events with a 2 m temperature difference equal to or below -5°C. In these periods the wind direction was mainly from the east/southeast aloft and east/northeast in Trevim. The difference in the 10 m wind speed was usually negative, which implies higher values at the lower elevation (Trevim). Given the orientation of the mountain ridge, a strong interaction between the flow and the topography is likely to play a relevant role in such conditions.
c)
While the data between Trevim (1167 m asl) and Espinheiro (995 m asl) shows a large dispersion, negative differences in the 10 m wind speed only occurred with an east/northeast in Trevim and a southeasterly wind in Espinheiro. The biggest differences in 2 m temperature occurred with south/southwesterly or east/northeasterly winds at both sites. In the latter case large negative differences in the 2 m relative humidity were also observed.
d)
Despite the large dispersion, the data from Espinheiro (995 m asl) and Candal (621 m asl) shows that positive differences in the 2 m temperature and large negative differences in the 2 m relative humidity (over -40%) occurred with an east/southeasterly flow at the site aloft.
e)
Large positive differences in the 2 m temperature between Candal (621 m asl) and Lousã (195 m asl) and large negative differences in the 2 m relative humidity (lower or equal to -40%) occurred with east/southeasterly winds in Candal. In these periods the wind direction was from the west/northwest in Lousã. Negative differences in the 2 m temperature were observed with northwesterly winds in Candal.
f)
In Candal the 10 m wind speed may be higher than in Lousã and this was observed either from the W/NW or E/SE directions, which may suggest channelling in the narrow valley. On some occasions the 10 m wind speed is below 2 m/s in both Candal and Lousã, but the 10 m wind gusts in Candal may exceed by 6 m/s the values observed in the valley. In these events the wind direction is from the E/SE in Candal, which suggest that strong downslope winds do not always reach the valley.
g)
Differences in the 2 m relative humidity larger than -60% were observed in 15 events in Candal/Lousã and the frequency of temperature inversions was 63%. In the Seia region, the frequency of temperature inversions between the valley station and Espinheiro was higher, at 88%. Both results highlight the large vertical variability between valley areas and the medium slope.
h)
The frequency of temperature inversions in the upper slope was 50% when using data from Penhas Douradas and Trevim. If a deeper layer is chosen (Penhas Douradas-Espinheiro), the frequency drops to 23%. Finally, the frequency of temperature inversion in all the layers between Penhas Douradas and Candal is lower, at 12%.
i)
Large negative differences in the 2 m relative humidity (more than -40%) were observed in all the three layers studied between Penhas Douradas and Candal. When these large differences were observed in the two upper layers (Penhas Douradas/Trevim and Trevim/Espinheiro) a strong vertical gradient of the potential temperature was detected in the 880-940 hPa layer. When the large negative difference in 2 m relative humidity was observed between Espinheiro and Candal, the strong vertical gradient was usually around 930-960 hPa. When dry air is detected as low as in Candal, which is taken by considering the threshold of 2°C in the 2 m dew point temperature at this site, an inversion was present at levels below 960 hPa level. Model data tends to overestimate these low values of 2 m dew point temperature in Candal (not shown).

4. Events with large vertical variability

In this section a description of four selected events with large vertical variability is given. Three of the events occurred in 2021 and the fourth covers a period of 15 days in July 2022, in which there were fast changes in the vertical variability of the meteorological variables. The events in 2021 include two episodes with temperature inversions that led to distinct weather conditions in the medium slope. The third event provides an example of downslope windstorm that occurred on 21 May 2022, which is therefore outside the traditional fire season period in Portugal. However, given that recent research has shown that in the last two decades there has been an earlier onset of fire activity and an increased fire risk in late spring [43], this study considers this event to be relevant enough to be included in this section.

4.1 Maritime inversion, 19-22 July 2021

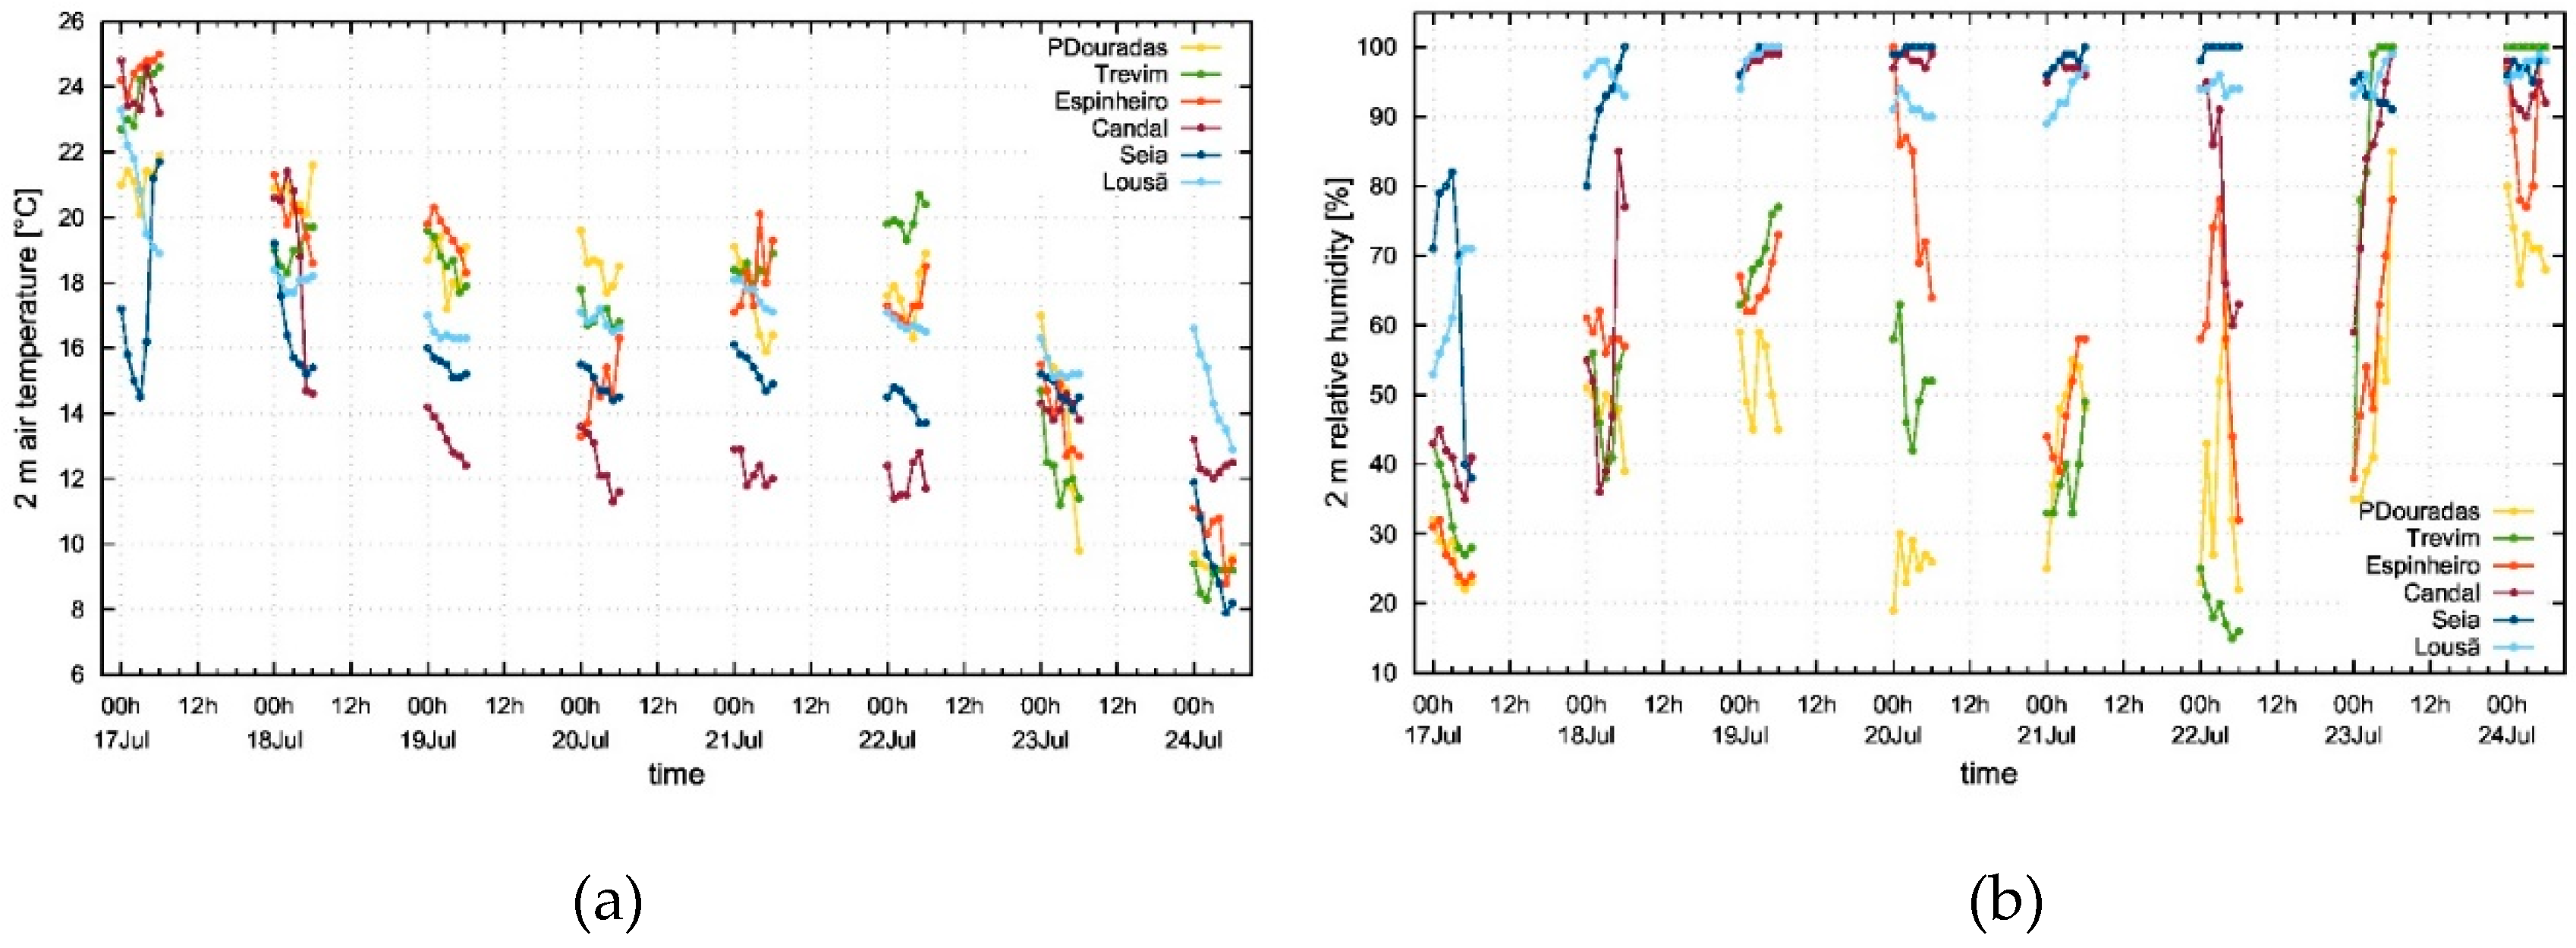
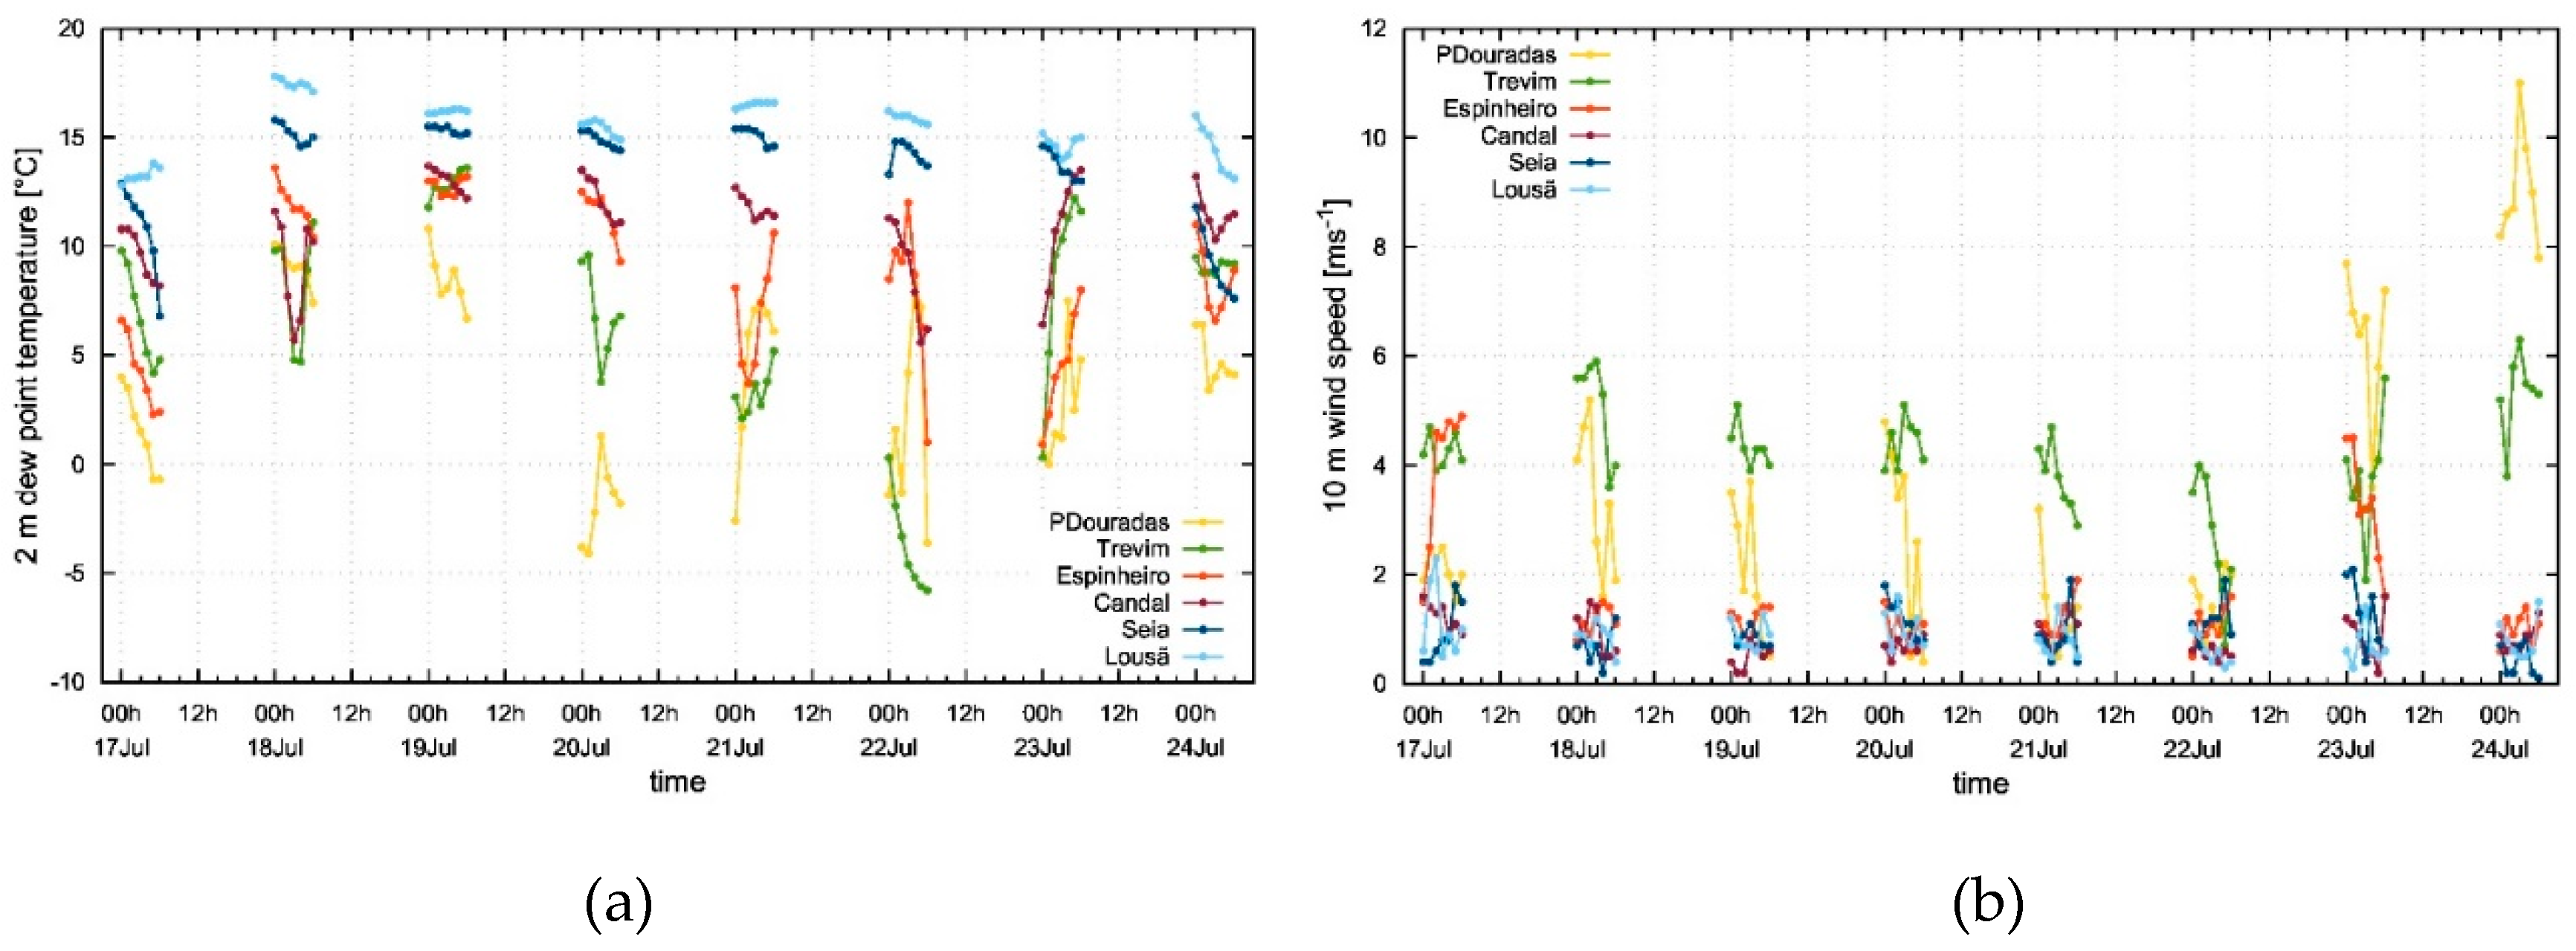
On 17 July 2021 the nighttime 2 m temperature exceeded 20°C (Figure 10a) and the values of 2 m relative humidity dropped to values close to 20-35% (Figure 10b) in the AWS in the medium and upper slope of the Lousã/Estrela mountain range. In the Seia valley there was a surface inversion, as the 2 m temperature was close to 15°C, with values of 2 m relative humidity around 80%. The winds were light at all sites (Figure 11b) and the dew point decreased as elevation increased (Figure 11a). On 18 July 2021, the 2 m temperature in Candal (621 m asl) was similar to the ones observed aloft, but at 5 am it dropped to 14°C, below the values observed in Seia. The 2 m relative humidity increased from 50% to 80% and the 10 m winds were everywhere below 2 m/s, except above 1100 m.
In the following four nights (19-22 July), the 2 m temperature in Candal was the lowest in all the AWS and the 2 m relative humidity reached values above 90% in Candal and in the valley sites. Above Candal the air was warmer and drier, with values of 2 m relative humidity dropping below 20% on 22 July 2021 in Trevim. In Espinheiro (995 m asl), the 2 m relative humidity ranged between 30 and 100% and the 2 m dew point briefly dropped close to 0°C, which is similar to what was being observed aloft. In this period the 10 m wind was light in all the sites.
On 23 July 2021 there was a change in the vertical profile of the meteorological variables, with values of 2 m temperature close to 12-16°C in all the AWS. The 2 m relative humidity was initially around 40% above 900 m, but increased during the nighttime to close to 80%. The 10 m wind speed increased on sites above 1000 m, but remained light below this altitude. By 24 July 2021 this event was over as the temperature profile became closer to what is typically observed.
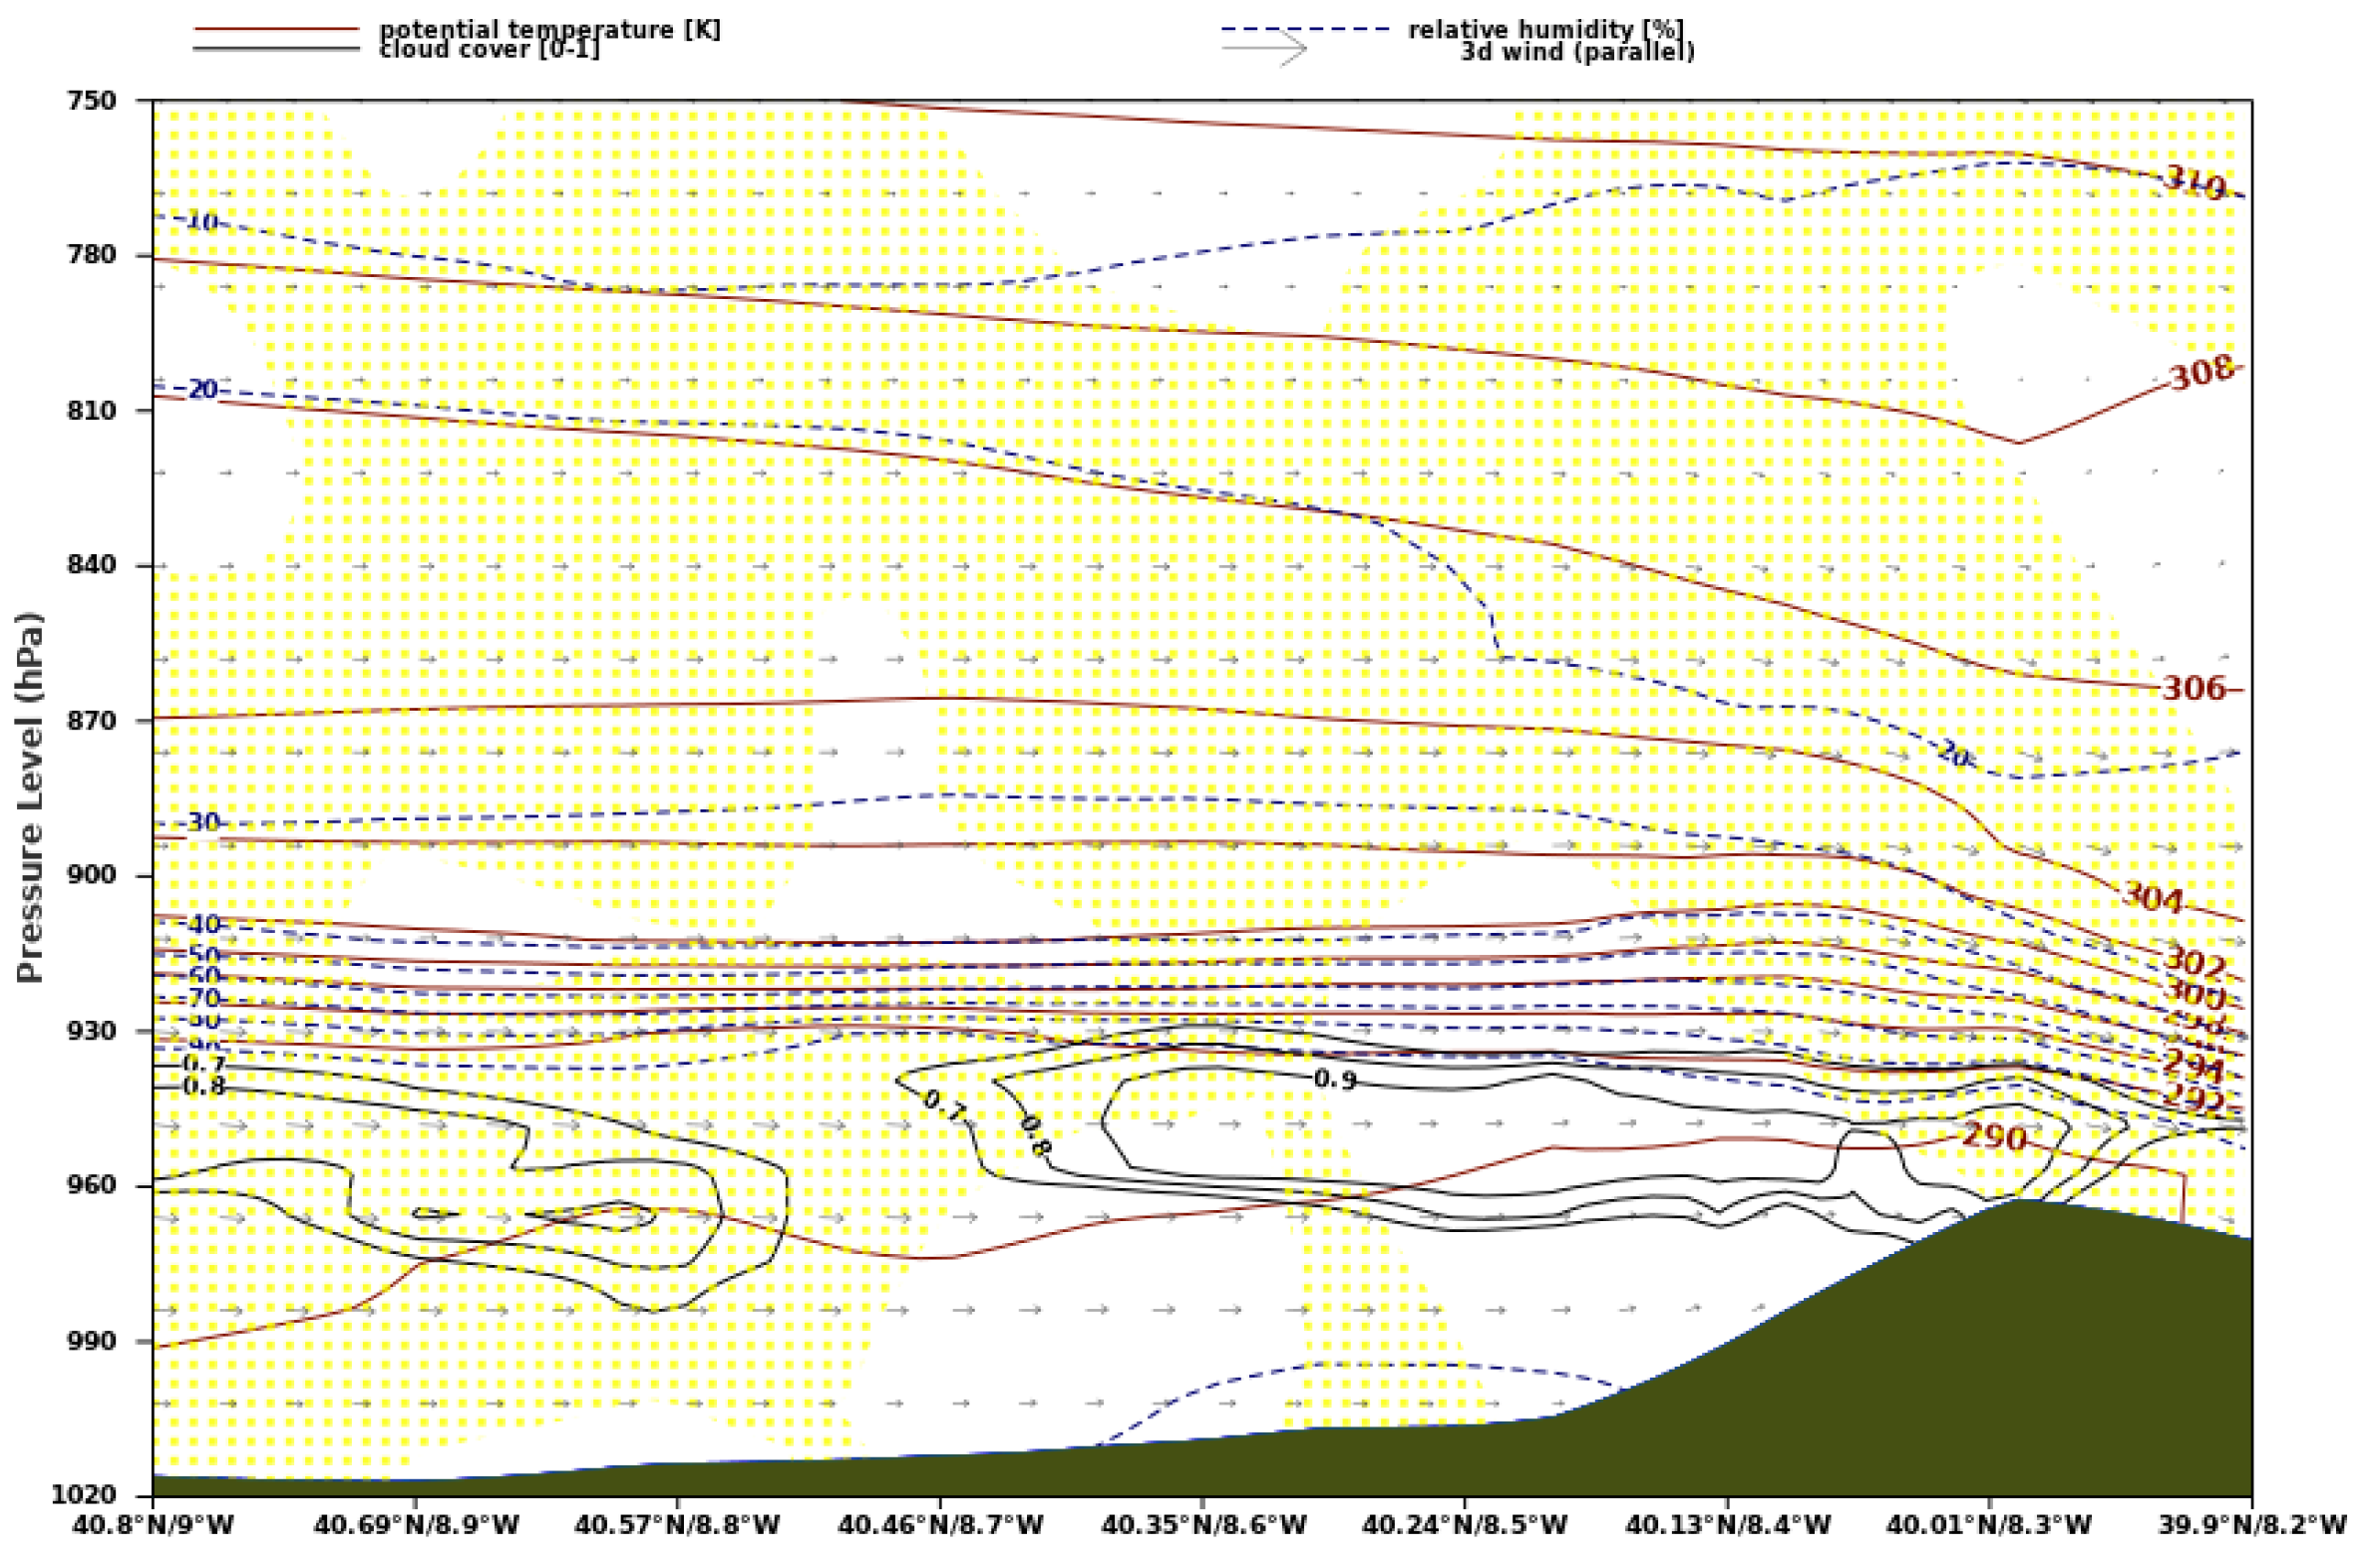
In this event Iberia was affected by the presence of a high-pressure system located south of the Azores and a weak low-pressure system over western Iberia, which led to a west/northwesterly flow over mainland Portugal (Figure S7). On 20 July 2021 a cross-section over central mainland Portugal (Figure S8 and Figure 12) shows there was an inversion with a sharp gradient of the potential temperature and relative humidity in the 910-930 hPa layer. Above this layer the air was dry, with values of relative humidity around 30% at 1000 m asl. Around 950 hPa the 2 m relative humidity was above 80% and cloudiness was typically above 60%. In the region the flow was from the north/northwest and the vertical velocity was mainly negative, indicating large-scale subsidence.
The vertical profile in Lousã (Figure 13) shows an inversion base around 700 m asl. Below this level the temperature dropped with altitude and the relative humidity was above 95%, with a northwesterly wind, veering to the north and becoming light above 800-1000 m asl. At the top of the well mixed surface layer, which exhibits a negative lapse-rate of the temperature up to 600 m asl, there was a layer of clouds with overcast conditions throughout a depth of approximately 300 m.

4.2 Large-scale subsidence at low elevations, 14-15 August 2021

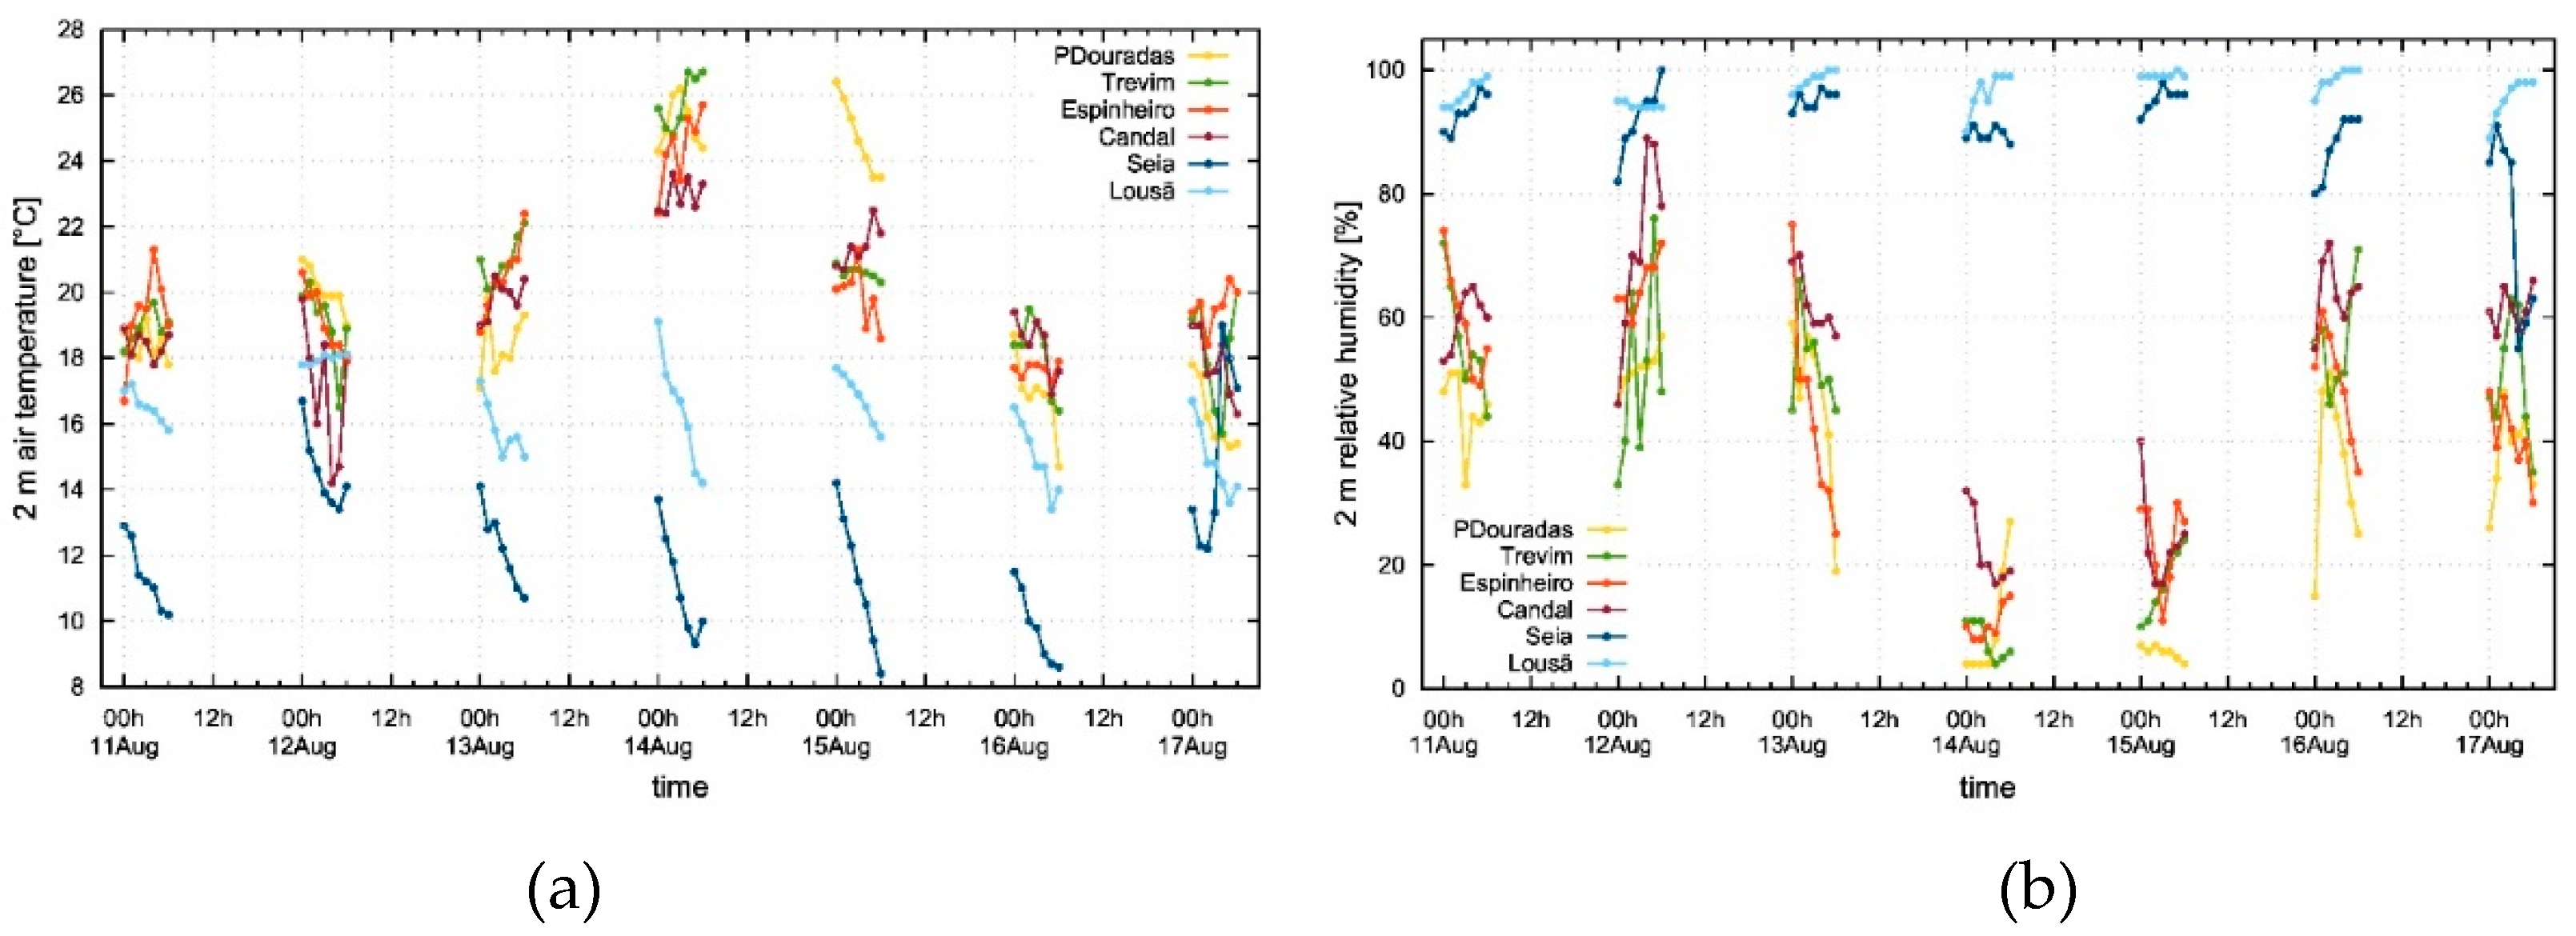
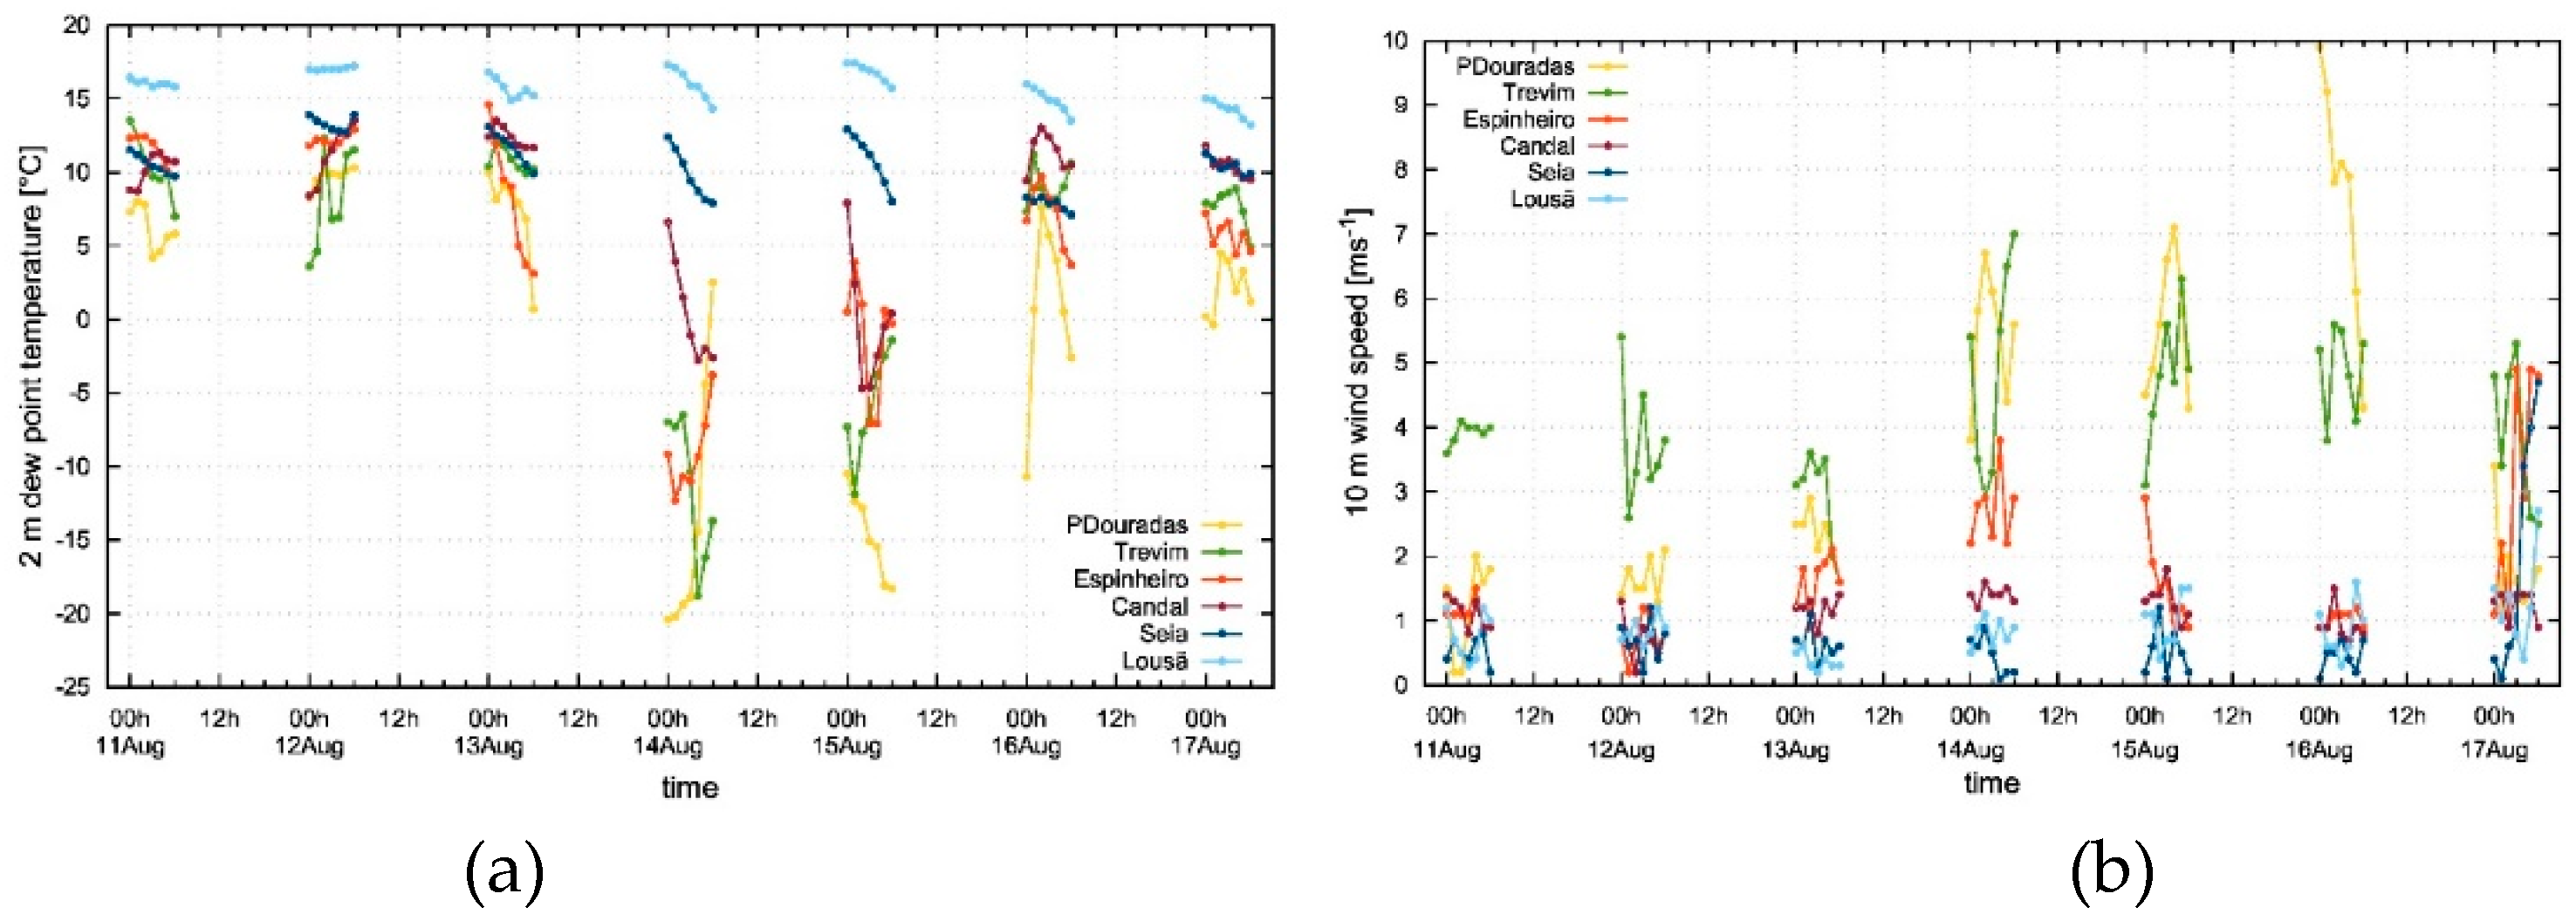
On 11-13 August 2021 the 2 m temperature in Seia and Lousã were lower than in the remaining stations (Figure 14a), which highlights the presence of a surface inversion. Additionally, in the valley stations the 2 m relative humidity was above 90% (Figure 14b) and the winds were light (Figure 15b). At higher elevations the 2 m temperature was around 18-20°C and on 12 August 2021 the highest readings of this near-surface variable were observed in Penhas Douradas (1380 m asl). Overall, the 2 m relative humidity was around 50-80% in Candal, but at higher elevations it was lower, around 30-70%. The 10 m wind speed was also light in the stations above 600 m asl, with the highest values recorded in Trevim (1167 m asl).
On 14-15 August 2021 the differences in the 2 m temperature and relative humidity widened considerably. While in the valley the 2 m temperature remained similar to the previous two days, aloft the temperature increased, with values above 22°C. The highest readings of the 2 m temperature were observed in the stations at higher elevations, with values around 26°C. At the same time, the 2 m relative humidity dropped to values below 10% in the AWS above 900 m and 20% in Candal (621 m asl). A review of the 2 m dew point temperature shows that values as low as -20°C were recorded in Penhas Douradas and -5°C in Candal (Figure 15a). Along with these dry conditions, typical of strong large-scale subsidence, the 10 m wind speed increased to around 6 m/s in the AWS above 900 m.
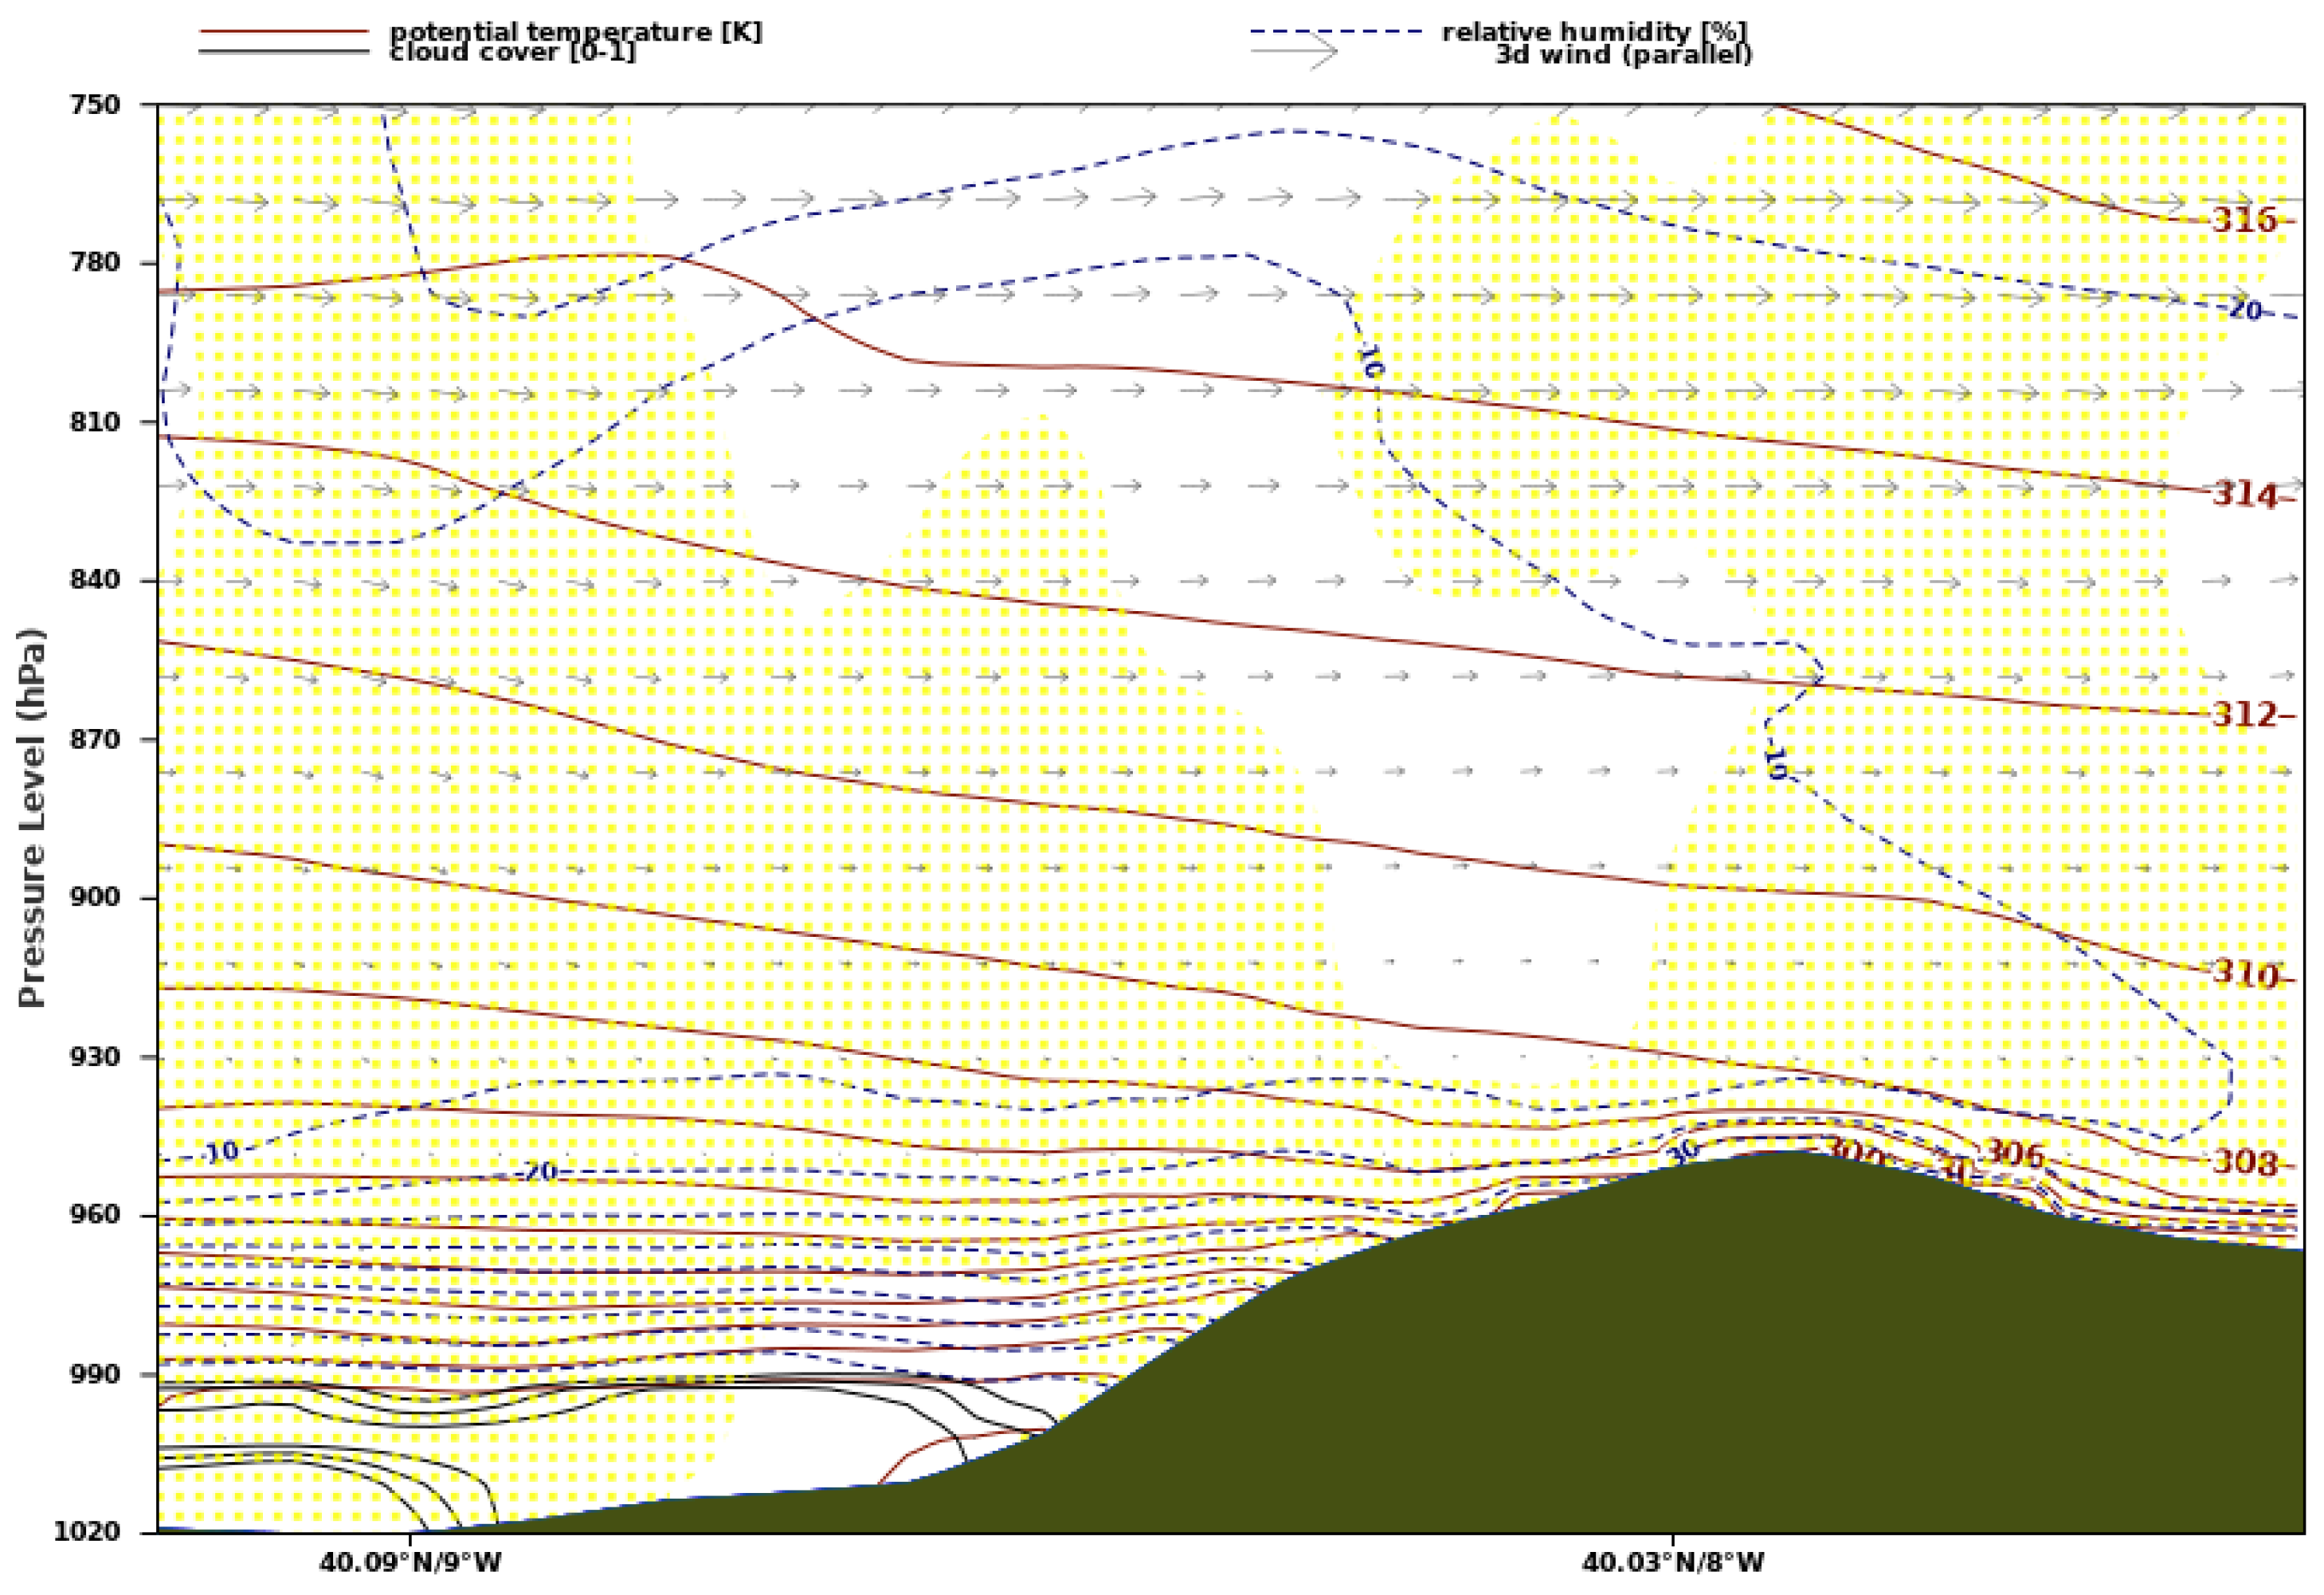
On 15 August the weather conditions observed in the AWS led to strong positive lapse rates, between 1.53°C/100 m and 1.83°C/100 m. Model data from ECMWF-HRES shows that Iberia was being affected by a warm air mass advected from Northern Africa (Figure S9). This circulation was induced by a high-pressure system in the western Mediterranean and a low-pressure system over the North Atlantic, northwest of Iberia. A cross-section over central mainland Portugal (Figure S10 and Figure 16) showed that a sharp inversion was present, with a strong gradient in potential temperature in the 960-990 hPa layer. Large-scale subsidence was a key feature, with predominantly negative vertical wind speeds. At 925 hPa the relative humidity was around 10-20%, in agreement with the values observed in Candal.
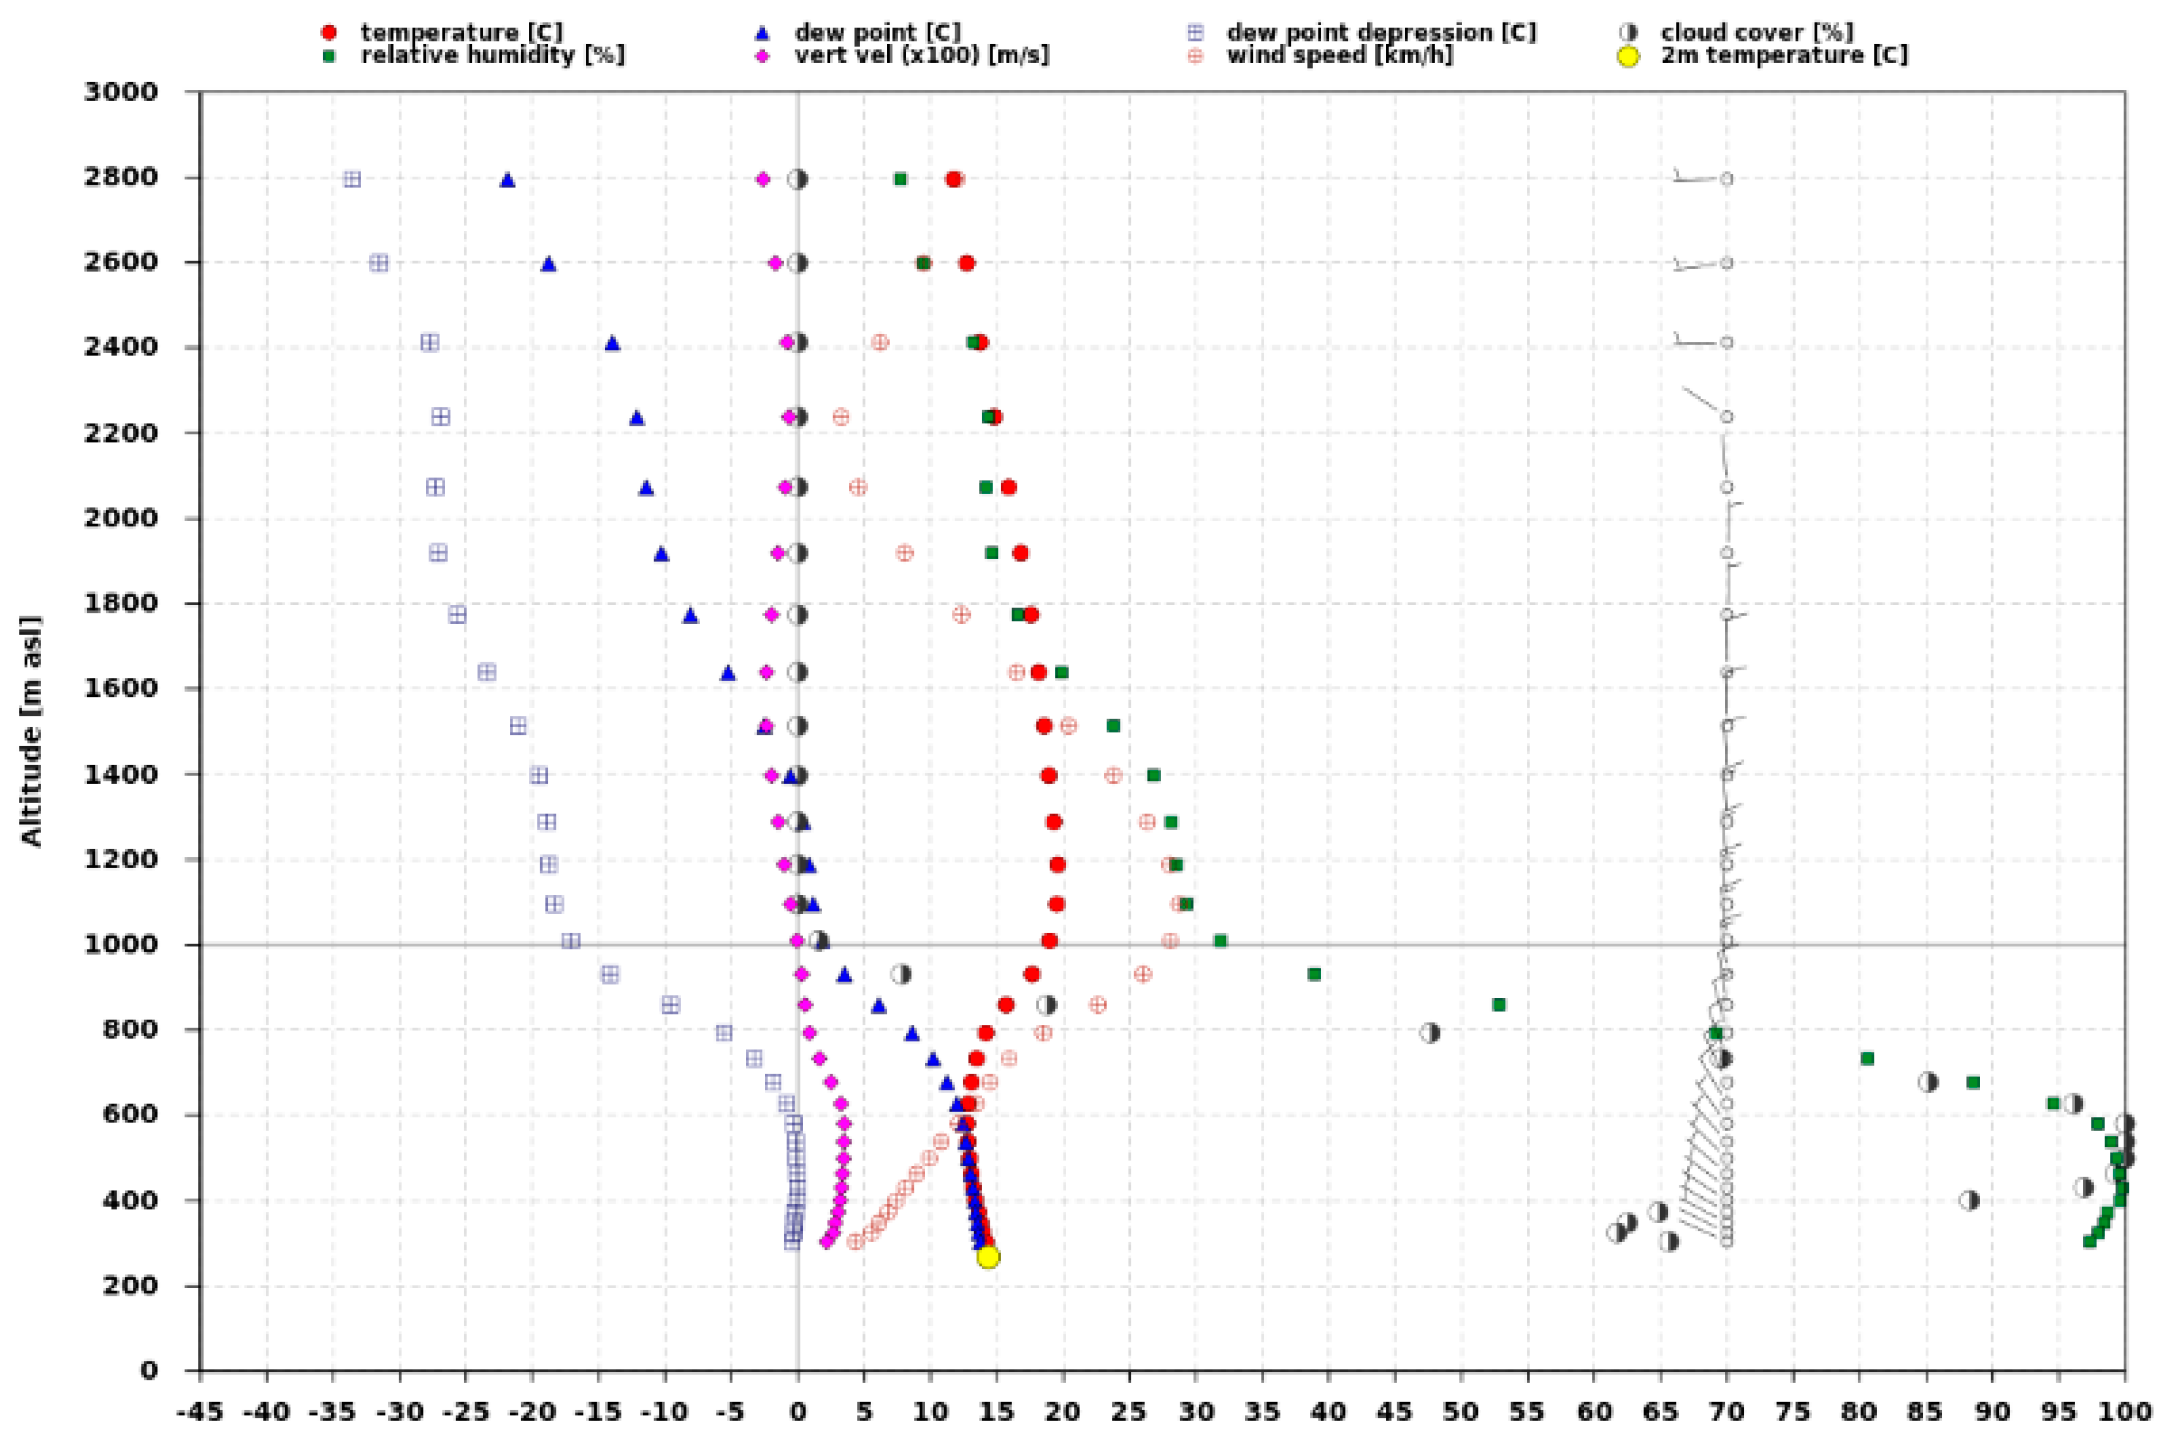
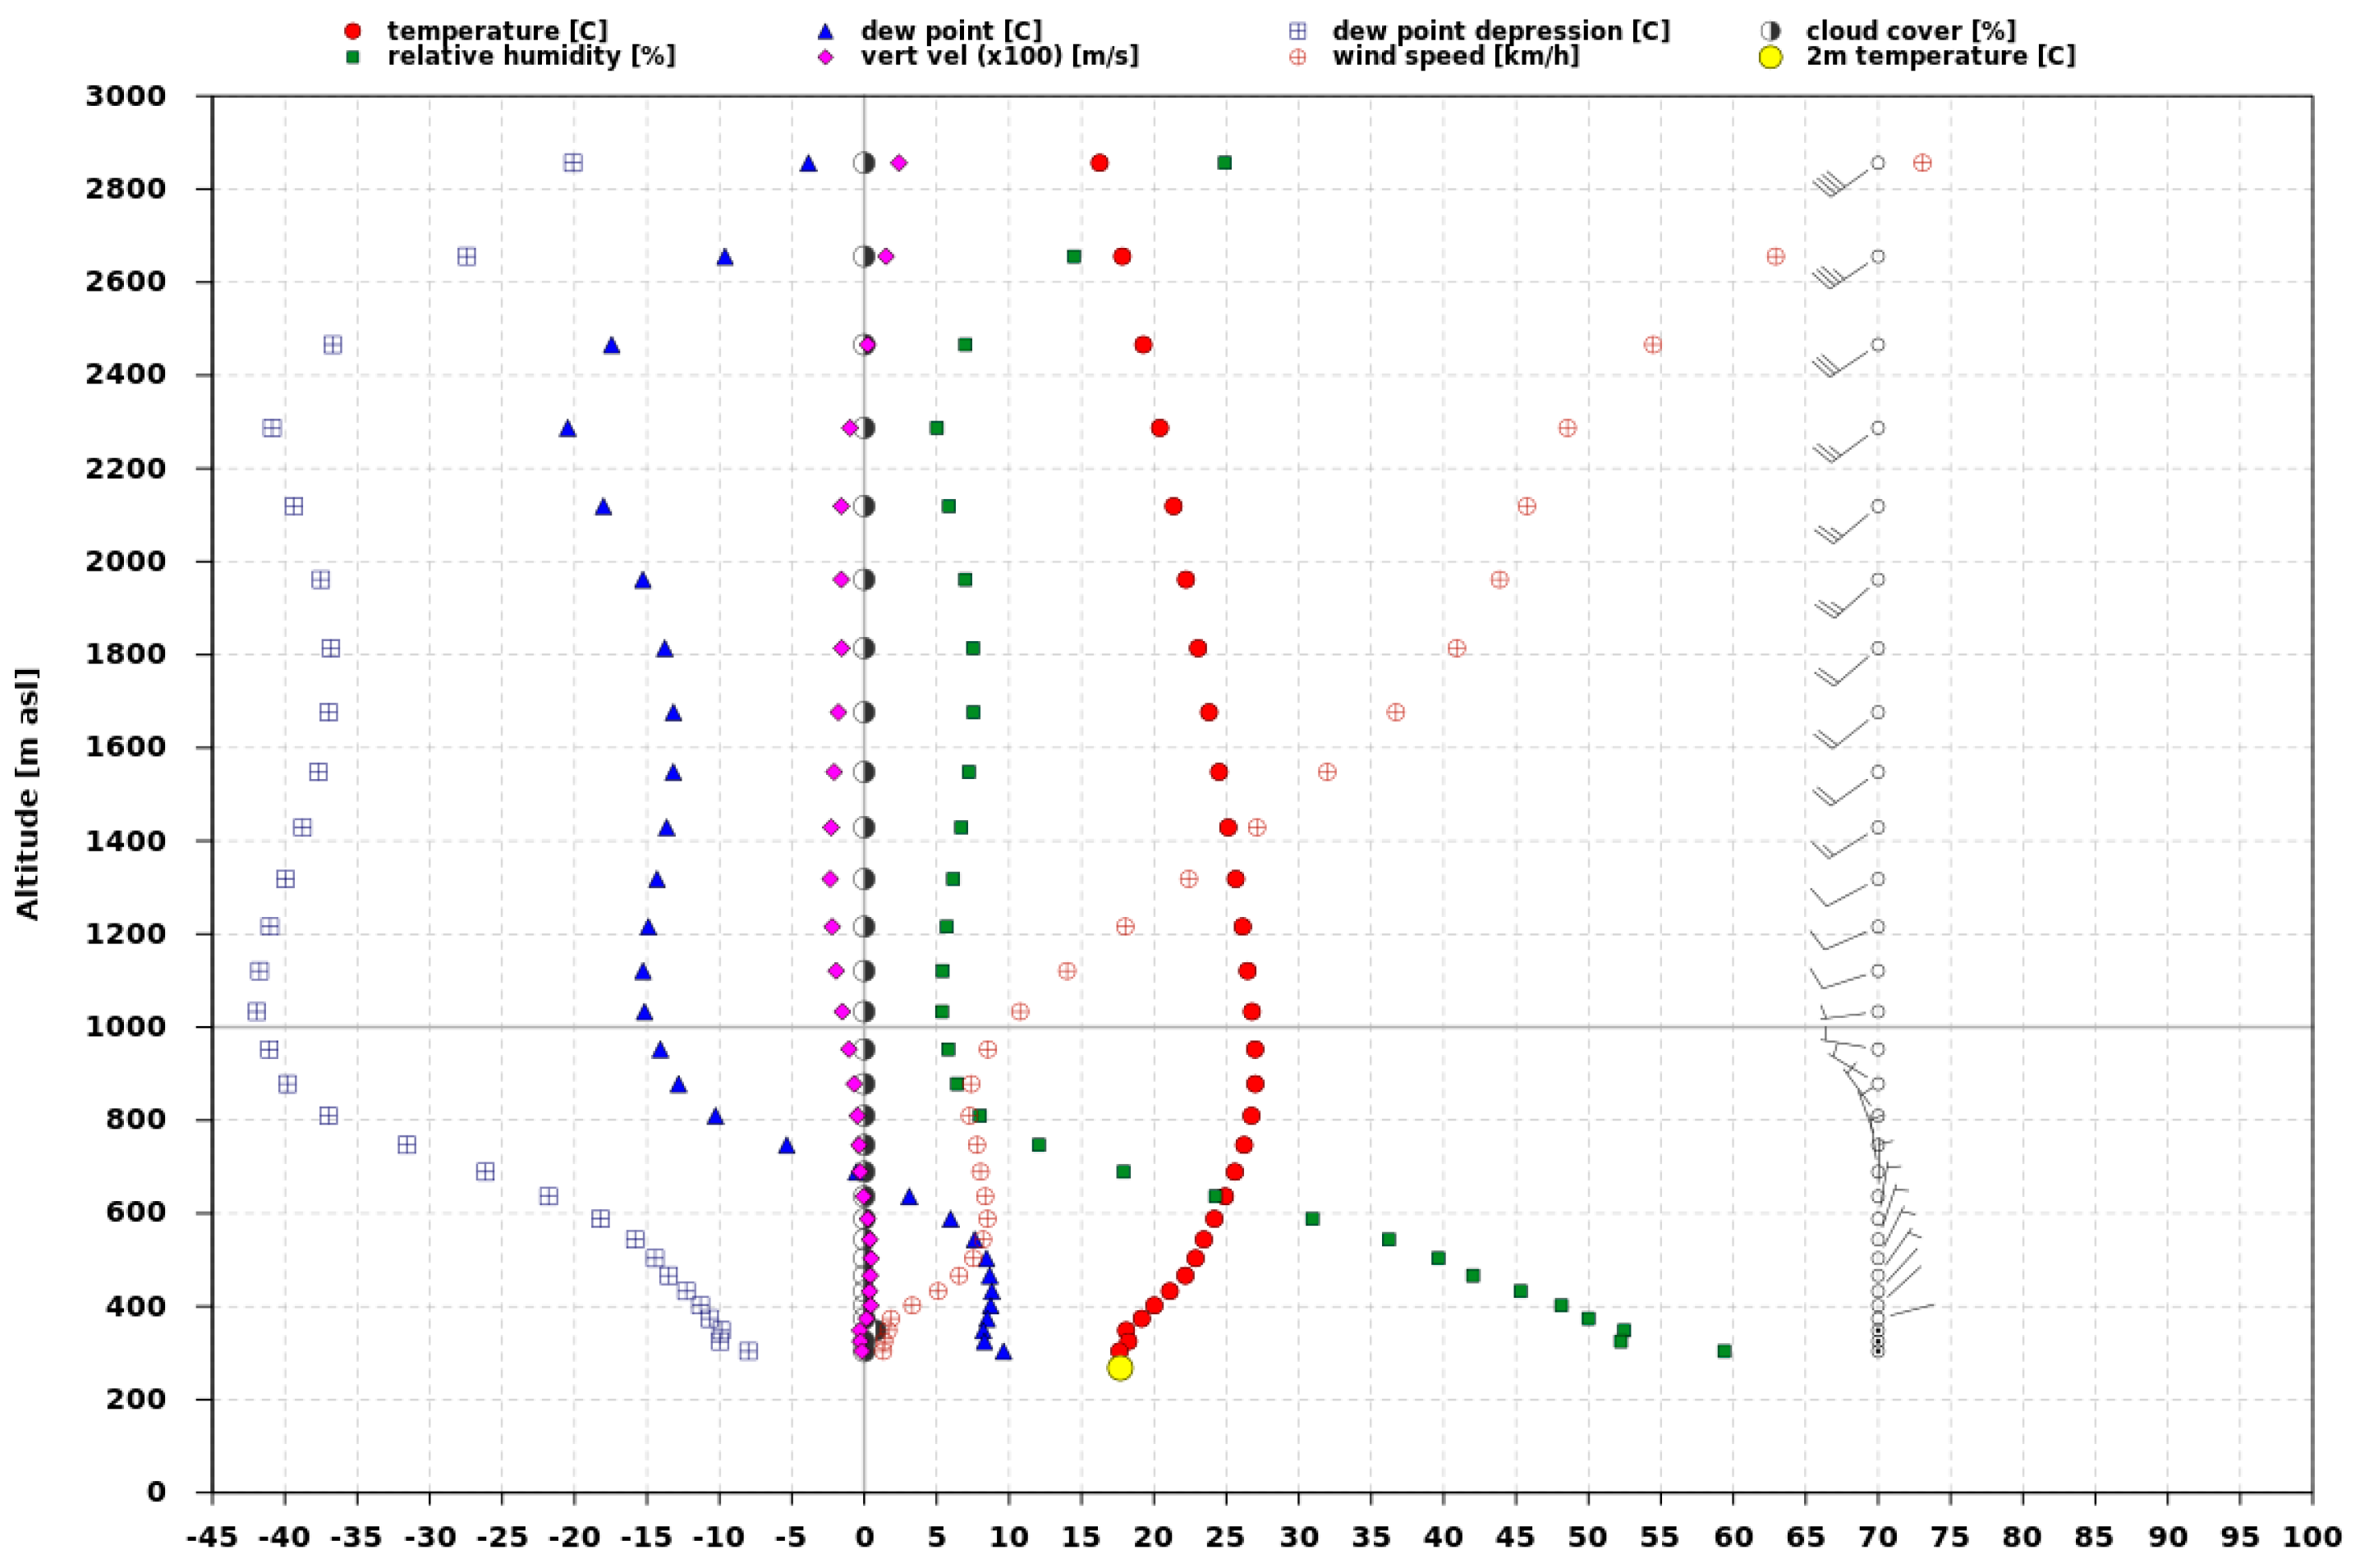
The vertical profile for Lousã (Figure 17) shows that a temperature inversion was present from close to the surface, with calm conditions at the lowest levels and light winds from the northeast below 600 m asl. In the layer 600-1000 m asl the wind veers to the west and the dew point depression drops at the fastest rate (around 5°C/100 m). The top of the temperature inversion was close to 1000 m asl, the temperature was around 27°C and very dry air was present (below 10% relative humidity and dew point depression values as low as -40°C).
Already under the influence of a northeasterly flow and a weaker inversion (not shown), on 16-17 August 2021 the weather observations returned to values close to the ones observed on 11-13 August. The only exception was the 10 m wind speed, as it was stronger in Penhas Douradas (1380 m asl), with maximum values around 10 m/s.

4.3 Downslope windstorm on 21 May 2022

Due to the combined effect of a low-pressure system to the west/southwest of Iberia and a large high-pressure system over the central Mediterranean, on 19-21 May 2022 mainland Portugal was affected by an advection of a warm and dry air mass from North Africa (Figure S11). This warm air mass was gradually replaced by a cooler and with more moisture air mass on 21 May 2022, with a sharp change to a southwesterly flow during daytime. In the early hours on 21 May 2022, there was a strong southerly flow and the temperature at 850 hPa reached the highest values in this event, peaking at around 24-26°C. These values of temperature at 850 hPa were at record highs for the time of the year and affected the whole country.
During the nighttime on 21 May 2022, weather data available at IPMA showed that several valley stations located north of the Lousã/Estrela mountain range recorded 2 m temperatures above 27°C and maximum hourly wind gusts in excess of 10 m/s (Figure S12). Given that these stations are up to 100 km apart from each other, the data highlights that unusually warm and gusty weather conditions affected a widespread area in central mainland Portugal.
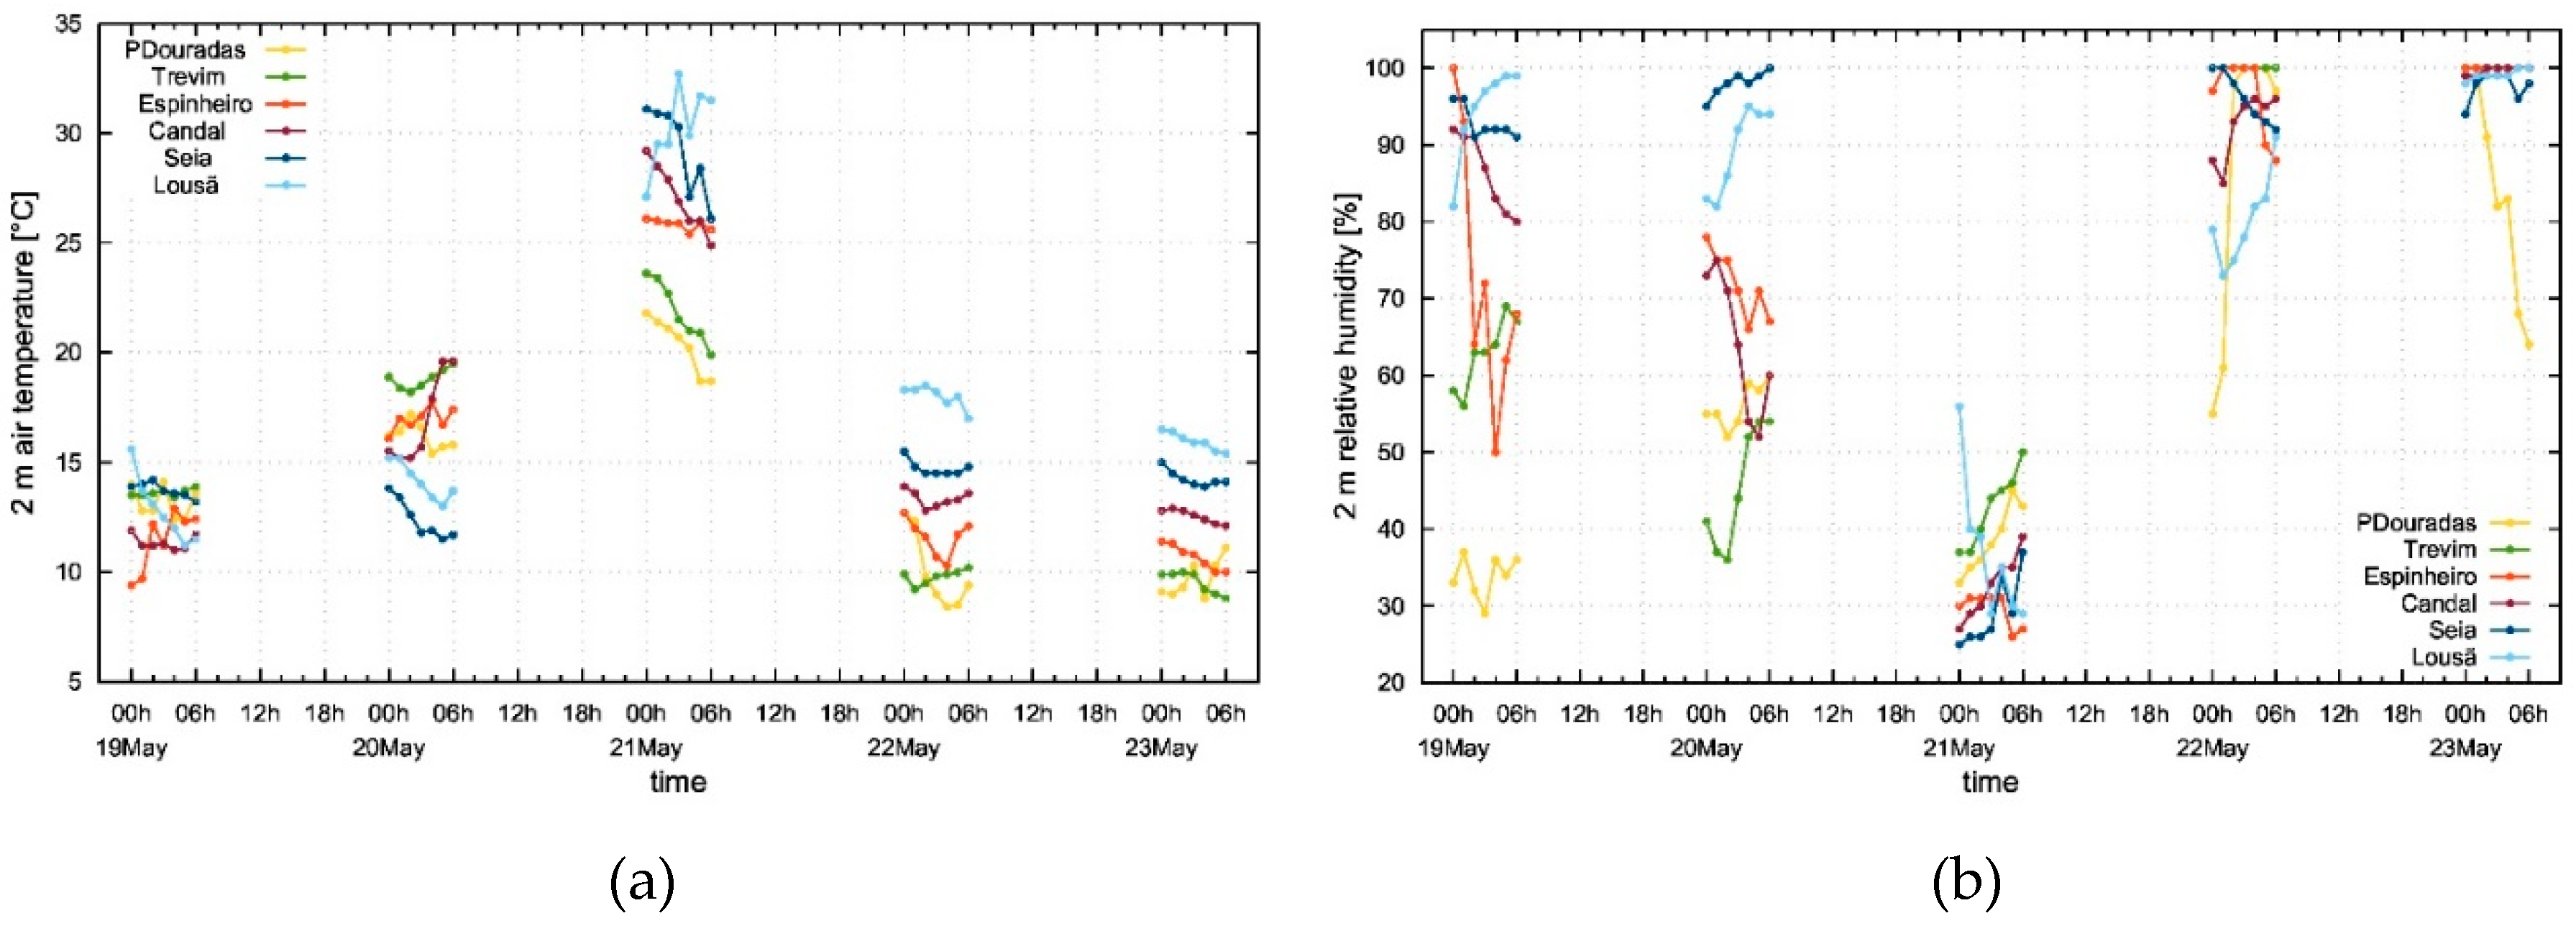
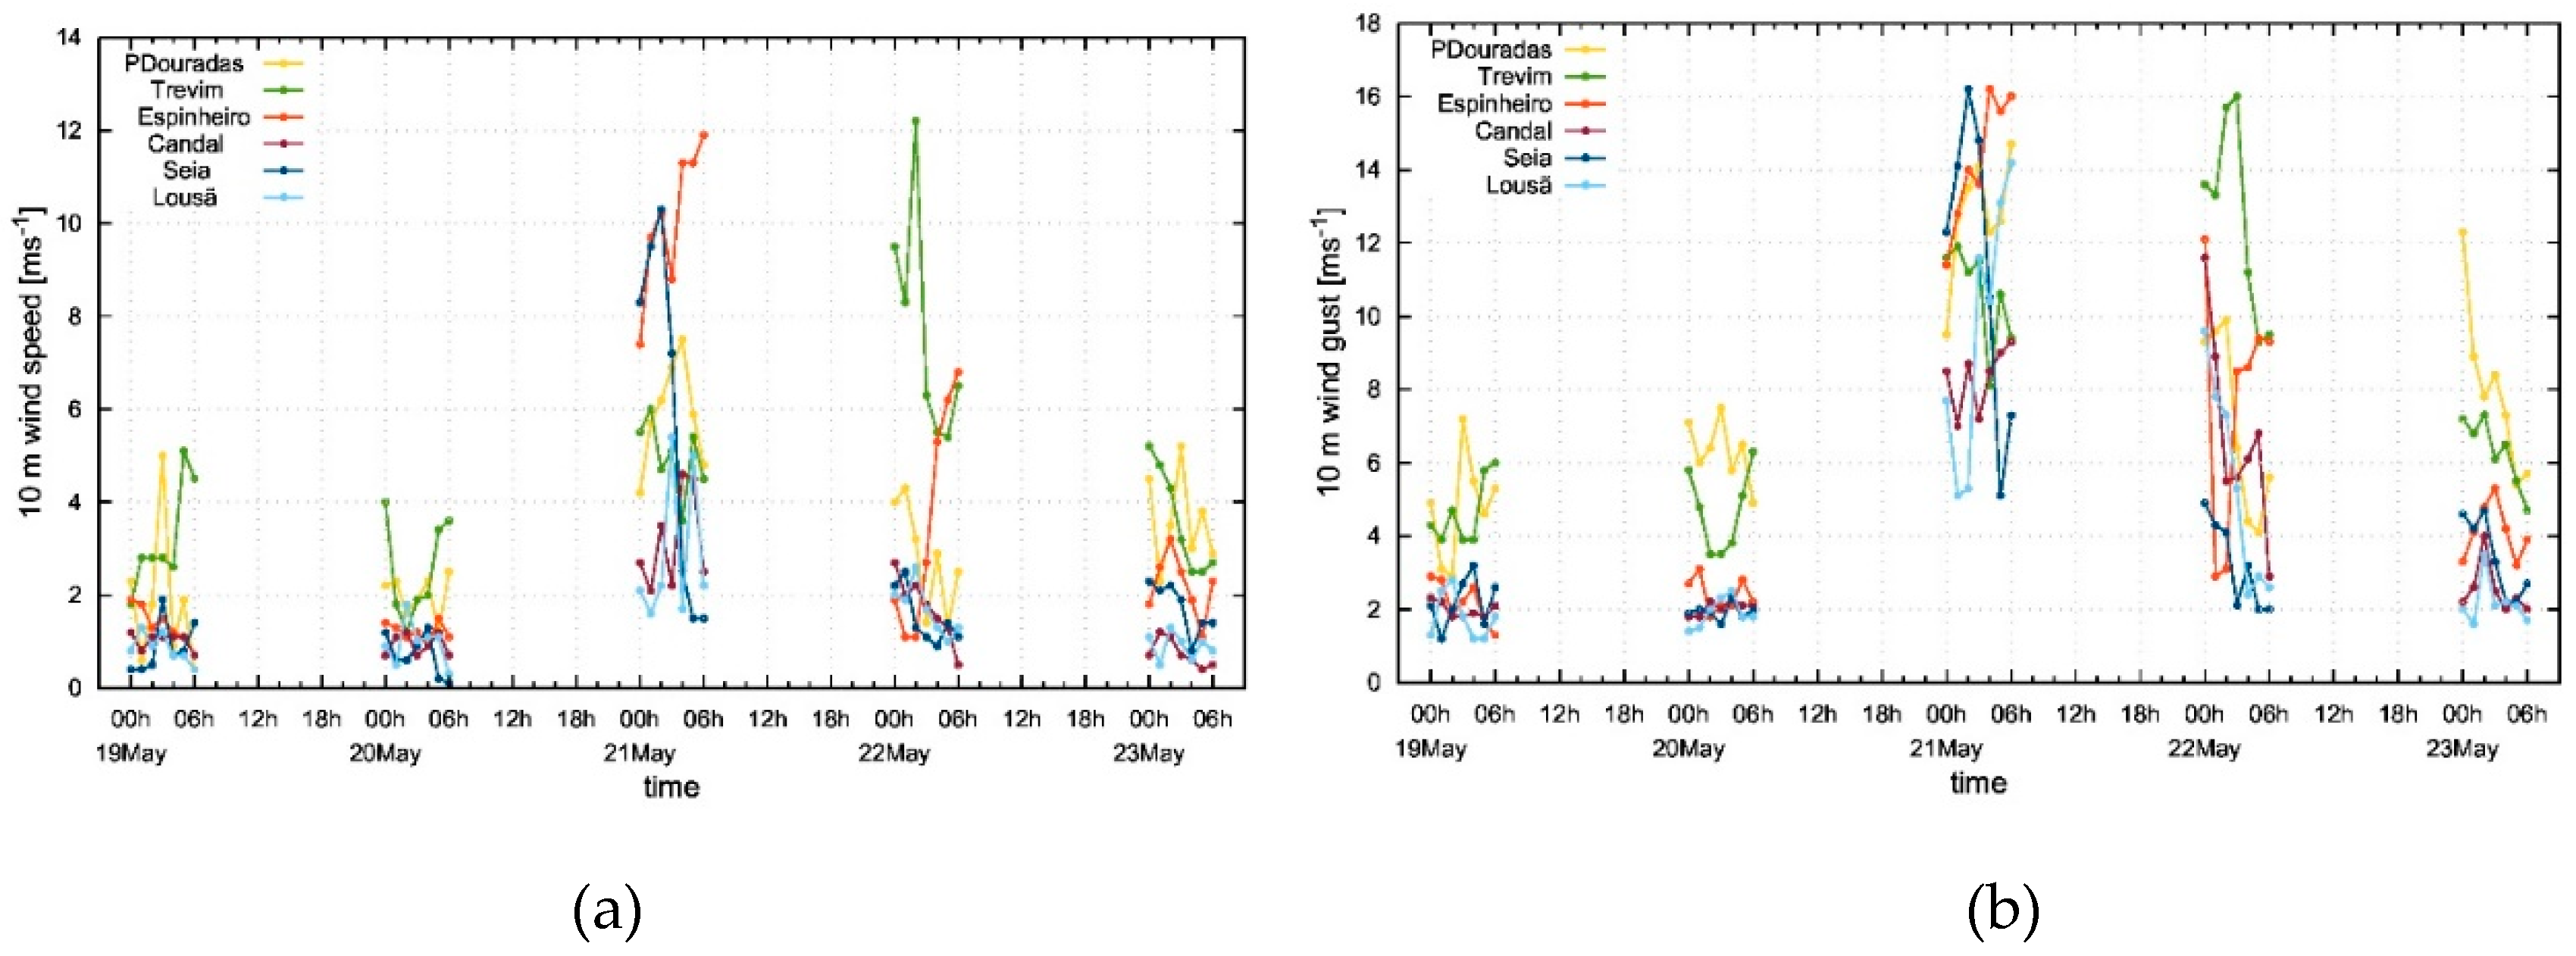
Even though mainland Portugal was already being affected by a warm and dry air mass on 20 May 2022, the 2 m temperature was within the typical range, considering the nighttime period, a warm event and time of the year (Figure 18a). The 2 m relative humidity (Figure 18b) in the valley stations (Lousã and Seia) was over 90%, which was higher than the readings aloft, typically in the 30-70% range. The 10 m wind speed and gust (Figure 19a,b) showed that the winds were light in all the AWS.
On 21 May 2022, the observed values of 2 m temperature increased by more than 15°C in the valley stations. In Lousã readings of 32.7°C were reported at 03 UTC and the minimum and maximum values of the 2 m temperature in this location during the 00-06 UTC period were 27.2°C and 33.3°C (not shown). For further context, in May this range of values of the 2 m temperature, in the valleys of central mainland Portugal, are only observed in the afternoon, in spells of very warm weather, as the record highs for the month are around 35°C. Moreover, readings above 30°C during the nighttime are unusual even in the warmest periods in summer.
Overall, the values of 2 m temperature increased when moving from Penhas Douradas to the valley stations and the 2 m relative humidity was in the 20-50% range in all the AWS. The 10 m wind speed was higher in the AWS above 700 m asl, but the variability was higher in the valley stations, namely in Lousã, with a range between 2 and 10 m/s. The 10 m wind gusts reached values of 12-16 m/s in all the stations, except in Candal. However, even in this sheltered site the 10 m wind gusts were between 8 and 10 m/s during the nighttime. While in the valley stations the 10 m wind gusts were as strong as in the stations aloft, it must be stressed that in Lousã and Seia hourly values exhibited a range as large as 10 m/s. This data is therefore suggestive of a turbulent flow, intermittently affecting the valley area, in the context of a downslope windstorm event in the northwestern slope. In all the AWS the wind direction was from the southeast (not shown), which implies a flow over the mountain.
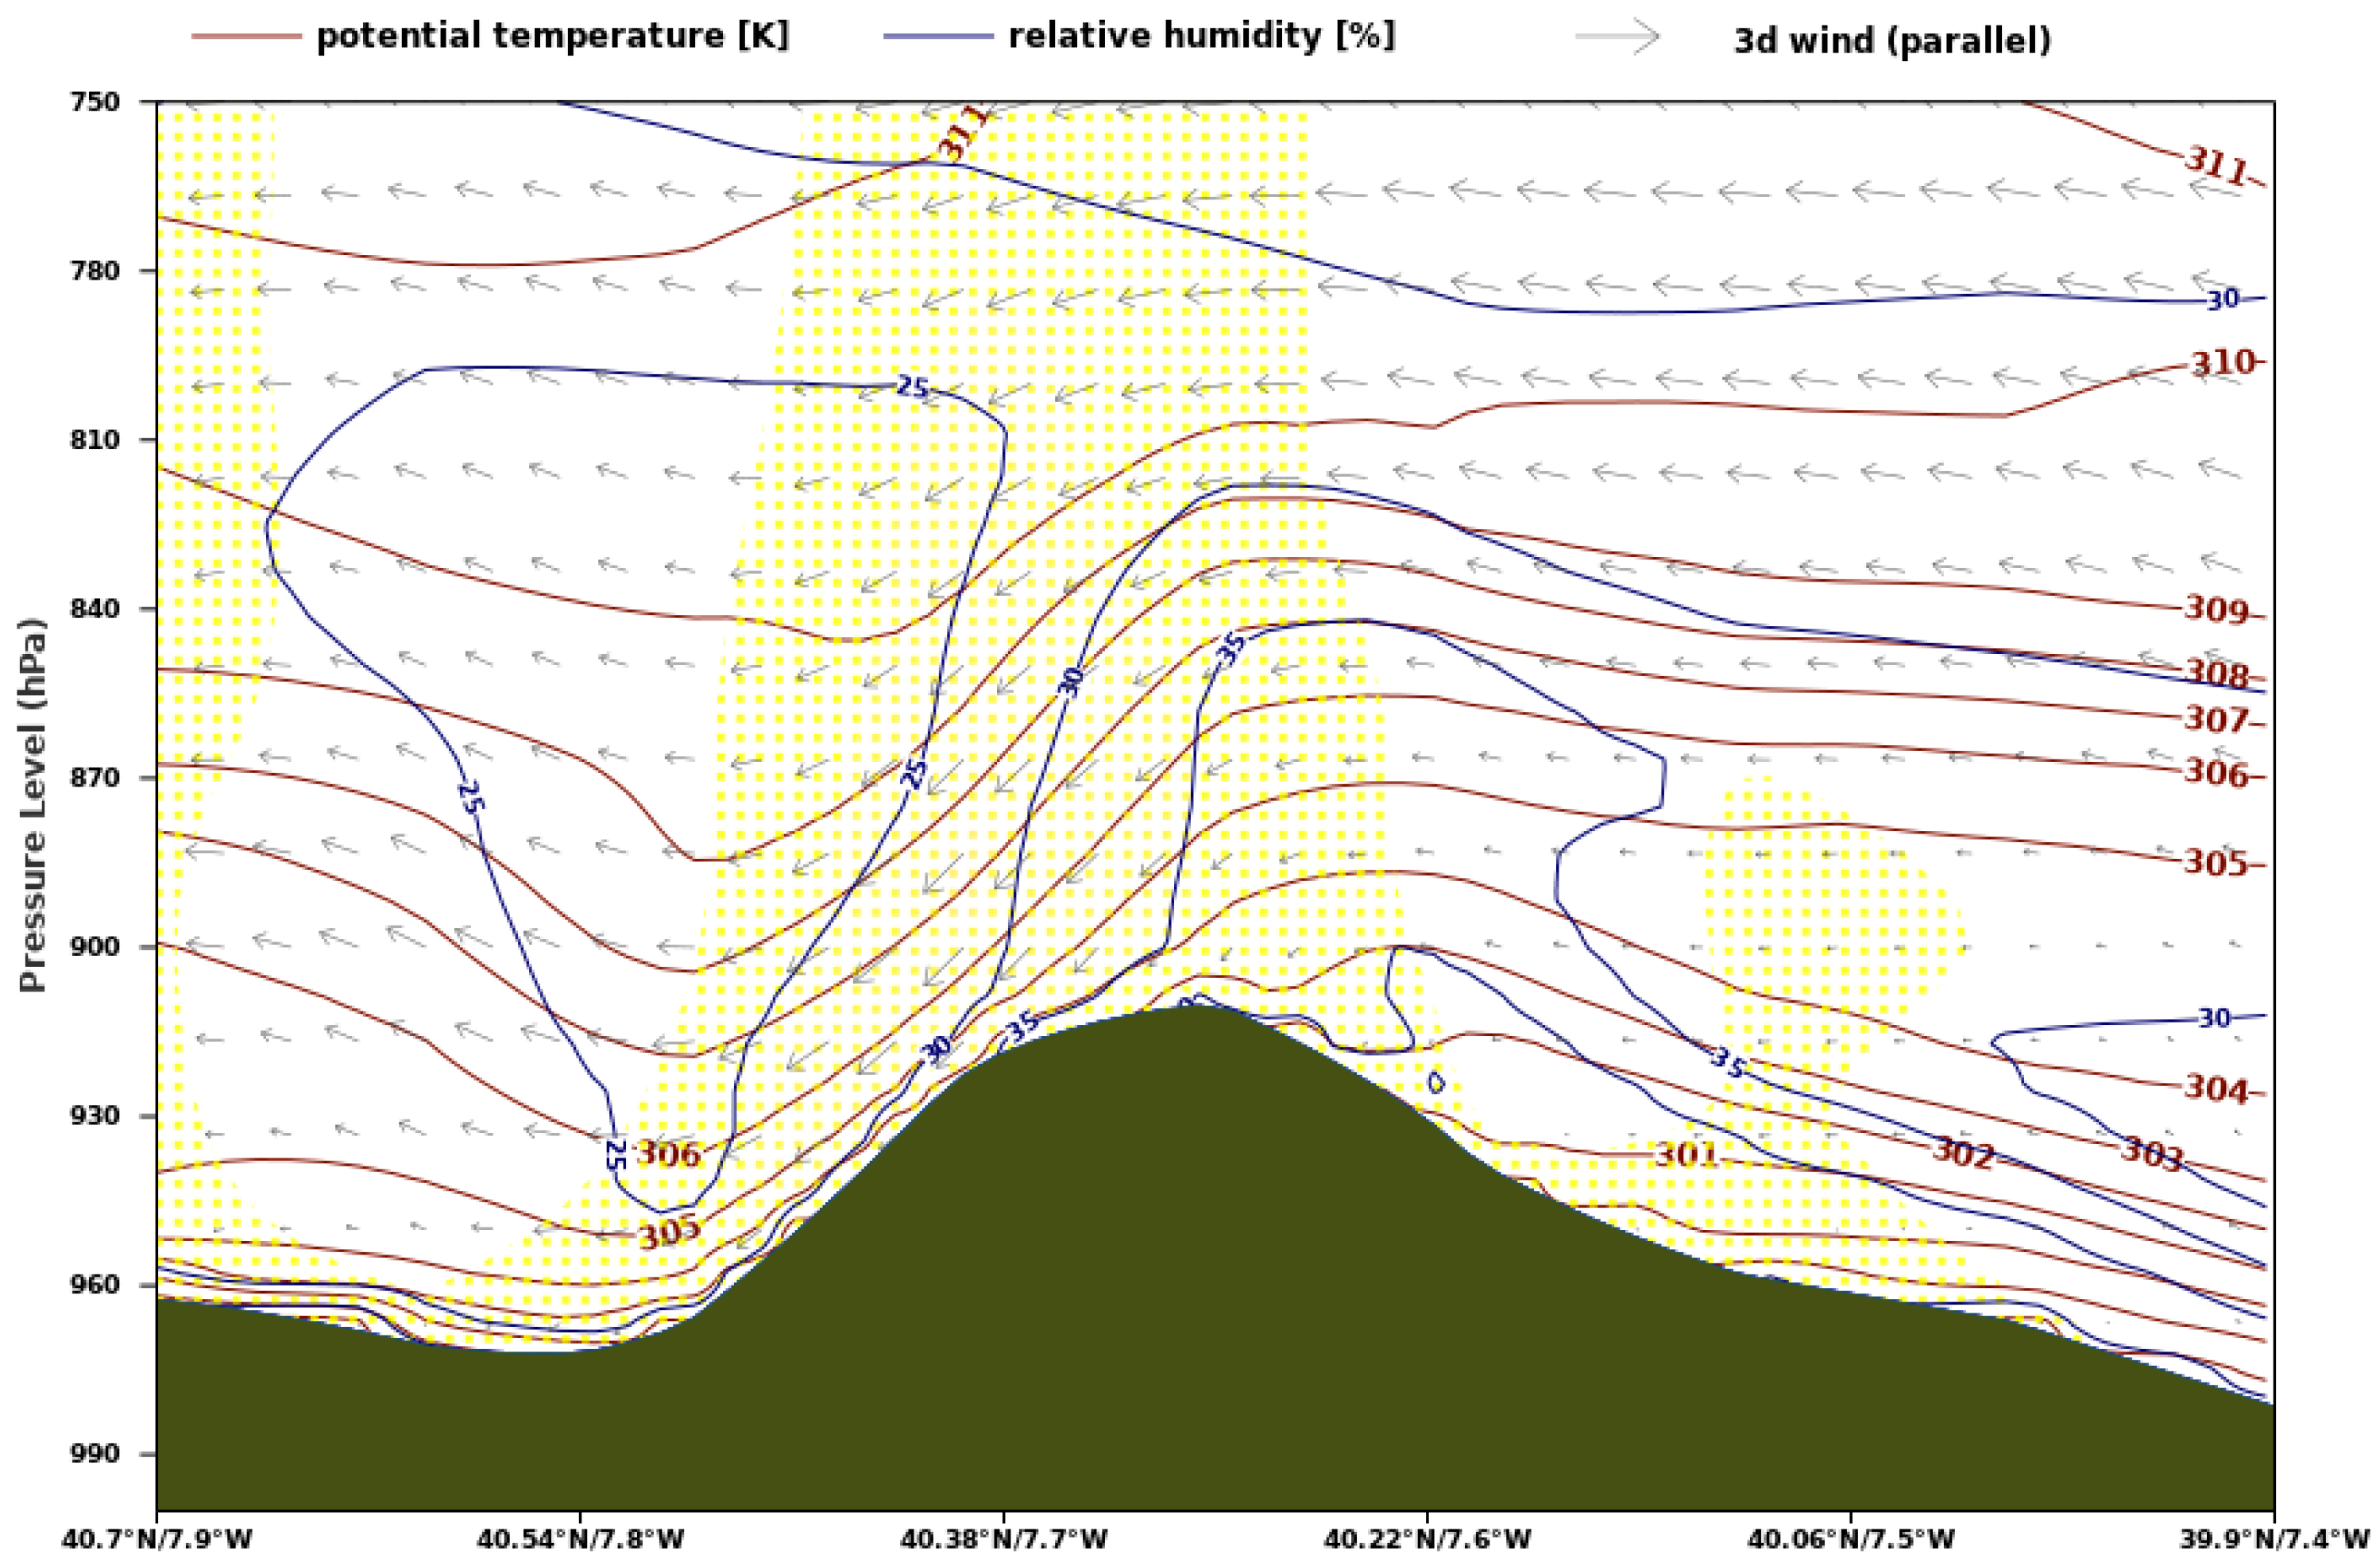
By May 22, with the advection of a cooler and humid air mass, the weather conditions returned to their normal range for this time of the year. Overall, ECMWF-HRES forecast data provided useful guidance in this event as it showed a strong downward flow on the north-western slopes of the Lousã/Estrela mountain range and suggested a significant vertical extent, eventually reaching the valley (Figure S13 and Figure 20).
The vertical profile in Lousã (Figure S14) shows that below 2200 m there was a significant downward momentum and the air was very dry, even close to the model surface. The wind was from the southeast below 600 m asl, veering aloft to the south. Model data suggests that the temperature from the near surface to around 1200 m asl was 25-28°C, with the highest values in the 800-1000 m asl layer. However, it must be stressed that these events are quite challenging to forecast with numerical weather prediction models (NWP) [45], namely specific details such as the intensity, the onset and demise of the downward flow. Therefore, one should be cautious when using NWP for operational forecasting specifically in complex terrain, as large differences between model data and observations at surface weather stations are possible.

4.4 Large variability in July 2022

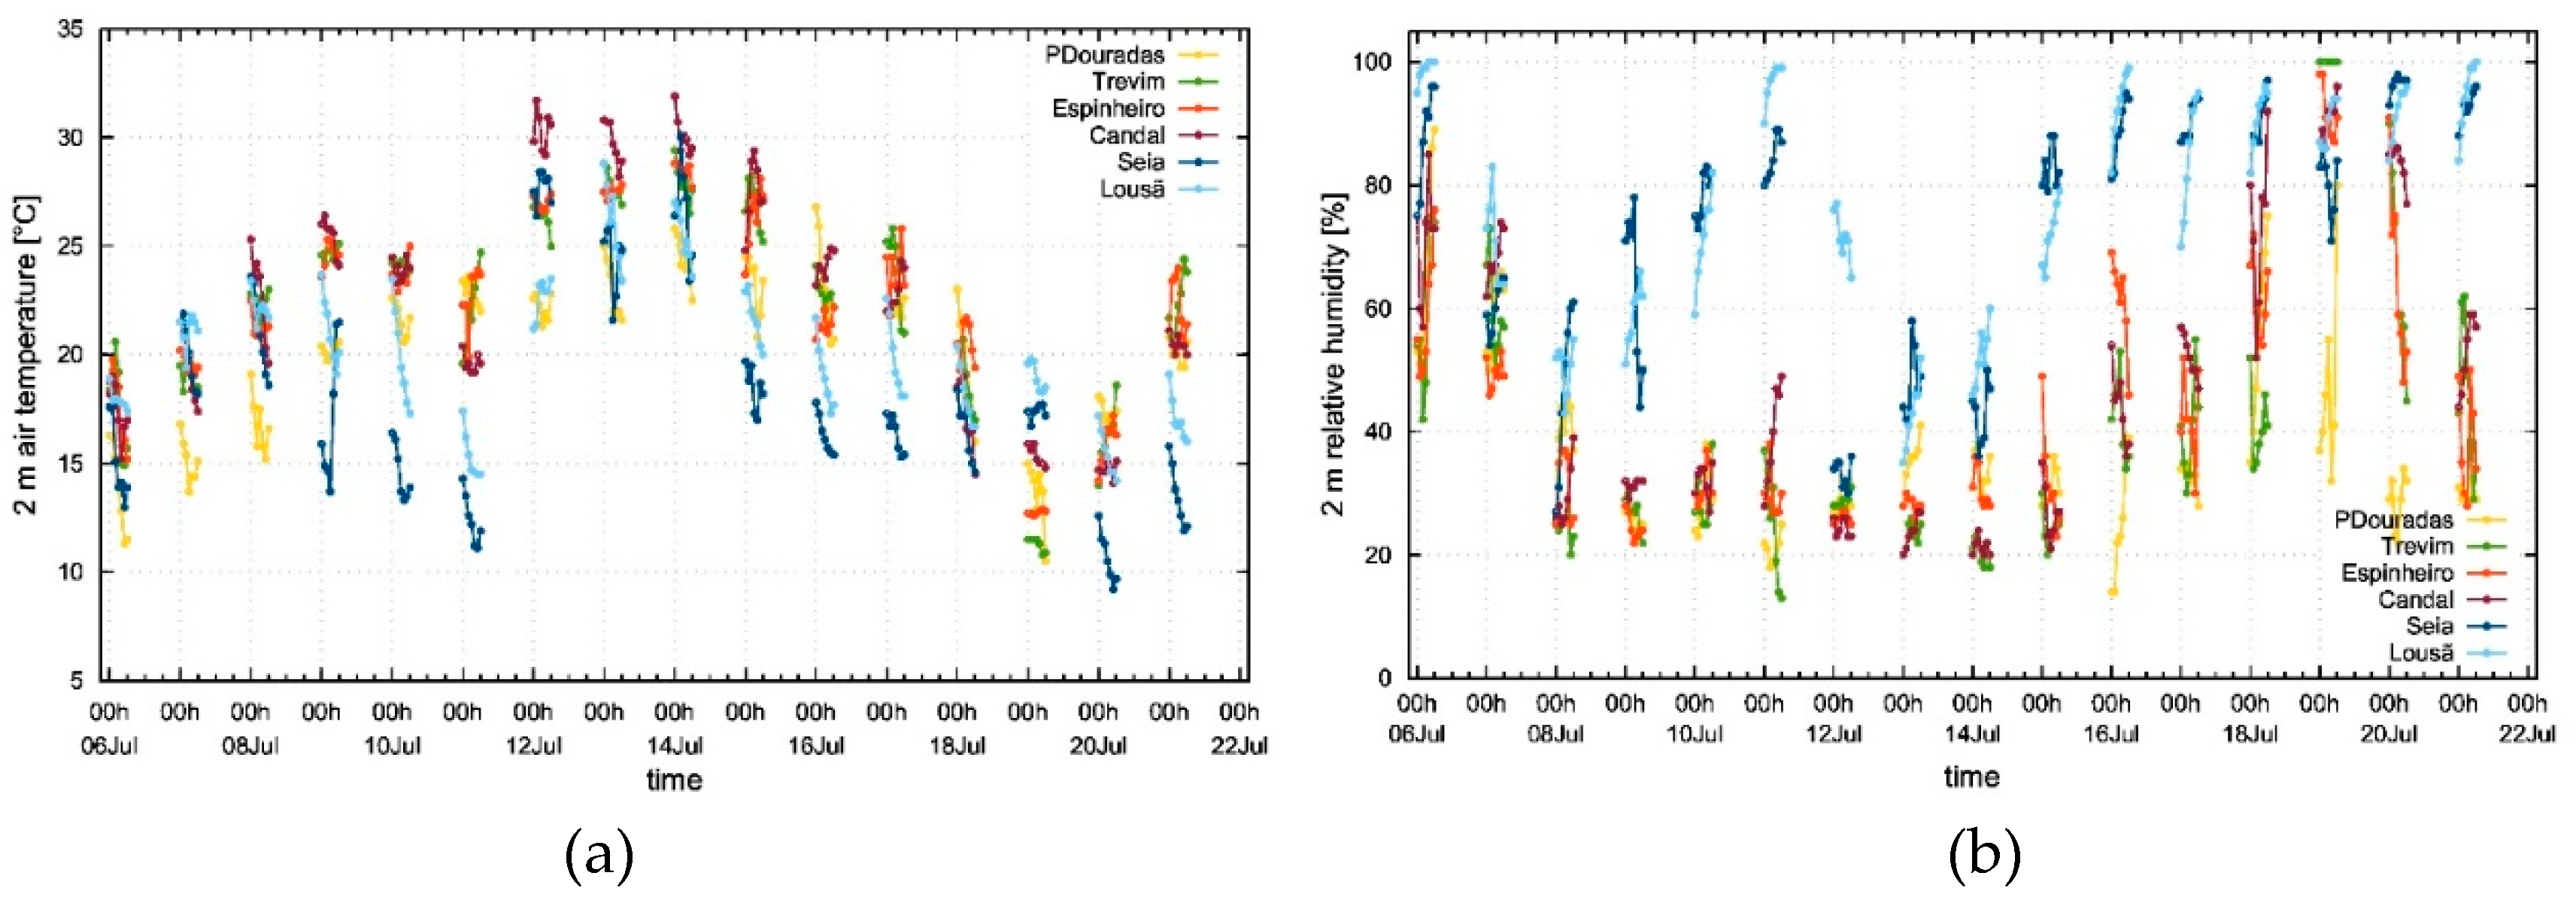
On 6-8 July 2022 the 2 m temperature (Figure 21a) in the AWS showed a negative lapse rate, with the lowest values observed in Penhas Douradas. By 9-11 July this had changed, with the lowest temperatures in the valley stations and warm conditions aloft, with values around 25°C at elevations between 600-1200 m. July 12-14 was a very warm period, with most of the AWS above 25°C. The only sites with 2 m temperatures below this value were in the valley and Penhas Douradas. The station with the highest 2 m temperatures was in Candal, with values above 30°C, which is noteworthy as this site is around 600 m asl and this is within the range of elevations where many of the wildfires occur in mainland Portugal. By 15-17 July 2022 the 2 m temperature in the valley stations dropped by nearly 10°C, but the values were still high aloft, with Penhas Douradas recording the highest values on 16 July.
On 18 July the progressive drop in the 2 m temperature continued, with a similar pattern to the previous days, with cooler valleys and warmer conditions at higher elevations. However, on 19 July there was a significant reversal, as the 2 m temperature increased in the valley and dropped at higher elevations. On 20-21 July, another reversal to a pattern with cool valley stations and higher temperatures in the middle and upper slope.
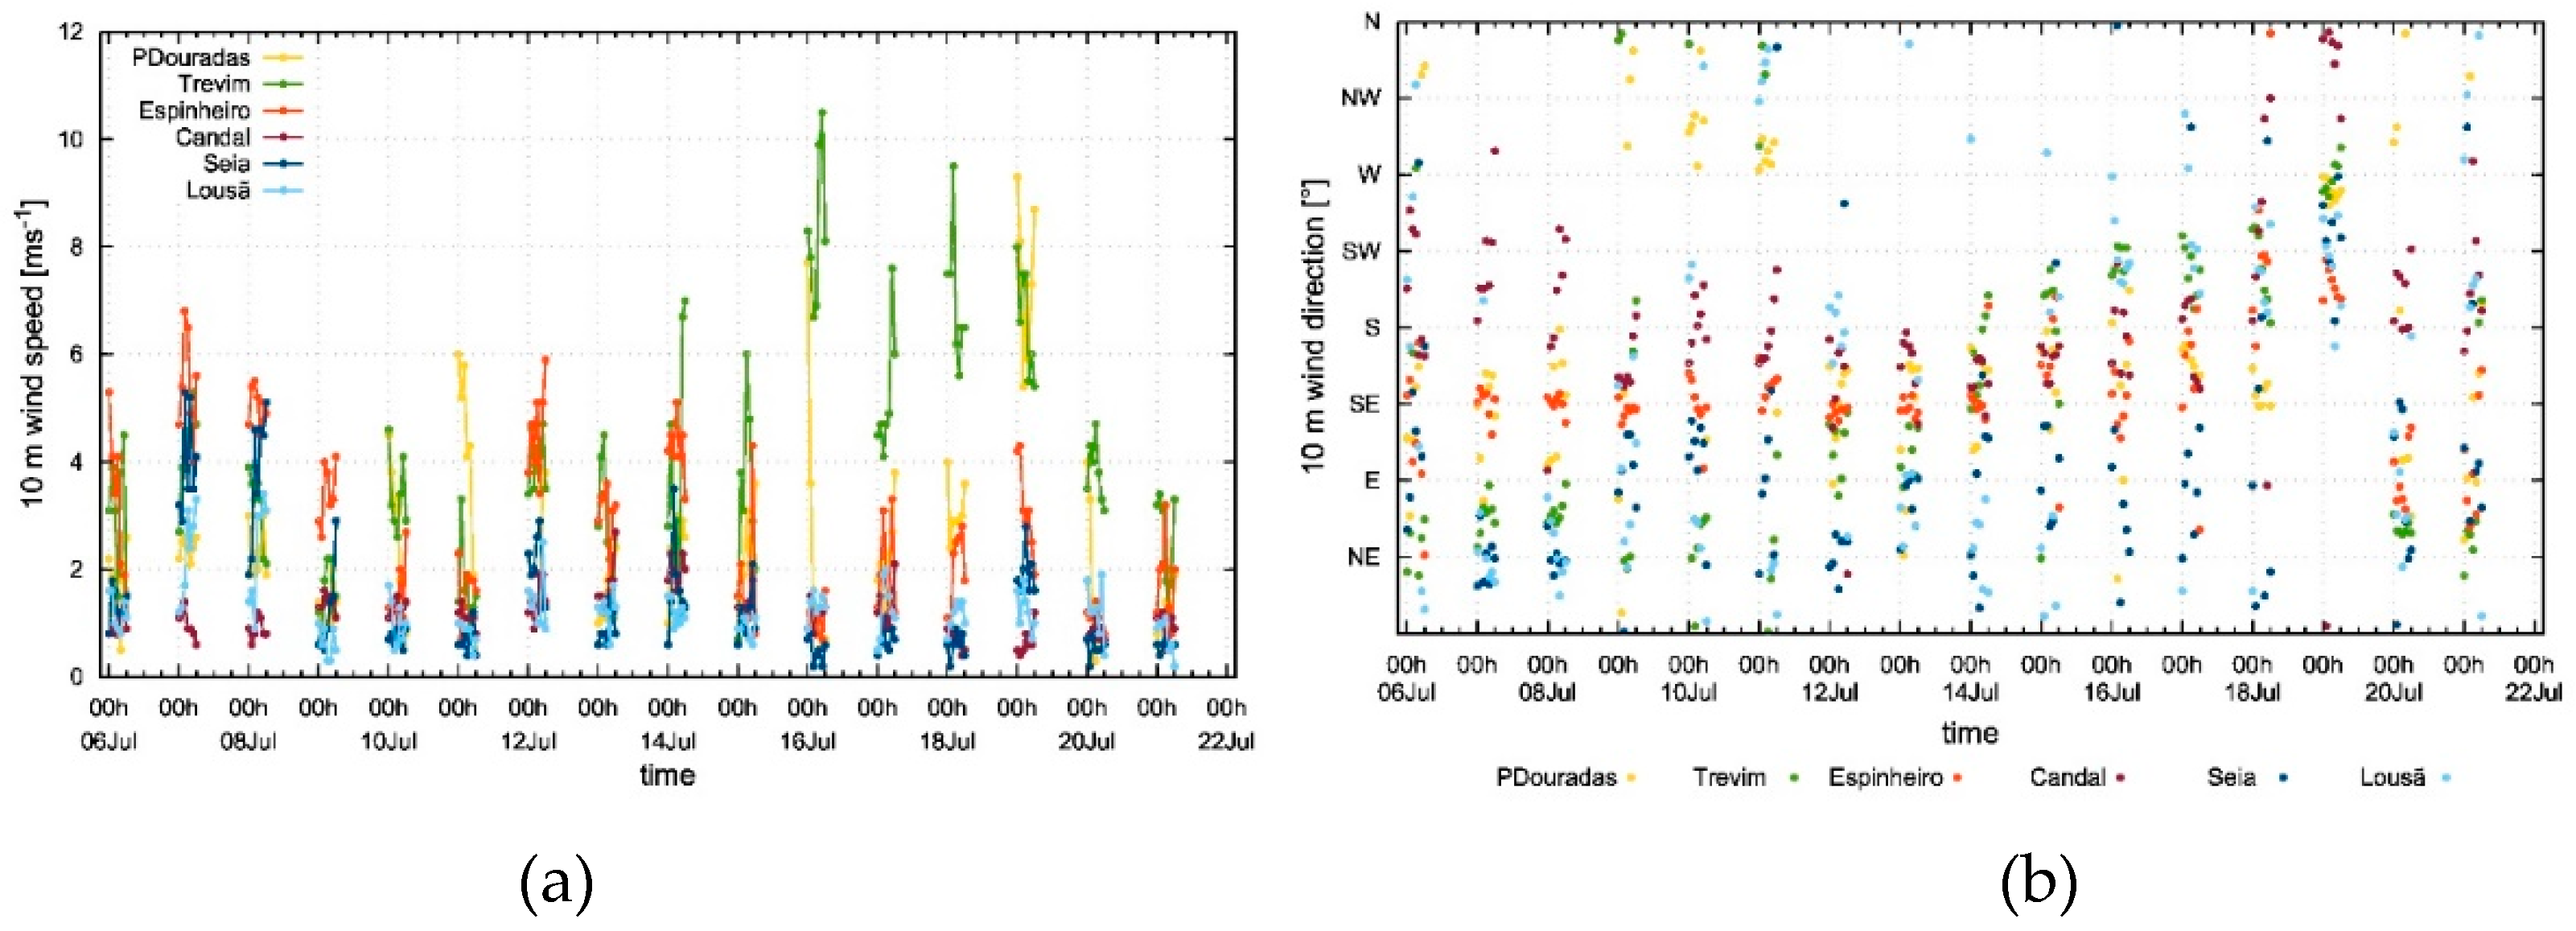
Although the valley stations frequently report values of 2 m relative humidity (Figure 21b) above 80% in the nighttime period, the daily variability may be quite large. As an example, in Seia there was a drop of 60% in the values of 2 m relative humidity between 11 and 12 July, with a change of wind direction to the northeast (Figure 22b). Additionally, although Lousã and Seia are only 60 km apart and weather conditions are usually similar, large differences may be observed between the valley stations. This was the case on 12 July, with values of 2 m relative humidity in Lousã higher than was recorded in Seia by around 40%. In the medium slope, the 2 m relative humidity in Candal is usually between the values observed in the valley and aloft. However, given the relevance of dry conditions to the propagation and spread of wildfires, it should be noticed that on 12-15 July the low values of 2 m relative humidity at this site were comparable to the ones observed at higher levels and were even the lowest recorded on 12-13 July 2022.
Overall, in dry periods, advection and large-scale subsidence are two mechanisms that lead to large variability of the near-surface relative humidity in the Lousã/Estrela mountain range. On 19 July dry air was only detected in Penhas Douradas (1380 m asl), with values of 2 m relative humidity around 30-50%, while at Espinheiro (995 m asl) it was close to 90%. In the following night dry air was detected at both sites, with the lowest values around 20% in Penhas Douradas and 45% in Espinheiro. This example shows that in this region the daily variations of the 2 m relative humidity may reach 40-50%. Additionally, the data also highlights large differences in the 2 m relative humidity intranight, with ranges around 50% observed in Penhas Douradas on July 18 and 19, which is likely a consequence of changes in the base height of elevated inversions.
In the period being assessed the highest values of 10 m wind speed (Figure 22a) were observed in Penhas Douradas. However, it should be highlighted that on several occasions the highest values of 10 m wind speed were observed either in Trevim or Espinheiro. On 14-18 July the highest values were detected in Trevim, with south/southwesterly winds, which is parallel to the main orientation of the mountain range. In Espinheiro, the highest values occurred on 7-8 and 12 July, with southeasterly winds, which implies a flow perpendicular to the orientation of the mountain range. These observations suggest that strong interaction between the flow and the topography is likely to have occurred.

5. Final remarks

The largest wildfire in mainland Portugal, since the catastrophic events in 2017, occurred in mid-August 2022, burning around 25.000 ha in approximately 10 days. It affected the Estrela National Park (Seia/Penhas Douradas), which is partly located in the region of interest of this study. The wildfire started on the eastern slope, moved westwards upslope and crossed the main ridge (around 1200-1400 m asl). Eventually it went downslope and burned swathe areas in the western slope. In this complex event, with the onset of a strong westerly flow, the wildfire ultimately returned to the eastern slope. This event, with spread rates up to 3 km/h, highlights the usefulness of this study as it raises awareness to the high variability of the weather conditions in the region, namely in elevations above 1200 m, despite they cover less than 2% of the area of mainland Portugal.
In the framework of the FireStorm project, four portable surface automatic weather stations were installed in the Lousã/Estrela mountain range, which is an area with complex terrain and prone to large wildfires in mainland Portugal. Together with two surface weather stations from IPMA’s network, these six stations improve the monitoring of the vertical variability of temperature, relative humidity and wind in the Lousã/Seia region. The portable weather stations have been working since March 2021 with high data availability.
This study improves the understanding about the role that local weather can have in extreme fire behaviour in mainland Portugal, which becomes even more relevant as recent work suggests that fire intensity is globally increasing during the nighttime. The paper showed the first assessment of the observed meteorological data, with the main focus on the nighttime period in the summer seasons of 2021 and 2022. The results included the average observed weather conditions and provided an insight into the large vertical variability, both intraday and in selected periods. The results shown highlight that the sea-breeze circulation and the persistent influence of the Azores subtropical high-pressure system play a key role in the vertical variability of the weather conditions in the region. Furthermore, the observed data gives some evidence on the interaction between the atmospheric circulation and the topography, namely in events with a strong east/southeasterly flow.
The data from the six weather stations is beneficial in operational weather forecasting and as a source of valuable observed weather conditions in case of active wildfires in this area. Given the high variability observed, the results suggest that installing three additional AWS in the medium slope might be useful as they would increase the monitoring in a particularly vulnerable area. Finally, this study may create the opportunity to extend the framework utilized in this project to other locations in mainland Portugal, namely the ones with complex terrain and prone to wildfires.

Supplementary Materials

The following supporting information can be downloaded at the website of this paper posted on Preprints.org.

Author Contributions

Conceptualisation, J.R.; methodology, J.R.; visualization: J.R. and P.S.; resources: J.R.; writing—original draft: J.R. and writing—review and editing: J.R, M.L., P.S., I.N. All authors have read and agreed to the published version of the manuscript.

Funding

This research was funded by the research projects supported by the Portuguese Science and Technology Foundation—FCT: “FireStorm: Meteorology and fire storm behaviour” under the reference PCIF/GFC/0109/2017.

Institutional Review Board Statement

Not applicable.

Informed Consent Statement

Not applicable.

Data Availability Statement

Data available upon request.

Acknowledgments

The installation of the portable surface weather stations was only possible with a close and fruitful cooperation between IPMA (Jorge Neto, João Rio, Ilda Novo), the Association for the Development of Industrial Aerodynamics - ADAI (Luís Reis, Daniela Alves and Professor Domingos Xavier) and the Local Municipalities of Lousã and Seia. We thank one anonymous reviewer for the insightful comments that helped improve this paper.

Conflicts of Interest

The authors declare no conflict of interest.

Abbreviations

asl—above sea level; AWS – surface automatic weather station; ECMWF—European Centre for Medium Range Weather Forecasts; ECMWF-HRES—High Resolution Operational Weather Forecast from ECMWF; EI – elevated temperature inversion; IPMA—Instituto Português do Mar e da Atmosfera/Institute for Sea and Atmosphere; NWP—Numerical Weather Prediction; UTC— Coordinated Universal Time.

References

  1. Miranda, P.M.; Coelho, F.; Tomé, A.; Valente, M.; Carvalho, A.; Pires, C.; Pires, H.; Pires, V.; Ramalho, C. 20th century Portuguese Climate and Climate Scenarios, in Santos, F.D., K. Forbes, and R. Moita (eds), 2002, Climate Change in Portugal: Scenarios, Impacts and Adaptation Measures (SIAM Project), 23-83, Gradiva, 454 pp.
  2. Mora, C.; Vieira, G. The Climate of Portugal. In: Vieira, G., Zêzere, J., Mora, C. (eds) Landscapes and Landforms of Portugal. World Geomorphological Landscapes. Springer, Cham, 2020, pp 33-46.
  3. Trigo, R.M.; Pereira, J.M.; Pereira, M.G.; Mota, B.; Calado, T.J.; da Câmara, C. and Santo, F.E. Santo. Atmospheric conditions associated with the exceptional fire season of 2003 in Portugal. Int. J. Climatol., 2006, 26, 1741–1757. [Google Scholar] [CrossRef]
  4. Trigo, R.M.; Sousa, P.M.; Pereira, M.G.; Rasilla, D. and Gouveia, C. M. Modelling wildfire activity in Iberia with different atmospheric circulation weather types. Int. J. Climatol., 2016, 36, 2761–2778. [Google Scholar] [CrossRef]
  5. Pereira, M.; Trigo, R.; Camara, C.; Pereira, J. and Leite, S. Synoptic patterns associated with large summer forest fires in Portugal. Agric For Meteorol, 2005, 129, 11–25. [Google Scholar] [CrossRef]
  6. Vieira, I.; Russo, A.; M. Trigo, R. Identifying Local-Scale Weather Forcing Conditions Favourable to Generating Iberia’s Largest Fires. Forests, 2020, 11, 547. [Google Scholar] [CrossRef]
  7. Russo, A.; Gouveia, C.M.; Páscoa, P.; da Câmara, C.C.; Sousa, P.M. and Trigo, R.M. Assessing the role of drought events on wildfires in the Iberian Peninsula. Agric For Meteorol, 2017, 237, 50–59. [Google Scholar] [CrossRef]
  8. Carmo, M.; Ferreira, J.P.; Mendes, M.T.; Silva, Á.; Silva, P.C.; Alves, D.; Reis, L.C.D.; Novo, I.; Viegas, D.X. The climatology of extreme wildfires in Portugal, 1980-2018: Contributions to forecasting and preparedness. Int J Climatol 2022, 42, 3123–3146. [Google Scholar] [CrossRef]
  9. Potter, Brian. Atmospheric interactions with wildland fire behaviour - I. Basic surface interactions, vertical profiles and synoptic structures. Int. J. Wildland Fire, 2012, 21, 779. [Google Scholar] [CrossRef]
  10. Mills, G. A. and McCaw, W. L. Atmospheric stability environments and fire weather in Australia: extending the Haines index. Centre for Australian Weather, Climate Research Melbourne, Australia, 2010.
  11. Chaboureau, J.P.; Guichard, F.; Redelsperger, J.-L. and Lafore, J.-P. The role of stability and moisture in the diurnal cycle of convection over land. Q. J. R. Meteorol. Soc., Wiley, 2004, 130, 3105–3117. [Google Scholar] [CrossRef]
  12. Stevens, B. Atmospheric Moist Convection. Annual Review of Earth and Planetary Sciences 2005, 33, 605–643. [Google Scholar] [CrossRef]
  13. Pinto, P.; Silva, Á.P.; Viegas, D.X.; Almeida, M.; Raposo, J.; Ribeiro, L.M. Influence of Convectively Driven Flows in the Course of a Large Fire in Portugal: The Case of Pedrógão Grande. Atmosphere, 2022, 13, 414. [Google Scholar] [CrossRef]
  14. Kalashnikov, D.; Abatzoglou, J.; Nauslar, N.; Swain, D.; Touma, D.; Singh, D. Meteorological and geographical factors associated with dry lightning in central and northern California. Environ. Res.: Climate, 2022; 1, 025001.
  15. Pérez-Invernón, F. J.; Huntrieser, H.; Soler, S.; Gordillo-Vázquez, F. J.; Pineda, N.; Navarro-González, J.; Reglero, V.; Montanyà, J.; Van der Velde, O. and Koutsias, N. Lightning-ignited wildfires and long continuing current lightning in the Mediterranean Basin: preferential meteorological conditions, Atmos. Chem. Phys., 2021, 21, 17529–17557. [Google Scholar]
  16. Análise das Causas dos Incêndios Florestais. ICNF, Lisbon, Portugal, 2014 (In Portuguese).
  17. 8º Relatório Provisório de Incêndios Rurais. ICNF, Lisbon, Portugal, 2022 (In Portuguese).
  18. Rio, J. Probabilidade de ocorrência de trovoada seca. Nota Técnica DivMV 08/2020, IPMA, Lisbon, Portugal. 2020 (In Portuguese).
  19. Prior, V. Estrutura Termomecânica da baixa troposfera associada ao regime de brisas em Portugal. Ph.D. Dissertation, University of Aveiro, Portugal, 2006. (In Portuguese). [Google Scholar]
  20. Pinto, P. Avaliação do desempenho das previsões do modelo AROME: posicionamento de frentes de brisa. DORE, IPMA, Lisbon, Portugal, 2011 (In Portuguese).
  21. Martins, J.; Cardoso, R.; Soares, P.; Trigo, I.; Belo-Pereira, M.; Moreira, N.; Tomé, R. The summer diurnal cycle of coastal cloudiness over west Iberia using Meteosat/SEVIRI and a WRF regional climate model simulation, Int. J. Climatolol., 2016, 36, 1755–1772. [Google Scholar] [CrossRef]
  22. Sharples, J.J. An overview of mountain meteorological effects relevant to fire behaviour and bushfire risk. Int. J. Wildland Fire 2009. [Google Scholar] [CrossRef]
  23. Werth, P. A.; Potter, B. E.; Clements, C. B.; Finney, M. A.; Goodrick, S. L.; Alexander, M. E.; Cruz, M. G.; Forthofer, J. A.; McAllister, S. S. Synthesis of knowledge of extreme fire behavior: volume I for fire managers. Gen. Tech. Rep. PNW-GTR-854. Portland, OR: U.S. Department of Agriculture, Forest Service, Pacific Northwest Research Station. 2011, 144 p.
  24. Fernando, H. J. S., Pardyjak, E. R., Di Sabatino, S., Chow, F. K., De Wekker, S. F. J., Hoch, S. W., Hacker et al. The MATERHORN: Unraveling the Intricacies of Mountain Weather. Bull. Amer. Meteorol. Soc. 2015, 96, 1945–1967.
  25. Whiteman, C. D. Mountain Meteorology: Fundamentals and Applications, Oxford Univ. Press, New York, 2000, 355 pp.
  26. Durran, D.R. Mountain Waves and Downslope Winds. In: Blumen, W. (eds) Atmospheric Processes over Complex Terrain. Meteorological Monographs, vol 23. American Meteorological Society, Boston, MA, 1990.
  27. Belcher, S.E.; Hunt, J.C.R. Turbulent flow over hills and waves. Annual Review of Fluid Mechanics 1998, 30, 507–538. [Google Scholar] [CrossRef]
  28. Smith, R. B.; Gleason, A. C.; Gluhosky, P. A.; Grubišić, V. The Wake of St. Vincent. J Atmos Sci. 1997, 54, 606–623. [Google Scholar] [CrossRef]
  29. Hertenstein, R.F.; Joachim, P. K. Rotor types associated with steep lee topography: influence of the wind profile. Tellus A. 2005, 57, 117–135. [Google Scholar] [CrossRef]
  30. Blackadar, A. K. Boundary Layer Wind Maxima and their Significance for the Growth of Nocturnal Inversions, Bull. Amer. Meteorol. Soc., 1957, 38, 283–290. [Google Scholar] [CrossRef]
  31. Banta, R.; Newsom, R.K.; Lundquist, J.K.; et al. Nocturnal Low-Level Jet Characteristics Over Kansas During Cases-99. Boundary-Layer Meteorology, 2002, 105, 221–252. [Google Scholar] [CrossRef]
  32. Davis, P. Development and mechanisms of the nocturnal jet. Meteorol. Appl. 2000, 7, 239–246. [Google Scholar]
  33. Palarz, A.; Celiński-Mysław, D. and Ustrnul, U. Temporal and spatial variability of elevated inversions over Europe based on ERA-Interim reanalysis. Int. J. Climatol., 2020, 40, 1335–1347. [Google Scholar] [CrossRef]
  34. Palarz, A., Luterbacher, J., Ustrnul, Z., Xoplaki, E. and Celiński-Mysław, D. Representation of low-tropospheric temperature inversions in ECMWF reanalyses in Europe. Environ. Res. Lett. 2020, 15, 074043. [CrossRef]
  35. Stull, R.B. An Introduction to Boundary Layer Meteorology. Kluwer Academic, Publishers, Dordrecht, 1998, 666 pp.
  36. LeMone, M. A.; Angevine, W. M.; Bretherton, C. S.; Chen, F.; Dudhia, J.; Fedorovich, E.; et al. 100 years of progress in boundary layer meteorology. Meteorological Monographs, 2019, 59, 9.1–9.85. [Google Scholar] [CrossRef]
  37. Poulos, G. S.; Blumen, W.; Fritts, D. C.; Lundquist, J. K.; Sun, J.; Burns, S. P.; Nappo, C.; Banta, R.; Newsom, R.; Cuxart, J.; Terradellas, E.; Balsley, B.; Jensen, M. CASES-99: A Comprehensive Investigation of the Stable Nocturnal Boundary Layer. Bull. Amer. Meteorol. Soc. 2002, 83, 555–582. [Google Scholar] [CrossRef]
  38. Goens, D.W. Forecast guidelines for fire weather and forecasters, how nighttime humidity affects wildland fuels. Series: NOAA technical memorandum NWS WR, 1989, 205.
  39. Balch, J.K.; Abatzoglou, J.T.; Joseph, M.B.; et al. Warming weakens the night-time barrier to global fire. Nature, 2022, 602, 442–448. [Google Scholar] [CrossRef]
  40. Xavier, D.; Almeida, M. , Ribeiro, L. et al. Análise dos Incêndios Florestais Ocorridos em 15 de outubro de 2017. ADAI/LAETA, Centro de Estudos sobre Incêndios Florestais (CEIF), Coimbra University, Coimbra, Portugal, 2019 (In Portuguese).
  41. Novo, I.; Pinto, P.; Rio, J. and Gouveia, C. Fires in Portugal on 15th October 2017: A Catastrophic Evolution, In Advances in Forest Fire Research 2018. Eds. Coimbra University Press, Coimbra, Portugal, 2018, pp. 57–70. 20 October.
  42. Fernando, H. J. S.; Mann, J.; Palma, J. M. L. M.; Lundquist, J. K.; Barthelmie, R.J.; Belo-Pereira, M.; Brown, W.O.J.; et al. The Perdigão: Peering into Microscale Details of Mountain Winds. In Bull. Am. Meteorol.; 2019; Volume 100, pp. 799–819.
  43. Silva, P.; Carmo, M.; Rio, J.; Novo, I. Changes in the Seasonality of Fire Activity and Fire Weather in Portugal: Is the Wildfire Season Really Longer? . Meteorology 2023, 2, 74–86. [Google Scholar] [CrossRef]
  44. Novo, I.; Ferreira, J.; Silva, P.; Ponte, J.; Moreira, N.; Ramos, R., Rio, J. and Cardoso, E. Large Fires in Portugal and Synoptic Circulation Patterns: meteorological parameters and fire danger indices associated with the critical weather types. In Proceedings of the 9th International Conference on Forest Fire Research, Coimbra, Portugal, 14-18 November 2022.
  45. Haraldur, O. and Bao, J.W. Uncertainties in numerical weather prediction, 1st ed. Elsevier, 2021, 364 pp.
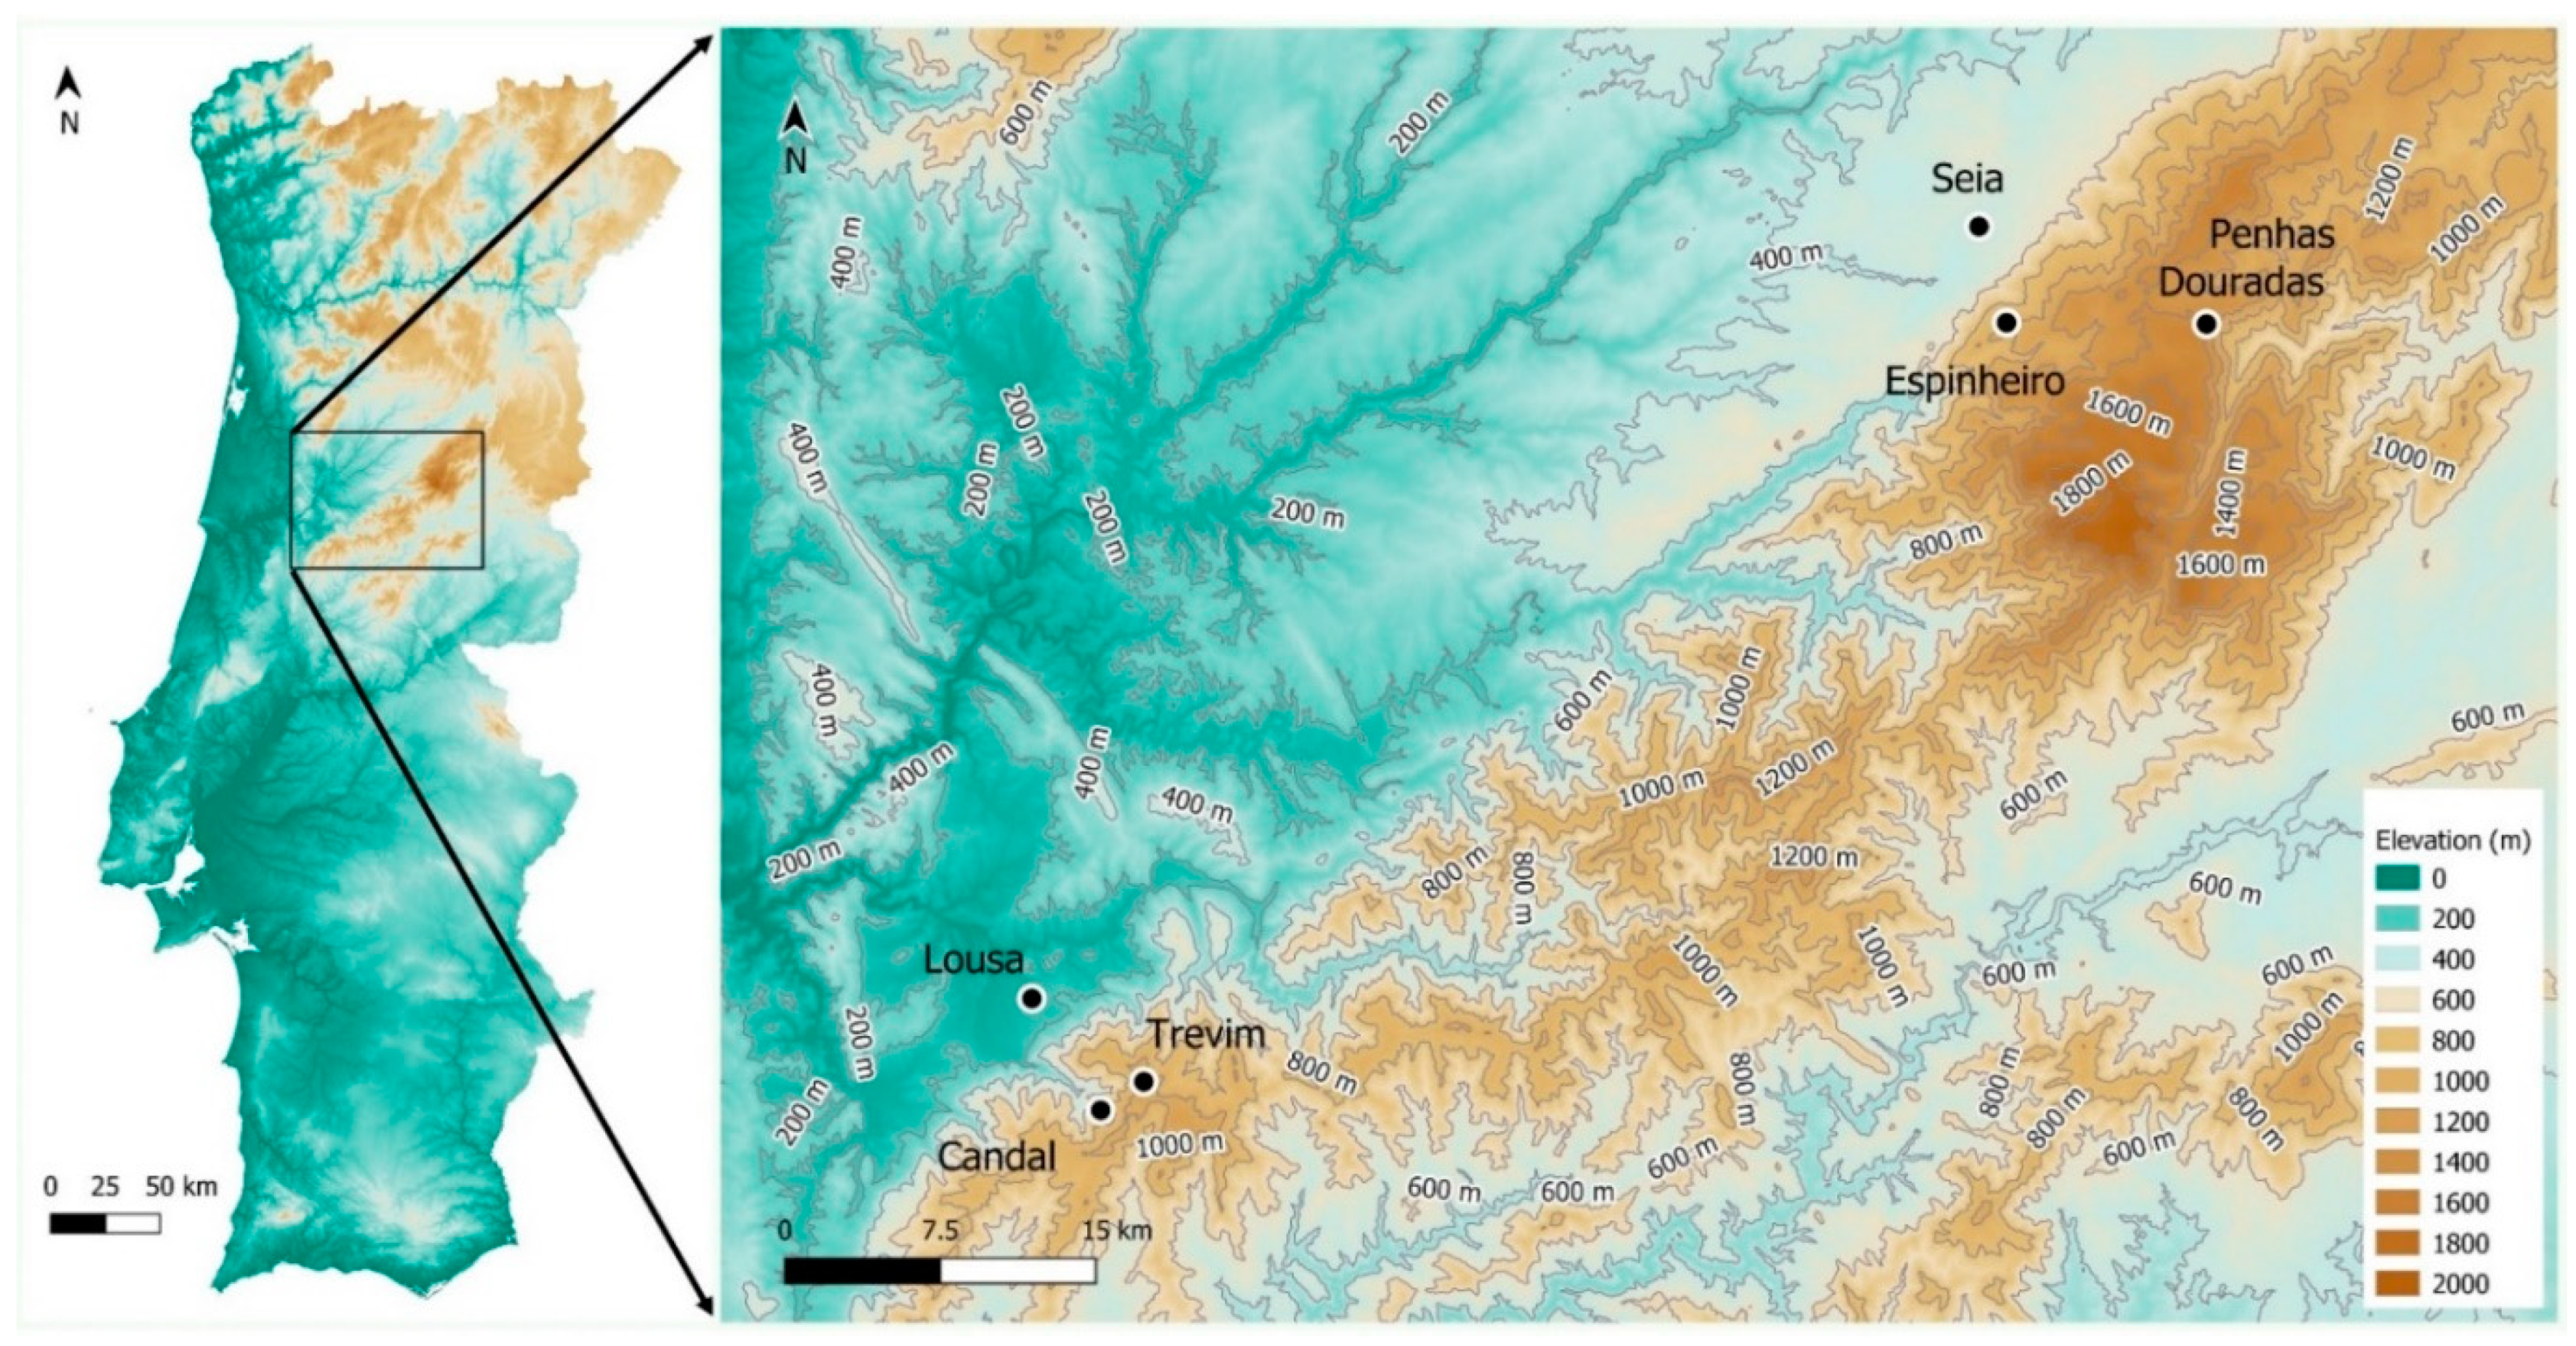
Figure 1. Location of Lousã/Estrela region and the surface weather stations used in this study.
Preprints 74618 g001
Figure 2. Daily cycle of the average (a) and extreme minimum/maximum (b) values of the 2 m temperature.
Preprints 74618 g002
Figure 3. Daily cycle of the average (a) and extreme minimum (b) values of the 2 m relative humidity.
Preprints 74618 g003
Figure 4. Daily cycle of the average (a) and extreme maximum (b) values of the 10 m wind speed.
Preprints 74618 g004
Figure 5. Wind roses of the 10 m wind in Penhas Douradas (a), Trevim (b), Candal (c) and Seia (d).
Preprints 74618 g005aPreprints 74618 g005b
Figure 6. Daily cycle of the frequency of westerly winds in the Lousã/Seia region.
Preprints 74618 g006
Figure 7. Vertical gradient (a) and difference (b) of the 2 m temperature, in the nighttime period, between selected weather stations in the Lousã/Seia region. Boxes indicate the 5 and 95 percentiles, whereas whiskers encompass minimum and maximum value of the observed variable. Median is displayed as the central solid line through the boxes and average value is shown by the dot.
Preprints 74618 g007
Figure 8. Vertical gradient (a) and difference (b) of the 2 m relative humidity, in the nighttime period, between selected weather stations in the Lousã/Seia region. Boxes indicate the 5 and 95 percentiles, whereas whiskers encompass minimum and maximum value of the observed variable. Median is displayed as the central solid line through the boxes and average value is shown by the dot.
Preprints 74618 g008
Figure 9. Vertical gradient (a) and difference (b) of the 10 m wind speed, in the nighttime period, between selected weather stations in the Lousã/Seia region. Boxes indicate the 5 and 95 percentiles, whereas whiskers encompass minimum and maximum value of the observed variable. Median is displayed as the central solid line through the boxes and average value is shown by the dot.
Preprints 74618 g009
Figure 10. Time-series of the observed hourly values of the 2 m temperature (a) and relative humidity (b), in the Lousã/Seia region. Data for the nighttime period between 00 UTC on 17 July 2021 and 12 UTC on 24 July 2021.
Preprints 74618 g010
Figure 11. Time-series of the observed hourly values of the 2 m dew point temperature (a) and 10 m wind speed (b), in the Lousã/Seia region. Data for the nighttime period between 00 UTC on 17 July 2021 and 12 UTC on 24 July 2021.
Preprints 74618 g011
Figure 12. Cross-section of the potential temperature, relative humidity, cloud cover, vertical wind speed (negative values in shaded) and 3d wind (parallel component). ECMWF-HRES short-range forecast (H+6), valid at 06 UTC on 20 July 2021.
Preprints 74618 g012
Figure 13. ECMWF-HRES short-range vertical profile forecast in Lousã, valid at 06 UTC on 20 July 2021.
Preprints 74618 g013
Figure 14. Time-series of the observed hourly values of the 2 m temperature (a) and relative humidity (b), in the Lousã/Seia region. Data for the nighttime period between 00 UTC on 11 August 2021 and 12 UTC on 17 August 2021.
Preprints 74618 g014
Figure 15. Time-series of the observed hourly values of the 2 m dew point (a) and 10 m wind speed (b), in the Lousã/Seia region. Data for the nighttime period between 00 UTC on 11 August 2021 and 12 UTC on 17 August 2021.
Preprints 74618 g015
Figure 16. Cross-section of the potential temperature, relative humidity, cloud cover, vertical wind speed (negative values in shaded) and 3d wind (parallel component). ECMWF-HRES short-range forecast (H+6), valid at 06 UTC on 14 August 2021.
Preprints 74618 g016
Figure 17. ECMWF-HRES short-range vertical profile forecast in Lousã, valid at 06 UTC on 14 August 2021.
Preprints 74618 g017
Figure 18. Time-series of the observed hourly values of the 2 m temperature (a) relative humidity (b), in the Lousã/Seia region. Data for the nighttime period between 00 UTC on 19 May 2022 and 12 UTC on 23 May 2022.
Preprints 74618 g018
Figure 19. Time-series of the observed hourly values of the 10 m wind speed (a) and gust (b), in the Lousã/Seia region. Data for the nighttime period between 00 UTC on 19 May 2022 and 06 UTC on 23 May 2022.
Preprints 74618 g019
Figure 20. Cross-section of the potential temperature, relative humidity, vertical wind speed (negative values in shaded) and 3d wind (parallel component). ECMWF-HRES short-range forecast (H+6), valid at 06 UTC on 21 May 2022.
Preprints 74618 g020
Figure 21. Time-series of the observed hourly values of the 2 m temperature (a) and relative humidity (b), in the Lousã/Seia region. Data for the nighttime period between 00 UTC on 6 July 2022 and 12 UTC on 21 July 2022.
Preprints 74618 g021
Figure 22. Time-series of the observed hourly values of the 10 m wind speed (a) and direction (b), in the Lousã/Seia region. Data for the nighttime period between 00 UTC on 6 July 2022 and 12 UTC on 21 July 2022.
Preprints 74618 g022
Table 1. Identification of the surface weather stations used in this study.
Region Station Name Latitude (°N) Longitude (°W) Elevation [m] Description Source
Seia Penhas Douradas 40.41 7.56 1380 Small plateau on the ridge IPMA
Espinheiro 40.41 7.67 995 Medium slope IPMA/FireStorm
Seia 40.46 7.69 438 Open valley IPMA/Firestorm
Lousã Trevim 40.09 8.18 1167 Ridge IPMA/FireStorm
Candal 40.08 8.20 621 Narrow valley in medium slope IPMA/FireStorm
Lousã 40.13 8.24 195 Open valley IPMA
Disclaimer/Publisher’s Note: The statements, opinions and data contained in all publications are solely those of the individual author(s) and contributor(s) and not of MDPI and/or the editor(s). MDPI and/or the editor(s) disclaim responsibility for any injury to people or property resulting from any ideas, methods, instructions or products referred to in the content.
Copyright: This open access article is published under a Creative Commons CC BY 4.0 license, which permit the free download, distribution, and reuse, provided that the author and preprint are cited in any reuse.
Prerpints.org logo

Preprints.org is a free preprint server supported by MDPI in Basel, Switzerland.

Subscribe

© 2024 MDPI (Basel, Switzerland) unless otherwise stated