Submitted:
25 May 2023
Posted:
26 May 2023
You are already at the latest version
Abstract
Keywords:
1. Introduction
2. Materials and Methods
2.1. Fish maintenance
2.2. Exposure Conditions
2.3. Histology and Histopathological assessment
2.4. Lipid droplets content
2.5. Quantitative Real-Time PCR
3. Results
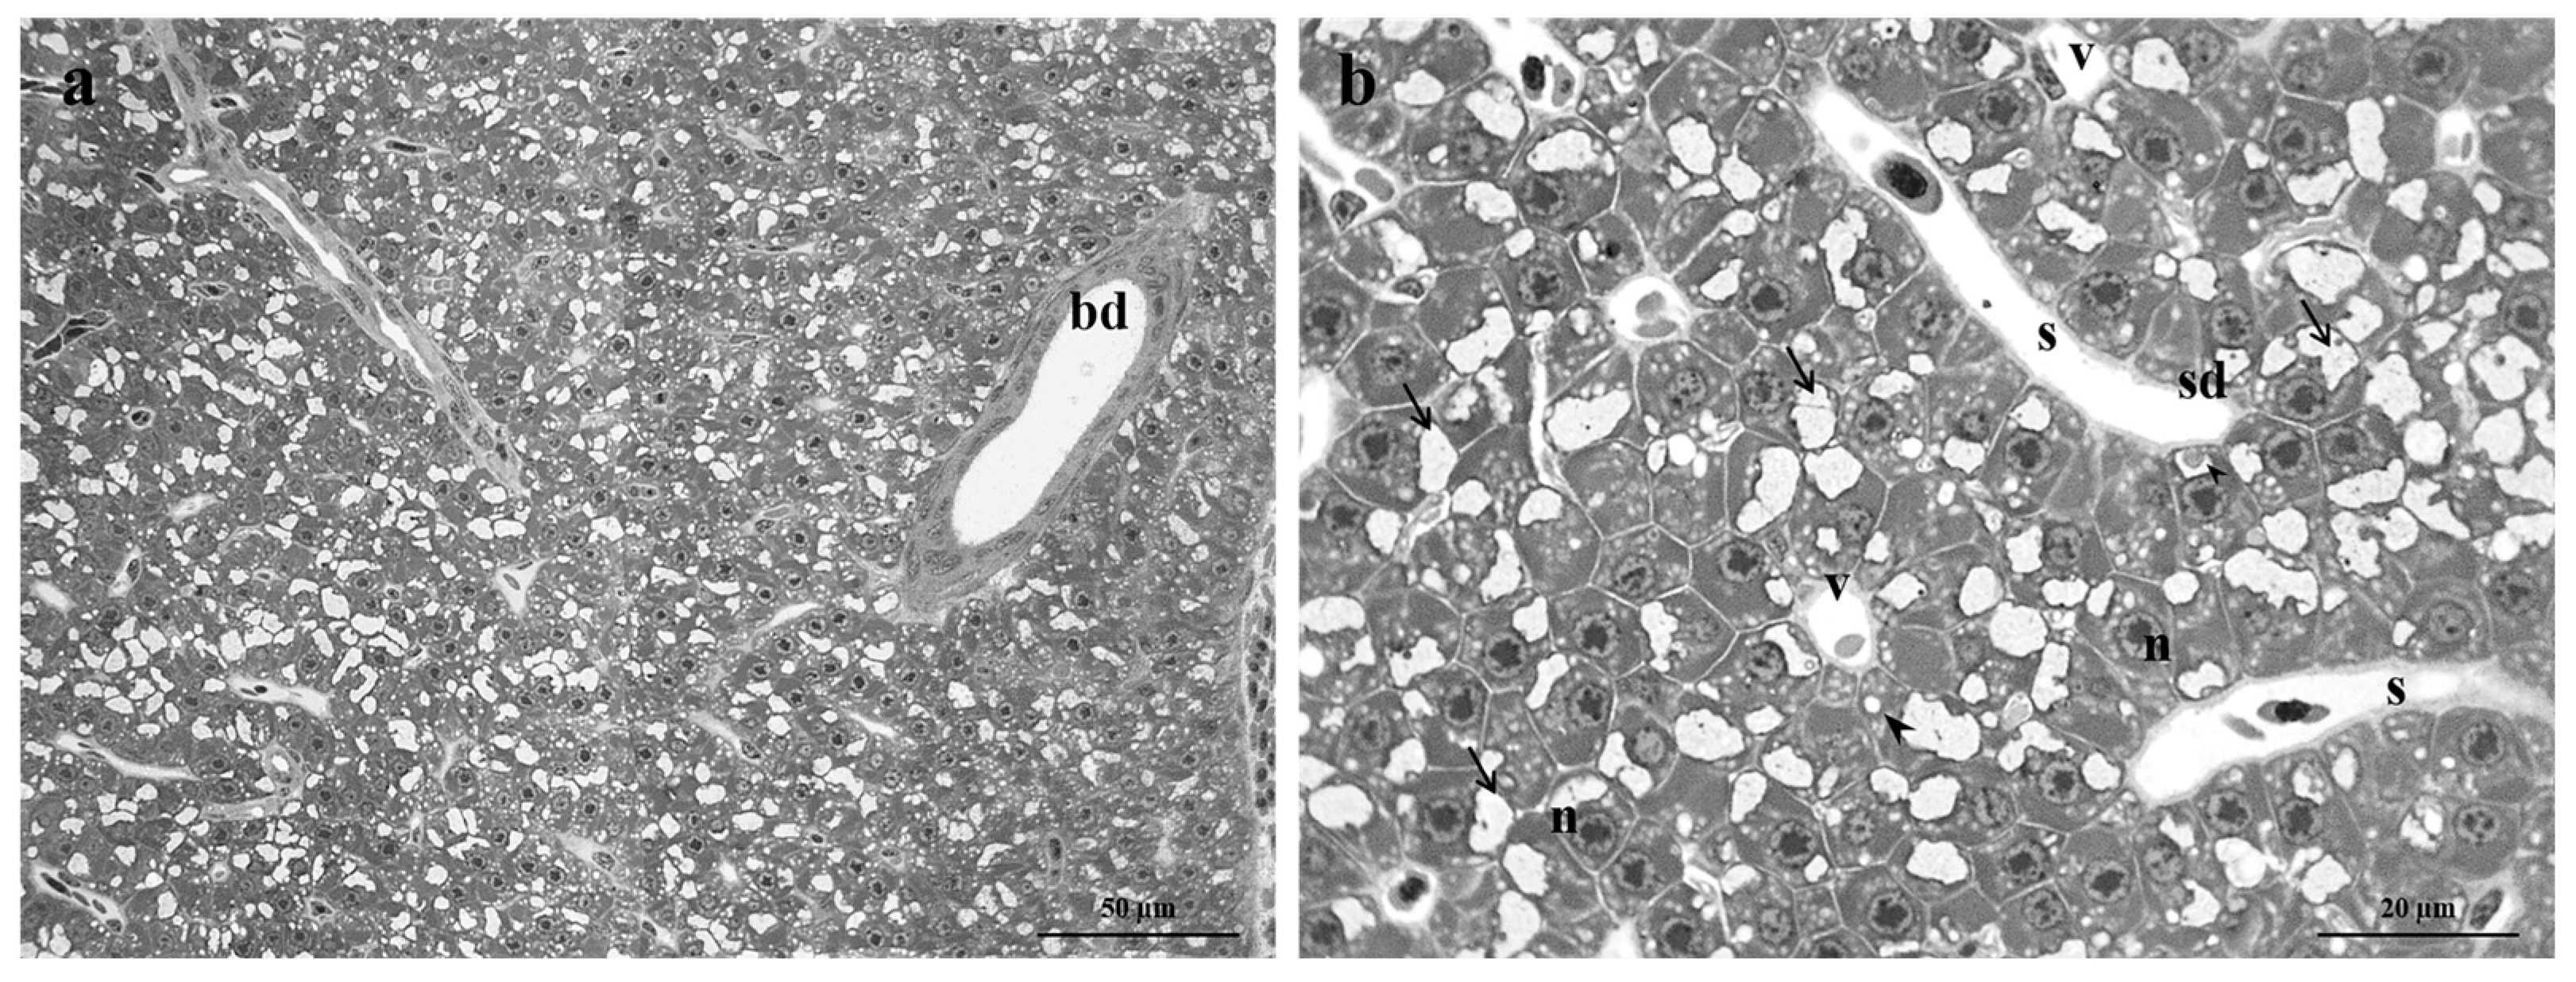
3.1. Control group
3.2. Exposed group
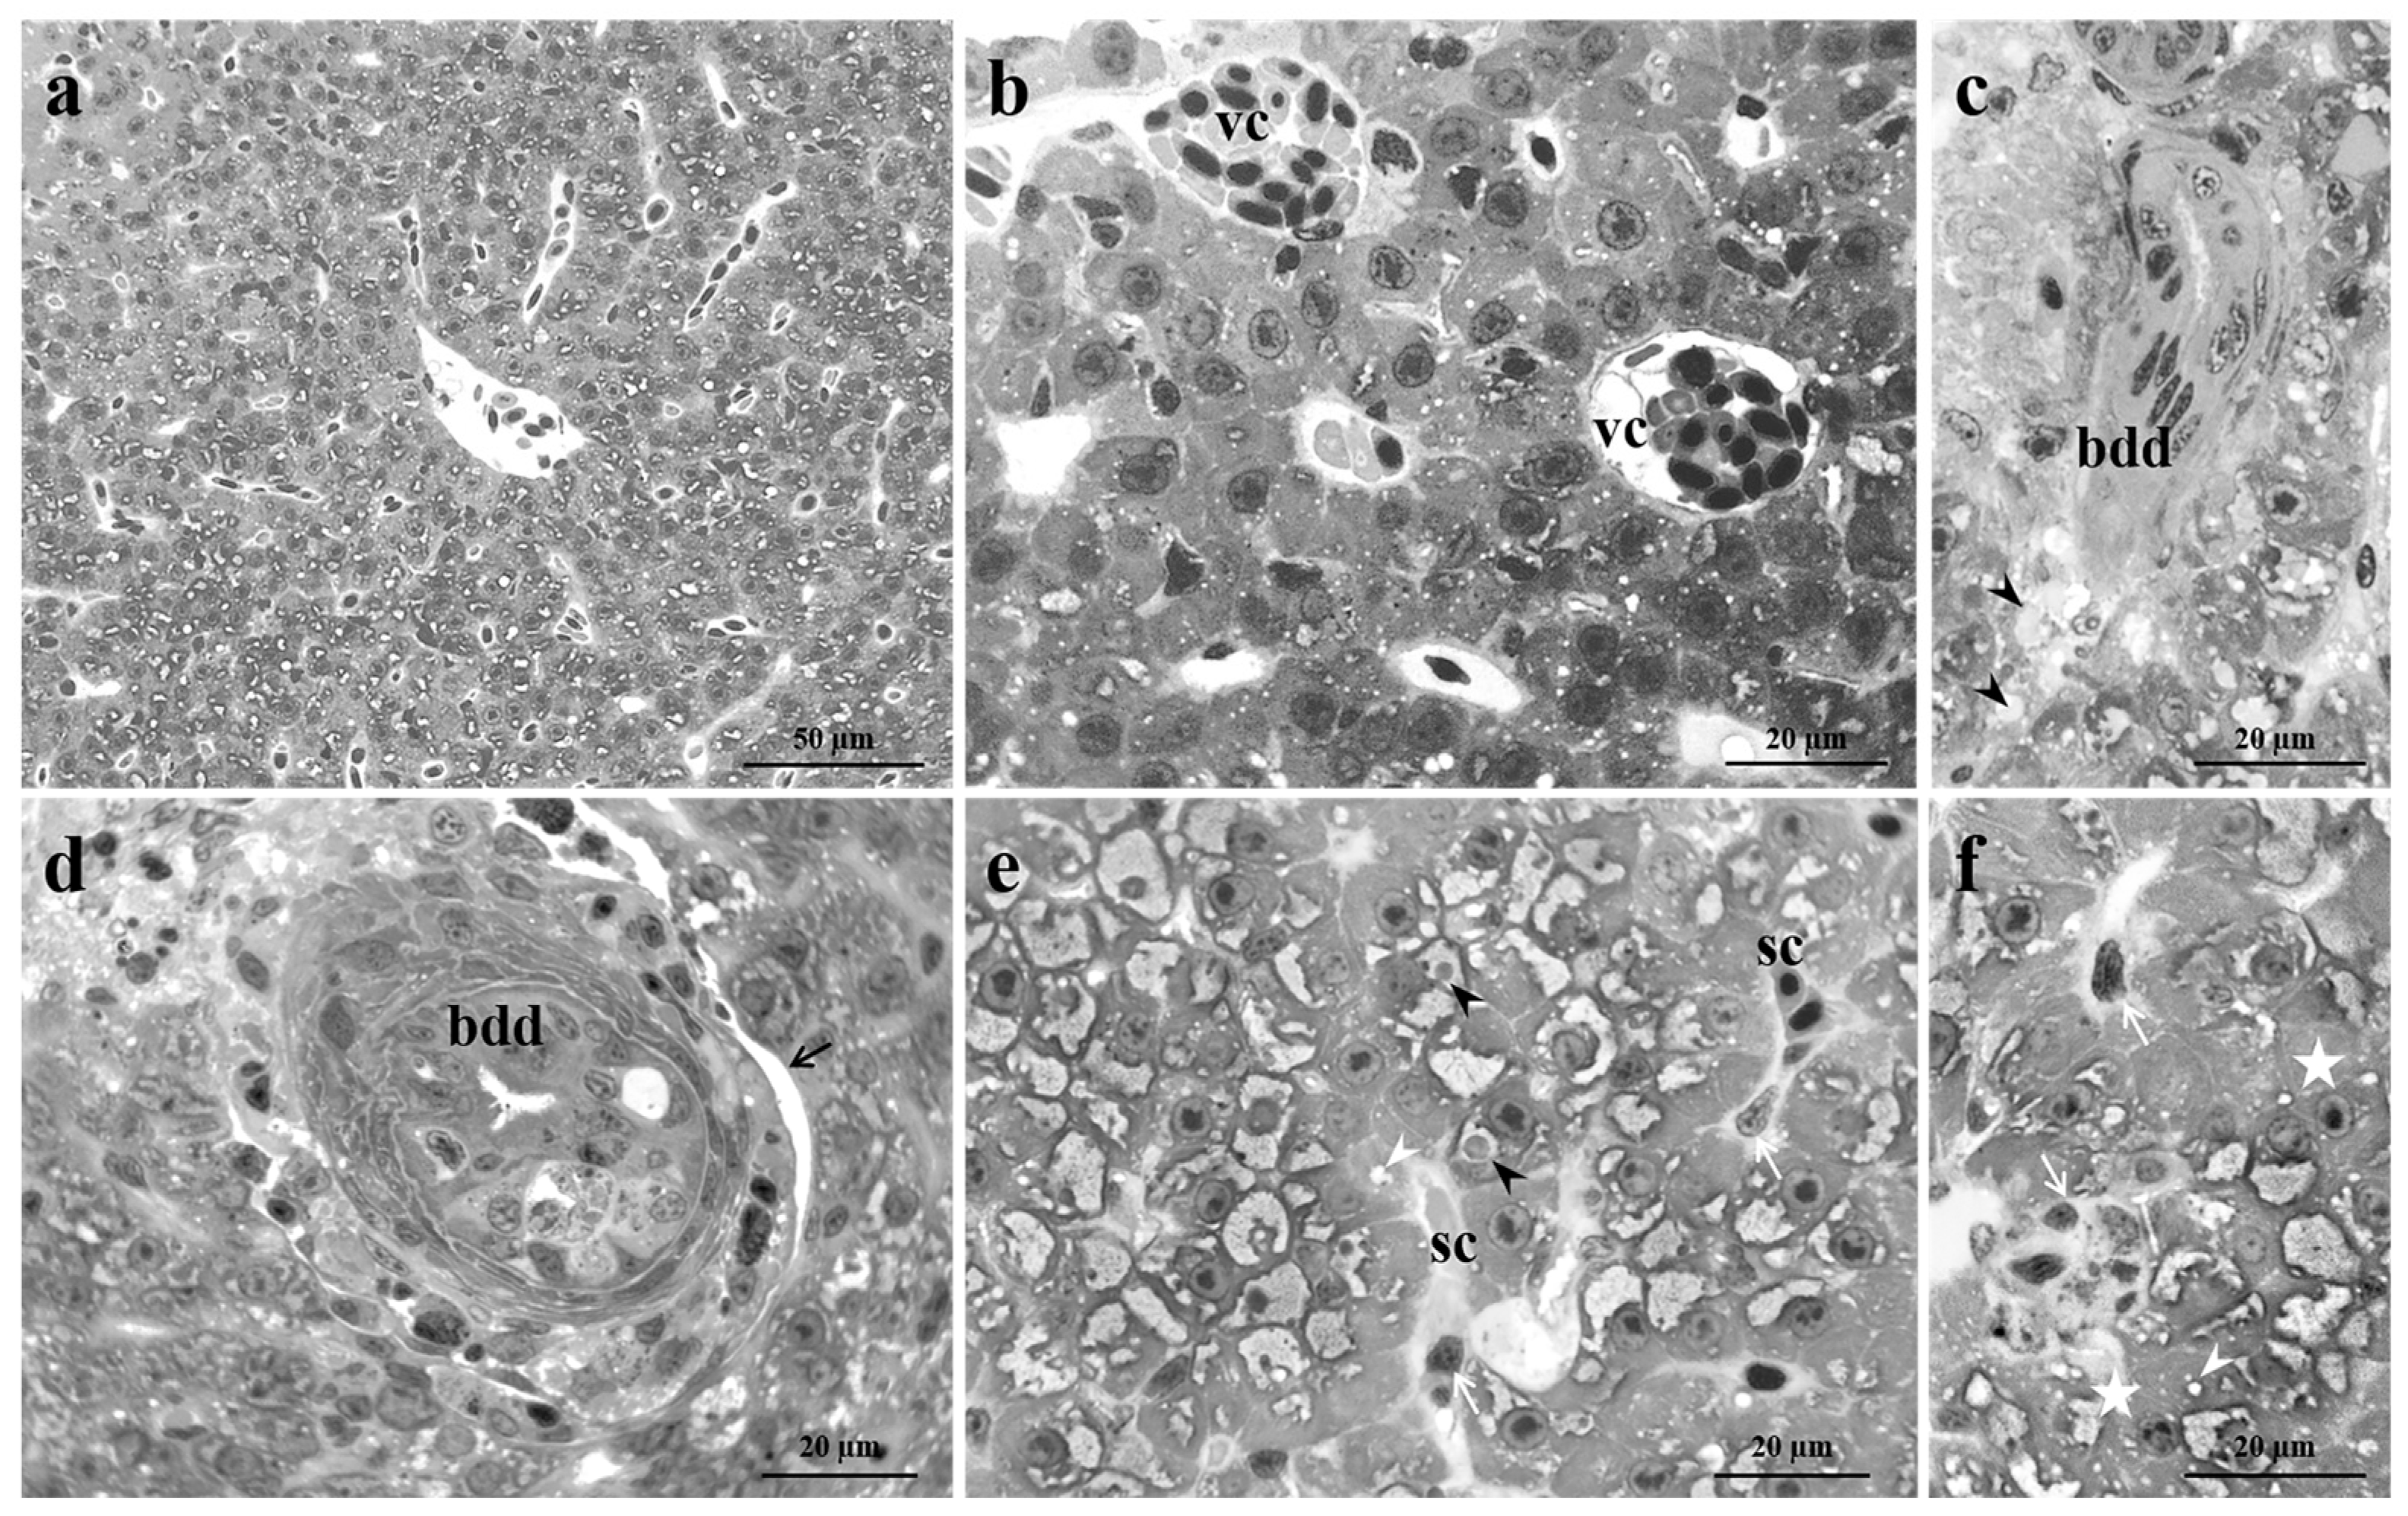
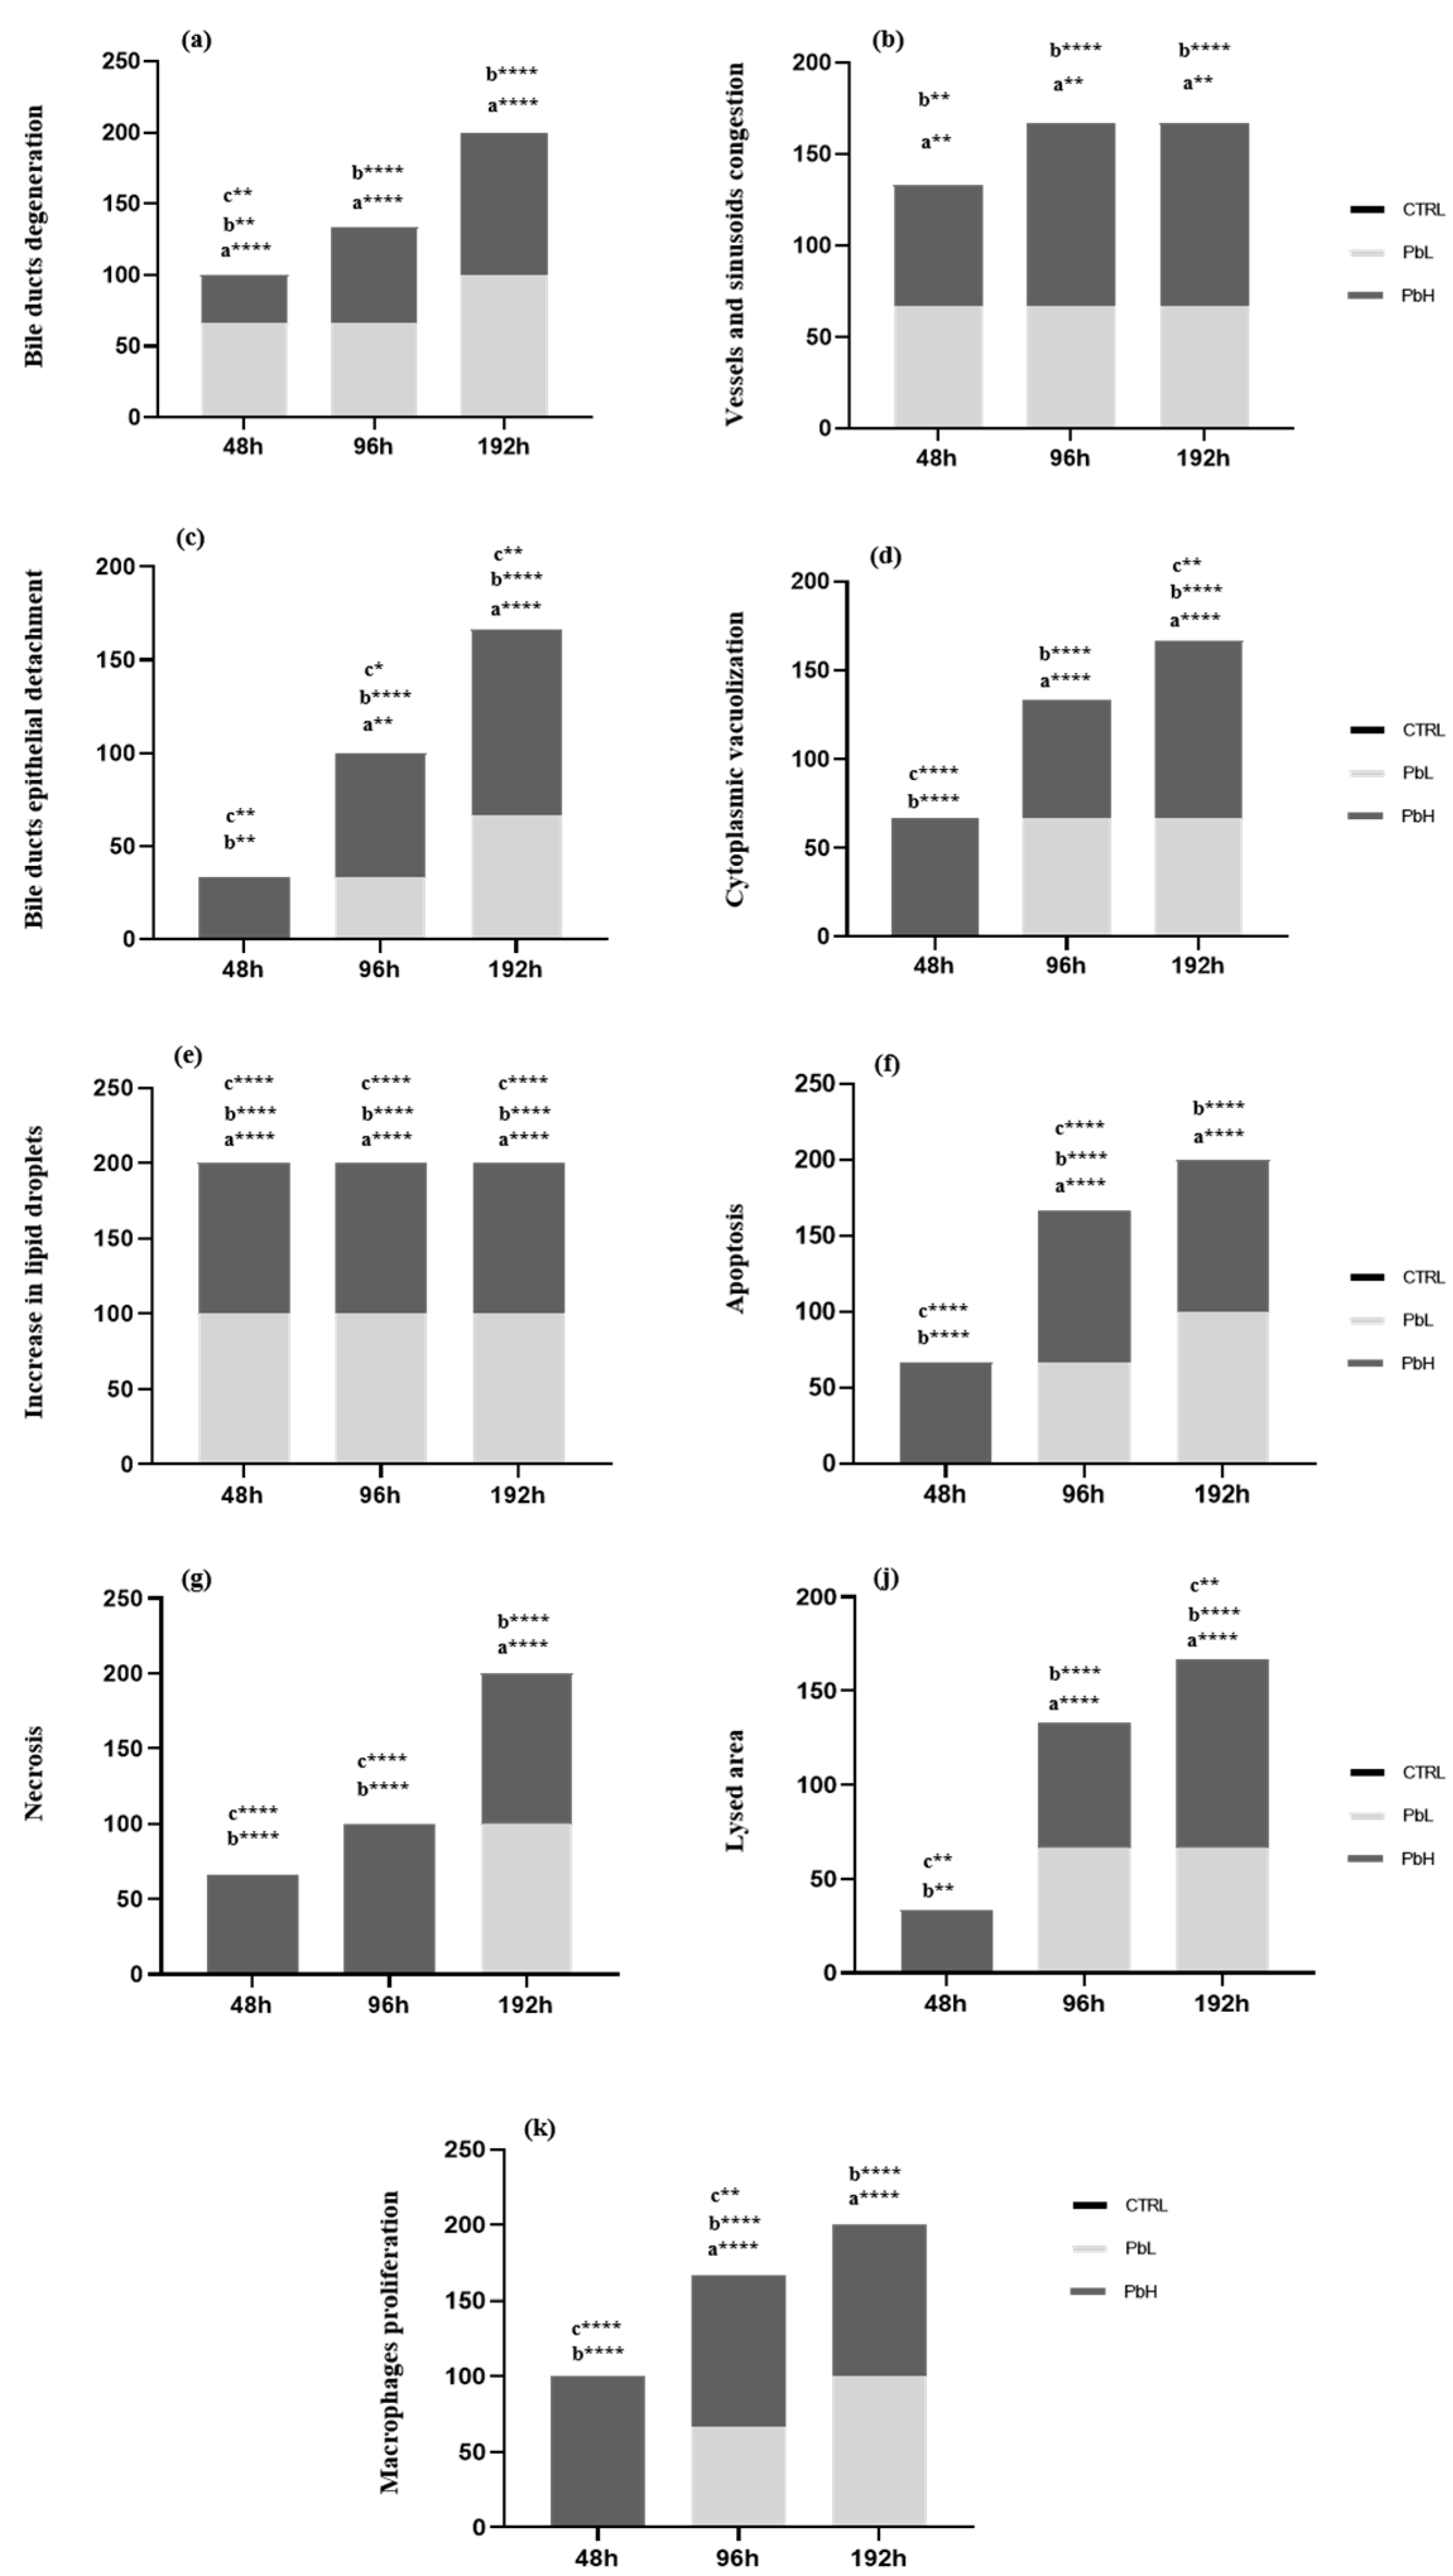
3.2.1. Low Pb concentration
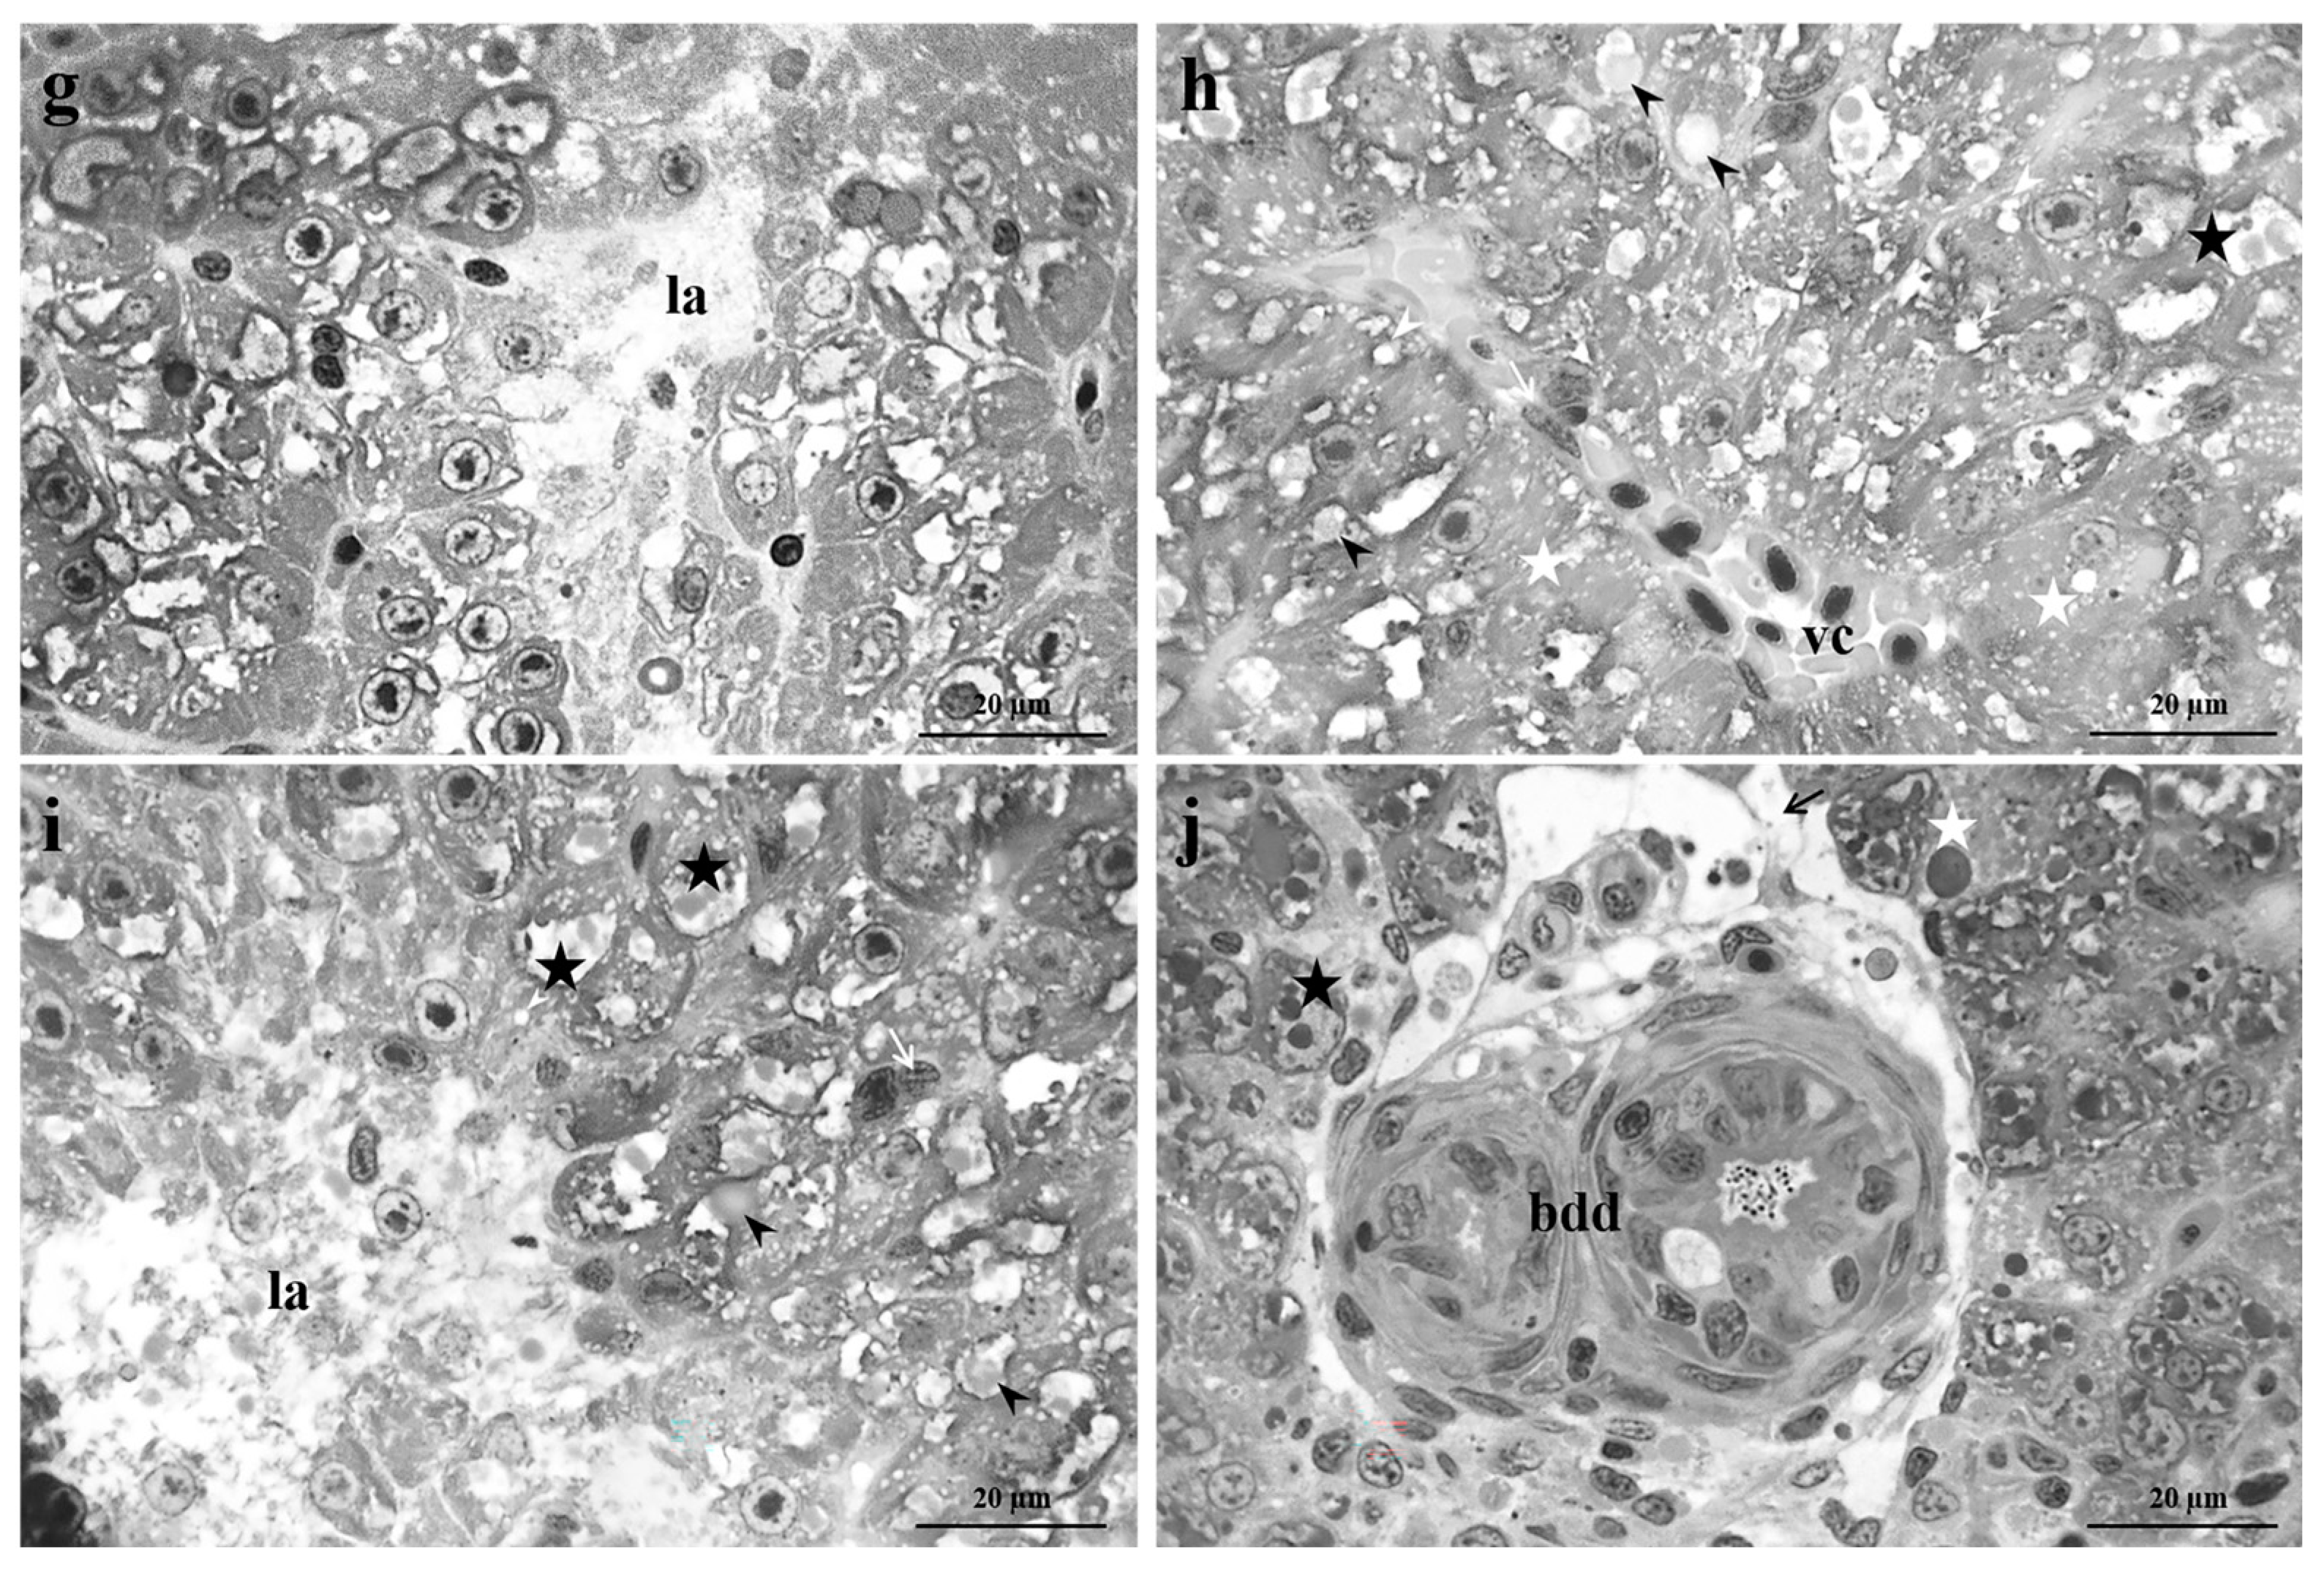
3.2.2. High Pb concentration
3.3. Lipid droplets content
3.4. Gene expression
4. Discussion
4.1. Morphological Modifications
4.2. Gene-Expression
5. Conclusions
Supplementary Materials
Author Contributions
Funding
Institutional Review Board Statement
Data Availability Statement
Conflicts of Interest
References
- Kortei, N.K.; Heymann, M.E.; Essuman, E.K.; Kpodo, F.M.; Akonor, P.T.; Lokpo, S.Y.; Boadi, N.O.; Ayim-Akonor, M.; Tettey, C. Health risk assessment and levels of toxic metals in fishes (Oreochromis noliticus and Clarias anguillaris) from Ankobrah and Pra basins: Impact of illegal mining activities on food safety. Toxicol. Rep. 2020, 7, 360–369. [Google Scholar] [CrossRef] [PubMed]
- Chen, G.W.; Lee, D.Y.; Chen, P.J. Use of embedded Chelex chelating resin and sediment toxicity bioassays with medaka embryos to determine the bioavailability and toxicity of lead-contaminated sediment. Sci. Total Environ. 2020, 745, 140794. [Google Scholar] [CrossRef]
- Ezemonye, L.I.; Adebayo, P.O.; Enuneku, A.A.; Tongo, I.; Ogbomida, E. Potential health risk consequences of heavy metal concentrations in surface water, shrimp (Macrobrachium macrobrachion) and fish (Brycinus longipinnis) from Benin River, Nigeria. Toxicol. Rep. 2019, 6, 1–9. [Google Scholar] [CrossRef] [PubMed]
- Bansod, B.; Kumar, T.; Thakur, R.; Rana, S.; Singh, I. A review on various electrochemical techniques for heavy metal ions detection with different sensing platforms. Biosens. Bioelectron. 2017, 94, 443–455. [Google Scholar] [CrossRef]
- Brunelli, E.; Mauceri, A.; Maisano, M.; Bernabò, I.; Giannetto, A.; de Domenico, E.; Corapi, B.; Tripepi, S.; Fasulo, S. Ultrastructural and immunohistochemical investigation on the gills of the teleost, Thalassoma pavo L., exposed to cadmium. Acta Histochem. 2011, 113, 201–213. [Google Scholar] [CrossRef]
- Cai, L.M.; Wang, Q.S.; Luo, J.; Chen, L.G.; Zhu, R.L.; Wang, S.; Tang, C.H. Heavy metal contamination and health risk assessment for children near a large Cu-smelter in central China. Sci. Total Environ. 2019, 650, 725–733. [Google Scholar] [CrossRef] [PubMed]
- Cheema, A.I.; Liu, G.; Yousaf, B.; Abbas, Q.; Zhou, H. A comprehensive review of biogeochemical distribution and fractionation of lead isotopes for source tracing in distinct interactive environmental compartments. Sci. Total Environ. 2020, 719, 135658. [Google Scholar] [CrossRef]
- Shi, L.; Wang, N.; Hu, X.; Yin, D.; Wu, C.; Liang, H.; Cao, W.; Cao, H. Acute toxic effects of lead (Pb2+) exposure to rare minnow (Gobiocypris rarus) revealed by histopathological examination and transcriptome analysis. Environ. Toxicol. Pharmacol. 2020, 78, 103385. [Google Scholar] [CrossRef]
- Kumar, A.; Kumar, A.; MMS, C.P.; Chaturvedi, A.K.; Shabnam, A.A.; Subrahmanyam, G.; Mondal, R.; Gupta, D.K.; Malyan, S.K.; Kumar, S.S.; Khan, S.A.; Yadav, K.K. Lead toxicity: Health hazards, influence on food chain, and sustainable remediation approaches. Int. J. Environ. Res. Public Health 2020, 17, 2179. [Google Scholar] [CrossRef] [PubMed]
- United States Environmental Protection Agency, "Learn About Lead". EPA, 2022. https://www.epa.gov/lead/learn-about-lead.
- Bashir, I.; Lone, F.A.; Bhat, R.A.; Mir, S.A.; Dar, Z.A.; Dar, S.A. Concerns and threats of contamination on aquatic ecosystems. In Bioremediation and Biotechnology; Hakeem, K., Bhat, R., Qadri, H., Eds.; Springer: Cham, Switzerland, 2020; pp. 1–26. [Google Scholar] [CrossRef]
- Su, G.; Logez, M.; Xu, J.; Tao, S.; Villéger, S.; Brosse, S. Human impacts on global freshwater fish biodiversity. Science 2021, 371, 835–838. [Google Scholar] [CrossRef]
- Keke, U.N.; Mgbemena, A.S.; Arimoro, F.O.; Omalu, I.C. Biomonitoring of effects and accumulations of heavy metals insults using some helminth parasites of fish as bio-indicators in an Afrotropical stream. Front. Environ. Sci. 2020, 8, 576080. [Google Scholar] [CrossRef]
- Łuczyńska, J.; Paszczyk, B.; Łuczyński, M.J. Fish as a bioindicator of heavy metals pollution in aquatic ecosystem of Pluszne Lake, Poland, and risk assessment for consumer's health. Ecotoxicol. Environ. Saf. 2018, 153, 60–67. [Google Scholar] [CrossRef]
- Macirella, R.; Brunelli, E. Morphofunctional alterations in zebrafish (Danio rerio) gills after exposure to mercury chloride. Int. J. Mol. Med. Sci. 2017, 18, 824. [Google Scholar] [CrossRef]
- Paul, S.; Mandal, A.; Bhattacharjee, P.; Chakraborty, S.; Paul, R.; Mukhopadhyay, B.K. Evaluation of water quality and toxicity after exposure of lead nitrate in fresh water fish, major source of water pollution. Egypt. J. Aquat. Res. 2019, 45, 345–351. [Google Scholar] [CrossRef]
- Dai, J.; Zhang, L.; Du, X.; Zhang, P.; Li, W.; Guo, X.; Li, Y. Effect of lead on antioxidant ability and immune responses of Crucian carp. Biol. Trace Elem. Res. 2018, 186, 546–553. [Google Scholar] [CrossRef]
- Zhao, L.; Zheng, Y.G.; Feng, Y.H.; Li, M.Y.; Wang, G.Q.; Ma, Y.F. Toxic effects of waterborne lead (Pb) on bioaccumulation, serum biochemistry, oxidative stress and heat shock protein-related genes expression in Channa argus. Chemosphere 2020, 261, 127714. [Google Scholar] [CrossRef] [PubMed]
- Ishaque, A.; Ishaque, S.; Arif, A.; Abbas, H.G. Toxic effects of lead on fish and human. Biol. Clin. Sci. Res. J. 2020, 2020, e045. [Google Scholar] [CrossRef]
- Jing, H.; Zhang, Q.; Li, S.; Gao, X.J. Pb exposure triggers MAPK-dependent inflammation by activating oxidative stress and miRNA-155 expression in carp head kidney. Fish Shellfish Immunol. 2020, 106, 219–227. [Google Scholar] [CrossRef] [PubMed]
- Lee, J.W.; Choi, H.; Hwang, U.K.; Kang, J.C.; Kang, Y.J.; Kim, K.I.; Kim, J.H. Toxic effects of lead exposure on bioaccumulation, oxidative stress, neurotoxicity, and immune responses in fish: A review. Environ. Toxicol. Pharmacol. 2019, 68, 101–108. [Google Scholar] [CrossRef] [PubMed]
- Paul, N.; Chakraborty, S.; Sengupta, M. Lead toxicity on non-specific immune mechanisms of freshwater fish Channa punctatus. Aquat. Toxicol. 2014, 152, 105–112. [Google Scholar] [CrossRef]
- Al-Balawi, H.F.A.; Al-Akel, A.S.; Al-Misned, F.; Suliman, E.A.M.; Al-Ghanim, K.A.; Mahboob, S.; Ahmad, Z. Effects of sub-lethal exposure of lead acetate on histopathology of gills, liver, kidney and muscle and its accumulation in these organs of Clarias gariepinus. Braz. Arch. Biol. Technol. 2013, 56, 293–302. [Google Scholar] [CrossRef]
- Macirella, R.; Sesti, S.; Bernabò, I.; Tripepi, M.; Godbert, N.; Brunelli, E. Lead toxicity in seawater teleosts: A morphofunctional and ultrastructural study on the gills of the Ornate wrasse (Thalassoma pavo L.). Aquat. Toxicol. 2019, 211, 193–201. [Google Scholar] [CrossRef]
- Curcio, V.; Macirella, R.; Sesti, S.; Ahmed, A. I.; Talarico, F.; Tagarelli, A.; Mezzasalma, M.; Brunelli, E. Morphological and functional alterations induced by two ecologically relevant concentrations of Lead on Danio rerio gills. Int. J. Mol. Sci. 23, 9165. [CrossRef] [PubMed]
- Zhai, Q.; Wang, H.; Tian, F.; Zhao, J.; Zhang, H.; Chen, W. Dietary Lactobacillus plantarum supplementation decreases tissue lead accumulation and alleviates lead toxicity in Nile tilapia (Oreochromis niloticus). Aquacult. Res. 2017, 48, 5094–5103. [Google Scholar] [CrossRef]
- Bawuro, A.A.; Voegborlo, R.B.; Adimado, A.A. Bioaccumulation of heavy metals in some tissues of fish in Lake Geriyo, Adamawa State, Nigeria. J. Environ. Public Health 2018, 2018. [Google Scholar] [CrossRef]
- Tanhan, P.; Imsilp, K.; Lansubsakul, N.; Thong-asa, W. Oxidative response to Cd and Pb accumulation in coastal fishes of Pattani Bay. Ital. J. Anim. Sci. 2023, 22, 148–156. [Google Scholar] [CrossRef]
- Kumar, E.K.; Midhun, S.J.; Vysakh, A.; James, T.J. Antagonistic effects of dietary Moringa oleifera on hemato-biochemical and oxidative stress of lead nitrate intoxicated Nile tilapia, Oreochromis niloticus. Aquacult. Res. 2021, 52, 6164–6178. [Google Scholar] [CrossRef]
- Eroglu, A.; Dogan, Z.; Kanak, E.G.; Atli, G.; Canli, M. Effects of heavy metals (Cd, Cu, Cr, Pb, Zn) on fish glutathione metabolism. Environ. Sci. Pollut. Res. 2015, 22, 3229–3237. [Google Scholar] [CrossRef]
- Rajamanickam, D.; Devadason, C.G. Histopathological alterations in gill, liver, and brain of Nile Tilapia (Oreochromis Niloticus), exposed to Lead Nitrate (Pb [NO3]2). Int. J. Sci. Technol. Res. 2021, 3, 149–153. [Google Scholar]
- Mustafa, S.A.; Al-Faragi, J.K.; Salman, N.M.; Al-Rudainy, A.J. Histopathological alterations in gills, liver and kidney of common carp, Cyprinus carpio exposed to lead Acetate. Adv. Anim. Vet. Sci. 2017, 5, 371–376. [Google Scholar] [CrossRef]
- Doaa, M.M.; Hanan, H.A. Histological changes in selected organs of Oreochromis niloticus exposed to doses of lead acetate. J. Life Sci. Biomed. 2013, 3, 256–263. [Google Scholar]
- Abdel-Warith, A.W.A.; Younis, E.S.M.; Al-Asgah, N.A.; Rady, A.M.; Allam, H.Y. Bioaccumulation of lead nitrate in tissues and its effects on hematological and biochemical parameters of Clarias gariepinus. Saudi J. Biol. Sci. 2020, 27, 840–845. [Google Scholar] [CrossRef]
- Li, X.; Zhang, B.; Li, N.; Ji, X.; Liu, K.; Jin, M. Zebrafish neurobehavioral phenomics applied as the behavioral warning methods for fingerprinting endocrine disrupting effect by lead exposure at environmentally relevant level. Chemosphere 2019, 231, 315–325. [Google Scholar] [CrossRef]
- Curcio, V.; Macirella, R.; Sesti, S.; Ahmed, A.I.; Talarico, F.; Pizzolotto, R.; Tagarelli, A.; Mezzasalma, M.; Brunelli, E. The role of exposure window and dose in determining lead toxicity in developing Zebrafish. Chemosphere 307, 136095. [CrossRef]
- Lei, P.; Zhang, W.; Ma, J.; Xia, Y.; Yu, H.; Du, J.; Fang, Y.; Wang, L.; Zhang, K.; Jin, L.; Sun, D.; Zhong, J. Advances in the utilization of Zebrafish for assessing and understanding the mechanisms of Nano-/Microparticles toxicity in water. Toxics 2023, 11, 380. [Google Scholar] [CrossRef] [PubMed]
- Magyary, I. Recent advances and future trends in zebrafish bioassays for aquatic ecotoxicology. Ecocycles 2018, 4, 12–18. [Google Scholar] [CrossRef]
- Zhang, H.; Liu, Y.; Liu, R.; Liu, C.; Chen, Y. Molecular mechanism of lead-induced superoxide dismutase inactivation in zebrafish livers. J. Phys. Chem. B 2014, 118, 14820–14826. [Google Scholar] [CrossRef]
- Xia, J.; Lu, L.; Jin, C.; Wang, S.; Zhou, J.; Ni, Y.; Zhengwei, F.; Jin, Y. Effects of short-term lead exposure on gut microbiota and hepatic metabolism in adult zebrafish. Comp. Biochem. Physiol. Part C Toxicol. Pharmacol. 2018, 209, 1–8. [Google Scholar] [CrossRef] [PubMed]
- Wang, G.; Wang, T.; Zhang, X.; Chen, J.; Feng, C.; Yun, S.; Cheng, Y.; Cheng, F.; Cao, J. Sex-specific effects of fluoride and lead exposures on histology, antioxidant physiology, and immune system in the liver of zebrafish (Danio rerio). Ecotoxicology 2022, 31, 396–414. [Google Scholar] [CrossRef]
- Shah, Z.U.; Parveen, S. Oxidative, biochemical and histopathological alterations in fishes from pesticide contaminated river Ganga, India. Sci. Rep. 2022, 12, 3628. [Google Scholar] [CrossRef]
- Opute, P.A.; Oboh, I.P. Hepatotoxic effects of atrazine on Clarias gariepinus (Burchell, 1822): biochemical and histopathological studies. Arch. Environ. Contam. Toxicol. 2021, 80, 414–425. [Google Scholar] [CrossRef]
- Bakiu, R.; Pacchini, S.; Piva, E.; Schumann, S.; Tolomeo, A.M. , Ferro, D.; Irato, P.; Santovito, G. Metallothionein expression as a physiological response against metal toxicity in the striped rockcod Trematomus hansoni. Int. J. Mol. Sci. 2022, 23, 12799. [Google Scholar] [CrossRef]
- Wang, W.C.; Mao, H.; Ma, D.D.; Yang, W.X. Characteristics, functions, and applications of metallothionein in aquatic vertebrates. Front. Mar. Sci. 2014, 1, 34. [Google Scholar] [CrossRef]
- Hauser-Davis, R.A. The current knowledge gap on metallothionein mediated metal-detoxification in Elasmobranchs. PeerJ 2020, 8, e10293. [Google Scholar] [CrossRef] [PubMed]
- Yin, J.; Wang, A.P.; Li, W.F.; Shi, R.; Jin, H.T.; Wei, J.F. Sensitive biomarkers identification for differentiating Cd and Pb induced toxicity on zebrafish embryos. Environ. Toxicol. Pharm. 2017, 56, 340–349. [Google Scholar] [CrossRef] [PubMed]
- Maiti, A.K.; Saha, N.C.; Paul, G. Effect of lead on oxidative stress, Na+K+ATPase activity and mitochondrial election transport chain activity of the brain of Clarias batrachus L. Bull. Environ. Contam. Toxicol. 2010, 84, 672–676. [Google Scholar] [CrossRef]
- Kim, J.H.; Kang, J.C. Effects of sub-chronic exposure to lead (Pb) and ascorbic acid in juvenile rockfish: antioxidant responses, MT gene expression, and neurotransmitters. Chemosphere 2017, 171, 520–527. [Google Scholar] [CrossRef] [PubMed]
- Morcillo, P.; Esteban, M.Á.; Cuesta, A. Heavy metals produce toxicity, oxidative stress and apoptosis in the marine teleost fish SAF-1 cell line. Chemosphere 2016, 144, 225–233. [Google Scholar] [CrossRef]
- Bernet, D.; Schmidt, H.; Meier, W.; Burkhardt-Holm, P.; Wahli, T. Histopathology in fish: proposal for a protocol to assess aquatic pollution. J. Fish Dis. 1999, 22, 25–34. [Google Scholar] [CrossRef]
- Santos, R.M.B.; Monteiro, S.M.V.; Cortes, R.M.V.; Pacheco, F.A.L.; Fernandes, L.F.S. Seasonal differences in water pollution and liver histopathology of Iberian barbel (Luciobarbus bocagei) and Douro nase (Pseudochondrostoma duriense) in an agricultural watershed. Water 2022, 14, 444. [Google Scholar] [CrossRef]
- Macirella, R.; Curcio, V.; Ahmed, A.I.M.; Pellegrino, D.; Brunelli, E. Effect of short-term exposure to low concentration of tebuconazole: Morphological, histometric and functional modifications in Danio rerio liver. Eur. Zool. J. 2022, 89, 331–345. [Google Scholar] [CrossRef]
- Macirella, R.; Guardia, A.; Pellegrino, D.; Bernabò, I.; Tronci, V.; Ebbesson, L.O.; Sesti, S.; Tripepi, S.; Brunelli, E. Effects of two sublethal concentrations of mercury chloride on the morphology and metallothionein activity in the liver of zebrafish (Danio rerio). Int. J. Mol. Sci. 2016, 17, 361. [Google Scholar] [CrossRef]
- Ali, H.; Khan, E.; Ilahi, I. Environmental chemistry and ecotoxicology of hazardous heavy metals: Environmental persistence, toxicity, and bioaccumulation. J. Chem. 2019, 2019, 6730305. [Google Scholar] [CrossRef]
- Agbohessi, P.; Olowo, L.; Degila, B.; Houedjissi, G.; Imorou Toko, I.; Mandiki, S.N.; Kestemont, P. Comparative assessment of acute toxicity and histological changes in liver of African catfish Clarias gariepinus exposed to cotton insecticides. J. Environ. Sci. Health. Part B 2023, 58, 31–44. [Google Scholar] [CrossRef]
- Agamy, E. Histopathological changes in the livers of rabbit fish (Siganus canaliculatus) following exposure to crude oil and dispersed oil. Toxicol Pathol. 2012, 40, 1128–1140. [Google Scholar] [CrossRef] [PubMed]
- Popović, N.T.; Čižmek, L.; Babić, S.; Strunjak-Perović, I.; Čož-Rakovac, R. Fish liver damage related to the wastewater treatment plant effluents. Environ. Sci. Pollut. Res. 2023, 30, 48739–48768. [Google Scholar] [CrossRef]
- Khidr, B.M.; Mekkawy, I.A.; Harabawy, A.S.; Ohaida, A.S. Effect of lead nitrate on the liver of the cichlid fish (Oreochromis niloticus): a light microscope study. PJBS 2012, 15, 854–862. [Google Scholar] [CrossRef] [PubMed]
- Rajeshkumar, S.; Liu, Y.; Ma, J.; Duan, H.Y.; Li, X. Effects of exposure to multiple heavy metals on biochemical and histopathological alterations in common carp, Cyprinus carpio L. Fish Shellfish Immunol. 2017, 70, 461–472. [Google Scholar] [CrossRef]
- Shahid, S.; Sultana, T.; Sultana, S.; Hussain, B.; Irfan, M.; Al-Ghanim, K.A.; A-Misnedb, F.; Mahboob, S. Histopathological alterations in gills, liver, kidney and muscles of Ictalurus punctatus collected from pollutes areas of River. Braz. J. Biol. 2020, 81, 814–821. [Google Scholar] [CrossRef]
- Abalaka, S.E. Heavy metals bioaccumulation and histopathological changes in Auchenoglanis occidentalis fish from Tiga dam, Nigeria. J. Environ. Health Sci. Eng. 2015, 13, 1–8. [Google Scholar] [CrossRef]
- Liu, X.H.; Pang, X.; Jin, L.; Pu, D.Y.; Wang, Z.J.; Zhang, Y.G. Exposure to acute waterborne cadmium caused severe damage on lipid metabolism of freshwater fish, revealed by nuclear lipid droplet deposition in hepatocytes of rare minnow. Aquat. Toxicol. 2023, 257, 106433. [Google Scholar] [CrossRef]
- Paris-Palacios, S.; Biagianti-Risbourg, S.; Vernet, G. Biochemical and (ultra) structural hepatic perturbations of Brachydanio rerio (Teleostei, Cyprinidae) exposed to two sublethal concentrations of copper sulfate. Aquat. Toxicol. 2000, 50, 109–124. [Google Scholar] [CrossRef]
- Broeg, K. Acid phosphatase activity in liver macrophage aggregates as a marker for pollution-induced immunomodulation of the non-specific immune response in fish. Helgol. Mar. Res. 2003, 57, 166–175. [Google Scholar] [CrossRef]
- Valdez Domingos, F.X.; Assis, H.C.S.; Silva, M.D.; Damian, R.C.; Almeida, A.I.M.; Cestari, M.M.; Randi, M.A.F.; Oliveira Ribeiro, C.A. Anthropic Impact Evaluation of Two Brazilian Estuaries Trough Biomarkers in Fish. J. Braz. Soc. Ecotoxicol. 2009, 4, 21–30. [Google Scholar] [CrossRef]
- Sinha, R. Macrophage: a key player of teleost immune system. In Macrophages-140 Years of Their Discovery. IntechOpen 2022. [CrossRef]
- Curcio, V.; Macirella, R.; Sesti, S.; Pellegrino, D.; Ahmed, A.I.; Brunelli, E. Morphological and molecular alterations induced by lead in embryos and larvae of Danio rerio. Appl. Sci. 2021, 11, 7464. [Google Scholar] [CrossRef]
- Xia, X.; He, B.; Zhang, X.; Cheng, Z.; Liu, M.; Wei, X.; Jiang, J.; Hu, J. Lytic regulated cell death in aquaculture fish. Rev. Aquacult. 2021, 13, 1549–1564. [Google Scholar] [CrossRef]
- Conrad, M.; Kagan, V.E.; Bayir, H.; Pagnussat, G.C.; Head, B.; Traber, M.G.; Stockwell, B.R. Regulation of lipid peroxidation and ferroptosis in diverse species. Genes Dev. 2018, 32, 602–619. [Google Scholar] [CrossRef]
- Sun, Z.; Gong, C.; Ren, J.; Zhang, X.; Wang, G.; Liu, Y.; Ren, Y.; Zhao, Y.; Yu, Q.; Wang, Y.; Hou, J. Toxicity of nickel and cobalt in Japanese flounder. Environ. Poll. 2020, 263, 114516. [Google Scholar] [CrossRef] [PubMed]
- Gautheron, J.; Gores, G.J.; Rodrigues, C.M. Lytic cell death in metabolic liver disease. J. Hepatol. 2020, 73, 394–408. [Google Scholar] [CrossRef]
- Stephenie, S.; Chang, Y.P.; Gnanasekaran, A.; Esa, N.M.; Gnanaraj, C. An insight on superoxide dismutase (SOD) from plants for mammalian health enhancement. J. Funct. Foods 2020, 68, 103917. [Google Scholar] [CrossRef]
- Shi, Q.; Xiong, X.; Wen, Z.; Qin, C.; Li, R.; Zhang, Z.; Gong, Q.; Wu, X. Cu/Zn Superoxide dismutase and catalase of Yangtze Sturgeon, Acipenser dabryanus: molecular cloning, tissue distribution and response to fasting and refeeding. Fishes, 2022, 7, 35. [Google Scholar] [CrossRef]
- Alak, G.; Atamanalp, M.; Topal, A.; Arslan, H.; Kocaman, E.M.; Oruc, E. Effect of sub-lethal lead toxicity on the histopathological and antioxidant enzyme activity of rainbow trout (Oncorhynchus mykiss). Fresenius Environ. Bull. 2013, 22, 733–738. [Google Scholar]
- Jing, D.; Li, M.; Zhang, Y.; Yuan, L.; Wang, R.; Gong, Y. Differential induction of enzymes and genes involved in oxidative stress in gill and liver tissues of mudskipper Boleophthalmus pectinirostris exposed to lead. Turk. J. Fish. Aquat. Sci. 2017, 17, 437–443. [Google Scholar] [CrossRef] [PubMed]
- Girgis, S.M.; Mabrouk, D.M.; Hanna, M.I.; Abd ElRaouf, A. Seasonal assessment of some heavy metal pollution and Metallothionein gene expression in cultured Oreochromis niloticus. Bull. Natl. Res. Cent. 2019, 43, 1–8. [Google Scholar] [CrossRef]
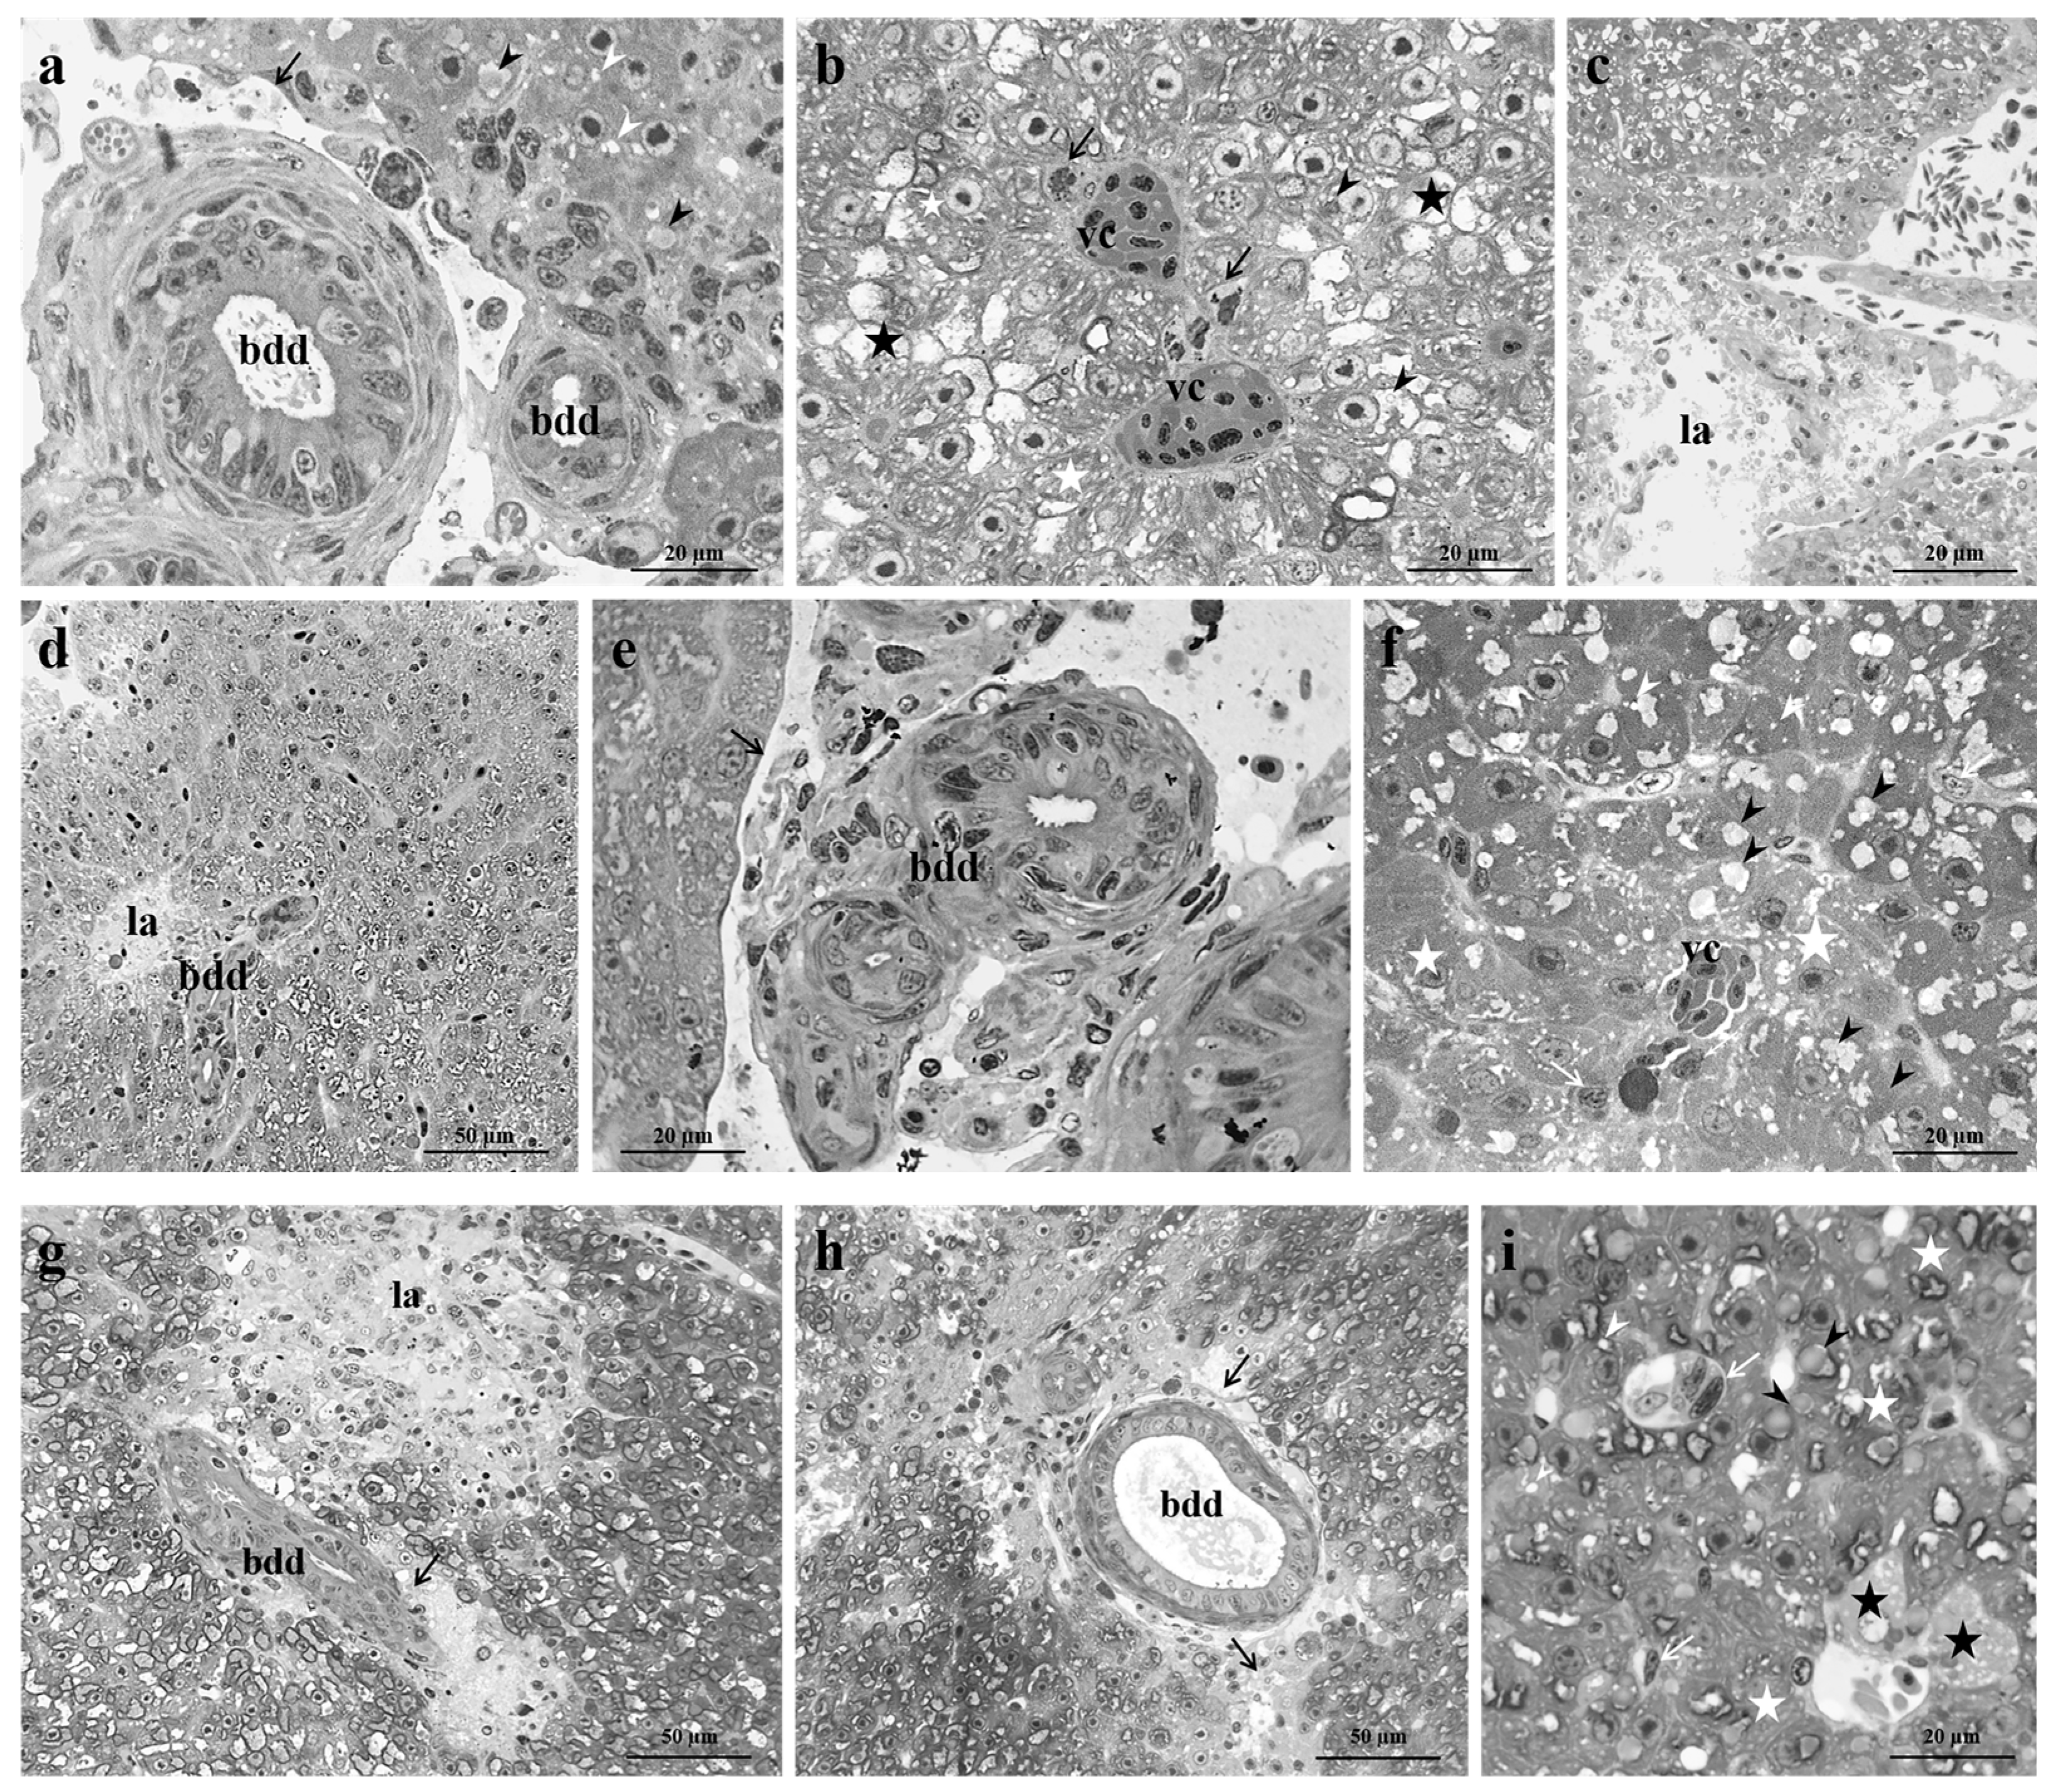
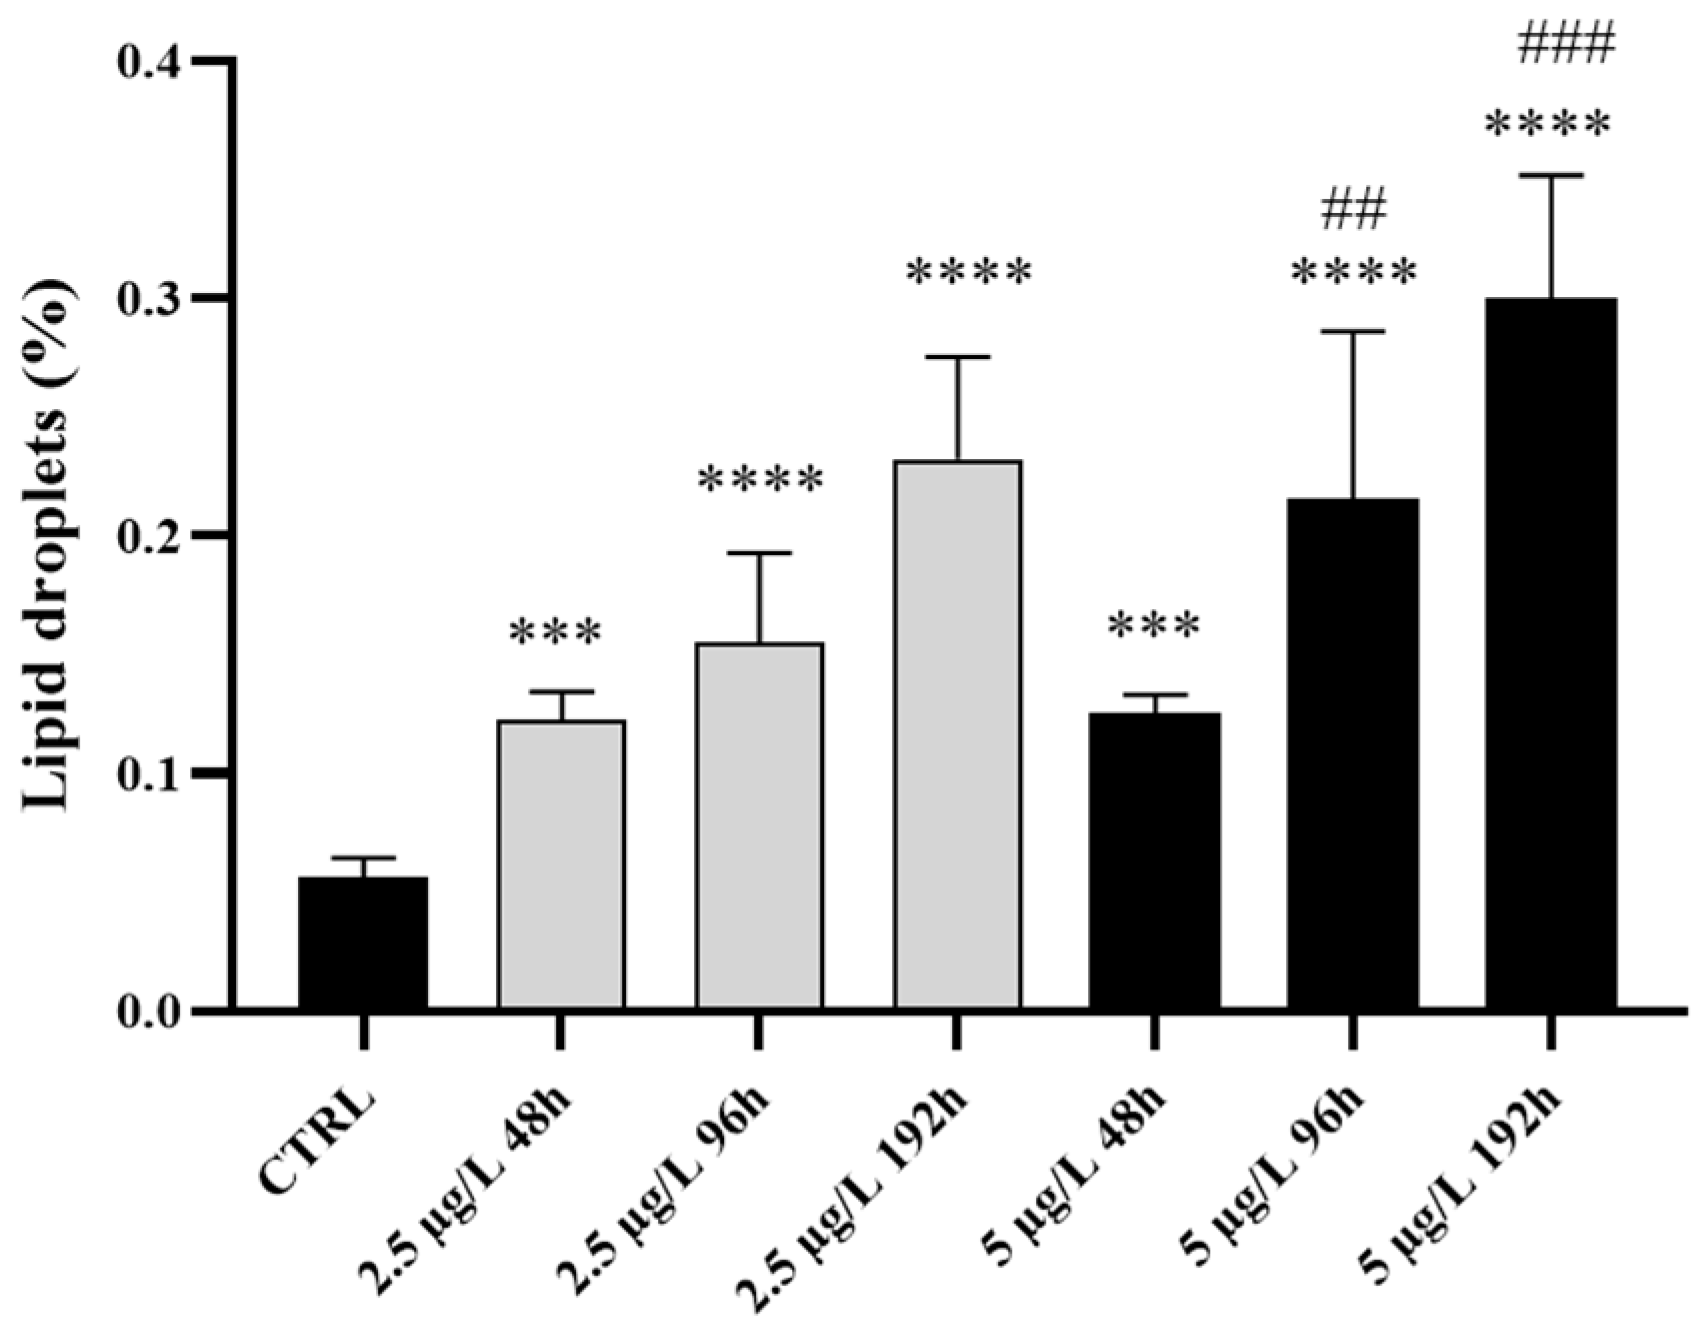

| 2.5 µg/L Pb | 5 µg/L Pb | |
|---|---|---|
| CTRL | 0.00±0.00 | 0.00±0.00 |
| 48 hours | 2.66±1.15 | 16.00±5.29(a***)(b**) |
| 96 hours | 14.66±3.05(a**)(c*) | 42.00±2.40(a****)(b****)(c****) |
| 192 hours | 35.33±4.61(a****)(c****) | 53.33±3.05(a****)(b****)(c*) |
Disclaimer/Publisher’s Note: The statements, opinions and data contained in all publications are solely those of the individual author(s) and contributor(s) and not of MDPI and/or the editor(s). MDPI and/or the editor(s) disclaim responsibility for any injury to people or property resulting from any ideas, methods, instructions or products referred to in the content. |
© 2023 by the authors. Licensee MDPI, Basel, Switzerland. This article is an open access article distributed under the terms and conditions of the Creative Commons Attribution (CC BY) license (http://creativecommons.org/licenses/by/4.0/).


