Submitted:
25 May 2023
Posted:
26 May 2023
You are already at the latest version
Abstract
Keywords:
1. Introduction
2. Results and discussion
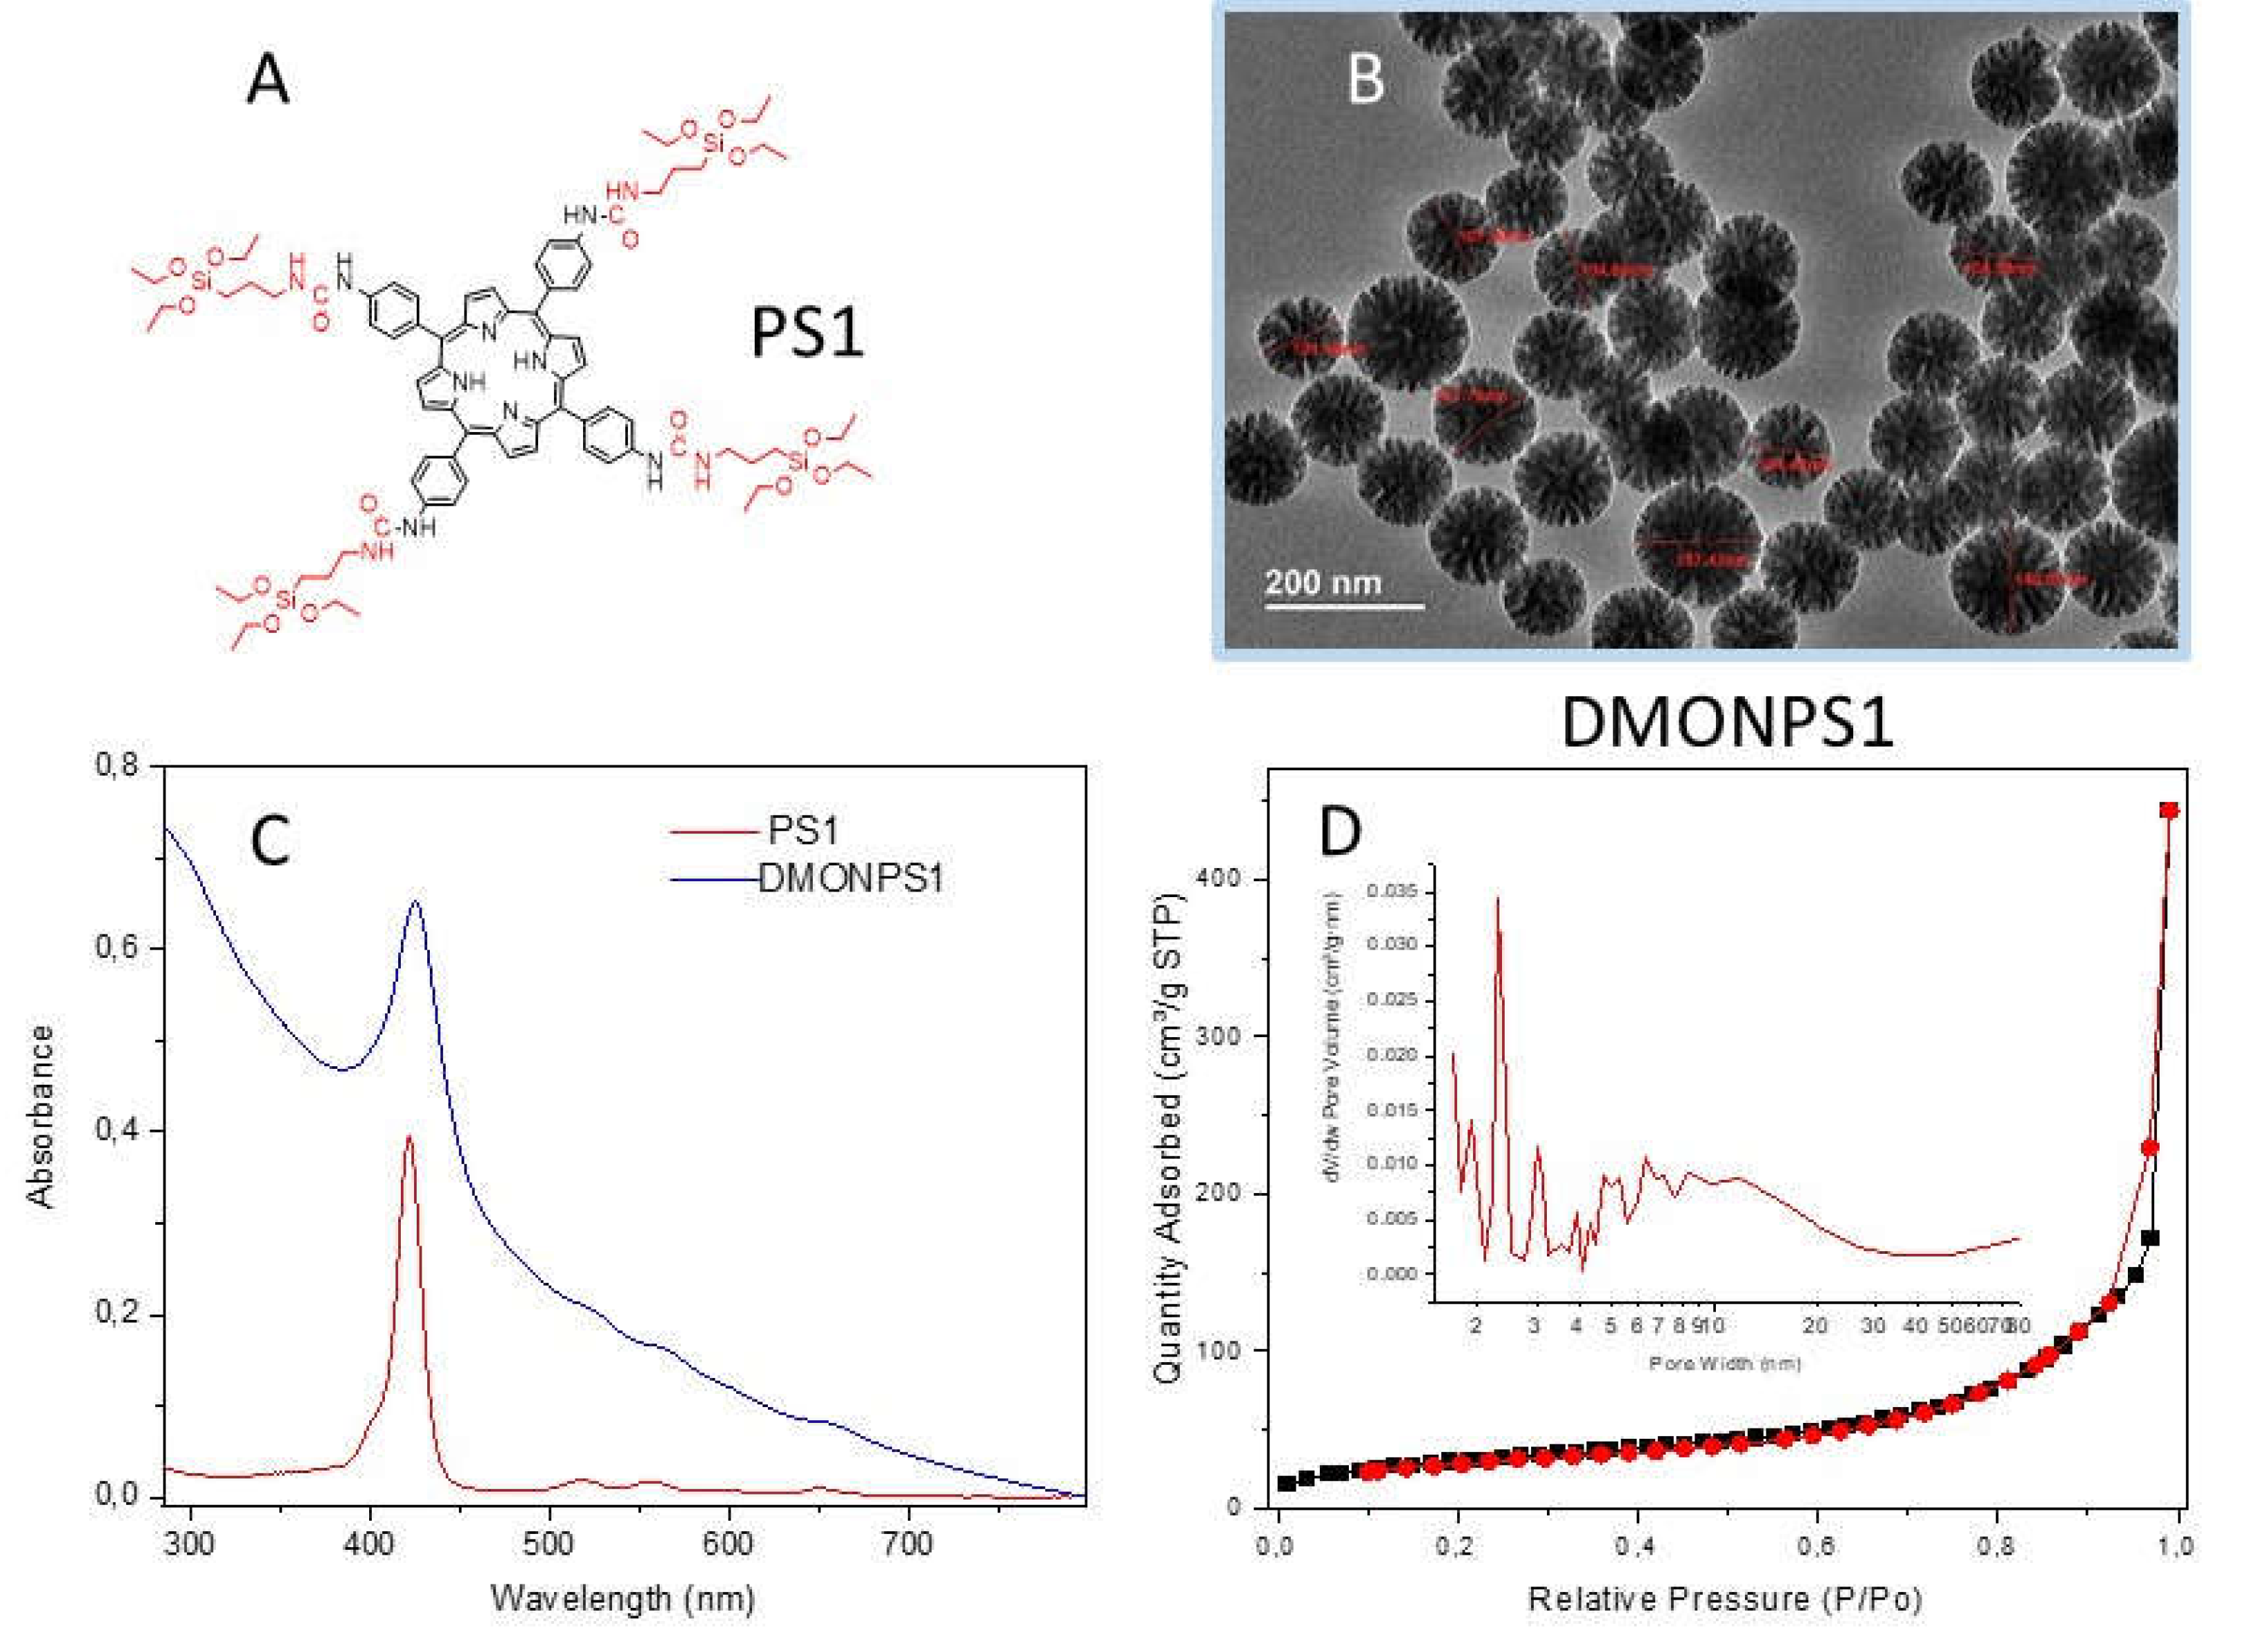
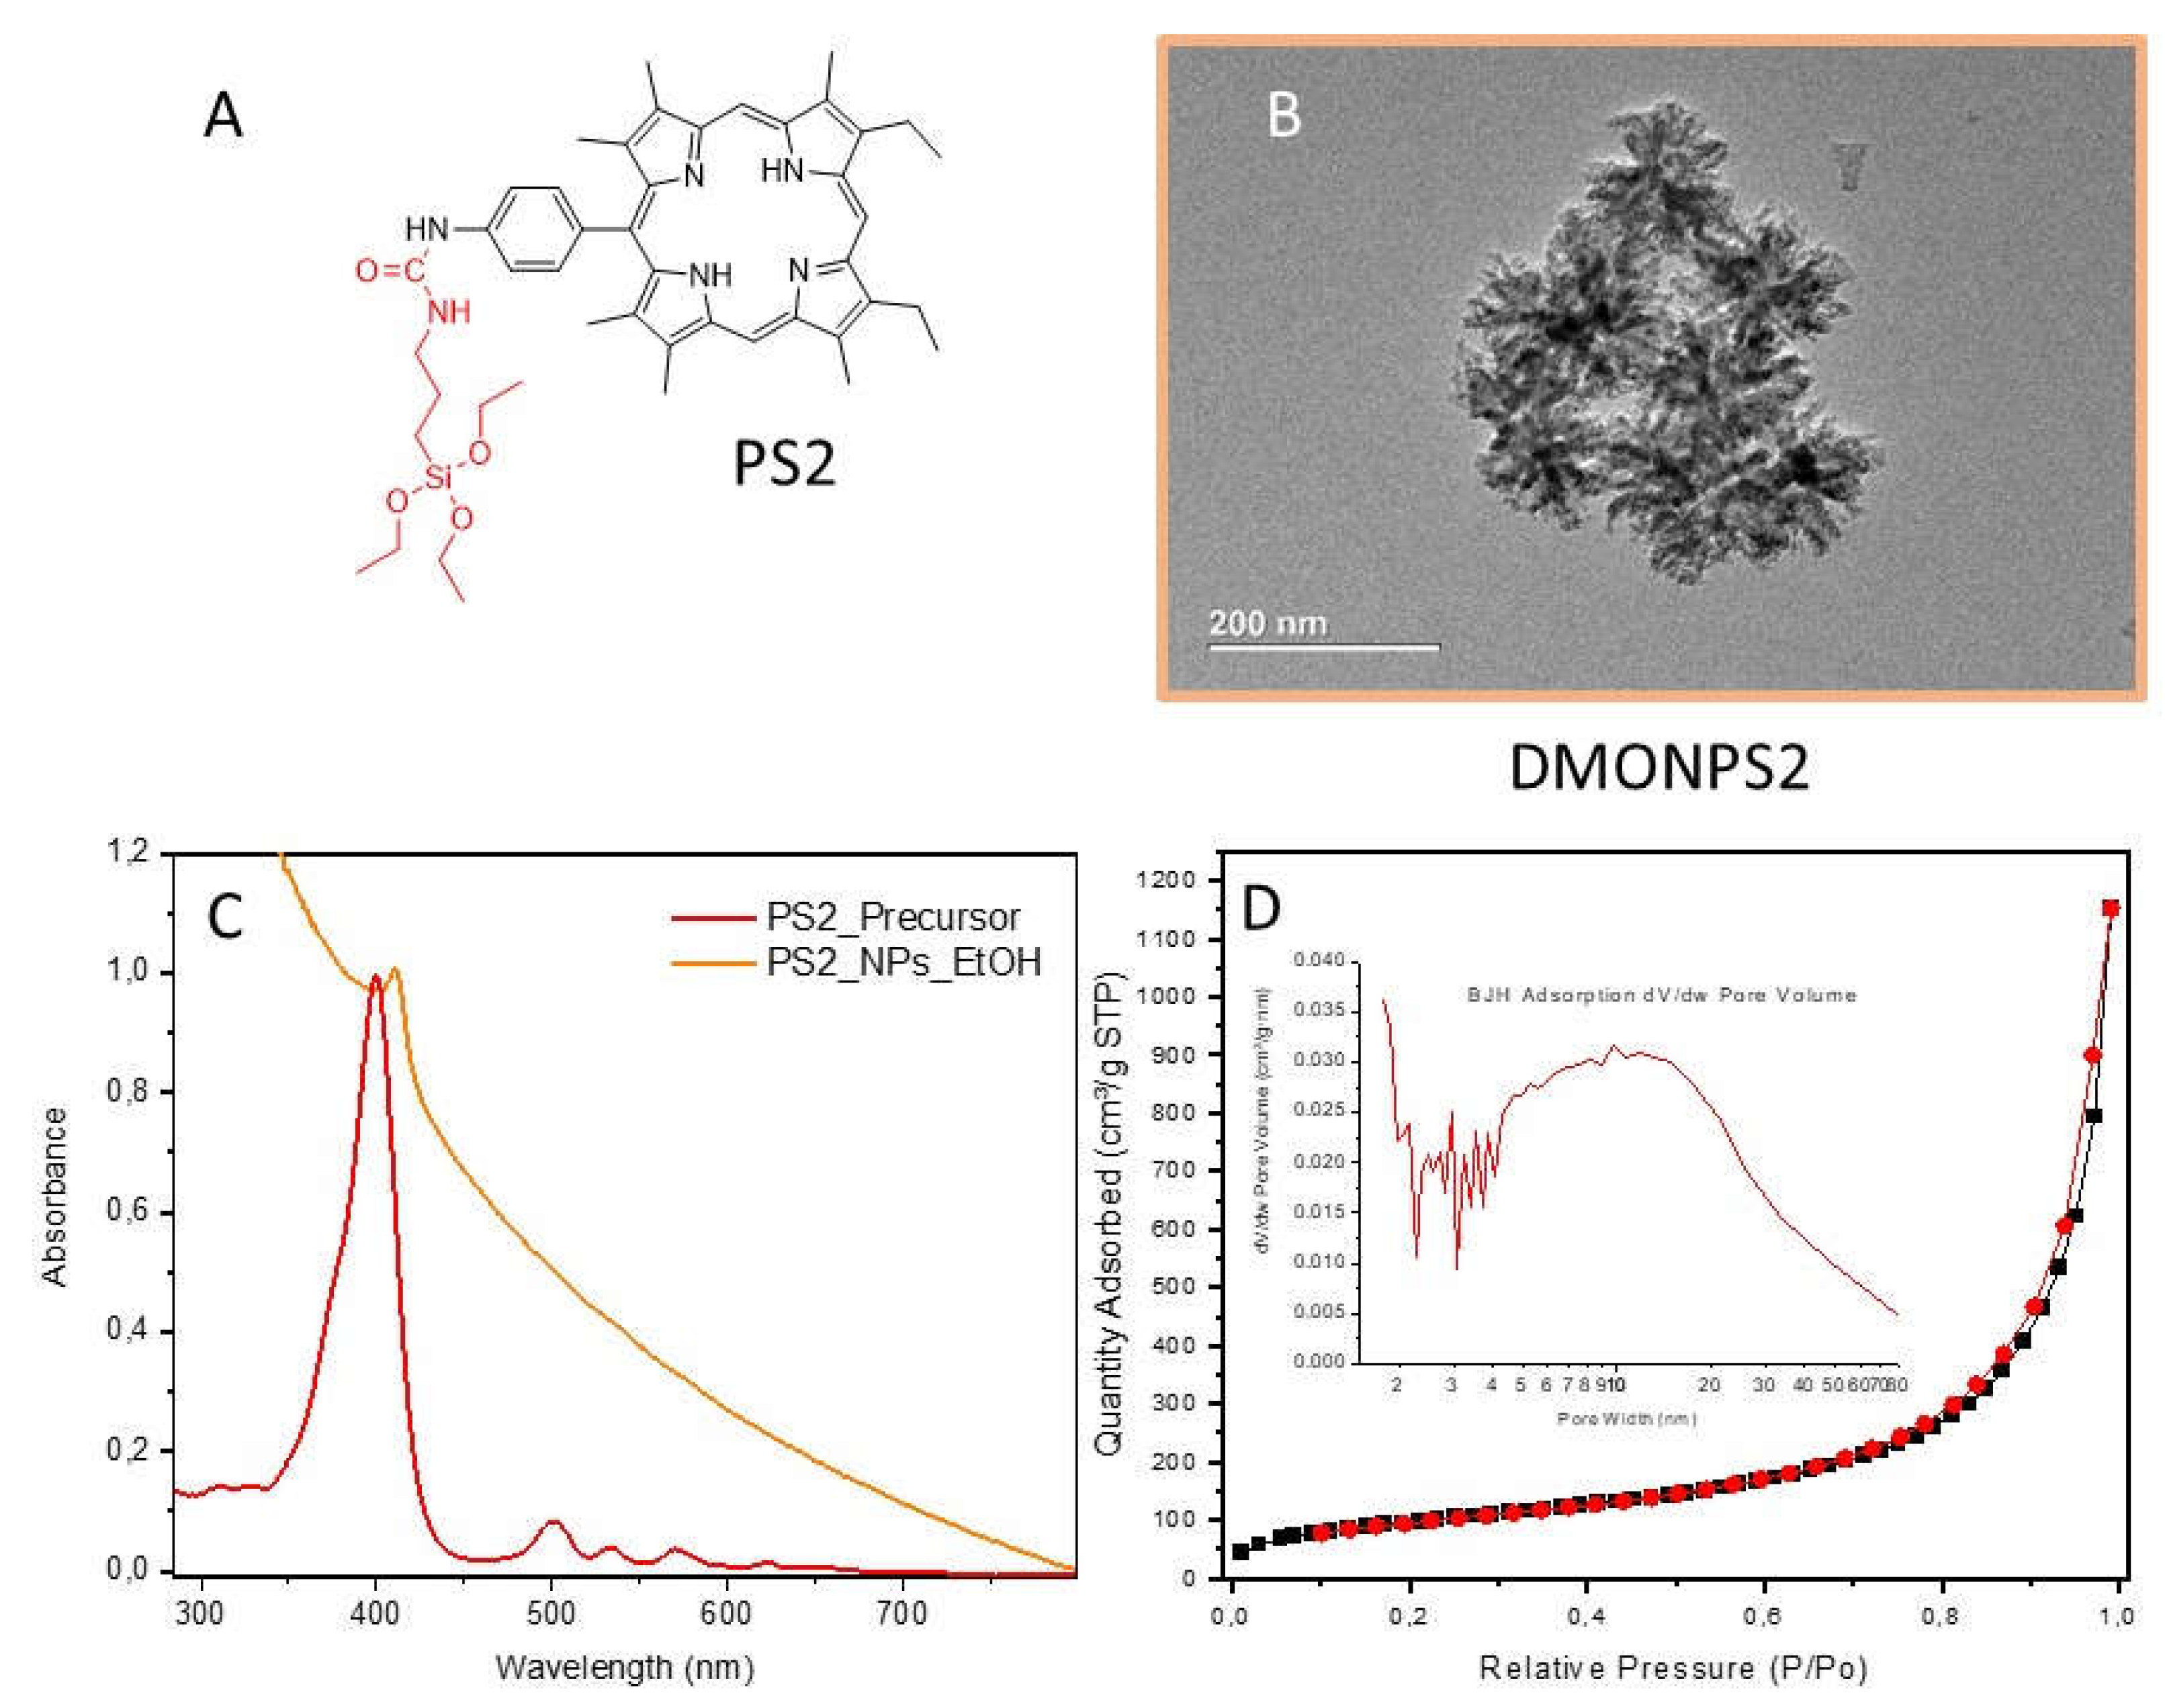
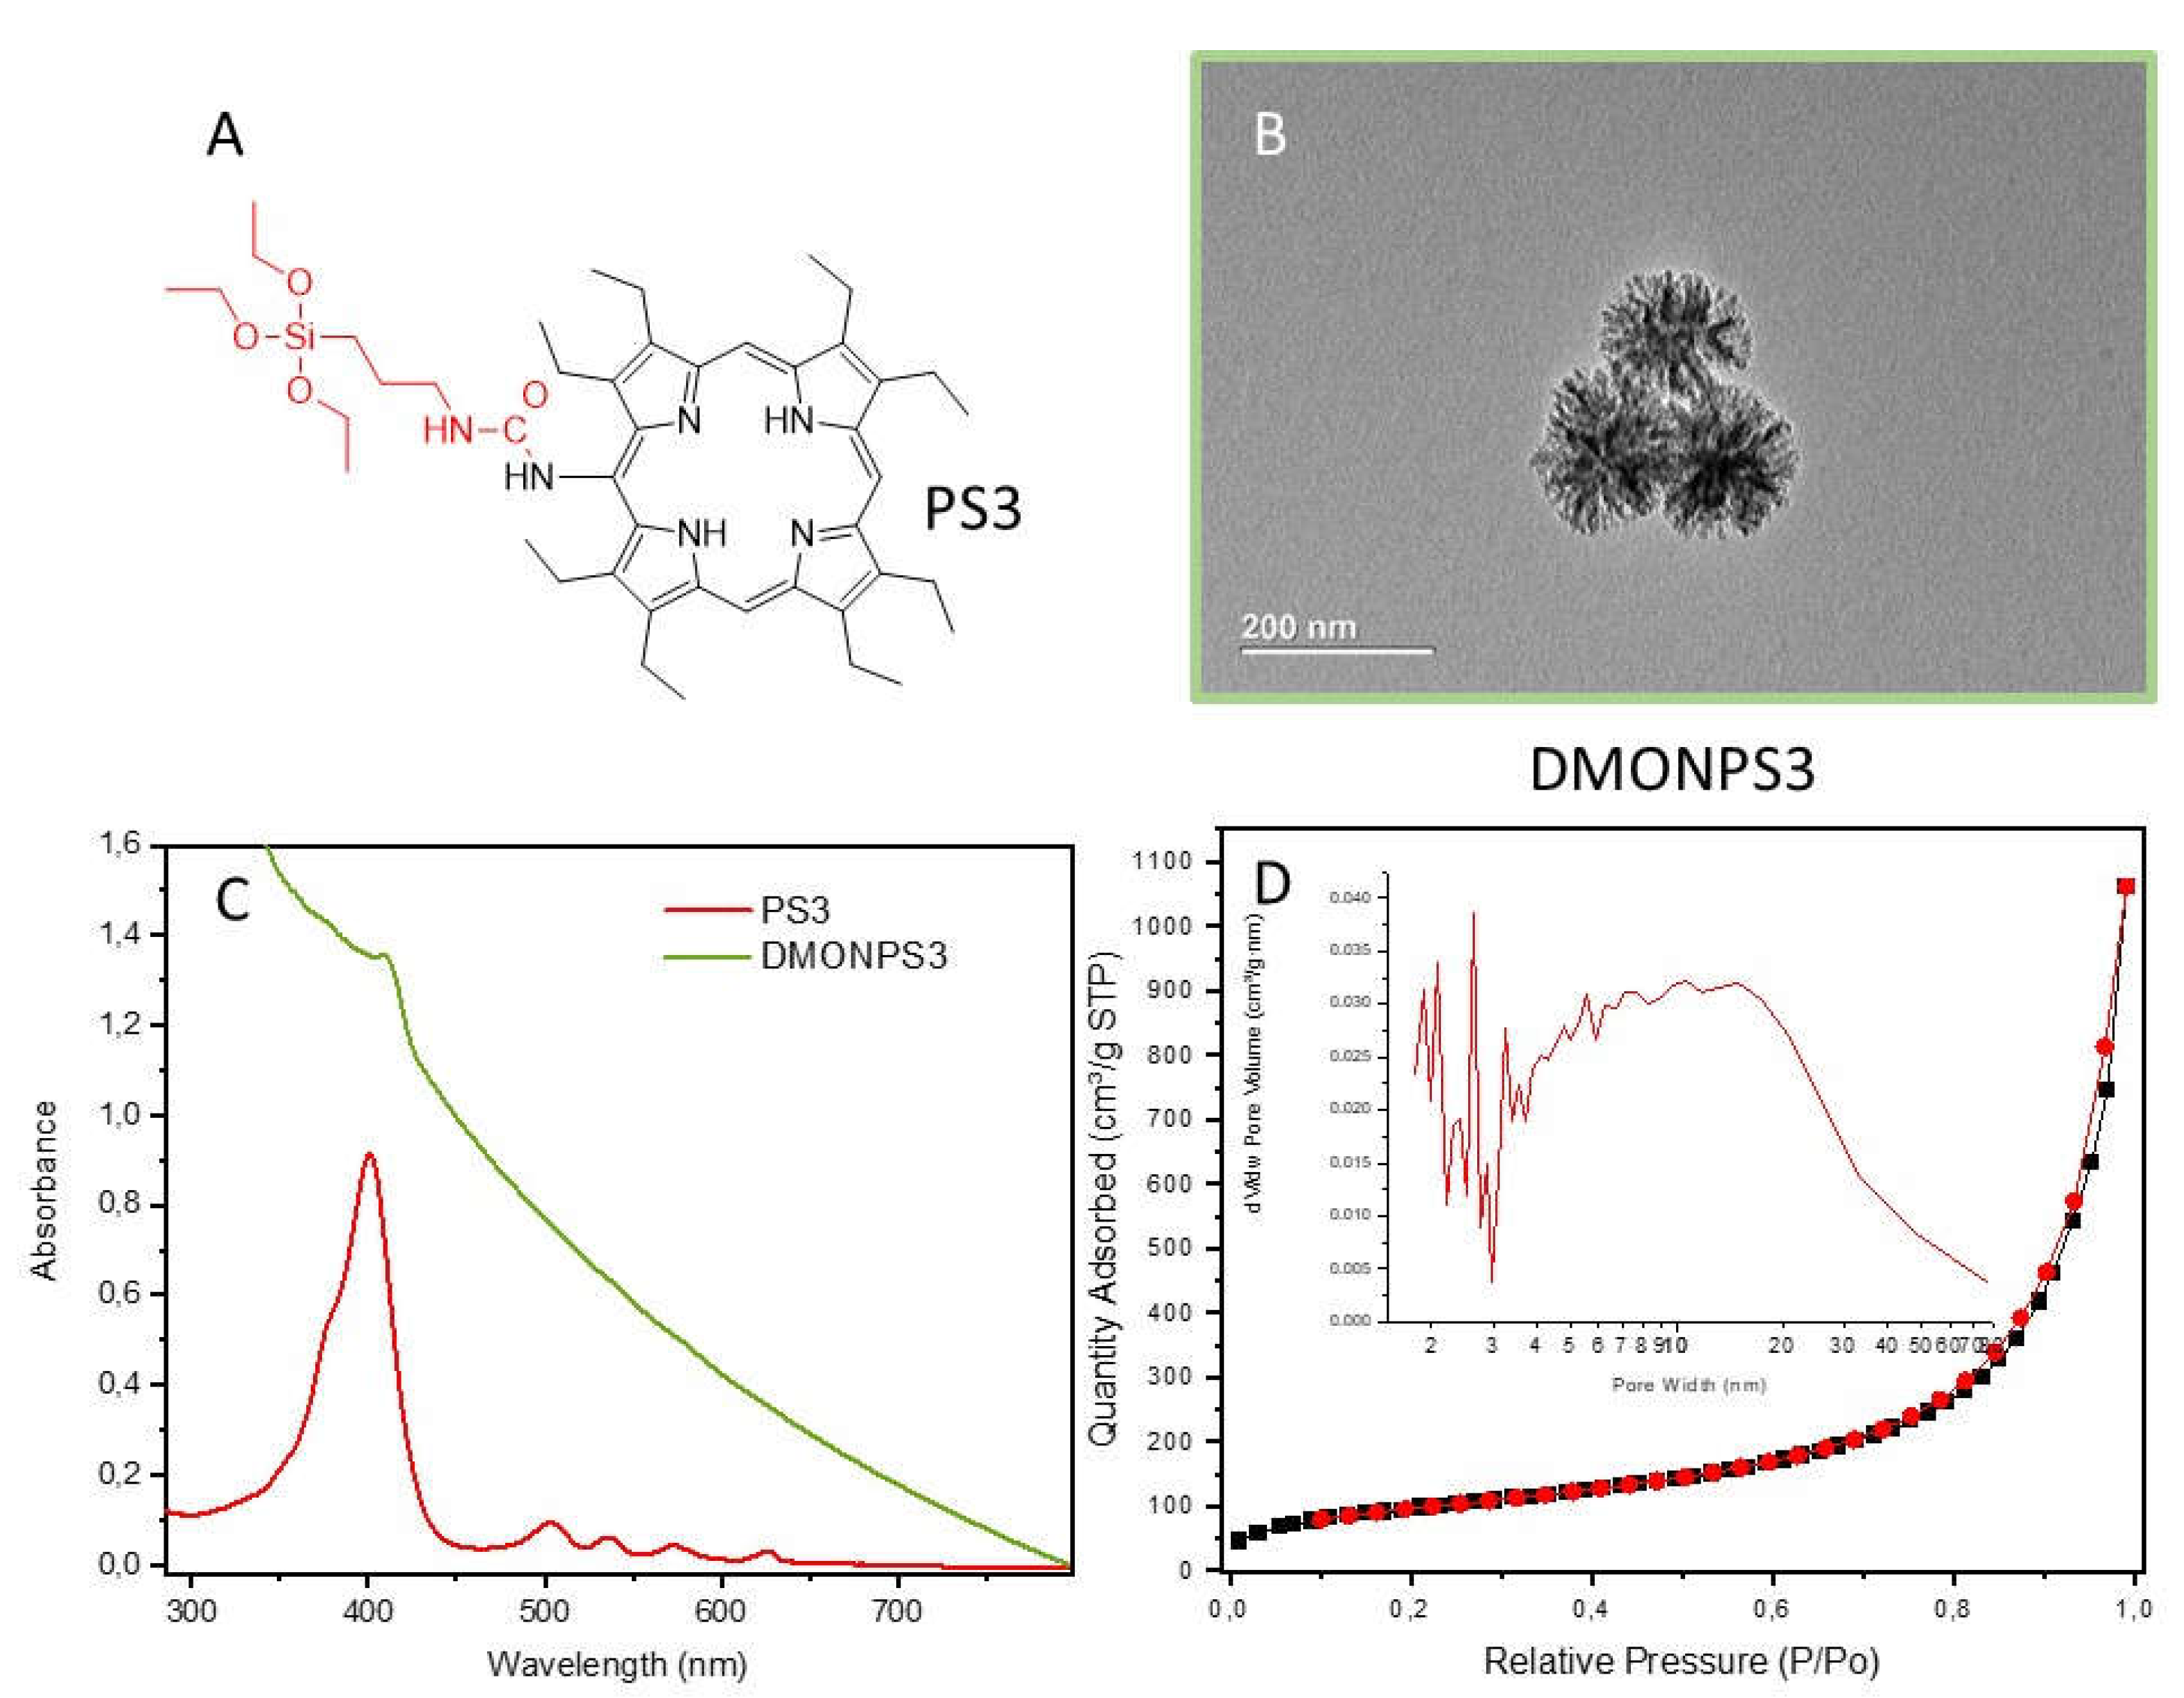
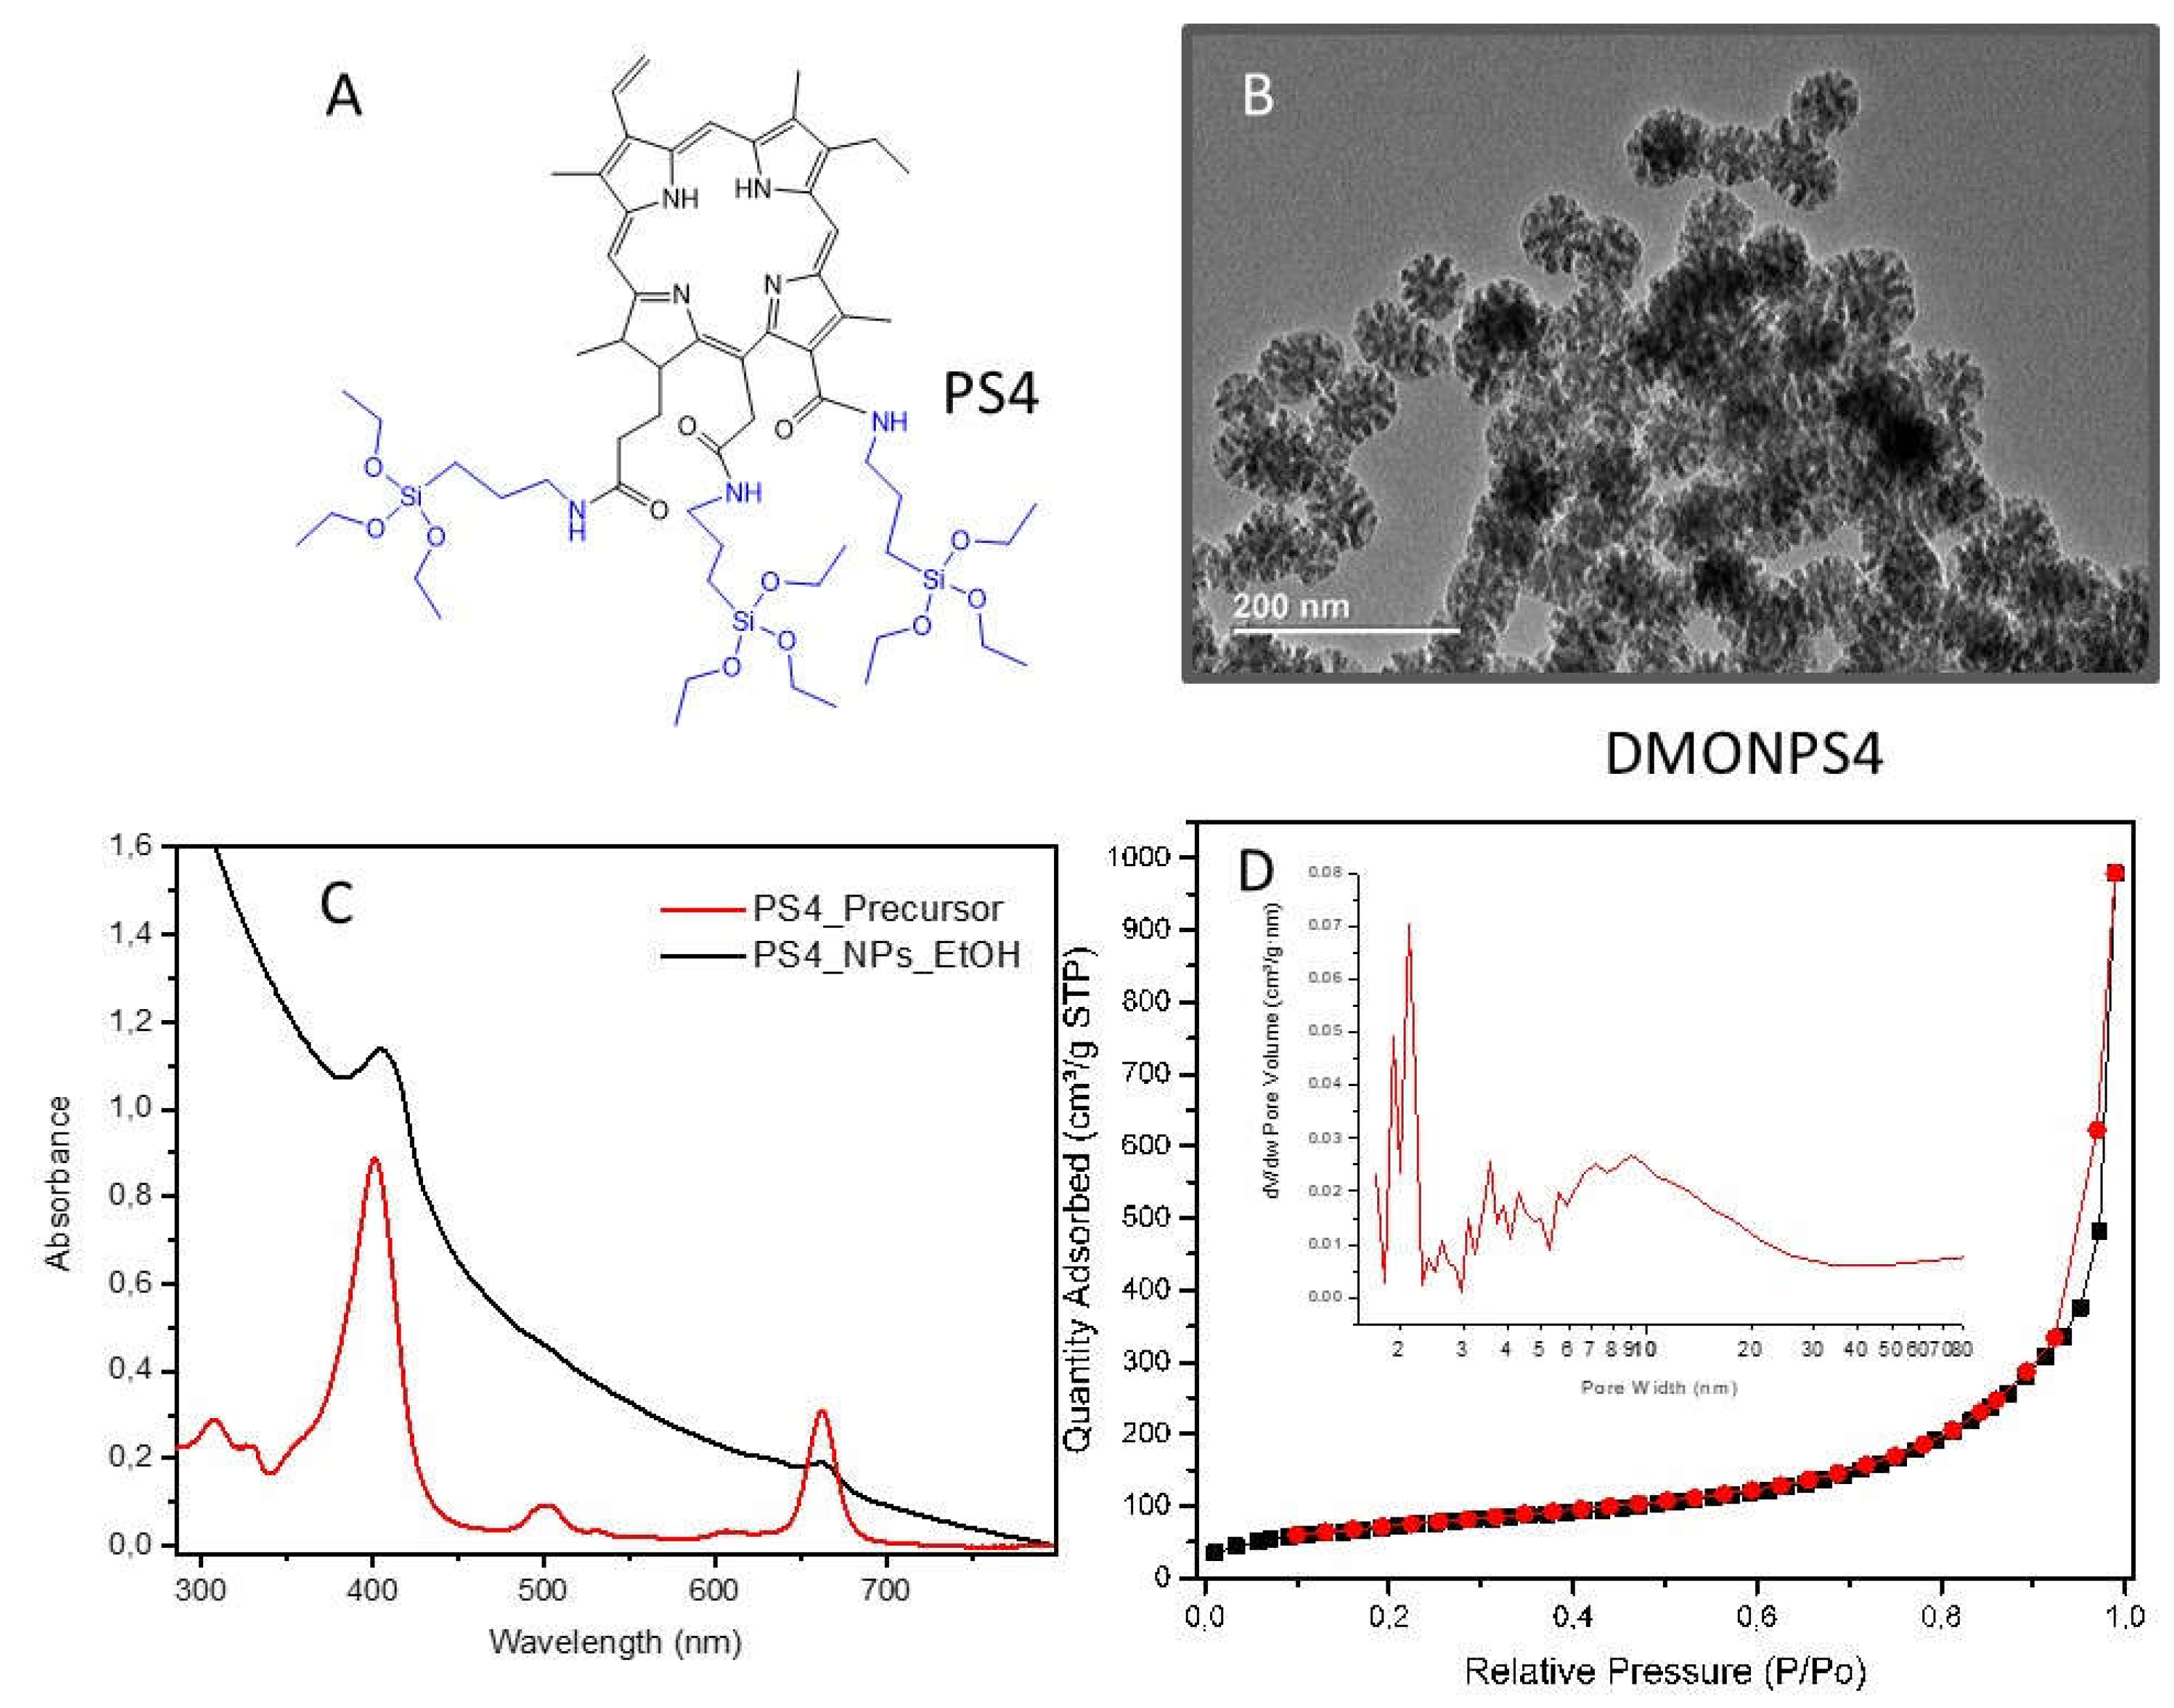
| DMONPS | DLS (nm) | ZETA Potential (mV) | BET (m2.g-1) |
Pore size (nm) |
Pore volume cm3.g-1 |
|---|---|---|---|---|---|
| DMONPS1 | 100 | -8.1 | 110 | 24.4 | 0.44 |
| DMONPS2 | 92 | -8.5 | 356 | 19.5 | 1.78 |
| DMONPS3 | 96 | -10.4 | 353 | 18.2 | 1.65 |
| DMONPS4 | 95 | -7.5 | 265 | 22.6 | 1.52 |
| DMONPS1-NH2 | 100 | 6.0 | / | / | / |
| DMONPS2-NH2 | 99 | 4.8 | / | / | / |
| DMONPS3-NH2 | 100 | 5.1 | / | / | / |
| DMONPS4-NH2 | 100 | 6.3 | / | / | / |
| DMONPS1-Lys | 99 | 42.0 | / | / | / |
| DMONPS2-lys | 99 | 26.3 | / | / | / |
| DMONPS3-Lys | 100 | 26.4 | / | / | / |
| DMONPS4-Lys | 100 | 6.0 | / | / | / |

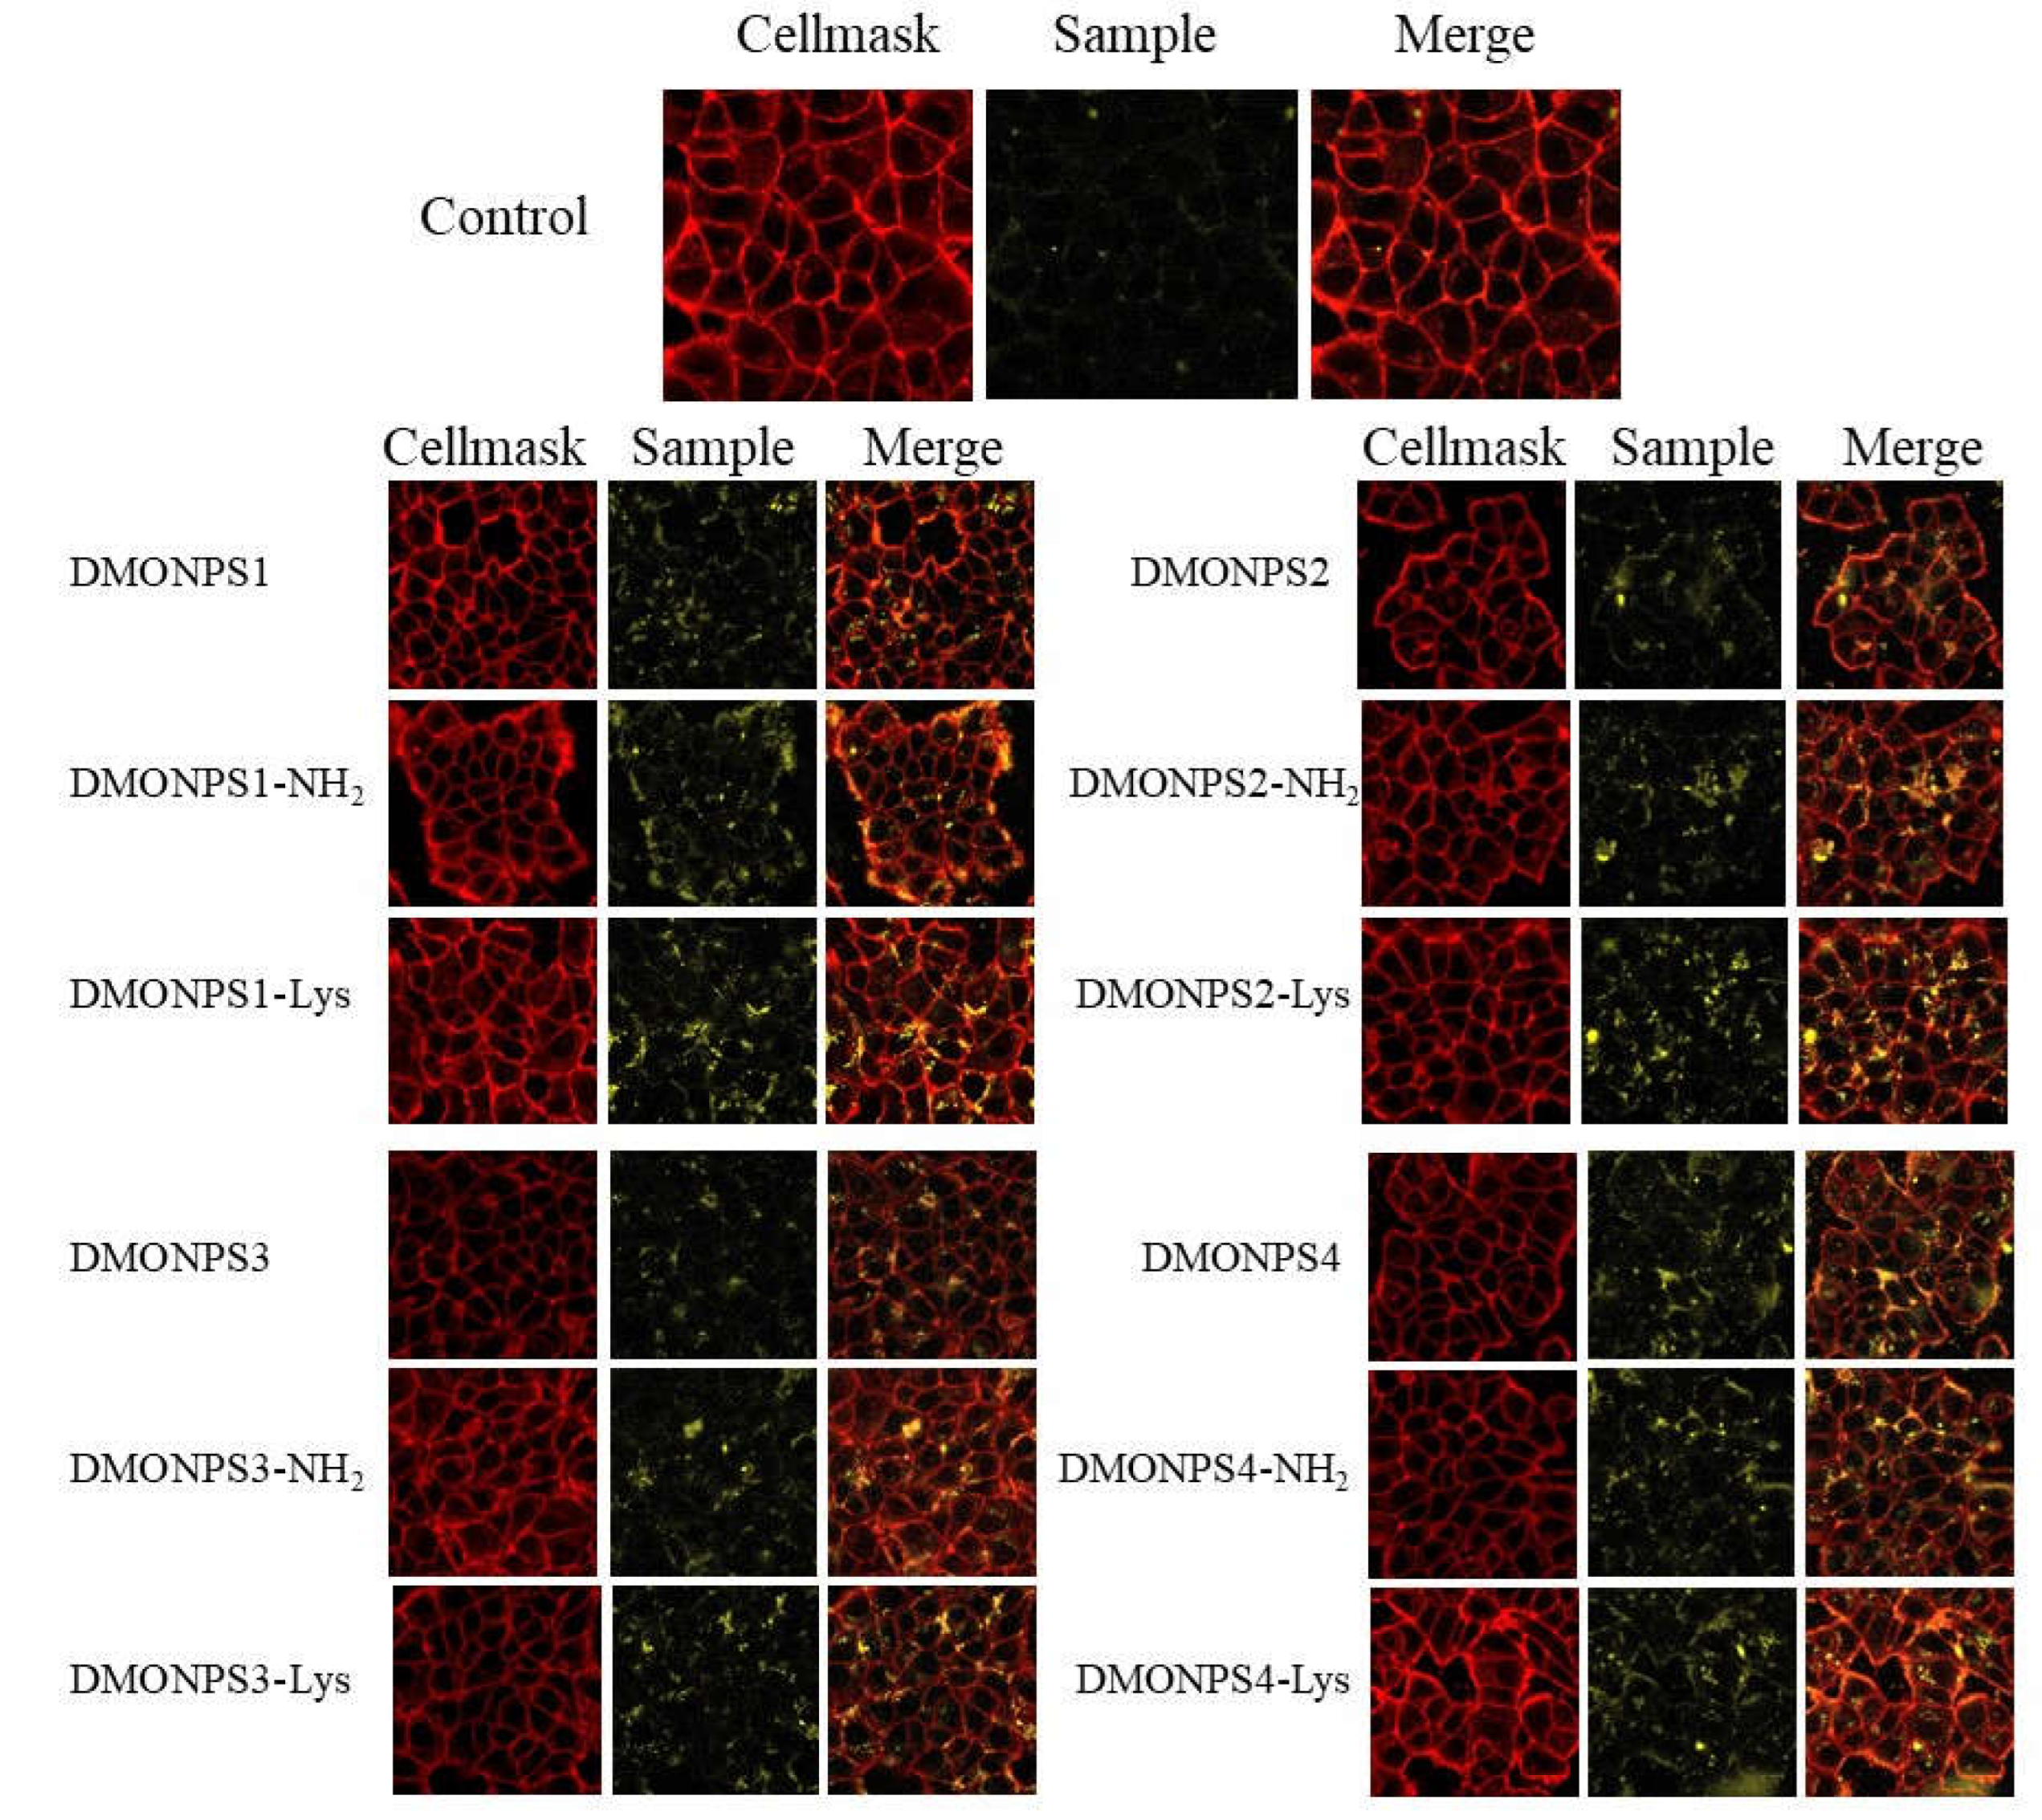
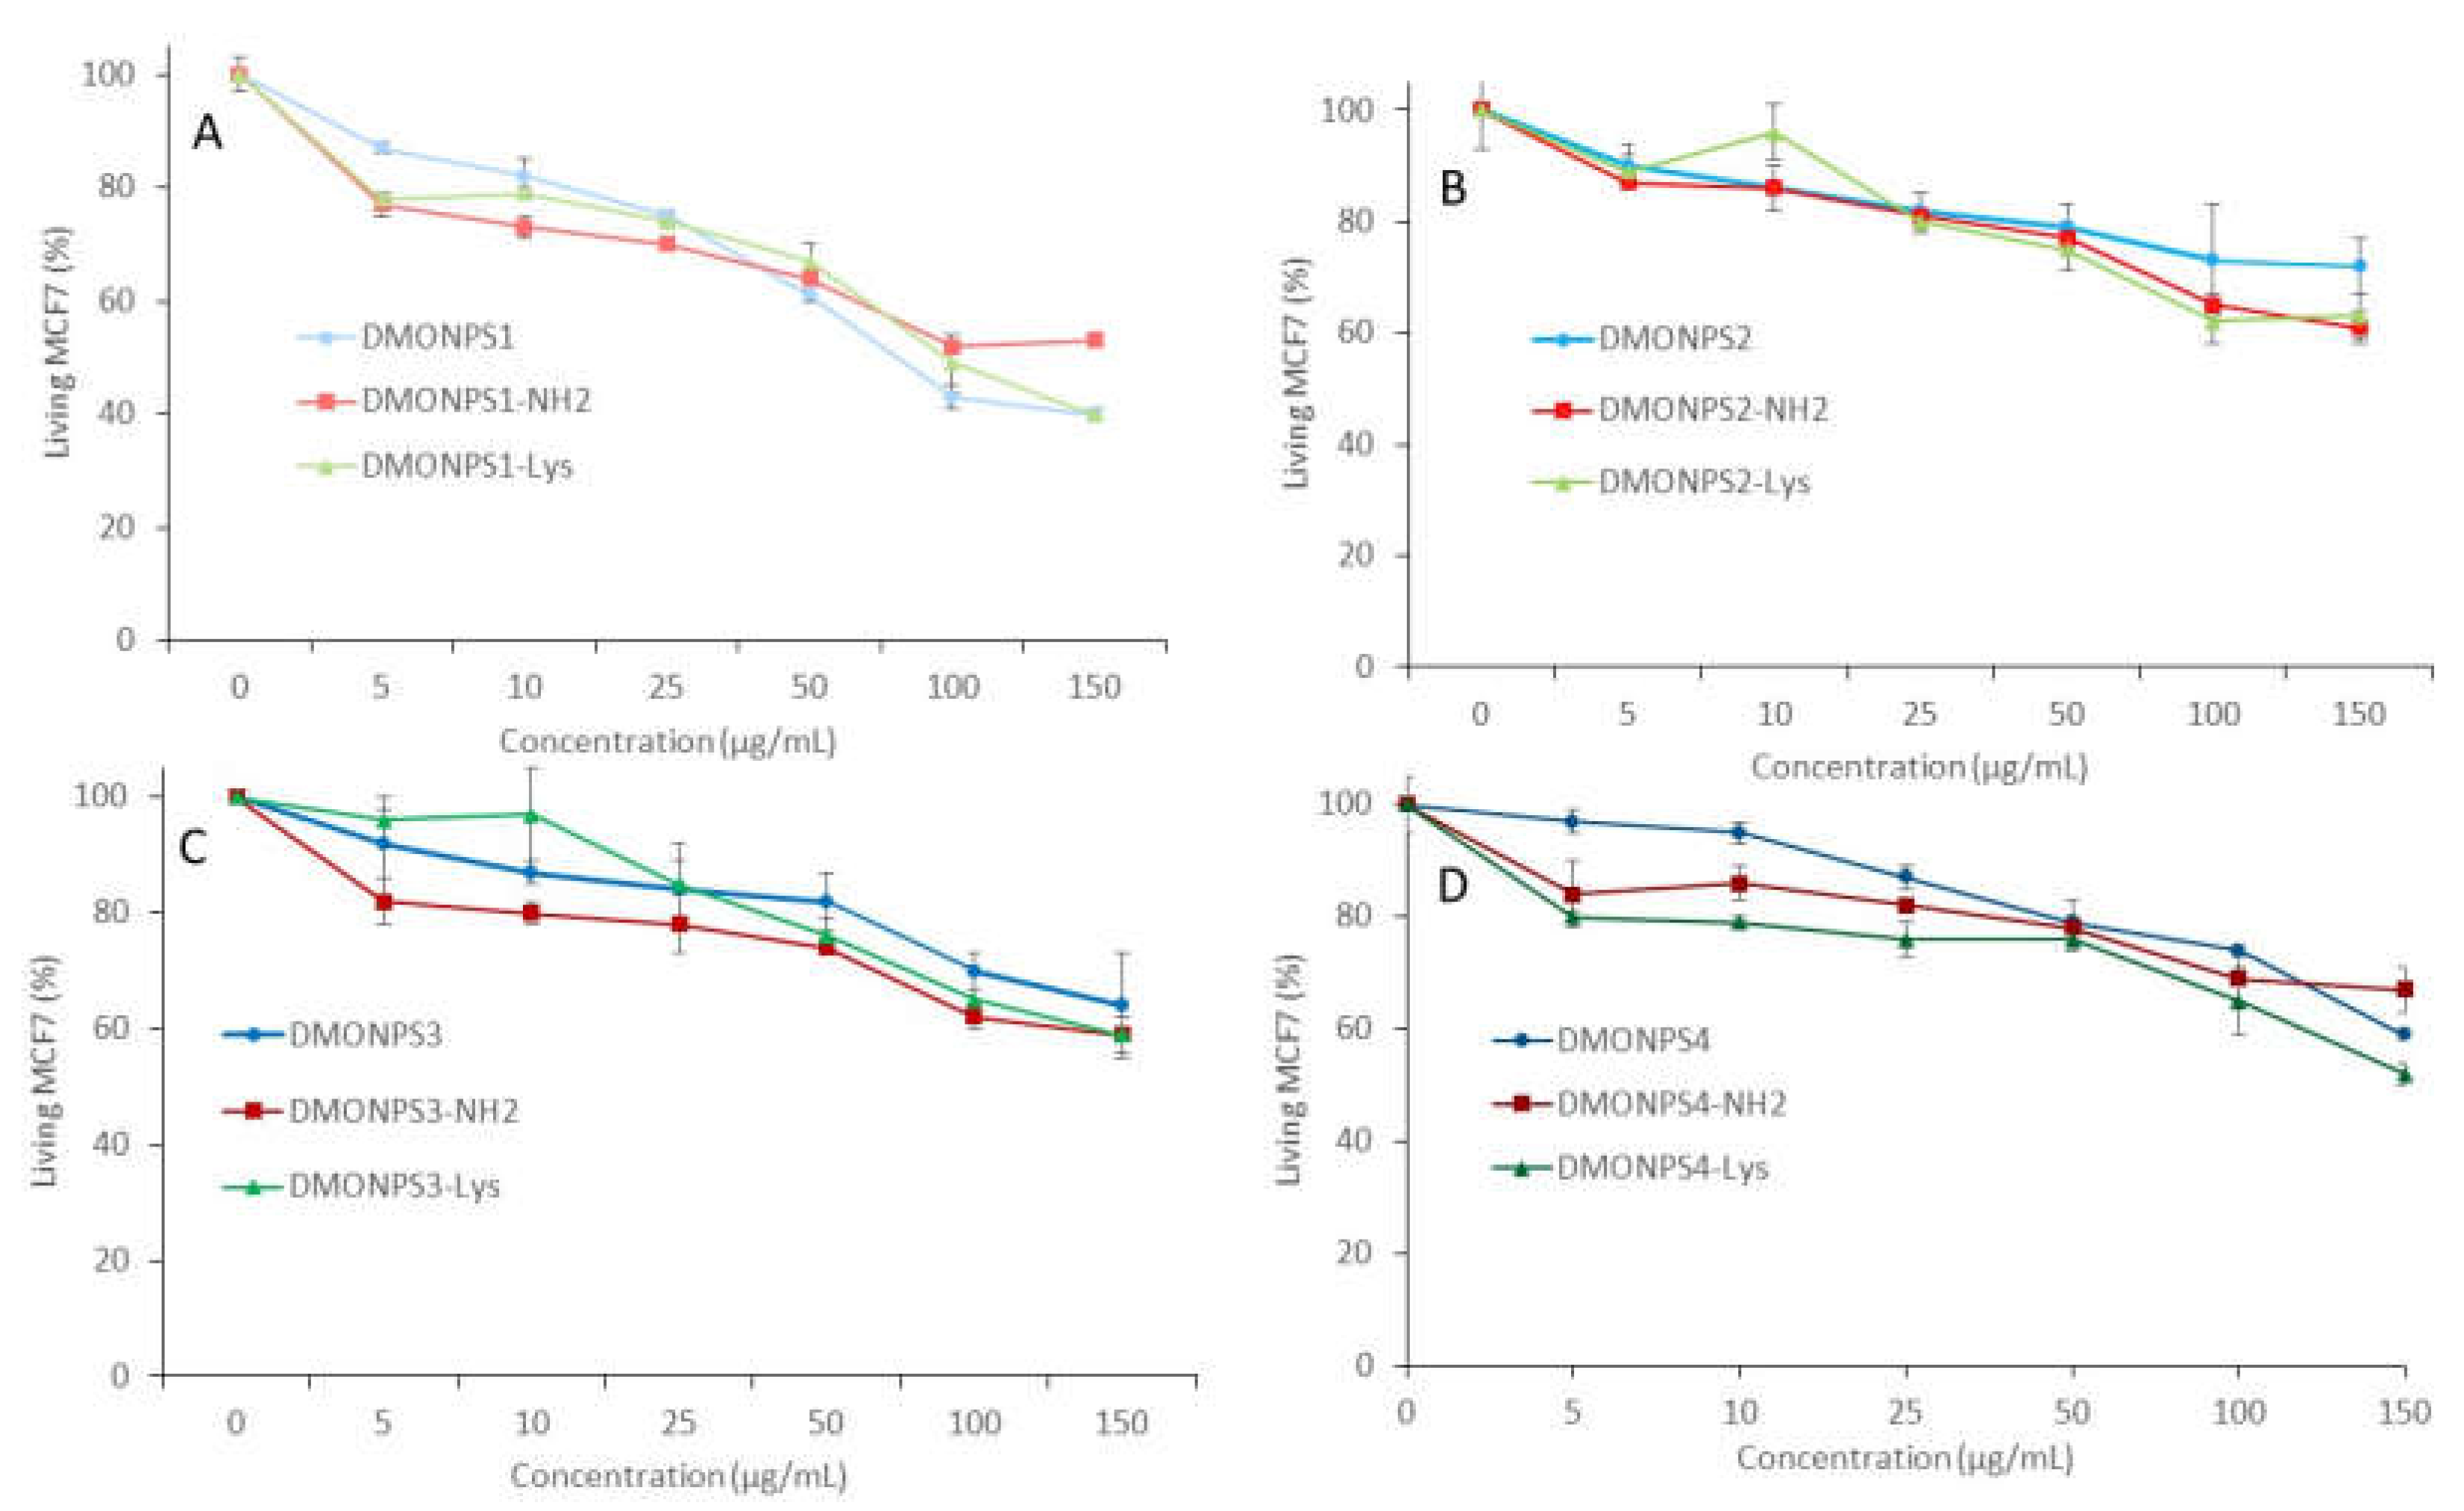

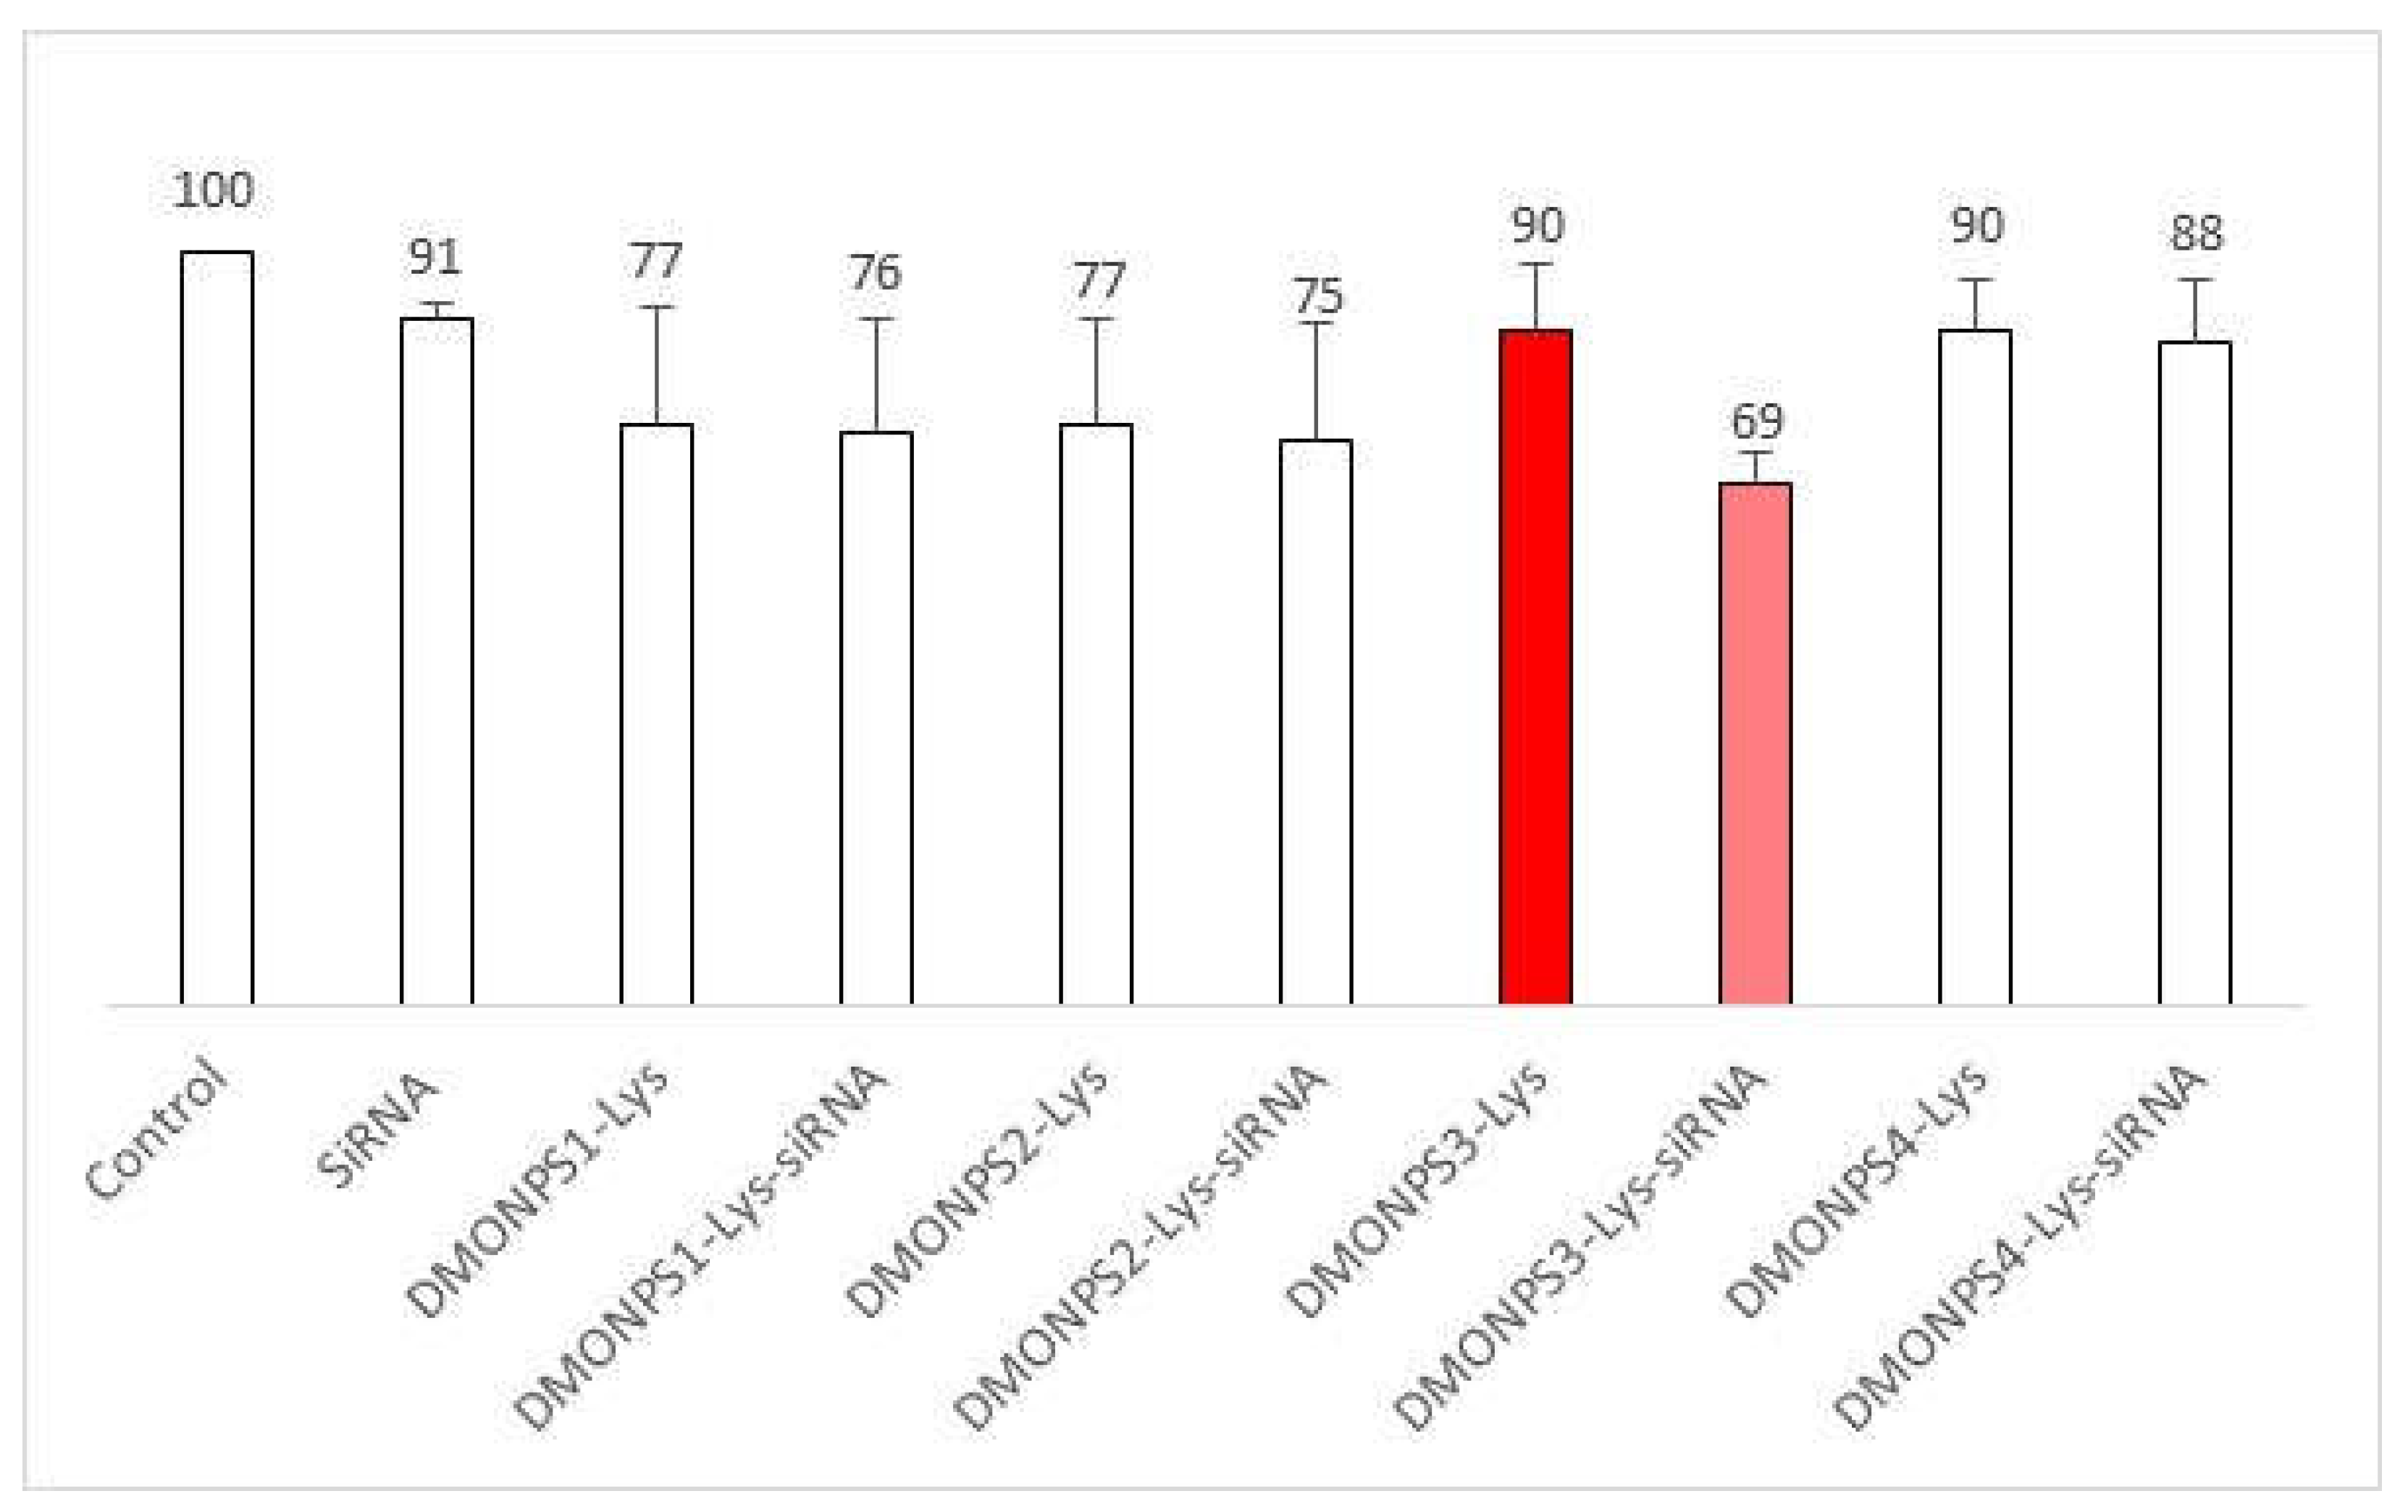
| DMONPS | DLC 2 mg/mL FVIII |
DLE 2 mg/mL FVIII |
DLC 4 mg/mL FVIII |
DLE 4 mg/mL FVIII |
|---|---|---|---|---|
| DMONPS1-Lys | 14 % | 40 % | / | / |
| DMONPS3-Lys | 12% | 35% | 25% | 42% |
3. Materials and Methods
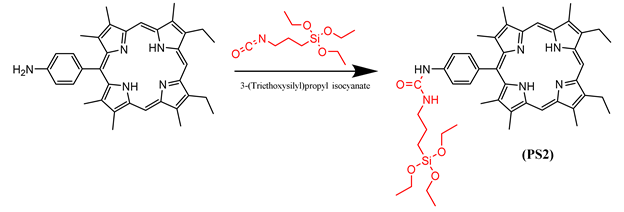
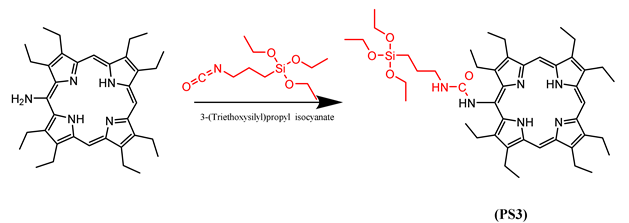
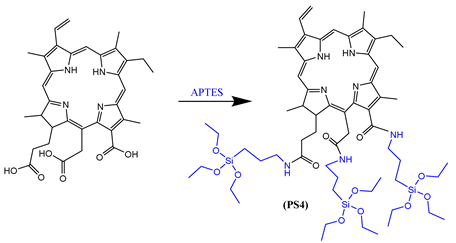
3.1. Silylation of PS1-4
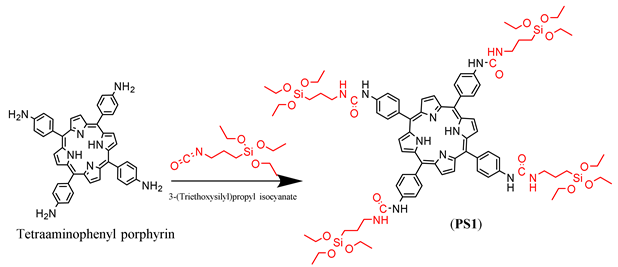
3.2. Preparation of DMONPS1-4
3.3. Preparation of DMONPS1-4 -NH2
3.4. Preparation of DMONPS1-4- Lys
4. Biological studies
4.1. Cell culture
4.2. Cytotoxicity study
4.3. Confocal Fluorescent Imaging on MCF-7
4.4. Gel Electrophoresis with siRNA
4.5. In vitro siRNA Delivery
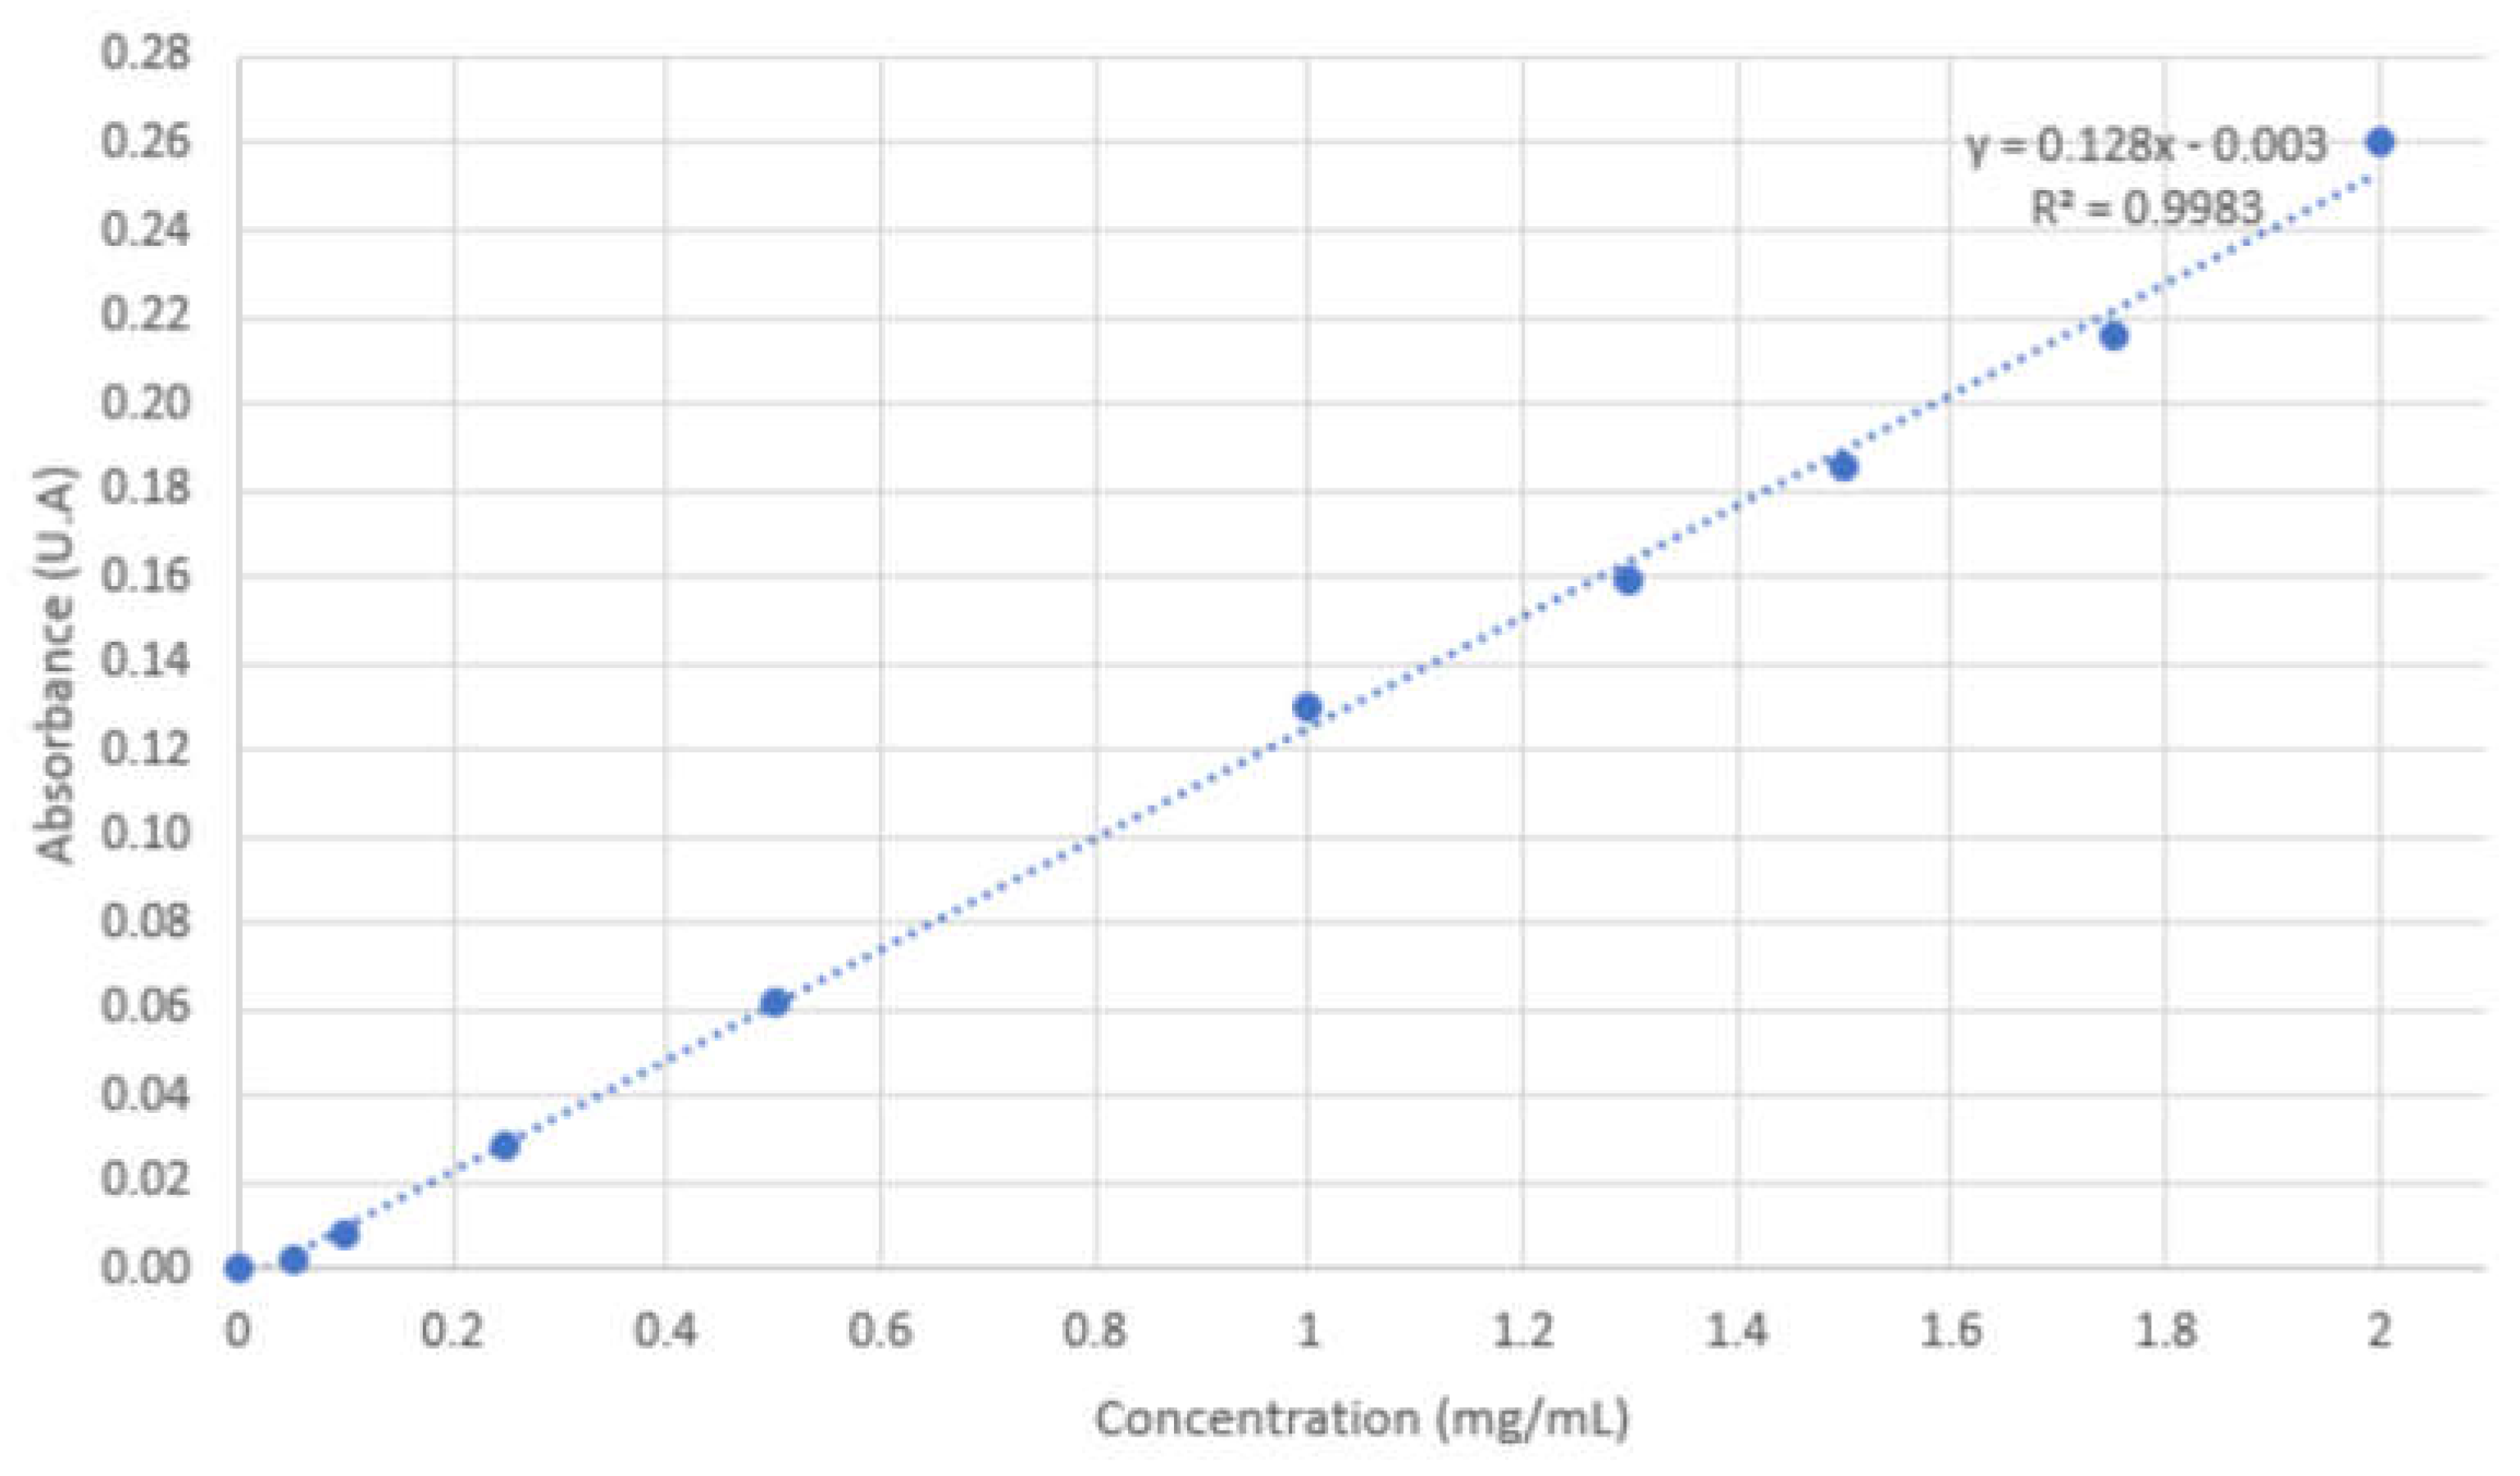
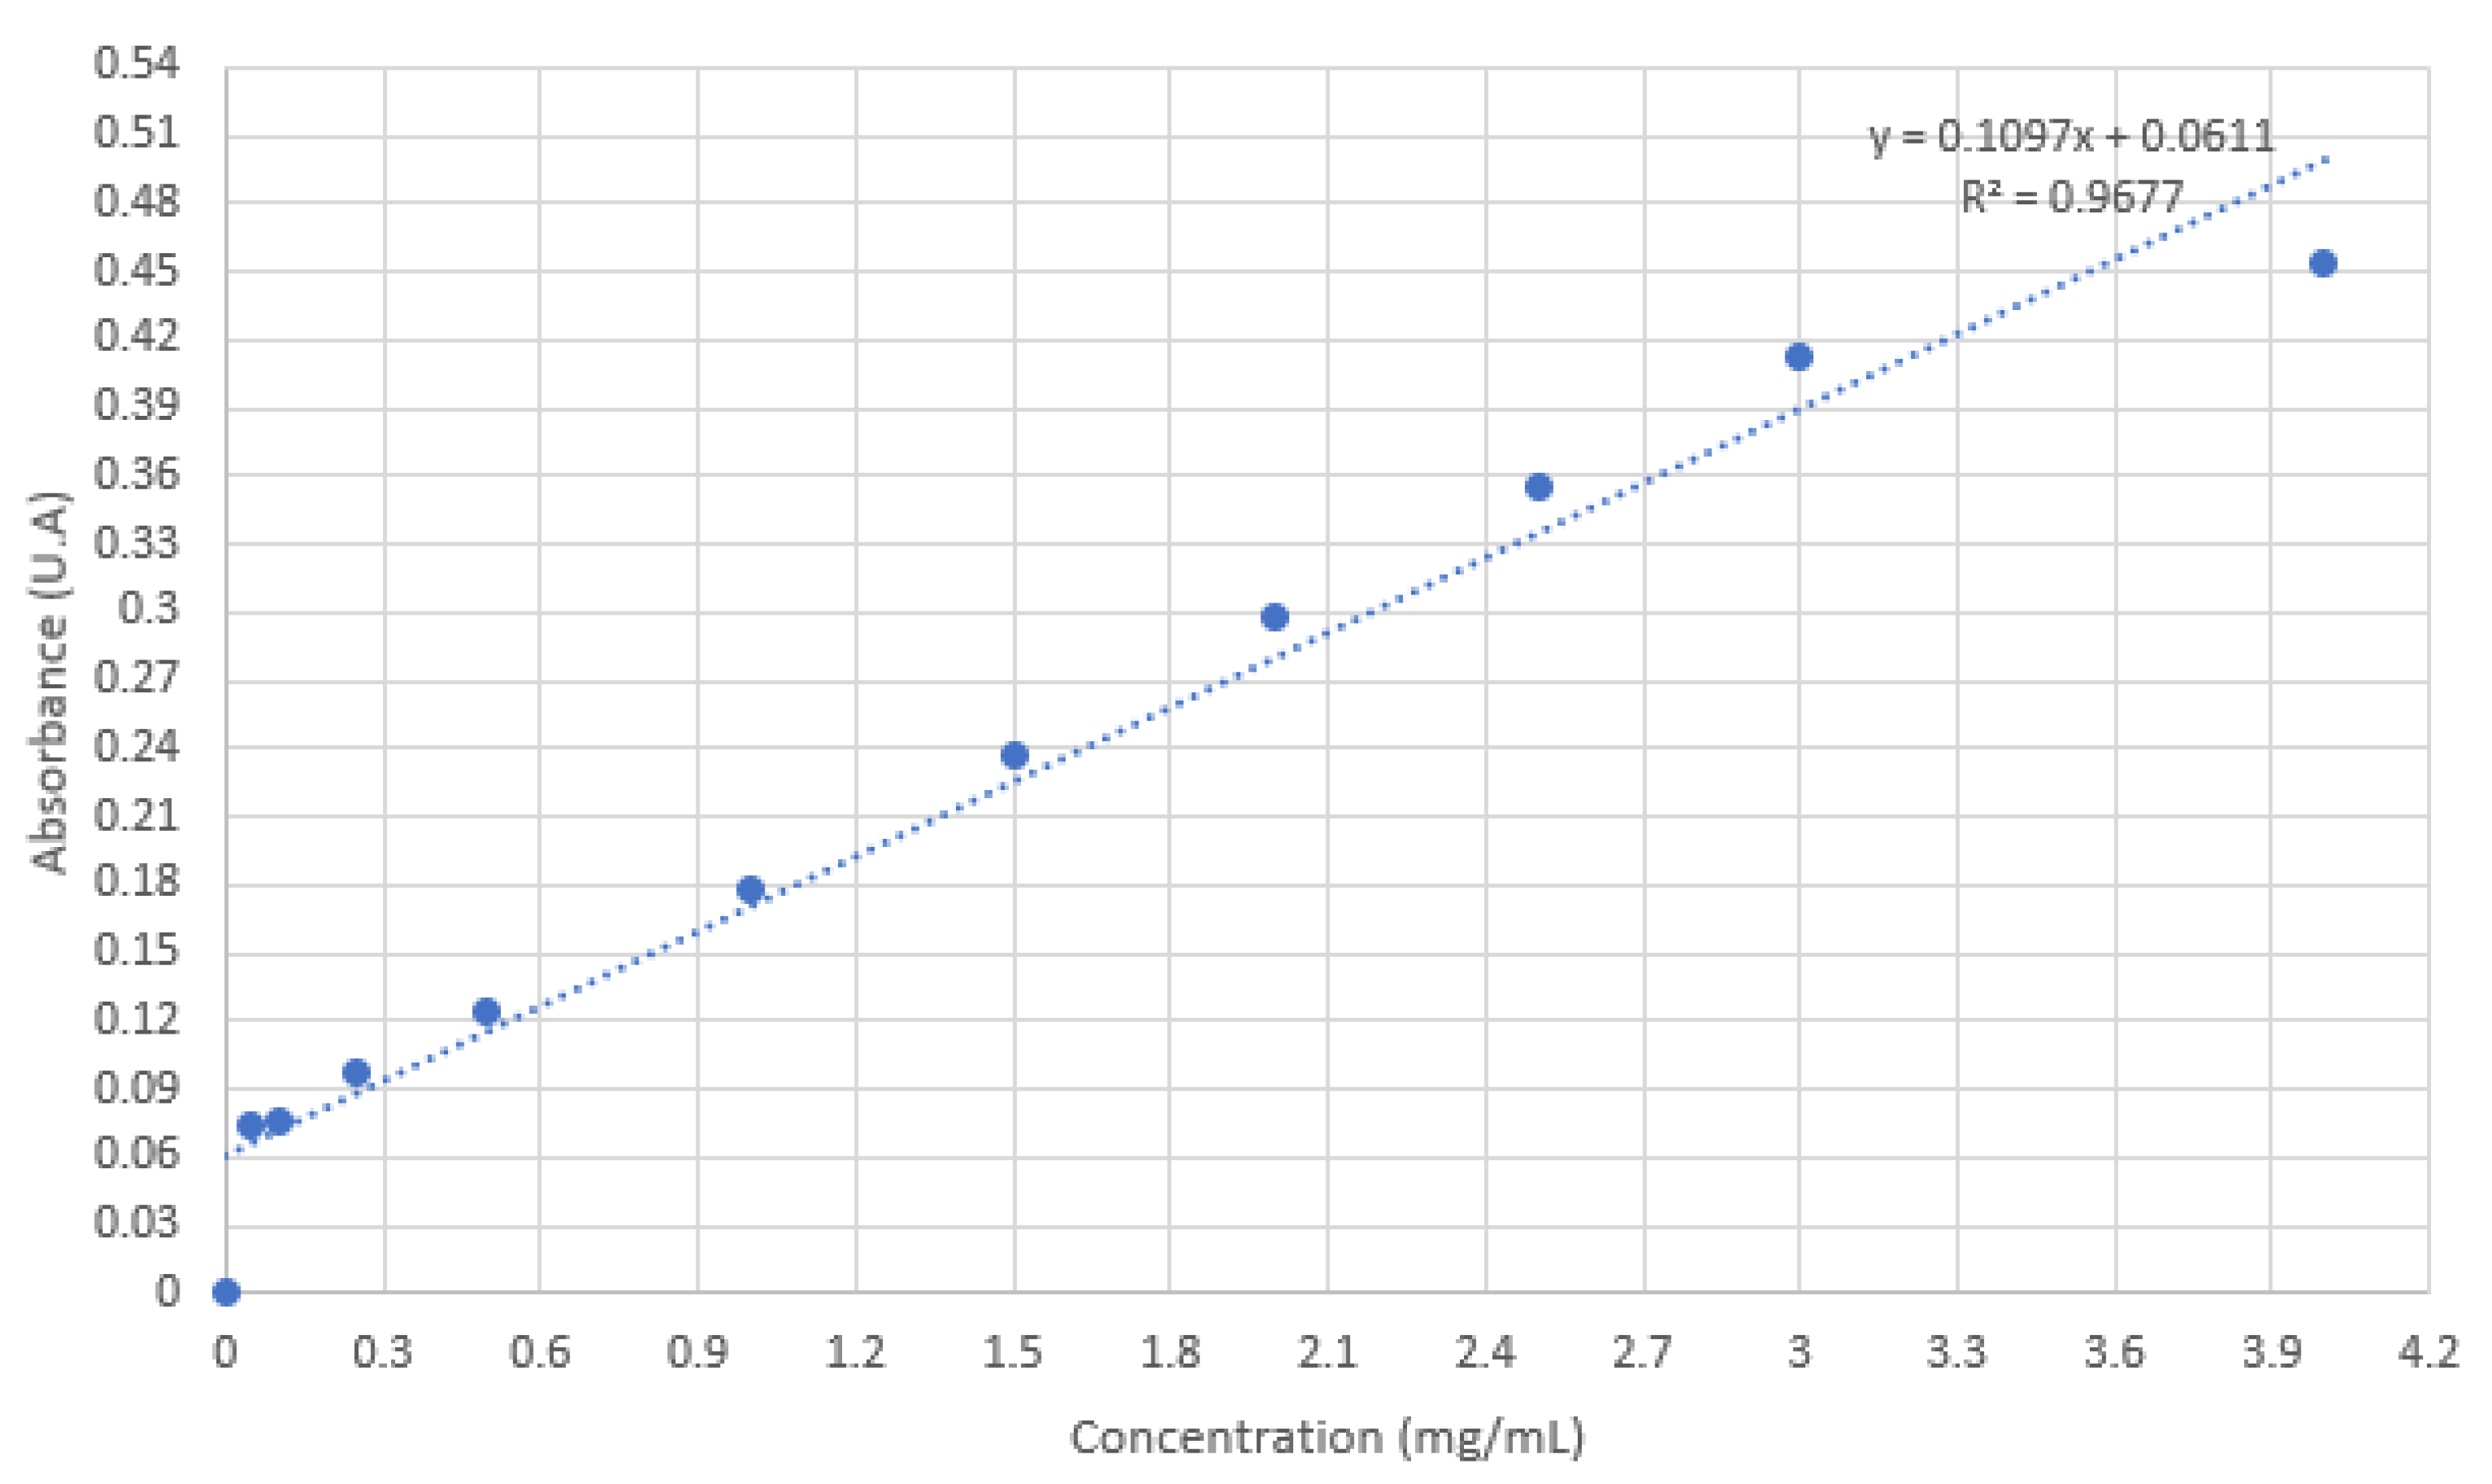
4.6. FVIII encapsulation
5. Conclusions
Author Contributions
Funding
Data Availability Statement
Acknowledgments
Conflicts of Interest
References
- Manzano, M.; Vallet-Regi, M. Mesoporous silica nanoparticles for drug delivery. Adv. Funct. Mater. 2019, 10.1002/adfm.201902634, Ahead of Print. [CrossRef]
- Li, Z.; Zhang, Y.; Feng, N. Mesoporous silica nanoparticles: synthesis, classification, drug loading, pharmacokinetics, biocompatibility, and application in drug delivery. Expert Opin. Drug Delivery 2019, 16, 219–237. [Google Scholar] [CrossRef]
- Li, T.; Shi, S.; Goel, S.; Shen, X.; Xie, X.; Chen, Z.; Zhang, H.; Li, S.; Qin, X.; Yang, H. , et al. Recent advancements in mesoporous silica nanoparticles towards therapeutic applications for cancer. Acta Biomater. 2019, 89, 1–13. [Google Scholar] [CrossRef] [PubMed]
- Castillo, R.R.; Lozano, D.; Gonzalez, B.; Manzano, M.; Izquierdo-Barba, I.; Vallet-Regi, M. Advances in mesoporous silica nanoparticles for targeted stimuli-responsive drug delivery: an update. Expert Opin. Drug Delivery 2019, 16, 415–439. [Google Scholar] [CrossRef]
- Chinnathambi, S.; Tamanoi, F. Recent Development to Explore the Use of Biodegradable Periodic Mesoporous Organosilica (BPMO) Nanomaterials for Cancer Therapy. Pharmaceutics 2020, 12, 890. [Google Scholar] [CrossRef]
- Mai, N.X.D.; Nguyen, T.-H.T.; Vong, L.B.; Dang, M.-H.D.; Nguyen, T.T.T.; Nguyen, L.H.T.; Ta, H.K.T.; Nguyen, T.-H.; Phan, T.B.; Doan, T.L.H. Tailoring chemical compositions of biodegradable mesoporous organosilica nanoparticles for controlled slow release of chemotherapeutic drug. Materials Science and Engineering: C 2021, 127, 112232. [Google Scholar] [CrossRef] [PubMed]
- Guan, L.; Chen, J.; Tian, Z.; Zhu, M.; Bian, Y.; Zhu, Y. Mesoporous organosilica nanoparticles: Degradation strategies and application in tumor therapy. VIEW 2021, 2, 20200117. [Google Scholar] [CrossRef]
- Guimarães, R.S.; Rodrigues, C.F.; Moreira, A.F.; Correia, I.J. Overview of stimuli-responsive mesoporous organosilica nanocarriers for drug delivery. Pharmacol.. Res. 2020, 155, 104742. [Google Scholar] [CrossRef]
- Cheng, Y.; Jiao, X.; Fan, W.; Yang, Z.; Wen, Y.; Chen, X. Controllable synthesis of versatile mesoporous organosilica nanoparticles as precision cancer theranostics. Biomaterials 2020, 256, 120191. [Google Scholar] [CrossRef]
- Yang, B.; Chen, Y.; Shi, J. Mesoporous silica/organosilica nanoparticles: Synthesis, biological effect and biomedical application. Materials Science and Engineering: R: Reports 2019, 137, 66–105. [Google Scholar] [CrossRef]
- Yu, L.; Chen, Y.; Lin, H.; Du, W.; Chen, H.; Shi, J. Ultrasmall mesoporous organosilica nanoparticles: Morphology modulations and redox-responsive biodegradability for tumor-specific drug delivery. Biomaterials 2018, 161, 292–305. [Google Scholar] [CrossRef]
- Croissant, J.G.; Fatieiev, Y.; Almalik, A.; Khashab, N.M. Mesoporous Silica and Organosilica Nanoparticles: Physical Chemistry, Biosafety, Delivery Strategies, and Biomedical Applications. Adv. Healthc. Mater. 2018, 7, 1700831. [Google Scholar] [CrossRef]
- Du, X.; Li, X.; Xiong, L.; Zhang, X.; Kleitz, F.; Qiao, S.Z. Mesoporous silica nanoparticles with organo-bridged silsesquioxane framework as innovative platforms for bioimaging and therapeutic agent delivery. Biomaterials 2016, 91, 90–127. [Google Scholar] [CrossRef]
- Chen, Y.; Shi, J. Chemistry of Mesoporous Organosilica in Nanotechnology: Molecularly Organic-Inorganic Hybridization into Frameworks. Adv. Mater. 2016, 28, 3235–3272. [Google Scholar] [CrossRef]
- Croissant, J.G.; Cattoen, X.; Wong Chi Man, M.; Durand, J.-O.; Khashab, N.M. Syntheses and applications of periodic mesoporous organosilica nanoparticles. Nanoscale 2015, 7, 20318–20334. [Google Scholar] [CrossRef] [PubMed]
- Yang, S.; Chen, S.; Fan, J.; Shang, T.; Huang, D.; Li, G. Novel mesoporous organosilica nanoparticles with ferrocene group for efficient removal of contaminants from wastewater. J. Coll. Int. Sci. 2019, 554, 565–571. [Google Scholar] [CrossRef]
- Hoffmann, F.; Cornelius, M.; Morell, J.; Froeba, M. Silica-based mesoporous organic-inorganic hybrid materials. Angew. Chem., Int. Ed. 2006, 45, 3216–3251. [Google Scholar] [CrossRef] [PubMed]
- Kickelbick, G. Hybrid inorganic-organic mesoporous materials. Angew. Chem., Int. Ed. 2004, 43, 3102–3104. [Google Scholar] [CrossRef]
- Tao, J.; Su, X.; Li, J.; Shi, W.; Teng, Z.; Wang, L. Intricately structured mesoporous organosilica nanoparticles: synthesis strategies and biomedical applications. Biomaterials Science 2021, 9, 1609–1626. [Google Scholar] [CrossRef] [PubMed]
- Wang, Y.; Zhang, B.; Ding, X.; Du, X. Dendritic mesoporous organosilica nanoparticles (DMONs): Chemical composition, structural architecture, and promising applications. Nano Today 2021, 39, 101231. [Google Scholar] [CrossRef]
- Wang, Y.; Song, H.; Liu, C.; Zhang, Y.; Kong, Y.; Tang, J.; Yang, Y.; Yu, C. Confined growth of ZIF-8 in dendritic mesoporous organosilica nanoparticles as bioregulators for enhanced mRNA delivery in vivo. National science review 2021, 8, nwaa268. [Google Scholar] [CrossRef] [PubMed]
- Mezghrani, B.; Ali, L.M.A.; Richeter, S.; Durand, J.-O.; Hesemann, P.; Bettache, N. Periodic Mesoporous Ionosilica Nanoparticles for Green Light Photodynamic Therapy and Photochemical Internalization of siRNA. ACS Appl. Mater. Interfaces. 2021, 13, 29325–29339. [Google Scholar] [CrossRef] [PubMed]
- Pham, T.C.; Nguyen, V.-N.; Choi, Y.; Lee, S.; Yoon, J. Recent Strategies to Develop Innovative Photosensitizers for Enhanced Photodynamic Therapy. Chem. Rev. 2021, 121, 13454–13619. [Google Scholar] [CrossRef] [PubMed]
- Tsuboi, M.; Matsuo, K.; Ts'o, P.O.P. Interaction of poly-l-lysine and nucleic acids. Journal of Molecular Biology 1966, 15, 256–267. [Google Scholar] [CrossRef] [PubMed]
- Daurat, M.; Rahmani, S.; Bouchal, R.; Akrout, A.; Budimir, J.; Nguyen, C.; Charnay, C.; Guari, Y.; Richeter, S.; Raehm, L. , et al. Organosilica Nanoparticles for Gemcitabine Monophosphate Delivery in Cancer Cells. ChemNanoMat 2019, 5, 888–896. [Google Scholar] [CrossRef]
- Aggad, D.; Mauriello Jimenez, C.; Dib, S.; Croissant, J.G.; Lichon, L.; Laurencin, D.; Richeter, S.; Maynadier, M.; Alsaiari, S.K.; Boufatit, M. , et al. Gemcitabine Delivery and Photodynamic Therapy in Cancer Cells via Porphyrin-Ethylene-Based Periodic Mesoporous Organosilica Nanoparticles. ChemNanoMat 2018, 4, 46–51. [Google Scholar] [CrossRef]
- Jimenez, C.M.; Rubio, Y.G.; Saunier, V.; Warther, D.; Stojanovic, V.; Raehm, L.; Frochot, C.; Arnoux, P.; Garcia, M.; Morère, A. , et al. 20-nm-sized mesoporous silica nanoparticles with porphyrin photosensitizers for in vitro photodynamic therapy. J. Sol-Gel Sci. Technol. 2016, 79, 447–456. [Google Scholar] [CrossRef]
- Yang, G.; Gong, H.; Qian, X.; Tan, P.; Li, Z.; Liu, T.; Liu, J.; Li, Y.; Liu, Z. Mesoporous silica nanorods intrinsically doped with photosensitizers as a multifunctional drug carrier for combination therapy of cancer. Nano Research 2015, 8, 751–764. [Google Scholar] [CrossRef]
- Yang, Y.; Wan, J.; Niu, Y.; Gu, Z.; Zhang, J.; Yu, M.; Yu, C. Structure-Dependent and Glutathione-Responsive Biodegradable Dendritic Mesoporous Organosilica Nanoparticles for Safe Protein Delivery. Chem. Mater. 2016, 28, 9008–9016. [Google Scholar] [CrossRef]
- Lacombe, S.; Cardy, H.; Simon, M.; Khoukh, A.; Soumillion, J.P.; Ayadim, M. Oxidation of sulfides and disulfides under electron transfer or singlet oxygen photosensitization using soluble or grafted sensitizers. Photochem. Photobiol. Sci. 2002, 1, 347–354. [Google Scholar] [CrossRef] [PubMed]
- Samuelson Bannow, B.; Recht, M.; Négrier, C.; Hermans, C.; Berntorp, E.; Eichler, H.; Mancuso, M.E.; Klamroth, R.; O'Hara, J.; Santagostino, E. , et al. Factor VIII: Long-established role in haemophilia A and emerging evidence beyond haemostasis. Blood Reviews 2019, 35, 43–50. [Google Scholar] [CrossRef] [PubMed]
- Qu, J.; Ma, C.; Xu, X.-Q.; Xiao, M.; Zhang, J.; Li, D.; Liu, D.; Konkle, B.A.; Miao, C.H.; Li, L. , et al. Comparative glycosylation mapping of plasma-derived and recombinant human factor VIII. PLoS One 2020, 15, e0233576. [Google Scholar] [CrossRef] [PubMed]
Disclaimer/Publisher’s Note: The statements, opinions and data contained in all publications are solely those of the individual author(s) and contributor(s) and not of MDPI and/or the editor(s). MDPI and/or the editor(s) disclaim responsibility for any injury to people or property resulting from any ideas, methods, instructions or products referred to in the content. |
© 2023 by the authors. Licensee MDPI, Basel, Switzerland. This article is an open access article distributed under the terms and conditions of the Creative Commons Attribution (CC BY) license (http://creativecommons.org/licenses/by/4.0/).


