Submitted:
26 May 2023
Posted:
29 May 2023
You are already at the latest version
Abstract
Keywords:
1. Introduction
2. Materials and Methods
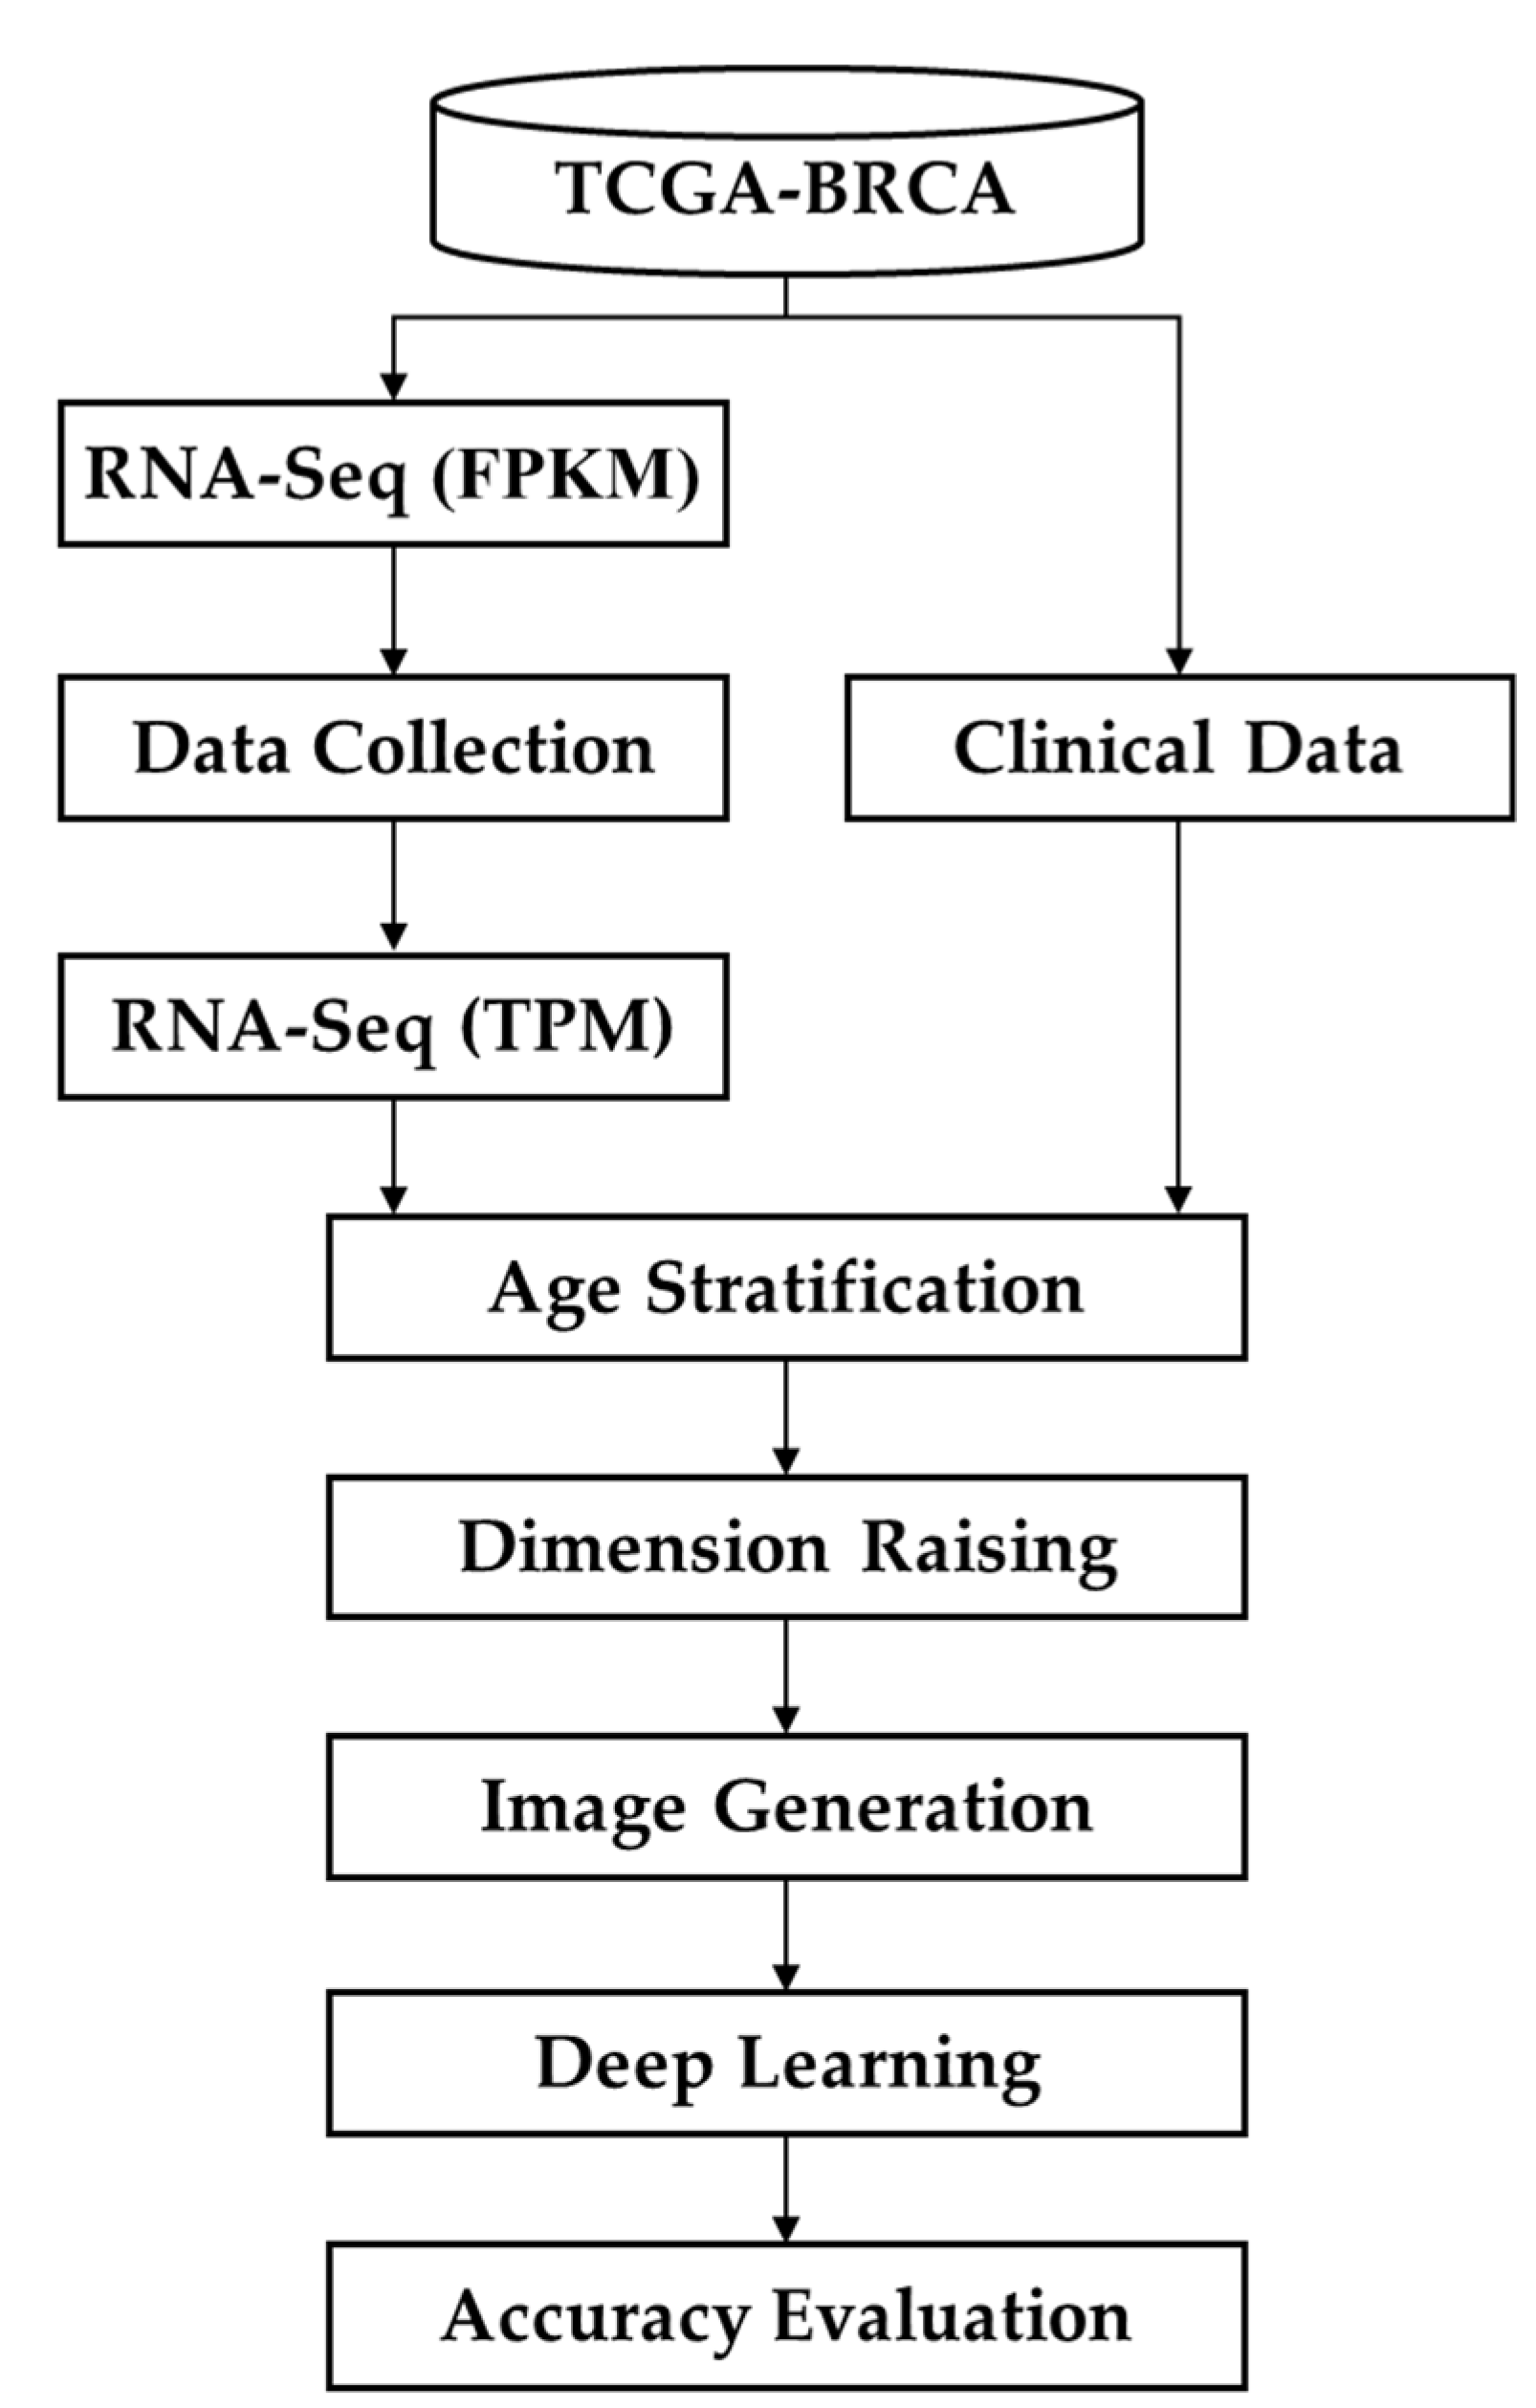
2.1. Modeling Process
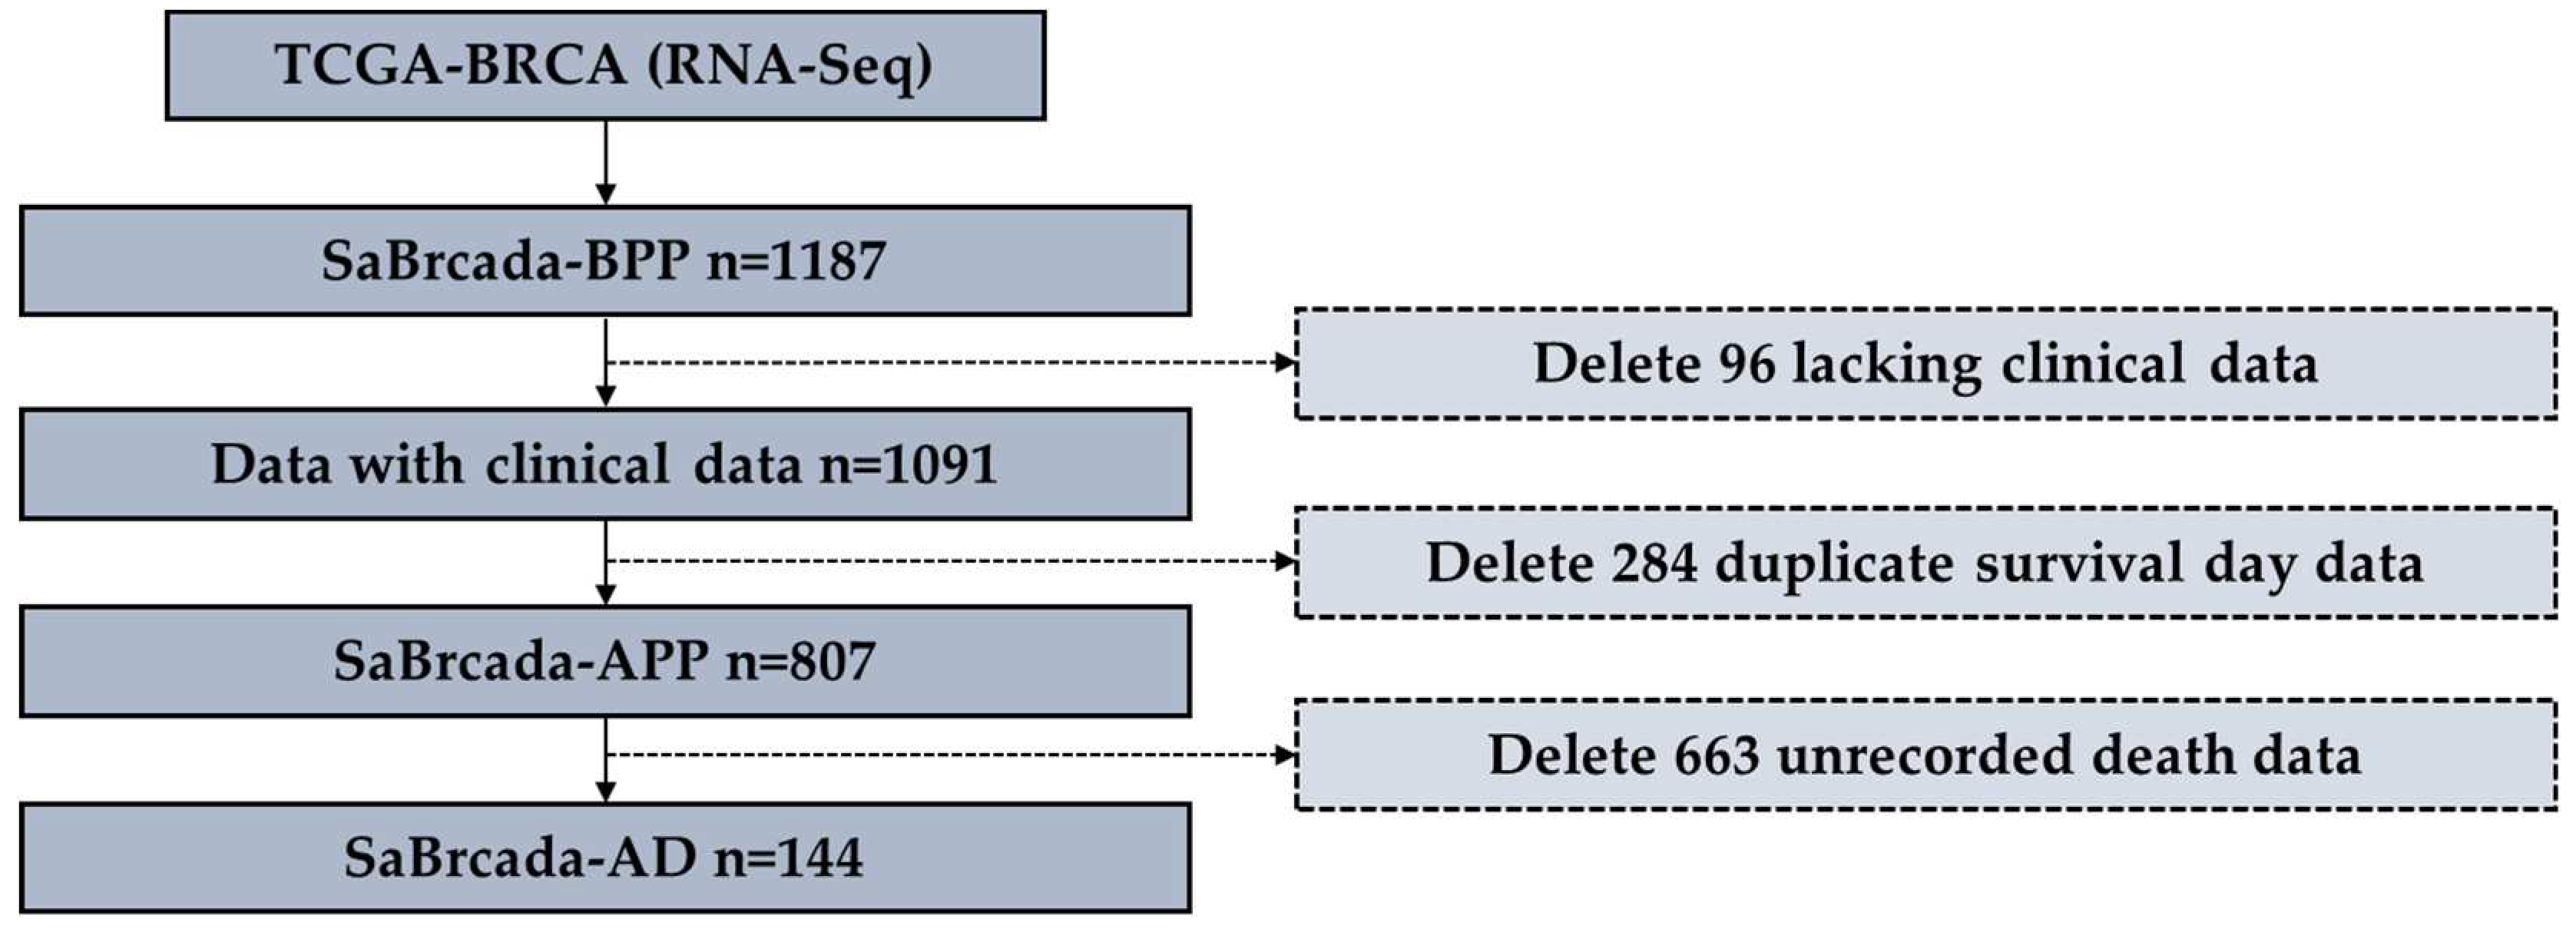
2.2. Data Preprocessing
2.3. Age Stratification
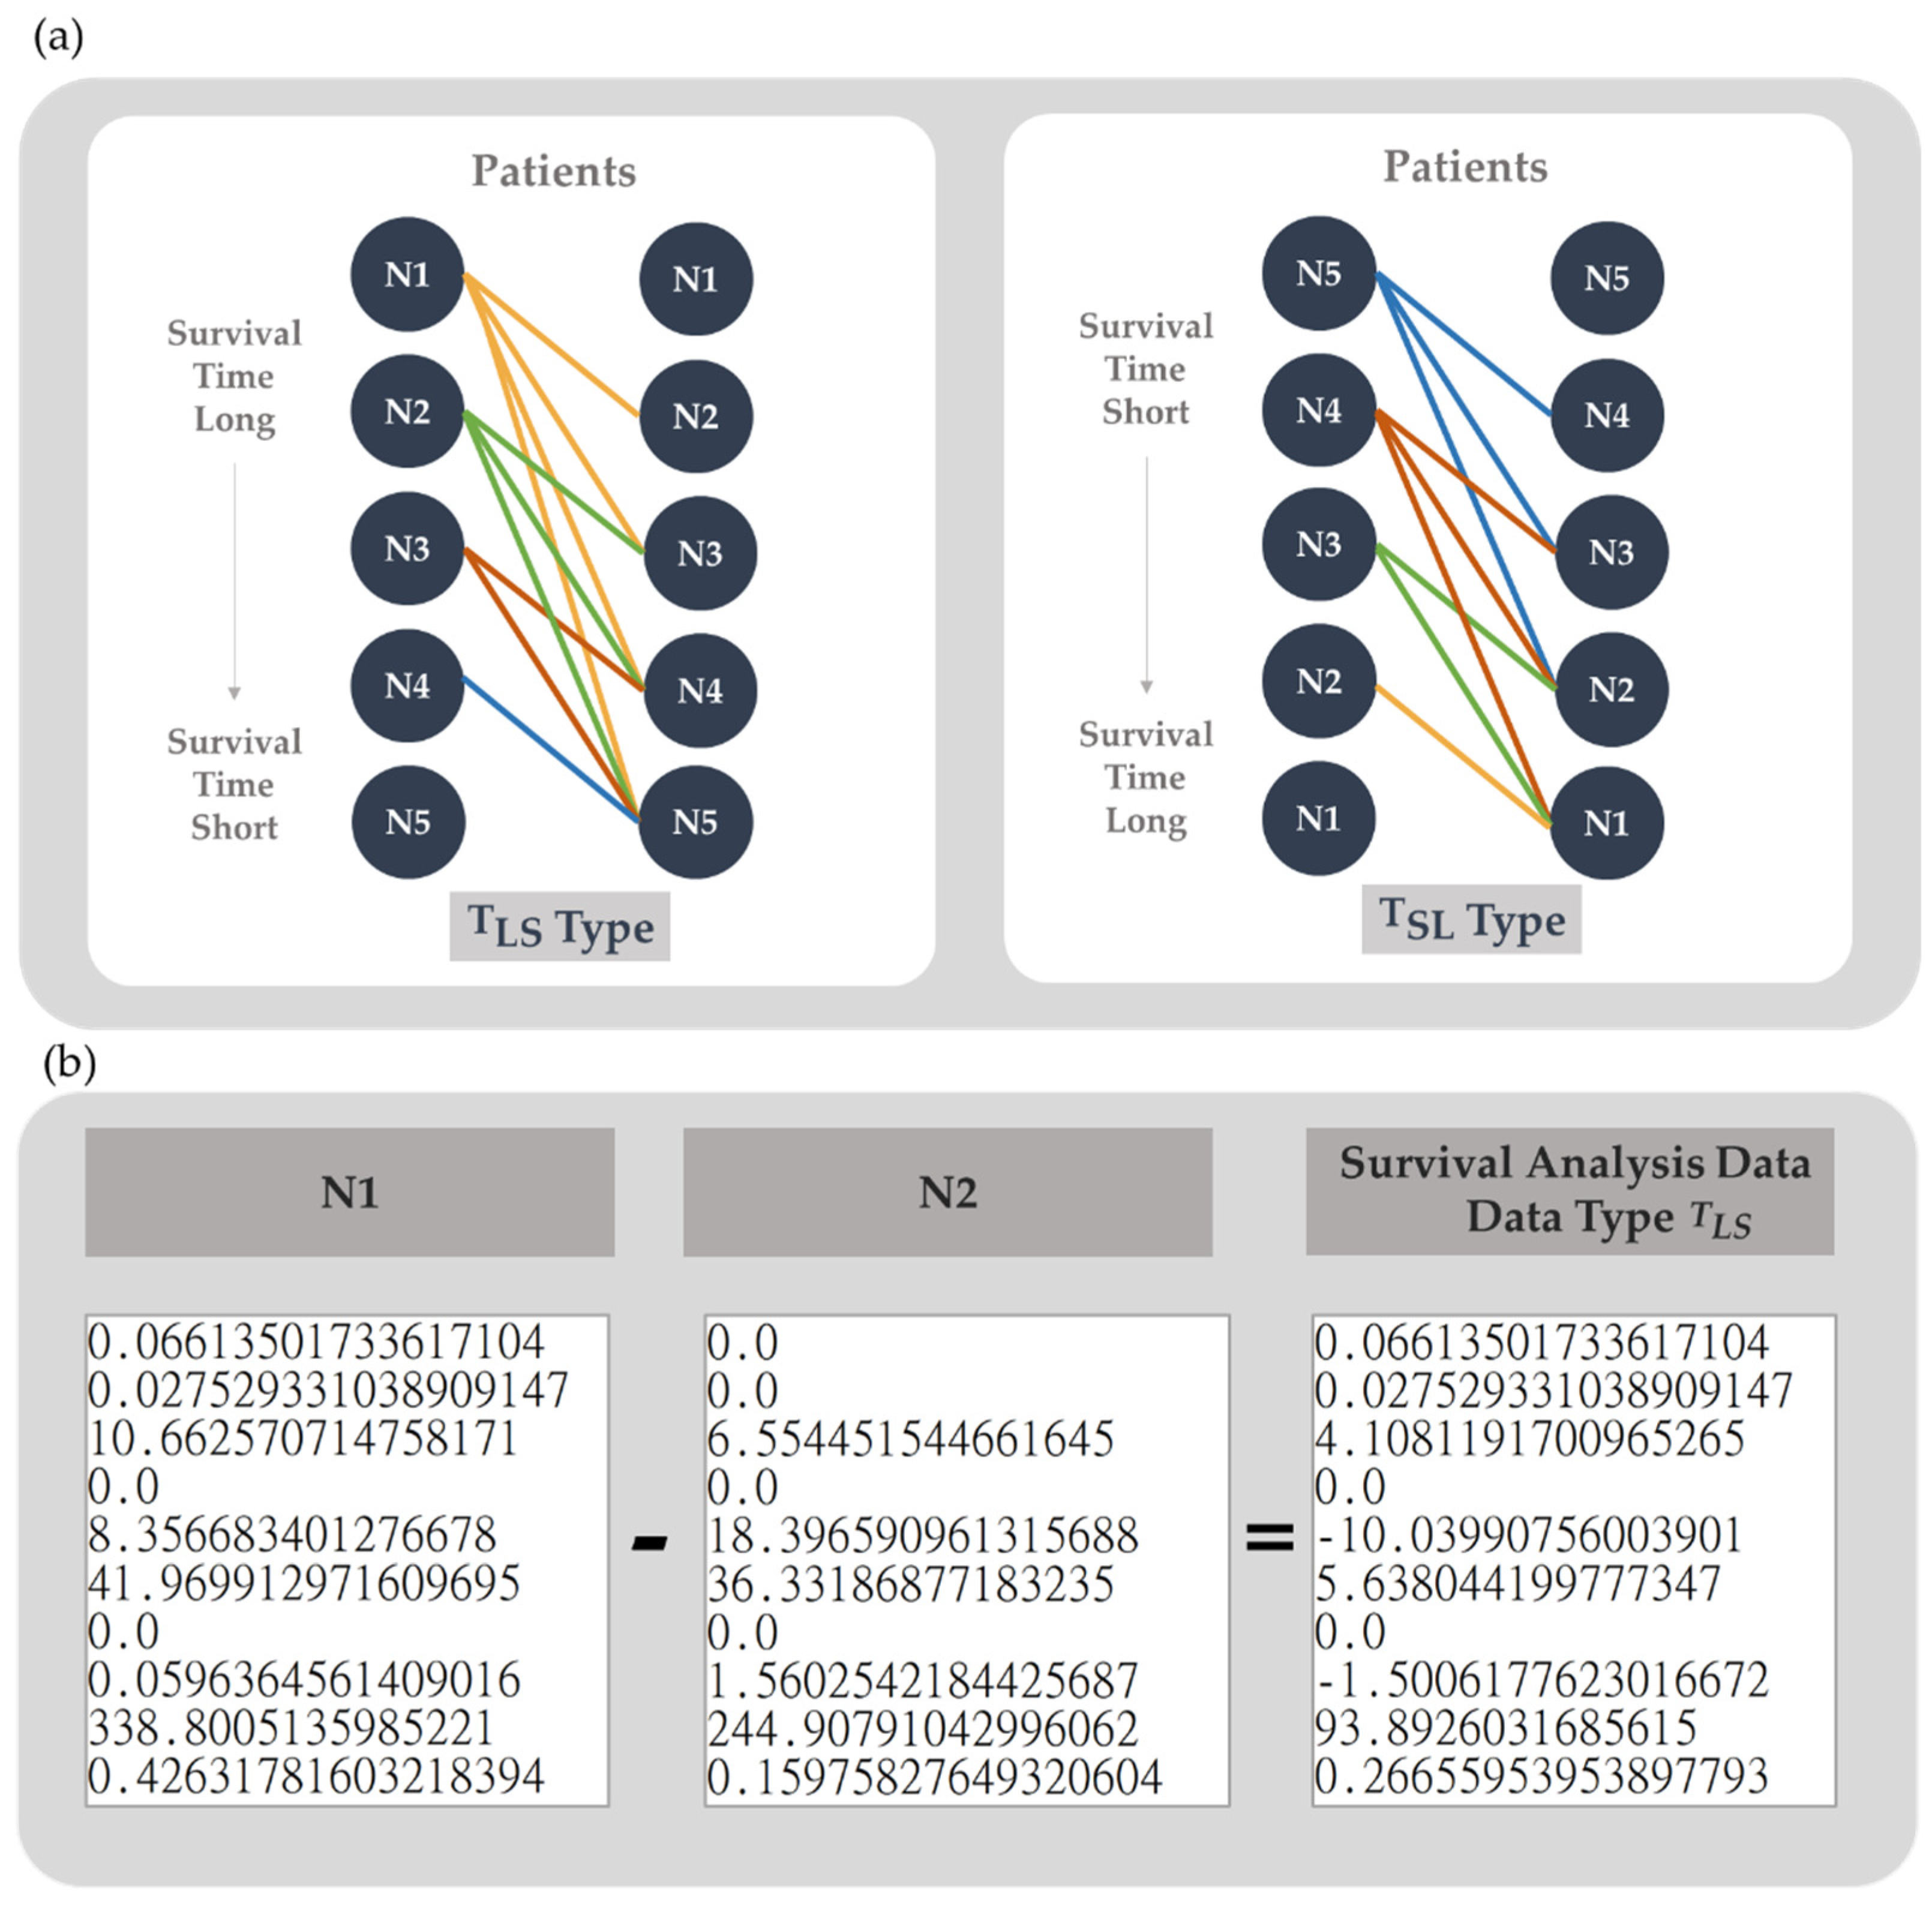
2.4. Data Generation
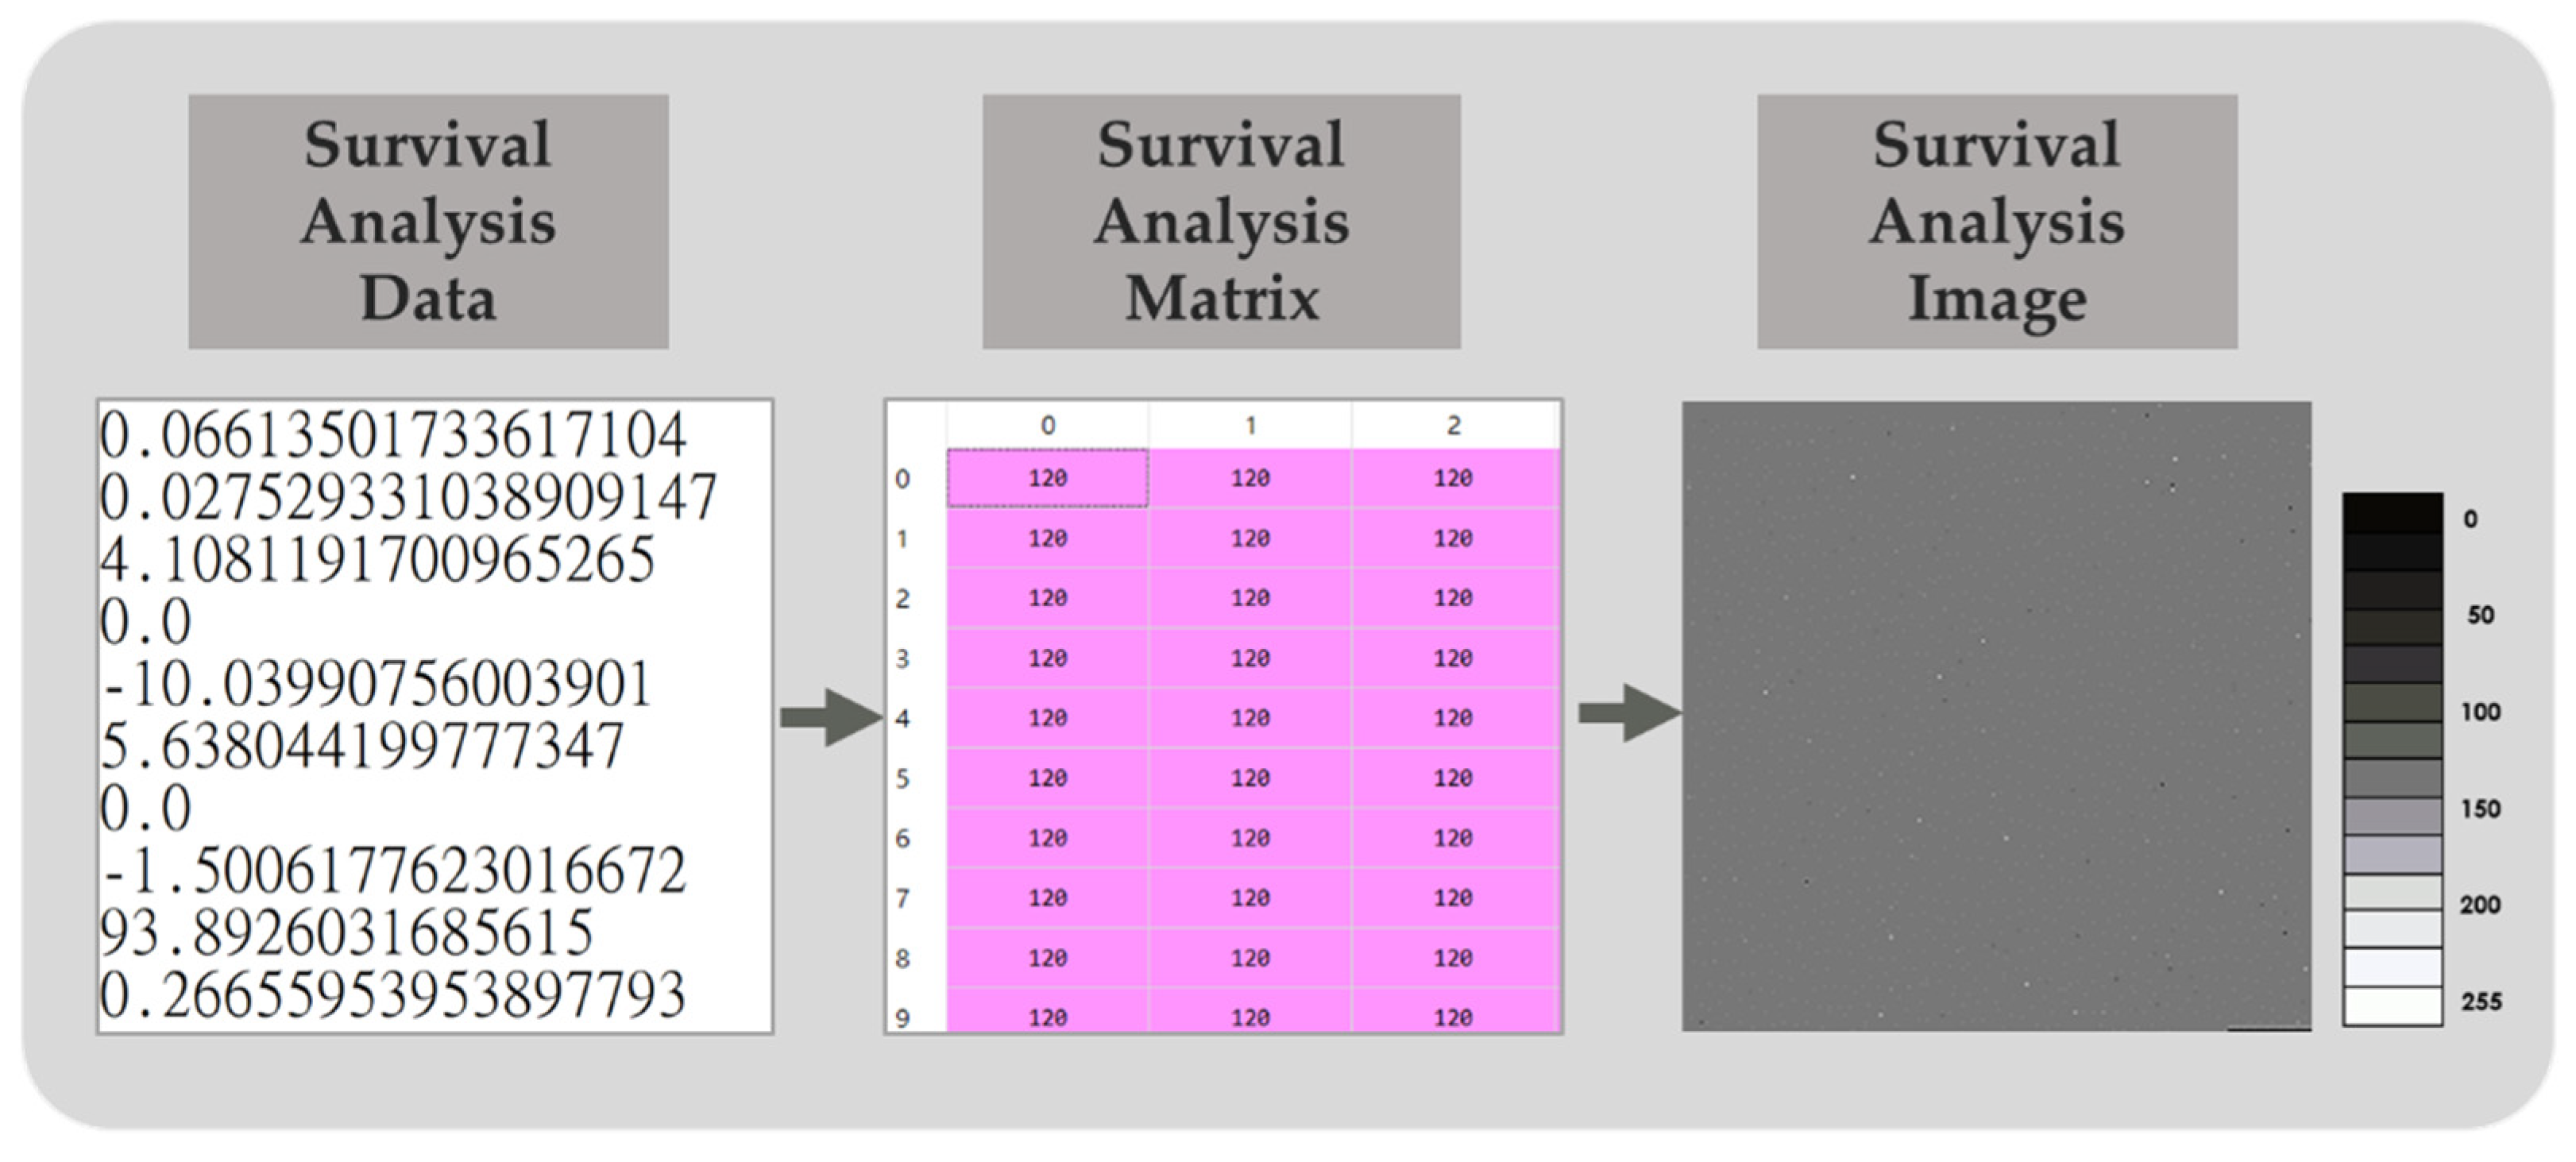
2.5. Data Dimension Augmentation
2.6. Deep Learning
2.7. Assessment of Model Performance
3. Results
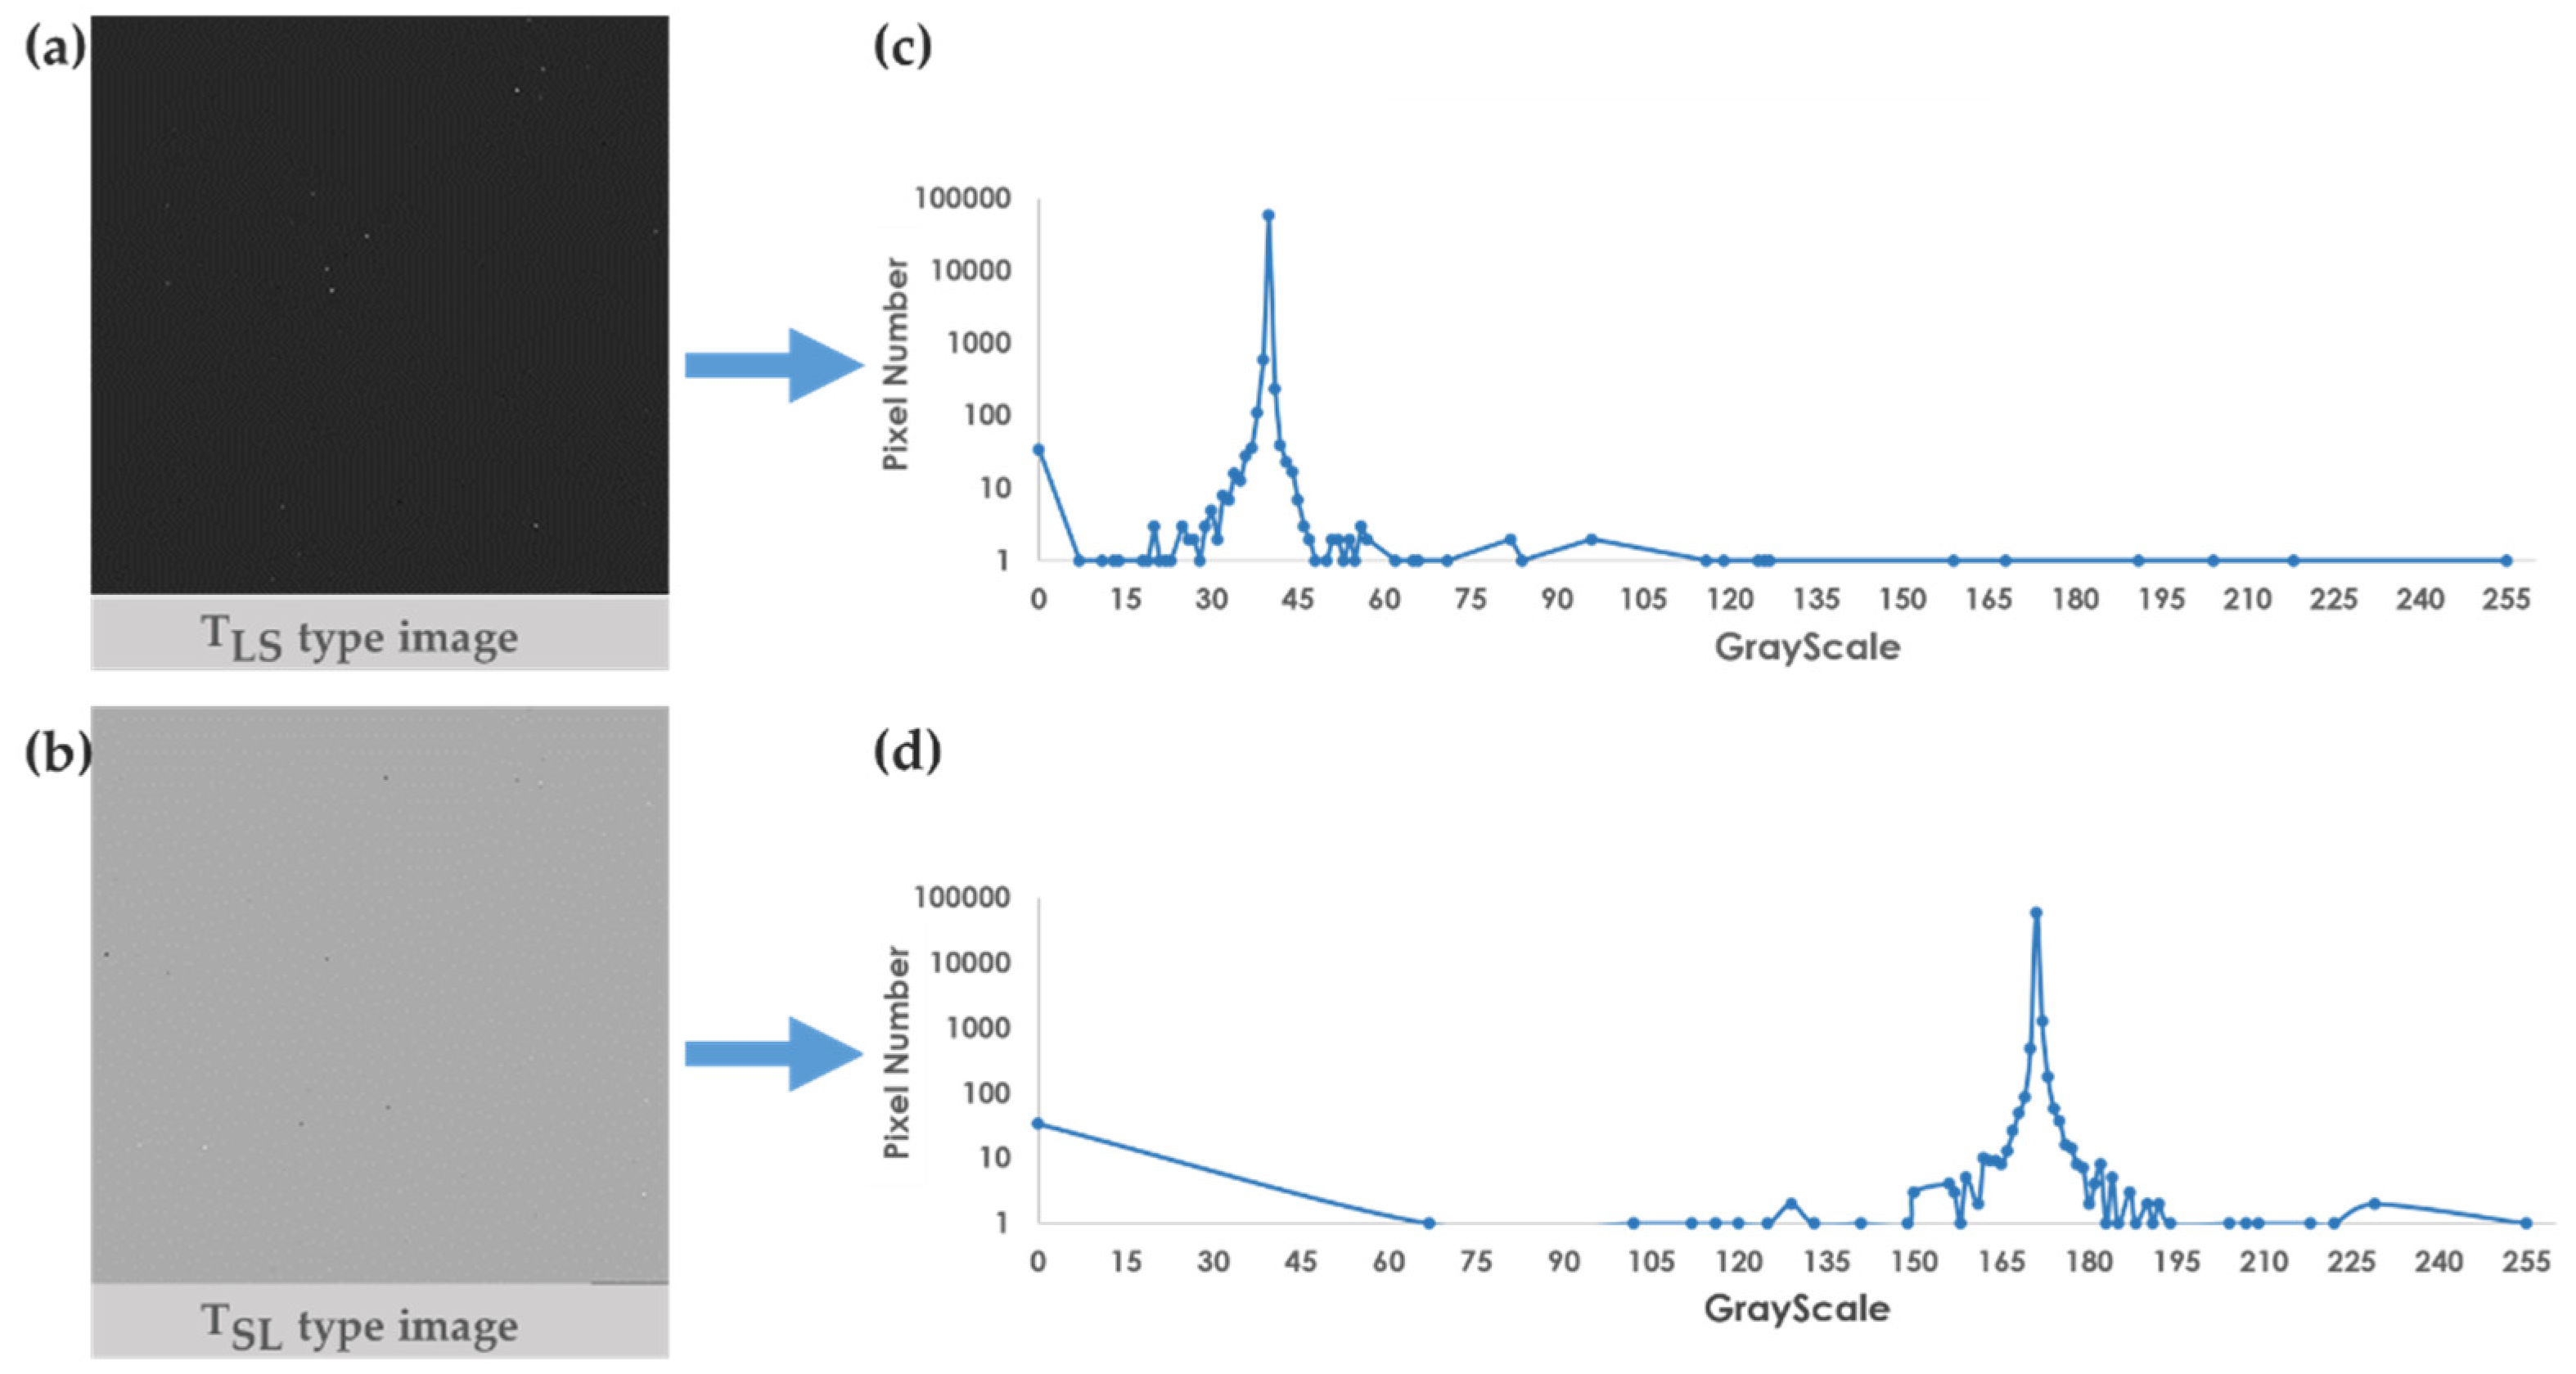
3.1. Survival Analysis Image Applicability Analysis
3.2. Deep Learning Architecture Test
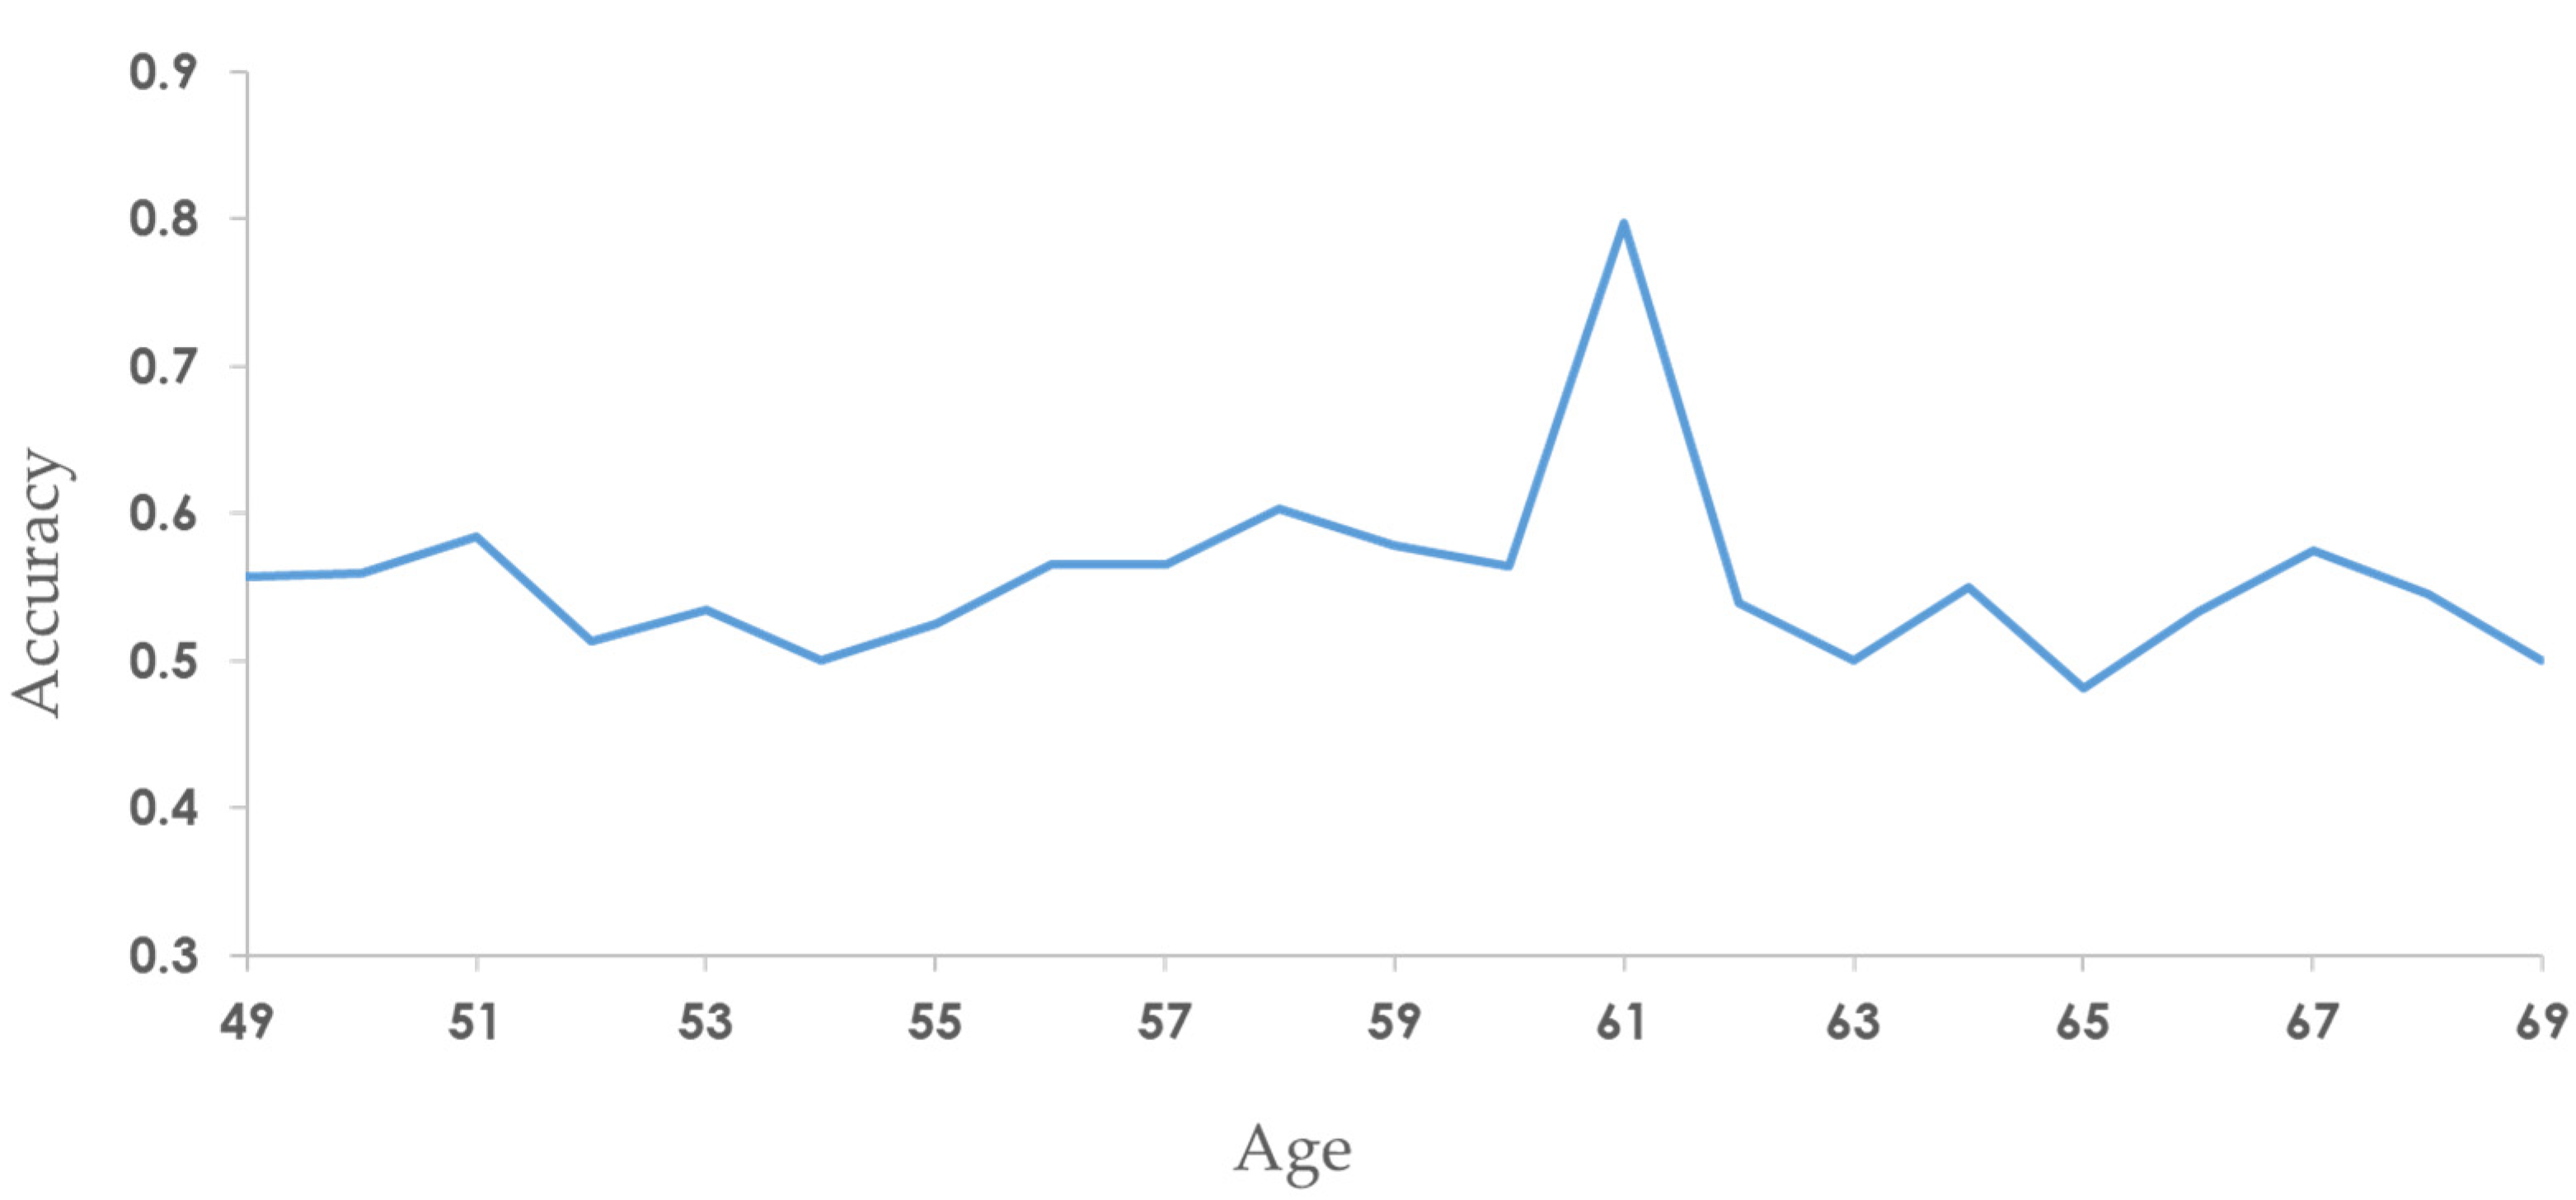
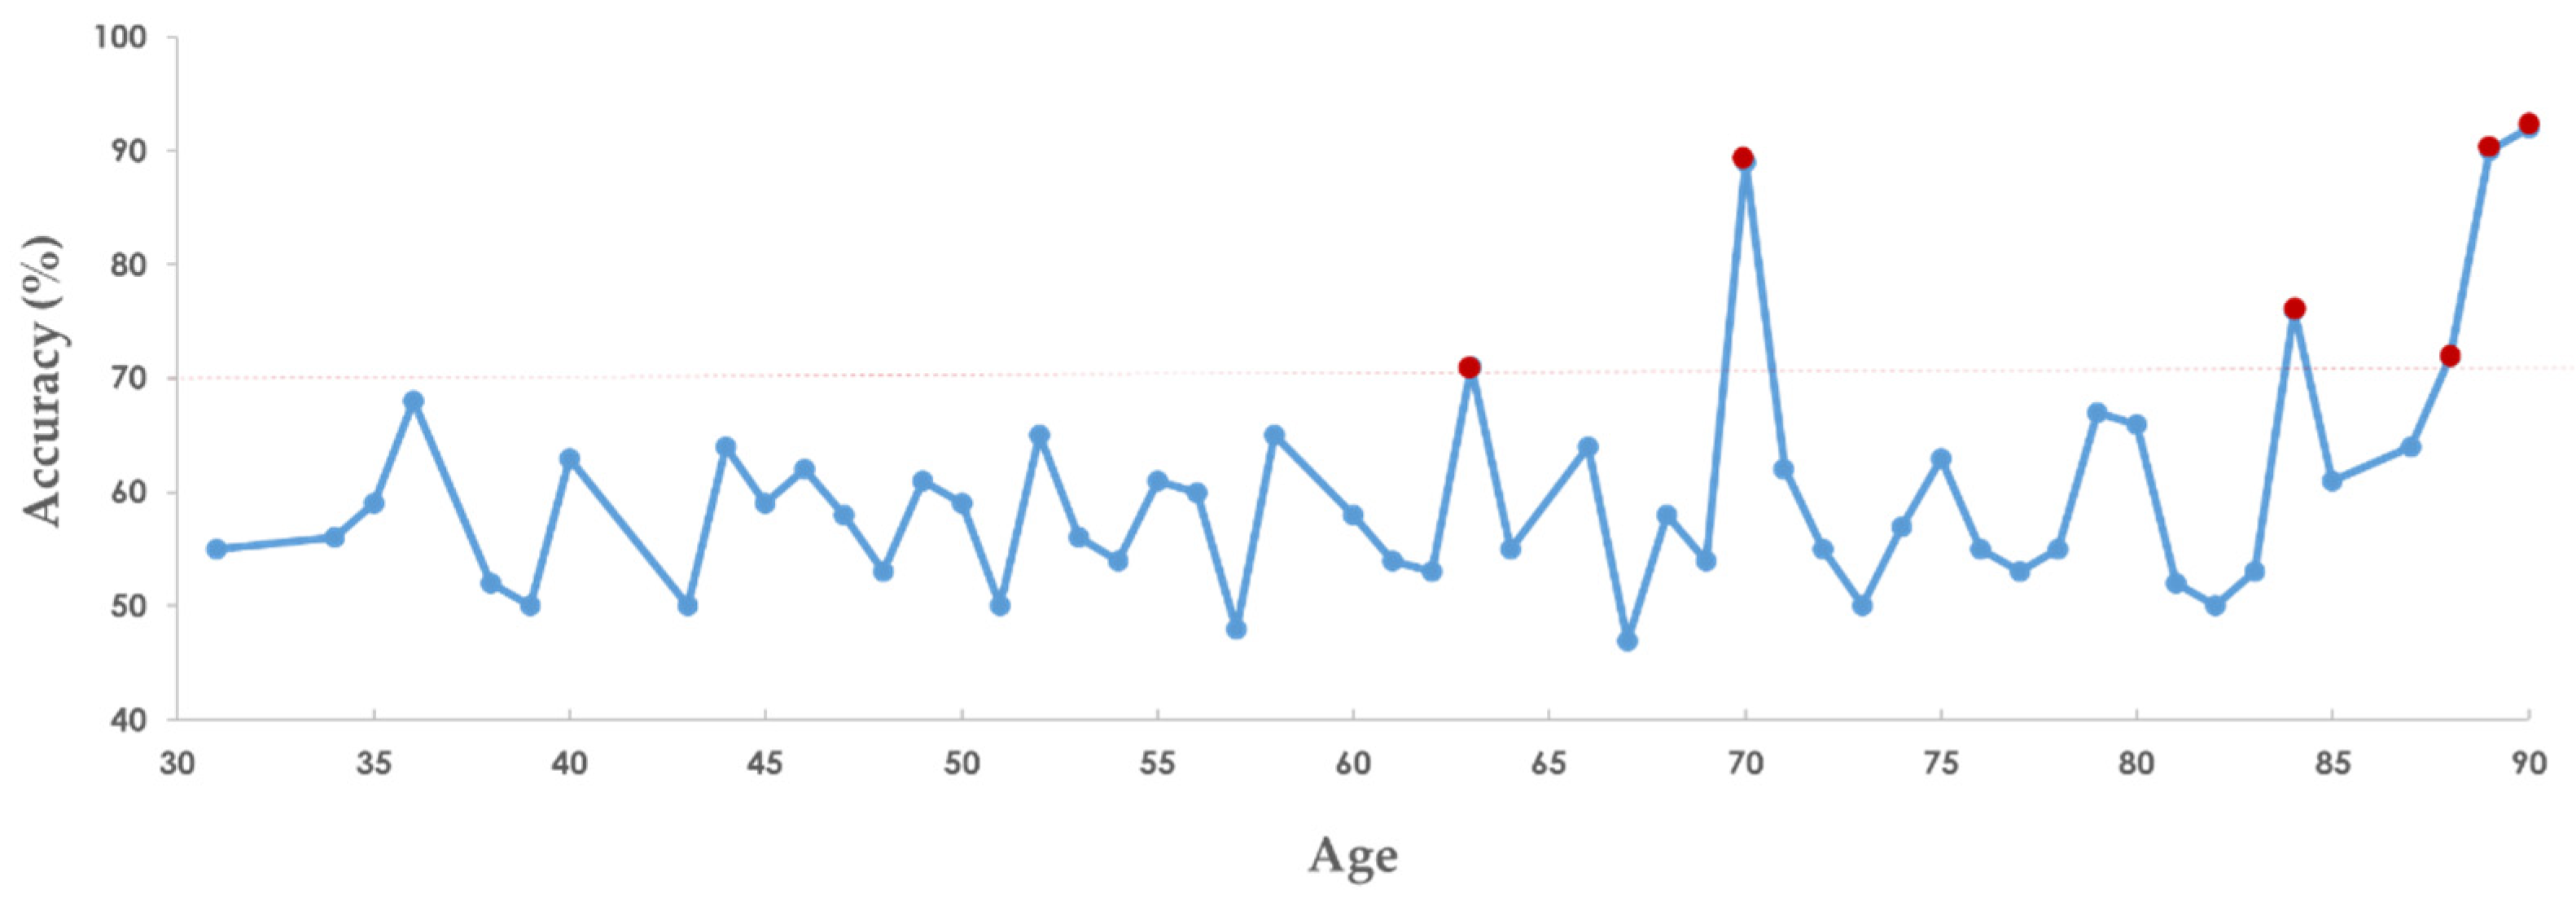
3.3. Stratification by Age
3.4. Comparison of the Previous Studies
3.5. Assessment of Accuracy of SaBrcada
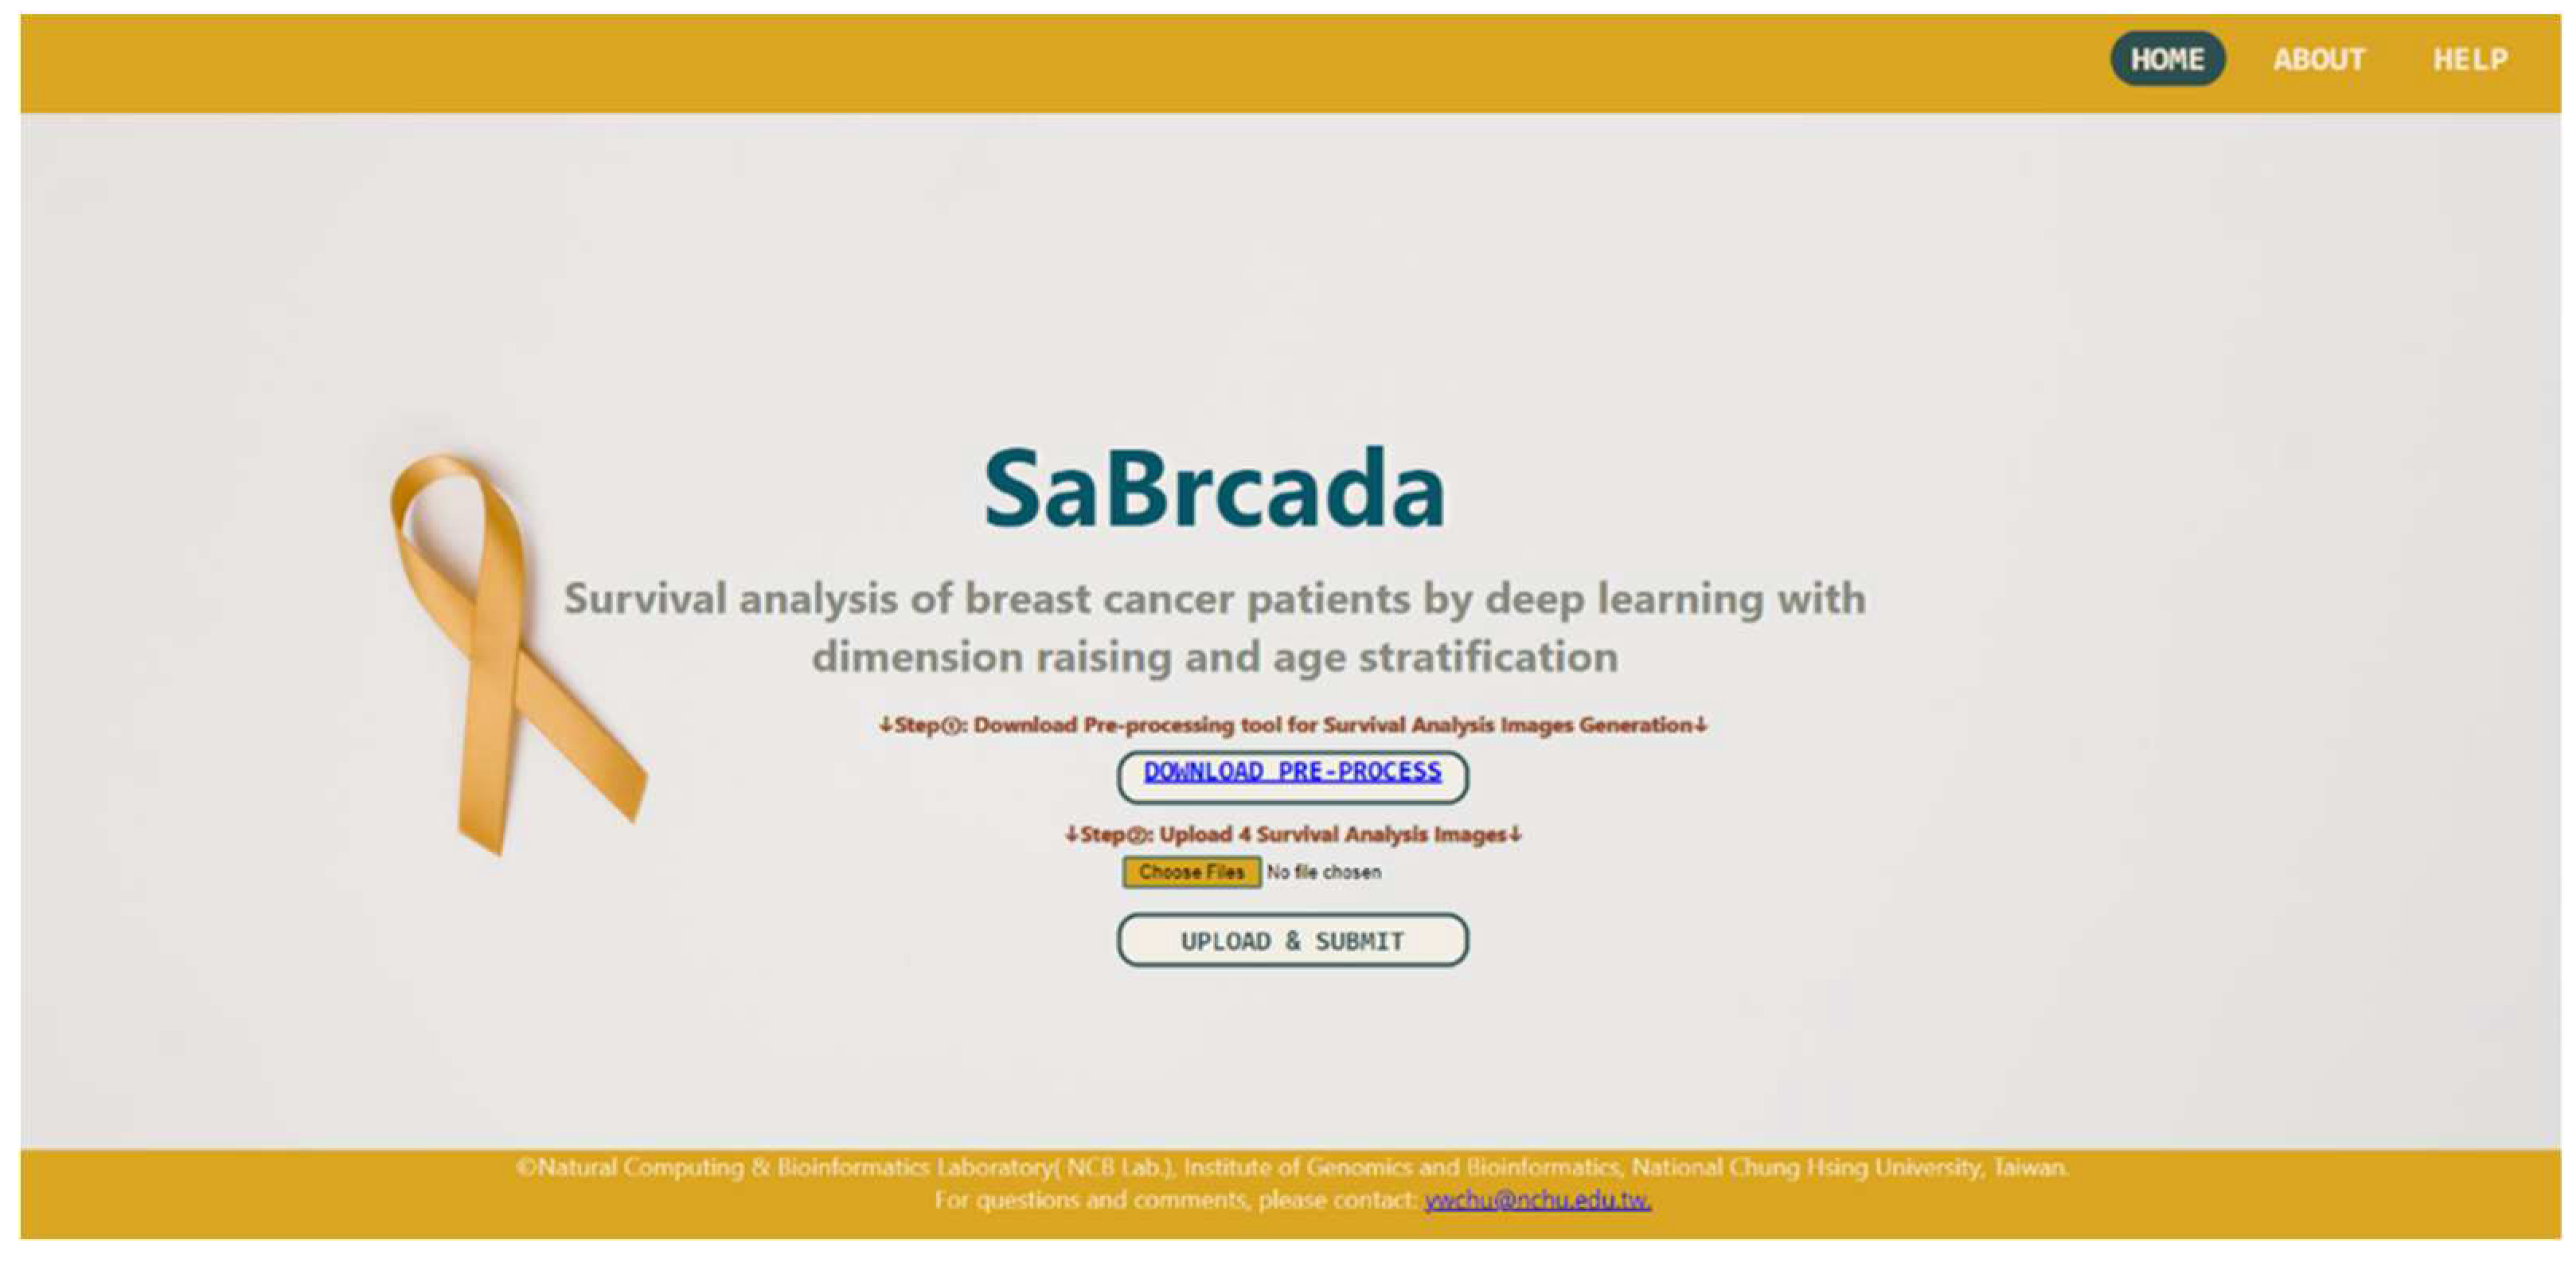
3.6. Website Tools
4. Discussion
4.1. Comparison with Past Research Models
4.2. Advantages of SaBrcada
4.3. Directions for Future Research
5. Conclusions
Author Contributions
Funding
Institutional Review Board Statement
Informed Consent Statement
Data Availability Statement
Acknowledgments
Conflicts of Interest
References
- Nagini, S. Breast Cancer: Current Molecular Therapeutic Targets and New Players. Anticancer Agents Med. Chem. 2017, 17, 152–163. [Google Scholar] [CrossRef]
- Sung, H.; Ferlay, J.; Siegel, R.L.; Laversanne, M.; Soerjomataram, I.; Jemal, A.; Bray, F. Global Cancer Statistics 2020: GLOBOCAN Estimates of Incidence and Mortality Worldwide for 36 Cancers in 185 Countries. CA. Cancer J. Clin. 2021, 71, 209–249. [Google Scholar] [CrossRef] [PubMed]
- Anastasiadi, Z.; Lianos, G.D.; Ignatiadou, E.; Harissis, H.V.; Mitsis, M. Breast Cancer in Young Women: An Overview. Updat. Surg. 2017, 69, 313–317. [Google Scholar] [CrossRef] [PubMed]
- Tao, Z.; Shi, A.; Lu, C.; Song, T.; Zhang, Z.; Zhao, J. Breast Cancer: Epidemiology and Etiology. Cell Biochem. Biophys. 2015, 72, 333–338. [Google Scholar] [CrossRef]
- Morrison, R.S.; Meier, D.E. Clinical Practice. Palliative Care. N. Engl. J. Med. 2004, 350, 2582–2590. [Google Scholar] [CrossRef]
- Shachar, S.S.; Hurria, A.; Muss, H.B. Breast Cancer in Women Older Than 80 Years. J. Oncol. Pract. 2016, 12, 123–132. [Google Scholar] [CrossRef] [PubMed]
- Milanez-Almeida, P.; Martins, A.J.; Germain, R.N.; Tsang, J.S. Cancer Prognosis with Shallow Tumor RNA Sequencing. Nat. Med. 2020, 26, 188–192. [Google Scholar] [CrossRef] [PubMed]
- Cuzick, J.; Swanson, G.P.; Fisher, G.; Brothman, A.R.; Berney, D.M.; Reid, J.E.; Mesher, D.; Speights, V.O.; Stankiewicz, E.; Foster, C.S.; et al. Prognostic Value of an RNA Expression Signature Derived from Cell Cycle Proliferation Genes for Recurrence and Death from Prostate Cancer: A Retrospective Study in Two Cohorts. Lancet Oncol. 2011, 12, 245–255. [Google Scholar] [CrossRef]
- Harrell, F.E.; Lee, K.L.; Mark, D.B. Multivariable Prognostic Models: Issues in Developing Models, Evaluating Assumptions and Adequacy, and Measuring and Reducing Errors. Stat. Med. 1996, 15, 361–387. [Google Scholar] [CrossRef]
- Altman, D.G.; Royston, P. What Do We Mean by Validating a Prognostic Model? Stat. Med. 2000, 19, 453–473. [Google Scholar] [CrossRef]
- Concato, J. Challenges in Prognostic Analysis. Cancer 2001, 91, 1607–1614. [Google Scholar] [CrossRef] [PubMed]
- McShane, L.M.; Altman, D.G.; Sauerbrei, W.; Taube, S.E.; Gion, M.; Clark, G.M. REporting Recommendations for Tumour MARKer Prognostic Studies (REMARK). Br. J. Cancer 2005, 93, 387–391. [Google Scholar] [CrossRef]
- Reilly, B.M.; Evans, A.T. Translating Clinical Research into Clinical Practice: Impact of Using Prediction Rules To Make Decisions. Ann. Intern. Med. 2006, 144, 201–209. [Google Scholar] [CrossRef] [PubMed]
- Royston, P.; Moons, K.G.M.; Altman, D.G.; Vergouwe, Y. Prognosis and Prognostic Research: Developing a Prognostic Model. BMJ 2009, 338, b604. [Google Scholar] [CrossRef]
- Huang, Z.; Zhan, X.; Xiang, S.; Johnson, T.S.; Helm, B.; Yu, C.Y.; Zhang, J.; Salama, P.; Rizkalla, M.; Han, Z.; et al. SALMON: Survival Analysis Learning With Multi-Omics Neural Networks on Breast Cancer. Front. Genet. 2019, 10, 166. [Google Scholar] [CrossRef] [PubMed]
- Kim, S.; Kim, K.; Choe, J.; Lee, I.; Kang, J. Improved Survival Analysis by Learning Shared Genomic Information from Pan-Cancer Data. Bioinforma. Oxf. Engl. 2020, 36, i389–i398. [Google Scholar] [CrossRef]
- Gascard, P.; Bilenky, M.; Sigaroudinia, M.; Zhao, J.; Li, L.; Carles, A.; Delaney, A.; Tam, A.; Kamoh, B.; Cho, S.; et al. Epigenetic and Transcriptional Determinants of the Human Breast. Nat. Commun. 2015, 6, 6351. [Google Scholar] [CrossRef]
- Sun, C.-C.; Li, S.-J.; Hu, W.; Zhang, J.; Zhou, Q.; Liu, C.; Li, L.-L.; Songyang, Y.-Y.; Zhang, F.; Chen, Z.-L.; et al. Comprehensive Analysis of the Expression and Prognosis for E2Fs in Human Breast Cancer. Mol. Ther. 2019, 27, 1153–1165. [Google Scholar] [CrossRef]
- Sanchez-Vega, F.; Mina, M.; Armenia, J.; Chatila, W.K.; Luna, A.; La, K.C.; Dimitriadoy, S.; Liu, D.L.; Kantheti, H.S.; Saghafinia, S.; et al. Oncogenic Signaling Pathways in The Cancer Genome Atlas. Cell 2018, 173, 321–337. [Google Scholar] [CrossRef]
- Cooper, T.A.; Wan, L.; Dreyfuss, G. RNA and Disease. Cell 2009, 136, 777–793. [Google Scholar] [CrossRef]
- Matera, A.G.; Wang, Z. A Day in the Life of the Spliceosome. Nat. Rev. Mol. Cell Biol. 2014, 15, 108–121. [Google Scholar] [CrossRef]
- Bracken, C.P.; Scott, H.S.; Goodall, G.J. A Network-Biology Perspective of MicroRNA Function and Dysfunction in Cancer. Nat. Rev. Genet. 2016, 17, 719–732. [Google Scholar] [CrossRef] [PubMed]
- Wickramasinghe, V.O.; Laskey, R.A. Control of Mammalian Gene Expression by Selective MRNA Export. Nat. Rev. Mol. Cell Biol. 2015, 16, 431–442. [Google Scholar] [CrossRef] [PubMed]
- Venter, J.C.; Adams, M.D.; Myers, E.W.; Li, P.W.; Mural, R.J.; Sutton, G.G.; Smith, H.O.; Yandell, M.; Evans, C.A.; Holt, R.A.; et al. The Sequence of the Human Genome. Science 2001, 291, 1304–1351. [Google Scholar] [CrossRef] [PubMed]
- Phan, J.H.; Quo, C.F.; Cheng, C.; Wang, M.D. Multiscale Integration of -Omic, Imaging, and Clinical Data in Biomedical Informatics. IEEE Rev. Biomed. Eng. 2012, 5, 74–87. [Google Scholar] [CrossRef] [PubMed]
- O’Driscoll, A.; Daugelaite, J.; Sleator, R.D. “Big Data”, Hadoop and Cloud Computing in Genomics. J. Biomed. Inform. 2013, 46, 774–781. [Google Scholar] [CrossRef] [PubMed]
- Gujar, R.; Panwar, B.; Dhanda, S.K. Bioinformatics Drives Discovery in Biomedicine. Bioinformation 2020, 16, 13–16. [Google Scholar] [CrossRef]
- Chaudhary, K.; Poirion, O.B.; Lu, L.; Garmire, L.X. Deep Learning Based Multi-Omics Integration Robustly Predicts Survival in Liver Cancer. Clin. Cancer Res. Off. J. Am. Assoc. Cancer Res. 2018, 24, 1248–1259. [Google Scholar] [CrossRef]
- Ching, T.; Zhu, X.; Garmire, L.X. Cox-Nnet: An Artificial Neural Network Method for Prognosis Prediction of High-Throughput Omics Data. PLoS Comput. Biol. 2018, 14, e1006076. [Google Scholar] [CrossRef]
- Katzman, J.L.; Shaham, U.; Cloninger, A.; Bates, J.; Jiang, T.; Kluger, Y. DeepSurv: Personalized Treatment Recommender System Using a Cox Proportional Hazards Deep Neural Network. BMC Med. Res. Methodol. 2018, 18, 24. [Google Scholar] [CrossRef]
- Cox, D.R.; Oakes, D. Analysis of Survival Data; Chapman and Hall/CRC: Boca Raton, 2017; ISBN 978-1-315-13743-8. [Google Scholar]
- Concato, J. Challenges in Prognostic Analysis. Cancer 2001, 91, 1607–1614. [Google Scholar] [CrossRef] [PubMed]
- Street, W. Breast Cancer Facts & Figures 2017-2018. 44.
- Wagner, G.P.; Kin, K.; Lynch, V.J. Measurement of MRNA Abundance Using RNA-Seq Data: RPKM Measure Is Inconsistent among Samples. Theory Biosci. 2012, 131, 281–285. [Google Scholar] [CrossRef] [PubMed]
- Richelle, A.; Joshi, C.; Lewis, N.E. Assessing Key Decisions for Transcriptomic Data Integration in Biochemical Networks. PLOS Comput. Biol. 2019, 15, e1007185. [Google Scholar] [CrossRef] [PubMed]
- Xu, X.; Zhang, Y.; Zou, L.; Wang, M.; Li, A. A Gene Signature for Breast Cancer Prognosis Using Support Vector Machine. In Proceedings of the 2012 5th International Conference on BioMedical Engineering and Informatics; October 2012; pp. 928–931. [Google Scholar]
- Kim, S.; Kim, K.; Choe, J.; Lee, I.; Kang, J. Improved Survival Analysis by Learning Shared Genomic Information from Pan-Cancer Data. Bioinformatics 2020, 36, i389–i398. [Google Scholar] [CrossRef]
- Tong, L.; Mitchel, J.; Chatlin, K.; Wang, M.D. Deep Learning Based Feature-Level Integration of Multi-Omics Data for Breast Cancer Patients Survival Analysis. BMC Med. Inform. Decis. Mak. 2020, 20, 225. [Google Scholar] [CrossRef]
- Gascard, P.; Bilenky, M.; Sigaroudinia, M.; Zhao, J.; Li, L.; Carles, A.; Delaney, A.; Tam, A.; Kamoh, B.; Cho, S.; et al. Epigenetic and Transcriptional Determinants of the Human Breast. Nat. Commun. 2015, 6, 6351. [Google Scholar] [CrossRef]
- Colak, D.; Nofal, A.; AlBakheet, A.; Nirmal, M.; Jeprel, H.; Eldali, A.; AL-Tweigeri, T.; Tulbah, A.; Ajarim, D.; Malik, O.A.; et al. Age-Specific Gene Expression Signatures for Breast Tumors and Cross-Species Conserved Potential Cancer Progression Markers in Young Women. PLoS ONE 2013, 8, e63204. [Google Scholar] [CrossRef]
| Dataset | No. | Age at index, median (range) | Survival day, median (range) | Race no. (%) (W, BAA, A, AIAN, NR) * |
|---|---|---|---|---|
| SaBrcada-BPPa | 1187 | 58 (26,90) | 912 (-7,8605) | 753 (68%), 182 (16%), 61 (5%), 1 (0.09%), 94 (9%) |
| SaBrcada-APPb | 807 | 57 (26,90) | 1026 (0,8605) | 583 (72%), 141 (17%), 34 (4%), 1 (0.1%), 48 (5%) |
| SaBrcada-ADc | 144 | 58 (25,90) | 1163 (0,7455) | 106 (74%), 30 (21%), 2 (1%), 0 (0%), 6 (4%) |
| SaBrcada-AYT61d | 84 | 46 (25,58) | 1439 (227, 7455) | 51 (74%), 15 (22%), 1 (1%), 0 (0%), 2 (3%) |
| SaBrcada-AOT61e | 60 | 69 (54,90) | 1004 (0,4267) | 55 (73%), 15 (18%), 1 (3%), 0 (0%), 4 (5%) |
| SaBrcada -trainf | 103 | 58 (25,90) | 1032 (0, 7455) | 77 (74%), 19 (18%), 2 (2%), 0 (0%), 5 (7%) |
| SaBrcada -testg | 41 | 58 (27,85) | 1692 (158, 3926) | 29 (71%), 11 (27%), 0 (0%), 0 (0%), 1 (2%) |
| Architecture | Accuracy | Batch Size | Epoch |
|---|---|---|---|
| Resnet18 | 0.50 | 8 | 50 |
| 0.49 | 16 | 100 | |
| 0.50 | 32 | 150 | |
| Resnet50 | 0.50 | 8 | 50 |
| 0.50 | 16 | 100 | |
| 0.50 | 32 | 150 | |
| Resnet101 | 0.50 | 8 | 50 |
| 0.50 | 16 | 100 | |
| 0.50 | 32 | 150 | |
| Resnet152 | 0.50 | 8 | 50 |
| 0.49 | 16 | 100 | |
| 0.50 | 32 | 150 | |
| ResNext101 | 0.50 | 8 | 50 |
| 0.50 | 16 | 100 | |
| 0.50 | 32 | 150 | |
| GoogLeNet* | 0.55 | 8 | 50 |
| 0.50 | 16 | 100 | |
| 0.60 | 32 | 150 | |
| DenseNet121 | 0.55 | 8 | 50 |
| 0.54 | 16 | 100 | |
| 0.54 | 32 | 150 | |
| DenseNet161 | 0.55 | 8 | 50 |
| 0.55 | 16 | 100 | |
| 0.53 | 32 | 150 |
| Model | Number of Cancer | Type of Data | Patient Number | Method | C-index* /Accuracy† |
|---|---|---|---|---|---|
| SaBrcada-APP-M | 1a | mRNA | 807c | GoogLeNet | 0.500† |
| SaBrcada-AD-M | 1a | mRNA | 144c | GoogLeNet | 0.600† |
| SaBrcada-ASYT61-M | 1a | mRNA | 84c | GoogLeNet | 0.500† |
| SaBrcada-ASOT61-M | 1a | mRNA | 60c | GoogLeNet | 0.681† |
| SaBrcada | 1a | mRNA | 144c | GoogLeNet | 0.798† |
| VAECox (2019) | 10b | mRNA | 6127d | VAE, Cox | 0.649* |
| SALMON (2020) | 1a | mRNA, miRNA–target interactions | 626c | Cox | 0.700* |
| ConcatAE (2020) | 1 a | DNA methylation, miRNA | 1060e | ConcatAE | 0.641* |
Disclaimer/Publisher’s Note: The statements, opinions and data contained in all publications are solely those of the individual author(s) and contributor(s) and not of MDPI and/or the editor(s). MDPI and/or the editor(s) disclaim responsibility for any injury to people or property resulting from any ideas, methods, instructions or products referred to in the content. |
© 2023 by the authors. Licensee MDPI, Basel, Switzerland. This article is an open access article distributed under the terms and conditions of the Creative Commons Attribution (CC BY) license (http://creativecommons.org/licenses/by/4.0/).


