Submitted:
26 May 2023
Posted:
29 May 2023
You are already at the latest version
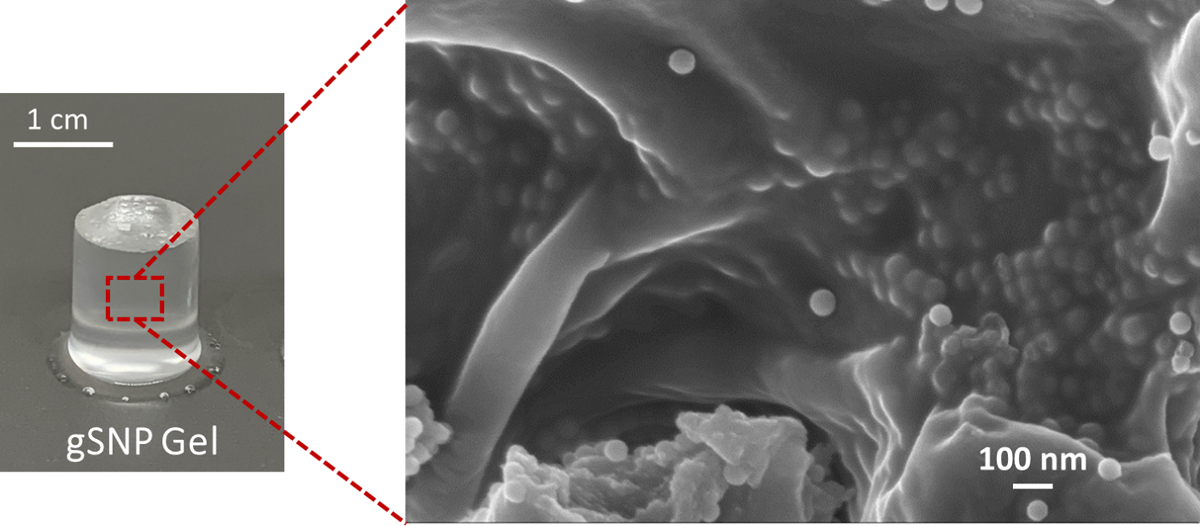
Abstract
Keywords:
1. Introduction
2. Results and discussion
2.1. Amine functionalized silica nanoparticles (ASNPs).
2.2. Polymers grafts on ASNPs
2.3. Nanocomposite polymer grafted silica nanoparticle hydrogels (gSNP Gels)
3. Conclusion
4. Materials and Methods
4.1. Polymer grafted silica nanoparticle hydrogels (gSNP Gels) synthesis.
4.2. Sample nomenclature
Supplementary Materials
Author Contributions
Acknowledgments
References
- Hoffman, A.S. Hydrogels for biomedical applications. Advanced Drug Delivery Reviews 2012, 64, 18–23. [Google Scholar] [CrossRef]
- Zhang, Y.S.; Khademhosseini, A. Advances in engineering hydrogels. Science 2017, 356, eaaf3627. [Google Scholar] [CrossRef] [PubMed]
- Caló, E.; Khutoryanskiy, V.V. Biomedical applications of hydrogels: A review of patents and commercial products. European Polymer Journal 2015, 65, 252–267. [Google Scholar] [CrossRef]
- Tibbitt, M.W.; Anseth, K.S. Hydrogels as extracellular matrix mimics for 3D cell culture. Biotechnology and Bioengineering 2009, 103, 655–663. [Google Scholar] [CrossRef] [PubMed]
- Slaughter, B.V.; Khurshid, S.S.; Fisher, O.Z.; Khademhosseini, A.; Peppas, N.A. Hydrogels in Regenerative Medicine. Advanced Materials 2009, 21, 3307–3329. [Google Scholar] [CrossRef] [PubMed]
- Catoira, M.C.; Fusaro, L.; Di Francesco, D.; Ramella, M.; Boccafoschi, F. Overview of natural hydrogels for regenerative medicine applications. Journal of Materials Science: Materials in Medicine 2019, 30, 115. [Google Scholar] [CrossRef]
- Hoare, T.R.; Kohane, D.S. Hydrogels in drug delivery: Progress and challenges. Polymer 2008, 49, 1993–2007. [Google Scholar] [CrossRef]
- Gong, J.P. Why are double network hydrogels so tough? Soft Matter 2010, 6, 2583–2590. [Google Scholar] [CrossRef]
- Chen, Q.; Chen, H.; Zhu, L.; Zheng, J. Fundamentals of double network hydrogels. Journal of Materials Chemistry B 2015, 3, 3654–3676. [Google Scholar] [CrossRef]
- Gong, J.P.; Katsuyama, Y.; Kurokawa, T.; Osada, Y. Double-Network Hydrogels with Extremely High Mechanical Strength. Advanced Materials 2003, 15, 1155–1158. [Google Scholar] [CrossRef]
- Hart, N.H.; Nimphius, S.; Rantalainen, T.; Ireland, A.; Siafarikas, A.; Newton, R.U. Mechanical basis of bone strength: influence of bone material, bone structure and muscle action. J Musculoskelet Neuronal Interact 2017, 17, 114–139. [Google Scholar]
- Zhu, P.; Hu, M.; Deng, Y.; Wang, C. One-Pot Fabrication of a Novel Agar-Polyacrylamide/Graphene Oxide Nanocomposite Double Network Hydrogel with High Mechanical Properties Advanced Engineering Materials 2016, 18, 1799–1807. 18. [CrossRef]
- Sun, T.L.; Kurokawa, T.; Kuroda, S.; Ihsan, A.B.; Akasaki, T.; Sato, K.; Haque, M.A.; Nakajima, T.; Gong, J.P. Physical hydrogels composed of polyampholytes demonstrate high toughness and viscoelasticity. Nature Materials 2013, 12, 932–937. [Google Scholar] [CrossRef] [PubMed]
- Mohammed, A.A.; Aviles Milan, J.; Li, S.; Chung, J.J.; Stevens, M.M.; Georgiou, T.K.; Jones, J.R. Open vessel free radical photopolymerization of double network gels for biomaterial applications using glucose oxidase. Journal of Materials Chemistry B 2019, 7, 4030–4039. [Google Scholar] [CrossRef]
- Mohammed, A.A.; Merrild, N.G.; Li, S.; Pinna, A.; Jones, J.R. Double-Network Hydrogels Reinforced with Covalently Bonded Silica Nanoparticles via 1-Ethyl-3-(3-dimethylaminopropyl)carbodiimide Chemistry. ACS Omega 2022, 7, 43904–43914. [Google Scholar] [CrossRef]
- Villanueva, M.E.; Diez, A.M.d.R.; González, J.A.; Pérez, C.J.; Orrego, M.; Piehl, L.; Teves, S.; Copello, G.J. Antimicrobial Activity of Starch Hydrogel Incorporated with Copper Nanoparticles. ACS Applied Materials & Interfaces 2016, 8, 16280–16288. [Google Scholar] [CrossRef]
- Chang, C.-W.; van Spreeuwel, A.; Zhang, C.; Varghese, S. PEG/clay nanocomposite hydrogel: a mechanically robust tissue engineering scaffold. Soft Matter 2010, 6, 5157–5164. [Google Scholar] [CrossRef]
- Mohammed, A.A.; Miao, J.; Ragaisyte, I.; Porter, A.E.; Myant, C.W.; Pinna, A. 3D printed superparamagnetic stimuli-responsive starfish-shaped hydrogels. Heliyon 2023, 9, e14682. [Google Scholar] [CrossRef]
- Mohammed, A.A.; Pinna, A.; Li, S.; Sang, T.; Jones, J.R. Auto-catalytic redox polymerisation using nanoceria and glucose oxidase for double network hydrogels. Journal of Materials Chemistry B 2020, 8, 2834–2844. [Google Scholar] [CrossRef]
- Zhou, C.; Wu, Q.; Yue, Y.; Zhang, Q. Application of rod-shaped cellulose nanocrystals in polyacrylamide hydrogels. Journal of Colloid and Interface Science 2011, 353, 116–123. [Google Scholar] [CrossRef]
- Abitbol, T.; Johnstone, T.; Quinn, T.M.; Gray, D.G. Reinforcement with cellulose nanocrystals of poly(vinyl alcohol) hydrogels prepared by cyclic freezing and thawing. Soft Matter 2011, 7, 2373–2379. [Google Scholar] [CrossRef]
- Kalossaka, L.M.; Mohammed, A.A.; Sena, G.; Barter, L.; Myant, C. 3D printing nanocomposite hydrogels with lattice vascular networks using stereolithography. Journal of Materials Research 2021, 36, 4249–4261. [Google Scholar] [CrossRef]
- Motealleh, A.; Dorri, P.; Schäfer, A.H.; Kehr, N.S. 3D bioprinting of triphasic nanocomposite hydrogels and scaffolds for cell adhesion and migration. Biofabrication 2019, 11, 035022. [Google Scholar] [CrossRef] [PubMed]
- Deng, Z.; Hu, T.; Lei, Q.; He, J.; Ma, P.X.; Guo, B. Stimuli-Responsive Conductive Nanocomposite Hydrogels with High Stretchability, Self-Healing, Adhesiveness, and 3D Printability for Human Motion Sensing. ACS Applied Materials & Interfaces 2019, 11, 6796–6808. [Google Scholar] [CrossRef]
- Pinna, A.; Torki Baghbaderani, M.; Vigil Hernández, V.; Naruphontjirakul, P.; Li, S.; McFarlane, T.; Hachim, D.; Stevens, M.M.; Porter, A.E.; Jones, J.R. Nanoceria provides antioxidant and osteogenic properties to mesoporous silica nanoparticles for osteoporosis treatment. Acta Biomaterialia 2021, 122, 365–376. [Google Scholar] [CrossRef]
- Pinna, A.; Cali, E.; Kerherve, G.; Galleri, G.; Maggini, M.; Innocenzi, P.; Malfatti, L. Fulleropyrrolidine-functionalized ceria nanoparticles as a tethered dual nanosystem with improved antioxidant properties. Nanoscale Advances 2020, 2, 2387–2396. [Google Scholar] [CrossRef] [PubMed]
- Pinna, A.; Lasio, B.; Piccinini, M.; Marmiroli, B.; Amenitsch, H.; Falcaro, P.; Tokudome, Y.; Malfatti, L.; Innocenzi, P. Combining Top-Down and Bottom-Up Routes for Fabrication of Mesoporous Titania Films Containing Ceria Nanoparticles for Free Radical Scavenging. ACS Applied Materials & Interfaces 2013, 5, 3168–3175. [Google Scholar] [CrossRef]
- Barrioni, B.R.; de Carvalho, S.M.; Naruphontjirakul, P.; Norris, E.; Kelly, N.L.; Hanna, J.V.; Jones, J.R.; Pereira, M.d.M. Cobalt-containing spherical glass nanoparticles for therapeutic ion release. Journal of the American Ceramic Society 2022, 105, 1765–1777. [Google Scholar] [CrossRef]
- Labbaf, S.; Tsigkou, O.; Müller, K.H.; Stevens, M.M.; Porter, A.E.; Jones, J.R. Spherical bioactive glass particles and their interaction with human mesenchymal stem cells in vitro. Biomaterials 2011, 32, 1010–1018. [Google Scholar] [CrossRef]
- Chen, S.; Greasley, S.L.; Ong, Z.Y.; Naruphontjirakul, P.; Page, S.J.; Hanna, J.V.; Redpath, A.N.; Tsigkou, O.; Rankin, S.; Ryan, M.P.; et al. Biodegradable zinc-containing mesoporous silica nanoparticles for cancer therapy. Materials Today Advances 2020, 6, 100066. [Google Scholar] [CrossRef]
- Kim, Y.; Yuk, H.; Zhao, R.; Chester, S.A.; Zhao, X. Printing ferromagnetic domains for untethered fast-transforming soft materials. Nature 2018, 558, 274–279. [Google Scholar] [CrossRef]
- Vashist, A.; Kaushik, A.; Ghosal, A.; Bala, J.; Nikkhah-Moshaie, R.; A Wani, W.; Manickam, P.; Nair, M. Nanocomposite Hydrogels: Advances in Nanofillers Used for Nanomedicine. Gels 2018, 4, 75. [Google Scholar] [CrossRef] [PubMed]
- Esmaeely Neisiany, R.; Enayati, M.S.; Sajkiewicz, P.; Pahlevanneshan, Z.; Ramakrishna, S. Insight Into the Current Directions in Functionalized Nanocomposite Hydrogels. Frontiers in Materials 2020, 7. [Google Scholar] [CrossRef]
- Haraguchi, K. Nanocomposite hydrogels. Current Opinion in Solid State and Materials Science 2007, 11, 47–54. [Google Scholar] [CrossRef]
- Rafieian, S.; Mirzadeh, H.; Mahdavi, H.; Masoumi, M.E. A review on nanocomposite hydrogels and their biomedical applications. Science and Engineering of Composite Materials 2019, 26, 154–174. [Google Scholar] [CrossRef]
- Zhao, H.; Liu, M.; Zhang, Y.; Yin, J.; Pei, R. Nanocomposite hydrogels for tissue engineering applications. Nanoscale 2020, 12, 14976–14995. [Google Scholar] [CrossRef]
- Kim, S.; Kim, E.; Kim, S.; Kim, W. Surface modification of silica nanoparticles by UV-induced graft polymerization of methyl methacrylate. Journal of Colloid and Interface Science 2005, 292, 93–98. [Google Scholar] [CrossRef]
- von Werne, T.; Patten, T.E. Preparation of Structurally Well-Defined Polymer−Nanoparticle Hybrids with Controlled/Living Radical Polymerizations. Journal of the American Chemical Society 1999, 121, 7409–7410. [Google Scholar] [CrossRef]
- El Harrak, A.; Carrot, G.; Oberdisse, J.; Jestin, J.; Boué, F. Atom transfer radical polymerization from silica nanoparticles using the ‘grafting from’ method and structural study via small-angle neutron scattering. Polymer 2005, 46, 1095–1104. [Google Scholar] [CrossRef]
- Wu, T.; Zhang, Y.; Wang, X.; Liu, S. Fabrication of Hybrid Silica Nanoparticles Densely Grafted with Thermoresponsive Poly(N-isopropylacrylamide) Brushes of Controlled Thickness via Surface-Initiated Atom Transfer Radical Polymerization. Chemistry of Materials 2008, 20, 101–109. [Google Scholar] [CrossRef]
- Salarizadeh, P.; Abdollahi, M.; Javanbakht, M. Modification of silica nanoparticles with hydrophilic sulfonated polymers by using surface-initiated redox polymerization. Iranian Polymer Journal 2012, 21, 661–668. [Google Scholar] [CrossRef]
- Chapman, R.; Gormley, A.J.; Herpoldt, K.-L.; Stevens, M.M. Highly Controlled Open Vessel RAFT Polymerizations by Enzyme Degassing. Macromolecules 2014, 47, 8541–8547. [Google Scholar] [CrossRef]
- Zoldák, G.; Zubrik, A.; Musatov, A.; Stupák, M.; Sedlák, E. Irreversible Thermal Denaturation of Glucose Oxidase from Aspergillus niger Is the Transition to the Denatured State with Residual Structure*. Journal of Biological Chemistry 2004, 279, 47601–47609. [Google Scholar] [CrossRef] [PubMed]
- Anjum Zia, M.; Khalil Ur, R.; M, K.S.; Andaleeb, F.; M, I.R.; M, A.S.; I, A.K.; A, I.K. Thermal Characterization of Purified Glucose Oxidase from A Newly Isolated Aspergillus Niger UAF-1. J Clin Biochem Nutr 2007, 41, 132–138. [Google Scholar] [CrossRef] [PubMed]
- Gupta, K.C.; Sahoo, S.; Khandekar, K. Graft copolymerization of ethyl acrylate onto cellulose using ceric ammonium nitrate as initiator in aqueous medium. Biomacromolecules 2002, 3, 1087–1094. [Google Scholar] [CrossRef]
- Lu, H.-T. Synthesis and characterization of amino-functionalized silica nanoparticles. Colloid Journal 2013, 75, 311–318. [Google Scholar] [CrossRef]
- Gormley, A.J.; Chapman, R.; Stevens, M.M. Polymerization Amplified Detection for Nanoparticle-Based Biosensing. Nano Letters 2014, 14, 6368–6373. [Google Scholar] [CrossRef]
- Mohammed, A. Double network hydrogels for cartilage repair and their nanocomposite structure. 2017. [CrossRef]
- Berron, B.J.; Johnson, L.M.; Ba, X.; McCall, J.D.; Alvey, N.J.; Anseth, K.S.; Bowman, C.N. Glucose Oxidase-Mediated Polymerization as a Platform for Dual-Mode Signal Amplification and Biodetection. Biotechnology and Bioengineering 2011, 108, 1521–1528. [Google Scholar] [CrossRef] [PubMed]
- Zhang, J.; Xie, X.; Li, C.; Wang, H.; Wang, L. The role of soft colloidal templates in the shape evolution of flower-like MgAl-LDH hierarchical microstructures. RSC Advances 2015, 5, 29757–29765. [Google Scholar] [CrossRef]
- Gu, Z.; Huang, K.; Luo, Y.; Zhang, L.; Kuang, T.; Chen, Z.; Liao, G. Double network hydrogel for tissue engineering. WIREs Nanomedicine and Nanobiotechnology 2018, 10, e1520. [Google Scholar] [CrossRef]
- Stammen, J.A.; Williams, S.; Ku, D.N.; Guldberg, R.E. Mechanical properties of a novel PVA hydrogel in shear and unconfined compression. Biomaterials 2001, 22, 799–806. [Google Scholar] [CrossRef]
- Oka, M.; Ushio, K.; Kumar, P.; Ikeuchi, K.; Hyon, S.H.; Nakamura, T.; Fujita, H. Development of artificial articular cartilage. Proceedings of the Institution of Mechanical Engineers, Part H: Journal of Engineering in Medicine 2000, 214, 59–68. [Google Scholar] [CrossRef] [PubMed]
- Wang, Q.; Hou, R.; Cheng, Y.; Fu, J. Super-tough double-network hydrogels reinforced by covalently compositing with silica-nanoparticles. Soft Matter 2012, 8, 6048–6056. [Google Scholar] [CrossRef]
- Xu, B.; Li, H.; Wang, Y.; Zhang, G.; Zhang, Q. Nanocomposite hydrogels with high strength cross-linked by titania. RSC Advances 2013, 3, 7233–7236. [Google Scholar] [CrossRef]
- Yang, J.; Han, C.-R.; Duan, J.-F.; Ma, M.-G.; Zhang, X.-M.; Xu, F.; Sun, R.-C.; Xie, X.-M. Studies on the properties and formation mechanism of flexible nanocomposite hydrogels from cellulose nanocrystals and poly(acrylic acid). Journal of Materials Chemistry 2012, 22, 22467–22480. [Google Scholar] [CrossRef]

| Control Gel (no ASNPs/ GOx) | gSNP gel | |
|---|---|---|
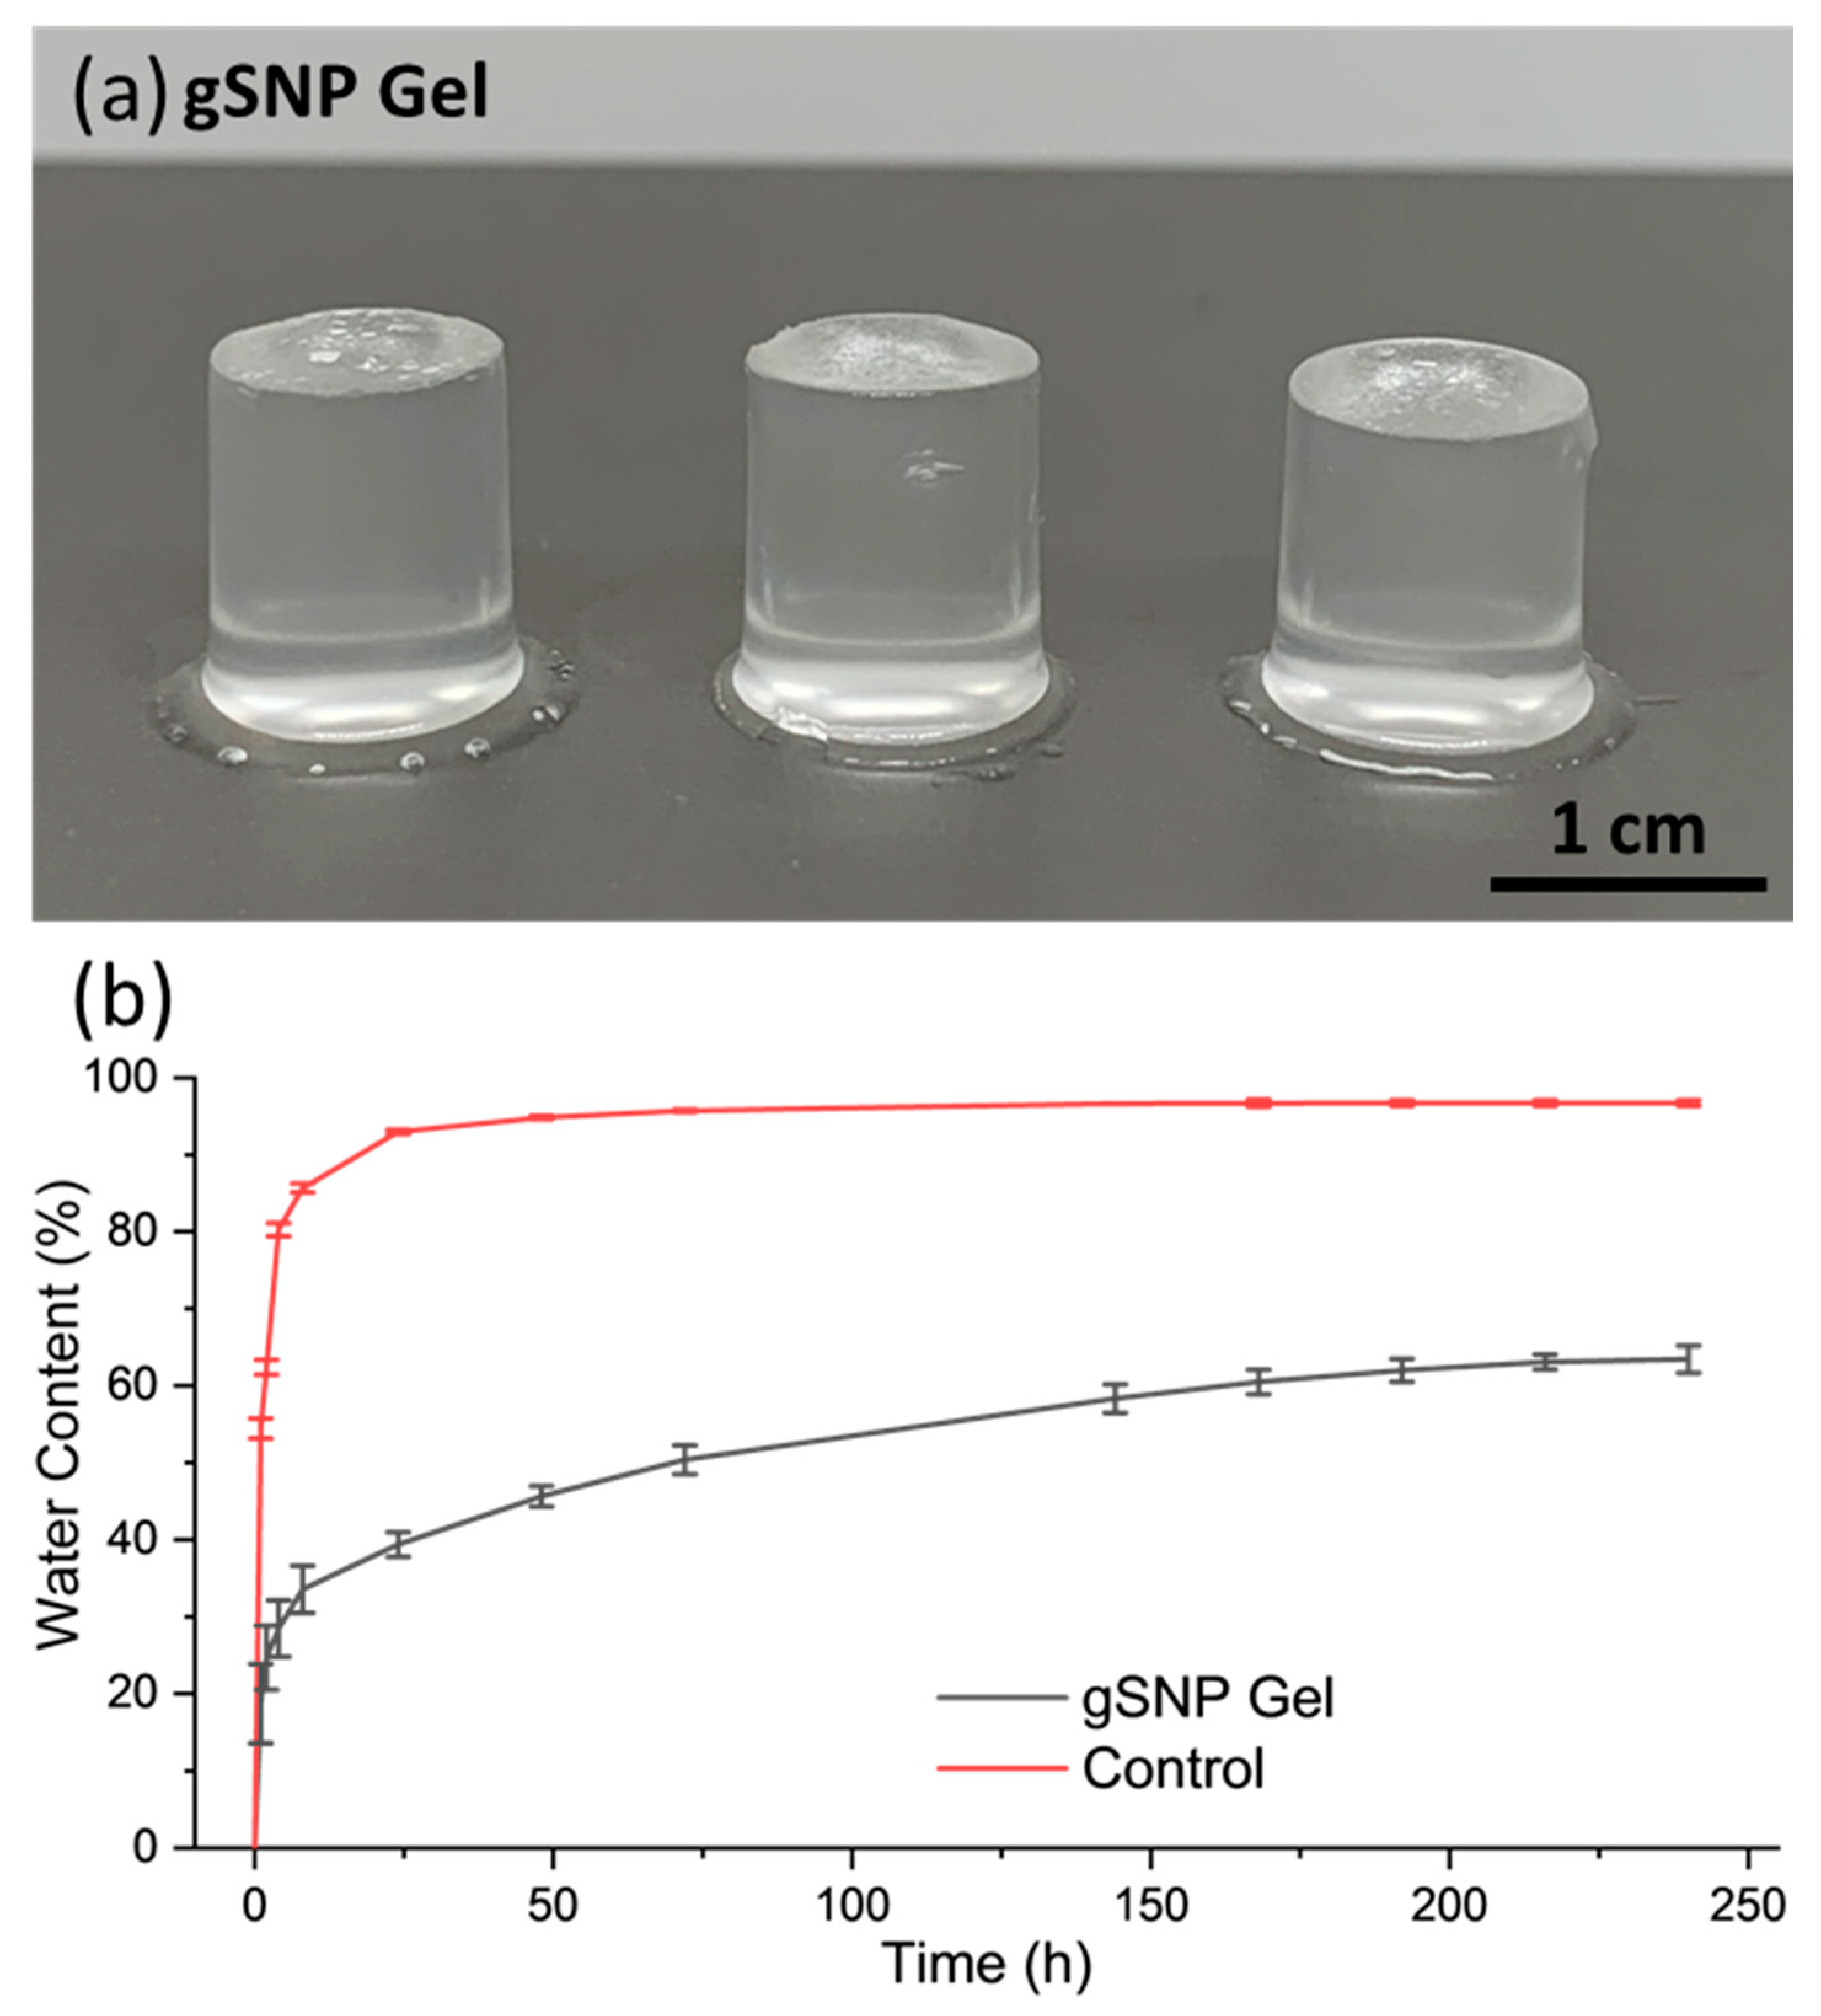
| Water Content (%) | 96.7 % ± 0.4 | 63.4 % ± 1.8 |
| Swelling (%) | 2757 % ± 157 | 274 % ± 9 |
| Control Gel | gSNP Gel | |
|---|---|---|
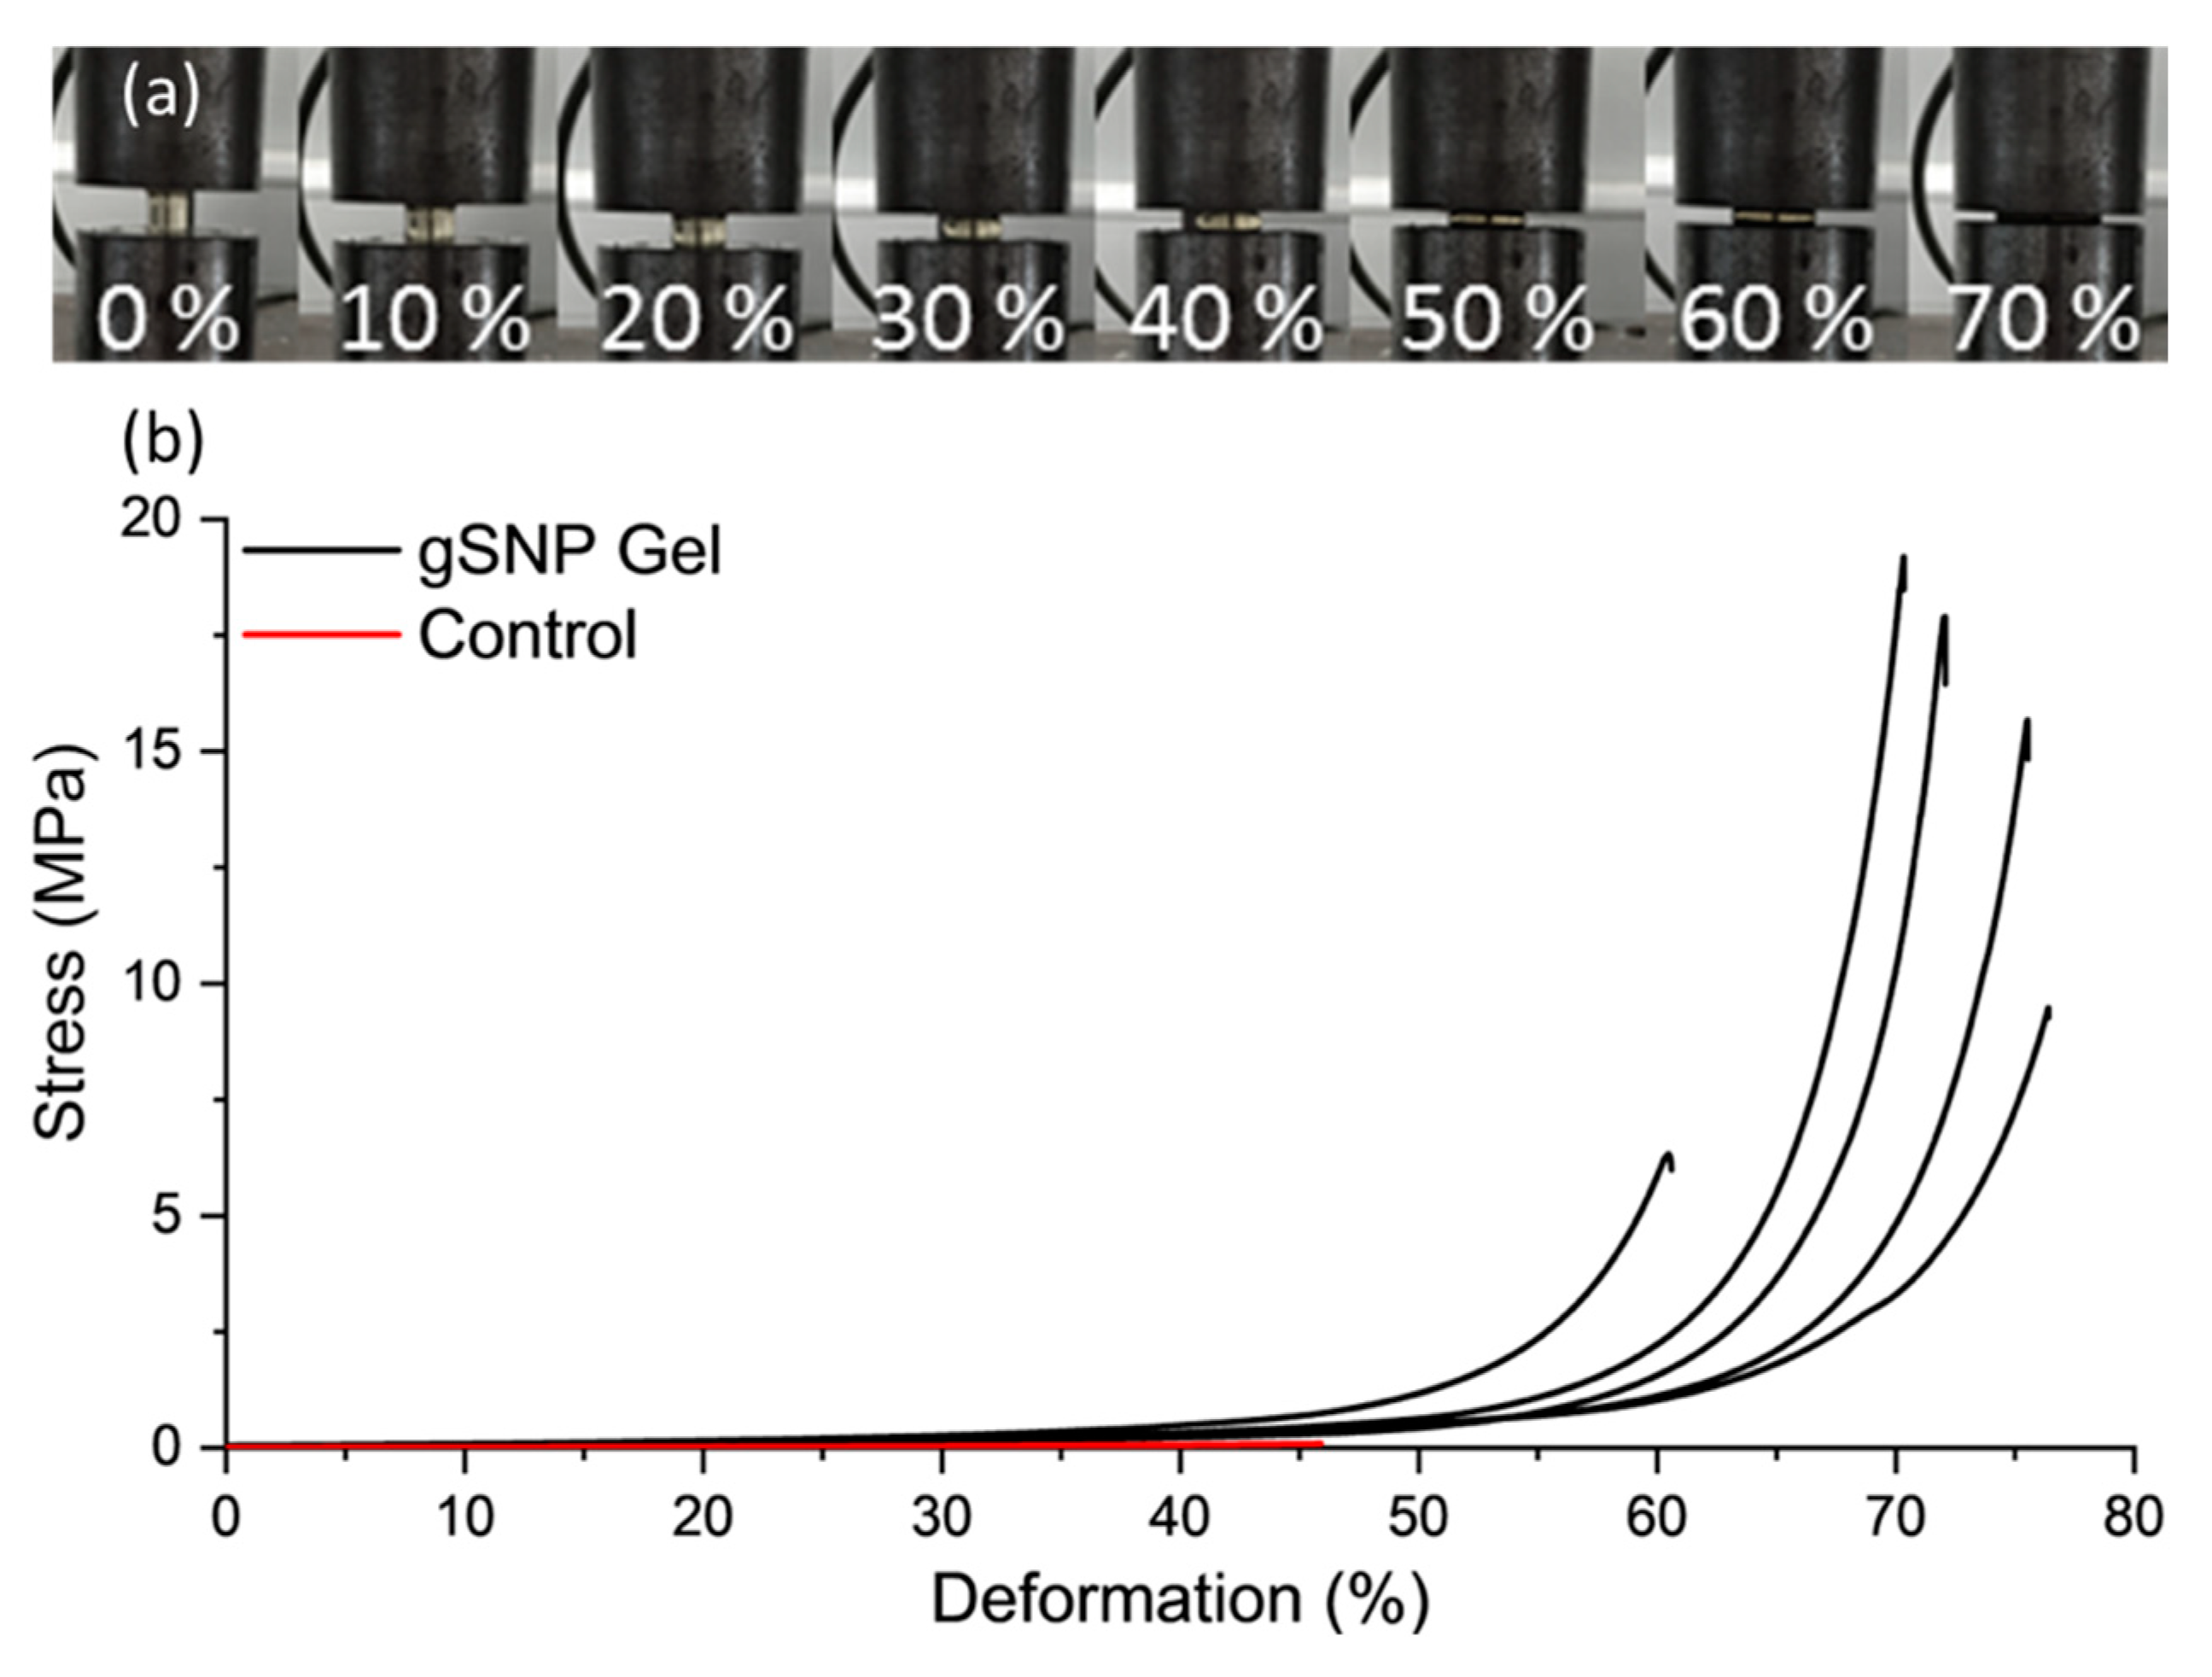
| Compressive Fracture Stress (MPa) | 0.10 ± 0.06 | 13.9 ± 5.5 |
| Fracture Strain (%) | 45.9 ± 2.1 | 69.6 ± 6.4 |
Disclaimer/Publisher’s Note: The statements, opinions and data contained in all publications are solely those of the individual author(s) and contributor(s) and not of MDPI and/or the editor(s). MDPI and/or the editor(s) disclaim responsibility for any injury to people or property resulting from any ideas, methods, instructions or products referred to in the content. |
© 2023 by the authors. Licensee MDPI, Basel, Switzerland. This article is an open access article distributed under the terms and conditions of the Creative Commons Attribution (CC BY) license (http://creativecommons.org/licenses/by/4.0/).


