Preprint
Article

Multi-Generation Effects of Lead (Pb) on Two Daphnia Species: Looking at Different Levels of Biological Organization

Altmetrics

Downloads

155

Views

40

Comments

0

Submitted:

26 May 2023

Posted:

30 May 2023

You are already at the latest version

Alerts
Abstract
Two monophyletic Daphnia species (Daphnia magna and D. similis) were exposed to a sub-lethal concentration of Pb (50 µg/L) for nine generations under two food regimes (usual and restricted) and analysed for acetylcholinesterase (AChE) activity, hatching delay and lifespan, and Net Reproductive Rate (R0) at subcellular, individual and population levels, respectively. At the sixth generation, Pb acclimated neonates were moved to a clean media for three more generations to check for recovery. D. magna showed no Pb effect on Net Reproductive Rate (R0). However, Pb stimulated reproduction, reduced lifespan and decreased AChE activity. Hatching delay and lifespan did not improve during the recovery process, indicating genetic adaptation. Food restriction reduced R0, lifespan, delayed hatching, and increased AChE activity; opposite outcomes were shown for D. similis. Full recovery shown by R0 suggests a physiological acclimation of D. similis. Under food restriction, the animals exhibited a reduction of R0 and lifespan, delayed hatching and increased AChE activity; however, with no Pb effect. The recovery process under food restriction showed that D. similis might not cope with Pb exposure, indicating failed recovery. Such outcomes indicate that a model species' sensitivity may not represent another's sensitivity.
Keywords: 
Subject: Environmental and Earth Sciences  -   Pollution

1. Introduction

Natural ecosystems have been increasingly affected due to xenobiotics’ release from anthropogenic activities. Such substances reach water bodies through multiple sources, such as run-off, domestic and industrial effluents, leaching from solid wastes, and atmospheric deposition [1]. Once in the aquatic environment, the contaminants may spread through the environmental compartments and affect aquatic life.
Lead (Pb) is a non-essential metal that can be highly toxic to organisms [2], which is originated from a set of sources, such as industrial emissions, mining residues, fuels (such as leaded gasoline), and lead-based paints [3]. Along with Ni, Zn and Cu, Pb is considered a main contaminant from human activities [4]; it may have natural or anthropic sources. Lead has been found in drinking water, surface waters, groundwater, soils, and sediments in concentrations capable of causing toxic effects to exposed organisms, including humans [5]. Pb can cause neurotoxicity in exposed organisms [6], such as rats, fish and crustaceans, and can also affect organisms’ cholinergic neurons [7]. Thus, acetylcholinesterase activity is frequently used as a neurotoxicity biomarker [8], including for Pb exposure.
In June 2018, Pb was included in the Candidate List of Substances of very high concern (SVHCs) by the European Chemicals Agency (ECHA). The Maximum Allowable Concentration (MAC) for Pb in European countries is not applicable because the Annual Average Value for the Environmental Quality Standards (AA-EQS) found in surface waters is 7.2 μg/L [9]. On the other hand, the Brazilian federal legislation established 50 μg/L as the maximum permitted Pb concentration for freshwater ecosystems [10].
Microcrustaceans of the genus Daphnia have been used to evaluate the effects of contaminants (such as Pb) and the quality of waterbodies that receive contaminants’ inputs. As daphnids are primary grazers, a toxic effect on these organisms can display a cascading response which may be propagated through the food web [11,12]. Daphnids are model organisms in standardized acute and chronic toxicity tests [13,14], widely used worldwide. However, laboratory standard tests, which often expose organisms for short-term periods, do not adequately assess the long-term effects of chemicals on natural populations. Thus, exposing organisms for longer periods or multiple generations may constitute a more representative approach that provides additional information to support risk assessment [15,16,17].
Individuals from a single or closely related species can respond differently to chemical exposure [18,19,20,21]. In this study, two monophyletic daphnid species from two different climatic regions (Daphnia magna and D. similis, from temperate and tropical regions, respectively) were used to compare the chronic effects of Pb. In addition, because natural ecosystems may vary in terms of food quality and quantity on a temporal scale [22] and that nutritional status may influence organisms’ sensitivity to chemicals [23], we evaluated if Pb exposure over nine generations would impact different levels of biological organization for both of these daphnid species, also considering differences of food supply. To accomplish our goal, we evaluated the activity of acetylcholinesterase (AChE) as a low level of organization, hatching delay, lifespan and Net Reproductive Rate (R0), to derive information from the individual to the population level.

2. Materials and Methods

2.1. Culture maintenance

Daphnia magna and D. similis were maintained in ASTM hard water [24], at 20 ± 2 °C and a photoperiod of 16:8 h (light/dark). Organisms were fed with Raphidocellis subcapitata (3 × 10⁵ cells/mL), and enriched with an organic extract (Marine seaweed extract, supplied by Glenside Organics Ltd.) [25]. Media and food were renewed every other day. Neonates from the third to fifth brood (less than 24 h old) were used to start new cultures. Details of both daphnids’ cultures are provided in Araújo et al. [26,27].

2.2. Chemical Solutions and Analyses

A stock solution of Pb(NO3)2 (CAS No. 10099-74-8, 98.5% purity, VWR chemicals®) was prepared in Milli-Q water and then used for preparing the Pb working solution used to expose the organisms (50 µg/L). Aliquots of Pb solution were separated, acidified (nitric acid) and then analyzed by ICP-OES (Horiba Jobin Yvon, Activa M), with no internal standard, to quantify the total Pb concentrations. These analyses were made in triplicate; certified material was also analyzed (in duplicate) to ensure optimum chemical recovery during procedures (Inorganic Venture®). A control (ASTM media) was also evaluated to validate the procedure.

2.3. Multi-generation

The multi-generation test was conducted with nine generations (F0 to F9) (Figure 1). Each generation started with the previous generation’s third brood (N3), with neonates younger than 24 hours old. Both species were divided into four treatments, as follows: control with clean ASTM media with normal food supply regime (consisting of 3 × 10⁵ cells/mL of algae), control ASTM media with restricted food supply regime (1.5 × 10⁵ cells/mL), and the Pb exposed organisms at both normal and restricted food supply regimes. The treatments comprised three replicates of 20 neonates in one litter vial each. This set-up was used for generations F0 to F6. Then, Pb exposed organisms at generation F6 were divided into two sets to check for recovery. One of the sets was maintained under Pb exposure (i.e., exposed to 50 μg/L of Pb), while in the other set, Pb pre-exposed organisms were transferred to clean ASTM. These two treatments involved an additional exposure for three generations (F6 to F9), at their respective food supply treatments. Then, at F0, F3, F6 and F9, several endpoints were assessed to evaluate the effects of long-term exposure to Pb and subsequent recovery.

2.4. Acetylcholinesterase activity

The AChE enzymatic activity was estimated for all treatments in organisms aged 96 h old for both species at generations F0, F3 and F9. For that, a 96 h period (after birth) was waited, and neonates from continuous Pb exposure were divided into two sets. In the first set, neonates were kept in continuous Pb exposure (as Pb exposure treatment) until they reached 96 h old. On the second set, denominated as Pb (clean96 h), neonates (<24 h) from the continuous Pb exposure treatment were moved to clean ASTM media until they reached 96 h old. This may enable evaluating the AChE activity of retrieving organisms in a 96 h period. Each replicate consisted of a pool of 15 neonates (96 hours old) frozen with liquid nitrogen in a 1.5 mL microtube until enzymatic analysis. All samples were homogenized with a phosphate buffer, under a pH of 7.2 and at 0.1 M. Samples were centrifuged at 6.000 rpm for 5 minutes and at 4 ºC. The enzymatic activity was estimated as Ellman et al. [28], and adapted to microplate [8]. Protein quantification to normalize enzymatic activity was carried out as described in [29], adapted by BioRad’s micro-assay and using bovine γ-globuline as standard.

2.5. Net Reproductive Rate (R0)

Daphnid neonates from the first to the fifth brood (N1 to N5) were counted in order to estimate the Net Reproductive Rate (R0) of all treatments (negative control, Pb exposure and recovery for both food regimes). Along with the total number of offspring produced (N1 to N5), adult survival was also recorded to estimate R0, using the formula R0 = Σ (lx.mx), where lx represents survival and mx represents fecundity, as detailed in [30].

2.6. Hatching delay

The time of the release of the F control first brood (N1) was used to determine the hatching delay and designate time 0. The time the other treatments took to start producing the first brood was the delayed (or accelerated) time to start reproducing (hatching delay). Daphnia usually give the first brood 8–10 days after birth (normal conditions). The hatching delay was evaluated for all treatments (control and Pb) and food regimes, including the recovery process.

2.7. Lifespan

Daphnids reproduce early and have short lifespans being r-strategists organisms. All treatments were maintained until “natural” death occurred to estimate the generational Pb effect on daphnids’ longevity. Every day organisms in all treatments (negative control, Pb exposure and recovery for both food regimes) were checked to search for dead organisms and to estimate organisms’ lifespans. Because the experiments were initiated with individuals less than 24 old, the measurements of lifespan were reliable.

2.8. Statistical analysis

All endpoints acquired through the multi-generation test were checked for normality (Kolmogorov–Smirnov) and homoscedasticity (Levene’s equal variance test) and the differences among generations and treatments of each generation were evaluated through a Two-Way Analysis of Variance (ANOVA). When statistical differences were first highlighted, a post-hoc test (Bonferroni) was applied (GraphPad Prism®). In order to integrate and highlight associations among variables, a multivariate Principal Component Analysis (PCA) was made. The multivariate analysis was run with the help of SPSS® software.

3. Results

3.1. Chemical analyses

In the chemical analysis, the certified material evaluated had >80% of the recovery. In the ASTM control, the concentrations were below the limit of quantification (LOQ) for Pb, which was 25 µg/L. In the stock solution, the measured Pb concentration was within 103% of the nominal added value of 46.54 mg/L. For the multi-generation test, the measured Pb concentration was within 108% of the nominal added value of 50 µg/L of Pb.

3.2. Acetylcholinesterase activity (AChE)

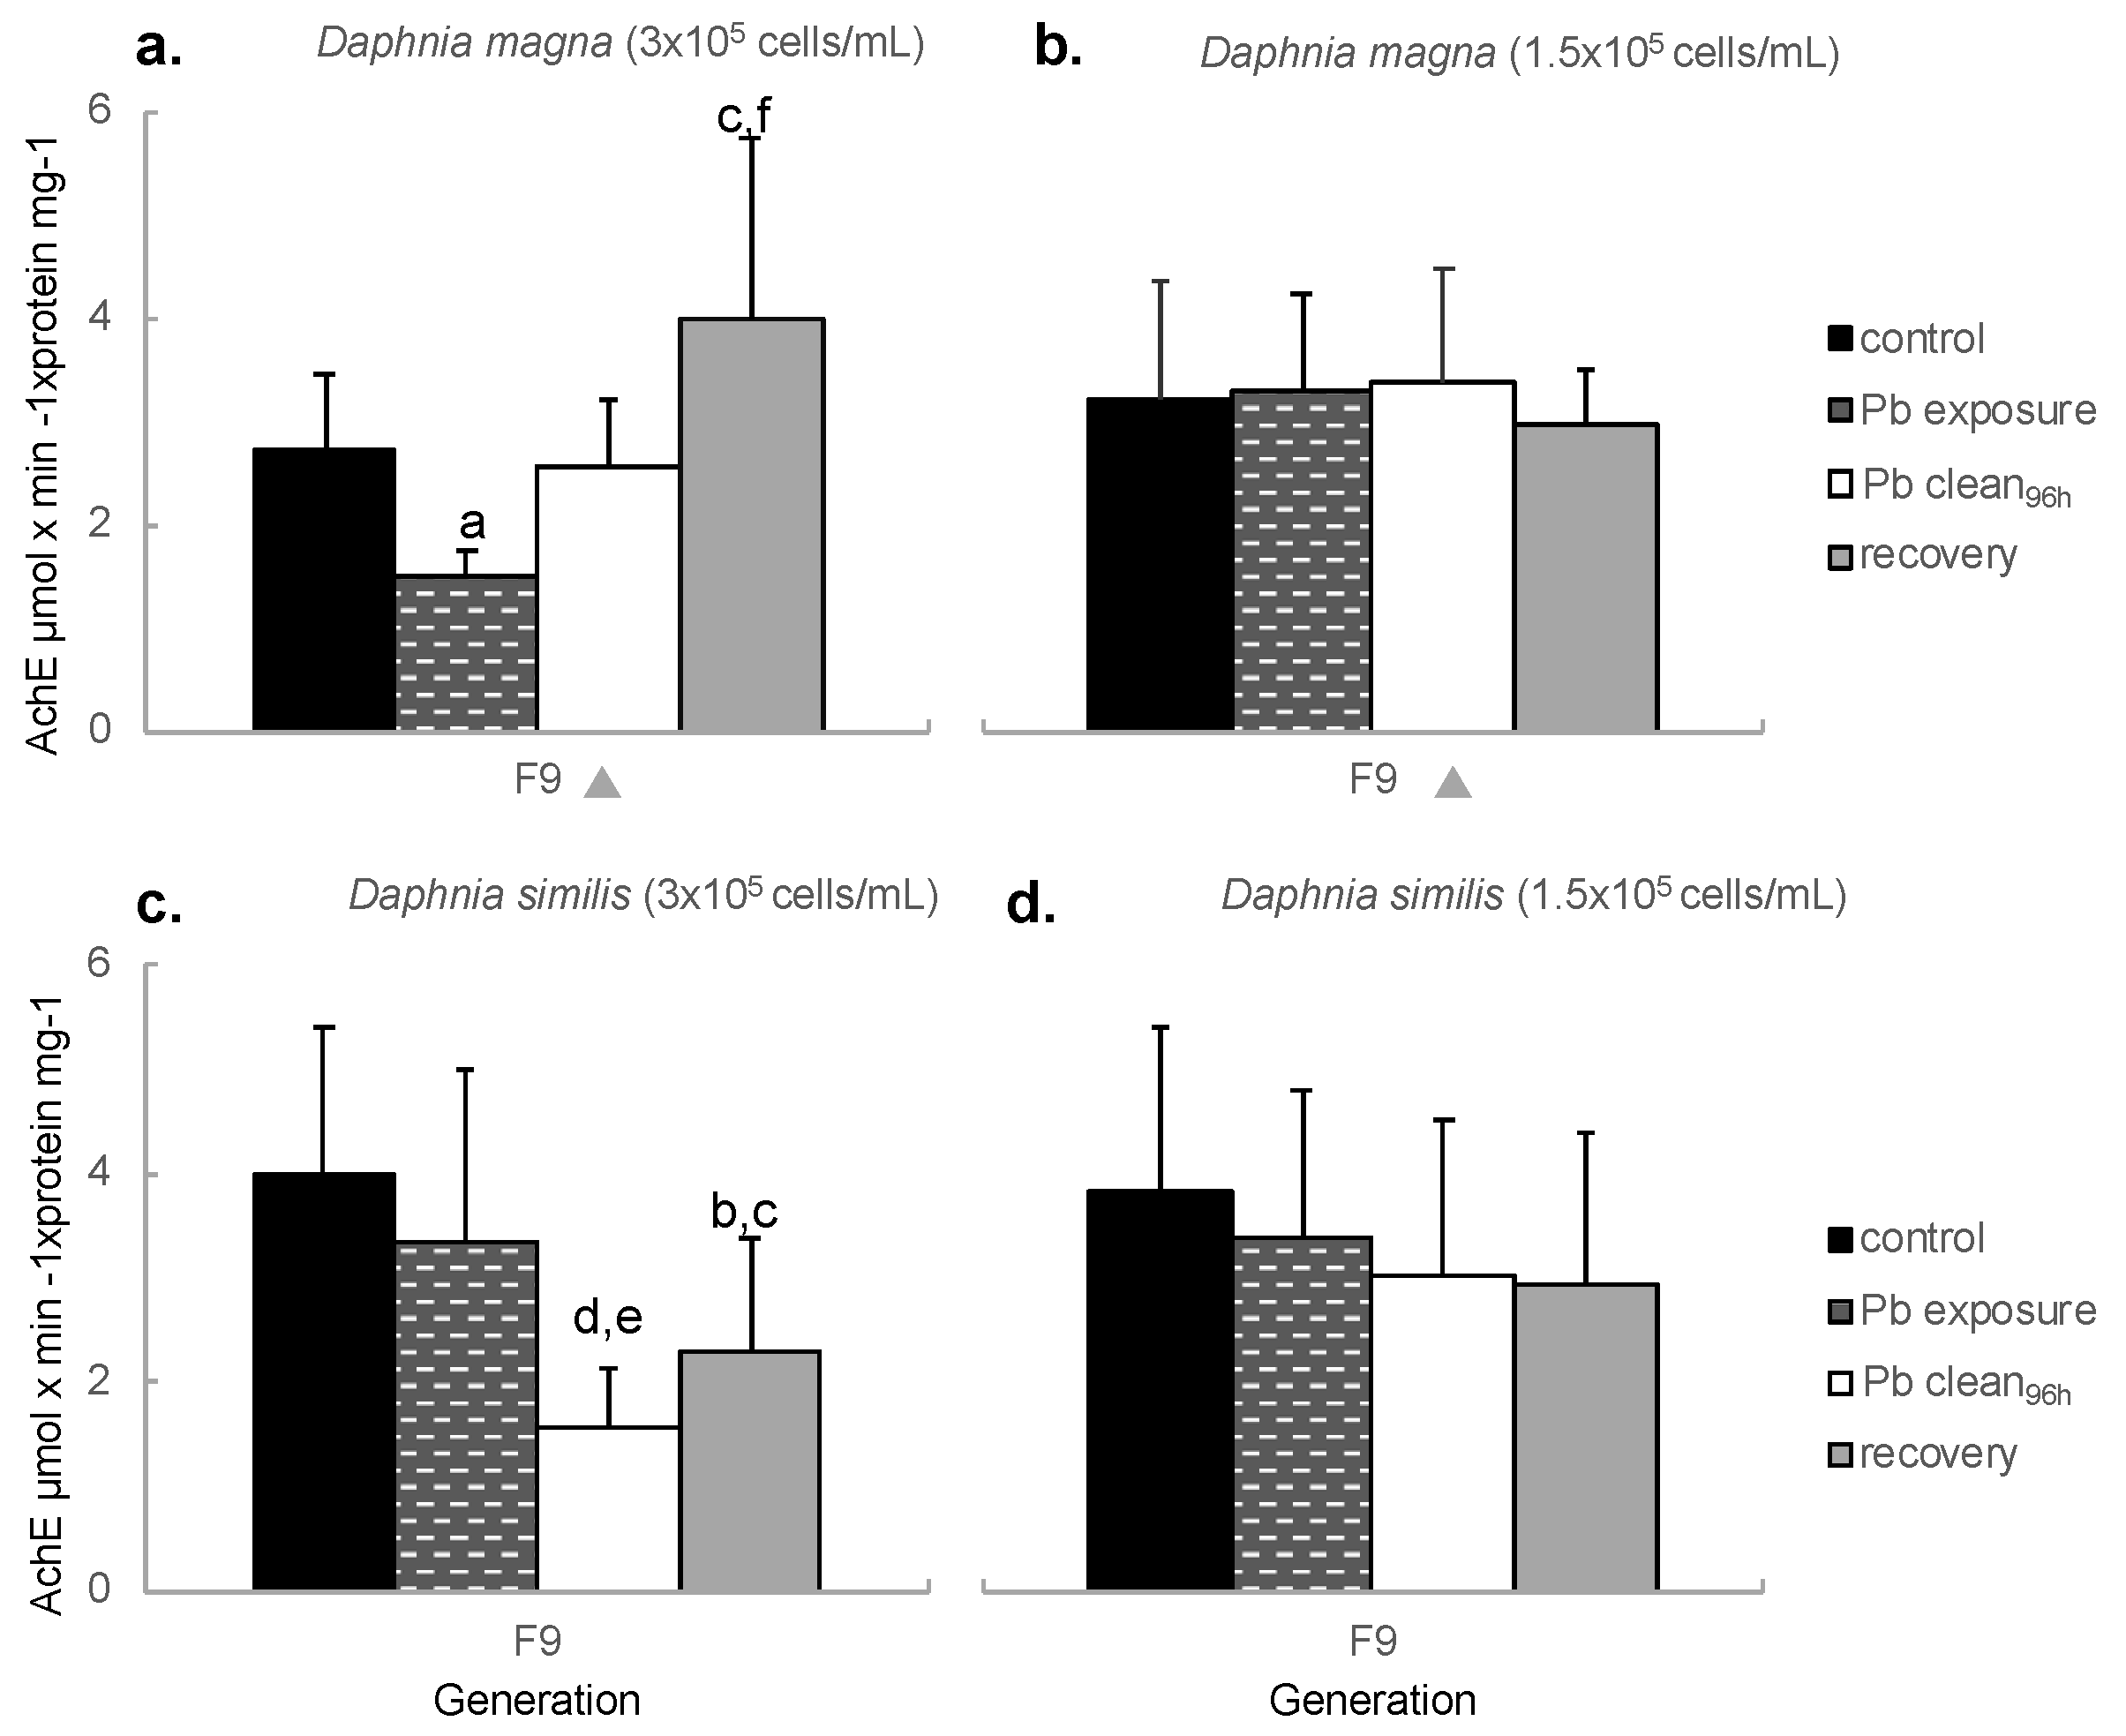
The result of the two-way ANOVA for the AChE activity is shown in Table S1. Control D. magna presented higher AChE activities among generations F3 and F9 than F0 organisms (Figure 2a). Among treatments, control showed higher enzymatic activity than continuous Pb exposure, but similar to that exhibited by Pb (clean96h) organisms (Pb exposed neonates moved for 96 h to a clean ASTM media). Under food restriction, no differences among treatments were shown; however, all treatments at generation F9 presented an enhanced AChE activity compared to F0 (Figure 2b).
Control and Pb treatment D. similis presented increased AChE activity throughout generations, differing from F0 at generation F9 (Figure 2c). Both treatments also had higher enzymatic activity than Pb (clean96h) organisms (F9). Food restriction showed a similar outcome for control and Pb treatment (Figure 2d). However, Pb (clean96h) organisms enhanced AChE activity from F3 to F9 and exhibited no statistical difference among treatments.
Regarding recovery, organisms of both species with normal food supply presented increased variations among treatments than organisms under food restriction. Recovery D. magna (normal food, F9) showed enhanced AChE activity compared to F0 and to both Pb treatments (Pb and Pb (clean96h)) (Figure 3a). Under food restriction, no difference among treatments was spotted; however, recovery organisms presented a significantly higher enzymatic activity than F0 (Figure 3b). Recovery D. similis (normal food) presented a lower enzymatic activity when compared to control organisms (Figure 3c). Under food restriction, different outcomes are shown, and no difference among treatments or generations was indicated (Figure 3d).

3.3. Net Reproductive Rate (R0)

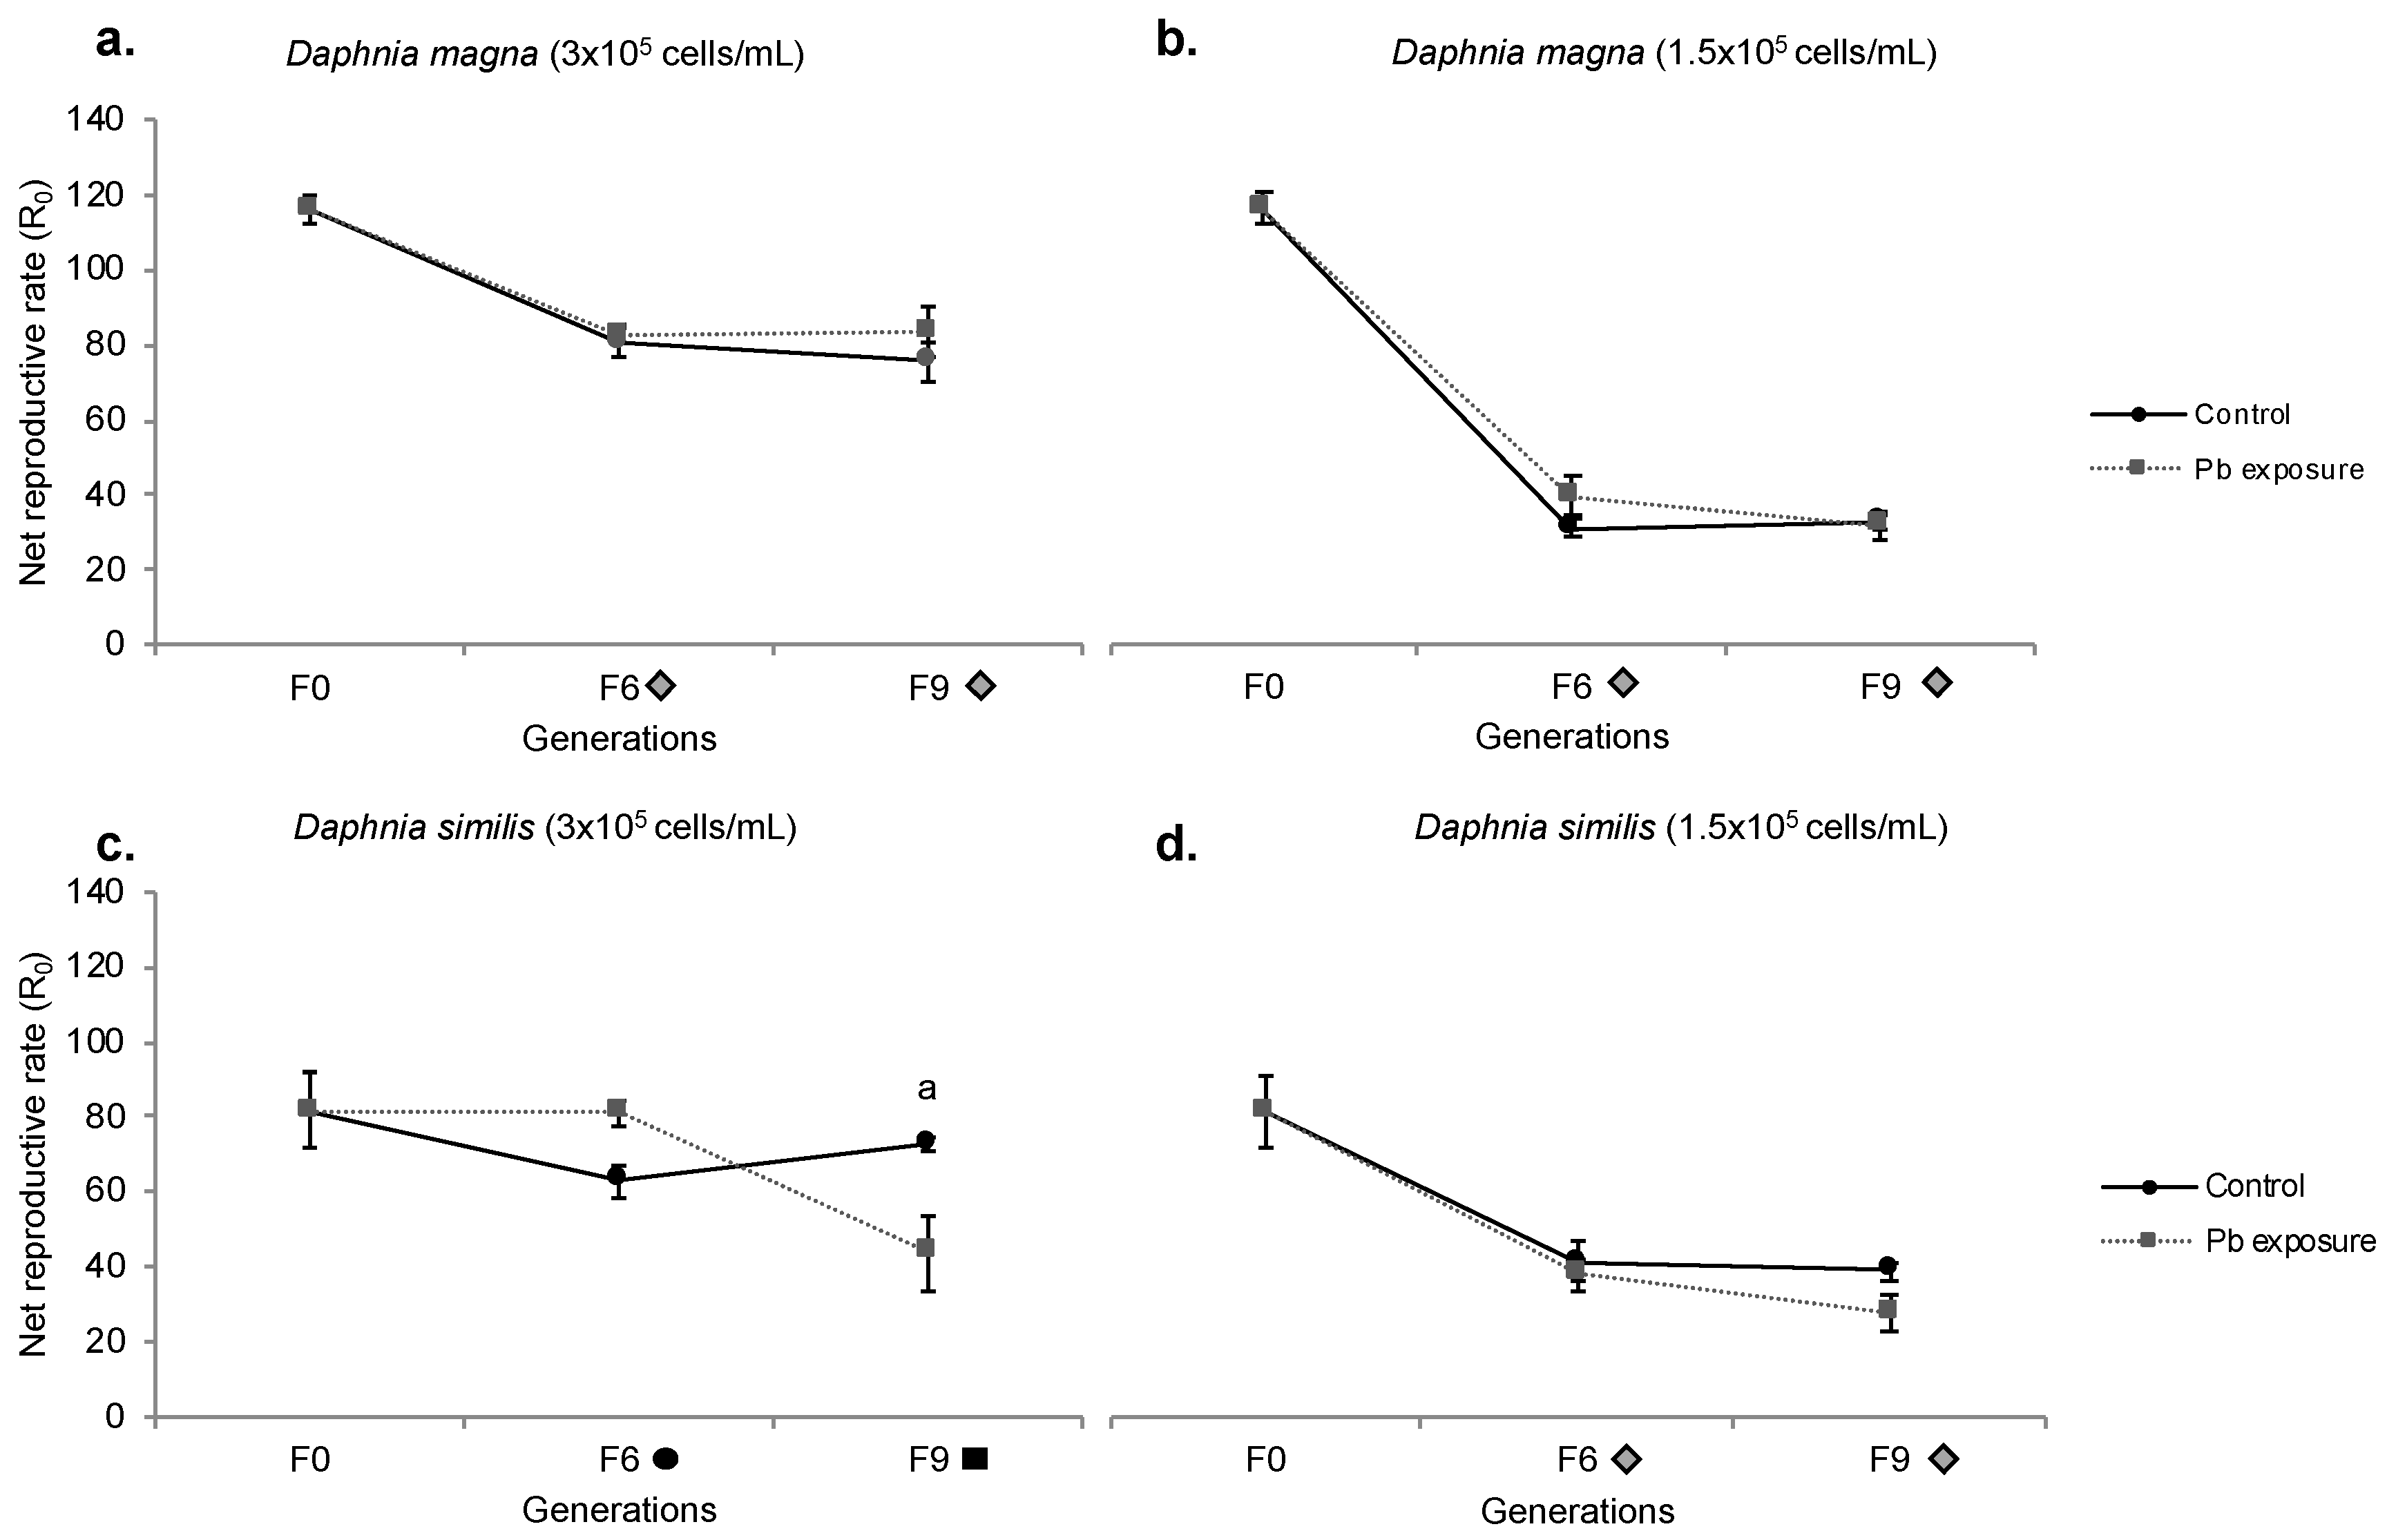
Regarding the Net Reproduction Rate (R0), the statistical analysis results are shown in Table S2. The quality criteria (> 60 total neonates/female) [14] was achieved for the control treatment at every generation kept under a normal food regime. Under food restriction, the controls of both species produced lower offspring quantity than the minimum recommended by OECD at generations F6 and F9. The mean reproductive rate of D. magna maintained with a normal food regime decreased through generations in both control and Pb exposure treatments, with F0 values statistically higher than in F6 and F9 (Figure 4a). In addition, no differences between treatments were attained. Under food restriction (Figure 4b), R0 decreased drastically, with both treatments (control and Pb exposure) different from F0 at generations F6 and F9.
D. similis showed a lower R0 in comparison to D. magna, with averages of 82 and 120 (F0) neonates per living female, respectively. Control D. similis (normal food) showed a reduction of R0 at generation F6, compared to F0 (Figure 2c). Continuous Pb exposure decreased R0 at generation F9 compared to control treatment and generation F0. No difference among treatments was shown for D. similis under food restriction (Figure 2d); however, both treatments presented reduced R0 at generations F6 and F9 compared to F0.
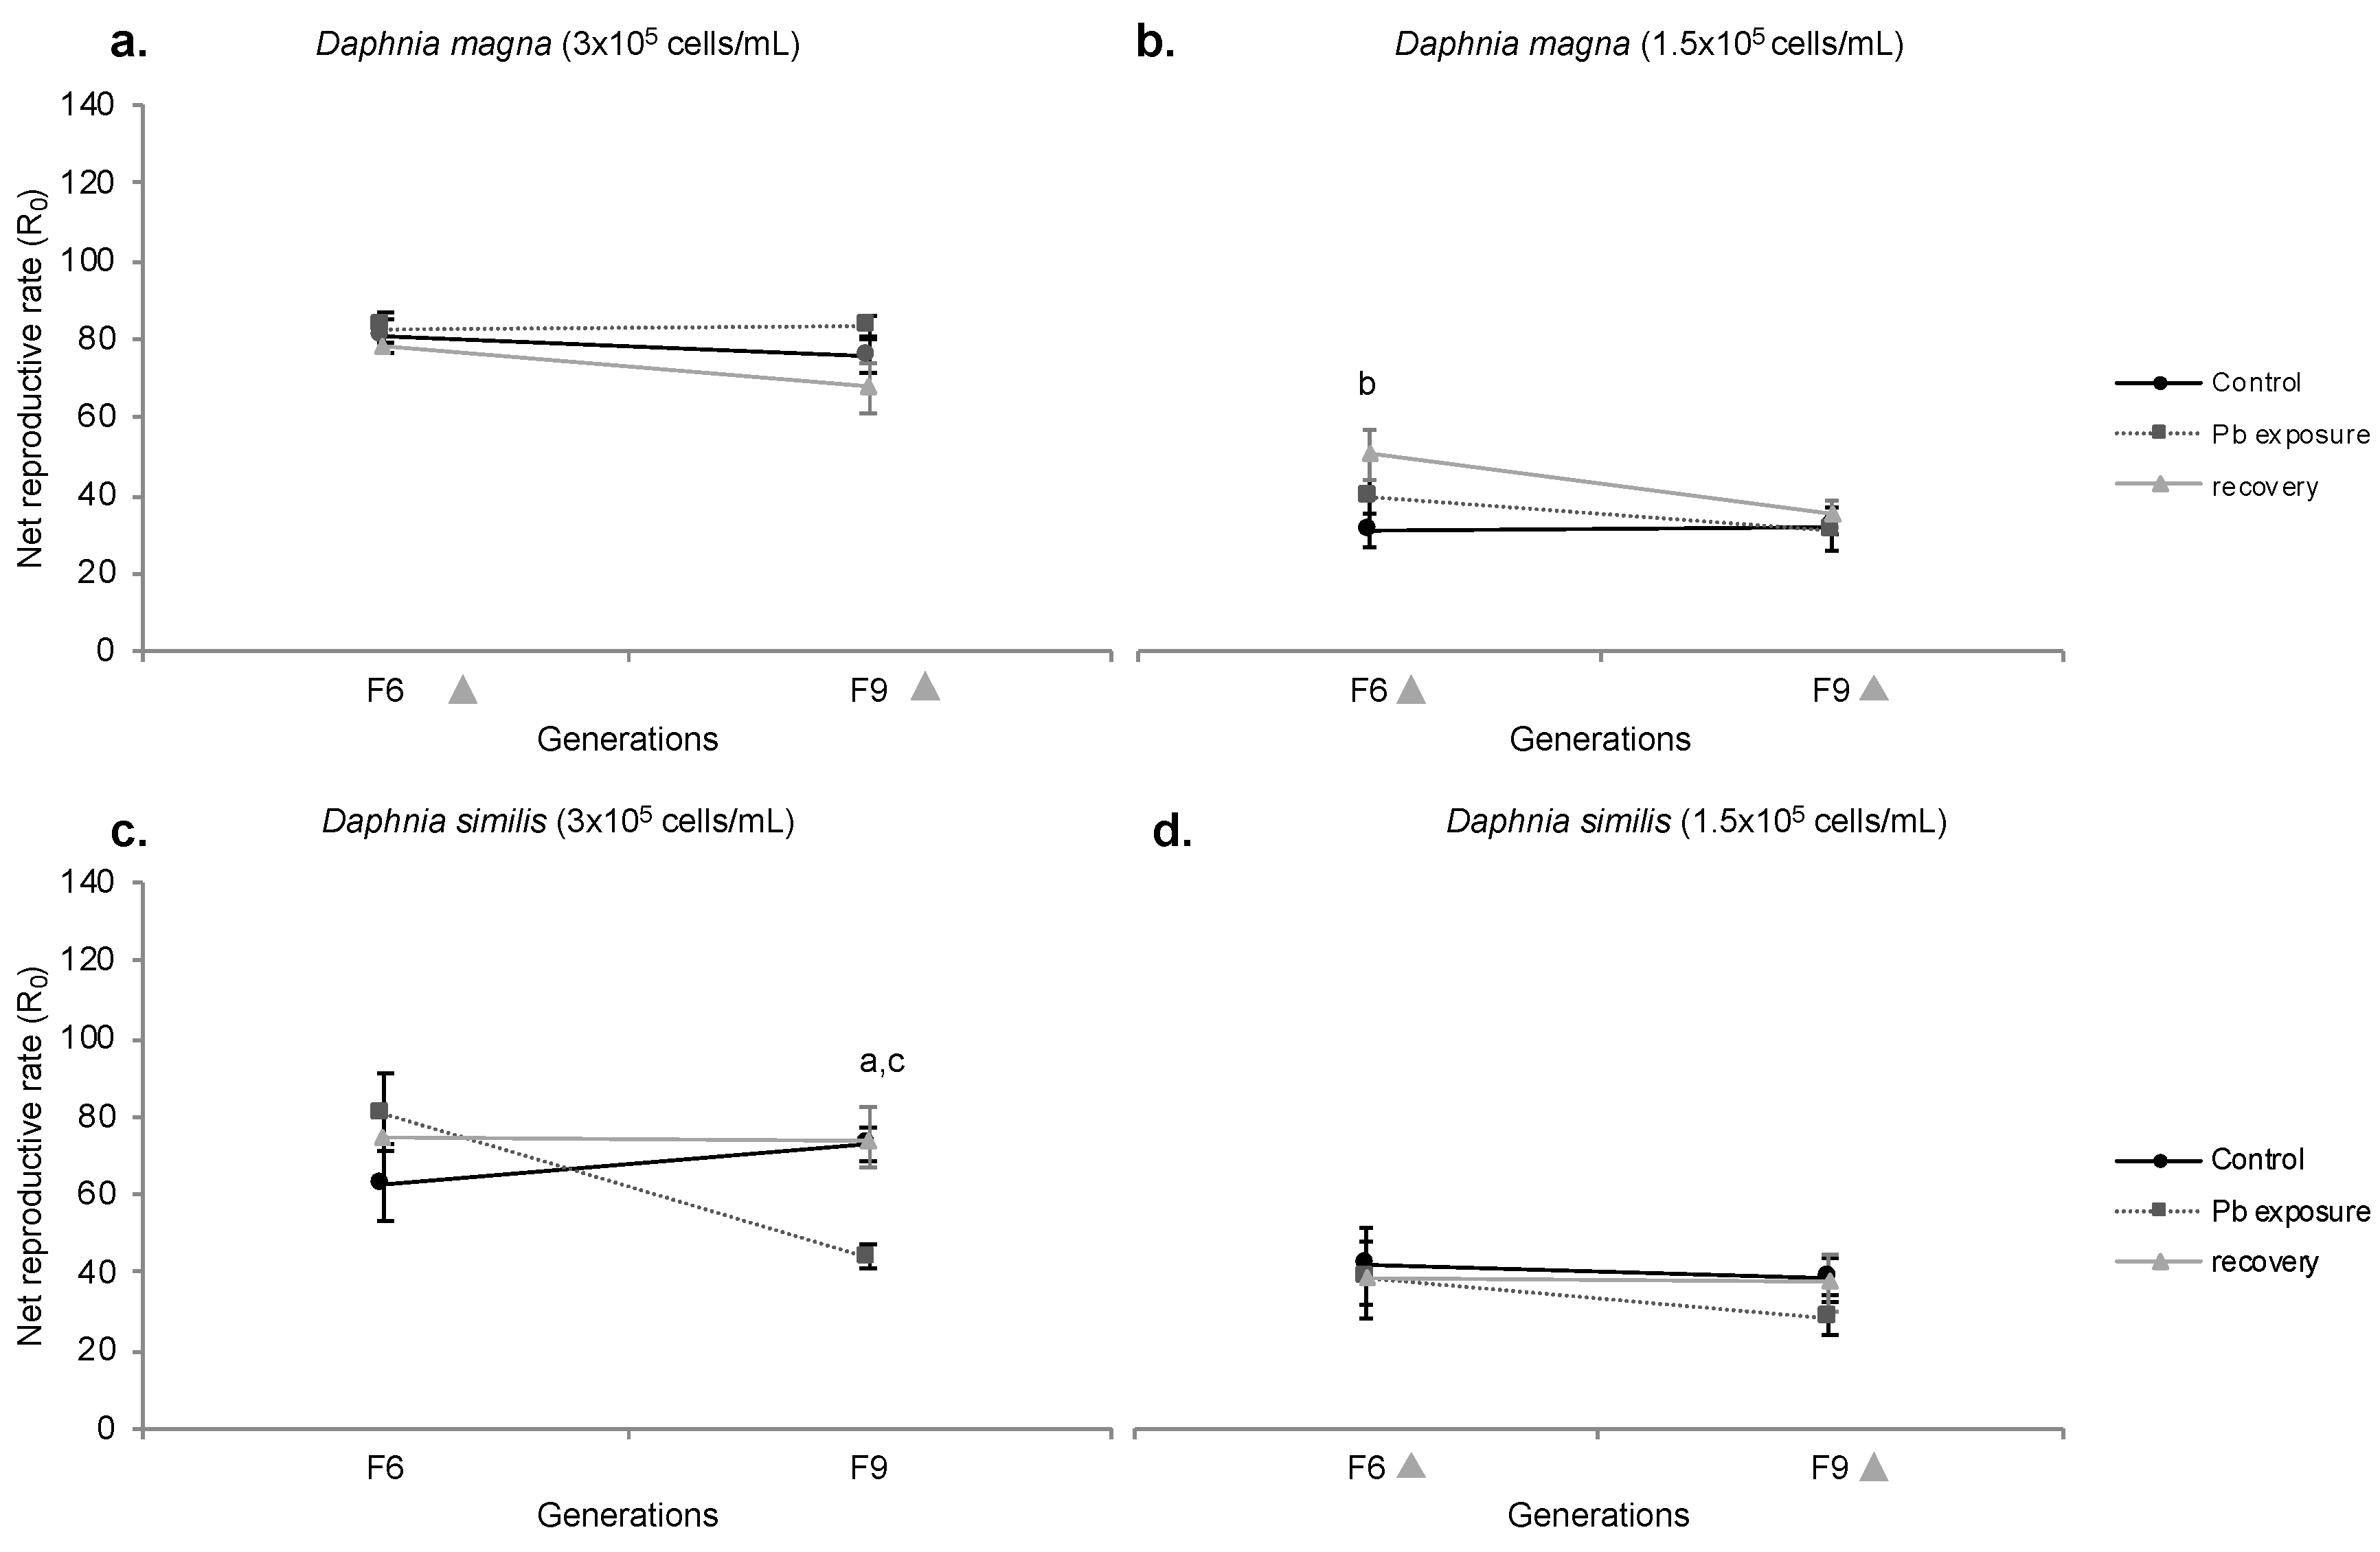
Regarding the recovery period, D. magna (normal food regime) presented no statistical difference towards other treatments (control and Pb exposure); however, a lower R0 was shown for both F6 and F9 when compared to F0 (Figure 5a). Under food restriction (Figure 5b), recovering D. magna showed an enhanced R0 compared to control organisms at generation F6, a pattern not maintained at generation F9, as this treatment was similar to both control and Pb treatments. Regarding generations, F6 and F9 indicated a statistically lower R0 than F0.
Recovering D. similis (normal food) showed no statistical divergence among generations (compared to F0) (Figure 5c). Organisms from the recovery period presented a higher R0 than Pb exposure at generation F9, but similar to F9 control. Under food restriction, no difference is shown among treatments (control, Pb and recovery period), but a lower R0 was shown for generations F6 and F9 compared to F0 (Figure 5d).

3.4. Hatching delay

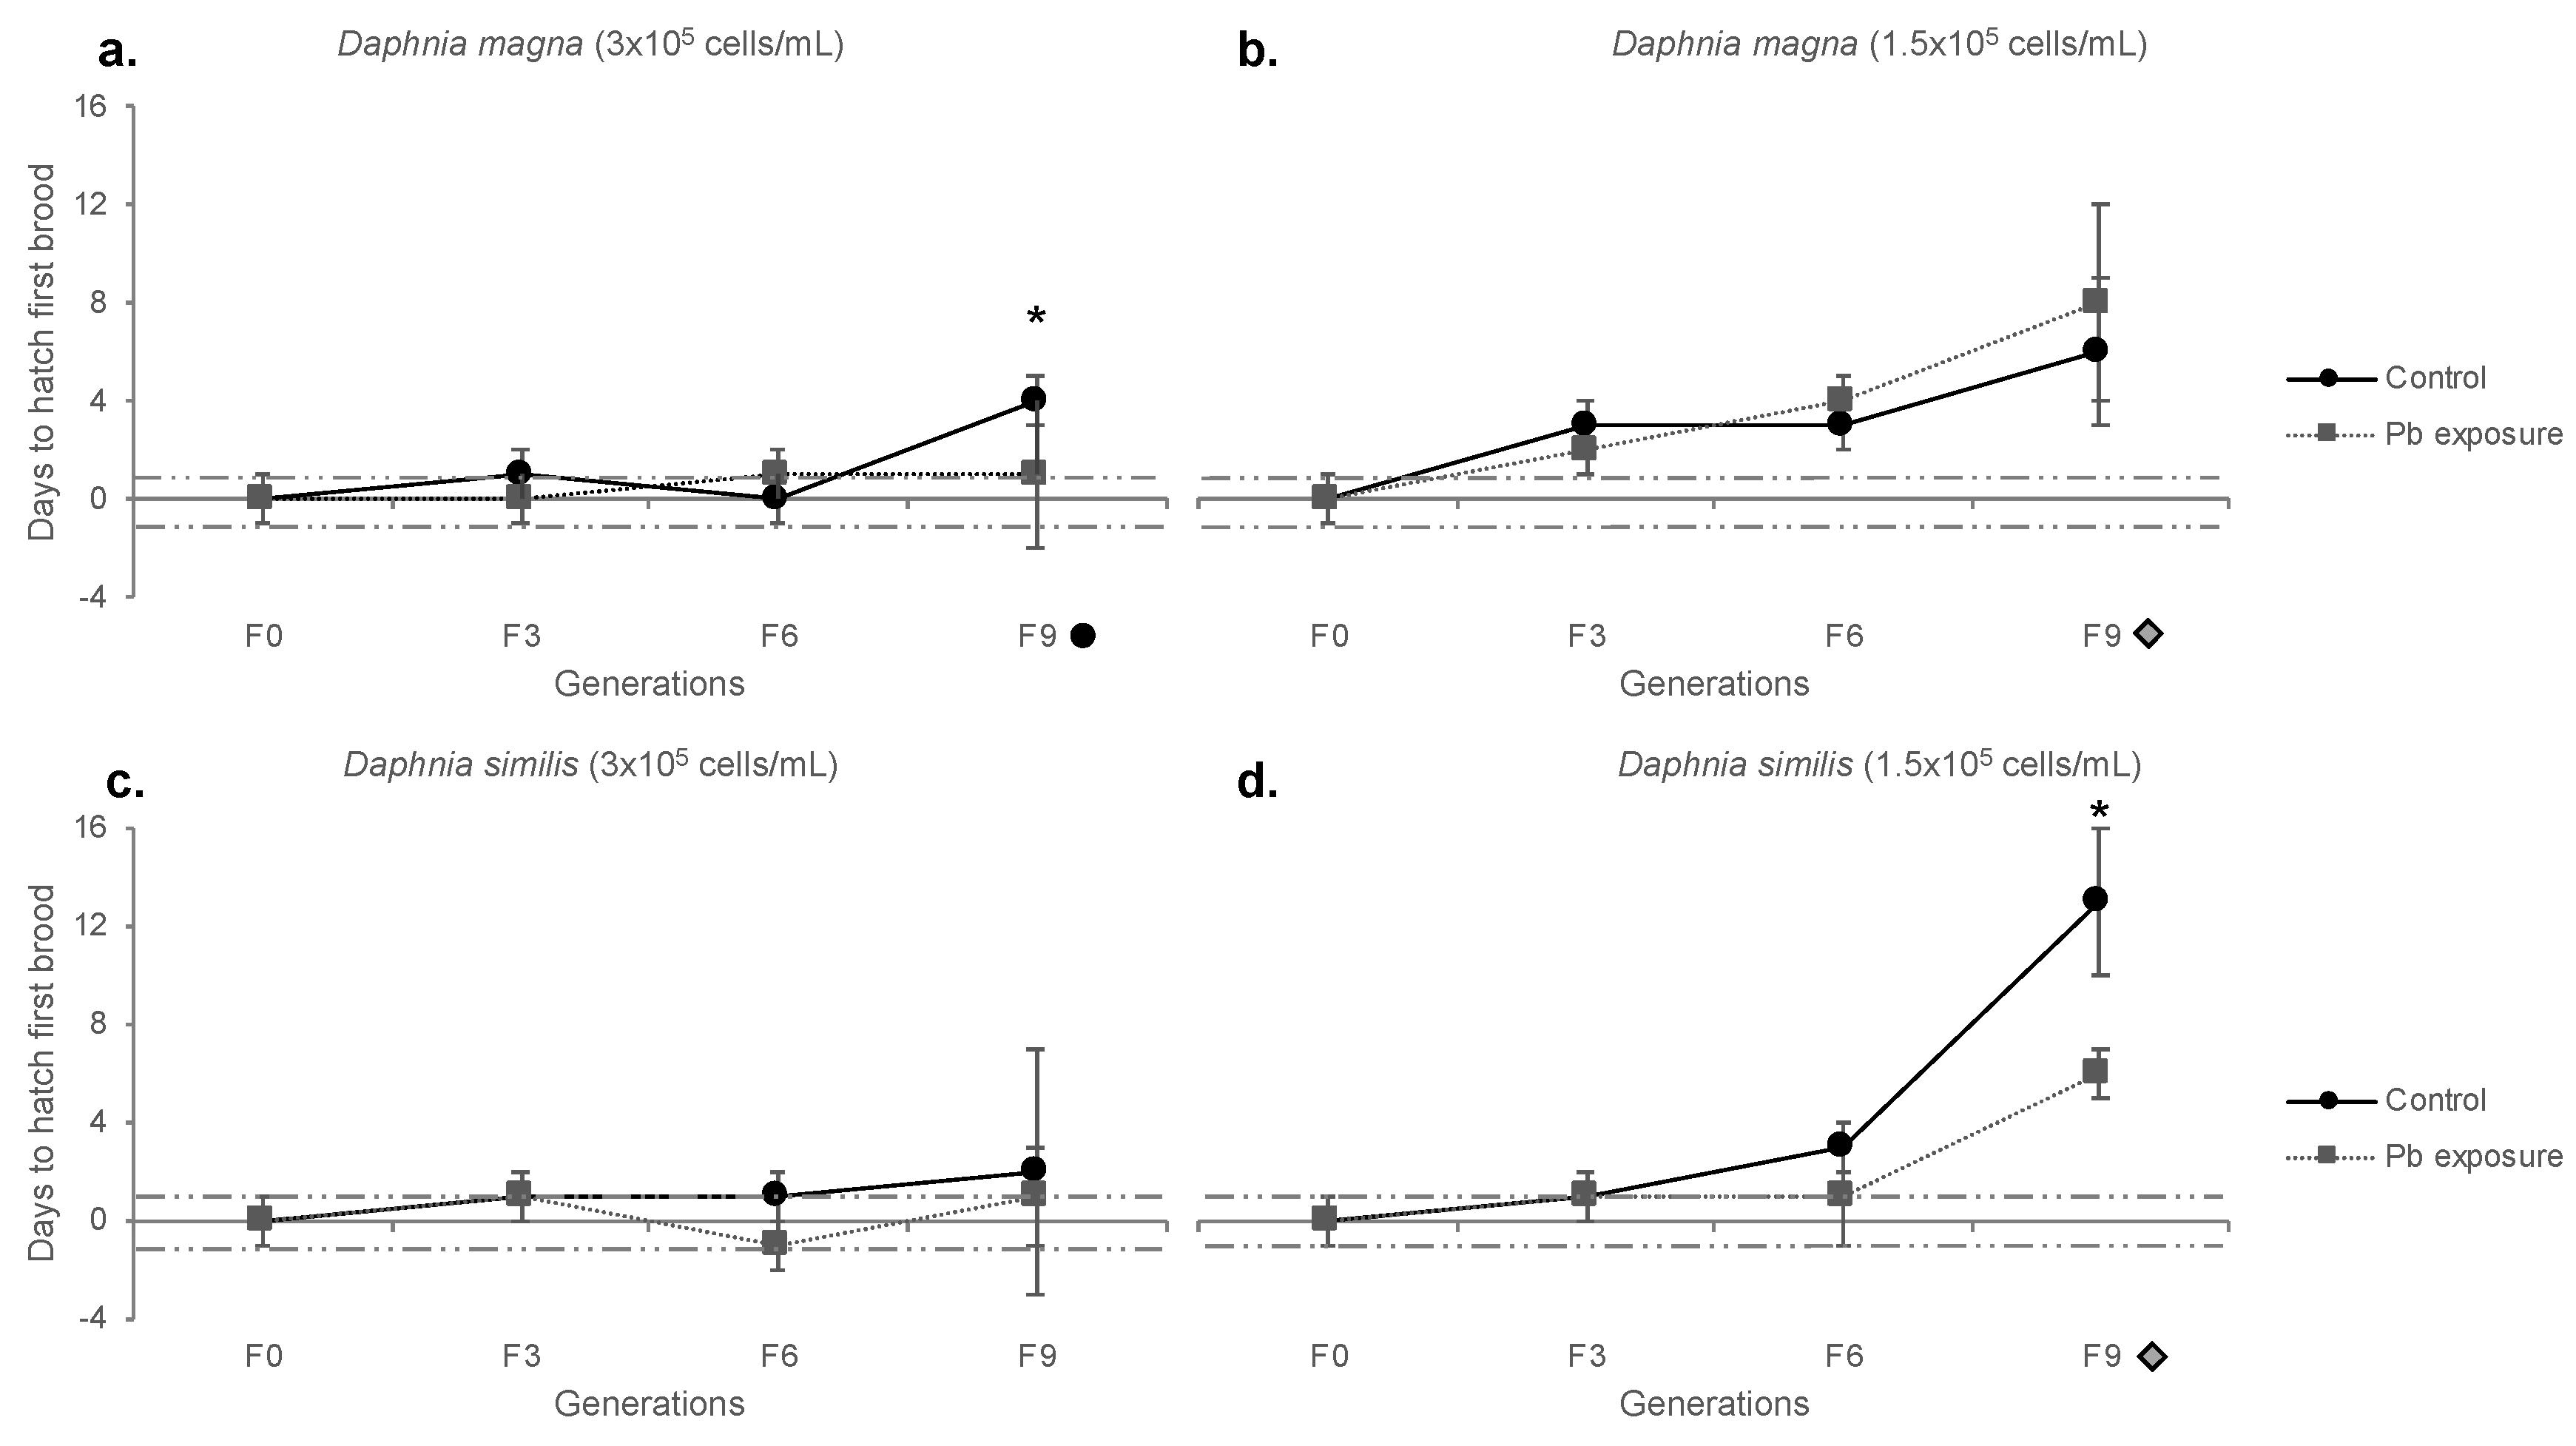
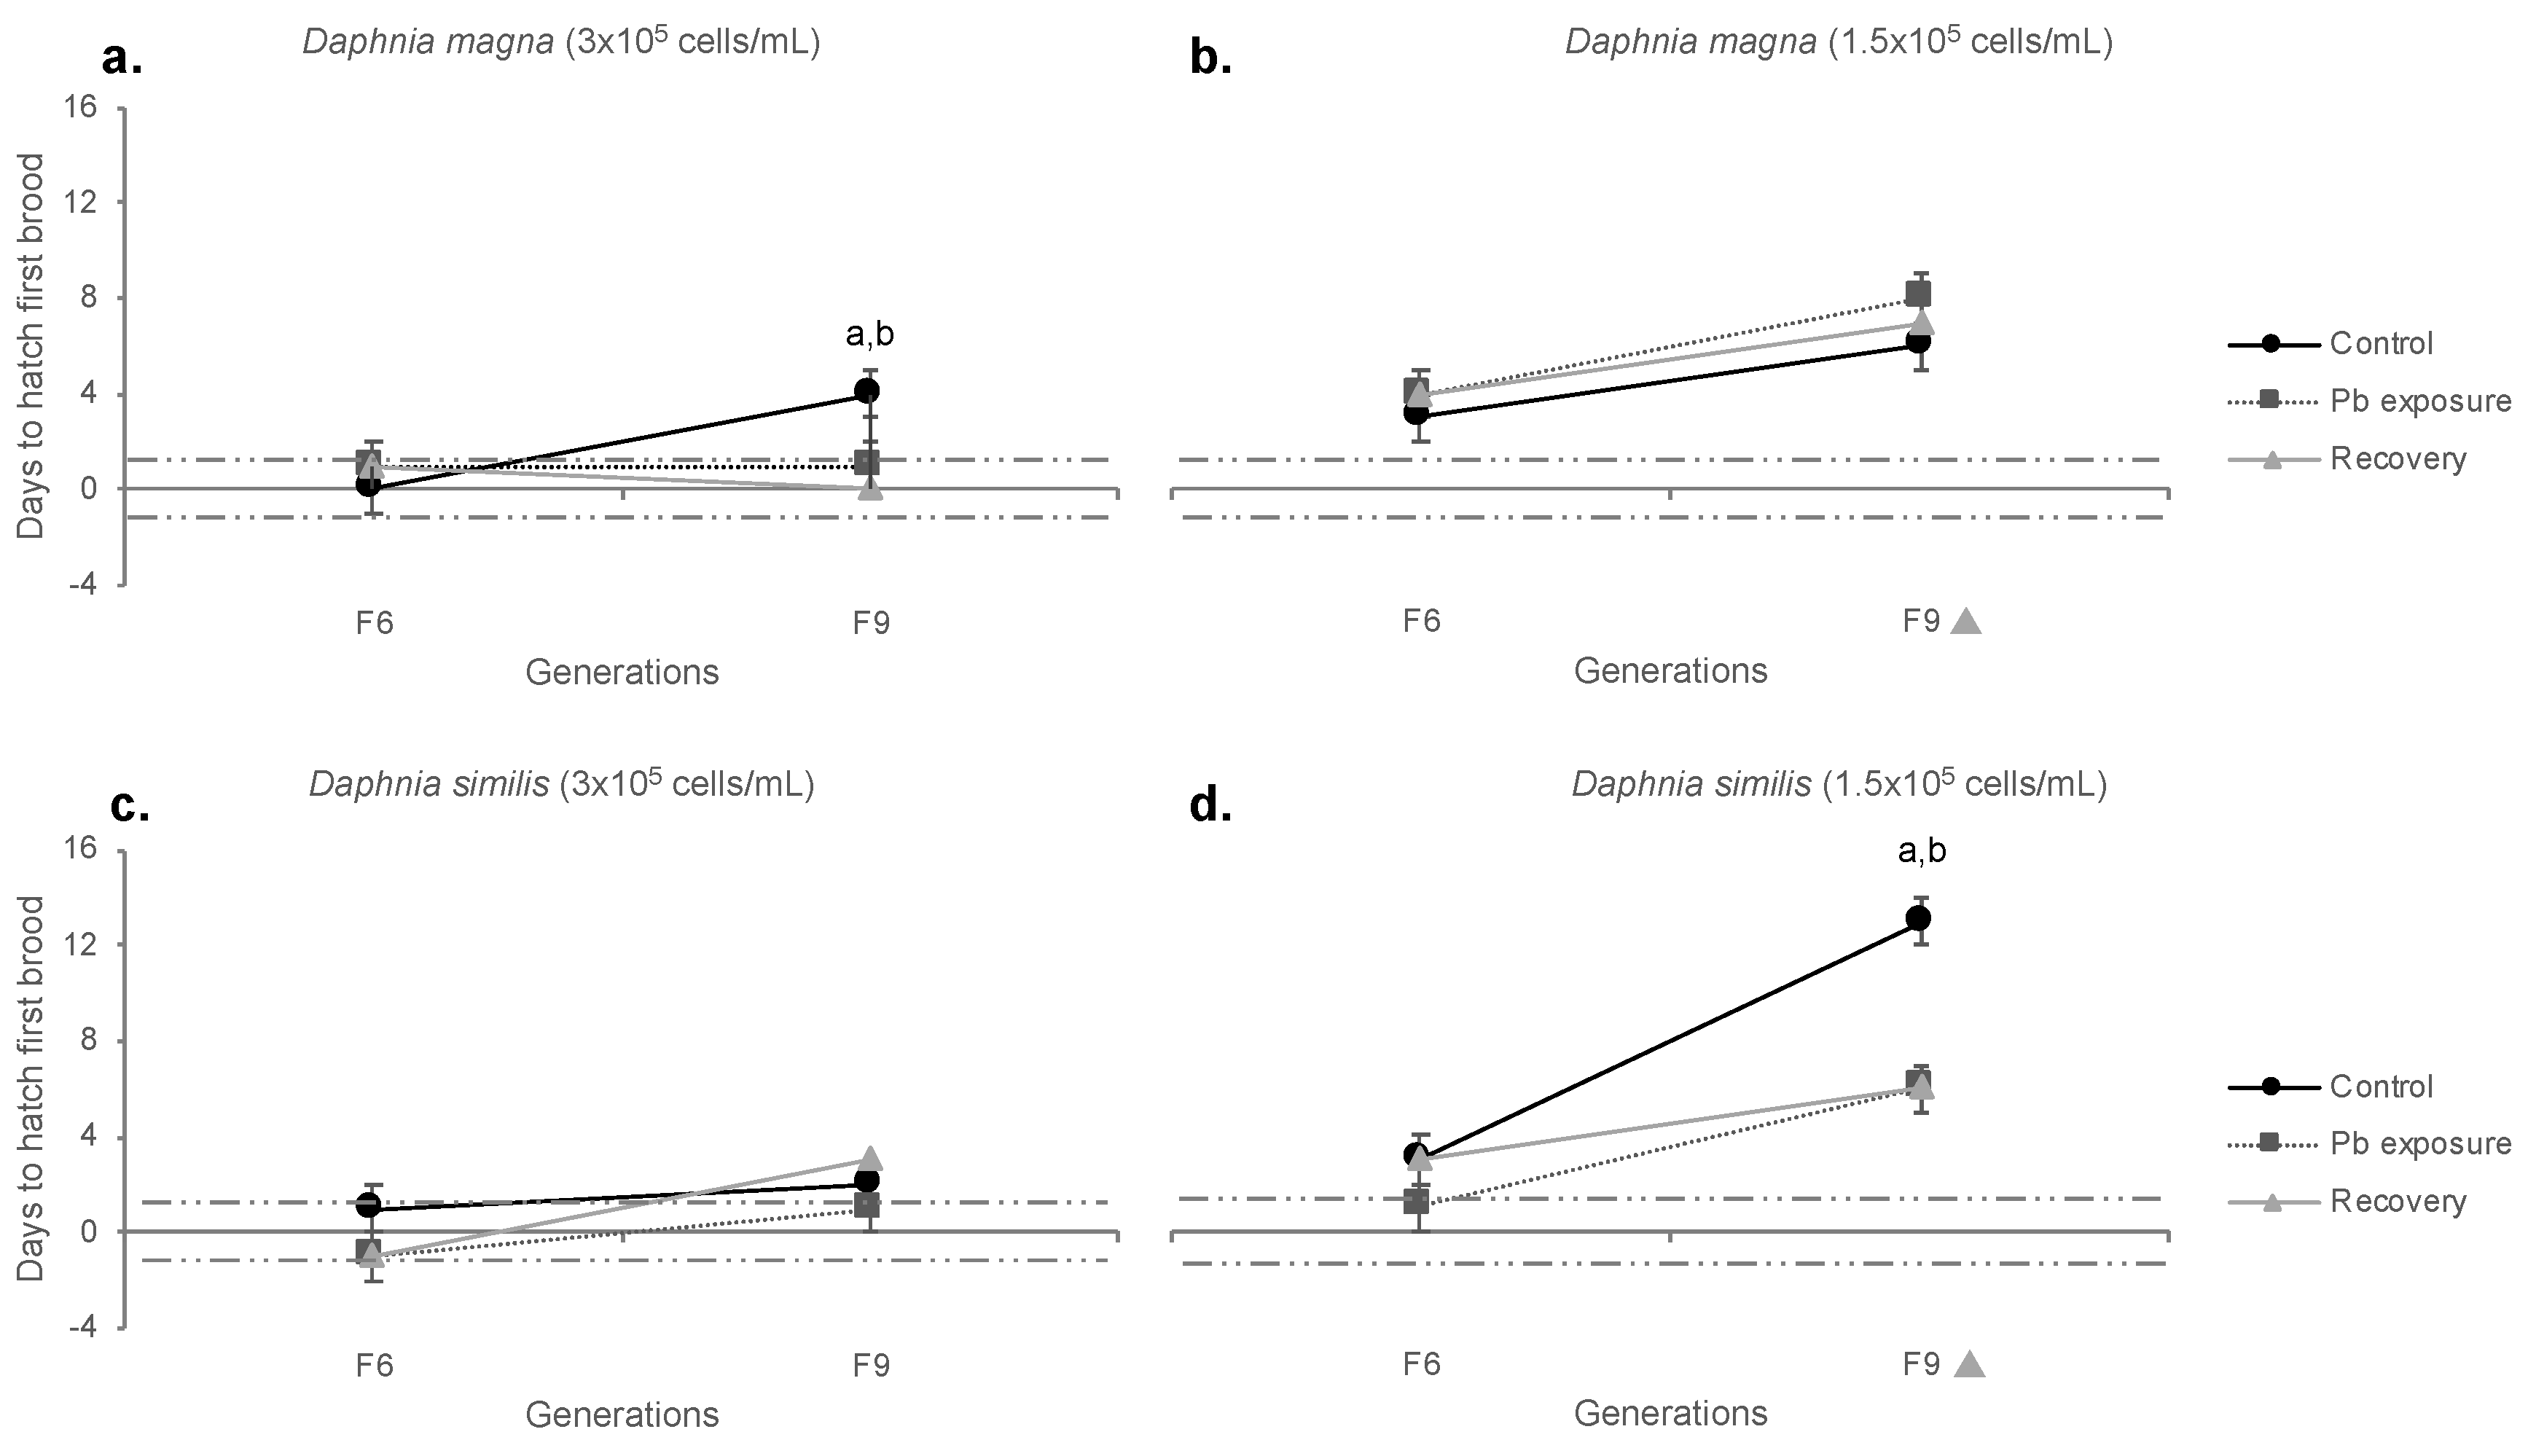
The hatching delay is the difference, in days, that organisms took to give the first brood (N1), compared to F0, and the respective results are detailed in Table S3. Usually, daphnids started producing N1 at the age of eight to ten days (normal conditions); thus, the delayed days were counted from that starting point (time for 1st brood for F0 control organisms, being eight days for D. magna and nine days for D. similis). Neonates from control D. magna (normal food) were delayed at F9, in comparison to F0 and to continuous Pb exposure (Figure 6a). Under food restriction, F9 control and Pb exposed daphnids were delayed compared to F0, but no statistical difference among treatments was shown (Figure 6b).
No difference was shown for D. similis (normal food) regarding F0 or treatments (Figure 6c). Under food restriction, control D. similis gradually delayed hatching through generations, being statistically different (taking longer to hatch) than Pb treatment at generation F9. Both treatments delayed hatching N1 neonates at generation F9 compared to F0 (Figure 6d).
Recovering D. magna (normal food) showed no statistical difference with F0. However, a statistically different (stimulated) reproduction was seen for recovering organisms compared to F9 control (Figure 7a). Under food restriction, the hatching delay of D. magna during the recovery period did not show statistical differences among treatments (control and Pb exposure), reproduction was delayed at F9 in comparison to F0 (Figure 7b). D. similis (normal food) showed no significant variations regarding treatments (control and Pb exposure) or generations (compared to F0) (Figure 7c). Under food restriction, however, recovering organisms presented a delayed reproduction at F9 compared to F0. Among treatments, the 1st reproduction of recovering organisms was similar to that shown by organisms under Pb exposure but differed from F9 control organisms, which presented a significantly delayed reproduction (Figure 7d).

3.5. Lifespan

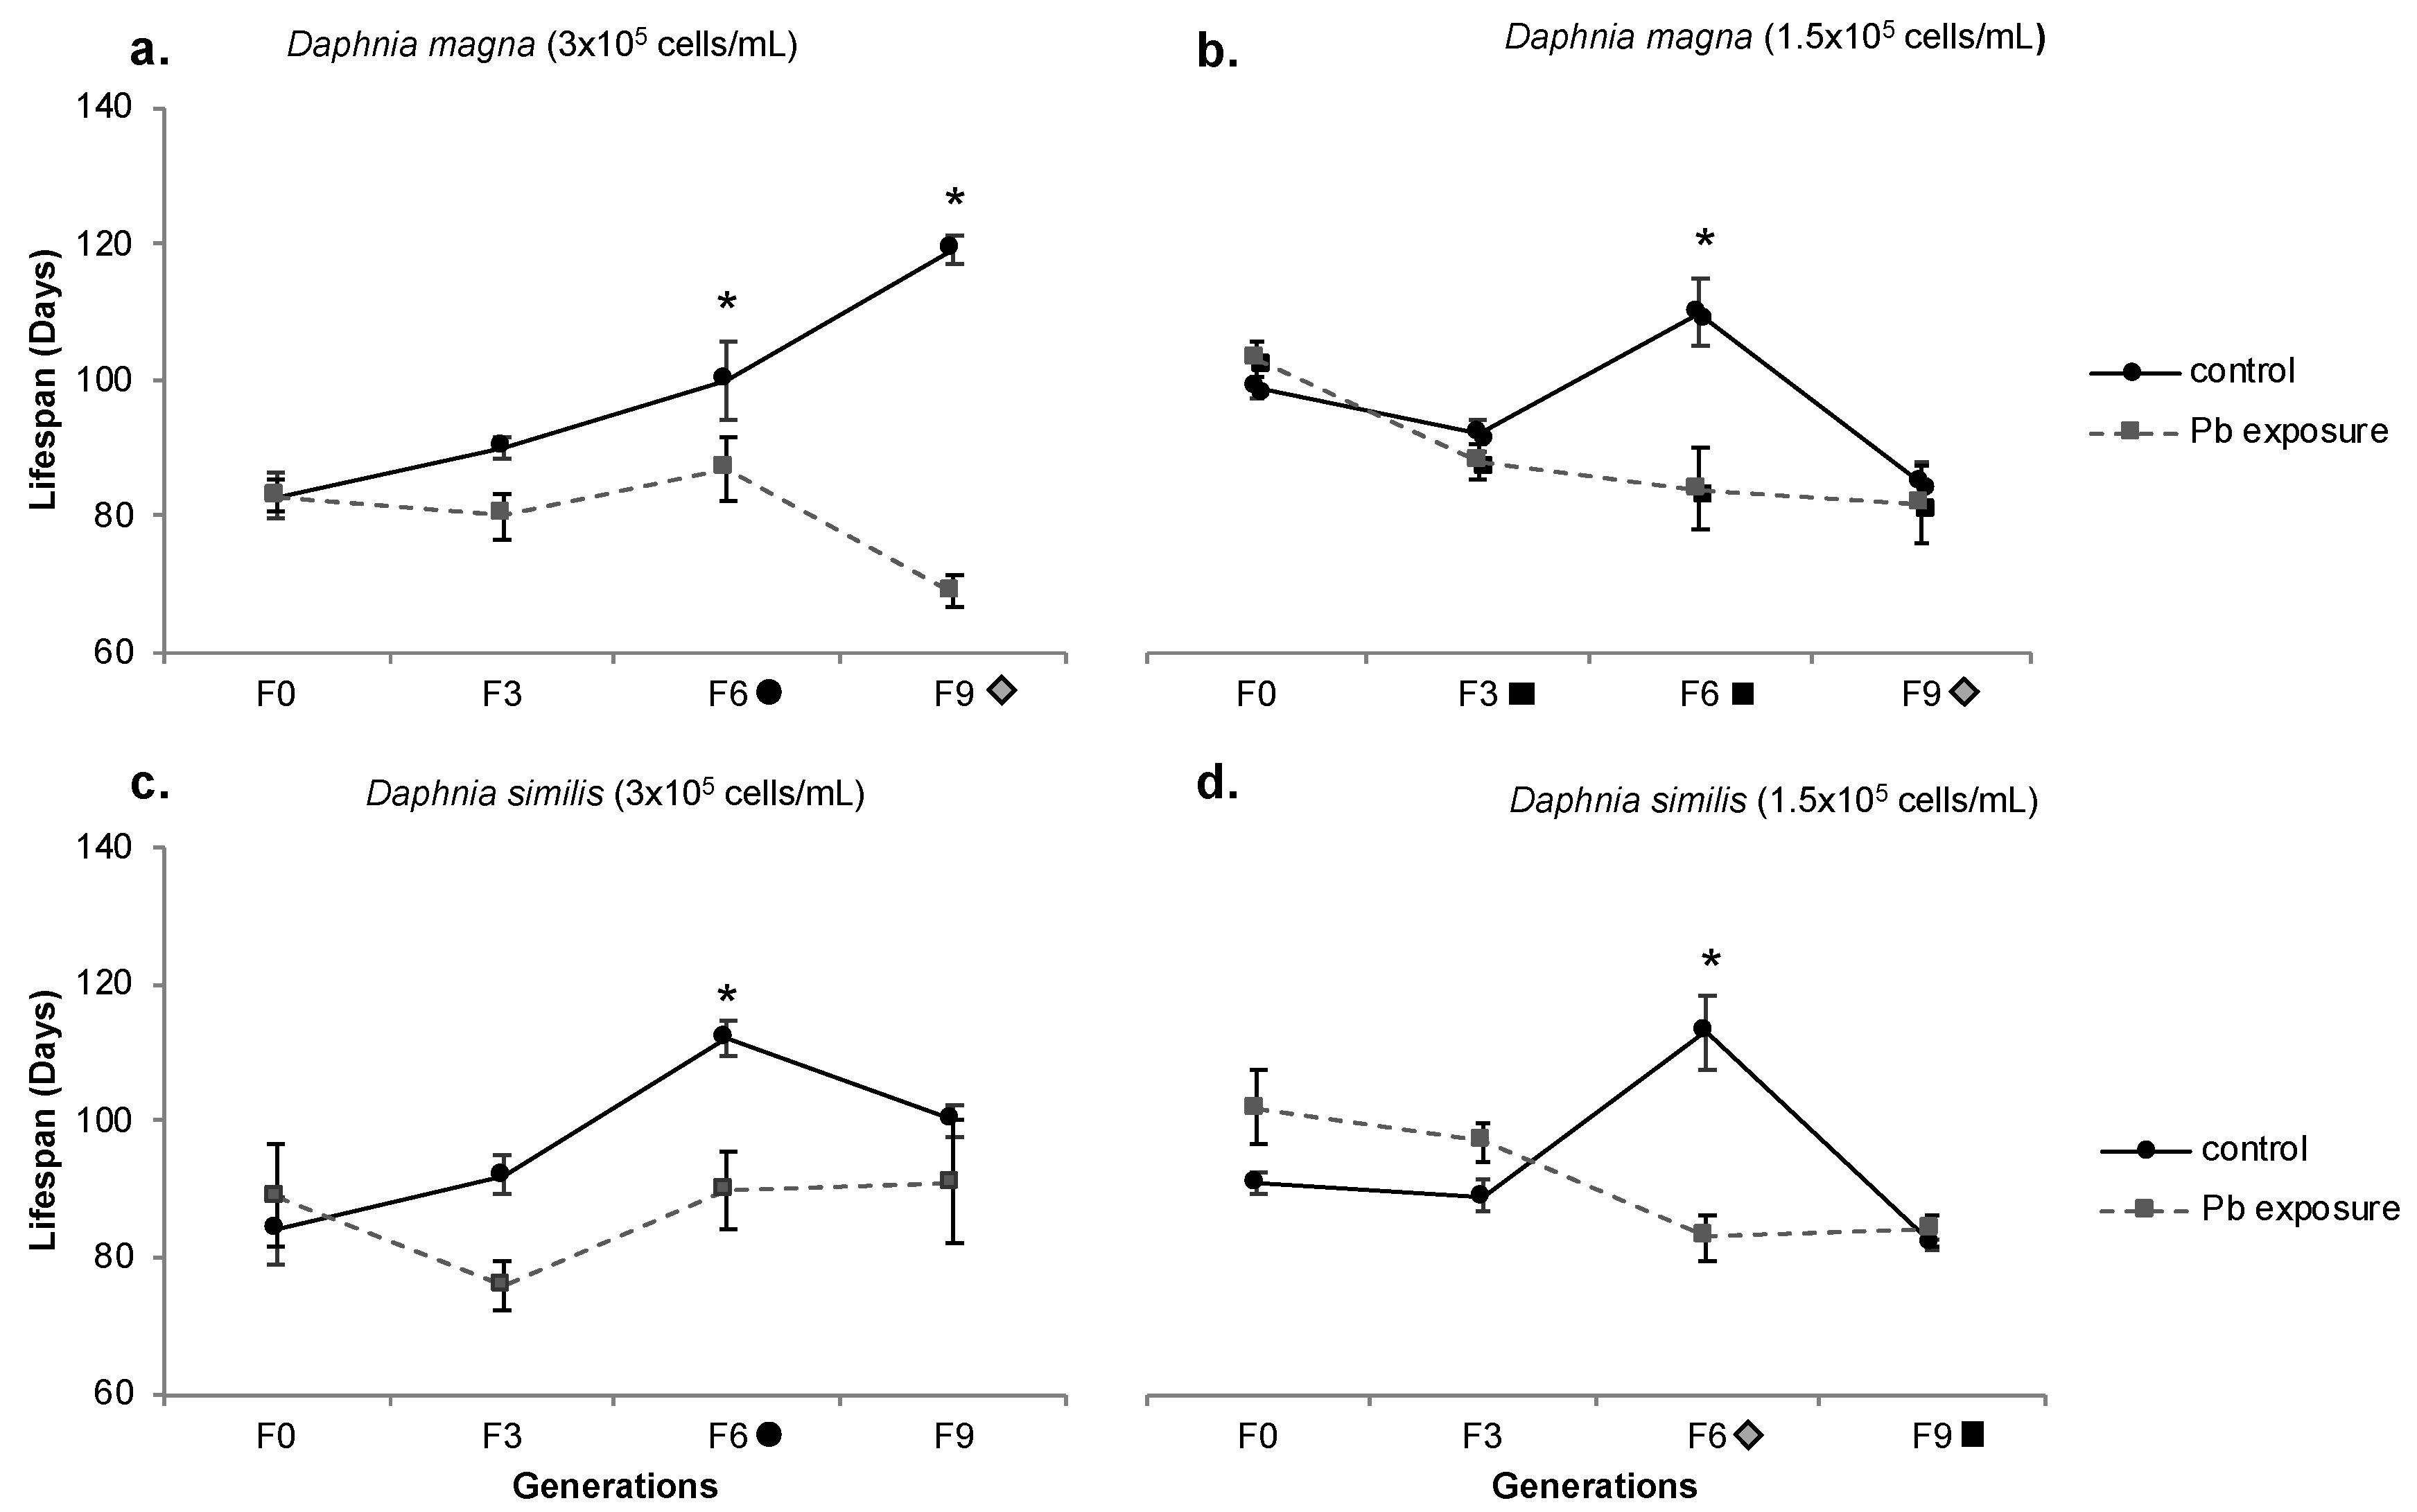
Organisms’ lifespan was investigated to evaluate the effects of Pb exposure on daphnids’ longevity, and the results of statistical analyzes are shown in Table S4. Control D. magna (normal food) reached ages ranging from 83 to 119 days (F0 to F9, respectively), with control organisms from generations F6 (100 d) and F9 (119 d) presenting statistically longer longevity in comparison to F0 (86 d) (Figure 8a). D. magna under continuous Pb exposure had their lifespan significantly reduced from F0 to F9 (from 83 to 69 days, respectively). Pb exposed organisms from F6 and F9 presented statistically shorter lifespans than the respective controls from each generation. Under food restriction, such outcomes varied (Figure 8b). Control organisms presented an enhanced lifespan at generation F6 (110 days), which was higher than that exhibited by organisms from the F6 Pb treatment; however, the lifespan of control organisms decreased (from F6 to F9), presenting similar values as F9 Pb exposed organisms (85 days). F9 control treatment differed statistically (lower) from F0. Continuous Pb exposure exhibited lifespan reduction from F0 through F9 (103 to 82 days, respectively).
Regarding D. similis, control organisms under normal food presented an increased lifespan, ranging from 84 (F0) to 112 (F6) days (Figure 8c). The lifespan of Pb exposed organisms did not exhibit significant variations among generations, considering the group with a normal food regime. Under food restriction (Figure 8d), control organisms showed increased lifespan at F6 (113 days), the only generation significantly different from F0 and Pb exposed organisms. However, Pb treatment reduced the lifespan through generations (From 102 days for F0 to 83 days for F9), being lower than F0 at generations F6 and F9.
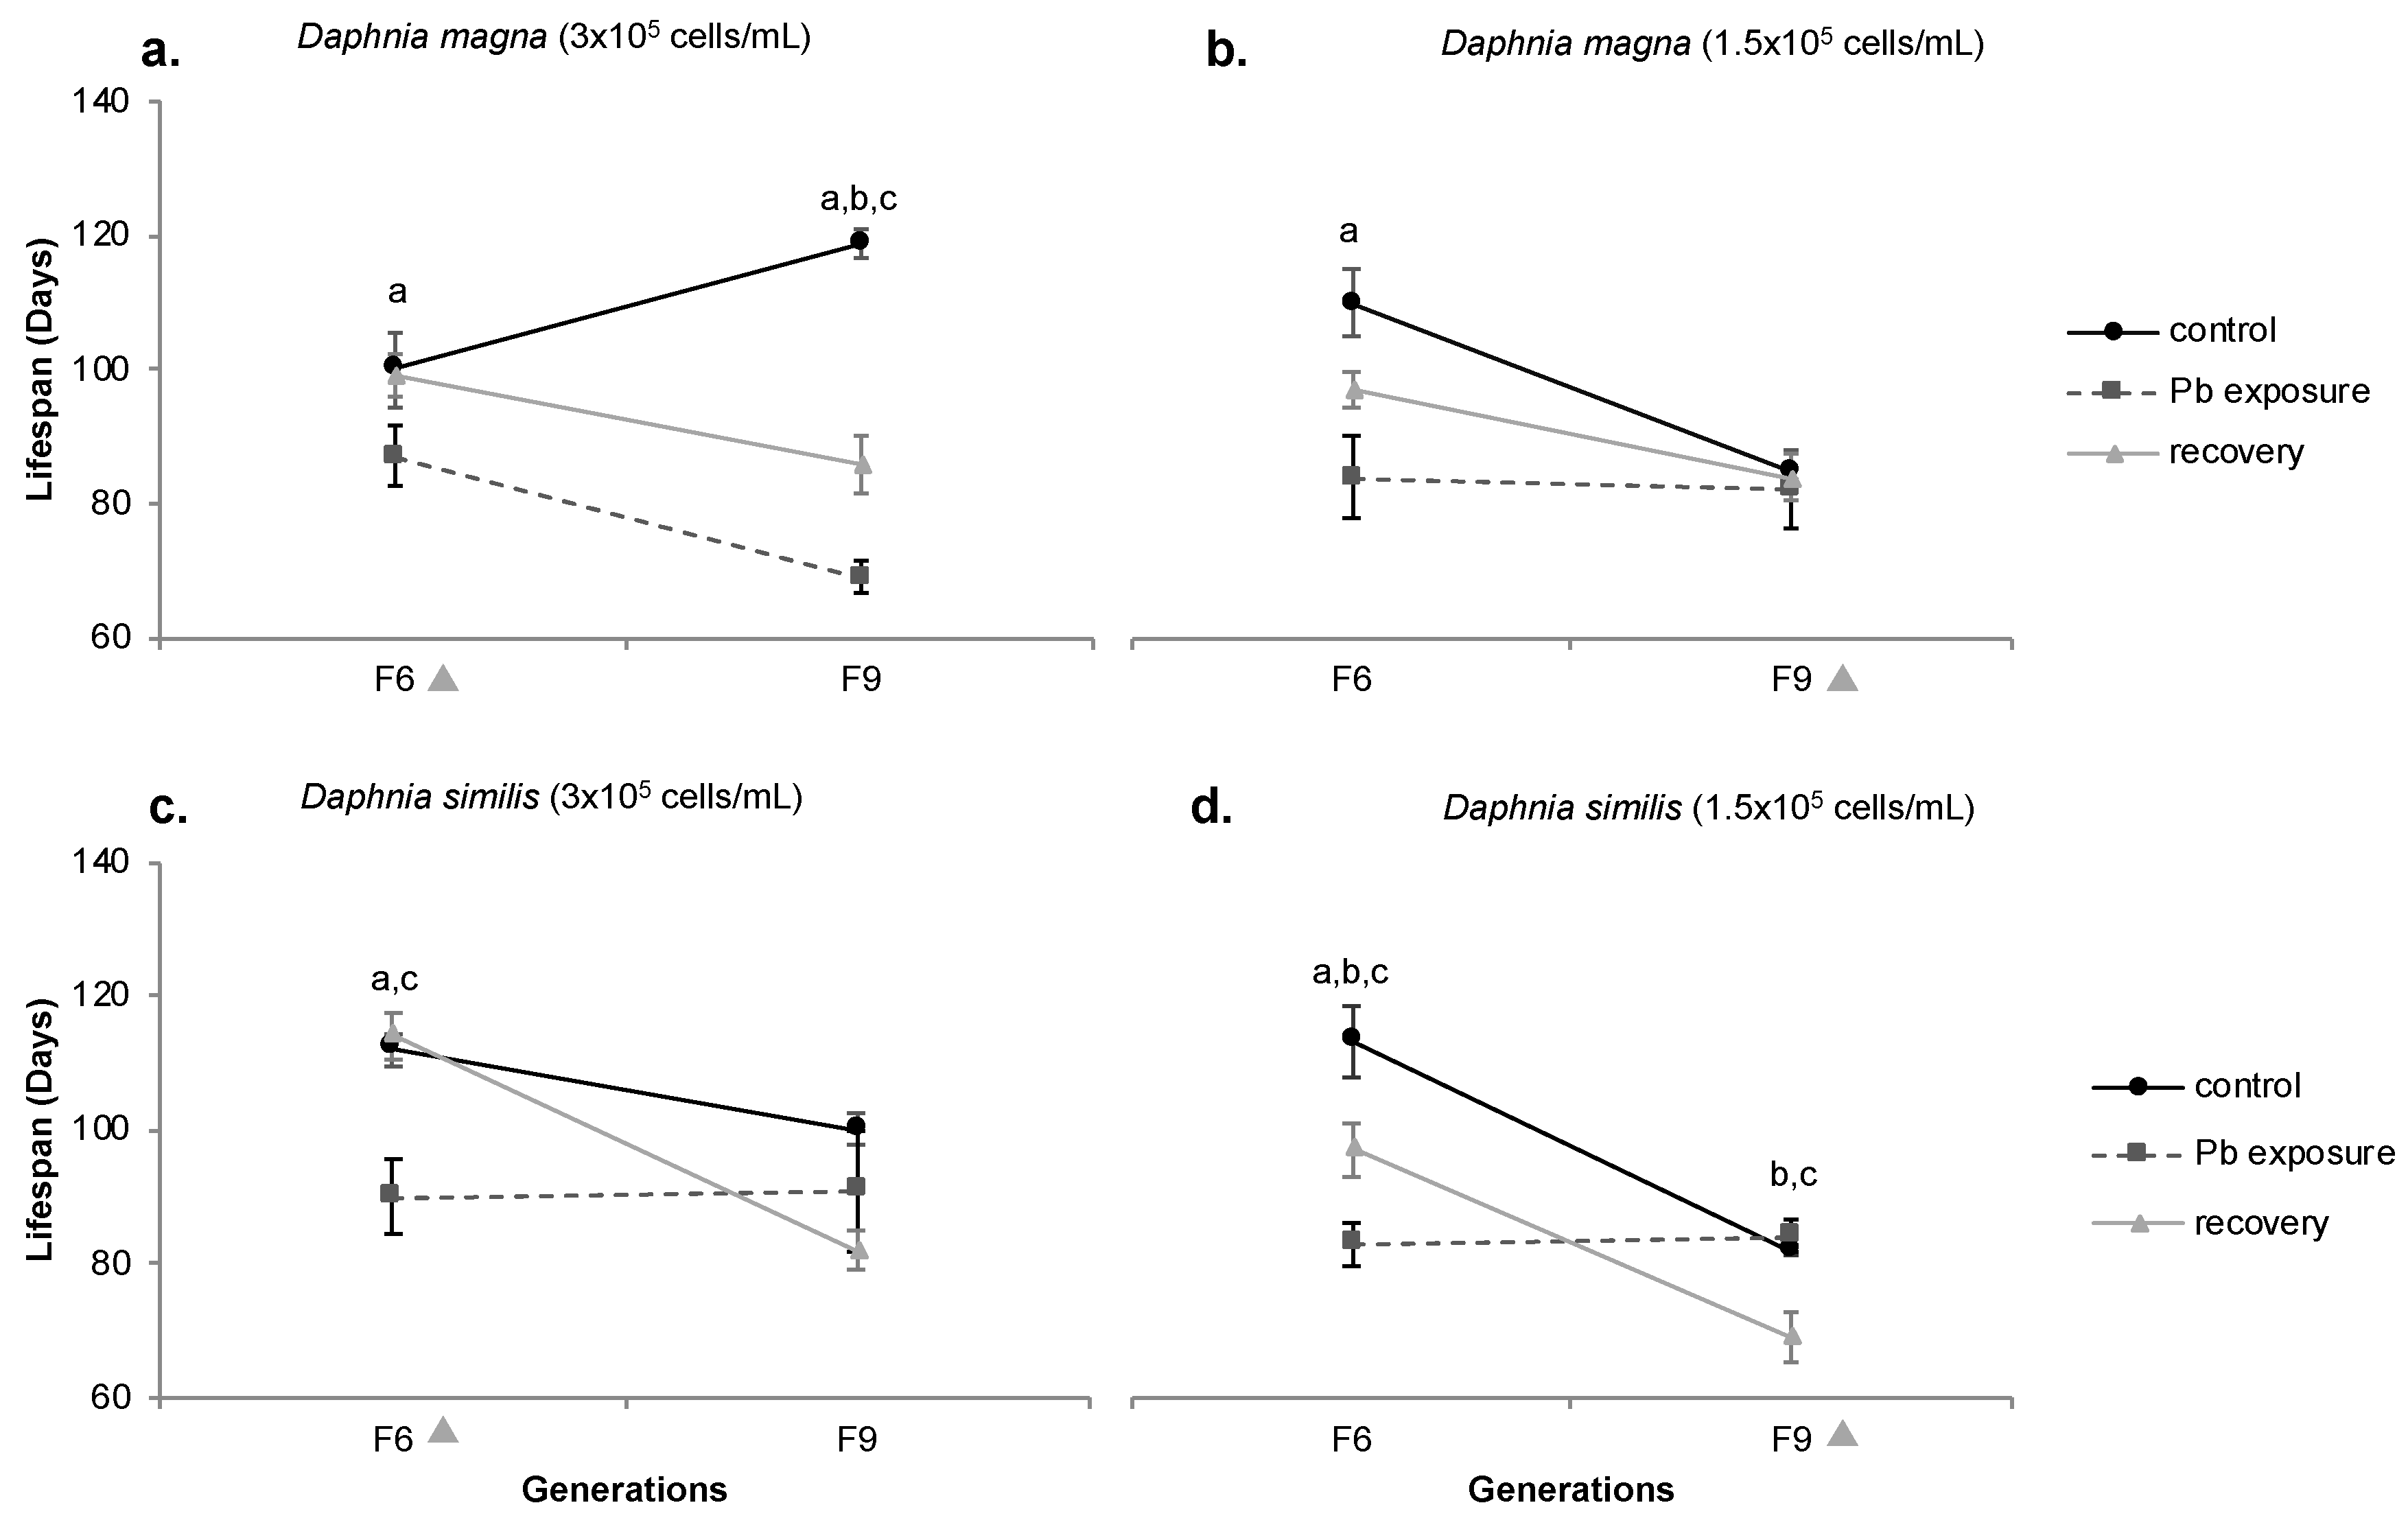
During the organisms’ recovery period, D. magna (normal food) lifespan decreased from 99 (F6) to 86 days (F9); the lifespan of generation F6 was higher than F0 (Figure 9a). Among treatments, the recovery period showed the opposite outcome and the control had a lower lifespan; however, it was still higher than the continuous Pb exposure (F9). Under food restriction, recovery period organisms showed no significant statistical difference towards other treatments (control and Pb exposure). They followed the same pattern as control, exhibiting a decreased lifespan from F6 to F9 (not shown by Pb treatment, which kept stable from F6 to F9). However, a decreased lifespan at generation F9 in comparison to F0 is shown (Figure 9b).
Recovering D. similis (normal food) reduced lifespan from F6 to F9 (114 to 82 days, respectively). At generation F6, recovering D. similis presented a statistically higher lifespan than continuous Pb exposure and F0 organisms (Figure 9c). A similar pattern (reduced lifespan) was shown under food restriction, with values ranging from 97 (F6) to 69 (F9). The recovery period lifespan was statistically shorter than control but longer than that exhibited by Pb treatment at generation F6, being lower than both treatments (control and Pb exposure) and also from F0 at generation F9 (Figure 9d).

3.6. Principal Component Analysis (PCA)

The PCA extracted two factors responsible for the variances (Table 1). Regarding endpoints evaluated, PC1 and PC2 together explained 83.88% of variances. PC1 (56.97% of explained variables) is associated with the hatching delay of both species and food regimes, and also neurotoxicity (AChE activity) under both food regimes and life expectancy (lifespan) under usual food for D. similis. The R0 of both species (both food regimes) indicated a negative (inverse) correlation to PC1, together with the life expectancy of D. magna (food restriction).
In turn, PC2 explained 26.9% of the variables with D. magna responses being related to AChE while D. similis was associated with life expectancy, both under food restriction. A negative association was shown for AChE of D. magna and the hatching delay of D. similis (both under normal food).
Among treatments, the PCA showed that variables from F0 are mainly negatively associated with PC1. F9 control reveals a weak association with PC1, while F9 Pb exposure and recovery period show a positive (more relevant) association with PC1. F9 control positively associates with PC2, while F9 Pb exposure indicates an inverse association.

4. Discussion

4.1. Population effects on control over generations (F0 vs. F9 control)

Comparing generations F0 and F9 control, the F9 control D. magna (normal food) presented lower R0 and delayed hatching, lifespan and AChE activity compared to F0. All endpoint fluctuations observed to D. magna (normal food) when comparing F0 to F9 under control conditions may be considered a natural fluctuation since no variation occurred in exposure conditions. R0 reduction and hatching delay can be linked outcomes [31], as well as late reproduction and increased lifespan (trade-off between reproduction and lifespan) [18]. Reduced R0 and increased lifespan can be related endpoints, where a higher investment in reproduction may enhance oxidative stress, consequently reducing organisms’ lifespan [32,33]. The relationship between enhanced lifespan and AChE activity is known, as the increased enzymatic activity stimulates homeostasis and enhances survival [34]. In humans, AChE activity may increase with age [12] and, in other organisms (such as D. magna), may be linked with high protein content [35]. Natural enzymatic fluctuations have already been shown, and Toumi et al. [36,37] observed different AChE activities among Daphnia strains and a high variability of protein quantities (0.72 to 8.9 nmol/min/mg) among control organisms from the same strain.
An opposite outcome was shown under food restriction, where control D. magna exhibited a reduced lifespan. However, similar results to normal food regime occurred, such as the reduction of R0, delayed hatching, and enhanced AChE activity (F9 compared to F0). The OECD’s quality criteria for control organisms ( > 60 neonates/female) was not achieved under food restriction [14]. Schwartz et al. [38], based on experiments with D. pulex, stated that individuals supplied with larger quantities of food tend to increase reproduction and lifespan, the opposite occurring under food restriction. A moderate calorie restriction enhances lifespan; however, a heavy or long period of food impairment could lead to a reduced lifespan [39]. The increased delay in reproduction shown by normal food regime daphnids (F9 compared to F0) was maintained under food restriction. Frost et al. [40] showed that D. magna delayed reproduction and slowed growth when kept under a poor food experience. Regarding food regimes and neurotoxicity, Toumi et al. [36,37] suggested that, among other factors, the quality and quantity of food may also affect AChE activity.
Differently from the control D. magna, control D. similis (normal food) among generations presented similar results in time as F0 organisms, except for AChE activity (F0 showed lower activities). Since no changes were made in the organisms culturing, the observed AChE fluctuation can be considered natural [36,37]. On the other hand, food restriction affected the D. similis control treatment outcomes among generations; organisms showed reduced R0 and delayed hatching and, as well as usual food, enhanced AChE activity (F9 in comparison to F0). Stige et al. [41] indicated that at high food regime, reproduction starts earlier, and neonates’ growth is enhanced, leading to a higher R0. D. magna and D. similis exhibited similar outcomes under food restriction, except for the decreased lifespan of D. magna. Corroborating with D. similis outcome, D. pulicaria exhibited a lack of lifespan divergence between normal and restricted food [42]. Kim et al. [43] evaluated D. pulex and D. pulicaria, suggesting that daphnids have unique physiological mechanisms to respond to food restriction and that lifespan variations may be genotype-dependent. Regarding enzymatic activity, Xuereb et al. [44] studied the behavioral consequences of AChE inhibition in Gammarus fossarum and suggested a correlation between AChE inhibition and feeding and swimming impairment.
However, both species and food regimes present different outcomes, with D. magna presenting outcome oscillations from F0 to F9, while D. similis shows no variance towards F0 (except for increased AChE activity). Under food restriction, both species showed similar responses for R0 and hatching, as expected in environments with low nutrient resources [45]. However, species diverged regarding lifespan, similar to that observed by [42] for Daphnia pulex (enhanced lifespan in reduced diet) and D. pulicaria (no difference regarding food regime).

4.2. Multi-generation Pb exposure

D. magna continuously exposed to Pb (normal food) triggered a lower R0 and lifespan than F0. However, the R0 of Pb exposed organisms was similar to the control (all generations), indicating that Pb did not cause this increase, and thus it was probably a natural fluctuation. A similar result was found by [46], who observed a lack of effect on D. magna’s reproduction in an eight-generational Cd (60 µg/L) exposure. Gust et al. [47] observed that the reproduction of D. magna exposed to a concentration of 236 µg/L of Pb was not affected either at low (1.8 × 10⁵ cells/mL) or high (3.6 × 10⁵ cells/mL) food concentration (R. subcapitata); however, they observed that the organisms fed with fewer quantities of algae produced fewer neonates. Nevertheless, continuous Pb exposure reduces organisms’ lifespan (control higher than Pb treatment at generations F6 and F9) and induces early reproduction. Low-level toxicity can reduce lifespan, and this may trigger an early reproduction investment [48], i.e., selecting individuals who start reproducing earlier; a similar result was reported by [49], as D. magna maintained with high amounts of food was “protected” against Cd exposure, exhibiting early reproduction and larger body size. Reduced lifespan and earlier reproduction of D. magna exposed to low concentrations of chromium and nickel were reported by Coniglio and Baudo [50] and Münzinger [51], respectively.
Reduction of AChE activity was observed in organisms from Pb treatment compared to control and Pb (clean96h) at F9. Decreased AChE activity was found in the mollusk Corbicula sp., the earthworm Eisenia fetida and the fish Brachydanio rerio exposed to Pb [52]. A recovery of AChE activity in D. magna after exposure to insecticides was reported [34], and in the Atlantic salmon (Salmo salar) exposed to fenitrothion [53], the crabs Barytelphusa guerini exposed to chlorpyrifos [54], and the freshwater shrimp Paratya australiensis exposed to profenofos [55].
D. magna from continuous Pb exposure under food restriction showed similar results to Pb exposed organisms kept with normal food regime (decreased R0 and lifespan). However, different outcomes also exhibited delayed hatching and increased AChE activity (Pb exposure compared with F0). Because no differences among treatments were spotted at generation F9 (for any of the evaluated endpoints), such results suggest that Pb exposure did not affect D. magna under food restriction at the experimental concentrations used. As treatments (control and Pb exposure) did not diverge, the condition that varied between F0 and F9 was the food amount. The varying outcomes probably were due to food restriction, which is known for negatively affecting the reproduction of daphnids [23,41,43,56]. AChE activity of control among generations and Pb treatment did not differ, similar to the findings of Guilhermino et al. [8] when studying Cd-exposed D. magna. In our study, food restriction enhanced F9 organisms’ AChE activity (compared to F0).
Pb exposed D. similis (normal food) for generations showed a reduction of R0 and an increase of AChE activity compared to F0. Differently from D. magna, Pb exposed (F9) organisms’ R0 was lower than the F9 control treatment, indicating the effects of Pb on the reproduction of D. similis. Previous studies showed the reproduction impairment of daphnids exposed to Ni in a seven-generation study [51] and Pb [57,58]. The AChE activity of F9 Pb treatment D. similis also presented a different response than that of D. magna, presenting a higher AChE activity for F9 Pb treatment when compared to F9 Pb (clean96h), indicating failed recovery. Printes and Callaghan [59] compared the AChE activity of both D. magna and D. similis and attributed such differences to genotype’s distinctions. Increased AChE activity was also found in the mussel Perna perna exposed to Pb [60], yet fish failed to recover AChE activity after one week in clean medium [53].
Under food restriction, Pb treatment (among generations) D. similis decreased R0 and lifespan and delayed hatching while increasing AChE activity, compared to F0. Unlike normal food D. similis, Pb exposure did not affect R0, similar to the control (all generations). This suggests that the lower reproduction (compared to F0) was due to food restriction, as previously reported to D. similis [61]. Guan and Wang [62] also observed reproduction impairment after six-generation of food restriction and Cd (3 µg/L) exposure. Comparing D. similis with normal and restricted food, it is clear that food quantity influences organisms’ sensitivity to Pb, corroborating similar results obtained for daphnids exposed to Pb [63] and Cd [49]. Regarding hatching delay, F9 control organisms exhibited delayed reproduction compared to F9 Pb treatment, indicating that Pb (combined with food restriction) induced early reproduction. This outcome is contrary to that exhibited by D. magna under food restriction. Pieters and Liess [64] suggested that low maternal food may accelerate the beginning of reproduction. This is an important outcome because organisms from natural ecosystems usually are under food restriction [45], and when this condition is combined with Pb exposure, D. similis starts reproducing early while D. magna presents an opposite response. Thus, using D. magna (temperate model species) to estimate D. similis (tropical) response to chemicals and vice-versa may not be appropriate. Despite the difference between generations, F9 Pb exposure lifespan and AChE did not differ from F9 control, indicating that the decreased lifespan and enhanced AChE activity probably was due to food restriction. Chandini [45] observed a reduction of daphnids’ lifespan after Cd exposure combined with food restriction, while other authors reported diminished lifespan of organisms under food restriction [38,42,43].

4.3. Recovery from chemical exposure

Recovering D. magna (normal food) presented lower R0 and higher AChE activity than F0 organisms. However, R0 in recovering organisms did not differ from control or Pb treatments (F9), indicating a natural fluctuation, as previously stated in this study. The hatching delay of recovering D. magna was similar to Pb treatment but lower than control (F9), suggesting an accelerated reproduction of pre-exposed organisms (failed recovery). A similar result was observed by Agra et al. [65], who found that mine drainage resistant D. longispina started reproducing earlier under Cu exposure. The recovery period lifespan reached an intermediary value between F9 control and Pb exposure, suggesting that the recovery period was not long or effective enough to achieve control conditions. Reduced lifespan of daphnids due to chemical exposure was previously reported to methylmercury [66], Zn and Cu [67] and Cd [45] exposure. Regarding the recovery period, Schultz et al. [68] found a concentration-dependent lifespan reduction of nematodes (Caenorhabditis elegans) exposed to Ag and Ag-nanoparticles. Also, they stated that the responses were more closely related to the last exposed generation than the control, as happened for D. magna in this study.
Organisms can adapt to chemical exposure through physiological acclimation or genetic adaptation. Recovering organisms exhibiting outcomes that diverge from control may indicate genetic adaptation. The difference between genetic adaptation or physiological acclimation is that when organisms genetically adapt to a chemical exposure, they do not recover similarly to control (or to the condition exhibited previously to the exposure). At the same time, when they physiologically acclimate, a full recovery is shown, and outcomes tend to be similar to control and the conditions prior to the exposure [69].
Enhanced AChE activity was shown by recovering D. magna (higher than F9 Pb and Pb (clean96h) treatments. F9 control and Pb (clean96h) presented similar enzymatic activity, indicating that the organisms can recover after 96 h in a clean medium. However, recovering D. magna (three generations in clean medium) presented the highest AChE activity, which was statistically different from F9 Pb and Pb (clean96h) and not from F9 control; this suggests that time has a crucial role when it comes to organisms’ depuration. Morgan et al. [53] evaluated AChE of fish and observed that recovery started one week after the end of the chemical exposure, and fully recovery occurred after six weeks in a clean medium.
Under food restriction, recovering D. magna had lower R0 and lifespan, delayed hatching, and higher AChE activity compared to F0. Although endpoints differ between generations, no statistical difference was shown among treatments. Thus, such variations were probably caused by the food restriction, as discussed in this paper. Food restriction also affected R0, lifespan [23,43] and caused delayed reproduction [41].
In turn, recovering D. similis (normal food) endpoints were similar to F0 organisms (and F9 control treatment). R0 of recovering D. similis was higher than F9 Pb treatment and similar to F9 control, indicating that organisms could recover. The enhanced R0 of recovering organisms (compared to F9 Pb treatment) could compensate for the Pb pre-exposure [19]. Daphnia recuperation is time and chemical concentration dependent, and successful recovery was already reported in other studies [70,71]. The enzymatic activity of recovering D. similis was lower than F9 control and Pb treatments; however, it was similar to Pb (clean96h), indicating that organisms did not fully recover for AChE activity, as previously shown in the literature [7,53]. A significant highlight is that F9 control and Pb treatments did not diverge for AChE activity while recovering organisms (both Pb (clean96h) and recovery period) presented lower AChE activity. Such results indicate a divergence of recovering process among D. similis and D. magna (enhanced AChE activity than Pb (clean96h)).
On the other hand, under food restriction, D. similis from the recovery period presented similar results as D. magna (reduced R0 and lifespan and delayed hatching) compared to F0. Although the R0 of recovering organisms was decreased compared to F0, it did not differ from F9 control nor Pb treatment, probably due to food restriction. Reduced reproduction and lifespan due to food restriction on recovering organisms were previously shown in the literature [31,38,40]. The hatching delay of recovering D. similis was similar to F9 Pb treatment; both presented an accelerated reproduction compared to F9 control. As previously reported for other metals, food restriction and Pb exposure resulted in a shorter lifespan for D. similis (compared to F9 control and Pb treatments) [48,50,51].

4.4. Principal Component Analysis (PCA) evaluation

The PCA confirmed the results obtained for the individual variables. F0 variables presented opposite trends than F9 treatments (control, Pb and recovery period). Such an outcome was demonstrated by the inverse correlations to PC1 (F0 negative and F9 positive). This result evidences the crucial effect of food restriction on daphnids for many generations since all treatments from F9 (including control) diverged from generation F0.
As previously discussed, R0, hatching delay, lifespan and AChE activities of both species under food restriction differed in F0 from F9 (control, Pb and recovery period), except for the lifespan of D. magna (F9 control) and the AChE of D. similis (F9 Pb (clean96h) and recovery period). According to the PCA, it can be inferred that generation F0 indicated a higher association with R0 while F9 Pb exposure and recovery period indicated an association with hatching delay (both species) and AChE of D. similis.
The inverse association of PCA regarding reproductive outputs (R0 and hatching delay) of both species and food regimes may be due to an association of low R0 to delayed reproduction, indicating that the number of neonates produced (from brood N1 to N5) was reduced when females delayed reproduction, as previously discussed. The survival expectancy of both species was also associated with reproductive outputs (with hatching delay for D. similis and R0 for D. magna), as well as the AChE activity of D. similis, which related to reproductive outputs (at both food regimes) and survival expectancy (normal food). Diminished R0 was related to increased AChE activity, similar to D. magna exposed to the insecticide Guadipyr [72].

4.5. Daphnia magna vs. Daphnia similis

Food restriction triggered similar reproductive outputs on both species (decreased R0 and reproduction delay). However, both species differ regarding lifespan (F9 control), with D. magna reducing its lifespan while D. similis was unaffected for this endpoint. Regarding F9 Pb exposure, both species were affected, with D. magna exhibiting a more evident response; Pb exposed D. similis, in turn, had reduced R0 (compared to F9 control). Under food restriction, both species showed similar responses (shorter lifespan) and only diverged for the hatching delay, as Pb induced D. similis reproduction. The recovery period (normal food) presented many disparities between species. D. similis R0 was fully recovered, indicating a physiological acclimation. On the other hand, D. magna seemed to have genetic adaptation, as this species presented early reproduction (as well as Pb treatment) and a failed recovery. Both species also differed regarding AChE activity: D. magna was able to recover (similar to F9 control but higher than Pb and Pb (clean96h)), while the AChE activity of D. similis failed to recover after three generations. Under food restriction, the recovery process of D. magna showed no divergence among treatments for all endpoints evaluated, indicating that all the observed responses were due to food restriction. D. similis, however, showed shortened lifespan after Pb exposure and accelerated reproduction, indicating a failed recovery (genetic adaptation). Therefore, this study shows that some caution should be taken when using daphnids of different regions (temperate and tropical) to establish sensitivity to pollutants since differences were observed between D. similis and D. magna. Further investigation (bioaccumulation, epigenetics and gene expression) should be accomplished to reassure the physiological or genetic element of organisms’ recovery process.

Supplementary Materials

The following supporting information can be downloaded at the website of this paper posted on Preprints.org. Table S1: Two-way ANOVA results testing for effects of treatments (Control, Pb exposure and recovery period) and among generations (F0 to F9) of both Daphnia magna and Daphnia similis and their interaction regarding the acetylcholinesterase activity (AChE). Indicating the sum-of-squares (SS), degrees of freedom (DF), mean squares (MS), the F ratio (F) and the p value (α < 0.05). Table S2: Two-way ANOVA results testing for effects of treatments (Control, Pb exposure and recovery period) and among generations (F0 to F9) of both Daphnia magna and Daphnia similis and their interaction regarding the Net Reproductive Rate (R0). Indicating the sum-of-squares (SS), degrees of freedom (DF), mean squares (MS), the F ratio (F) and the p value (α < 0.05). Table S3: Two-way ANOVA results testing for effects of treatments (Control, Pb exposure and recovery period) and among generations (F0 to F9) of both Daphnia magna and Daphnia similis and their interaction regarding hatching delay. Indicating the sum-of-squares (SS), degrees of freedom (DF), mean squares (MS), the F ratio (F) and the p value (α < 0.05). Table S4: Two-way ANOVA results testing for effects of treatments (Control, Pb exposure and recovery period) and among generations (F0 to F9) of both Daphnia magna and Daphnia similis and their interaction regarding lifespan. Indicating the sum-of-squares (SS), degrees of freedom (DF), mean squares (MS), the F ratio (F) and the p value (α < 0.05).

Author Contributions

Conceptualization, G.A., A.S., D.A. and S.L.; methodology, G.A. and A.F.; validation, G.A.; formal analysis, G.A., D.A. and S.L.; investigation, G.A.; resources, A.S. and S.L.; data curation, G.A.; writing—original draft preparation, G.A.; writing—review and editing, D.A. and S.L.; supervision, S.L., A.S. and D.A.; funding acquisition, S.L. and A.S. All authors have read and agreed to the published version of the manuscript.

Funding

The study was supported by the project RePulse—Responses of Daphnia magna Exposed to Chemical Pulses and Mixtures Throughout Generations (FCOMP-01-0124-FEDER-019321; Refª. FCT PTDC/AAC-AMB/117178/2010) from FCT/MCTES through national funds (PIDDAC), and the co-funding by the FEDER, within the PT2020 Partnership Agreement and Compete 2020. It also received financial support through CESAM by FCT/MCTES (UIDP/50017/2020+UIDB/50017/2020+LA/P/0094/2020), through national funds. Giuliana Araujo received a Ph.D. grant from the Brazilian National Council for Scientific and Technological Development (CNPq, 201788/2014-4). Denis Abessa thanks CNPq (grant No. 311609/2014-7).

Institutional Review Board Statement

Ethical review and approval were waived for this study because the experiments were conducted with aquatic invertebrates, which do not require authorization to be used.

Data Availability Statement

Original data of this investigation can be accessed by author’s request.

Acknowledgments

In addition to the funding agencies and institutions, the authors thank the support from the PhD program Biology and Ecology of Global Change from the Department of Biology, University of Aveiro, Portugal.

Conflicts of Interest

The authors declare no conflict of interest.

References

  1. Gandhi, S.A. The effect of organophosphorous pesticides on acetylcholinesterase activity in Daphnia carinata and Paratya australiensis. A thesis submitted in fulfilment of the requirements for the degree of Master of Science Saikrithika Arunachalam Gandhi Biotechnology. 2010.
  2. Komjarova, I.; Blust, R. Multi-metal interactions between Cd, Cu, Ni, Pb and Zn in water flea Daphnia magna, a stable isotope experiment. Aquat. Toxicol. 2008, 90, 138–144. [Google Scholar] [CrossRef]
  3. Irwin, R.J., 1997. Environmental Contaminants Encyclopedia. National Park Service. Colorado State University. Port Collins, Colorado, USA.
  4. Valavanidis, A.; Vlachogianni, T. Metal pollution in ecosystems. Ecotoxicology studies and risk assessment in the marine environment. Sci. Adv. Environ. Toxicol. Ecotoxicol. Issues. 2010. Available at https://www.researchgate.net/profile/Athanasios-Valavanidis/publication/236623174_Metal_Pollution_in_Ecosystems_Ecotoxicology_Studies_and_Risk_Assessment_in_the_Marine_Environment/links/00b4952fba8bb82bbd000000/Metal-Pollution-in-Ecosystems-Ecotoxicology-Studies-and-Risk-Assessment-in-the-Marine-Environment.pdf (accessed May 23, 2023). /.
  5. Frank, J.J.; Poulakos, A.G.; Tornero-Velez, R.; Xue, J. Systematic review and meta-analyses of lead (Pb) concentrations in environmental media (soil, dust, water, food, and air) reported in the United States from 1996 to 2016. Sci. Tot. Environ. 2019, 694, 133489. [Google Scholar] [CrossRef] [PubMed]
  6. Hashim, R.; Han Song, T.; Zuhartini Md Muslim, N.; Peck Yen, T. Determination of Heavy Metal Levels in Fishes from the Lower Reach of the Kelantan River, Kelantan, Malaysia. Trop. Life Sci. Res., 2014, 25, 21–39. [Google Scholar] [PubMed]
  7. Reddy, G.R.; Basha, M.R.; Devi, C.B.; Suresh, A.; Baker, J.L.; Shafeek, A.; Heinz, J.; Chetty, C.S. Lead induced effects on acetylcholinesterase activity in cerebellum and hippocampus of developing rat. Int. J. Dev. Neurosci., 2003, 21, 347–352. [Google Scholar] [CrossRef]
  8. Guilhermino, L.; Lopes, M.C.; Carvalho, A.P.; Soares, A.M.V.M. Inhibition of acetylcholinesterase activity as effect criterion in acute tests with juvenile Daphnia magna. Chemosphere, 1996, 32, 727–738. [Google Scholar] [CrossRef] [PubMed]
  9. European Parliment. Directive 2008/105/EC of the European Parliament and of the Council of 16 December 2008 on environmental quality standards in the field of water policy, amending and subsequently repealing Council Directives 82/176/EEC, 83/513/EEC, 84/156/EEC, 84/491/EEC. Off. J. Eur. Union, 2008, 84–97. https://doi.org/http://eur-lex.europa.eu/legal-content/EN/TXT/?uri=celex:32008L0105.
  10. Brasil (República Federativa). Resolução CONAMA No 357, de 17 de março de 2005. Dispõe sobre a classificação dos corpos de água e diretrizes ambientais para o seu enquadramento, bem como estabelece as condições e padrões de lançamento de efluentes, e dá outras providências. Ministério do Meio Ambiente, Brasil, DF. 2005.
  11. Tessier, A.J.; Leibold, M.A.; Tsao, J. A fundamental trade-off in resource exploitation by Daphnia and consequences to plankton communities. Ecology, 2000, 81, 826–841. [Google Scholar] [CrossRef]
  12. Wiklund, A.K.E.; Adolfsson-Erici, M.; Liewenborg, B.; Gorokhova, E. Sucralose induces biochemical responses in Daphnia magna. PLoS One. 2014, 9. [Google Scholar] [CrossRef]
  13. OECD. Guideline 202: Daphnia sp., Acute Immobilisation Test. OECD Guidel. Test. Chem. 2004. 1–12.
  14. OECD. Guideline 211: Daphnia magna reproduction test. OECD Guidel. Test. Chem. 2012, Section 2, 23. [CrossRef]
  15. Tanaka, Y.; Nakanishi, J. Chronic effects of p-nonylphenol on survival and reproduction of Daphnia galeata: Multigenerational life table experiment. Environ. Toxicol., 2002, 17, 487–492. [Google Scholar] [CrossRef]
  16. Shaw, J.R.; Colbourne, J.K.; Glaholt, S.P.; Turner, E.; Folt, C.L.; Chen, C.Y. Dynamics of Cadmium Acclimation in Daphnia pulex: Linking Fitness Costs, Cross-Tolerance, and Hyper-Induction of Metallothionein. Environ. Sci. Technol., 2019, 53, 14670–14678. [Google Scholar] [CrossRef]
  17. Bae, E.; Samanta, P.; Yoo, J.; Jung, J. Effects of multigenerational exposure to elevated temperature on reproduction, oxidative stress, and Cu toxicity in Daphnia magna. Ecotoxicol. Environ. Saf., 2016, 132, 366–371. [Google Scholar] [CrossRef] [PubMed]
  18. Dudycha, J.L.; Tessier, A.J. Natural Genetic Variation of Life Span, Reproduction, and Juvenile Growth in Daphnia. Evolution (NY)., 1999, 53, 1744–1756. [Google Scholar] [CrossRef]
  19. Printes, L.B.; Fellowes, M.D.E.; Callaghan, A. Clonal variation in acetylcholinesterase biomarkers and life history traits following OP exposure in Daphnia magna. Ecotoxicol. Environ. Saf. 2008, 71, 519–526. [Google Scholar] [CrossRef] [PubMed]
  20. Rellstab, C.; Spaak, P. Lake origin determines Daphnia population growth under winter conditions. J. Plankton Res., 2009, 31, 261–271. [Google Scholar] [CrossRef]
  21. Tessier, A.J.; Henry, L.L.; Goulden, C.E.; Henri, L.L.; Goulden, C.E.; Durand, M.W. Starvation in Daphnia: Energy reserves and reproductive allocation. Limnol. Oceanogr., 1983, 28, 667–676. [Google Scholar] [CrossRef]
  22. Wacker, A.; Martin-Creuzburg, D. Allocation of essential lipids in Daphnia magna during exposure to poor food quality. Funct. Ecol., 2007, 21, 738–747. [Google Scholar] [CrossRef]
  23. Smolders, R.; Baillieul, M.; Blust, R. Relationship between the energy status of Daphnia magna and its sensitivity to environmental stress. Aquat. Toxicol 2005, 73, 155–170. [Google Scholar] [CrossRef]
  24. ASTM. Methods for Acute Toxicity Tests With Fish, Macroinvertebrates and Amphibians. Ecol. Res. Ser. 2002. EPA-600/3-75-009 96, 61.
  25. Baird, D.J.; Barber, I.; Bradley, M.; Calow, P.; Soares, A.M.V.M. The Daphnia bioassay : a critique. Hydrobiology, 1989, 188, 403–406. [Google Scholar] [CrossRef]
  26. Araujo, G.S.; Pinheiro, C.; Pestana, J.L. Araujo, G.S.; Pinheiro, C.; Pestana, J.L.T; Soares; A.M.V.M; Abessa, D.M.S; Loureiro, S.L. Toxicity of Lead and Mancozeb differs in two monophyletic Daphnia species. Ecotoxicol. Environ. Saf 2019, 178, 230–238. [Google Scholar] [CrossRef]
  27. Araujo, G.S.; Soares, A.; Abessa, D.M.S.; Loureiro, S. Multi-generational effects under single and pulse exposure scenarios in two monophyletic Daphnia species. Sci. Tot. Environ 2019, 697, 134031. [Google Scholar] [CrossRef]
  28. Ellman, G.L.; Courtney, K.D.; Andres Jr., V.; Featherstone, R.M. A new and rapid colorimetric determination of Acetylcholinesterase activity. Biochem. Pharmacol., 1961, 7, 88–95. [Google Scholar] [CrossRef] [PubMed]
  29. Bradford, M.M. A rapid and sensitive method for the quantitation of microgram quantities of protein utilizing the principle of protein-dye binding. Anal. Biochem., 1976, 72, 248–54. [Google Scholar] [CrossRef] [PubMed]
  30. Coen, W.M.; Janssen, C.R. The missing biomarker link : relationships between effects on the cellular energy allocation biomarker of toxicant-stressed daphnia magna and corresponding population characteristics. Environ. Toxicol. Chem., 2003, 22, 1632–1641. [Google Scholar] [PubMed]
  31. Ginjupalli, G.K.; Baldwin, W.S. The time- and age-dependent effects of the juvenile hormone analog pesticide, pyriproxyfen on Daphnia magna reproduction. Chemosphere, 2013, 92, 1260–1266. [Google Scholar] [CrossRef] [PubMed]
  32. Garratt, M.; Mcardle, F.; Stockley, P.; Vasilaki, A.; Beynon, R.J.; Jackson, M.J.; Hurst, J.L. Tissue-dependent changes in oxidative damage with male reproductive effort in house mice. Funct. Ecol., 2012, 26, 423–433. [Google Scholar] [CrossRef]
  33. Speakman, J.R.; Garratt, M. Oxidative stress as a cost of reproduction: Beyond the simplistic trade-off model. BioEssays 2014, 36, 93–106. [Google Scholar] [CrossRef]
  34. Ren, Q.; Zhao, R.; Wang, C.; Li, S.; Zhang, T.; Ren, Z.; Yang, M.; Pan, H.; Xu, S.; Zhu, J.; Wang, X. The Role of AChE in Swimming Behavior of Daphnia magna: Correlation Analysis of Both Parameters Affected by Deltamethrin and Methomyl Exposure. J. Toxicol. 2017, 3265727. [Google Scholar] [CrossRef]
  35. Venkataraman, B.V.; Shetty, P.S.; Joseph, T.; Stephen, P.M. Acetylcholinesterase activity of rat brain and heart in starvation and protein restriction. Indian J. Physiol. Pharmacol., 1985, 29, 123–125. [Google Scholar]
  36. Toumi, H.; Boumaiza, M.; Millet, M.; Radetski, C.M.; Camara, B.I.; Felten, V.; Ferard, J.F. Investigation of differences in sensitivity between 3 strains of Daphnia magna (crustacean Cladocera) exposed to malathion (organophosphorous pesticide). J. Environ. Sci. Heal.—Part B Pestic. Food Contam. Agric. Wastes 2015, 50, 34–44. [Google Scholar] [CrossRef]
  37. Toumi, H.; Boumaiza, M.; Millet, M.; Radetski, C.M.; Felten, V.; Férard, J.F. Is acetylcholinesterase a biomarker of susceptibility in Daphnia magna (Crustacea, Cladocera) after deltamethrin exposure? Chemosphere 2015, 120, 351–356. [Google Scholar] [CrossRef]
  38. Schwartz, T.S.; Pearson, P.; Dawson, J.; Allison, D.B.; Gohlke, J.M. Effects of fluctuating temperature and food availability on reproduction and lifespan. Exp Gerontol., 2016, 86, 62–72. [Google Scholar] [CrossRef] [PubMed]
  39. Zhang, Y.; Hood, W.R. Current versus future reproduction and longevity: a re-evaluation of predictions and mechanisms. J. Exp. Biol., 2016, 219, 3177–3189. [Google Scholar] [CrossRef] [PubMed]
  40. Frost, P.C.; Ebert, D.; Larson, J.H.; Marcus, M.A.; Wagner, N.D.; Zalewski, A. Transgenerational effects of poor elemental food quality on Daphnia magna. Oecologia, 2010, 162, 865–872. [Google Scholar] [CrossRef]
  41. Stige, L.C.; Hessen, D.O.; Vøllestad, L.A. Severe food stress has no detectable impact on developmental instability in Daphnia magna. Oikos, 2004, 107, 519–530. [Google Scholar] [CrossRef]
  42. Latta, C.L.; Frederick, S.; Pfrender, M.E. Diet Restriction and Life-History Trade-Offs in Short- and Long-Lived Species of Daphnia. J Exp Zool A Ecol Genet Physiol. 2011, 315A, 610–617. [Google Scholar] [CrossRef]
  43. Kim, E.; Ansell, C.M.; Dudycha, J.L. Resveratrol and Food Effects on Lifespan and Reproduction in the Model Crustacean Daphnia. J Exp Zool A Ecol Genet Physiol. 2014, 321, 48–56. [Google Scholar] [CrossRef] [PubMed]
  44. Xuereb, B.; Lefèvre, E.; Garric, J.; Geffard, O. Acetylcholinesterase activity in Gammarus fossarum (Crustacea Amphipoda): Linking AChE inhibition and behavioural alteration. Aquat. Toxicol., 2009, 94, 114–122. [Google Scholar] [CrossRef]
  45. Chandini, T. Survival, growth and reproduction of Daphnia carinata (Crustacea: Cladocera) exposed to chronic cadmium stress at different food (Chlorella) levels. Environ. Pollut., 1989, 60, 29–45. [Google Scholar] [CrossRef]
  46. Ward, T.J.; Robinson, W.E. Evolution of cadmium resistance in Daphnia magna. Environ. Toxicol. Chem., 2005, 24, 2341–2349. [Google Scholar] [CrossRef]
  47. Gust, K.A.; Kennedy, A.J.; Melby, N.L.; Wilbanks, M.S.; Laird, J.; Meeks, B.; Muller, E.B.; Nisbet, R.M.; Perkins, E.J. , Daphnia magna’s sense of competition: intra-specific interactions (ISI) alter life history strategies and increase metals toxicity. Ecotoxicology, 2016, 25, 1126–1135. [Google Scholar] [CrossRef]
  48. Roff, D., 2001. Life History Evolution. Encycl. Biodivers. Second Ed. 3, 715–728. [CrossRef]
  49. Heugens, E.H.W.; Hendriks, A.J.; Dekker, T.; van Straalen, N.M.; Admiraal, W. A Review of the Effects of Multiple Stressors on Aquatic Organisms and Analysis of Uncertainty Factors for Use in Risk Assessment. Crit. Rev. Toxicol., 2001, 31, 247–284. [Google Scholar] [CrossRef] [PubMed]
  50. Coniglio, L.; Baudo, R. Life-tables of Daphnia obtusa (Kurz) surviving exposure to toxic concentrations of chromium. Hydrobiologia, 1989, 188–189, 407–410. [Google Scholar] [CrossRef]
  51. Münzinger, A. Effects of Nickel on Daphnia magna during chronic exposure and alterations in the toxicity to generations pre-exposed to Nickel. Wat. Res., 1990, 24, 845–852. [Google Scholar] [CrossRef]
  52. Labrot, F.; Ribera, D.; Denis, M. Saint; Narbonne, J.F. In vitro and in vivo studies of potential biomarkers of lead and uranium contamination: lipid peroxidation, acetylcholinesterase, catalase and glutathione peroxidase activities in three non-mammalian species. Biomarkers, 1996, 1, 21–28. [Google Scholar] [CrossRef] [PubMed]
  53. Morgan, M.; Fancey, L.L.; Kiceniuk, J.W. Response and Recovery of Brain Acetylcholinesterase Activity in Atlantic Salmon (Salmo salar) Exposed to Fenitrothion. Can. J. Fish. Aquat. Sci., 1990, 47, 1652–1654. [Google Scholar] [CrossRef]
  54. Narra, M.R.; Regatte, R.R.; Kodimyala, R. Sub-acute toxicity effects of chlorpyrifos on acetylcholinesterase activity and recovery in the freshwater field crab Barytelphusa guerini. Int. J. Environ. Sci., 2012, 3, 98–107. [Google Scholar]
  55. Abdullah, A.R.; Kumar, A.; Chapman, J.C. Inhibition of acetylcholinesterase in the Australian freshwater shrimp (Paratya australiensis) by profenfos. Envirom.Sci.Technol., 1994, 13, 1861–1866. [Google Scholar]
  56. Pieters, B.J.; Paschke, A.; Reynaldi, S.; Kraak, M.H.S.; Admiraal, W.; Liess, M. Influence of food limitation on the effects of fenvalerate pulse exposure on the life history and population growth rate of Daphnia magna. Environ. Toxicol. Chem., 2005, 24, 2254–2259. [Google Scholar] [CrossRef]
  57. Berglind, R.; Dave, G.; Sjöbeck, M.L. The effects of lead on delta-aminolevulinic acid dehydratase activity, growth, hemoglobin content, and reproduction in Daphnia magna. Ecotoxicol. Environ. Saf., 1985, 9, 216–229. [Google Scholar] [CrossRef]
  58. Biesinger, K.E.; Christensen, G.M. Effects of Various Metals on Survival, Growth, R. eproductiono and Metabolism of Daphnia magna. J. Fish. Res. Bd. Canada, 1972, 29, 1691–1700. [Google Scholar] [CrossRef]
  59. Printes, L.B.; Callaghan, A. Atividade de Acetilcolinesterase em Daphnia: Um Bom Biomarcador de Avaliação Ambiental? J. Brazilian Soc. Ecotoxicol., 2006, 1, 89–92. [Google Scholar] [CrossRef]
  60. Bainy, A.; Medeiros, M.; Di Mascio, P.; Almeida, E. In vivo effects of metals on the acetylcholinesterase activity of the Perna perna mussel’s digestive gland. Biotemas, 2006, 19, 35–39. [Google Scholar]
  61. Pedrozo, C.; Bohrer, M. Effects of culture medium and food quantity on the growth, fecundity and longevity of the cladoceran Daphnia similis Claus. Acta Limnol. Bras., 2003, 15, 43–49. [Google Scholar]
  62. Guan, R.; Wang, W.X. Multigenerational cadmium acclimation and biokinetics in Daphnia magna. Environ. Pollut., 2006, 141, 343–352. [Google Scholar] [CrossRef] [PubMed]
  63. Enserink, E.L.; Kerkhofs, M.J.J.; Baltus, C.A.M.; Koeman, J.H. Influence of food quantity and lead exposure on maturation in Daphnia magna; Evidence for a trade-off mechanism. Funct. Ecol., 1995, 9, 175–185. [Google Scholar] [CrossRef]
  64. Pieters, B.J.; Liess, M. Maternal nutritional state determines the sensitivity of Daphnia magna offspring to short-term Fenvalerate exposure. Aquat. Toxicol., 2006, 76, 268–277. [Google Scholar] [CrossRef] [PubMed]
  65. Agra, A.R.; Soares, A.M.V.M.; Barata, C. Life-history consequences of adaptation to pollution. “Daphnia longispina clones historically exposed to copper.” Ecotoxicology, 2011, 20, 552–562. [Google Scholar] [CrossRef]
  66. Doke, D.; Hudson, S.; Dawson, J.; Gohlke, J. 2017. Effects of early life exposure to methylmercury in Daphnia pulex on standard and reduced food ration. Reprod Toxicol., 2017, 49, 219–225. [Google Scholar] [CrossRef]
  67. Winner, R.W. A comparison of body length, brood size and longevity as indices of chronic copper and zinc stresses in Daphnia magna. Environ. Pollution. Ser. A, Ecol. Biol., 1981, 26, 33–37. [Google Scholar] [CrossRef]
  68. Schultz, C.L.; Wamucho, A.; Tsyusko, O.V.; Unrine, J.M.; Crossley, A.; Svendsen, C.; Spurgeon, D.J. Multigenerational exposure to silver ions and silver nanoparticles reveals heightened sensitivity and epigenetic memory in Caenorhabditis elegans. Proc. R. Soc. B Biol. Sci., 2016, 283, 20152911. [Google Scholar] [CrossRef]
  69. Barata, C.; Markich, S.J.; Baird, D.J.; Taylor, G.; Soares, A.M.V.M. Genetic variability in sublethal tolerance to mixtures of cadmium and zinc in clones of Daphnia magna Straus. Aquat. Toxicol., 2002, 60, 85–99. [Google Scholar] [CrossRef] [PubMed]
  70. Duquesne, S.; Reynaldi, S.; Liess, M. Effects of the organophosphate paraoxon-methyl on survival and reproduction of Daphnia magna: Importance of exposure duration and recovery. Environ. Toxicol. Chem., 2006, 25, 1196–1199. [Google Scholar] [CrossRef] [PubMed]
  71. Li, S.; Sheng, L.; Xu, J.; Tong, H.; Jiang, H. The induction of metallothioneins during pulsed cadmium exposure to Daphnia magna: Recovery and trans-generational effect. Ecotoxicol. Environ. Saf., 2016, 126, 71–77. [Google Scholar] [CrossRef] [PubMed]
  72. Qi, S.; Wang, C.; Chen, X.; Qin, Z.; Li, X.; Wang, C. Toxicity assessments with Daphnia magna of Guadipyr, a new neonicotinoid insecticide and studies of its effect on acetylcholinesterase (AChE), glutathione S-transferase (GST), catalase (CAT) and chitobiase activities. Ecotoxicol. Environ. Saf. 2013, 98, 339–344. [Google Scholar] [CrossRef]
Figure 1. Experimental design of the multi-generation test. F refers to generation and N for brood. Endpoints evaluated are described in each box (Net Reproductive Rate (R0), Hatching delay, Lifespan and Acetylcholinesterase (AChE)). Dark arrows indicate Pb exposure and light colour indicates the recovery period.
Preprints 74873 g001
Figure 2. Acetylcholinesterase activity of Daphnia magna (a,b) and Daphnia similis (c,d) under continuous exposure to negative control (ASTM) and Pb exposure in two different food regimes (3 × 10⁵ and 1.5 × 10⁵ cells/mL). Additionally, Pb (clean96h) daphnids were also assessed and referred to a 96 h exposure to clean media after Pb continuous exposure. Generations in the X axis are marked with a (1) black circle for those statistically different from F0, in the control treatment, (2) a black square for those statistically different from F0, in Pb treatment and (3) a grey diamond for those statistically different from F0 in all treatments (Bonferroni, p < 0.05). Letters indicate the statistical difference between treatments within the same generation, being (a) for Pb vs. control, (d) for Pb vs. Pb (clean96h) and (e) for Pb (clean96h) vs. control (Bonferroni, p < 0.05).
Preprints 74873 g002
Figure 3. Acetylcholinesterase activity of Daphnia magna (a,b) and Daphnia similis (c,d) under continuous exposure to the negative control (ASTM) and Pb, a clean media (Pb (clean96h)) for 96 h after Pb pre-exposure, and in a recovery exposure (3 generations in clean media) after Pb pre-exposure, in two different food regimes (3 × 10⁵ and 1.5 × 10⁵ cells/mL). Generations in the X-axis are marked with a grey triangle when recovery treatment presented a difference from F0 (Bonferroni, p < 0.05). Letters indicate the statistical difference between treatments within the same generation, being (a) for Pb vs. control, (b) for recovery vs. control and (c) for Pb vs. recovery, (d) for Pb vs. Pb (clean96h), (e) for Pb (clean96h) vs. control and (f) for recovery vs. Pb (clean96h) (Bonferroni, p < 0.05). Data presented for control and Pb are the same as in Figure 7, just for comparison.
Preprints 74873 g003
Figure 4. Net Reproductive Rate (R0) of Daphnia magna (a,b) and Daphnia similis (c,d) under continuous exposure to the negative control (ASTM) and Pb, in two different food regimes: 3 × 10⁵ cells/mL (left graphs) and 1.5 × 10⁵ cells/mL (right graphs). Generations shown on the X axis are marked with a (1) black circle for those statistically different from F0, in the control treatment, (2) a black square for those statistically different from F0, in Pb treatment and (3) a grey diamond when all treatments (ASTM, Pb and recovery) presented difference in comparison to F0 (Bonferroni, p < 0.05). Letters indicate the statistical difference between treatments within the same generation, being (a) for Pb vs. control (Bonferroni, p < 0.05).
Preprints 74873 g004
Figure 5. Net Reproductive Rate (R0) of Daphnia magna (a,b) and Daphnia similis (c,d) exposed to control media, Pb continuous exposure, and the recovery period in two different food regimes: 3 × 10⁵ cells/mL (left graphs) and 1.5 × 10⁵ cells/mL (right graphs). Generations in the X axis are marked with a grey diamond when recovery treatment presented a difference from F0 (Bonferroni, p < 0.05). Letters indicate the statistical difference between treatments within the same generation, being (a) for Pb vs. control, (b) for recovery vs. control and (c) for Pb vs. recovery (Bonferroni, p < 0.05). Data presented for control and Pb are the same as in Figure 4, just for comparison.
Preprints 74873 g005
Figure 6. Hatching delay of Daphnia magna (a,b) and Daphnia similis (c,d) under continuous exposure to the negative control (ASTM) and Pb, in two different food regimes (3 × 10⁵ and 1.5 × 10⁵ cells/mL). Generations in the X axis are marked with a (1) black circle for those statistically different from F0, in control treatment and (2) a gray diamond for those statistically different from F0 in all treatments (Bonferroni, p < 0.05). Asterisk (*) indicate the statistical difference between treatments at each generation (Bonferroni, p < 0.05). The dotted line close to the axis determines the standard deviation for F0 control.
Preprints 74873 g006
Figure 7. Hatching delay of Daphnia magna (a,b) and Daphnia similis (c,d) exposed to control media, Pb continuous exposure, and the recovery period under two food regimes (3 × 10⁵ and 1.5 × 10⁵ cells/mL). Generations in the X axis are marked with a grey triangle when recovery treatment presented a difference from F0 (Bonferroni, p < 0.05). Letters indicate the statistical difference between treatments within the same generation, being (a) for Pb vs. control and (b) for recovery vs. control (Bonferroni, p < 0.05). Data presented for control and Pb are the same as in Figure 6, just for comparison. The dotted line close to the axis determines the standard deviation for F0 control.
Preprints 74873 g007
Figure 8. Lifespan of Daphnia magna (a,b) and Daphnia similis (c,d) under continuous exposure to the negative control (ASTM) and Pb, in two different food regimes (3 × 10⁵ and 1.5 × 10⁵ cells/mL). Generations in the X axis are marked with a (1) black circle for those statistically different from F0, in the control treatment, (2) a black square for those statistically different from F0, in Pb treatment and (3) a grey diamond for those statistically different from F0 in all treatments (Bonferroni, p < 0.05). Asterisk (*) indicate the statistical difference between treatments at each generation (Bonferroni, p < 0.05).
Preprints 74873 g008
Figure 9. Lifespan of Daphnia magna (a,b) and Daphnia similis (c,d) exposed to control media and Pb continuous exposure for several generations, and in a recovery exposure (clean media) after Pb pre-exposure, under two food regimes (3 × 10⁵ and 1.5 × 10⁵ cells/mL). Generations in the X-axis are marked with a grey triangle when recovery treatment presented a difference from F0 (Bonferroni, p < 0.05). Letters indicate the statistical difference between treatments within the same generation, being (a) for Pb vs. control, (b) for recovery vs. control and (c) for Pb vs. recovery (Bonferroni, p < 0.05). Data presented for control and Pb are the same as in Figure 8, just for comparison.
Preprints 74873 g009
Table 1. Principal Component Analysis (PCA) integrating Daphnia magna and Daphnia similis endpoints (Net Reproductive Rate (R0), Lifespan, Hatching delay and Acetylcholinesterase (AChE)) exposed to control media and Pb continuous exposure for several generations, and a recovery period (clean media) after Pb pre-exposure, under two food regimes (3 × 10⁵ and 1.5 × 10⁵ cells/mL). A cut-off value of >0.5 was used.
Eigenvalues
Total % of Variance Cumulative %
1 9.116 56.97 56.97
2 4.305 26.90 83.88
Component
PC1 PC2
AChE (D. similis)_restricted 0.995
R0 (D. magna)_restricted −0.961
Lifespan (D. magna)_restricted −0.923
Hatch. delay (D. similis)_restricted 0.914
AChE (D. similis) 0.898
Hatch. delay (D. magna)_restricted 0.892
Lifespan (D. similis) 0.891
R0 (D. similis) −0.888
R0 (D. magna) −0.864
Hatch. Delay (D. magna) 0.683
AChE (D. magna) −0.959
AChE (D. magna)_restricted 0.956
Lifespan (D. similis)_restricted 0.919
Hatch. Delay (D. similis) 0.652 −0.752
Lifespan (D. magna)
R0 (D. similis)_restricted −0.515
Scores
PC1 PC2
F0 −1.428
Control (F9) 1.496
Pb_exposure (F9) 0.785 −0.603
Recovery period (F9) 0.582
Disclaimer/Publisher’s Note: The statements, opinions and data contained in all publications are solely those of the individual author(s) and contributor(s) and not of MDPI and/or the editor(s). MDPI and/or the editor(s) disclaim responsibility for any injury to people or property resulting from any ideas, methods, instructions or products referred to in the content.
Copyright: This open access article is published under a Creative Commons CC BY 4.0 license, which permit the free download, distribution, and reuse, provided that the author and preprint are cited in any reuse.
Prerpints.org logo

Preprints.org is a free preprint server supported by MDPI in Basel, Switzerland.

Subscribe

© 2024 MDPI (Basel, Switzerland) unless otherwise stated