Preprint
Article

Correlation of the Magnetomechancial Coupling and Damping in Fe80Si9B11 Metallic Glass Ribbons

Altmetrics

Downloads

119

Views

45

Comments

0

A peer-reviewed article of this preprint also exists.

This version is not peer-reviewed

Submitted:

29 May 2023

Posted:

30 May 2023

You are already at the latest version

Alerts
Abstract
Understanding of the correlation between the magnetomechancial coupling factors (k) and damping factors (Q^-1) is a key pathway to enhance the magnetomechanical power conversion ef-ficiency in laminated magnetoelectric (ME) composites by engineeringly manipulating the magnetic and mechanical properties of Fe-based amorphous metals. The k and Q^-1 factors of FeSiB amorphous ribbons annealed in air at different temperatures are investigated. It is found that k and Q^-1 factors are affected by both magnetic and elastic properties. The magnetic and elastic properties are equalized in terms of the magnetomechanical power efficiency for the low temperature annealing. The k and Q^-1 of FeSiB-based epoxied laminates with different stacking numbers show that the -3 dB bandwidth and Young’s modulus are equalized in terms of the magnetomechanical power efficiency for the high lamination stacking.
Keywords: 
Subject: Chemistry and Materials Science  -   Electronic, Optical and Magnetic Materials

1. Introduction

The contradiction between human needs and technology development is still outstanding in the society of 21st century. This is due to the change of the life values with the evolution of our emotional resonance after the Cold War—we pursue a world of diversity and harmony instead of a homogeneous living environment. A high-quality development is not only the abundance in materials, but the related cost is also tremendously considered, which includes the harmfulness to the environment and human morality. The UN’s sustainable development goals (SDGs) initiates the “responsible consumption and production” (SDG12) with a low carbon lifestyle [1,2]. It is implied that the R&D in highly efficient materials, devices and system is an emergency issue for nowadays [1,2].
The functionality of devices and systems are usually based on the exploration of the energy conversion in the materials that constitute those devices and systems. Thus, the energy in the transaction materials converts from one form to another to transmit the information and/or transport the power. To develop a material with high energy conversion efficiency requires balancing two or multiple parameters in it, as the relevant parameters in a material usually have impacts on each other in an extent degree [3]. To keep a parameter unchanged and balance the other parameters is normally unreasonable, it is even more struggling to balance two main parameters in some energy-converting materials. Specifically, the magnetomechancial power conversion efficiency (h) in magnetostrictive materials is based on two mutually exclusive but relative parameters—the magnetomechancial coupling coefficient (k) and damping factor (Q-1) [4,5]. The two factors are concomitant in most of the magnetomechancial transduction materials. For example, the traditional annealing procedure usually causes the relative change in k and Q-1 factors, this implies a dwarfed h value [3,5]. To enhance the efficiency a step forward, it is needed to further clarify the correlation in the variations between k and Q-1 and to disrupt the fatal causality between the two factors.
The k factor quantifies the ratio between the magnetic-to-mechanical energy conversion and the energy storage ability over a period in magnetostrictive devices [6,7]. The Q factor, a reciprocal of the damping factor, is another important parameter that quantifies the ratio between the power storage and the power loss [7,8]. The two factors can be used to characterize the magnetomechanical properties in Fe-based amorphous alloys that are ferromagnetic metallic glasses with good magnetic and magnetomechanical properties[4]. One of the recent applications of high efficiency Fe-based amorphous alloys have been whispered to the magnetoelectric (ME) laminated composites that contains the ferromagnetic glassy metals and the piezoelectric layers[3]. The ME composites have been recognized as one of the most promising candidates for practical applications in many devices due to their much higher ME coupling than single-phase materials [9,10,11]. The relevant applications include the magnetic field sensors, the radio signal processing devices, the novel magnetic memory elements and the autonomous power sources [12,13,14,15].
The magnetic and mechanical properties of the amorphous alloys are essential parameters to achieve high performance for their utilizing in ME composites. To optimize the magnetomechanical properties of metallic glassy ribbons in such devices, the heat treatment has been investigated to adjust both magnetic properties and mechanical properties [4,16,17,18]. The influence of annealing on the magnetic properties of Fe-based amorphous ribbon have been vastly studied. The annealing procedure can adjust the saturation magnetic flux density (Bs), coercivity (Hc), permeability (μr), k, Q and h factors, but the variation of these parameters is rarely independent [3,4,8,19,20,21,22,23,24,25,26,27,28,29,30,31,32,33,34,35,36,37,38]. Thus, a huge room has been reserved for the researchers to cooperatively elevate two or multiple parameters while causing the least negative impact. In this study, the influence of heat treatment on the magnetomechancial properties for FeSiB amorphous ribbons is investigated. The correlation of k and Q (or Q-1) factors of such ribbons that were annealed at temperatures far below the crystallization temperature is discussed. The magnetic properties and magnetomechancial properties in the single-foil ribbons and epoxy-ribbon laminates are also measured and compared in this work.

2. Experiment method

The samples used in this work to perform the experiments are Fe-based amorphous ribbons with a nominal composition of Fe80Si9B11 (at%). The width of the ribbons is 5 mm while the thickness is approximately 25 μm. The ribbons were cut into rectangular shape with a length of 40 mm and then annealed at different temperatures in air for 20 minutes using a muffle furnace. The annealed ribbons were inserted into a rectangular solenoid coil with a dimension of around 40×10×10 mm3. Since the impedance and inductance values were extremely sensitive to the applied dc field to amorphous ribbons [39,40] when they were driven by a magnetic excitation near the mechanical resonant frequency [41,42]. The inductance of the coils with inserted ribbon were measured by a high-precision impedance analyzer (HP 4294A). The resonant frequencies (fr at maximum impedance) and anti-resonant frequencies (fa at minimum impedance) on the motion impedance curve were also measured by the impedance analyzer under a dc magnetic bias field (Hdc) along the longitudinal direction of the ribbons [43,44]. The values of k are determined using resonant and anti-resonant frequencies, Q can be directly measured by the two poles (f1 at maximum inductance, f2 at minimum inductance) vs frequency [4,8,44]. From the frequency at fr, fa, f1 and f2 the values of k and Q are calculated using the following dependences: k = ( π 2 / 8 ) ( 1 f r 2 / f a 2 ) and Q = f r / ( f 2 f 1 ) , where Δ f = f 2 f 1 is also corresponding to the -3 dB bandwidth near the resonance [8]. The schematic diagram of the experiment is shown in Figure 1.
The measured inductance (L) values of the winding coil with an inserted Fe-based ribbon are linearly proportional to the magnetic permeability of the ribbon core due to the high magnetic susceptivity of the ribbon, following the expression: L = N 2 μ 0 μ r S / l [45], where μ0 and μr are the magnetic permeability of vacuum and the ribbon, respectively. N is the number of rounds of the wire for the coil. S is the cross section aera of the coil. l is the length of the coil. The values of Young’s modulus (E) in the ribbons with a length match to the coil can be calculated from the measured values of the anti-resonant frequency: f a = ( 2 l ) 1 ( E / ρ ) 0.5 ,where l is the length of the ribbon, ρ is the density of the ribbon, respectively [8,37,46]. The magnetic hysteresis loops of the ribbons annealed at different temperatures are measured by using the vibrational sample measurement system (VSM, MicroSense EZ-7). The samples with a dimension of around 5×5×0.025 mm3 are prepared together in the furnace with the 40mm long ribbons for VSM measurements.

3. Theoretical analysis and Measurement

a) Eddy current loss
The equivalent input loss factor (ξ) has been defined as the inverse of the product of k2 and Q. It quantifies the ratio between the power conversion and the power loss in the magnetic-to-mechanical energy conversion. Following the previous investigations [4,8,35,37,47], ξ can be written as
ξ = 1 k 2 Q = c e μ 0 χ f r + 1 k 2 Q 0
where ce is the loss coefficient for the eddy current, χ is the magnetic susceptibility of the ribbons, Q0 is the quality factor under magnetostriction-free conditions. From the right-hand side of Eq. (1), the first term with ce represents the energy loss for dynamic magnetization procedure, which is affected by the magnetic properties of the ribbon, the second part represents the loss not related to the eddy current. In single ribbons, the eddy current loss dominates after the heat treatment under the annealing temperature far below the crystallization temperature. Following Herzer et al. [48], the formula of ce is expressed as
c e = ( π t ) 2 6 ρ e l ( 1 + w 2 ( w cos β + t ) 2 m 2 1 m 2 )
where t is the ribbon thickness, ρel is the electric resistivity, β is the angle between the average magnetic anisotropy and the ribbon direction. m = J H / J s is the averaged longitudinal magnetization (JH) normalized to the saturation magnetization (JS). w is the magnetic domain width, the formula is given as [48]
w 2 = 8 L e x t N z z sin 2 β + N y y cos 2 β
where L e x = A / K is the magnetic exchange length. A is defined as the exchange stiffness and K is the anisotropy constant. Nzz and Nyy are demagnetization factors along the longitudinal and width direction of the ribbon, respectively. With the help of Eq. (2) and (3), the contribution of the eddy current in Eq. (1) can be rewritten as
ξ e d d y = ( π t ) 2 6 ρ e l μ 0 χ f r + ( π t ) 2 6 ρ e l m 2 1 m 2 w 2 ( w cos β + t ) 2 μ 0 χ f r
Taking into account that the average anisotropy angle β is close to zero for the ribbons annealed at low temperatures, Eq. (4) is rewritten as
ξ e d d y = ( π t ) 2 6 ρ e l μ 0 χ f r + π 2 6 ρ e l m 2 1 m 2 ( 1 t + 1 w ) 2 μ 0 χ f r
When the magnetic domain width is usually much larger than the ribbon thickness in low-temperature annealed samples, the assumption w >> t can be considered in the calculation. Thus, Eq. (5) can be rewritten as
ξ e d d y = 1 k 2 Q = ( π t ) 2 6 ρ e l ( 1 + m 2 1 m 2 ) μ 0 χ f r
The equivalent loss factor induced by the eddy current loss for the ribbons annealed at low temperature depends only on the variation of χ and fr for the ribbons.
b) Magnetic and magnetomechancial properties
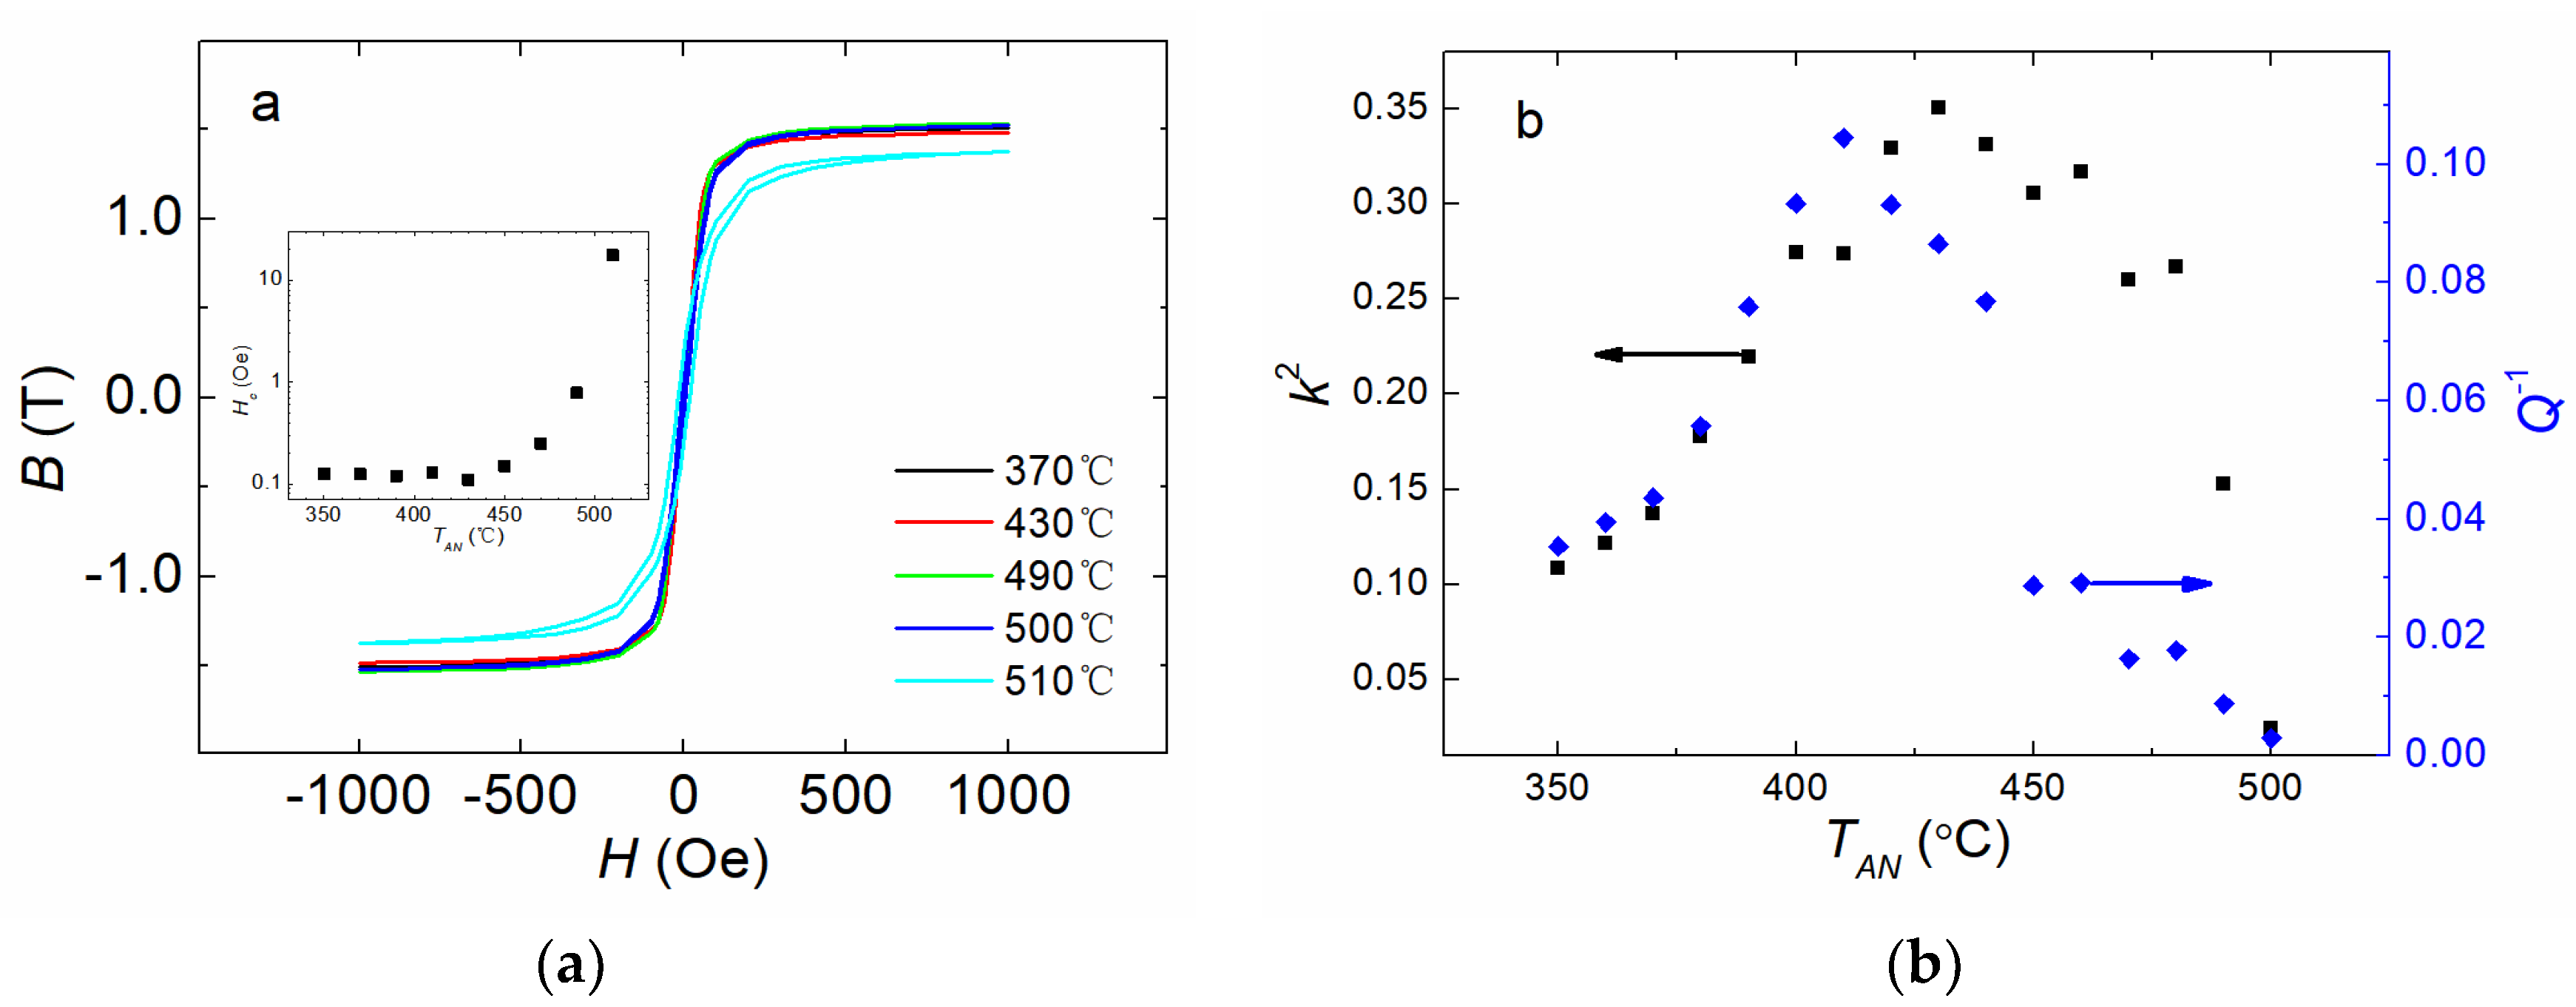
The hysteresis loops of magnetic materials could provide important information on the magnetic properties of materials. Figure 2(a) shows the dc magnetic hysteresis loops of the samples annealed in air at different annealing temperatures (TAN) for 20 minutes. The loops show small values of remnant magnetization and Hc for all the samples, suggesting that the samples remain good soft magnetic properties after the heat treatment in air. As shown in the inset in Figure 2(a), the values of Hc basically stay close to 0.1 Oe in the region of TAN from 370 °C to 450 °C. However, Hc begins to grow sharply with the increase of TAN when TAN exceeds 450 °C. In this case, the change of the chemical concentration causing the ordered clusters, the subsequent topological and chemical long-range orderings on the surface of the ribbons results in the variations in the values of Hc [31,33,34,36,47,49]. When TAN is above 500 °C, Hc shows a burst increase which suggests further deterioration in the soft magnetic properties. This is due to (1) the increasing fraction of the surface crystallization at high TAN; (2) a film of boron oxides formed with excessive boron atoms which are separated from the α-Fe crystallites, since the α-Fe crystallites have much lower solubility of B than that of amorphous Fe [4,22,28,31,33,36]. Consequently, the magnetic domains in the amorphous remainders are thinned and turned to the out-of-plan direction by the compress stress that are induced by the surface crystallization and surface oxidation films [4,22,28,31,33,36], leading to the increasing of Hc.
In our previous work, we have reported the TAN dependency of k and Q for single FeSiB ribbons, the value of k reaches its maximum around TAN of 430 °C, while Q shows a minimal value around TAN of 410 °C [4]. The k2 and Q-1 evolution after annealed at various temperature TAN are shown in Figure 2(b). In low TAN region below 400 °C, with increasing TAN, k2 increases while Q-1 decreases at almost the same pace, indicating k2 and Q-1 are correlated in low annealing temperature region. For higher TAN from 400 °C to 500 °C, the variation of k2 and Q-1 become non-synchronous, indicating the correlation level of these parameters drops significantly. As a result of synchronous change of k2 and Q-1 for low TAN below 400 °C, the equivalent input loss ξ stays almost invariable for low TAN below 400 °C, as reported by our earlier investigations [4].
c) Softening of magnetic and elastic properties
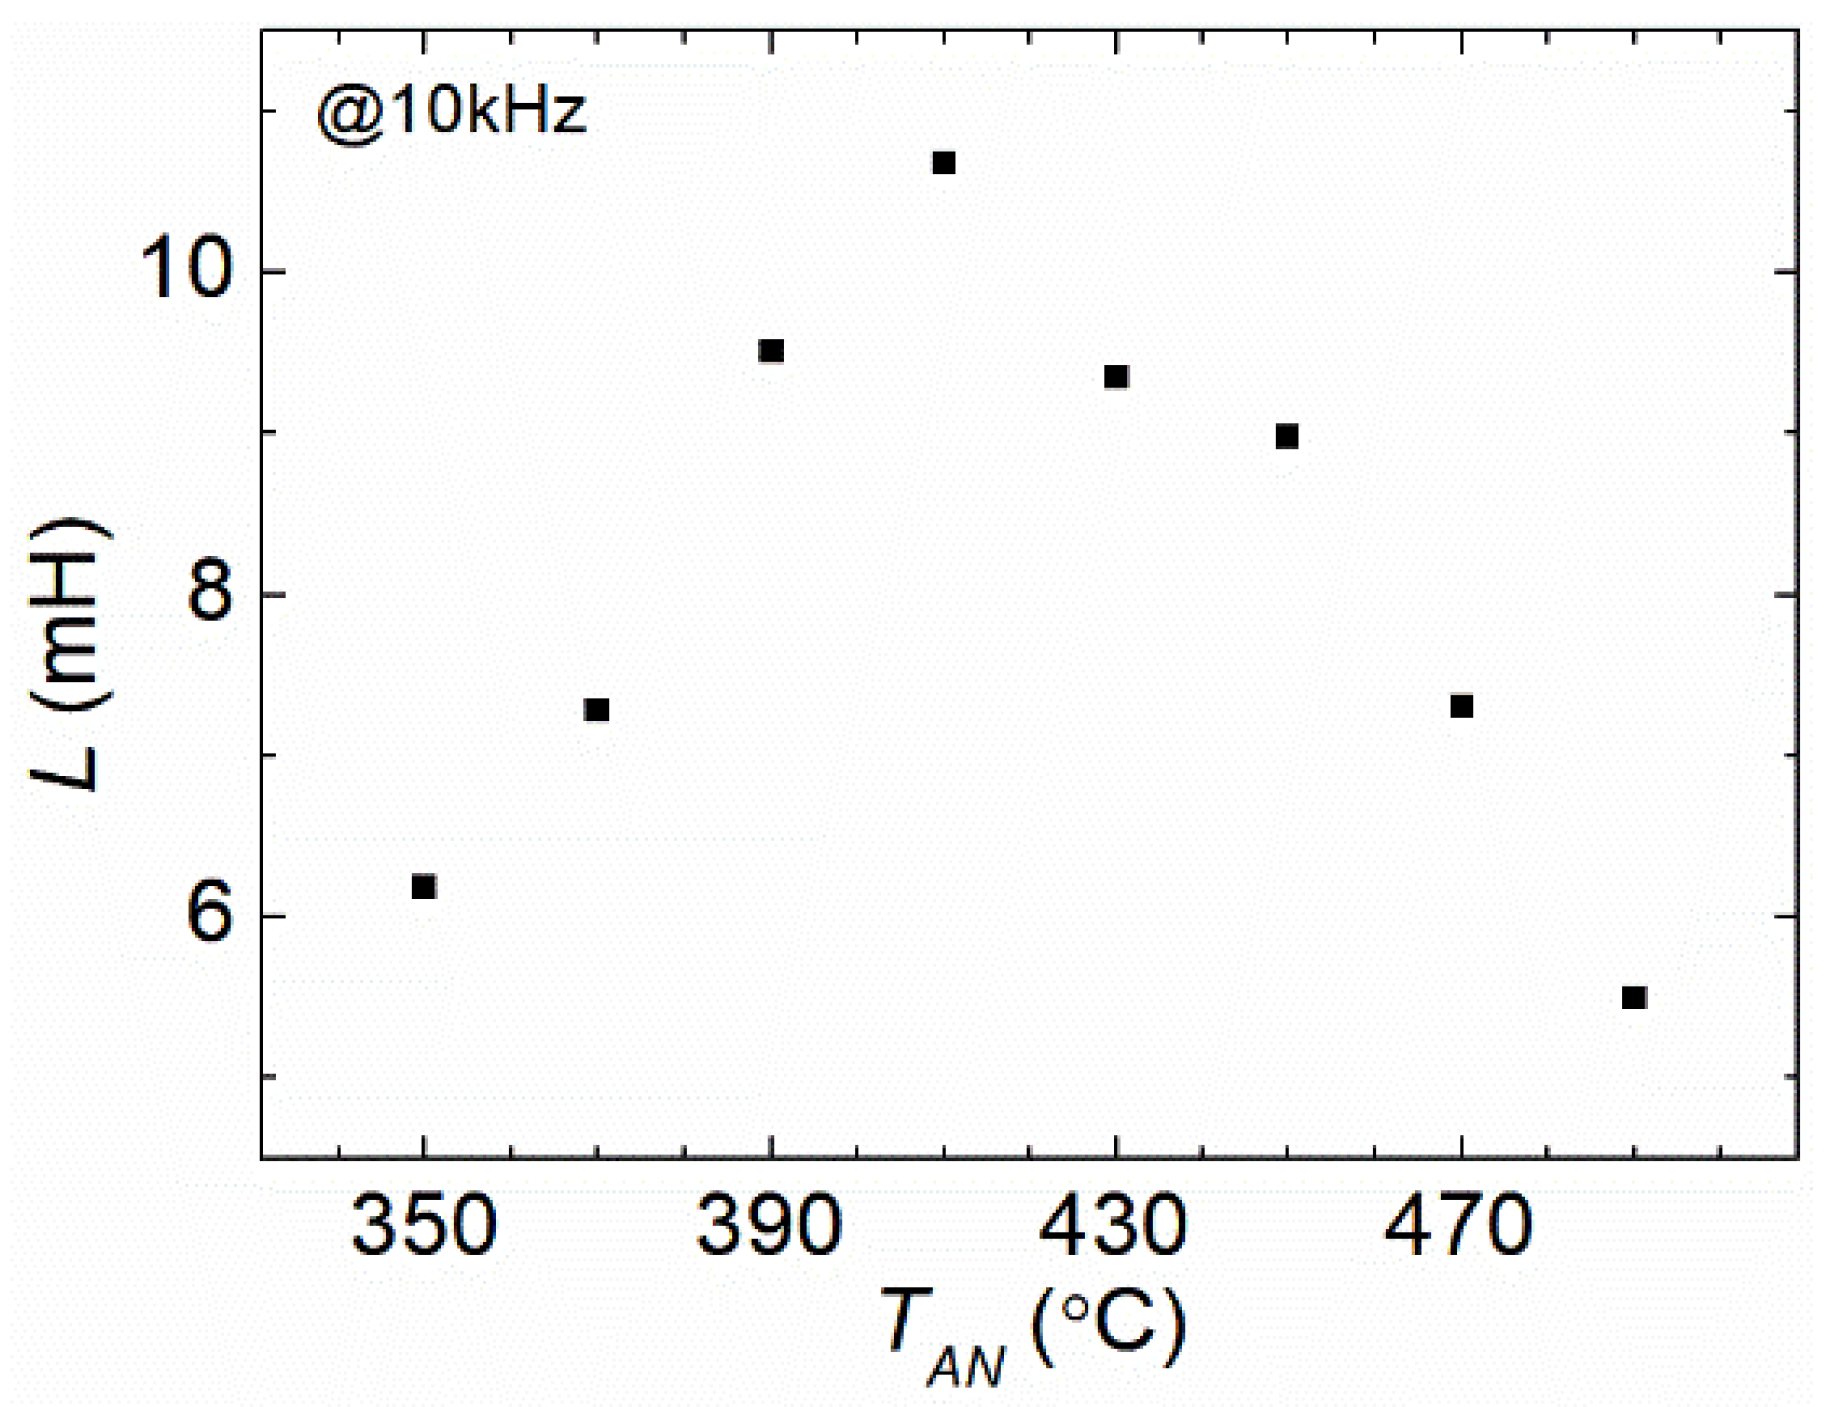
Figure 3 shows the measured values of the inductance (L) at 10 kHz after isothermal annealing at various temperature TAN, it can be observed that L increases with TAN in the region from 350 °C to 410 °C, then decreases for TAN from 420 °C to 490 °C. According to the formula L = N 2 μ 0 μ r S / l , the values of L are proportional to the magnetic permeability (μr) of the ribbon. Similar behavior of μr can also be observed from the magnetic hysteresis loops in Figure 1(a).
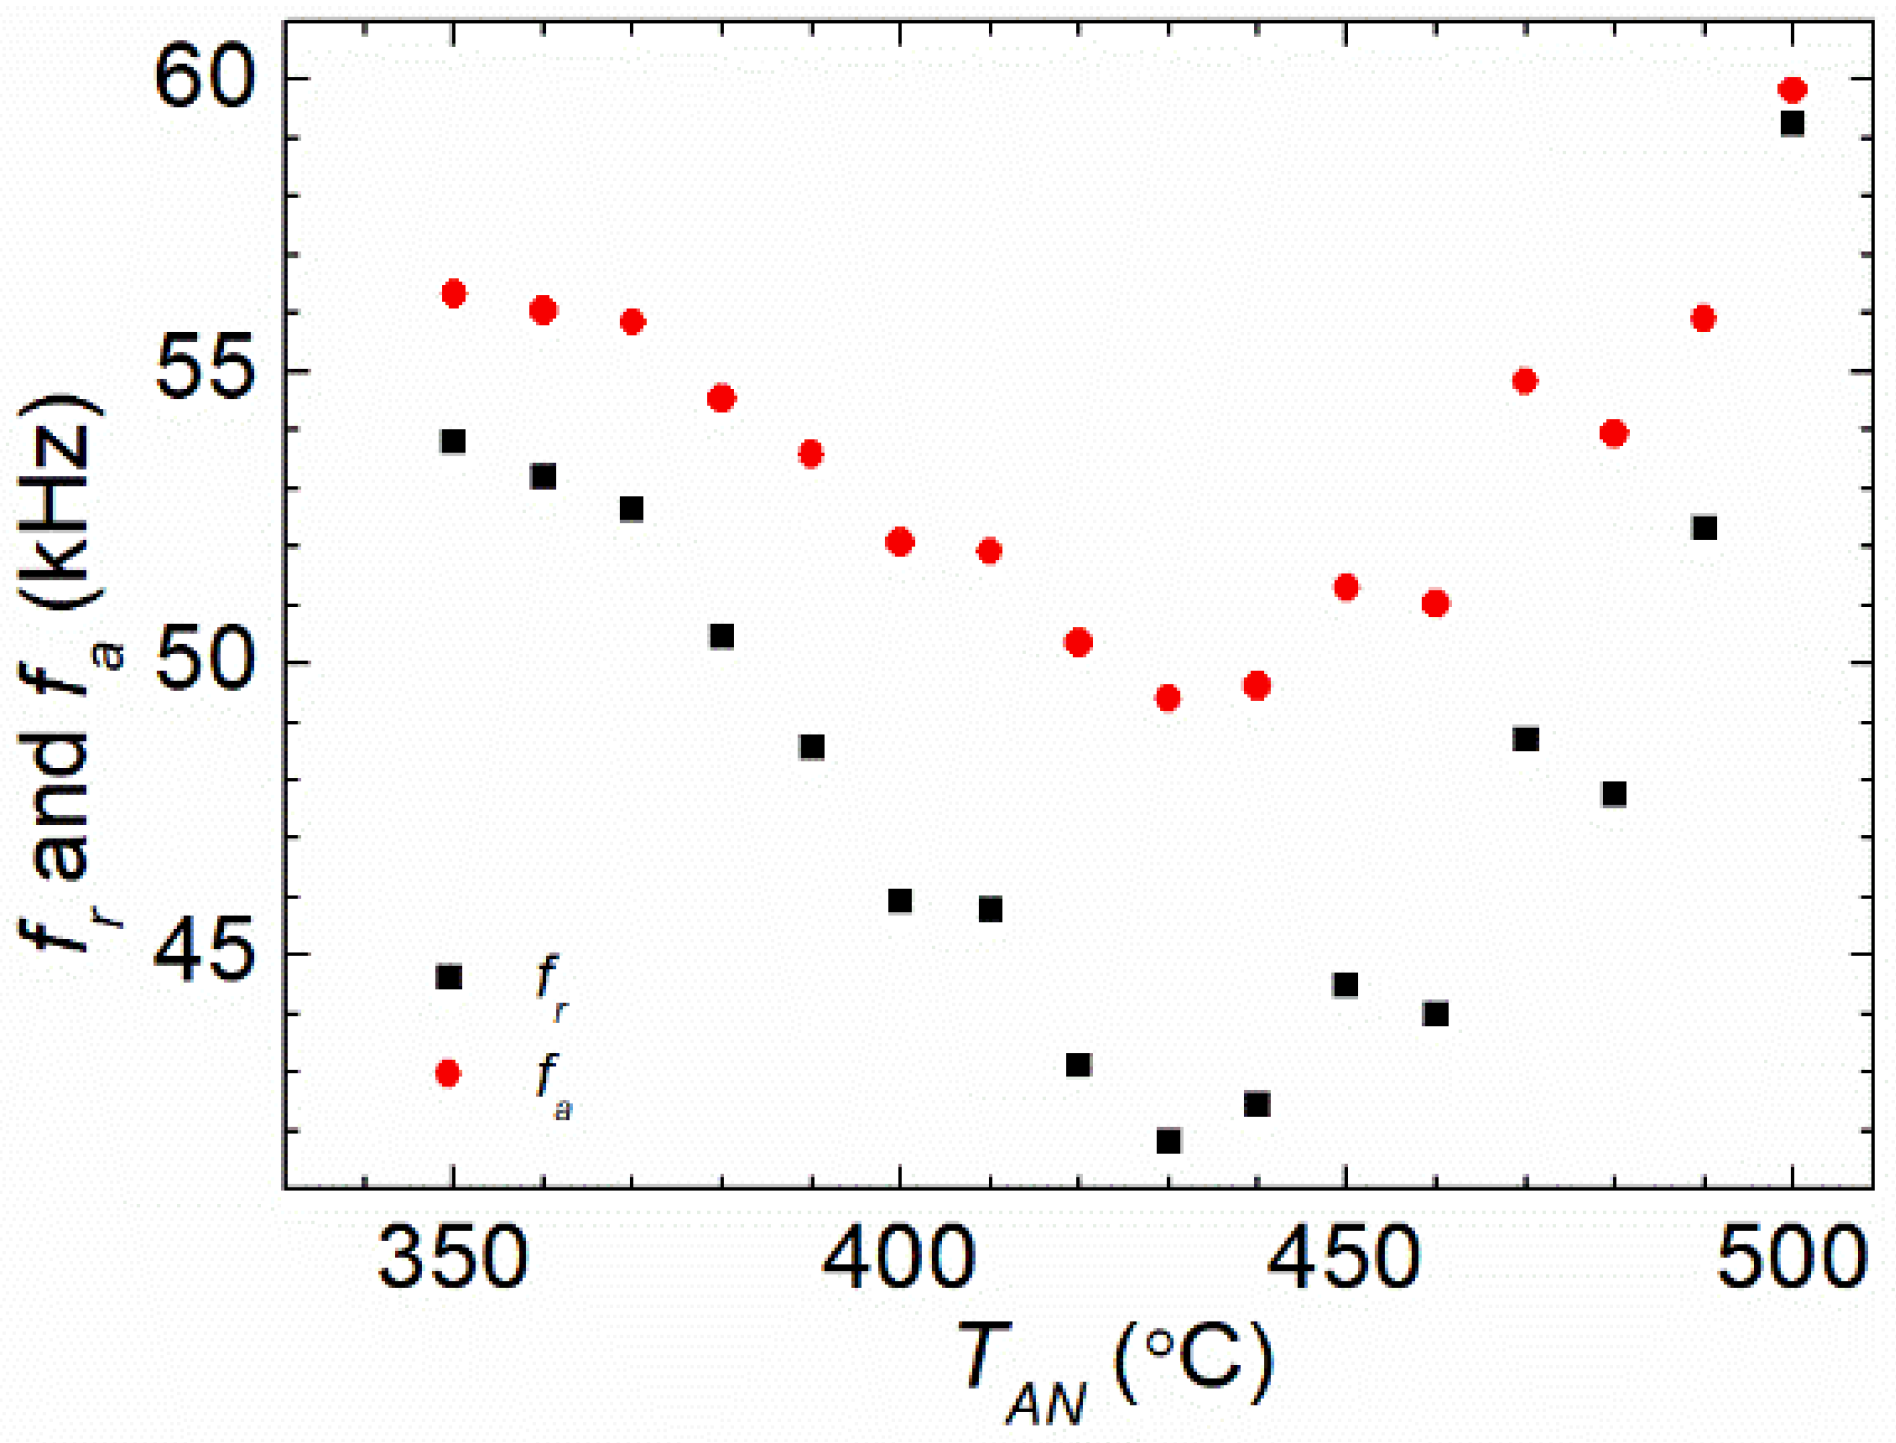
Figure 4 shows the TAN dependence of resonant fr and anti-resonant fa. It can be observed that in low TAN region, both fr and fa decrease with the increase of TAN and reach a minimal value at 410 °C. Then they rise as TAN continues to increase. Following the formula of f a = ( 2 l ) 1 ( E / ρ ) 0.5 , the values of fa is related to E of the ribbon [8]. Besides, it can be observed in Figure 4 that fr-curve and fa-curve has almost the same pattern and the similar amplitudes, which indicates that fr also reflects the change of E. By comparing the behavior of L and fa (fr) versus TAN, it can be noticed that the two parameters exhibit a respective extreme value as the function of TAN. However, the curves of L and fa show a lag of 20 °C versus TAN to reach their max/min values.
By comparing the TAN-dependence of L with TAN-dependence of Q-1 factors, it can be observed that the variations of L and Q-1 with the increase of TAN are almost the same below 400 °C, the fa (fr) has similar profile with k factor. According to Eq. (6), the trend of k and Q are recognized as the competition of the magnetic and mechanical properties, χ and fa (fr). Since the L-curve and Q-1-curve shares the same trend and same extreme value point of TAN below 410 °C, while fa (fr)-curve and k-curve show the inverse trend and same extreme value point of TAN below 430 °C, it is probable that L or μr is dominant on the values of Q-1 factors while fa (fr) or E has the dominative effect on k factor for the low TAN below 410 °C (for L and Q) or 430 °C (for fa and k). Moreover, because k and E are related to each other, the annealing experience though α-relaxation has an important influence on the softening in elasticity below 430 °C [4]. For higher TAN, because of the emerging of the surface crystallization and the long-range chemical orderings with B oxidation during the annealing procedure, the competition of magnetism and elasticity becomes much more complex, leading to the divorce between k2-curve and Q-curves as well as between fa (fr)-curve and L-curve versus TAN [4,31,33,34,36,38,47].
Below 410 C-TAN, the β-relaxation in Fe-lack zones was dominant and lead to the chemical short-range ordering (CSRO) in Fe-rich zones with the doped B atoms by diffusion[4]. In addition, the topological short-range ordering (TSRO) also occurs at this low TAN region as another result of β-relaxation, leading to the releasing of internal stress, both of which alleviate the pinning effect of the magnetic domain by defects in the sample [4], the expanding speed of magnetic domain increase therefor, i.e. L (μr) increases. For TAN from 450 °C to 500 °C, the sharp decrease of L (μr) may be due to the emerging of surface crystallization together with more severe surface oxidation that leads to the apparency of the grain boundary as well as magnetic anisotropy deviating from the long axis direction, both of which inhibit the movement or rotation of the magnetic moment of the magnetic domain, resulting in the smaller variation rate of the magnetic moment. The increase of Hc above 450 °C also coincides with the decrease of L (μr), suggesting the deterioration of the soft magnetic properties in high TAN region.
The decrease of E in the low TAN region suggests that the deformation quantity of the ribbon becomes smaller with the increasing TAN. According to previous studies [4,38], as a result of β-relaxation for low TAN, besides of the increasing of Fe-Fe bond caused by the CSRO, the TSRO could also be triggered by β-relaxation close to the cluster-matrix boundaries. The TSRO brings a decrease in the ductility of the sample, thus the sample becomes “more flexible” to be stretched. Consequently, E (fa and fr) becomes smaller after annealed at relatively low temperature and reaches minimum at 430 °C, as shown in Figure 4. The E (fa and fr) vs. TAN curve switches to an increasing trend when TAN exceeds 430 °C. This can be attributed to the apparency of α-relaxation, which is more intensive and usually occurs at high TAN. This α-relaxation further enhances the diffusion of the atoms, affecting the atomic orderings in a larger scale and usually reshaping the clusters. Fe or metalloid atoms experiencing a long-term relaxation in the B-rich area leads to the generation of some clusters with high elasticity that increase the values of E. In addition, because the annealing procedure in this article is taken in air, the oxidation is more strongly and penetrates deeper in the ribbons at high TAN, this also has a strong influence on the rigidity of the ribbon [4,20].
From Figure 3 and Figure 4, it can be obtained that the variation trends of magnetic susceptibility χ (χ is also proportional to L in Figure 3) and resonant (anti-resonant) frequency fr (fa) are synchronous but opposite for low TAN from 350 °C to 400 °C, the product of χ and fr (fa) remains close to a constant. Besides, the measured h, relating to k2Q, is nearly a constant value in this region of TAN following our previous investigations[4,25]. Therefore, according to Eq. (1), it could be inferenced that the loss factor ce which represents the eddy current loss should be basically unchanged for low TAN from 350 °C to 400 °C for the single FeSiB ribbons. This is consistent with our analysis in the theoretical section as well.
When TAN approaches to the crystallization temperature (Tx) of the FeSiB glassy metals, the size of the magnetic domain decreases due to the change of surface stress [4,34,36]. According to Herzer et al. [4,8,35,37,47,49], the loss factor ce is related to the width of magnetic domain w, following the Eq. (2). Therefore, the synchronously changing behavior of k2 and Q-1 suggest that the improvement of the soft magnetic properties may derive from the increase of the numbers of the activated magnetic units rather than the variation of the width of magnetic domains in low TAN region. Thus, the values of ξ for the ribbons annealed at low TAN remaining constant is more due to the increase of the quantity of magnetic units, rather than the change in the domain size.
d) Time-Temperature equivalence for the annealing
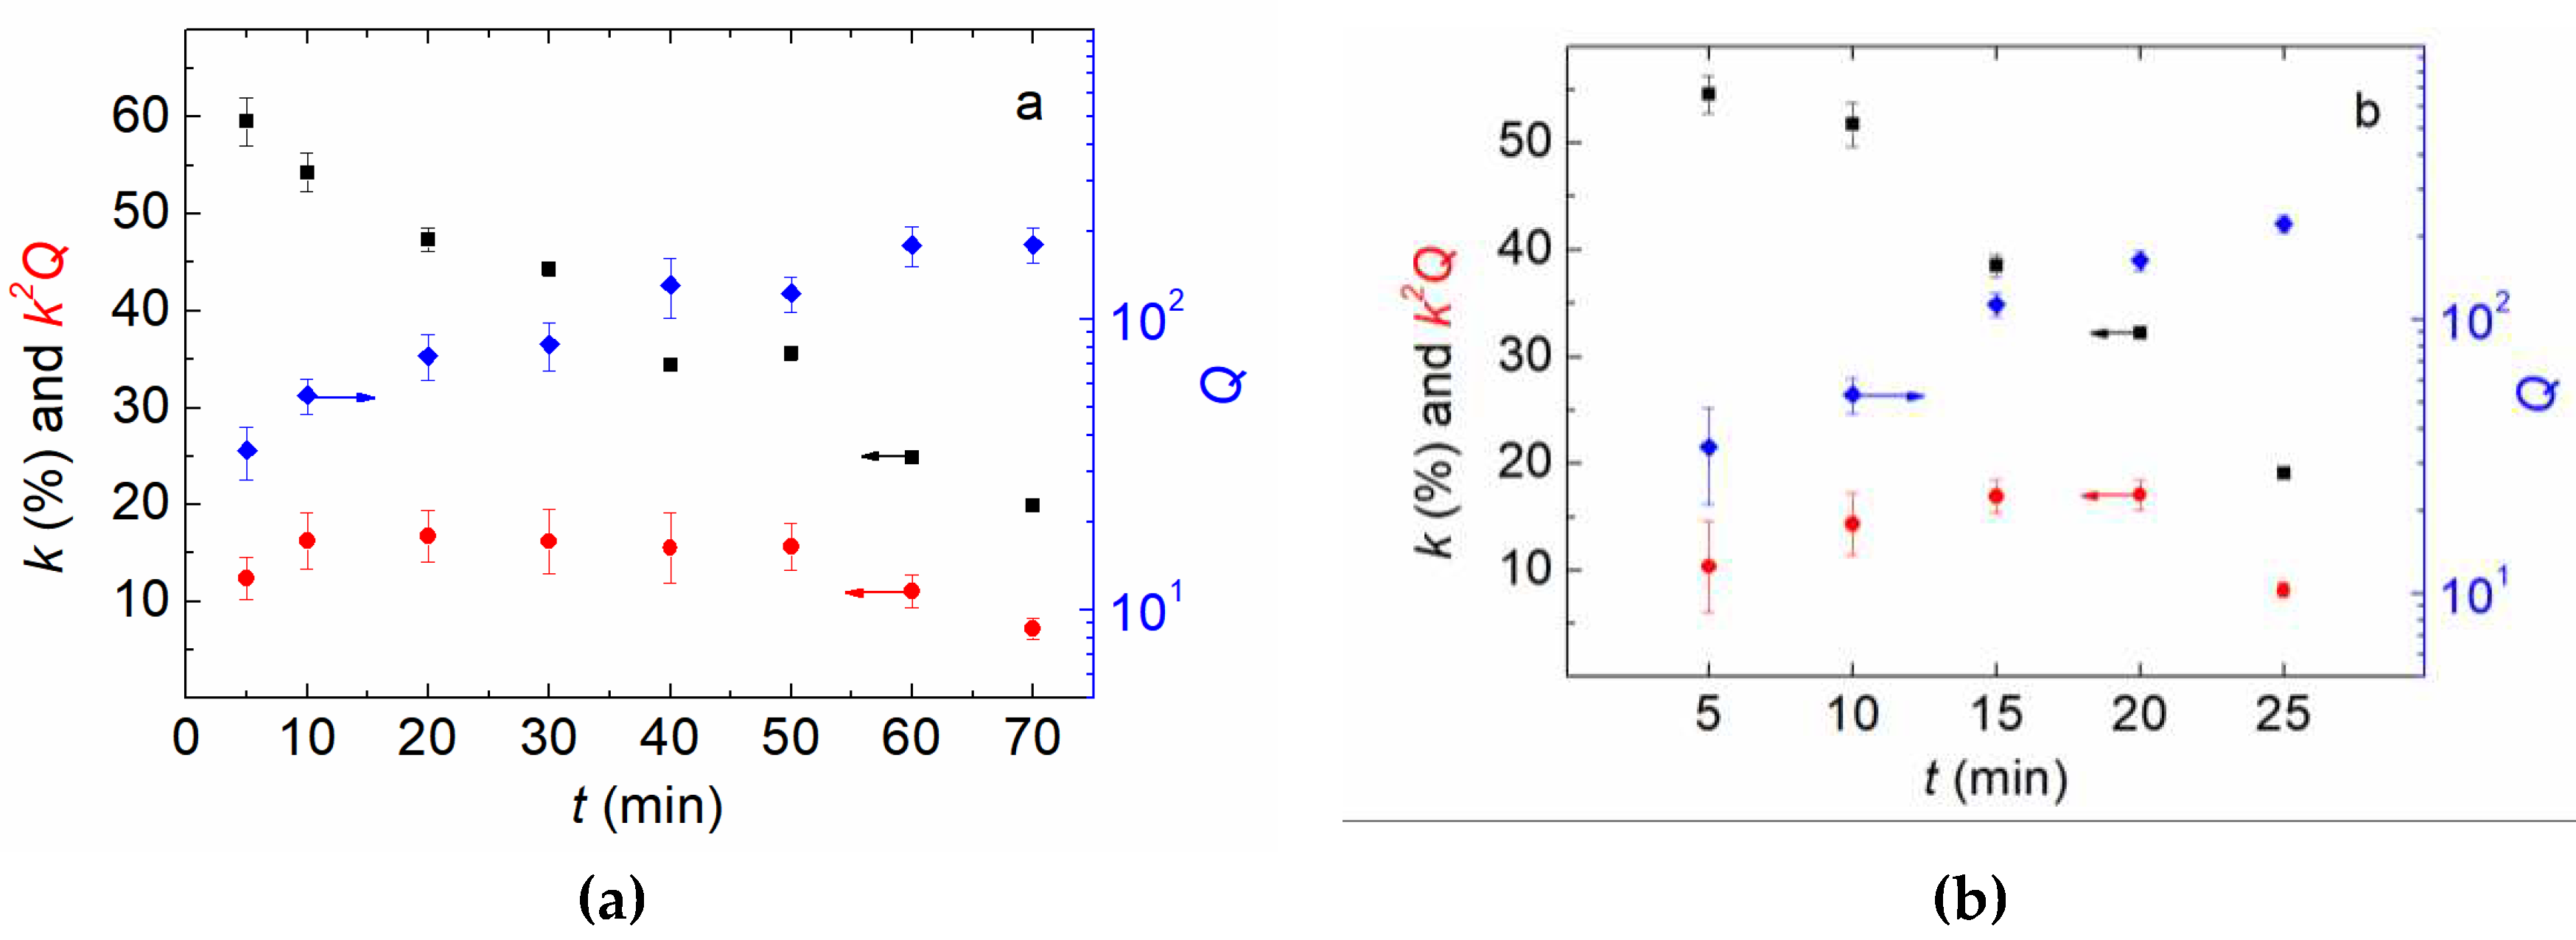
Figure 5 (a) and (b) displays the variation of k, k2Q and Q factor for different annealing times tAN at TAN from 470 °C to 490 °C, respectively. A significant decrease of k factor with the increase of Q factor occurs with the increase of tAN for TAN of 470 °C and 490 °C. The curve of k and Q show a cross profile at tAN = 40 minute and 15 minutes, respectively. After the ribbons are annealed for 40 minutes at TAN = 470 °C and 15 minutes at TAN = 490 °C, k decreases approximately from 60% to 40%, while the values of Q increase close to 200. The equivalent input loss factors ξ show a max value when tAN is 20 minutes for both samples, which suggests the optimal annealing time for the annealing at 470 °C and 490 °C. Based on the data mentioned above, it is implied that the decrease in k is caused by the surface oxidation and surface crystallization that induces the increase of the coercivity by the out-of-plane magnetic anisotropy. The increase of Q factors might be due to the long range-orderings that take place in the surface regions of the ribbons.
The Q factor represents the quality of mechanical performance in our FeSiB ribbons, a high value in Q factor indicates a high ratio between the storage power to the power loss. From Figure 5(a) and (b), it can be observed that the overall trend of k, k2Q and Q curves at 470 °C TAN are similar to that at 490 °C TAN, separately. Besides, the increase of TAN from 470 °C to 490 °C narrows the TAN window before the magnetomechancial properties deteriorate obviously. In terms of the h factors, it is similar to increase TAN for a constant tAN or to increase tAN at a fixed TAN, which suggests that TAN and tAN have equal effect on the h factor in the heat treatment procedure for the FeSiB ribbons to some extent. However, the equivalence of tAN and TAN in terms of the magnetomechanical power conversion efficiency seems to exist only at relative higher TAN, we do not observe this equivalence with TAN below 400 °C.
e) Magnetomechancial properties in epoxy-ribbon composites
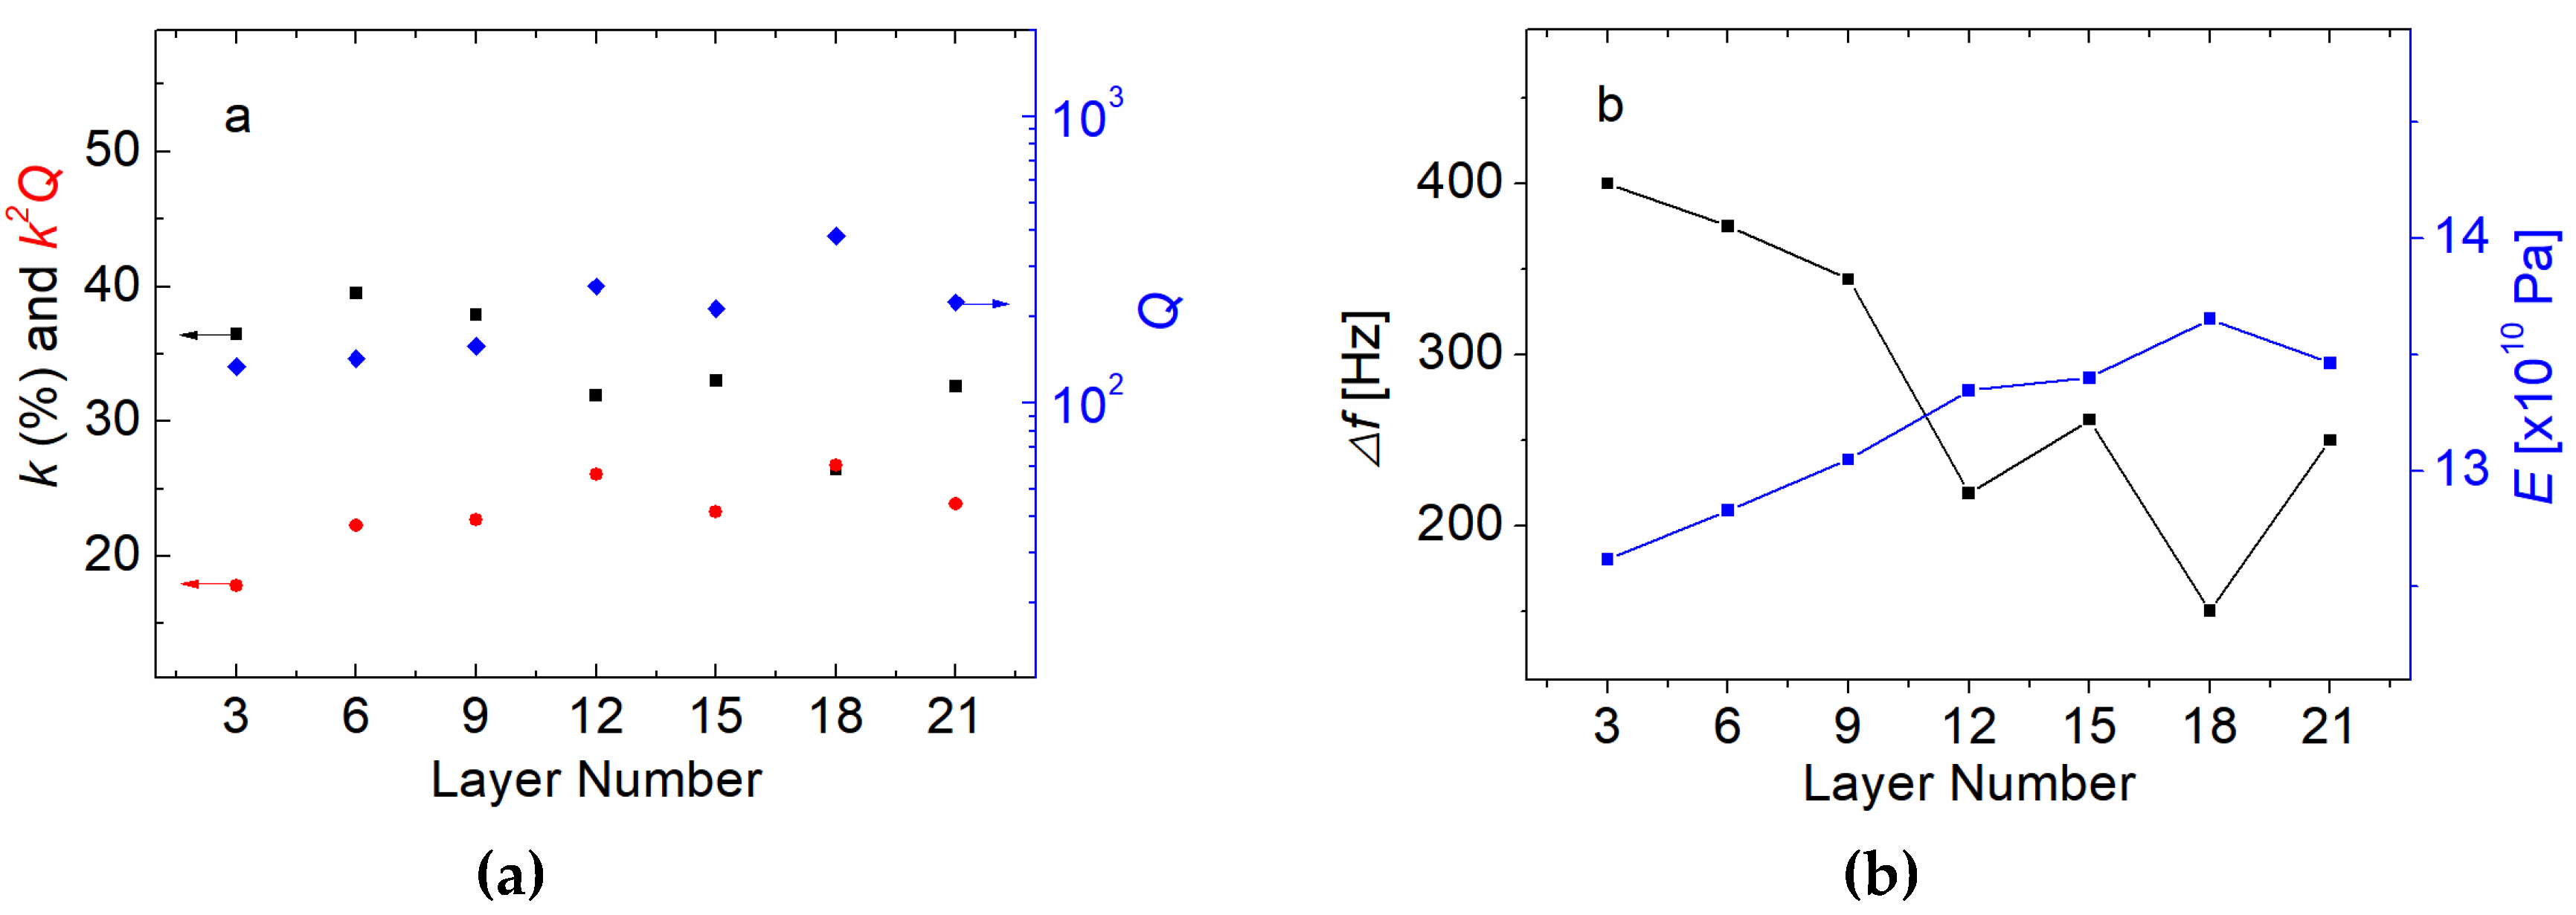
A schematic diagram of a laminated composite consisting of magnetostrictive amorphous FeSiB ribbons bonded by epoxy resin is given in Figure 6(a). Several FeSiB foils are fabricated by using hot-pressing techniques and an A-B part epoxy. The should-be ratio between the epoxy (A part) and the curing agent (B part) is 3:1. Figure 6(b) is a photo of the laminated FeSiB composites, we apply a dc magnetic field along the laminated composite, as shown in the upper part of Figure 6(b). The ratio between the quantity of magnetostrictive layers and the quantity of epoxy resin is varied to investigate the change of k, Q, and k2Q in FeSiB laminated composites with different foil numbers. The results are given in Figure 7(a). It is found that as the number of FeSiB layers increases, the k factors increase slightly and then decrease rapidly, while the Q factors show an overall increase trend to a maximum close to 400, corresponding to a foil number from 18 to 21 in the FeSiB laminates. The efficiency factor k2Q firstly increases for more FeSiB ribbons layers, and then reaches a relatively stable value around 25 corresponding to the FeSiB foil number from 12 to 21. Figure 7(b) shows the trend of the -3 dB bandwidth (Δf) and E for the FeSiB laminated composites with different foil numbers.
In Figure 7(a), it is observed that when the foil number is small, there is no obvious similarity or correlation between the k and Q factors as FeSiB layer numbers varies. The k and Q in the laminated composites with 9-layers, 6-layers, and 3-layers of FeSiB ribbons are examples. But for the laminated composites with more foil number of 12-layers, 15-layers, 18-layers and 21-layers, the data suggest that there is a mutually exclusive relationship between the k and Q factors. This causes the k2Q factors reaching a relatively stable state and that the k2Q factors does not continue increasing with the increase of the FeSiB layer number. For the record, it is needed to particularly emphasize that the ratio between epoxy and curing agents is not 3:1. The amount of the curing agent is reduced, giving a ratio less than 3:1 between the epoxy and the curing agent, so the epoxy resin was not fully solidified for the laminated samples. Thus, the mechanical loss due to the inter-friction is increased comparing to the samples with fully cured epoxy. Unlike the eddy current loss in the single-foil ribbons, the dominant loss in the FeSiB laminates is ascribed to the mechanical loss that triggers the temperature rising when the laminated composites are driven under high power conditions.
According to previous research, as TAN approaches to Tx, the size of the magnetic domain decreases due to the change of surface stress [4,34]. As mentioned above, the efficiency of a single-foil ribbon experienced a low TAN remains constant, and this is more due to the increasing of the number of the magnetic units, rather than the change in the magnetic domain size. In contrast, the increase of the k2Q factors at TAN above 450 °C is due to the reduction of magnetic domains size. Following the Eq. (1), because the k2Q factors of the laminated FeSiB composites is approximately a constant for high layer number laminates, and because the variation trend of E (associated to fr and fa) and the bandwidth (associated with χ) of the laminated FeSiB composites remains consistent with each other for all the foil numbers, ce of the laminated composites should remain constant, too. As the foil number of the FeSiB laminates decreases, the volume proportion of magnetostrictive materials (FeSiB) in laminated composite gradually increases. Using similar analyzing principle to Figure 7(a), the reason for the constant values in k2Q factors for the ribbons with the foil number from 12 to 21 is probably due to the increase in the number of ribbons, rather than the change in the relative fraction of the ribbons. The reason for the change in the k2Q factors for the laminates with the foil number from 3 to 12 is due to the variation of the relative volume fraction of FeSiB ribbons, but rather than the variation in the ribbon number. That is to say, the change in k2Q factors between the laminates with the ribbon number from 3 to 12 derives from the relative size of the magnetic units, which corresponds to the relative volume fraction of FeSiB ribbons in the laminates; while the constant k2Q factors between the 12-layers and 21-layers laminates come from the change in the number of magnetic units, rather than the change in relative volume of magnetic units.

5. Conclusions

In summary, we investigated the influence of magnetic and elastic properties on magnetomechancial coupling factors (k) and damping factors (Q-1) by measuring the resonant and anti-resonant frequencies from the motion impedance and the inductance spectrum from a winding coil with an annealed-FeSiB ribbon. We can draw the following conclusions:
1. By experiencing the annealing under different temperatures, the dynamic magnetic and elastic properties in the Fe80Si9B11 ribbons vary correlatively with the annealing temperature. However, the resonant frequency reaches its minimum value at 430 °C with a lag of 20 °C when the magnetic parameter reaches its minimum at 410 °C, coinciding with the behaviors of k and Q-1 when the annealing temperature changes.
2. It is found that annealing temperature and annealing time has equally impact in the heat treatment procedure for the FeSiB ribbons to maximize the magnetomechancial power efficiency. But the equivalence is correct only when the annealing temperature is high enough that the long-range orderings can occur in the surface region of the ribbons.
3. The investigation of the FeSiB laminated composites suggests that the behavior of k and Q-1 factors in the laminates with the various foil number from 12 to 21 is like the behaviors of k and Q-1 factors in the single-foil FeSiB ribbons with various annealing temperature from 350 °C to 400 °C.

Author Contributions

Conceptualization, X.Z. (Xin Zhuang); methodology, X.Z. (Xin Zhuang), X.Z. (Xu Zhang); software, X.Z. (Xin Zhuang), X.Z. (Xu Zhang); validation, X.Z. (Xin Zhuang), X.Z. (Xu Zhang),; formal analysis, X.Z. (Xin Zhuang), X.Z. (Xu Zhang); investigation, X.Z. (Xin Zhuang), X.Z. (Xu Zhang); resources, X.Z. (Xin Zhuang), X.Z. (Xu Zhang); data curation, X.Z. (Xin Zhuang), X.Z. (Xu Zhang); writing—original draft preparation, X.Z. (Xu Zhang); writing—review and editing, X.Z. (Xin Zhuang), X.Z. (Xu Zhang), Y.S. and B.Y.; visualization, X.Z. (Xin Zhuang), X.Z. (Xu Zhang); supervision, X.Z. (Xin Zhuang); project administration, X.Z. (Xin Zhuang), X.Z. (Xu Zhang); funding acquisition, X.Z. (Xin Zhuang), X.Z. (Xu Zhang) All authors have read and agreed to the published version of the manuscript.”

Funding

This research was funded by the National Key R & D Program of China: No. 2021YFA0716500, the Natural Science Foundation of Inner Mongolia: No. 2021BS05010 and the talent program with Chinese Academy of Sciences.

Institutional Review Board Statement

Not applicable.

Informed Consent Statement

Not applicable.

Data Availability Statement

Not applicable.

Conflicts of Interest

The authors declare no conflict of interest.

References

  1. Papadopoulou, C.-A. Chapter 4 - Technology and SDGs in Smart Cities Context. In Smart Cities and the un SDGs; Visvizi, A., Pérez del Hoyo, R., Eds.; Elsevier, 2021; pp. 45–58 ISBN 978-0-323-85151-0.
  2. Ortiz-Repiso, V. Chapter 11 - The 2030 Agenda and the Information Professionals. In Boosting the Knowledge Economy; Calzada-Prado, F.-J., Ed.; Chandos Information Professional Series; Chandos Publishing: Oxford, 2022; pp. 189–208 ISBN 978-1-84334-772-9.
  3. Channagoudra, G.; Dayal, V. Magnetoelectric Coupling in Ferromagnetic/Ferroelectric Heterostructures: A Survey and Perspective. J Alloys Compd 2022, 928. [CrossRef]
  4. Zhuang, X.; Xu, X.; Zhang, X.; Sun, Y.; Yan, B.; Liu, L.; Lu, Y.; Zhu, W.; Fang, G. Tailoring the Magnetomechanical Power Efficiency of Metallic Glasses for Magneto-Electric Devices. J Appl Phys 2022, 132. [CrossRef]
  5. Leung, C.M.; Li, J.; Viehland, D.; Zhuang, X. A Review on Applications of Magnetoelectric Composites: From Heterostructural Uncooled Magnetic Sensors, Energy Harvesters to Highly Efficient Power Converters. J Phys D Appl Phys 2018, 51, 263002. [CrossRef]
  6. Kabacoff, L.T. Thermal, Magnetic, and Magnetomechanical Properties of Metglas 2605 S2 and S3. J Appl Phys 1982, 53, 8098–8100. [CrossRef]
  7. Savage, H.; Clark, A.; Powers, J. Magnetomechanical Coupling and ΔE Effect in Highly Magnetostrictive Rare Earth - Fe2compounds. IEEE Trans Magn 1975, 11, 1355–1357. [CrossRef]
  8. Kaczkowski, Z. Magnetomechanical Properties of Rapidly Quenched Materials. Materials Science and Engineering: A 1997, 226–228, 614–625. [CrossRef]
  9. Qiao, K.; Hu, F.; Zhang, H.; Yu, Z.; Liu, X.; Liang, Y.; Long, Y.; Wang, J.; Sun, J.; Zhao, T.; et al. Unipolar Electric-Field-Controlled Nonvolatile Multistate Magnetic Memory in FeRh/(001)PMN-PT Heterostructures over a Broad Temperature Span. Sci China Phys Mech Astron 2021, 65, 217511. [CrossRef]
  10. Pal, M.; Srinivas, A.; Asthana, S. Enhanced Magneto-Electric Properties and Magnetodielectric Effect in Lead-Free (1-x)0.94Na0.5Bi0.5TiO3-0.06BaTiO3–x CoFe2O4 Particulate Composites. J Alloys Compd 2022, 900, 163487. [CrossRef]
  11. Li, T.X.; Li, R.; Lin, Y.; Bu, F.; Li, J.; Li, K.; Hu, Z.; Ju, L. Study of Enhanced Magnetoelectric Coupling Behavior in Asymmetrical Bilayered Multiferroic Heterostructure with Two Resonance Modes. J Alloys Compd 2022, 895, 162674. [CrossRef]
  12. Röbisch, V.; Salzer, S.; Urs, N.O.; Reermann, J.; Yarar, E.; Piorra, A.; Kirchhof, C.; Lage, E.; Höft, M.; Schmidt, G.U.; et al. Pushing the Detection Limit of Thin Film Magnetoelectric Heterostructures. J Mater Res 2017, 32, 1009–1019. [CrossRef]
  13. Betal, S.; Saha, A.K.; Ortega, E.; Dutta, M.; Ramasubramanian, A.K.; Bhalla, A.S.; Guo, R. Core-Shell Magnetoelectric Nanorobot – A Remotely Controlled Probe for Targeted Cell Manipulation. Sci Rep 2018, 8, 1755. [CrossRef]
  14. Narita, F.; Fox, M. A Review on Piezoelectric, Magnetostrictive, and Magnetoelectric Materials and Device Technologies for Energy Harvesting Applications. Adv Eng Mater 2018, 20, 1700743. [CrossRef]
  15. Gao, J.; Das, J.; Xing, Z.; Li, J.; Viehland, D. Comparison of Noise Floor and Sensitivity for Different Magnetoelectric Laminates. J Appl Phys 2010, 108, 084509. [CrossRef]
  16. Chen, H.S.; Leamy, H.J.; Barmatz, M. The Elastic and Anelastic Behavior of a Metallic Glass. J Non Cryst Solids 1971, 5, 444–448. [CrossRef]
  17. Morito, N.; Egami, T. Correlation of the Shear Modulus and Internal Friction in the Reversible Structural Relaxation of a Glassy Metal. J Non Cryst Solids 1984, 61–62, 973–978. [CrossRef]
  18. Soshiroda, T.; Koiwa, M.; Masumoto, T. The Internal Friction and Elastic Modulus of Amorphous Pd–Si and Fe–P–C Alloys. J Non Cryst Solids 1976, 22, 173–187. [CrossRef]
  19. Xu, D.D.; Zhou, B.L.; Wang, Q.Q.; Zhou, J.; Yang, W.M.; Yuan, C.C.; Xue, L.; Fan, X.D.; Ma, L.Q.; Shen, B.L. Effects of Cr Addition on Thermal Stability, Soft Magnetic Properties and Corrosion Resistance of FeSiB Amorphous Alloys. Corros Sci 2018, 138, 20–27. [CrossRef]
  20. Lin, J.; Li, X.; Zhou, S.; Zhang, Q.; Li, Z.; Wang, M.; Shi, G.; Wang, L.; Zhang, G. Effects of Heat Treatment in Air on Soft Magnetic Properties of FeCoSiBPC Amorphous Core. J Non Cryst Solids 2022, 597. [CrossRef]
  21. Murugaiyan, P.; Mitra, A.; Jena, P.S.M.; Mahato, B.; Ghosh, M.; Roy, R.K.; Panda, A.K. Grain Refinement in Fe-Rich FeSiB(P)NbCu Nanocomposite Alloys through P Compositional Modulation. Mater Lett 2021, 295. [CrossRef]
  22. Fang, Z.; Nagato, K.; Liu, S.; Sugita, N.; Nakao, M. Investigation into Surface Integrity and Magnetic Property of FeSiB Metallic Glass in Two-Dimensional Cutting. J Manuf Process 2021, 64, 1098–1104. [CrossRef]
  23. Wang, C.; Guo, Z.; Wang, J.; Sun, H.; Chen, D.; Chen, W.; Liu, X. Industry-Oriented Fe-Based Amorphous Soft Magnetic Composites with SiO2-Coated Layer by One-Pot High-Efficient Synthesis Method. J Magn Magn Mater 2020, 509. [CrossRef]
  24. Cheng, Y.Q.; Ma, E. Atomic-Level Structure and Structure-Property Relationship in Metallic Glasses. Prog Mater Sci 2011, 56, 379–473. [CrossRef]
  25. Sun, Y.; Zhang, X.; Wu, S.; Zhuang, X.; Yan, B.; Zhu, W.; Dolabdjian, C.; Fang, G. Magnetomechanical Properties of Fe-Si-B and Fe-Co-Si-B Metallic Glasses by Various Annealing Temperatures for Actuation Applications. Sensors 2023, 23. [CrossRef]
  26. Czyż, O.; Kusiński, J.; Radziszewska, A.; Liao, Z.; Zschech, E.; Kąc, M.; Ostrowski, R. Study of Structure and Properties of Fe-Based Amorphous Ribbons after Pulsed Laser Interference Heating. J Mater Eng Perform 2020, 29, 6277–6285. [CrossRef]
  27. Zhang, J.; Shan, G.; Li, J.; Wang, Y.; Shek, C.H. Structures and Physical Properties of Two Magnetic Fe-Based Metallic Glasses. J Alloys Compd 2018, 747, 636–639. [CrossRef]
  28. Li, Y.; Chen, W. zhi; Dong, B. shao; Zhou, S. xiong Effects of Phosphorus and Carbon Content on the Surface Tension of FeSiBPC Glass-Forming Alloy Melts. J Non Cryst Solids 2018, 496, 13–17. [CrossRef]
  29. Li, T.X.; Li, R.; Lin, Y.; Bu, F.; Li, J.; Li, K.; Hu, Z.; Ju, L. Study of Enhanced Magnetoelectric Coupling Behavior in Asymmetrical Bilayered Multiferroic Heterostructure with Two Resonance Modes. J Alloys Compd 2022, 895, 162674. [CrossRef]
  30. Kabacoff, L.T. Thermal, Magnetic, and Magnetomechanical Properties of Metglas 2605 S2 and S3. J Appl Phys 1982, 53, 8098–8100. [CrossRef]
  31. Lopatina, E.; Soldatov, I.; Budinsky, V.; Marsilius, M.; Schultz, L.; Herzer, G.; Schäfer, R. Surface Crystallization and Magnetic Properties of Fe84.3Cu0.7Si4B8P3 Soft Magnetic Ribbons. Acta Mater 2015, 96, 10–17. [CrossRef]
  32. Ok, H.N.; Morrish, A.H. Origin of the Perpendicular Anisotropy in Amorphous Fe82B12Si6 Ribbons. Phys Rev B 1981, 23, 2257–2261. [CrossRef]
  33. Gemperle, R.; Kraus, L.; Kroupa, F.; Schneider, J. Influence of Surface Oxidization on Induced Anisotropy of Amorphous (FeNi) PB Wires. physica status solidi (a) 1980, 60, 265–272. [CrossRef]
  34. Ok, H.N.; Morrish, A.H. Amorphous-to-Crystalline Transformation of Fe82B12Si6. Phys Rev B 1980, 22, 3471–3480. [CrossRef]
  35. Keupers, A.; De Schepper, L.; Knuyt, G.; Stals, L.M. Chemical and Topological Short Range Order in Amorphous Fe40Ni38Mo4B18 (Metglas 2826MB). J Non Cryst Solids 1985, 72, 267–278. [CrossRef]
  36. Morito, N. Surface Crystallization Induced by Selective Oxidation of Boron in Fe-B-Si Amorphous Alloy. Key Eng Mater 1990, 40–41, 63–68. [CrossRef]
  37. Herzer, G. Magnetomechanical Damping in Amorphous Ribbons with Uniaxial Anisotropy. Materials Science and Engineering: A 1997, 226–228, 631–635. [CrossRef]
  38. Tong, X.; Zhang, Y.; Wang, Y.; Liang, X.; Zhang, K.; Zhang, F.; Cai, Y.; Ke, H.; Wang, G.; Shen, J.; et al. Structural Origin of Magnetic Softening in a Fe-Based Amorphous Alloy upon Annealing. J Mater Sci Technol 2022, 96, 233–240. [CrossRef]
  39. Stoyanov, P.G.; Grimes, C.A. A Remote Query Magnetostrictive Viscosity Sensor. Sens Actuators A Phys 2000, 80, 8–14. [CrossRef]
  40. Herrero-Gómez, C.; Marín, P.; Hernando, A. Bias Free Magnetomechanical Coupling on Magnetic Microwires for Sensing Applications. Appl Phys Lett 2013, 103, 142414. [CrossRef]
  41. Hernando, A.; Madurga, V.; Barandiarán, J.M.; Liniers, M. Anomalous Eddy Currents in Magnetostrictive Amorphous Ferromagnets: A Large Contribution from Magnetoelastic Effects. J Magn Magn Mater 1982, 28, 109–116. [CrossRef]
  42. Gutiérrez, J.; Barandiarán, J.M.; Nielsen, O. V Magnetoelastic Properties of Some Fe-Rich FeCoSiB Metallic Glasses. physica status solidi (a) 1989, 111, 279–283. [CrossRef]
  43. Leung, C.M.; Zhuang, X.; Xu, J.; Li, J.; Zhang, J.; Srinivasan, G.; Viehland, D. Enhanced Tunability of Magneto-Impedance and Magneto-Capacitance in Annealed Metglas/PZT Magnetoelectric Composites. AIP Adv 2017, 8, 055803. [CrossRef]
  44. Kaczkowski, Z.; Vlasák, G.; Švec, P.; Duhaj, P.; Ruuskanen, P.; Barandiarán, J.M.; Gutiérrez, J.; Minguez, P. Influence of Heat-Treatment on Magnetic, Magnetostrictive and Piezomagnetic Properties and Structure of Fe64Ni10Nb3Cu1Si13B9 Metallic Glass. Materials Science and Engineering: A 2004, 375–377, 1065–1068. [CrossRef]
  45. Setiadi, R.N.; Schilling, M. Sideband Sensitivity of Fluxgate Sensors Theory and Experiment. Sens Actuators A Phys 2019, 285, 573–580. [CrossRef]
  46. Savage, H.; Clark, A.; Powers, J. Magnetomechanical Coupling and ΔE Effect in Highly Magnetostrictive Rare Earth - Fe2compounds. IEEE Trans Magn 1975, 11, 1355–1357. [CrossRef]
  47. Egami, T. Structural Relaxation in Amorphous Fe40Ni40P14 B6 Studied by Energy Dispersive X-Ray Diffraction. J Mater Sci 1978, 13, 2587–2599. [CrossRef]
  48. Herzer, G. Effect of Domain Size on the Magneto-Elastic Damping in Amorphous Ferromagnetic Metals. International Journal of Materials Research 2022, 93, 978–982.
  49. Egami, T. Structural Relaxation in Amorphous Alloys - Compositional Short Range Ordering. Mater Res Bull 1978, 13, 557–562. [CrossRef]
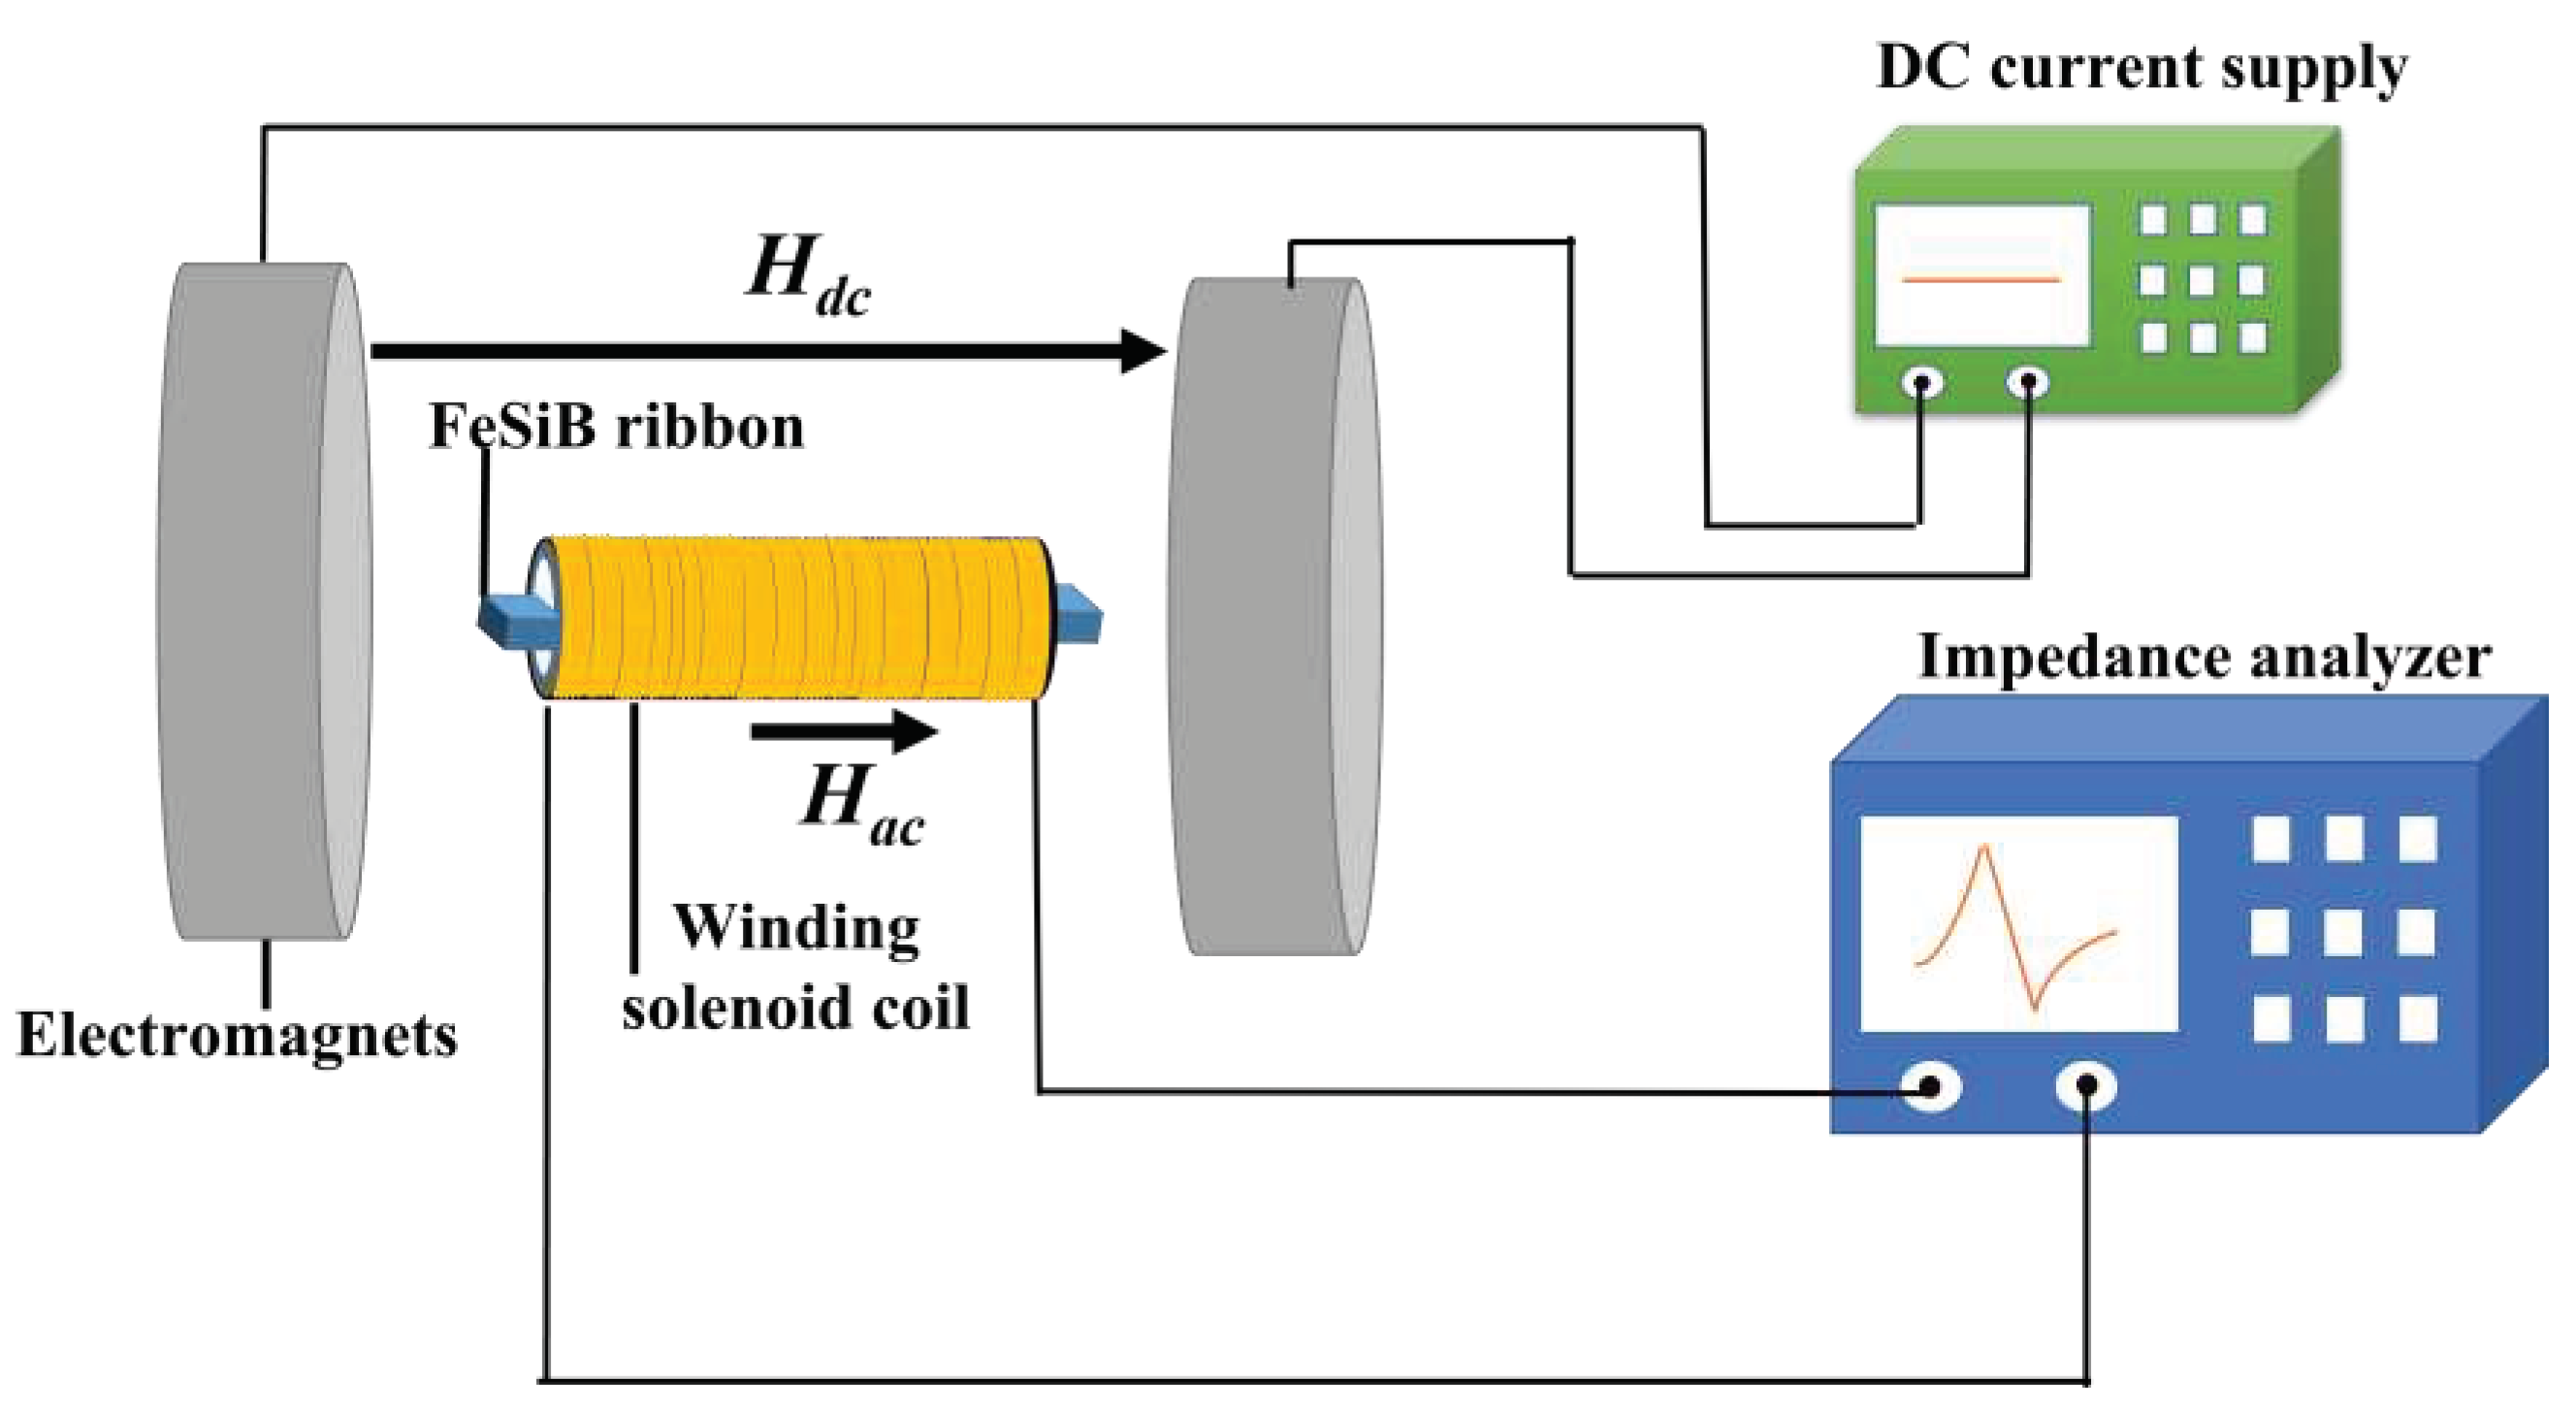
Figure 1. Schematic diagram of the experiment.
Preprints 74983 g001
Figure 2. (a) The hysteresis loops of FeSiB amorphous ribbons obtained after annealed at different temperatures from 370 °C to 510 °C for 20 minutes in air, the inset figure is the annealing temperature (TAN) dependence of coercivity Hc. (b) Damping factors (Q-1) and the square of magnetomechanical coupling (k) as a function of TAN for 20 minutes in air. k is acquired at its maximal values with external dc magnetic bias field Hdc. The values of Q-1 are measured under the same Hdc when k is maximized.
Preprints 74983 g002
Figure 3. The variation of inductance (L) of the winding coil with an inserted FeSiB ribbon annealed for 20 minutes at different annealing temperatures TAN from 350 °C to 490 °C. The measured L is linearly proportional to the magnetic permeability of the ribbon core due to the high magnetic susceptivity of the ribbon, following the expression: L = N 2 μ 0 μ r S / l , where μ0 and μr are the magnetic permeability of vacuum and the ribbon, respectively. N is the number of rounds of the wire for the coil. S is the cross section aera of the coil. l is the length of the coil.
Preprints 74983 g003
Figure 4. The variation of the resonant frequencies (fr) and anti-resonant frequencies (fa) of the winding coil with an inserted FeSiB ribbon annealed for 20 minutes at different annealing temperatures TAN from 350 °C to 500 °C. The fr and fa on the motion impedance curve were measured by the impedance analyzer under an dc magnetic bias field (Hdc) along the longitudinal direction of the ribbons. The values of Young’s modulus (E) in the ribbons with a length match to the coil can be calculated from the measured values of the anti-resonant frequency: f a = ( 2 l ) 1 ( E / ρ ) 0.5 , where l is the length of the ribbon, ρ is the density of the ribbon, respectively [8,37,46].
Preprints 74983 g004
Figure 5. The magnetomechanical coupling coefficient (k) for FeSiB ribbons as a function of the annealing time (tAN) at annealing temperature of (a) 470 °C and (b) 490 °C. The blue and red curves represent the values of the quality factors (Q) and efficiency factors (k2Q) associated to the maximum values of coupling coefficient k, respectively.
Preprints 74983 g005
Figure 6. (a) Schematic diagram of a laminated composite consisting of magnetostrictive amorphous FeSiB ribbons bonded by epoxy resin. (b) Photo of laminated metallic glass (FeSiB) ribbon composites and the solenoid coil used to generate the ac magnetic field.
Preprints 74983 g006
Figure 7. (a) The black curve is the magnetomechanical coupling factor (k) for laminated metallic glass composites consisting of magnetostrictive amorphous FeSiB ribbons as a function of the FeSiB-layer numbers. The blue and red curves represent the values of the quality factors (Q) and efficiency coefficients (k2Q) associated to the maximum values of coupling coefficient k, respectively. (b) The trend of the -3 dB bandwidth (∆f) and Young’s modulus (E) for laminated FeSiB ribbon composites as a function of the FeSiB-layer number, where Δ f = f 2 f 1 (f1 at maximum inductance, f2 at minimum inductance).
Preprints 74983 g007
Disclaimer/Publisher’s Note: The statements, opinions and data contained in all publications are solely those of the individual author(s) and contributor(s) and not of MDPI and/or the editor(s). MDPI and/or the editor(s) disclaim responsibility for any injury to people or property resulting from any ideas, methods, instructions or products referred to in the content.
Copyright: This open access article is published under a Creative Commons CC BY 4.0 license, which permit the free download, distribution, and reuse, provided that the author and preprint are cited in any reuse.
Prerpints.org logo

Preprints.org is a free preprint server supported by MDPI in Basel, Switzerland.

Subscribe

© 2024 MDPI (Basel, Switzerland) unless otherwise stated