Submitted:
29 May 2023
Posted:
30 May 2023
You are already at the latest version
Abstract
Keywords:
1. Introduction
2. Materials and Methods
2.1. Animal ethical statement
2.2. Animals and cells isolation and culture
2.3. Quantitative reverse-transcription polymerase chain reaction (qRT-PCR) analysis
2.4. Western blotting
2.5. Transmission electron microscopy analysis
2.6. Immunofluorescence microscopy analysis
2.7. TUNEL assay for detecting apoptosis
2.8. Measurement of oxidative stress
2.9. Statistical analysis
3. Results
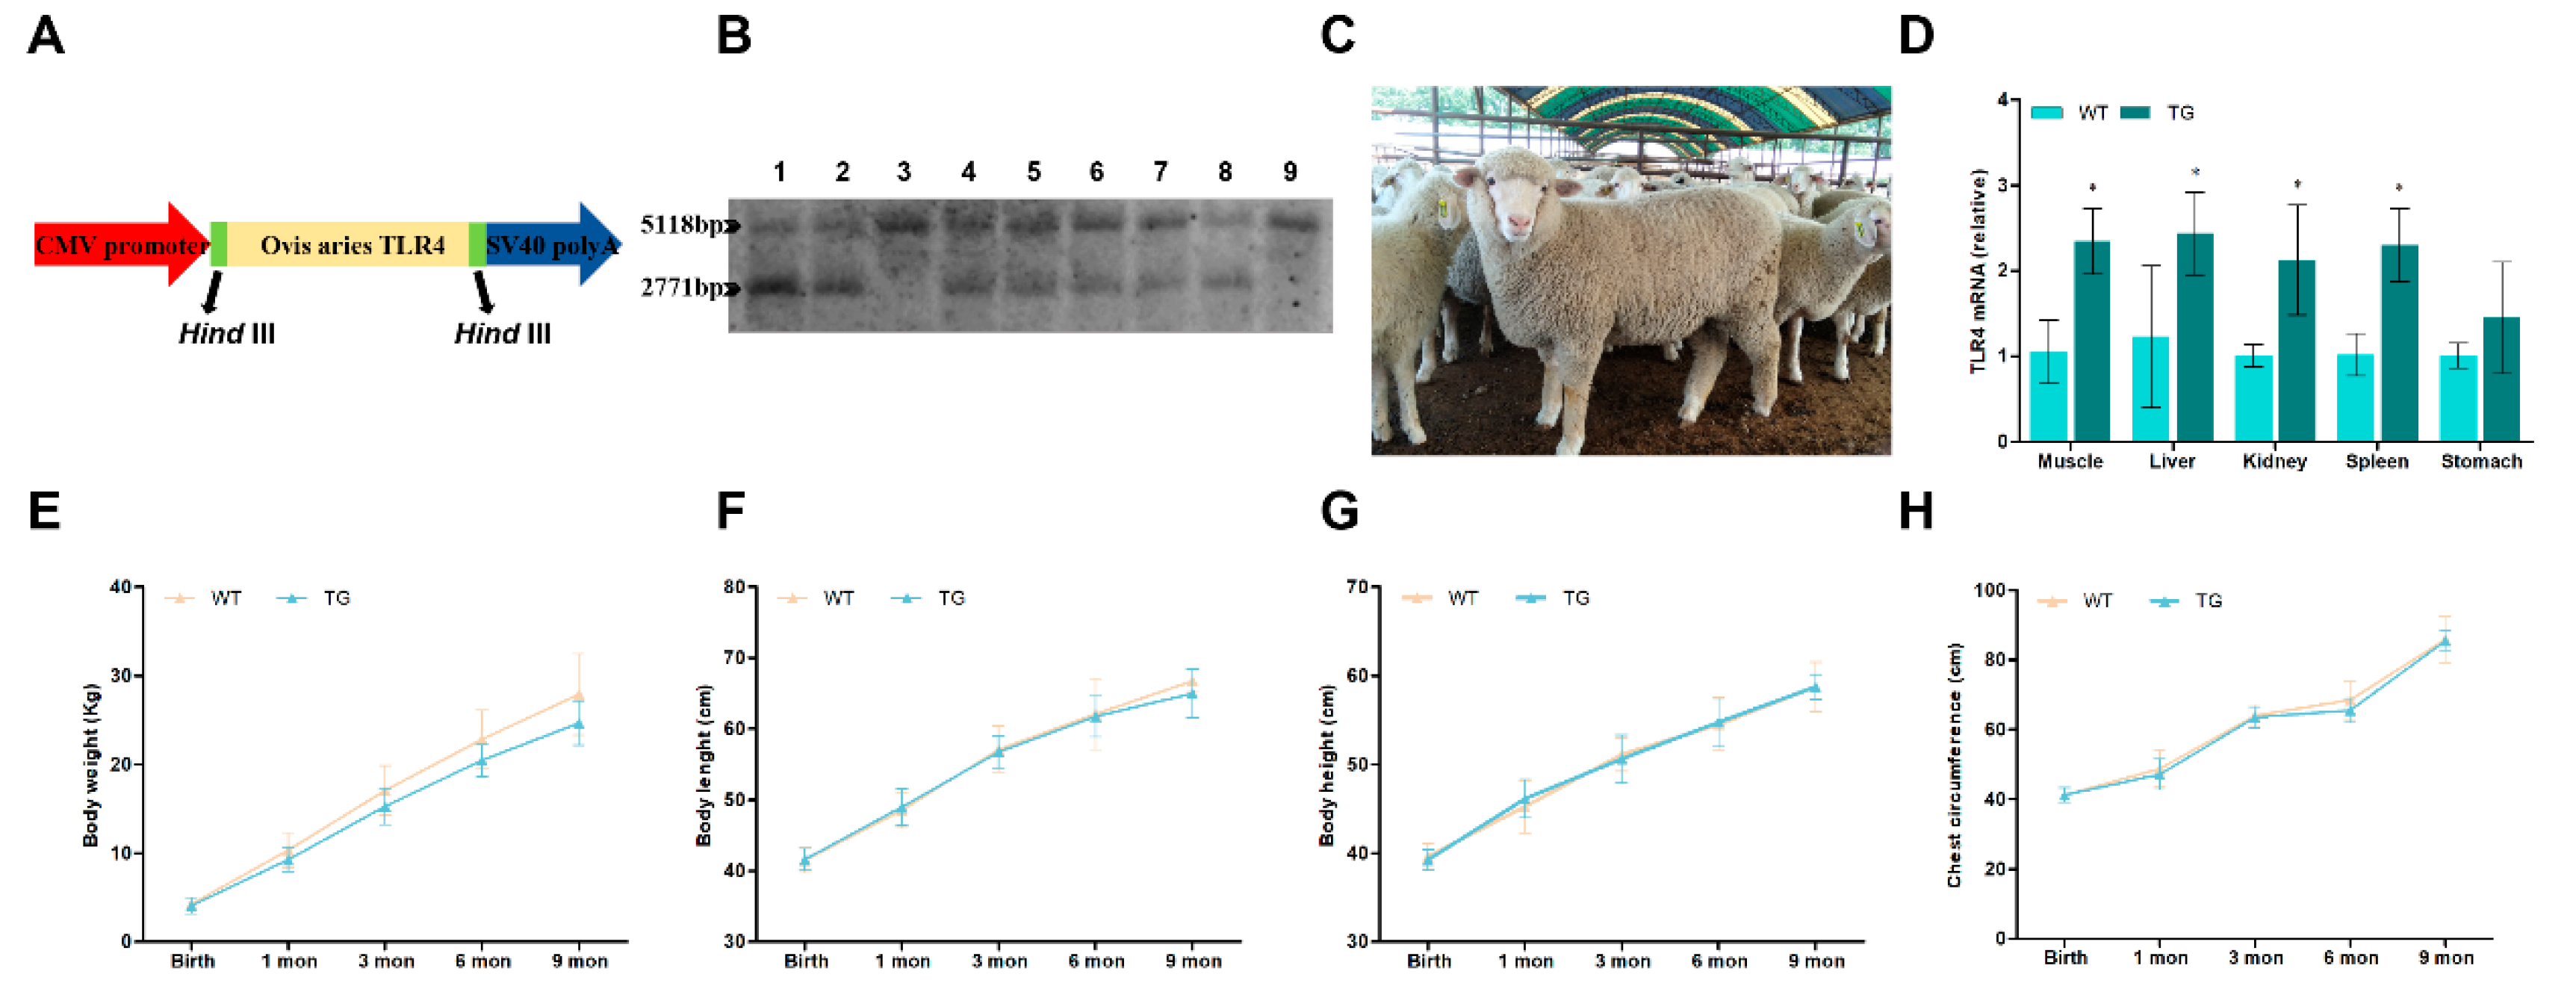
3.1. Generation and identification of transgenic individuals overexpressing TLR4
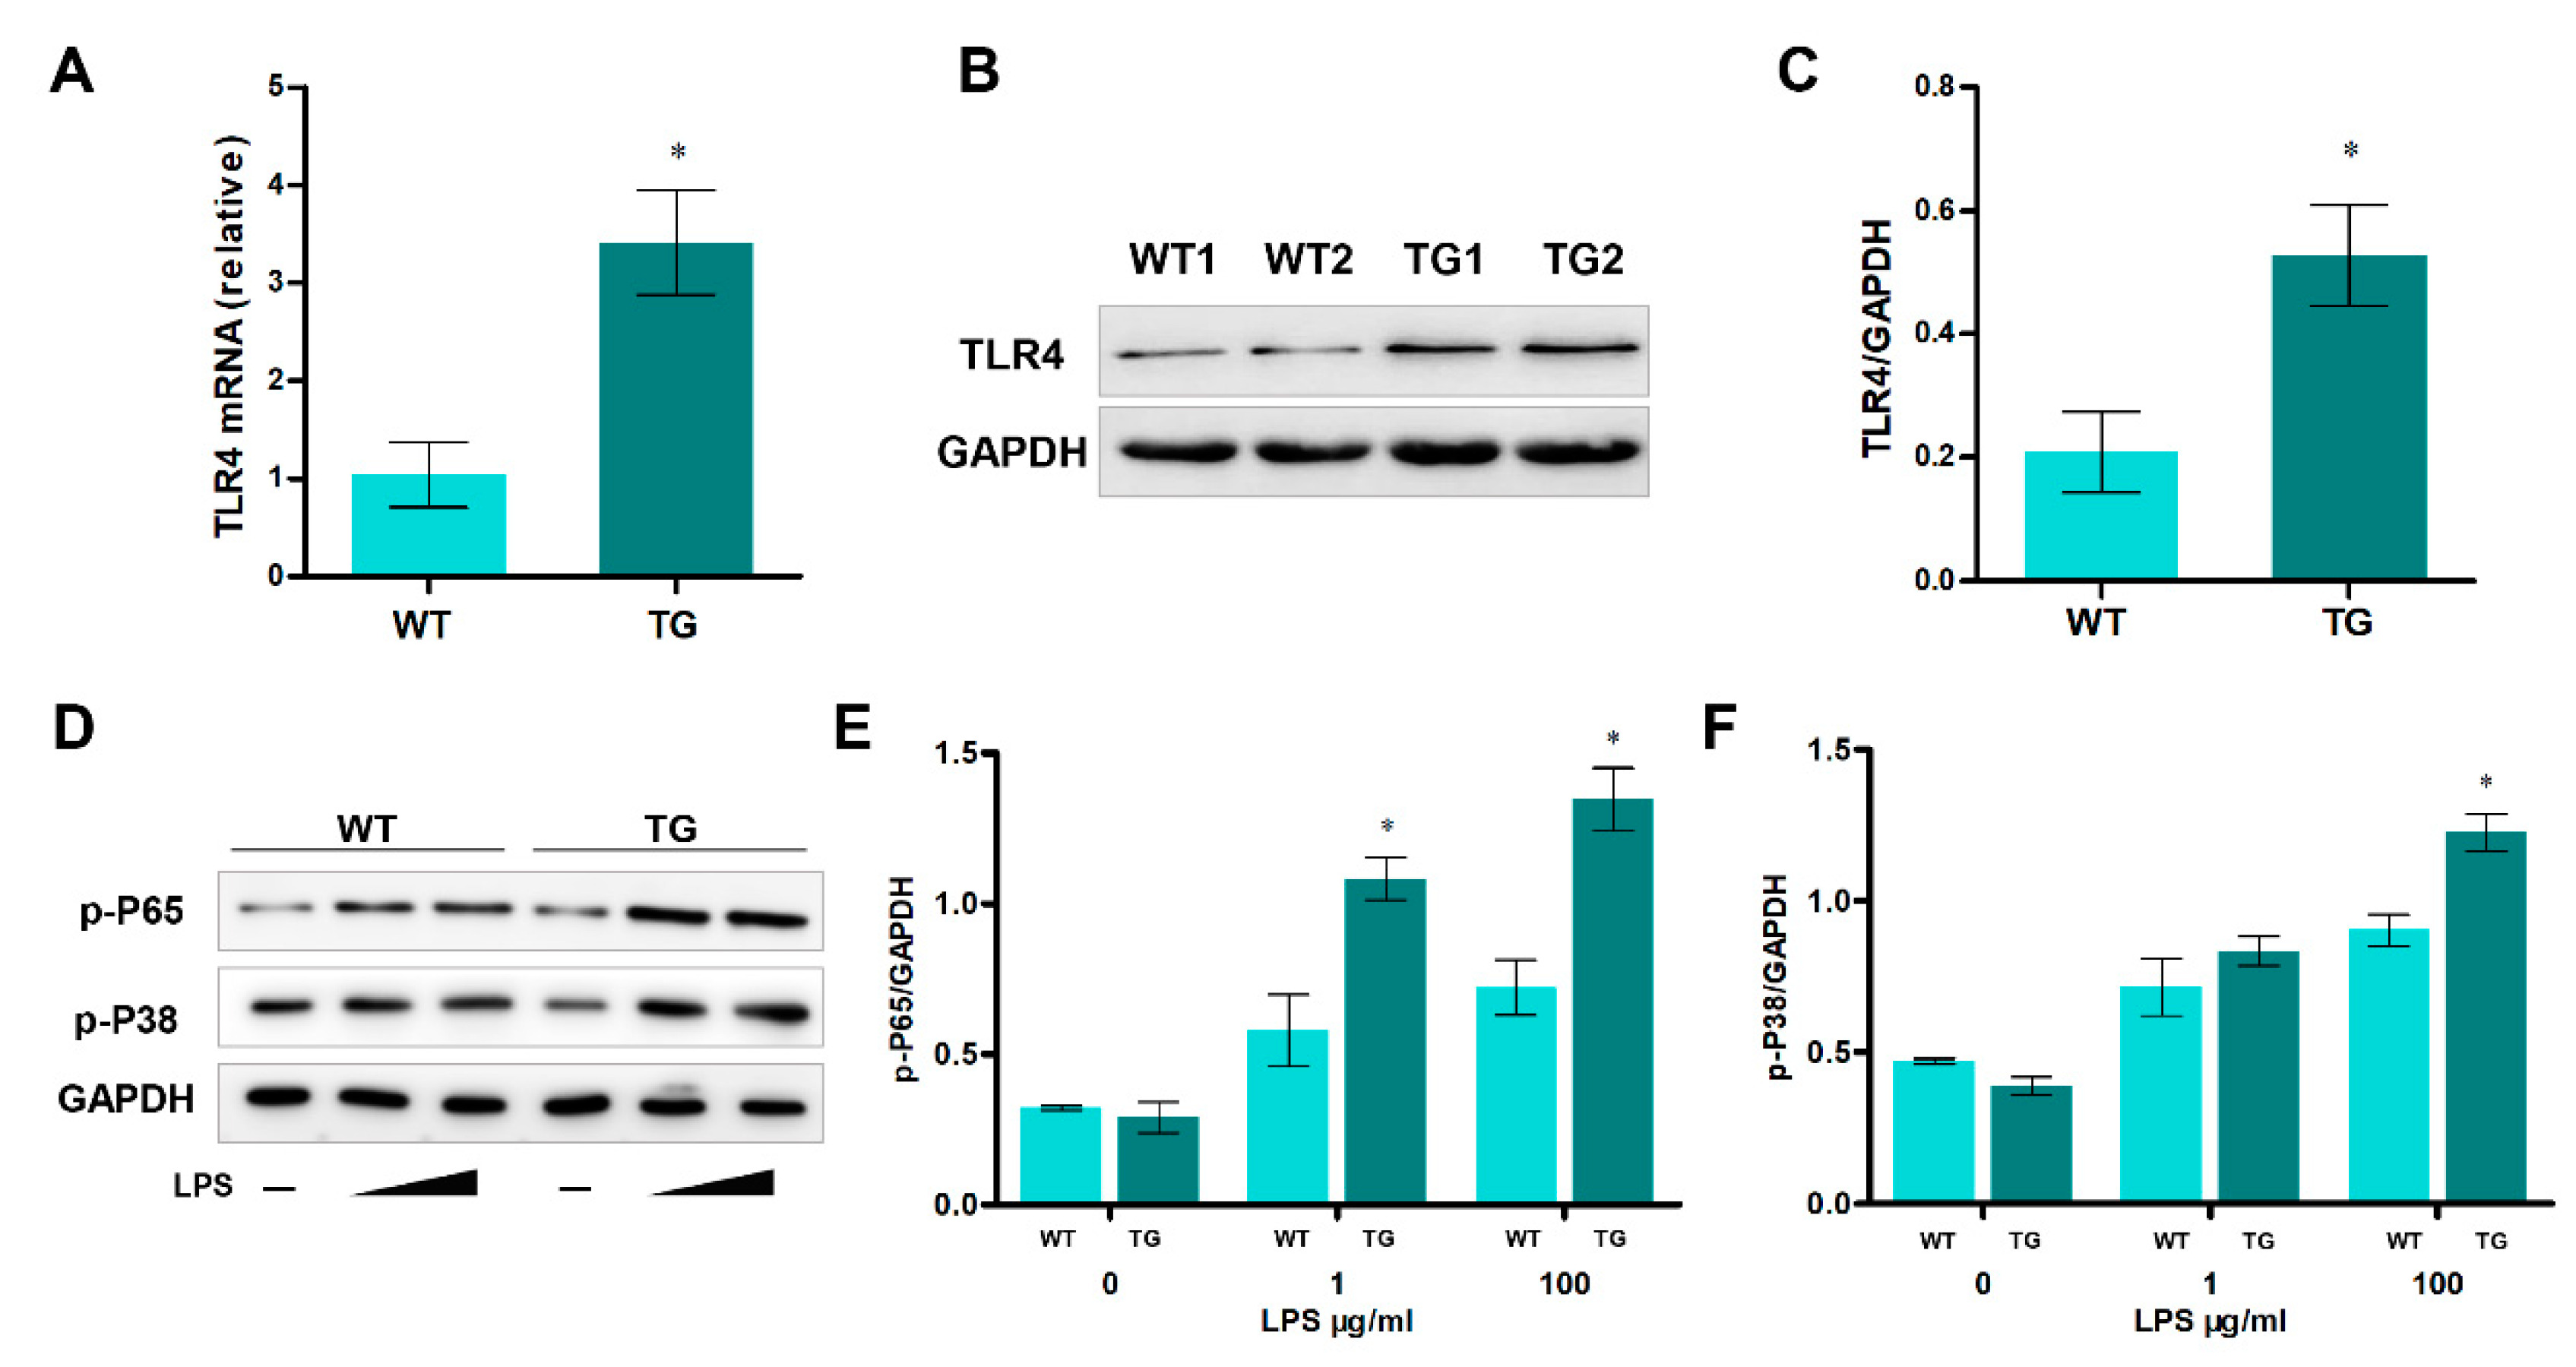
3.2. Generation and identification of transgenic individuals overexpressing TLR4
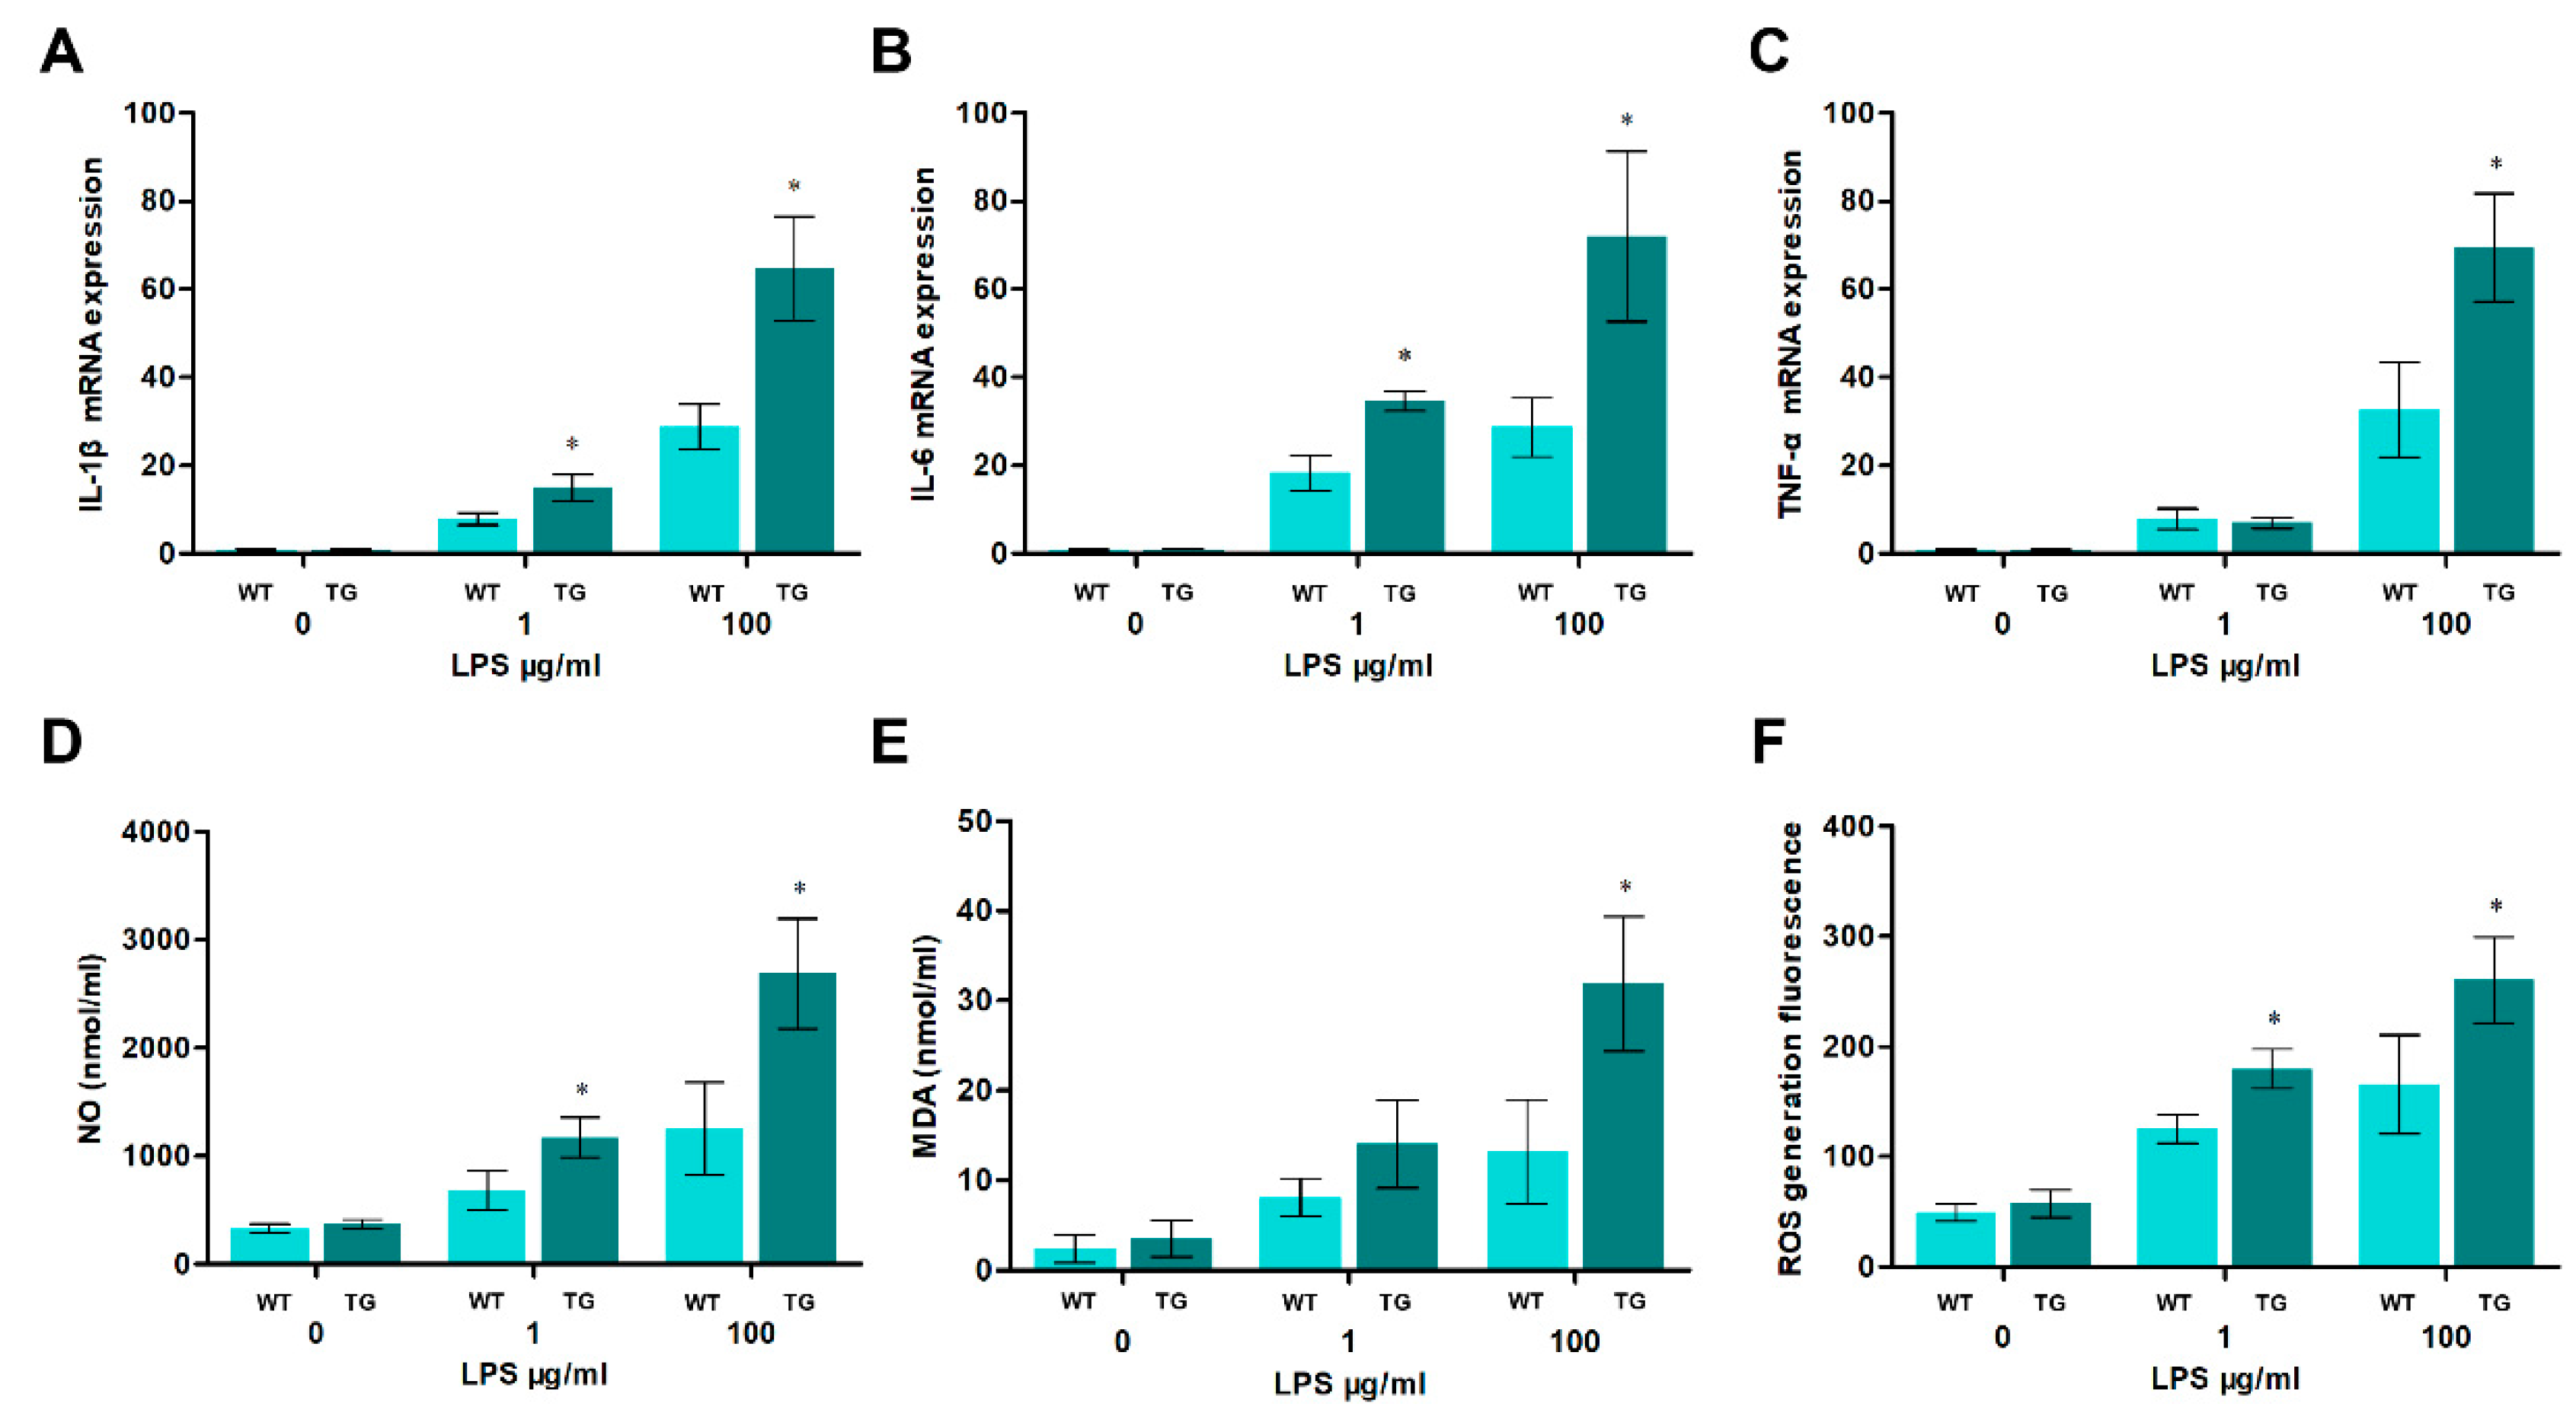
3.3. Over-expression of TLR4 promotes the production of pro-inflammatory cytokines and oxidative stress
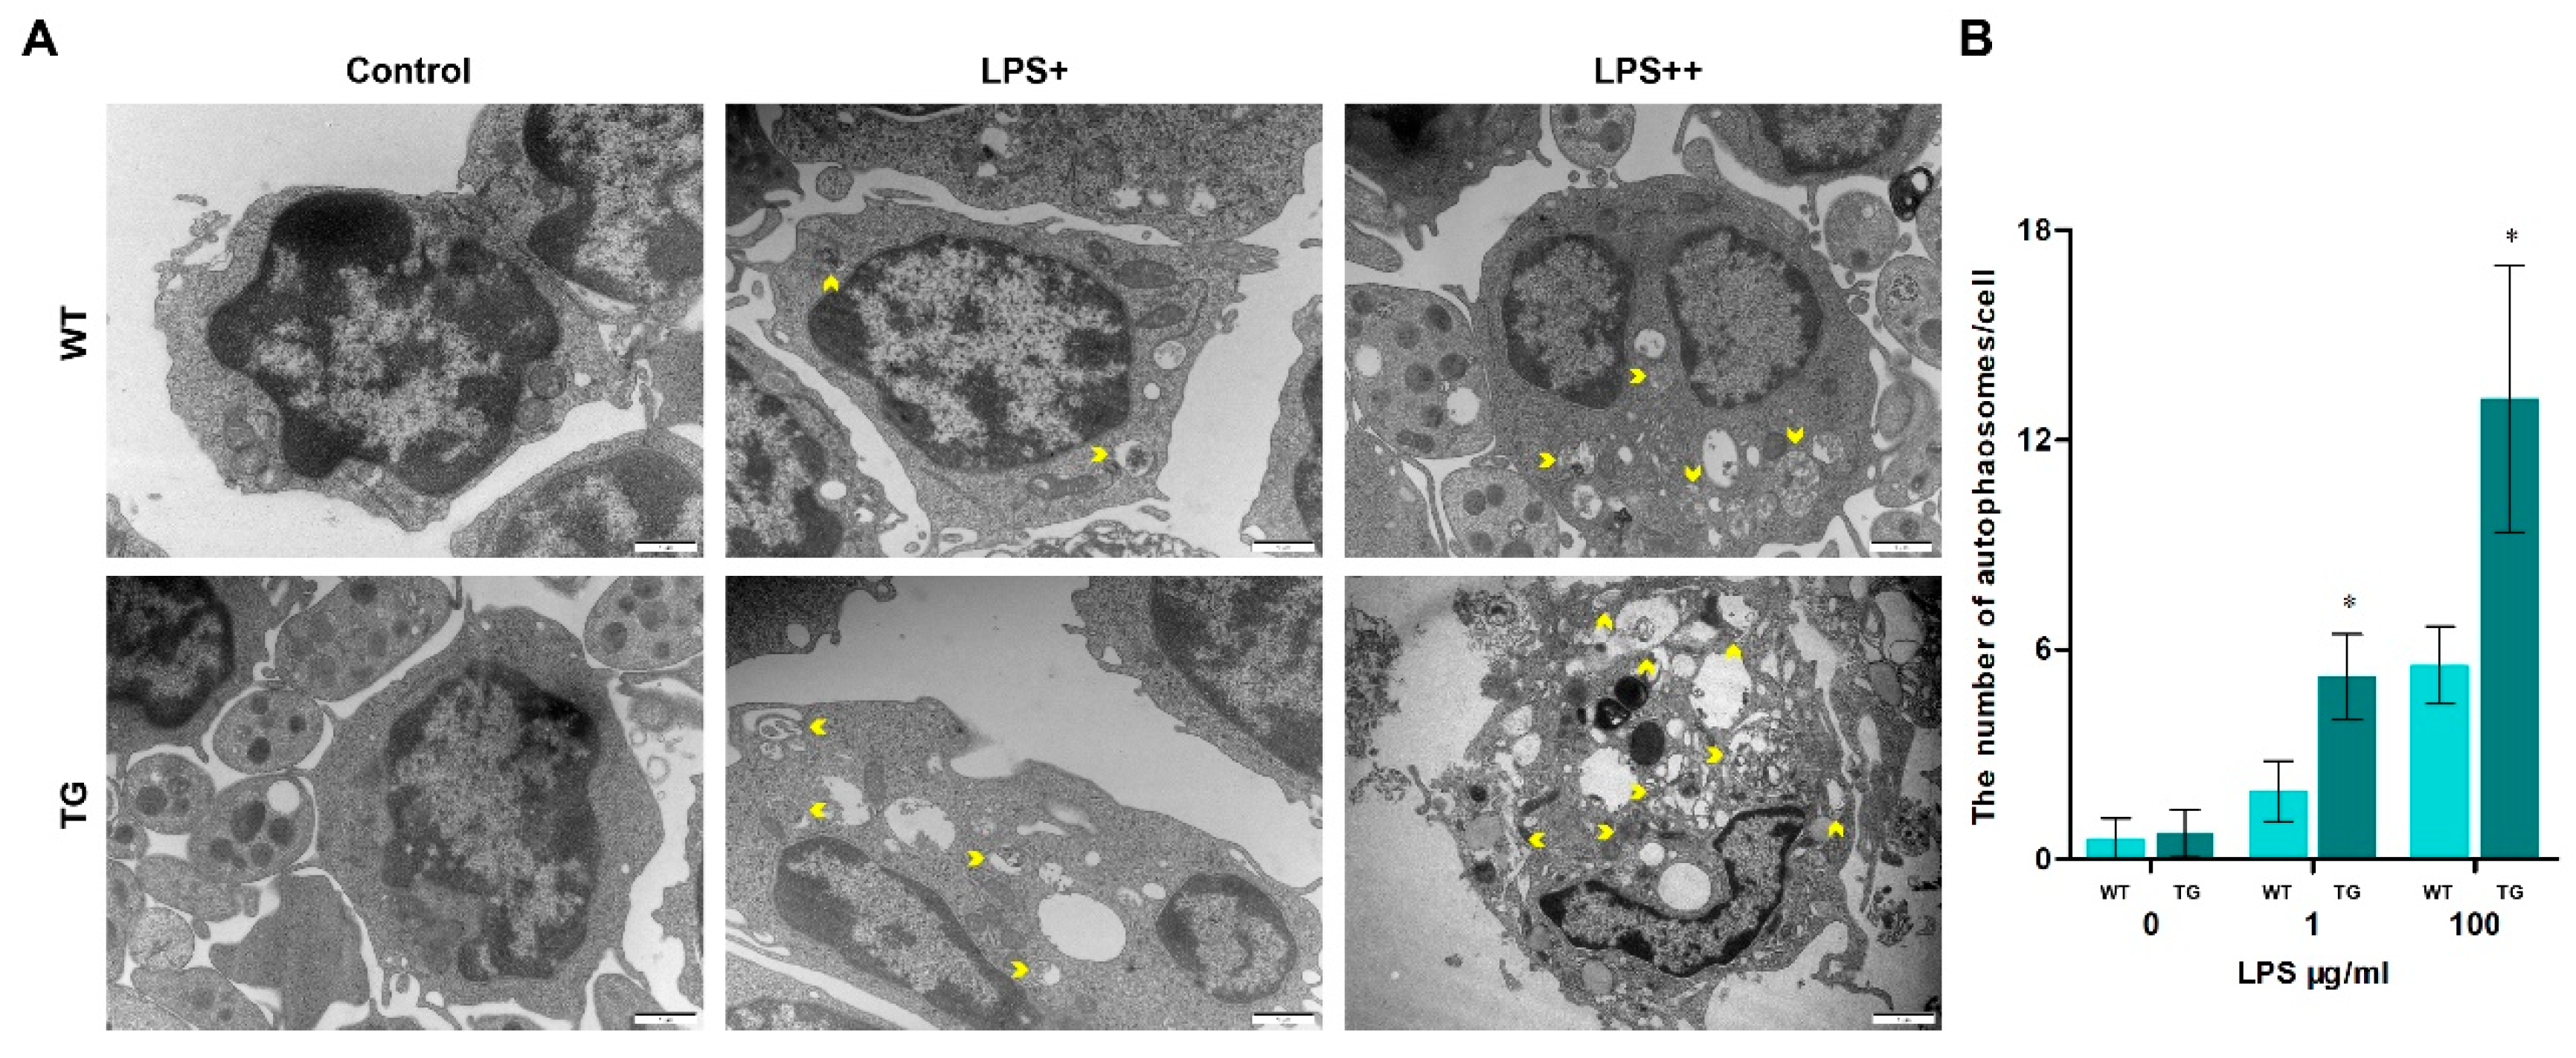
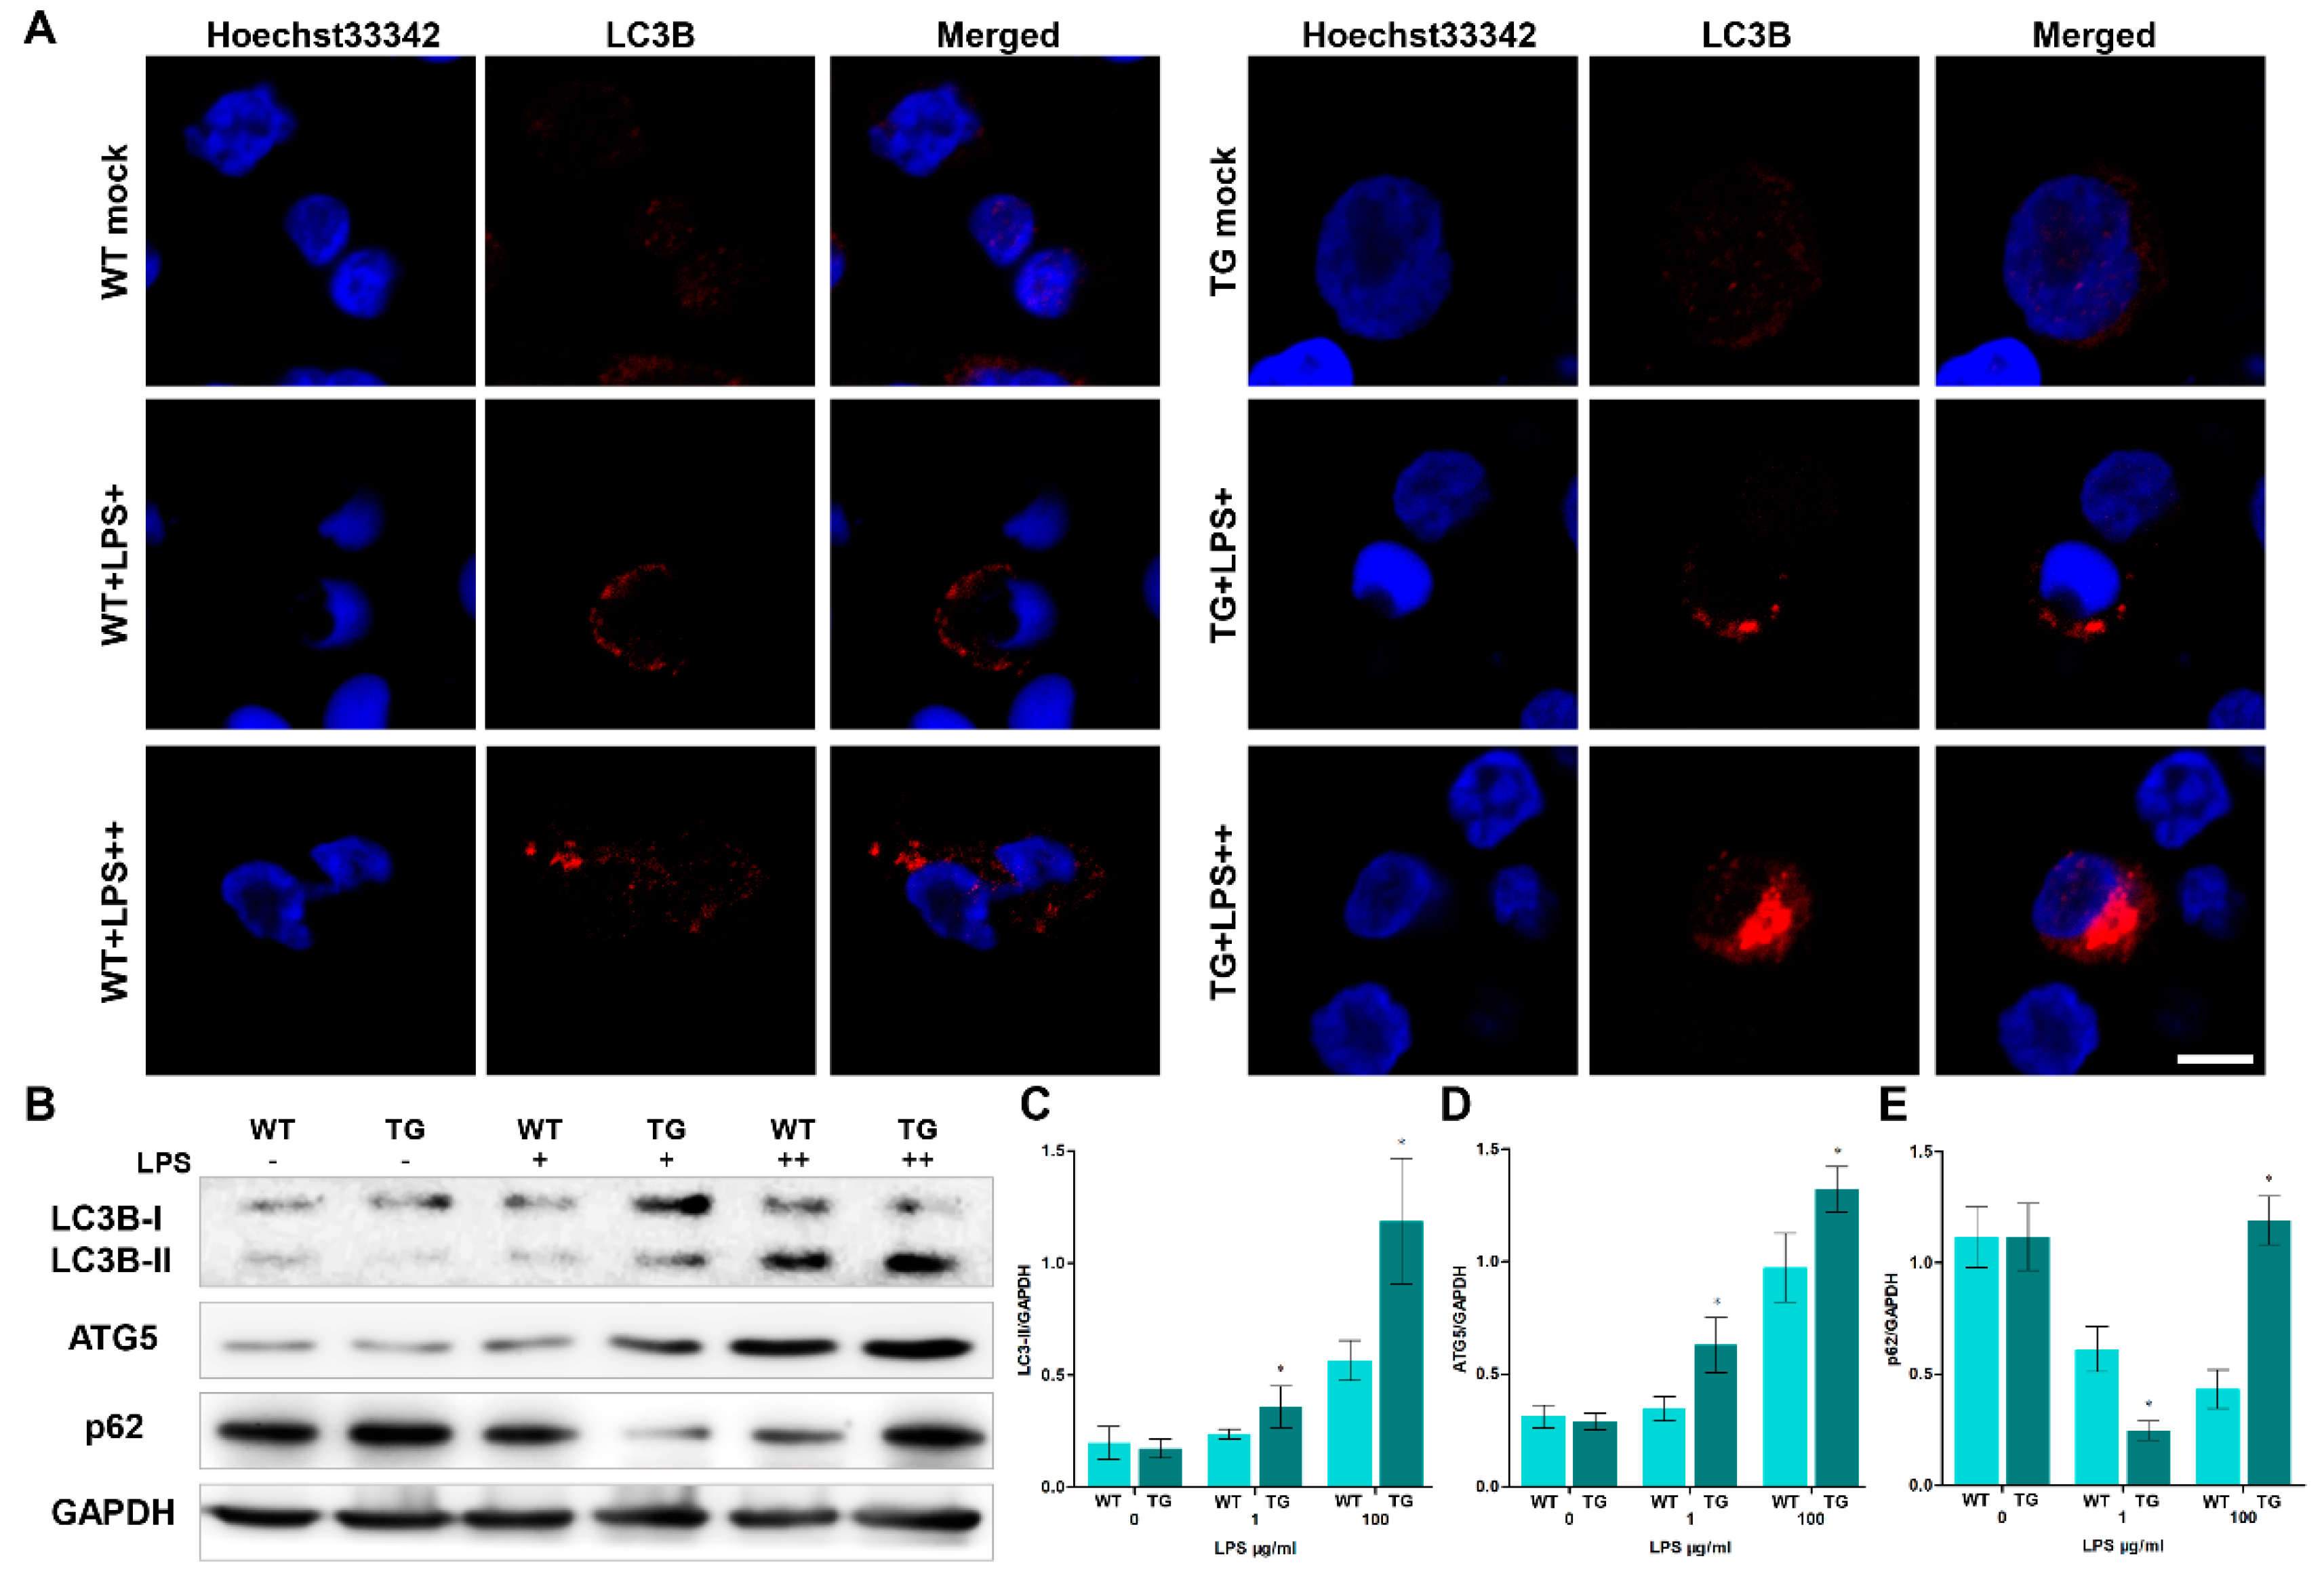
3.4. Overexpression of TLR4 leads to dysfunctional autophagy
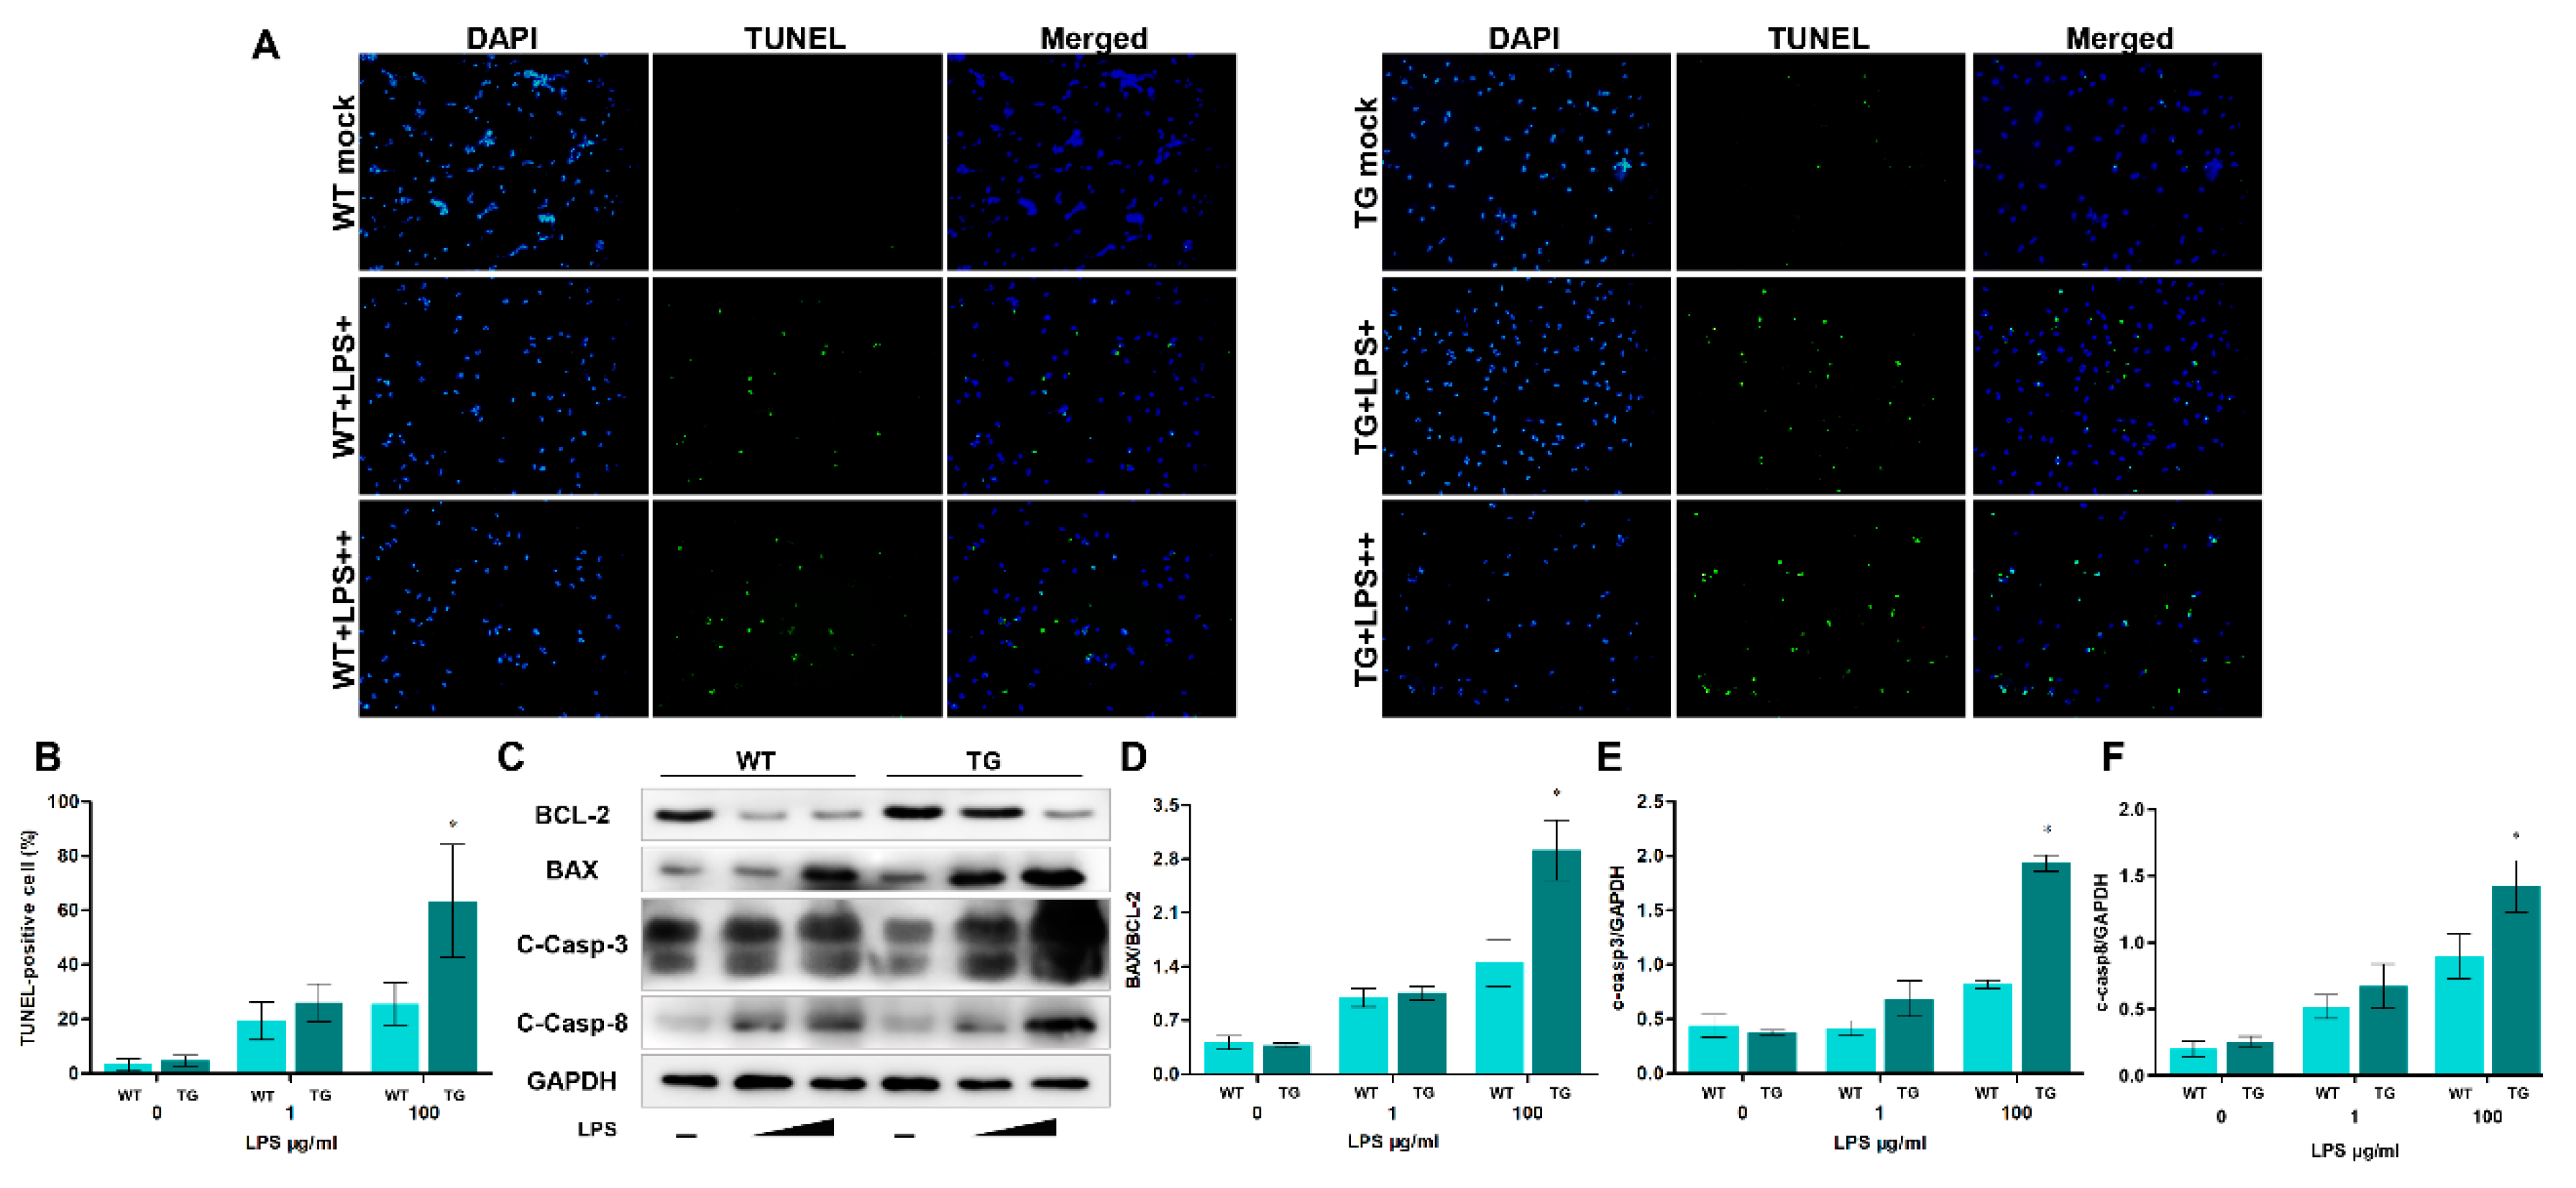
3.5. TLR4 overexpression promotes LPS-induced apoptosis
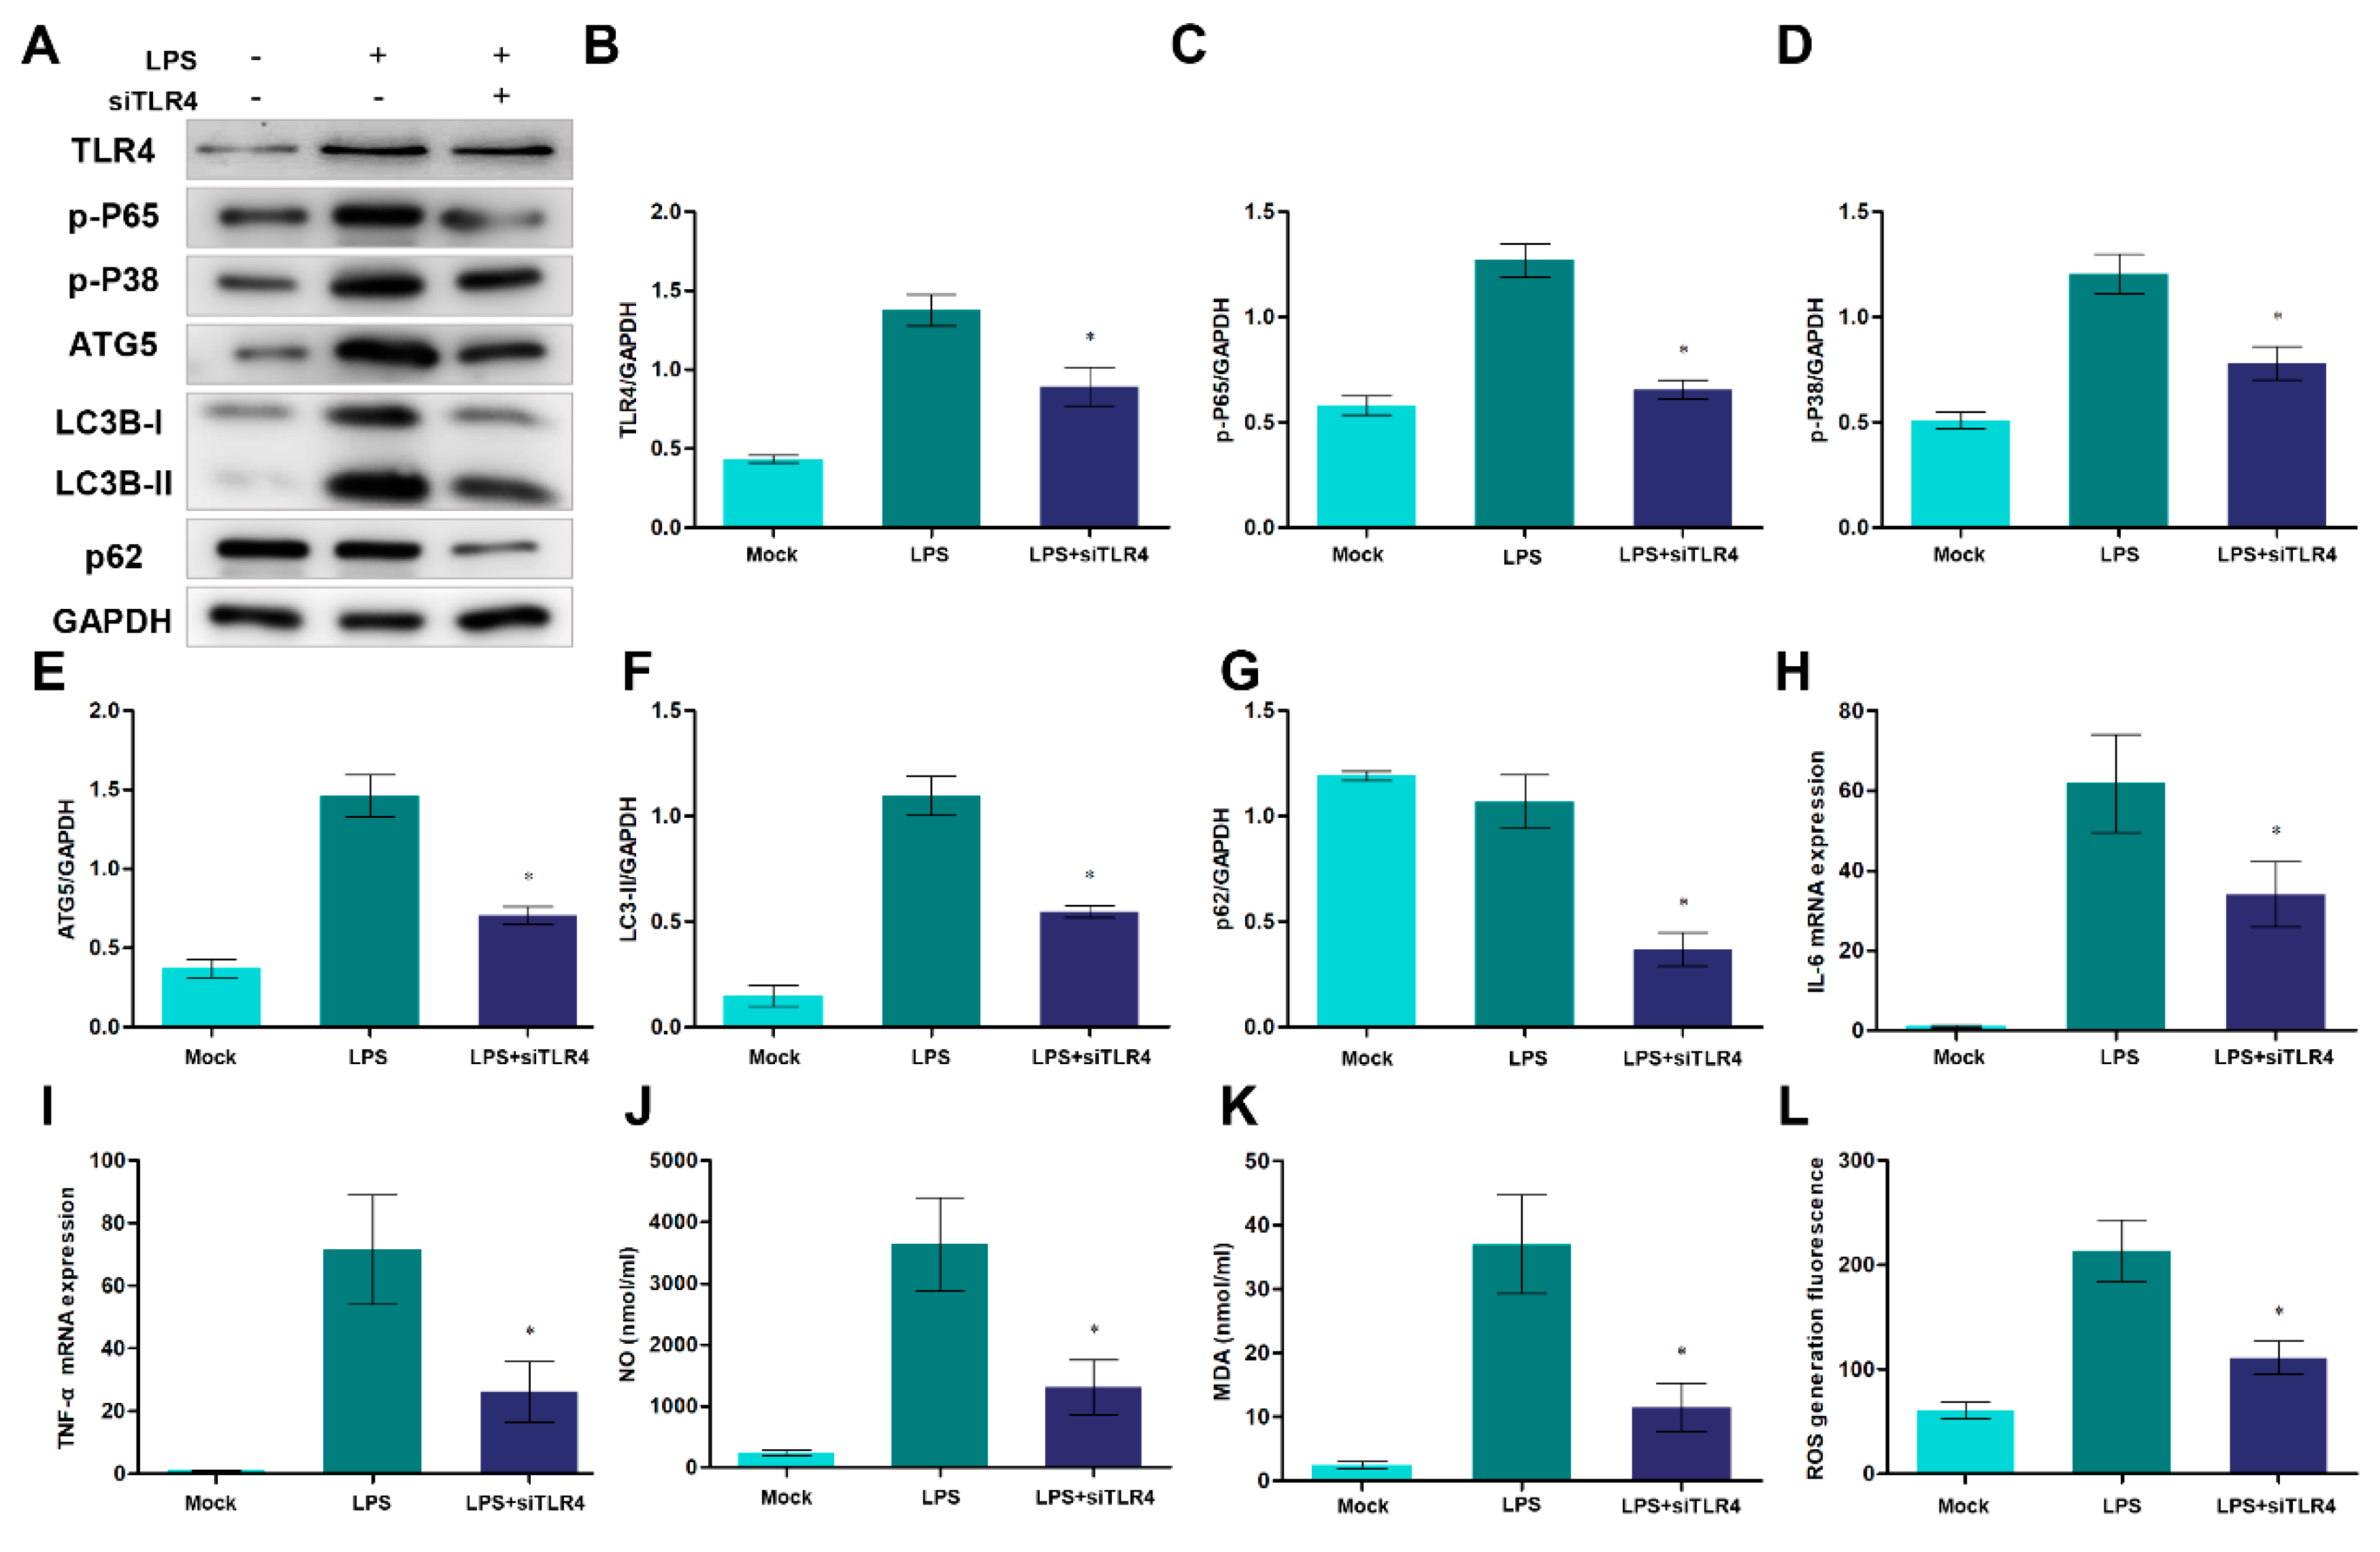
3.6. Knockdown of TLR4 affects autophagy and the production of pro-inflammatory cytokines and oxidative stress
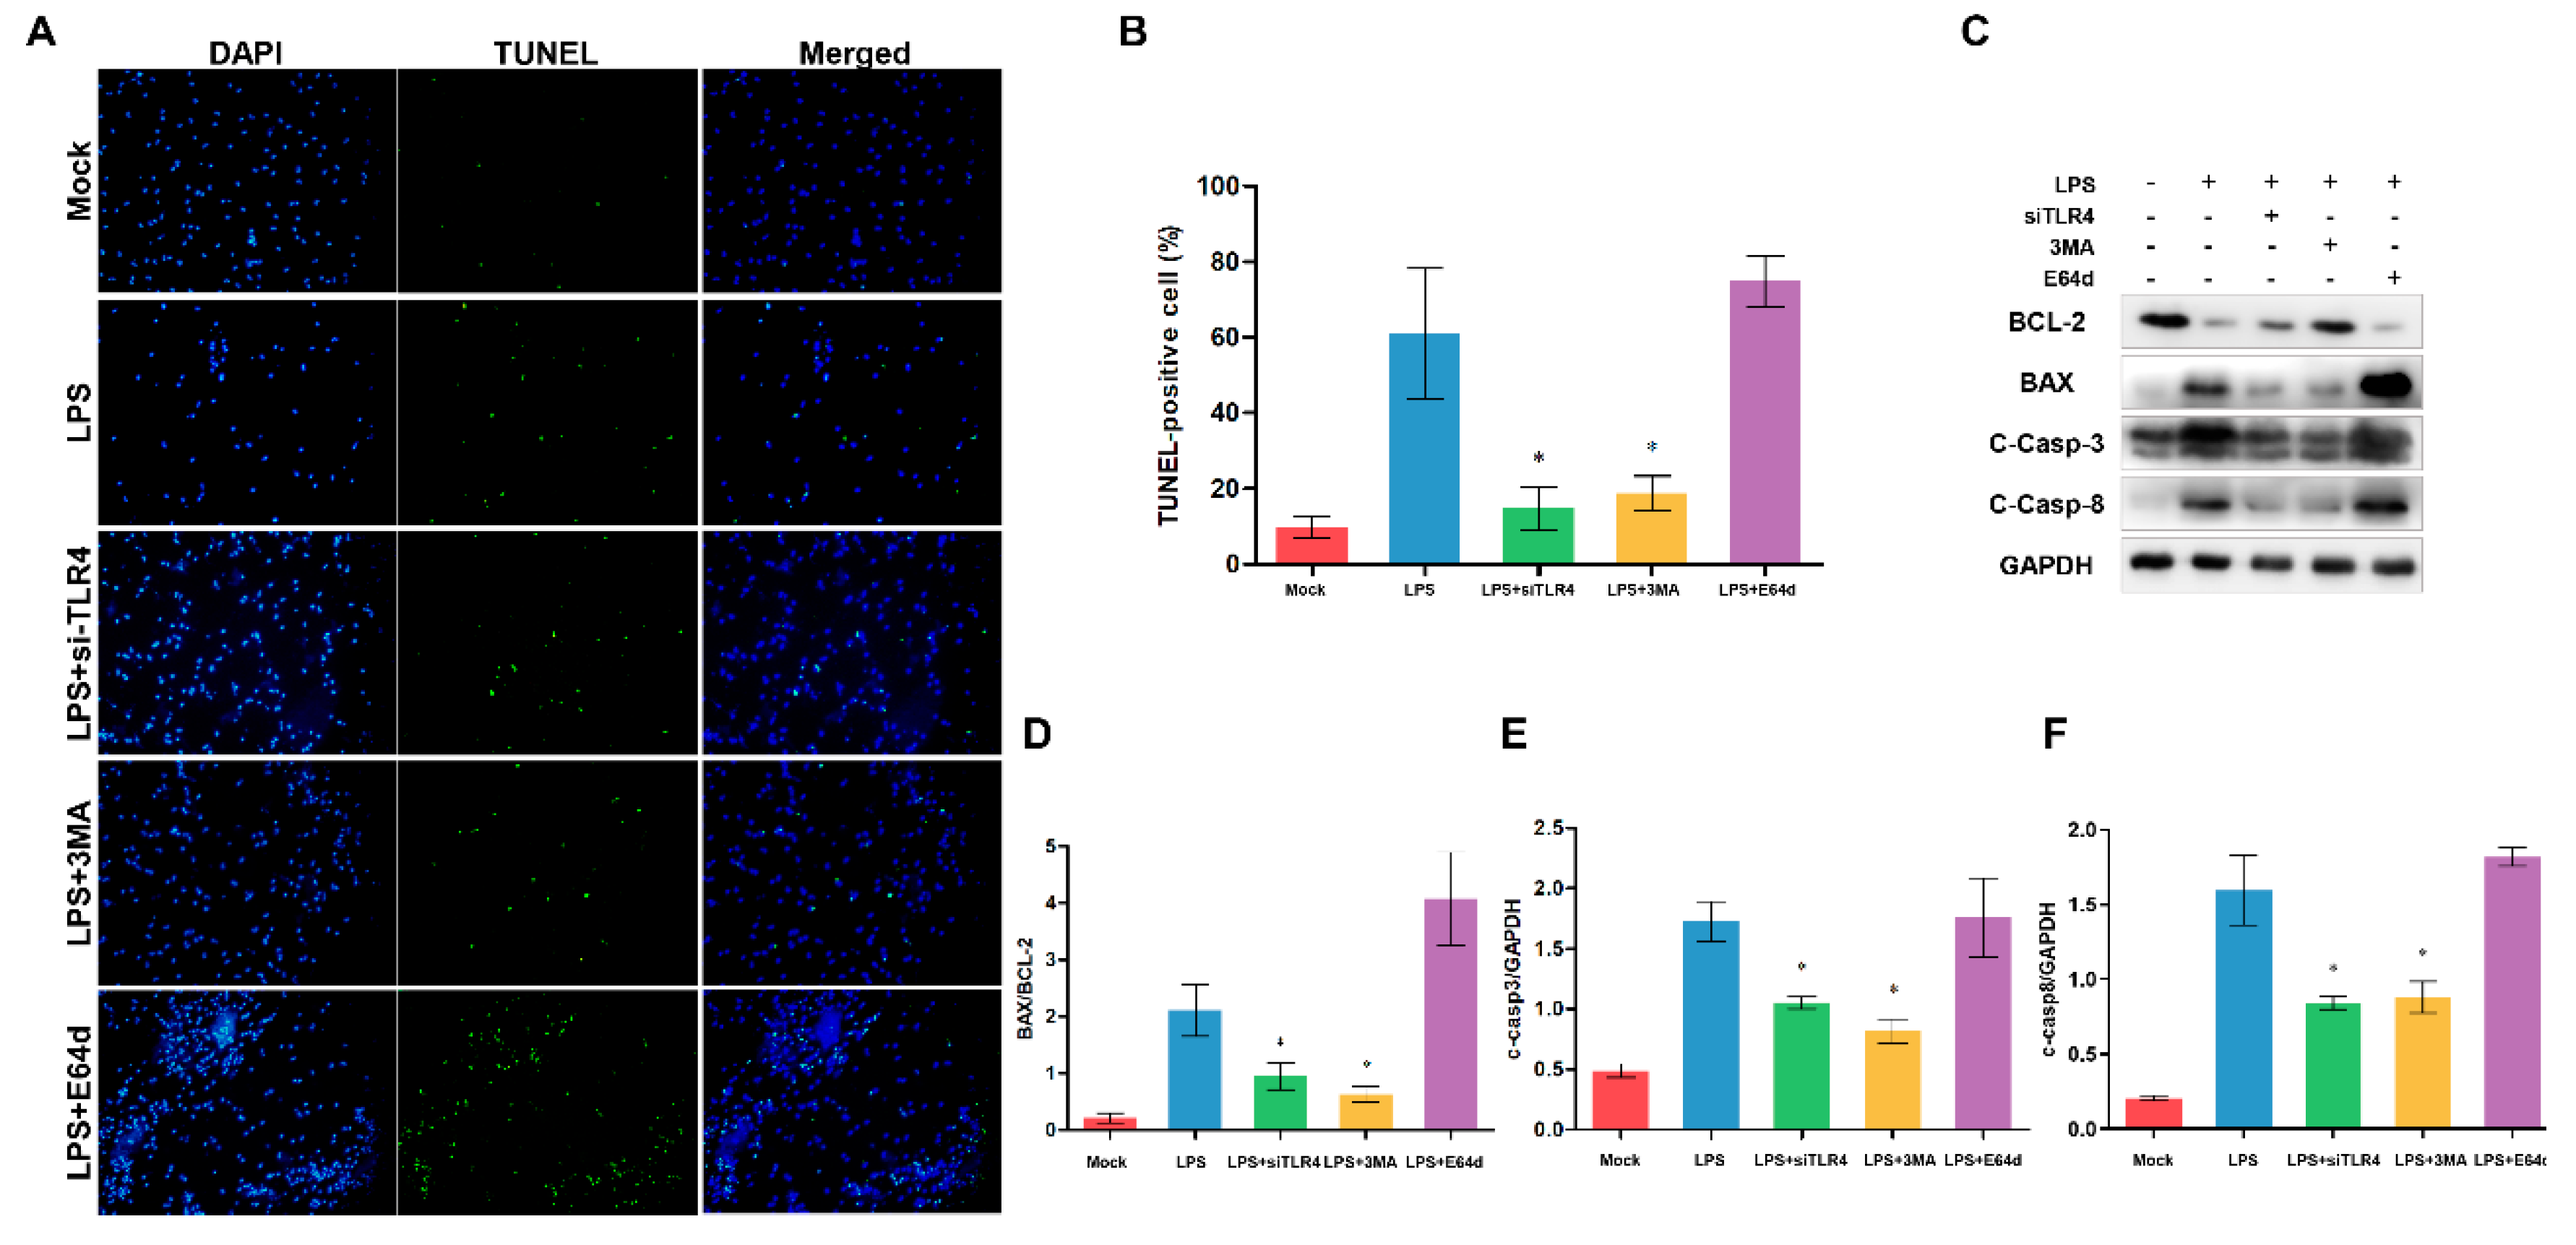
3.7. Inhibition of TLR4 and autophagy alleviates apoptosis
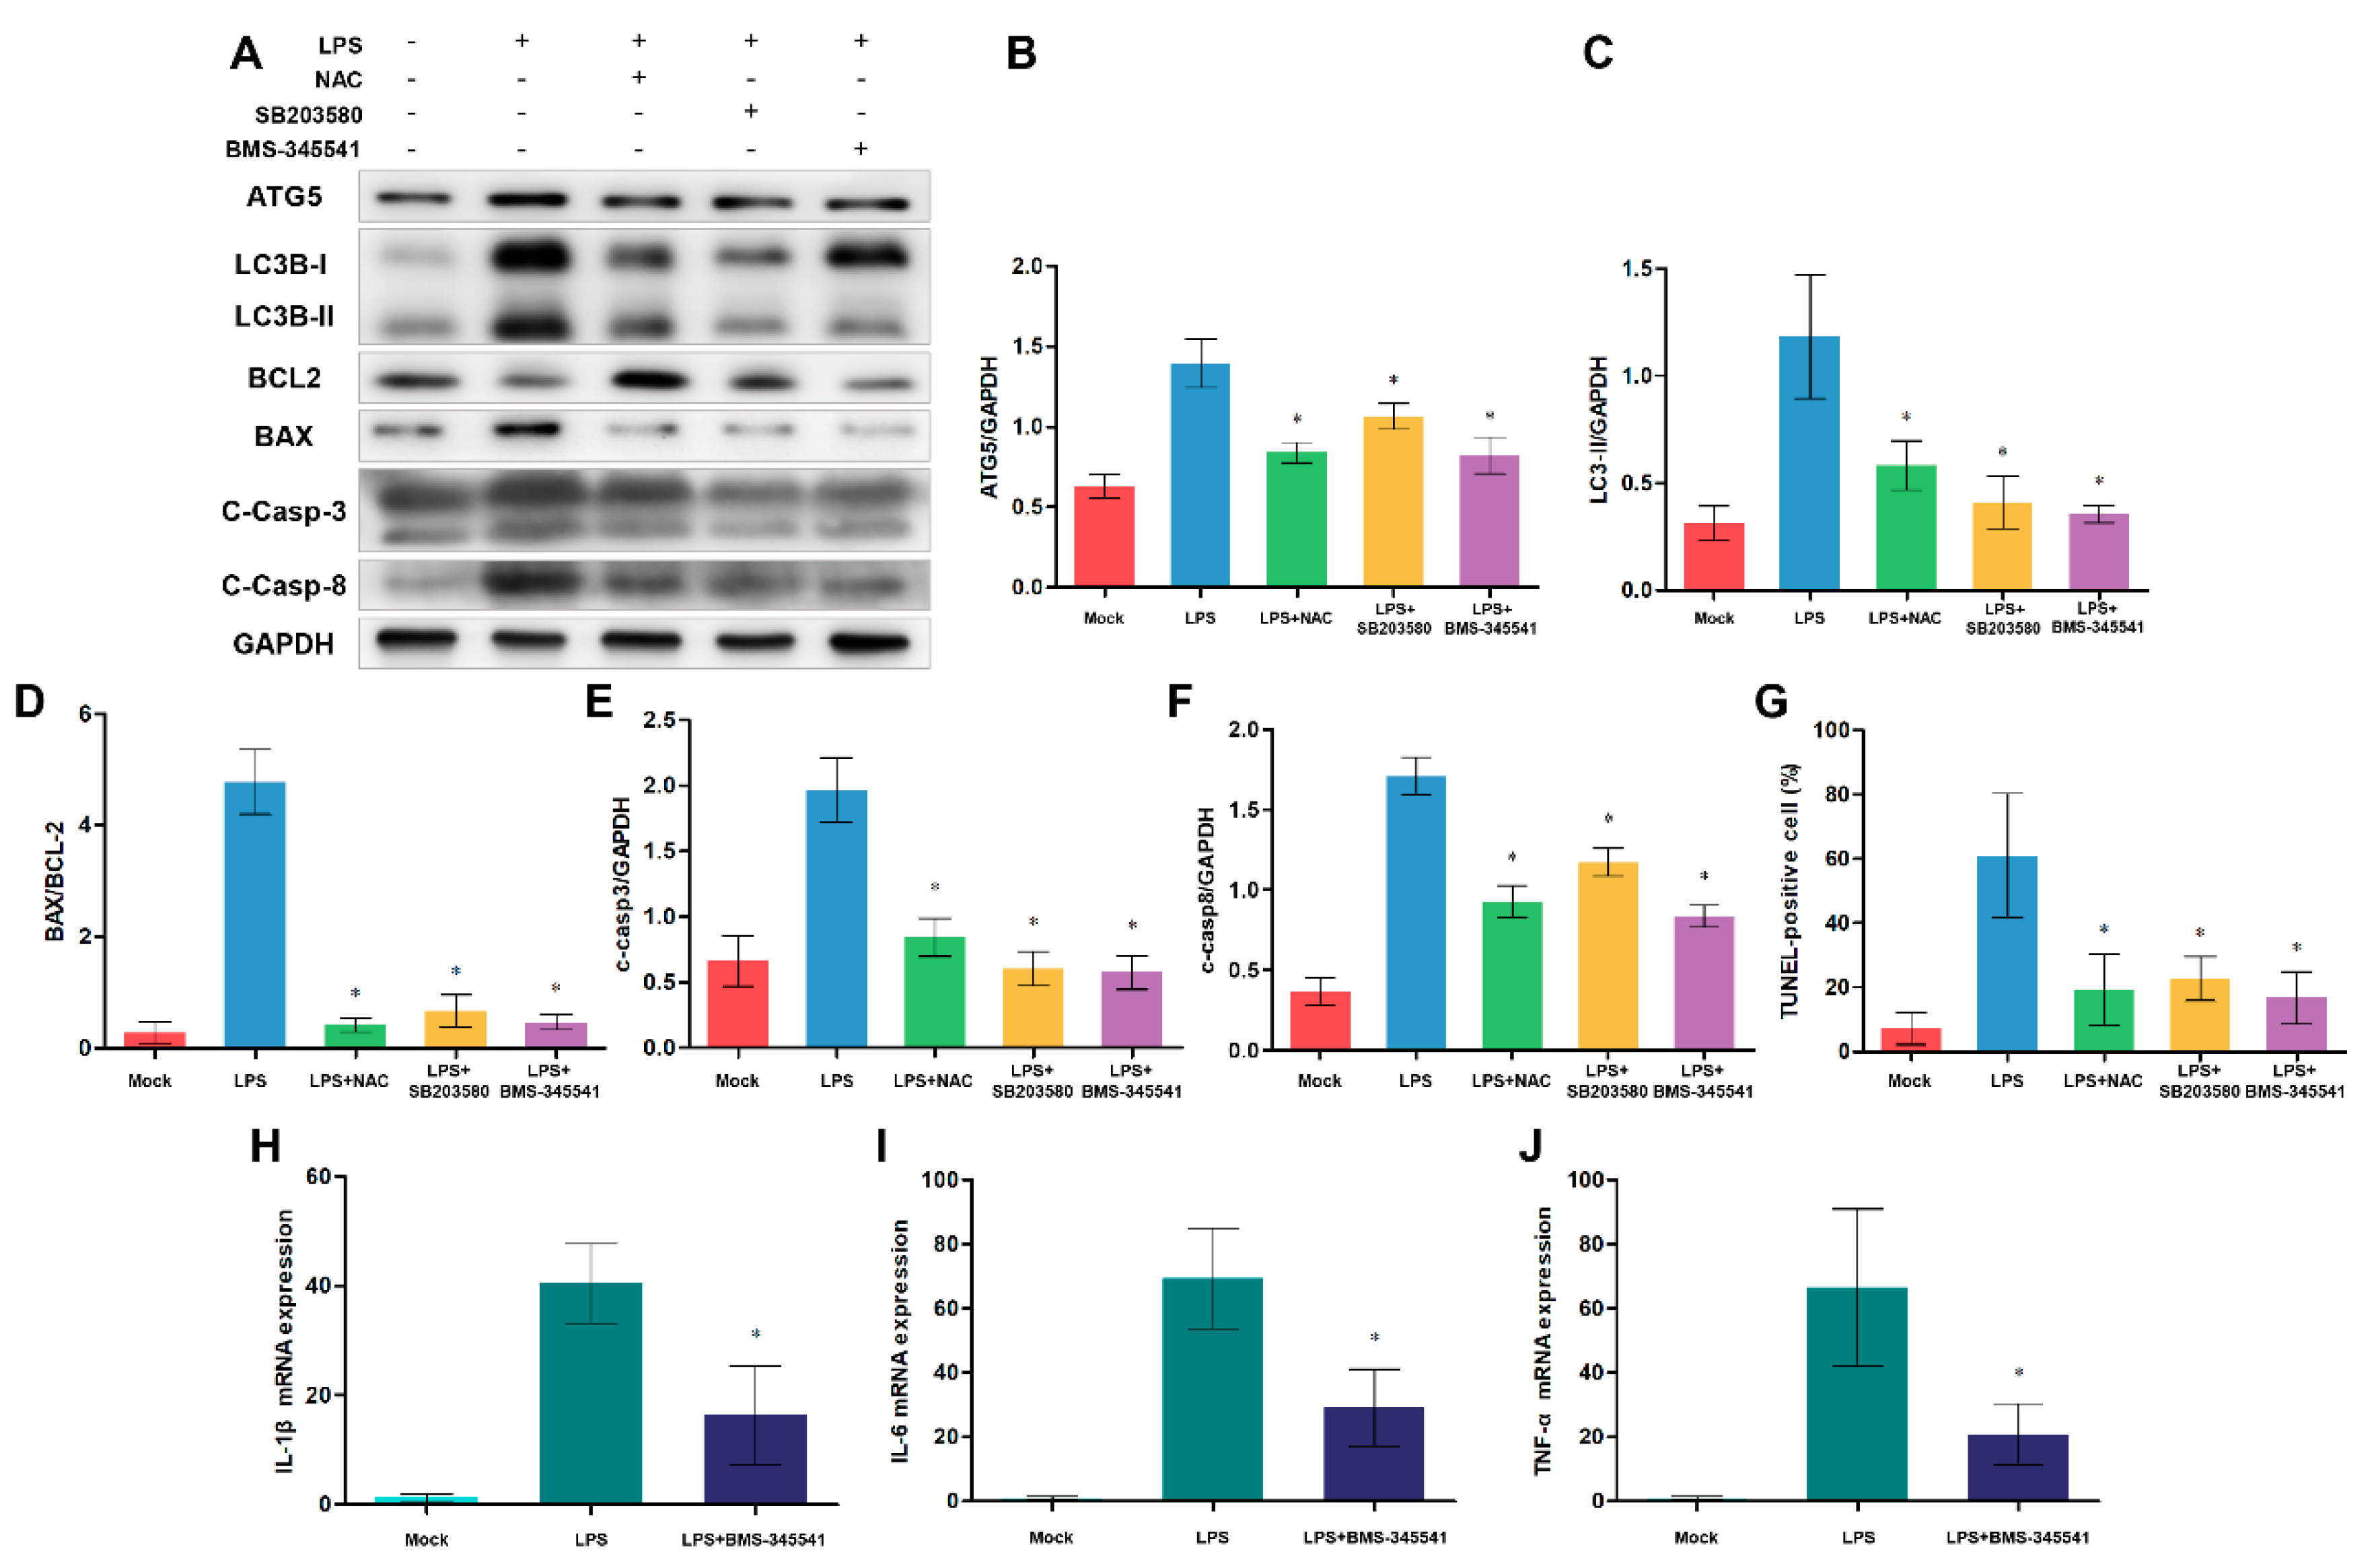
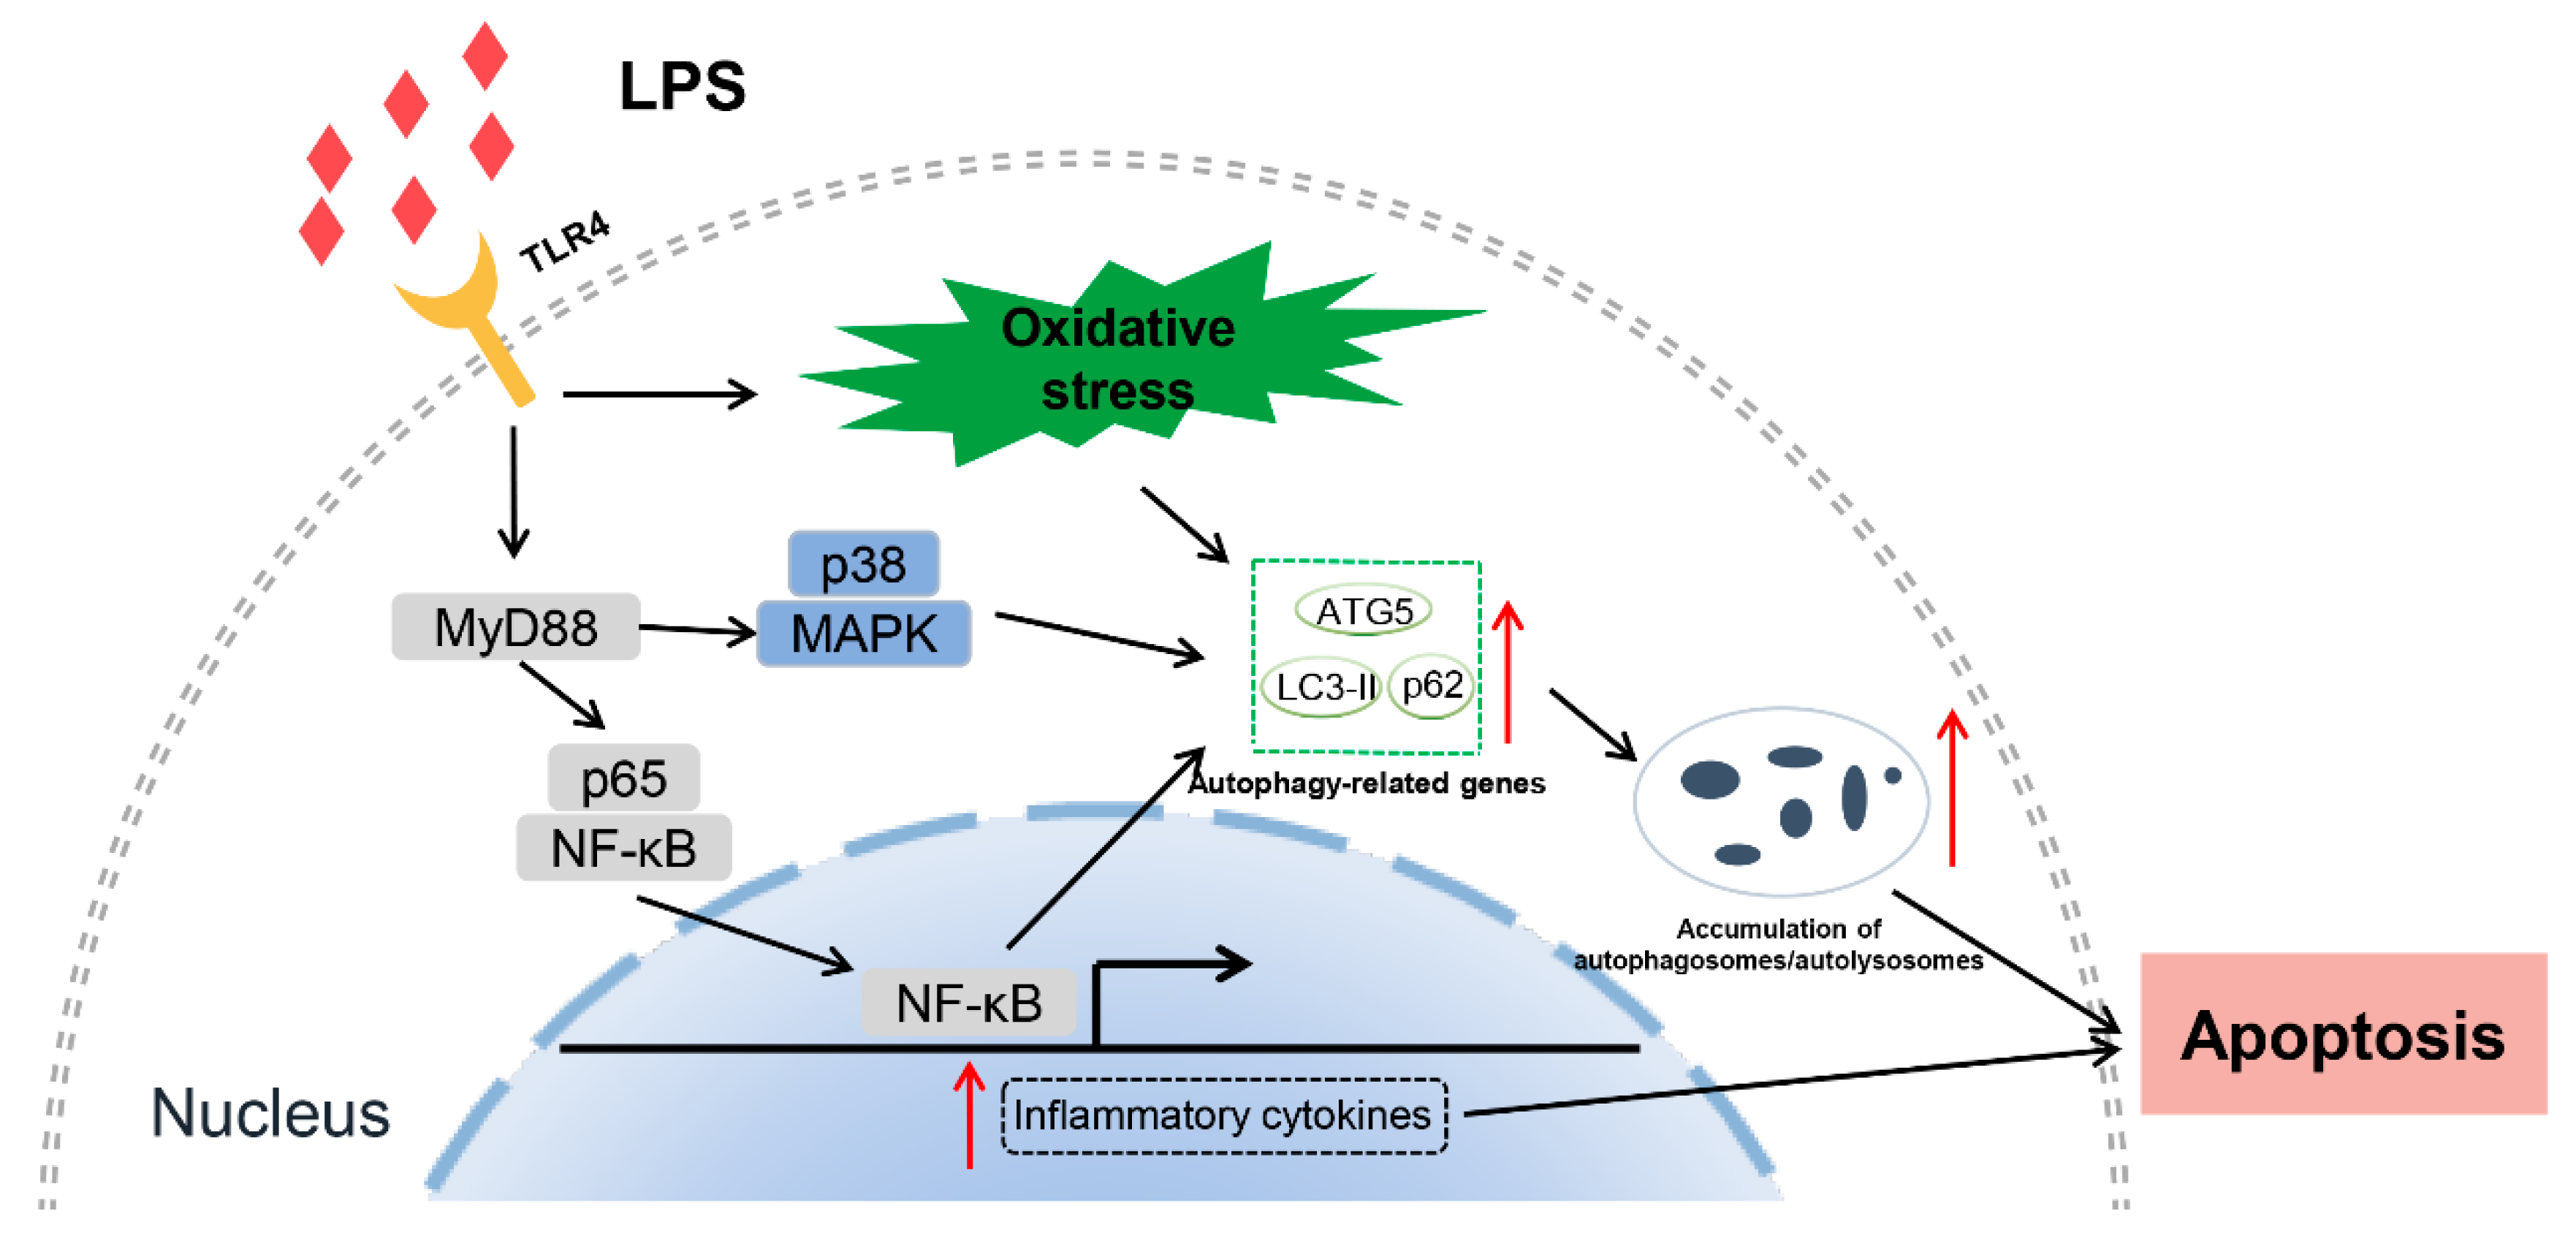
3.8. NF-κB, p38 MAPK signaling pathways and ROS are involved in autophagy-mediated cell death
4. Discussion
5. Conclusions
Supplementary Materials
Author Contributions
Funding
Institutional Review Board Statement
Informed Consent Statement
Data Availability Statement
Conflicts of Interest
Abbreviations
References
- Kawai, T.; Akira, S. Toll-like receptors and their crosstalk with other innate receptors in infection and immunity. Immunity 2011, 34, 637–650. [Google Scholar] [CrossRef]
- Akira, S.; Uematsu, S.; Takeuchi, O. Pathogen recognition and innate immunity. Cell 2006, 124, 783–801. [Google Scholar] [CrossRef]
- West, X.Z.; Malinin, N.L.; Merkulova, A.A.; Tischenko, M.; Kerr, B.A.; Borden, E.C.; Podrez, E.A.; Salomon, R.G.; Byzova, T.V. Oxidative stress induces angiogenesis by activating TLR2 with novel endogenous ligands. Nature 2010, 467, 972–976. [Google Scholar] [CrossRef] [PubMed]
- Yamamoto, M.; Sato, S.; Hemmi, H.; Hoshino, K.; Kaisho, T.; Sanjo, H.; Takeuchi, O.; Sugiyama, M.; Okabe, M.; Takeda, K.; et al. Role of adaptor TRIF in the MyD88-independent toll-like receptor signaling pathway. Science 2003, 301, 640–643. [Google Scholar] [CrossRef]
- Fitzgerald, K.A.; McWhirter, S.M.; Faia, K.L.; Rowe, D.C.; Latz, E.; Golenbock, D.T.; Coyle, A.J.; Liao, S.M.; Maniatis, T. IKKepsilon and TBK1 are essential components of the IRF3 signaling pathway. Nat Immunol 2003, 4, 491–496. [Google Scholar] [CrossRef] [PubMed]
- Perry, A.K.; Chen, G.; Zheng, D.; Tang, H.; Cheng, G. The host type I interferon response to viral and bacterial infections. Cell Res 2005, 15, 407–422. [Google Scholar] [CrossRef]
- Zhang, K.; Huang, Q.; Deng, S.; Yang, Y.; Li, J.; Wang, S. Mechanisms of TLR4-Mediated Autophagy and Nitroxidative Stress. Front Cell Infect Microbiol 2021, 11, 766590. [Google Scholar] [CrossRef]
- Haynes, L.M.; Moore, D.D.; Kurt-Jones, E.A.; Finberg, R.W.; Anderson, L.J.; Tripp, R.A. Involvement of toll-like receptor 4 in innate immunity to respiratory syncytial virus. J Virol 2001, 75, 10730–10737. [Google Scholar] [CrossRef] [PubMed]
- Seki, E.; Tsutsui, H.; Nakano, H.; Tsuji, N.; Hoshino, K.; Adachi, O.; Adachi, K.; Futatsugi, S.; Kuida, K.; Takeuchi, O.; et al. Lipopolysaccharide-induced IL-18 secretion from murine Kupffer cells independently of myeloid differentiation factor 88 that is critically involved in induction of production of IL-12 and IL-1beta. J Immunol 2001, 166, 2651–2657. [Google Scholar] [CrossRef]
- Park, B.S.; Lee, J.O. Recognition of lipopolysaccharide pattern by TLR4 complexes. Exp Mol Med 2013, 45, e66. [Google Scholar] [CrossRef]
- Tan, Y.; Kagan, J.C. A cross-disciplinary perspective on the innate immune responses to bacterial lipopolysaccharide. Mol Cell 2014, 54, 212–223. [Google Scholar] [CrossRef]
- Nakatogawa, H.; Ohbayashi, S.; Sakoh-Nakatogawa, M.; Kakuta, S.; Suzuki, S.W.; Kirisako, H.; Kondo-Kakuta, C.; Noda, N.N.; Yamamoto, H.; Ohsumi, Y. The autophagy-related protein kinase Atg1 interacts with the ubiquitin-like protein Atg8 via the Atg8 family interacting motif to facilitate autophagosome formation. J Biol Chem 2012, 287, 28503–28507. [Google Scholar] [CrossRef] [PubMed]
- Cui, B.; Lin, H.; Yu, J.; Yu, J.; Hu, Z. Autophagy and the Immune Response. Adv Exp Med Biol 2019, 1206, 595–634. [Google Scholar] [CrossRef] [PubMed]
- Sharma, V.; Makhdoomi, M.; Singh, L.; Kumar, P.; Khan, N.; Singh, S.; Verma, H.N.; Luthra, K.; Sarkar, S.; Kumar, D. Trehalose limits opportunistic mycobacterial survival during HIV co-infection by reversing HIV-mediated autophagy block. Autophagy 2021, 17, 476–495. [Google Scholar] [CrossRef]
- Wang, S.; Zhang, K.; Yao, Y.; Li, J. Autophagy and Mitochondrial Homeostasis During Infection: A Double-Edged Sword. Front Cell Dev Biol 2021, 9, 738932. [Google Scholar] [CrossRef] [PubMed]
- Huang, C.Y.; Deng, J.S.; Huang, W.C.; Jiang, W.P.; Huang, G.J. Attenuation of Lipopolysaccharide-Induced Acute Lung Injury by Hispolon in Mice, Through Regulating the TLR4/PI3K/Akt/mTOR and Keap1/Nrf2/HO-1 Pathways, and Suppressing Oxidative Stress-Mediated ER Stress-Induced Apoptosis and Autophagy. Nutrients 2020, 12. [Google Scholar] [CrossRef]
- Shariq, M.; Quadir, N.; Sharma, N.; Singh, J.; Sheikh, J.A.; Khubaib, M.; Hasnain, S.E.; Ehtesham, N.Z. Mycobacterium tuberculosis RipA Dampens TLR4-Mediated Host Protective Response Using a Multi-Pronged Approach Involving Autophagy, Apoptosis, Metabolic Repurposing, and Immune Modulation. Front Immunol 2021, 12, 636644. [Google Scholar] [CrossRef] [PubMed]
- Maiuri, M.C.; Zalckvar, E.; Kimchi, A.; Kroemer, G. Self-eating and self-killing: crosstalk between autophagy and apoptosis. Nat Rev Mol Cell Biol 2007, 8, 741–752. [Google Scholar] [CrossRef]
- Li, S.; Zhou, A.; Wang, J.; Zhang, S. Interplay of autophagy and apoptosis during PRRSV infection of Marc145 cell. Infect Genet Evol 2016, 39, 51–54. [Google Scholar] [CrossRef]
- Wang, S.; Guo, H.; Zhu-Salzman, K.; Ge, F.; Sun, Y. PEBP balances apoptosis and autophagy in whitefly upon arbovirus infection. Nat Commun 2022, 13, 846. [Google Scholar] [CrossRef]
- Mandal, R.; Barron, J.C.; Kostova, I.; Becker, S.; Strebhardt, K. Caspase-8: The double-edged sword. Biochim Biophys Acta Rev Cancer 2020, 1873, 188357. [Google Scholar] [CrossRef] [PubMed]
- Teng, Y.N.; Chang, H.C.; Chao, Y.Y.; Cheng, H.L.; Lien, W.C.; Wang, C.Y. Etoposide Triggers Cellular Senescence by Inducing Multiple Centrosomes and Primary Cilia in Adrenocortical Tumor Cells. Cells 2021, 10. [Google Scholar] [CrossRef] [PubMed]
- Pattingre, S.; Bauvy, C.; Levade, T.; Levine, B.; Codogno, P. Ceramide-induced autophagy: to junk or to protect cells? Autophagy 2009, 5, 558–560. [Google Scholar] [CrossRef]
- Denton, D.; Kumar, S. Autophagy-dependent cell death. Cell Death Differ 2019, 26, 605–616. [Google Scholar] [CrossRef]
- Song, S.; Tan, J.; Miao, Y.; Li, M.; Zhang, Q. Crosstalk of autophagy and apoptosis: Involvement of the dual role of autophagy under ER stress. J Cell Physiol 2017, 232, 2977–2984. [Google Scholar] [CrossRef] [PubMed]
- Xia, L.; Xu, Z.; Zhou, X.; Bergmann, F.; Grabe, N.; Buchler, M.W.; Neoptolemos, J.P.; Hackert, T.; Kroemer, G.; Fortunato, F. Impaired autophagy increases susceptibility to endotoxin-induced chronic pancreatitis. Cell Death Dis 2020, 11, 889. [Google Scholar] [CrossRef] [PubMed]
- Larabi, A.; Barnich, N.; Nguyen, H.T.T. New insights into the interplay between autophagy, gut microbiota and inflammatory responses in IBD. Autophagy 2020, 16, 38–51. [Google Scholar] [CrossRef]
- Deng, S.; Wu, Q.; Yu, K.; Zhang, Y.; Yao, Y.; Li, W.; Deng, Z.; Liu, G.; Li, W.; Lian, Z. Changes in the relative inflammatory responses in sheep cells overexpressing of toll-like receptor 4 when stimulated with LPS. PLoS One 2012, 7, e47118. [Google Scholar] [CrossRef]
- Lee, S.; Karki, R.; Wang, Y.; Nguyen, L.N.; Kalathur, R.C.; Kanneganti, T.D. AIM2 forms a complex with pyrin and ZBP1 to drive PANoptosis and host defence. Nature 2021, 597, 415–419. [Google Scholar] [CrossRef]
- Zhou, L.; Ding, X.; Wang, J.; Bai, S.; Zeng, Q.; Su, Z.; Xuan, Y.; Wu, A.; Zhang, K. Oxidized Oils and Oxidized Proteins Induce Apoptosis in Granulosa Cells by Increasing Oxidative Stress in Ovaries of Laying Hens. Oxid Med Cell Longev 2020, 2020, 2685310. [Google Scholar] [CrossRef]
- Wang, S.; Cao, Y.; Deng, S.; Jiang, X.; Wang, J.; Zhang, X.; Zhang, J.; Liu, G.; Lian, Z. Overexpression of Toll-like Receptor 4-linked Mitogen-activated Protein Kinase Signaling Contributes to Internalization of Escherichia coli in Sheep. Int J Biol Sci 2018, 14, 1022–1032. [Google Scholar] [CrossRef] [PubMed]
- Wang, S.; Deng, S.; Cao, Y.; Zhang, R.; Wang, Z.; Jiang, X.; Wang, J.; Zhang, X.; Zhang, J.; Liu, G.; et al. Overexpression of Toll-Like Receptor 4 Contributes to Phagocytosis of Salmonella Enterica Serovar Typhimurium via Phosphoinositide 3-Kinase Signaling in Sheep. Cell Physiol Biochem 2018, 49, 662–677. [Google Scholar] [CrossRef] [PubMed]
- Gram, A.; Grazul-Bilska, A.T.; Boos, A.; Rahman, N.A.; Kowalewski, M.P. Lipopolysaccharide disrupts gap junctional intercellular communication in an immortalized ovine luteal endothelial cell line. Toxicol In Vitro 2019, 60, 437–449. [Google Scholar] [CrossRef]
- Glowacka, P.; Zakowska, D.; Naylor, K.; Niemcewicz, M.; Bielawska-Drozd, A. Brucella - Virulence Factors, Pathogenesis and Treatment. Pol J Microbiol 2018, 67, 151–161. [Google Scholar] [CrossRef] [PubMed]
- Deng, M.; Scott, M.J.; Loughran, P.; Gibson, G.; Sodhi, C.; Watkins, S.; Hackam, D.; Billiar, T.R. Lipopolysaccharide clearance, bacterial clearance, and systemic inflammatory responses are regulated by cell type-specific functions of TLR4 during sepsis. J Immunol 2013, 190, 5152–5160. [Google Scholar] [CrossRef]
- Pei, J.; Ding, X.; Fan, Y.; Rice-Ficht, A.; Ficht, T.A. Toll-like receptors are critical for clearance of Brucella and play different roles in development of adaptive immunity following aerosol challenge in mice. Front Cell Infect Microbiol 2012, 2, 115. [Google Scholar] [CrossRef]
- Takeuchi, O.; Hoshino, K.; Kawai, T.; Sanjo, H.; Takada, H.; Ogawa, T.; Takeda, K.; Akira, S. Differential roles of TLR2 and TLR4 in recognition of gram-negative and gram-positive bacterial cell wall components. Immunity 1999, 11, 443–451. [Google Scholar] [CrossRef]
- Arpaia, N.; Godec, J.; Lau, L.; Sivick, K.E.; McLaughlin, L.M.; Jones, M.B.; Dracheva, T.; Peterson, S.N.; Monack, D.M.; Barton, G.M. TLR signaling is required for Salmonella typhimurium virulence. Cell 2011, 144, 675–688. [Google Scholar] [CrossRef]
- Roy, M.F.; Lariviere, L.; Wilkinson, R.; Tam, M.; Stevenson, M.M.; Malo, D. Incremental expression of Tlr4 correlates with mouse resistance to Salmonella infection and fine regulation of relevant immune genes. Genes Immun 2006, 7, 372–383. [Google Scholar] [CrossRef]
- Zhou, M.; Xu, W.; Wang, J.; Yan, J.; Shi, Y.; Zhang, C.; Ge, W.; Wu, J.; Du, P.; Chen, Y. Boosting mTOR-dependent autophagy via upstream TLR4-MyD88-MAPK signalling and downstream NF-kappaB pathway quenches intestinal inflammation and oxidative stress injury. EBioMedicine 2018, 35, 345–360. [Google Scholar] [CrossRef]
- Feng, Y.; He, D.; Yao, Z.; Klionsky, D.J. The machinery of macroautophagy. Cell Res 2014, 24, 24–41. [Google Scholar] [CrossRef] [PubMed]
- Doherty, J.; Baehrecke, E.H. Life, death and autophagy. Nat Cell Biol 2018, 20, 1110–1117. [Google Scholar] [CrossRef]
- Choi, Y.; Bowman, J.W.; Jung, J.U. Autophagy during viral infection - a double-edged sword. Nat Rev Microbiol 2018, 16, 341–354. [Google Scholar] [CrossRef]
- Chen, S.; Yuan, J.; Yao, S.; Jin, Y.; Chen, G.; Tian, W.; Xi, J.; Xu, Z.; Weng, D.; Chen, J. Lipopolysaccharides may aggravate apoptosis through accumulation of autophagosomes in alveolar macrophages of human silicosis. Autophagy 2015, 11, 2346–2357. [Google Scholar] [CrossRef] [PubMed]
- Wang, S.; Song, X.; Zhang, K.; Deng, S.; Jiao, P.; Qi, M.; Lian, Z.; Yao, Y. Overexpression of Toll-Like Receptor 4 Affects Autophagy, Oxidative Stress, and Inflammatory Responses in Monocytes of Transgenic Sheep. Front Cell Dev Biol 2020, 8, 248. [Google Scholar] [CrossRef] [PubMed]
- Shi, C.S.; Kehrl, J.H. MyD88 and Trif target Beclin 1 to trigger autophagy in macrophages. J Biol Chem 2008, 283, 33175–33182. [Google Scholar] [CrossRef] [PubMed]
- Komatsu, M.; Ichimura, Y. Selective autophagy regulates various cellular functions. Genes Cells 2010, 15, 923–933. [Google Scholar] [CrossRef]
- Tao, J.; Yang, M.; Wu, H.; Ma, T.; He, C.; Chai, M.; Zhang, X.; Zhang, J.; Ding, F.; Wang, S.; et al. Effects of AANAT overexpression on the inflammatory responses and autophagy activity in the cellular and transgenic animal levels. Autophagy 2018, 14, 1850–1869. [Google Scholar] [CrossRef]
- Komatsu, M.; Kurokawa, H.; Waguri, S.; Taguchi, K.; Kobayashi, A.; Ichimura, Y.; Sou, Y.S.; Ueno, I.; Sakamoto, A.; Tong, K.I.; et al. The selective autophagy substrate p62 activates the stress responsive transcription factor Nrf2 through inactivation of Keap1. Nat Cell Biol 2010, 12, 213–223. [Google Scholar] [CrossRef]
- Lee, J.W.; Nam, H.; Kim, L.E.; Jeon, Y.; Min, H.; Ha, S.; Lee, Y.; Kim, S.Y.; Lee, S.J.; Kim, E.K.; et al. TLR4 (toll-like receptor 4) activation suppresses autophagy through inhibition of FOXO3 and impairs phagocytic capacity of microglia. Autophagy 2019, 15, 753–770. [Google Scholar] [CrossRef] [PubMed]
- Chen, X.; Xu, S.; Zhao, C.; Liu, B. Role of TLR4/NADPH oxidase 4 pathway in promoting cell death through autophagy and ferroptosis during heart failure. Biochem Biophys Res Commun 2019, 516, 37–43. [Google Scholar] [CrossRef]
- Deretic, V.; Saitoh, T.; Akira, S. Autophagy in infection, inflammation and immunity. Nat Rev Immunol 2013, 13, 722–737. [Google Scholar] [CrossRef]
- Belkaid, Y.; Hand, T.W. Role of the microbiota in immunity and inflammation. Cell 2014, 157, 121–141. [Google Scholar] [CrossRef] [PubMed]
- Ezraty, B.; Gennaris, A.; Barras, F.; Collet, J.F. Oxidative stress, protein damage and repair in bacteria. Nat Rev Microbiol 2017, 15, 385–396. [Google Scholar] [CrossRef] [PubMed]
- Devis-Jauregui, L.; Eritja, N.; Davis, M.L.; Matias-Guiu, X.; Llobet-Navas, D. Autophagy in the physiological endometrium and cancer. Autophagy 2021, 17, 1077–1095. [Google Scholar] [CrossRef]
- Das, G.; Shravage, B.V.; Baehrecke, E.H. Regulation and function of autophagy during cell survival and cell death. Cold Spring Harb Perspect Biol 2012, 4. [Google Scholar] [CrossRef] [PubMed]
- Baehrecke, E.H. Autophagy: dual roles in life and death? Nat Rev Mol Cell Biol 2005, 6, 505–510. [Google Scholar] [CrossRef]
- Wang, K. Autophagy and apoptosis in liver injury. Cell Cycle 2015, 14, 1631–1642. [Google Scholar] [CrossRef]
- Wang, Z.; Zhao, G.; Zibrila, A.I.; Li, Y.; Liu, J.; Feng, W. Acetylcholine ameliorated hypoxia-induced oxidative stress and apoptosis in trophoblast cells via p38 MAPK/NF-kappaB pathway. Mol Hum Reprod 2021, 27. [Google Scholar] [CrossRef]
- Barkett, M.; Gilmore, T.D. Control of apoptosis by Rel/NF-kappaB transcription factors. Oncogene 1999, 18, 6910–6924. [Google Scholar] [CrossRef]
- Lee, J.; Hartman, M.; Kornfeld, H. Macrophage apoptosis in tuberculosis. Yonsei Med J 2009, 50, 1–11. [Google Scholar] [CrossRef] [PubMed]
- Zhang, B.; Zeng, M.; Li, M.; Kan, Y.; Li, B.; Xu, R.; Wu, Y.; Wang, S.; Zheng, X.; Feng, W. Protopine Protects Mice against LPS-Induced Acute Kidney Injury by Inhibiting Apoptosis and Inflammation via the TLR4 Signaling Pathway. Molecules 2019, 25. [Google Scholar] [CrossRef]
- Chen, S.N.; Tan, Y.; Xiao, X.C.; Li, Q.; Wu, Q.; Peng, Y.Y.; Ren, J.; Dong, M.L. Deletion of TLR4 attenuates lipopolysaccharide-induced acute liver injury by inhibiting inflammation and apoptosis. Acta Pharmacol Sin 2021, 42, 1610–1619. [Google Scholar] [CrossRef] [PubMed]
- Huang, Y.; Xu, W.; Zhou, R. NLRP3 inflammasome activation and cell death. Cell Mol Immunol 2021, 18, 2114–2127. [Google Scholar] [CrossRef] [PubMed]
- Van Antwerp, D.J.; Martin, S.J.; Verma, I.M.; Green, D.R. Inhibition of TNF-induced apoptosis by NF-kappa B. Trends Cell Biol 1998, 8, 107–111. [Google Scholar] [CrossRef]
- Redza-Dutordoir, M.; Averill-Bates, D.A. Activation of apoptosis signalling pathways by reactive oxygen species. Biochim Biophys Acta 2016, 1863, 2977–2992. [Google Scholar] [CrossRef]
- Singla, S.; Iwamoto-Stohl, L.K.; Zhu, M.; Zernicka-Goetz, M. Autophagy-mediated apoptosis eliminates aneuploid cells in a mouse model of chromosome mosaicism. Nat Commun 2020, 11, 2958. [Google Scholar] [CrossRef]
- Pattingre, S.; Tassa, A.; Qu, X.; Garuti, R.; Liang, X.H.; Mizushima, N.; Packer, M.; Schneider, M.D.; Levine, B. Bcl-2 antiapoptotic proteins inhibit Beclin 1-dependent autophagy. Cell 2005, 122, 927–939. [Google Scholar] [CrossRef]
- Scott, R.C.; Juhasz, G.; Neufeld, T.P. Direct induction of autophagy by Atg1 inhibits cell growth and induces apoptotic cell death. Curr Biol 2007, 17, 1–11. [Google Scholar] [CrossRef]
- Levine, B.; Kroemer, G. Biological Functions of Autophagy Genes: A Disease Perspective. Cell 2019, 176, 11–42. [Google Scholar] [CrossRef]
- Shoubridge, A.P.; Fourrier, C.; Choo, J.M.; Proud, C.G.; Sargeant, T.J.; Rogers, G.B. Gut Microbiome Regulation of Autophagic Flux and Neurodegenerative Disease Risks. Front Microbiol 2021, 12, 817433. [Google Scholar] [CrossRef] [PubMed]
- Goodall, M.L.; Fitzwalter, B.E.; Zahedi, S.; Wu, M.; Rodriguez, D.; Mulcahy-Levy, J.M.; Green, D.R.; Morgan, M.; Cramer, S.D.; Thorburn, A. The Autophagy Machinery Controls Cell Death Switching between Apoptosis and Necroptosis. Dev Cell 2016, 37, 337–349. [Google Scholar] [CrossRef] [PubMed]
- Galluzzi, L.; Vitale, I.; Aaronson, S.A.; Abrams, J.M.; Adam, D.; Agostinis, P.; Alnemri, E.S.; Altucci, L.; Amelio, I.; Andrews, D.W.; et al. Molecular mechanisms of cell death: recommendations of the Nomenclature Committee on Cell Death 2018. Cell Death Differ 2018, 25, 486–541. [Google Scholar] [CrossRef]
- Das, S.; Shukla, N.; Singh, S.S.; Kushwaha, S.; Shrivastava, R. Mechanism of interaction between autophagy and apoptosis in cancer. Apoptosis 2021, 26, 512–533. [Google Scholar] [CrossRef] [PubMed]
- Zhong, Z.; Umemura, A.; Sanchez-Lopez, E.; Liang, S.; Shalapour, S.; Wong, J.; He, F.; Boassa, D.; Perkins, G.; Ali, S.R.; et al. NF-kappaB Restricts Inflammasome Activation via Elimination of Damaged Mitochondria. Cell 2016, 164, 896–910. [Google Scholar] [CrossRef]
- Xu, Y.; Jagannath, C.; Liu, X.D.; Sharafkhaneh, A.; Kolodziejska, K.E.; Eissa, N.T. Toll-like receptor 4 is a sensor for autophagy associated with innate immunity. Immunity 2007, 27, 135–144. [Google Scholar] [CrossRef]
- Pandey, M.K.; Sung, B.; Ahn, K.S.; Kunnumakkara, A.B.; Chaturvedi, M.M.; Aggarwal, B.B. Gambogic acid, a novel ligand for transferrin receptor, potentiates TNF-induced apoptosis through modulation of the nuclear factor-kappaB signaling pathway. Blood 2007, 110, 3517–3525. [Google Scholar] [CrossRef]
- Yue, J.; Lopez, J.M. Understanding MAPK Signaling Pathways in Apoptosis. Int J Mol Sci 2020, 21. [Google Scholar] [CrossRef]
Disclaimer/Publisher’s Note: The statements, opinions and data contained in all publications are solely those of the individual author(s) and contributor(s) and not of MDPI and/or the editor(s). MDPI and/or the editor(s) disclaim responsibility for any injury to people or property resulting from any ideas, methods, instructions or products referred to in the content. |
© 2024 by the authors. Licensee MDPI, Basel, Switzerland. This article is an open access article distributed under the terms and conditions of the Creative Commons Attribution (CC BY) license (https://creativecommons.org/licenses/by/4.0/).


