Submitted:
30 May 2023
Posted:
31 May 2023
You are already at the latest version
Abstract
Keywords:
1. Introduction
2. Materials and Methods
2.1. Plant Materials
2.2. Experimental Site, Design and Weather Conditions
2.3. Field Phenotyping and Data Recording
2.4. Scanning Electron Microscopy
2.5. Statistical Analysis

3. Results
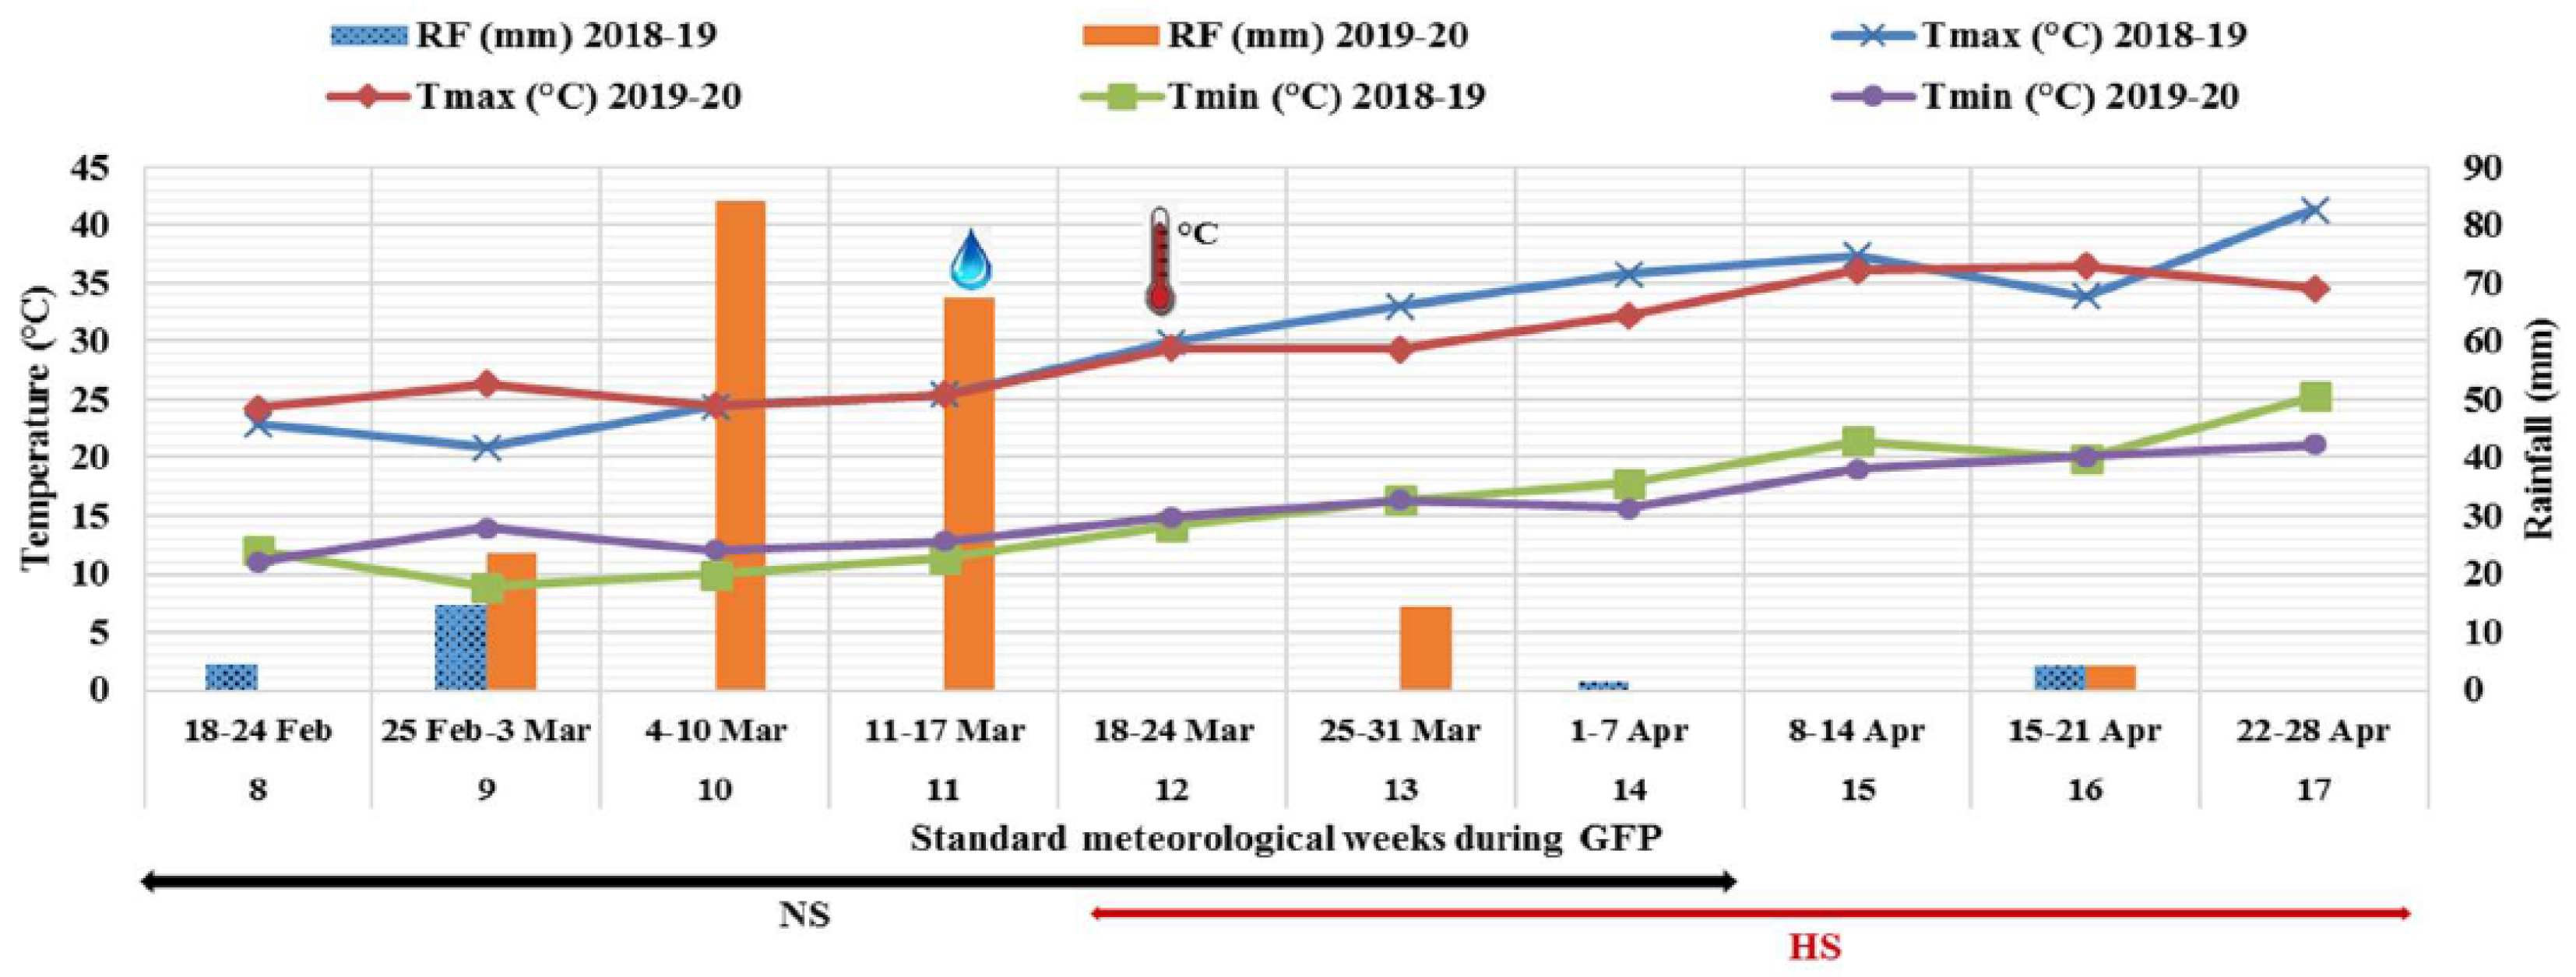
3.1. Weather Conditions during Crop Seasons
3.2. Crop Growth and Genetic Variability
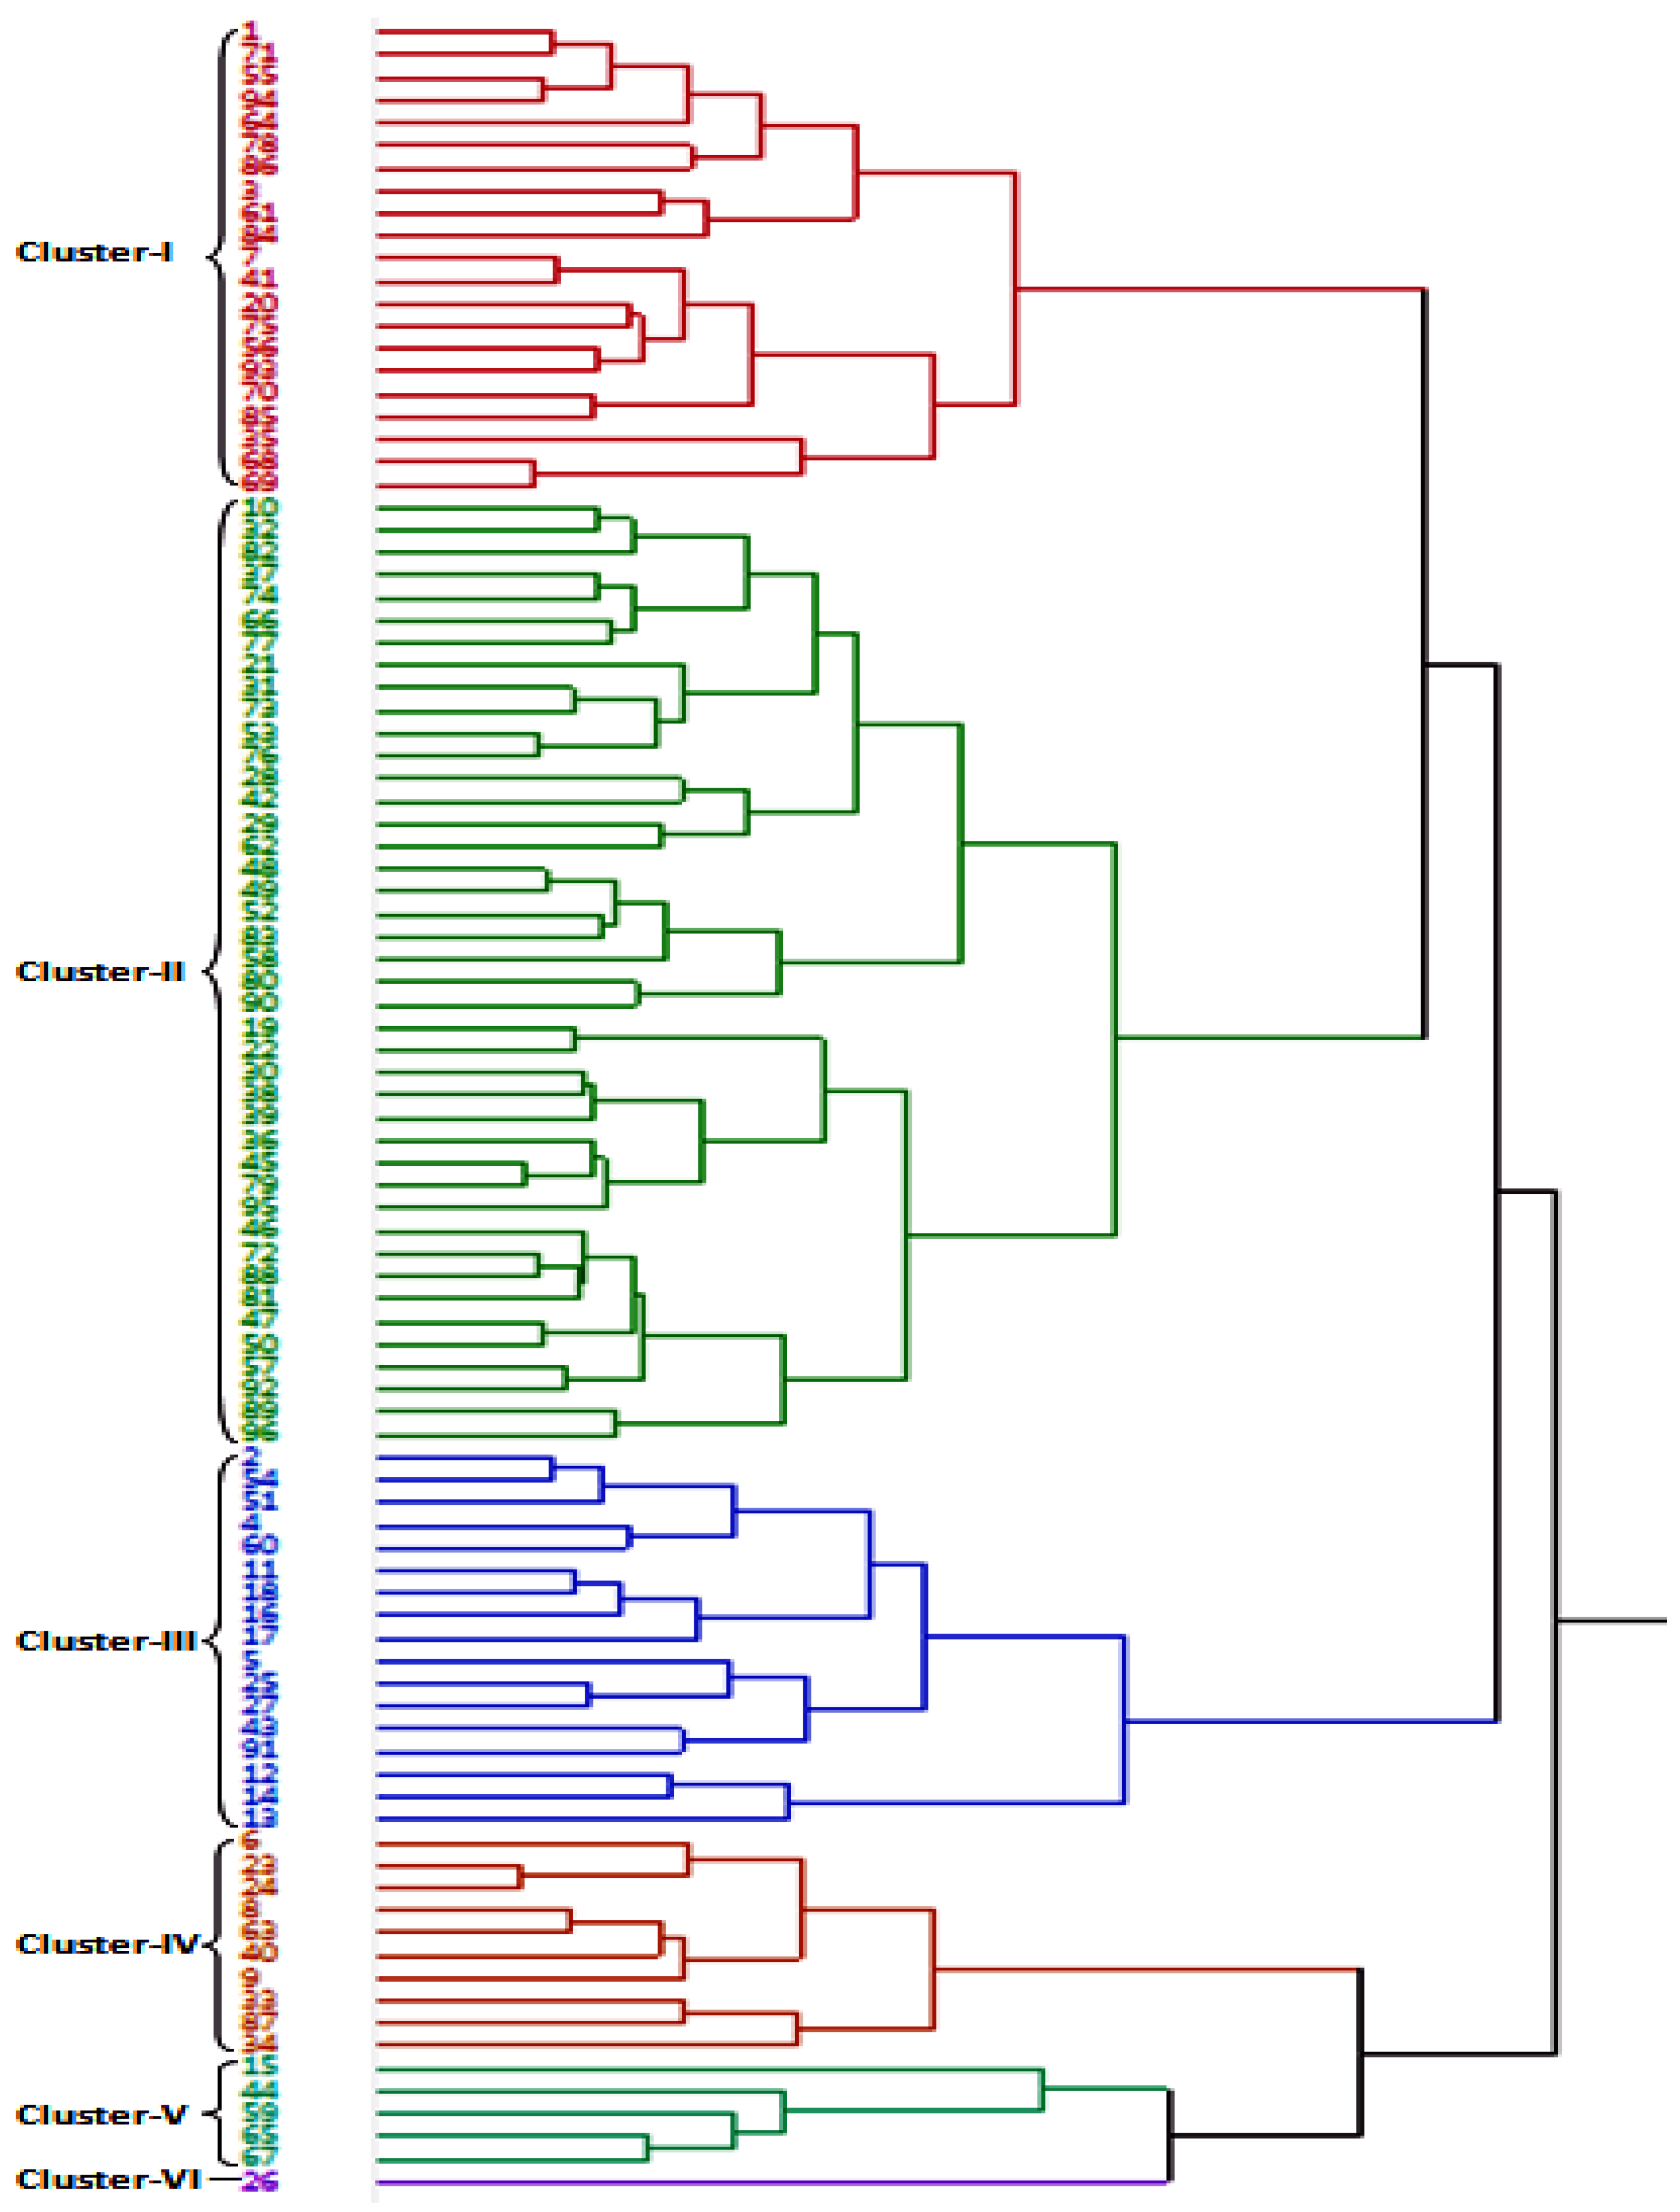
3.3. Genetic Relationship in Wheat Accessions
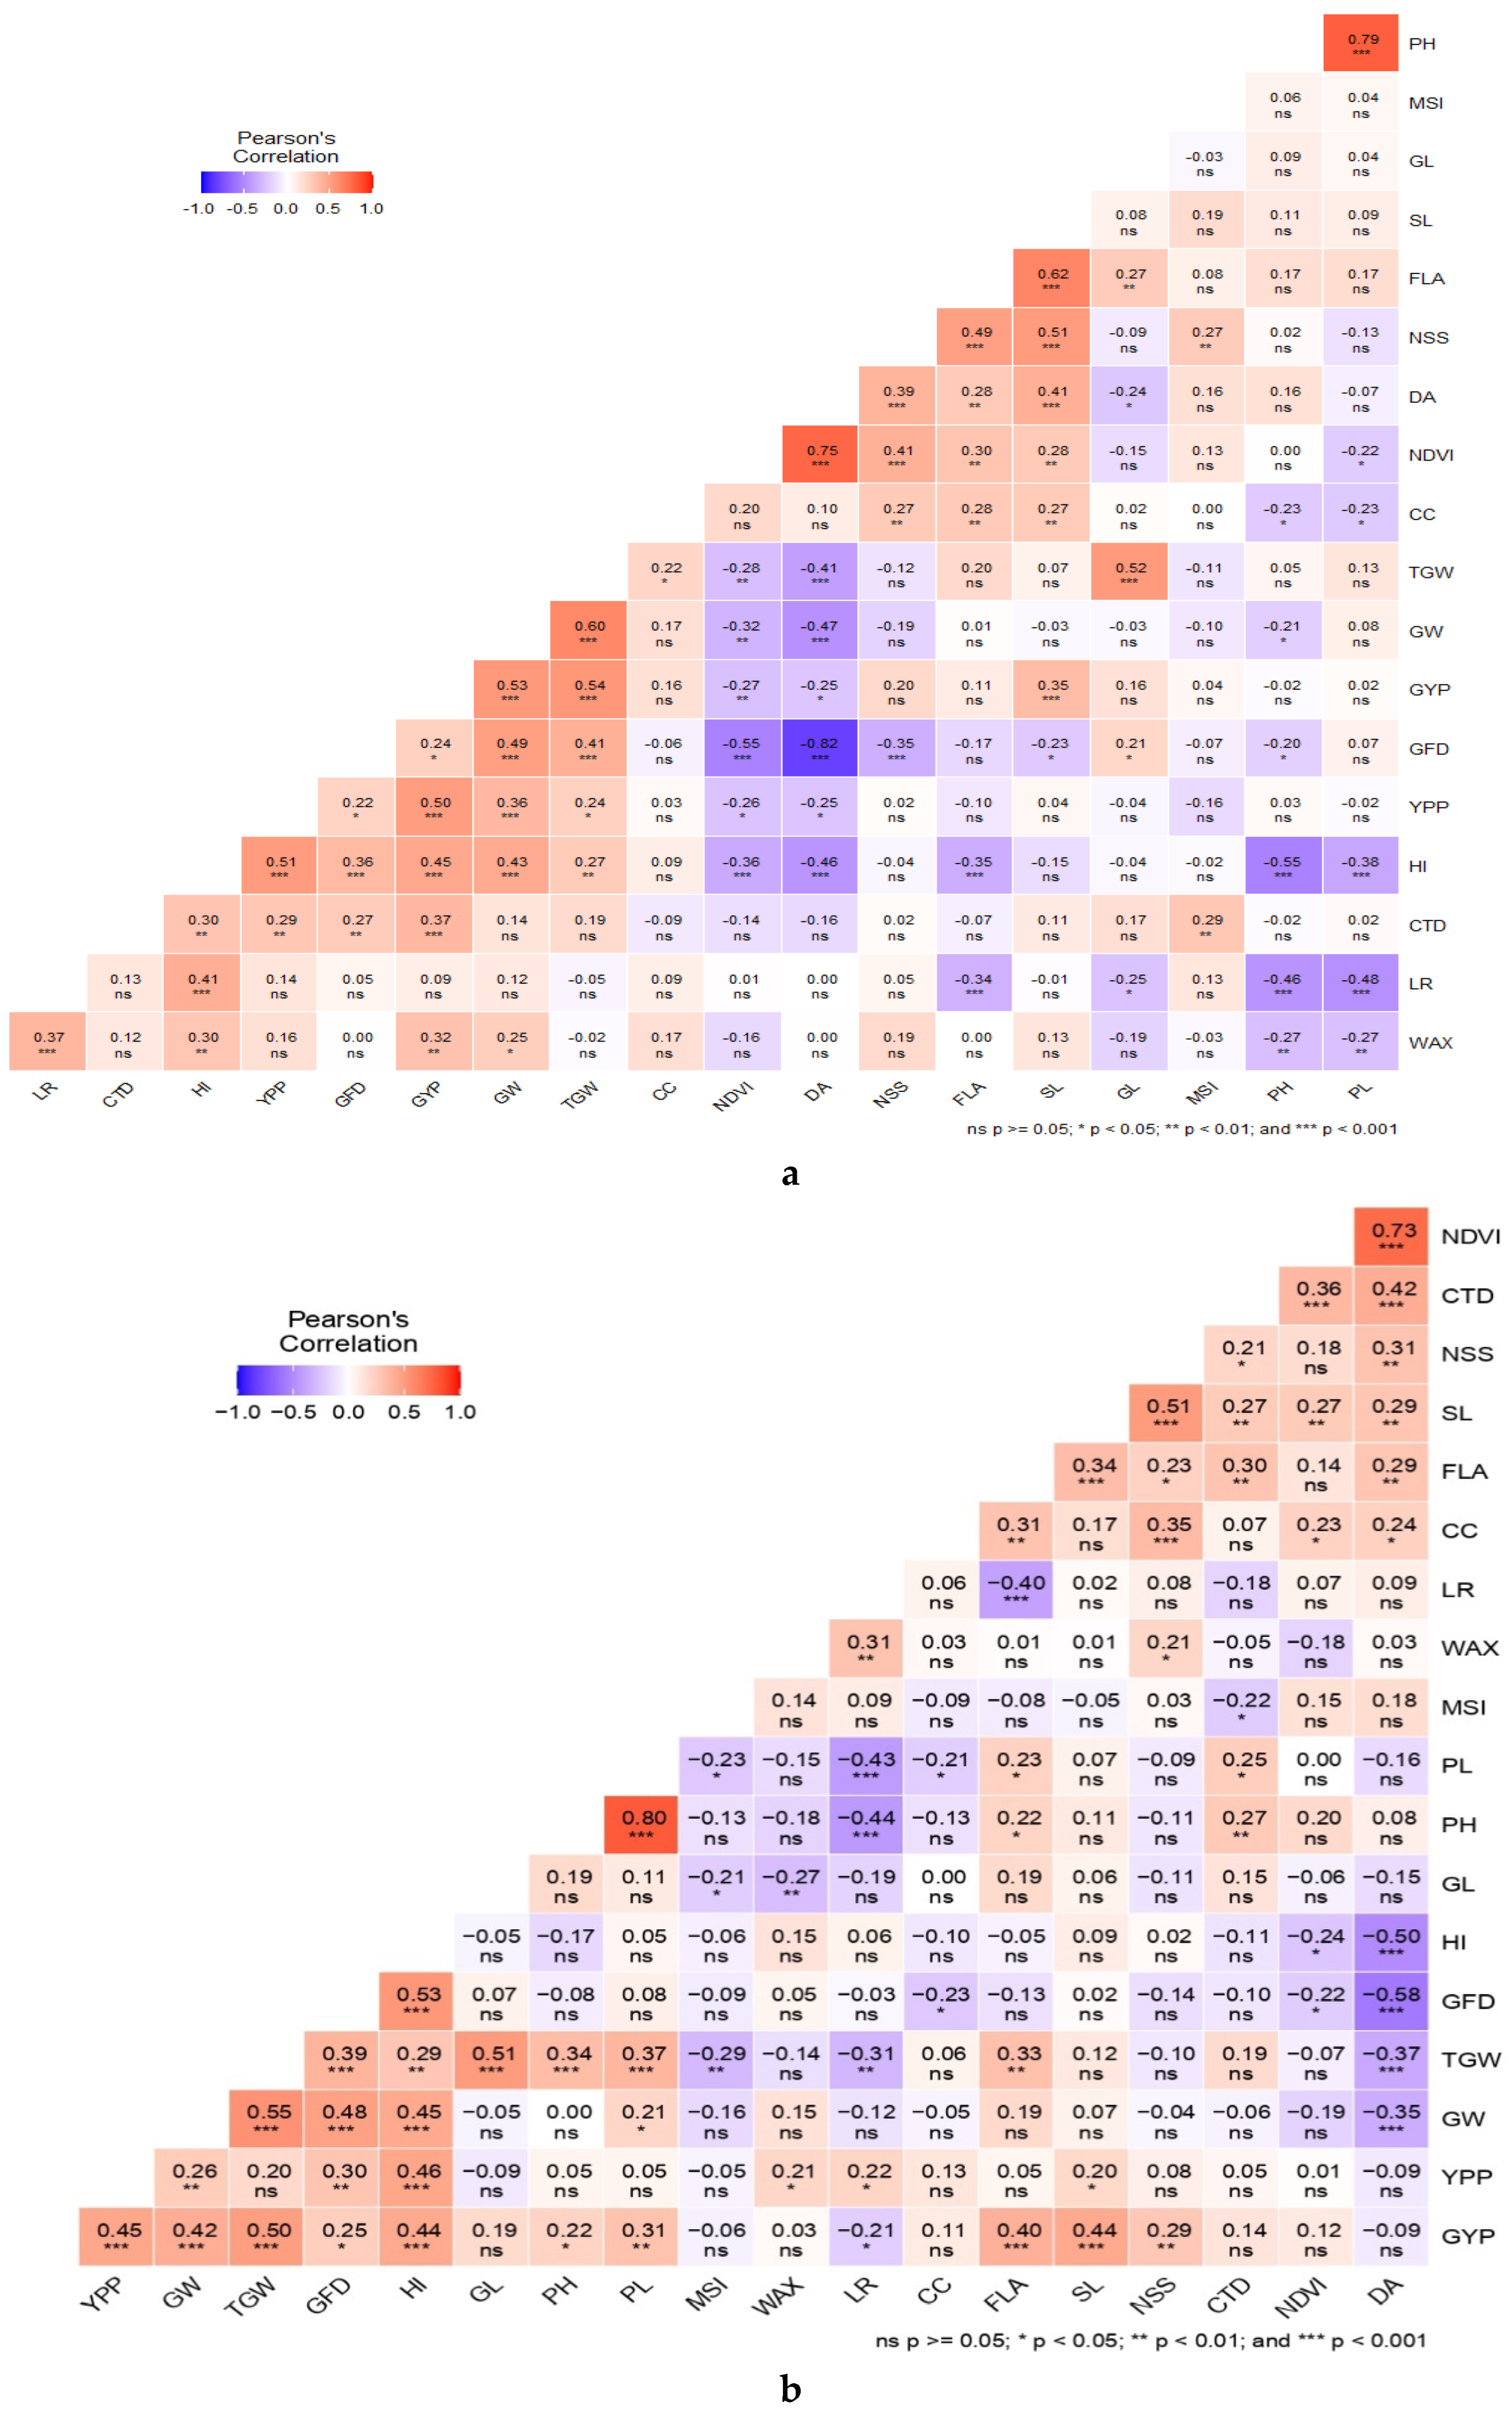
3.4. Correlations with Grain Yield
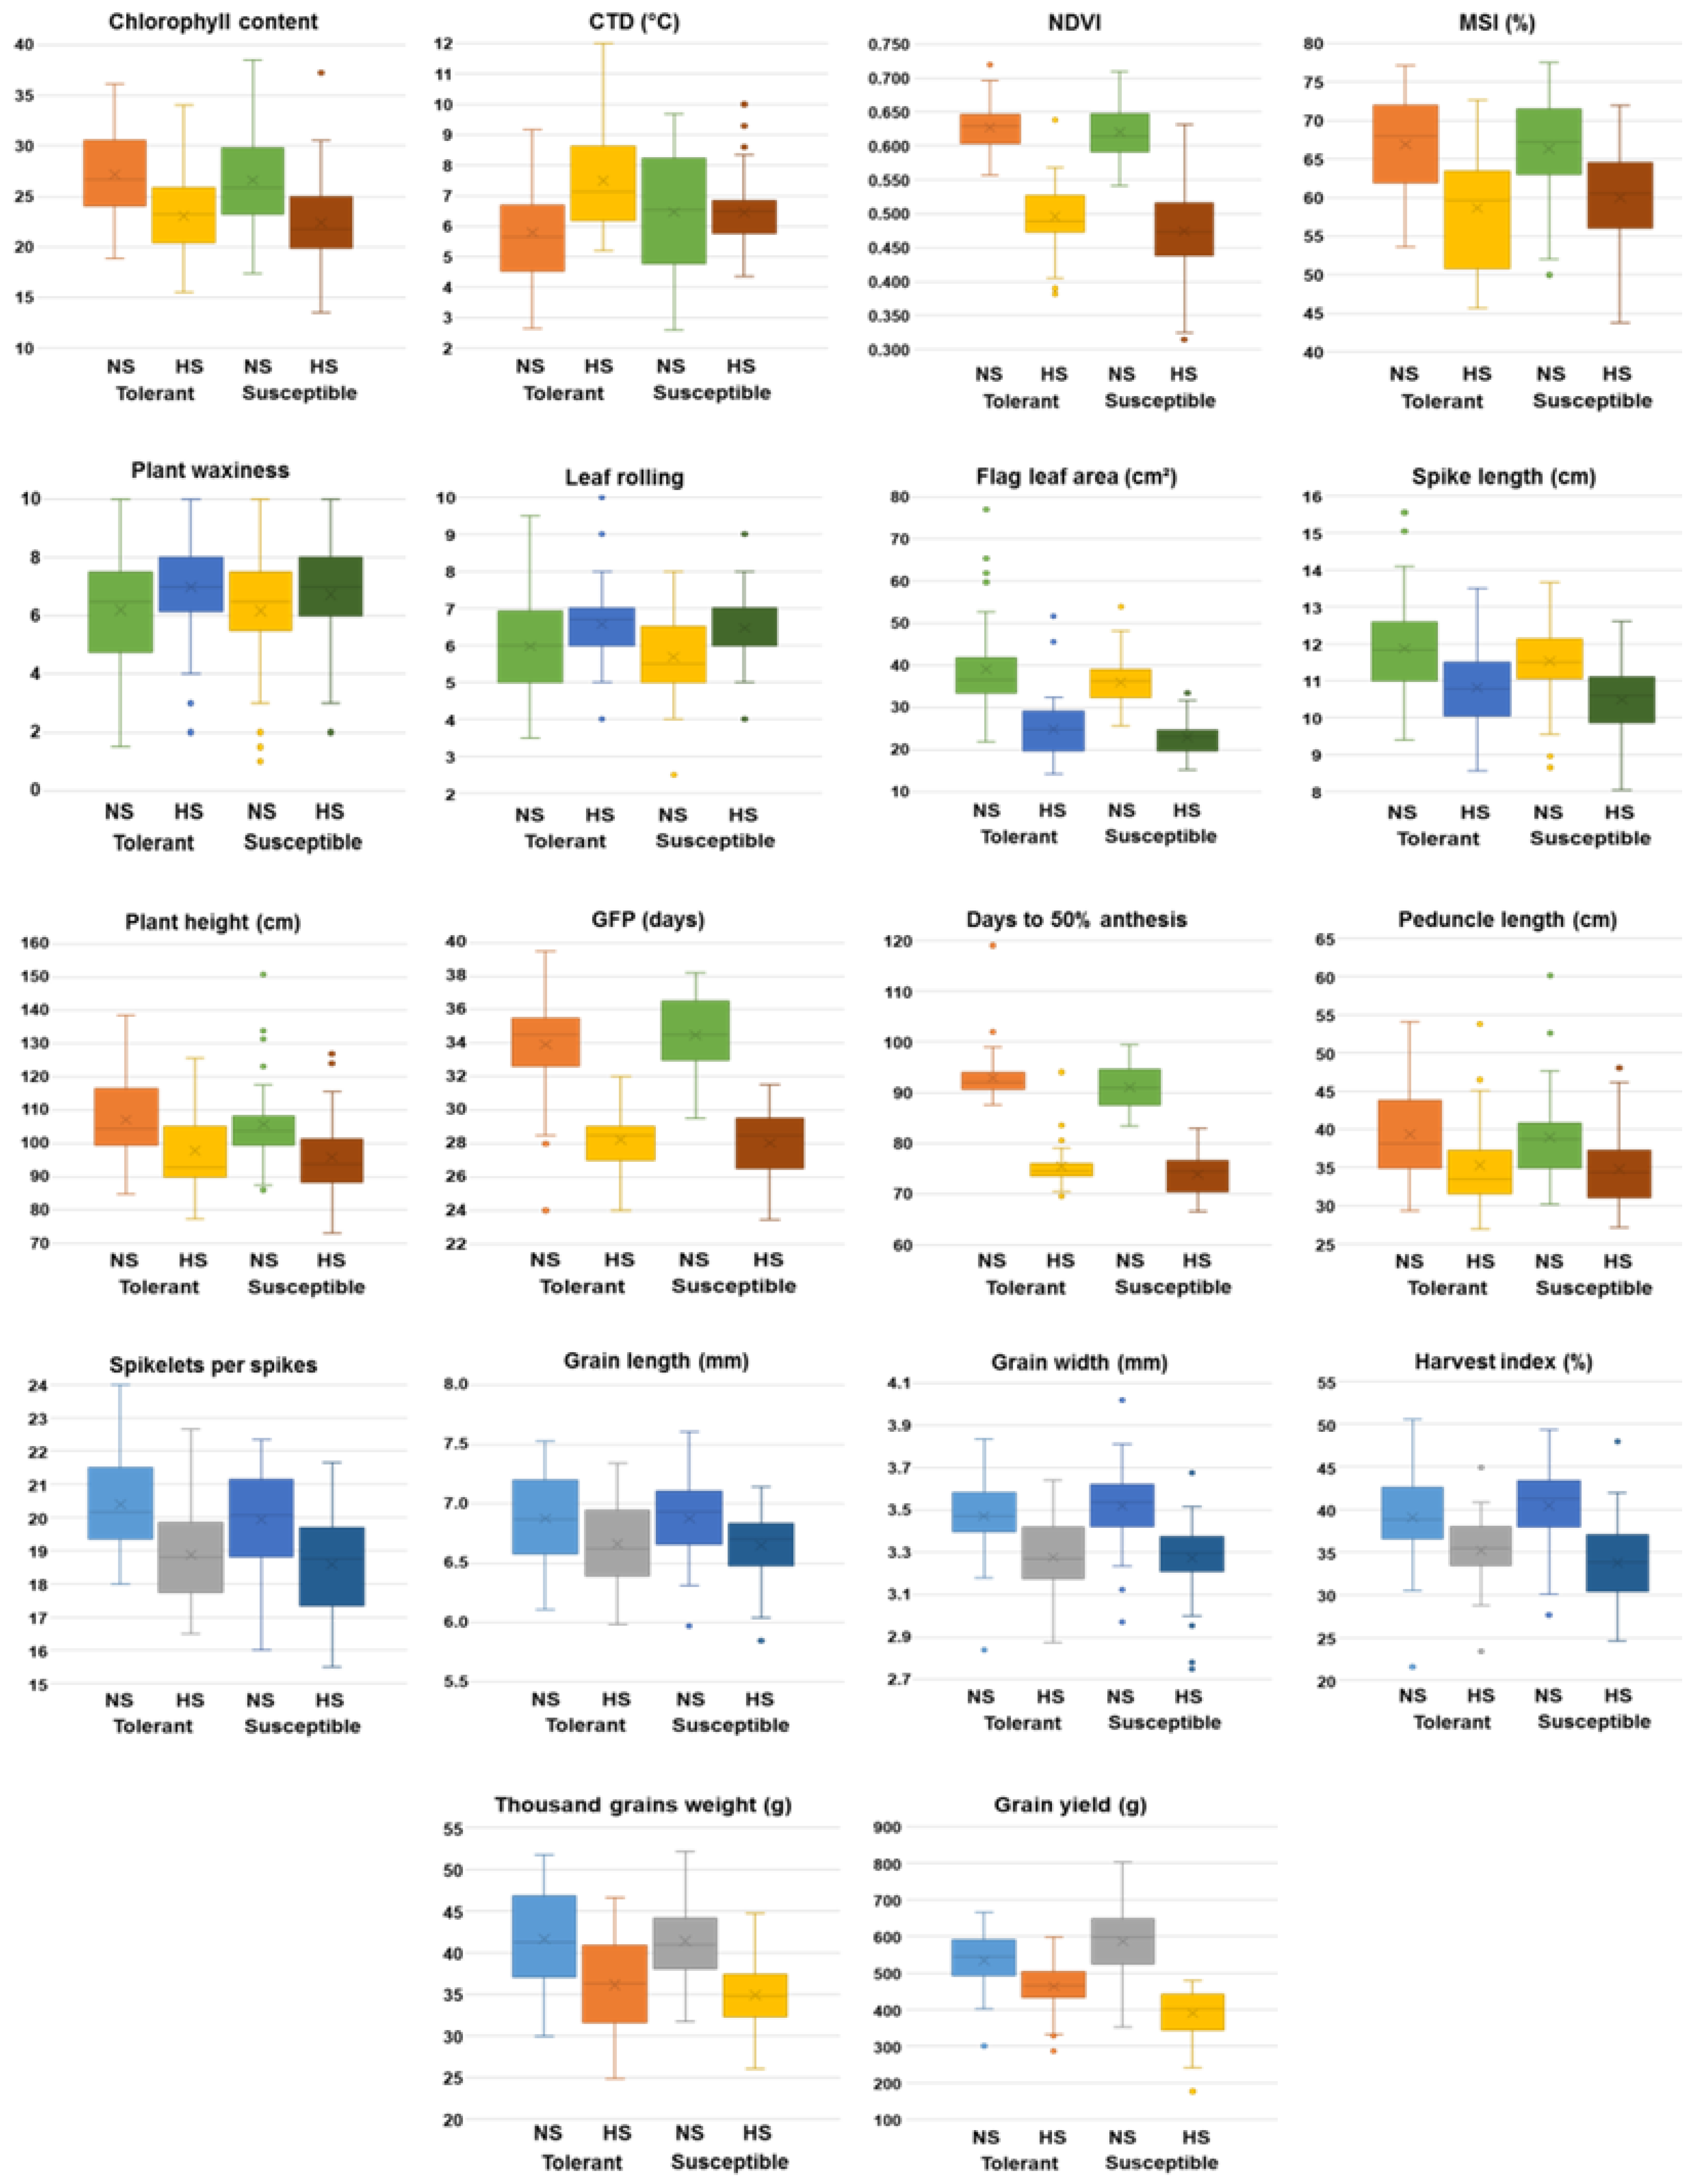
3.5. Impact of Heat-stress on Yield and Morpho-Physiological Traits
3.6. Impact of Heat-stress on Wheat Grains
3.7. Selection of Heat-stress Adapted Germplasm
4. Discussion
4.1. Trait Variability and Impact of Heat-stress
4.2. Association of Grain Yield with Other Traits
4.3. Grain Development under Heat Stress
4. Yield Stability and Selection of Accessions Adapted to Heat-stress
5. Conclusions
Supplementary Materials
Author Contributions
Data availability statement
Acknowledgments and Fundings
Conflicts of Interest
References
- Acevedo, M.; Zurn, J.D.; Molero, G.; Singh, P.; He, X.; Aoun, M.; McCandless, L. The role of wheat in global food security. In Agricultural Development and Sustainable Intensification: Technology and Policy Challenges in the Face of Climate Change, 1st Ed. New York, Routledge, 2018; pp. 81-110. [CrossRef]
- Shiferaw, B.; Smale, M.; Braun, H.J.; Duveiller, E.; Reynolds, M.; Muricho, G. Crops that feed the world 10. Past successes and future challenges to the role played by wheat in global food security. Food Sec. 2013, 5, 291–317. [Google Scholar] [CrossRef]
- Shewry, P.R.; Hey, S.J. The contribution of wheat to human diet and health. Food Energy Secur. 2015, 4, 178–202. [Google Scholar] [CrossRef]
- FAO. World Food and Agriculture – Statistical Yearbook. 2022, Rome. [CrossRef]
- CIMMYT. FFAR grant develops climate-resilient wheat. CIMMYT press release 11 January, 2021. Available at https://www. cimmyt.org/news/ffar-grant-develops-climate-resilient-wheat/.
- Lobell, D.B.; Schlenker, W.; Costa-Roberts, J. Climate trends and global crop production since 1980. Science 2011, 333, 616–620. [Google Scholar] [CrossRef]
- Wheeler, T.; von Braun, J. Climate change impacts on global food security. Science 2013, 341, 508–513. [Google Scholar] [CrossRef]
- FAO. The future of Food and Agriculture – Trends and challenges. Food and Agriculture Organization of the United Nations, Rome, 2017; pp. 151.
- Wang, P.; Deng, X.; Jiang, S. Global warming, grain production and its efficiency: Case study of major grain production region. Ecol. Indic. 2018, 105, 563–570. [Google Scholar] [CrossRef]
- Massel, K.; Lam, Y.; Wong, A.C.S.; Hickey, L.T.; Borrell, A.K.; Godwin, I.D. Hotter, drier, CRISPR: the latest edit on climate change. Theor. Appl. Genet. 2021, 134, 1691–1709. [Google Scholar] [CrossRef]
- IPCC. Summary for Policymakers. In Global warming of 1.5°C - An IPCC Special Report on the impacts of global warming of 1.5°C. World Meteorological Organization, Geneva, Switzerland, 2018; pp. 1–32.
- Liu, B.; Asseng, S.; Müller, C.; Ewert, F.; Elliott, J.; Lobell, D.B.; et al. Similar estimates of temperature impacts on global wheat yield by three independent methods. Nat. Clim. Change 2016, 6, 1130–1136. [Google Scholar] [CrossRef]
- McCouch, S.R.; Navabi, Z.K.; Abberton, M.; Anglin, N.L.; Barbieri, R.L.; Baum, M.; et al. Mobilizing crop biodiversity. Mol. Plant 2020, 13, 1341–1344. [Google Scholar] [CrossRef]
- Reynolds, M.; Tattaris, M.; Cossani, C.M.; Ellis, M.; Yamaguchi-Shinozaki, K.; Pierre, C.S. Exploring genetic resources to increase adaptation of wheat to climate change. In Advances in Wheat Genetics: From Genome to Field. Ogihara, Y., Takumi, S., Handa, H., Eds.; Springer, Tokyo, 2015; pp. 355–368. [CrossRef]
- Mujeeb-Kazi, A.; Kazi, A.G.; Dundas, I.; Rasheed, A.; Ogbonnaya, F.; Kishii, M.; Bonnett, D.; et al. Genetic diversity for wheat improvement as a conduit to food security. Adv. Agron. 2013, 122, 179–257. [Google Scholar] [CrossRef]
- Matsuoka, Y. Evolution of polyploid Triticum wheats under cultivation: the role of domestication, natural hybridization and allopolyploid speciation in their diversification. Plant Cell Physiol. 2011, 52, 750–764. [Google Scholar] [CrossRef]
- Tadesse, W.; Sanchez-Garcia, M.; Assefa, S.G.; Amri, A.; Bishaw, Z.; Ogbonnaya, F.C.; Baum, M. Genetic gains in wheat breeding and its role in feeding the world. Crop Breed. Genet. Genom. 2019, 1, e190005. [Google Scholar] [CrossRef]
- Singh, S.; Vikram, P.; Sehgal, D.; Burgueño, J.; Sharma, A.; Singh, S.K.; Sansaloni, C.P.; Joynson, R.; Brabbs, T.; Ortiz, C.; et al. Harnessing genetic potential of wheat germplasm banks through impact-oriented-prebreeding for future food and nutritional security. Sci. Rep. 2018, 8, 12527. [Google Scholar] [CrossRef] [PubMed]
- Rane, J.; Pannu, R.K.; Sohu, V.S.; Saini, R.S.; Mishra, B.; Shoran, J.; Crossa, J.; Vargas, M.; Joshi, A.K. Performance of yield and stability of advanced wheat genotypes under heat stress environments of the Indo-Gangetic plains. Crop Sci. 2007, 47, 1561–1573. [Google Scholar] [CrossRef]
- Kumar, S.N.; Aggarwal, P.K.; Rani, D.N.S.; Saxena, R.; Chauhan, N.; Jain, S. Vulnerability of wheat production to climate change in India. Clim. Res. 2014, 59, 173–187. [Google Scholar] [CrossRef]
- Ortiz, R.; Sayre, K.D.; Govaerts, B.; Gupta, R.; Subbarao, G.V.; Ban, T.; et al. Climate change: can wheat beat the heat? Agric. Ecosyst. Environ. 2008, 126, 46–58. [Google Scholar] [CrossRef]
- Joshi, A.K.; Mishra, B.; Chatrath, R.; Ortiz -Ferrara, G.; Singh, R.P. Wheat improvement in India: present status, emerging challenges and future prospects. Euphytica 2007, 157, 431–446. [Google Scholar] [CrossRef]
- Joshi, A.K.; Ortiz-Ferrara, G.; Crossa, J.; Singh, G.; Sharma, R.C.; Chand, R.; Parsad, R. Combining superior agronomic performance and terminal heat tolerance with resistance to spot blotch (Bipolaris sorokiniana) of wheat in the warm humid Gangetic Plains of South Asia. Field Crops Res. 2007, 103, 53–61. [Google Scholar] [CrossRef]
- Farooq, M.; Bramley, H.; Palta, J.A.; Siddique, K.H. Heat stress in wheat during reproductive and grain-filling phases. Crit. Rev. Plant Sci. 2011, 30, 491–507. [Google Scholar] [CrossRef]
- Lobell, D.B.; Burke, M.B.; Tebaldi, C.; Mastrandrea, M.D.; Falcon, W.P.; Naylor, R.L. Prioritizing climate change adaptation needs for food security in 2030. Science 2008, 319, 607–610. [Google Scholar] [CrossRef]
- Mondal, S.; Singh, R.P.; Crossa, J.; Huerta-Espino, J.; Sharma, I.; Chatrath, R.; et al. Earliness in wheat: a key to adaptation under terminal and continual high temperature stress in South Asia. Field Crops Res. 2013, 151, 19–26. [Google Scholar] [CrossRef]
- Joshi, A.K.; Chand, R.; Arun, B.; Singh, R.P.; Ortiz, R. Breeding crops for reduced-tillage management in the intensive, rice–wheat systems of South Asia. Euphytica 2007, 153, 135–151. [Google Scholar] [CrossRef]
- Ullah, S.; Bramley, H.; Mahmood, T.; Trethowan, R. A strategy of ideotype development for heat-tolerant wheat. J. Agro. Crop Sci. 2019, 206, 229–241. [Google Scholar] [CrossRef]
- Reynolds, M.P.; Ortiz-Monasterio, J.I.; McNab, A. Application of Physiology in Wheat Breeding. Mexico, D.F. CIMMYT, 2001.
- Huggins, T.D.; Mohammed, S.; Sengodon, P.; Ibrahim, A.M.H.; Tilley, M.; Hays, D.B. Changes in leaf epicuticular wax load and its effect on leaf temperature and physiological traits in wheat cultivars (Triticum aestivum L.) exposed to high temperatures during anthesis. J. Agro. Crop Sci. 2017, 204, 49–61. [Google Scholar] [CrossRef]
- Reynolds, M.P.; Singh, R.P.; Ibrahim, A.; Ageeb, O.A.A.; Larque-Saavedra, A.; Quick, J.S. Evaluating physiological traits to complement empirical selection for wheat in warm environments. Euphytica 1998, 100, 85–94. [Google Scholar] [CrossRef]
- Fokar, M.; Nguyen, H.T.; Blum, A. Heat tolerance in spring wheat. I. Estimating cellular thermotolerance and its heritability. Euphytica 1998, 104, 1–8. [Google Scholar] [CrossRef]
- Zhao, H.; Dai, T.; Jing, Q.; Jiang, D.; Cao, W. Leaf senescence and grain filling affected by post-anthesis high temperatures in two different wheat cultivars. Plant Growth Regul. 2007, 51, 149–158. [Google Scholar] [CrossRef]
- Mondal, S.; Singh, R.P.; Huerta-Espino, J.; Kehel, Z.; Autrique, E. Characterization of heat- and drought-stress tolerance in high-yielding spring wheat. Crop Sci. 2015, 55, 1–11. [Google Scholar] [CrossRef]
- Telfer, P.; Edwards, J.; Bennett, D.; Ganesalingam, D.; Able, J.; Kuchel, H. A field and controlled environment evaluation of wheat (Triticum aestivum) adaptation to heat stress. Field Crops Res. 2018, 229, 55–65. [Google Scholar] [CrossRef]
- Jenner, C.F. Starch synthesis in the kernel of wheat under high temperature conditions. Aust. J. Plant Physiol. 1994, 21, 791–806. [Google Scholar] [CrossRef]
- Dias, A.S.; Bagulho, A.S.; Lidon, F.C. Ultrastructure and biochemical traits of bread and durum wheat grains under heat stress. Braz. J. Plant Physiol. 2008, 20, 323–333. [Google Scholar] [CrossRef]
- Keeling, P.L.; Bacon, P.J.; Holt, D.C. Elevated temperature reduces starch deposition in wheat endosperm by reducing the activity of soluble starch synthase. Planta 1993, 191, 342–348. [Google Scholar] [CrossRef]
- Shah, N.H.; Paulsen, G.M. Interaction of drought and high temperature on photosynthesis and grain-filling of wheat. Plant Soil 2003, 257, 219–226. [Google Scholar] [CrossRef]
- Cossani, C.M.; Reynolds, M.P. Physiological traits for improving heat tolerance in wheat. Plant physiol. 2012, 160, 1710–1718. [Google Scholar] [CrossRef]
- Elbasyoni, I.S. Performance and stability of commercial wheat cultivars under terminal heat stress. Agronomy 2018, 8, 37. [Google Scholar] [CrossRef]
- Sharma, R.C.; Tiwary, A.K.; Ortiz-Ferrara, G. Reduction in kernel weight as a potential indirect selection criterion for wheat grain yield under terminal heat stress. Plant Breed. 2008, 127, 241–248. [Google Scholar] [CrossRef]
- Fleitas, M.C.; Mondal, S.; Gerard, G.S.; Hernández-Espinosa, N.; Singh, R.P.; Crossa, J.; Guzmán, C. Identification of CIMMYT spring bread wheat germplasm maintaining superior grain yield and quality under heat-stress. J. Cereal Sci. 2020, 93, 102981. [Google Scholar] [CrossRef]
- Asseng, S.; Ewert, F.; Martre, P.; Rötter, R.P.; Lobell, D. B.; Cammarano, D.; et al. Rising temperatures reduce global wheat production. Nat. Clim. Chang. 2015, 5, 143–147. [Google Scholar] [CrossRef]
- Ray, D.K.; Gerber, J.S.; MacDonald, G.K.; West, P.C. Climate variation explains a third of global crop yield variability. Nat. Comm. 2015, 6, 1–9. [Google Scholar] [CrossRef]
- Abdelrahman, M.; Burritt, D.J.; Gupta, A.; Tsujimoto, H.; Tran, L.S.P. Heat stress effects on source–sink relationships and metabolome dynamics in wheat. J. Exp. Bot. 2020, 71, 543–554. [Google Scholar] [CrossRef]
- Kang, M.S.; Prabhakaran, V.T.; Mehra, R.B. Genotype-by-environment interaction in crop improvement. In Plant Breeding - Mendelian to Molecular Approaches, Jain H.K.; Kharkwal, M.C., Eds., Narosa Publishing House, New Delhi, India, 2004; pp. 535–572.
- Akter, N.; Islam, M.R. Heat stress effects and management in wheat - A review. Agron. Sustain. Dev. 2017, 37, 1–17. [Google Scholar] [CrossRef]
- Hyles, J.; Bloomfield, M.T.; Hunt, J.R.; Trethowan, R.M.; Trevaskis, B. Phenology and related traits for wheat adaptation. Heredity 2020, 125, 417–430. [Google Scholar] [CrossRef] [PubMed]
- Phogat, B.S.; Kumar, S.; Kumari, J.; Kumar, N.; Pandey, A.C.; Singh, T.P.; et al. Characterization of wheat germplasm conserved in the Indian National Genebank and establishment of a composite core collection. Crop Sci. 2021, 61, 604–620. [Google Scholar] [CrossRef]
- Hijmans, R.J.; Guarino, L.; Cruz, M.; Rojas, E. Computer tools for spatial analysis of plant genetic resources data: 1. DIVA-GIS. Plant Genet. Resour. Newslett. 2001, 127, 15–19. [Google Scholar]
- Pask, A.J.D.; Pietragalla, J.; Mullan, D.M.; Reynolds, M.P. Physiological Breeding II: A Field Guide to Wheat Phenotyping. Mexico, D.F. CIMMYT, 2012.
- Zadoks, J.C.; Chang, T.T.; Konzak, C.F. A decimal code for the growth stages of cereals. Weed Res. 1974, 14, 415–421. [Google Scholar] [CrossRef]
- Reynolds, M.P.; Nagarajan, S.; Razzaque, M.A.; Ageeb, O.A.A. Using Canopy Temperature Depression to Select for Yield Potential of Wheat in Heat-Stressed Environments. Wheat Special Report. No. 42. Mexico, D.F.: CIMMYT, 1997.
- Babar, M.A.; Reynolds, M.P.; Van Ginkel, M.; Klatt, A.R.; Raun, W.R.; Stone, M.L. Spectral reflectance to estimate genetic variation for in-season biomass, leaf chlorophyll and canopy temperature in wheat. Crop Sci. 2006, 46, 1046–1057. [Google Scholar] [CrossRef]
- Sairam, R.K.; Deshmukh, P.S.; Shukla, D.S. Tolerance of drought and temperature stress in relation to increased antioxidant enzyme activity in wheat. J. Agron. Crop Sci. 1997, 178, 171–178. [Google Scholar] [CrossRef]
- Aldesuquy, H.; Baka, Z.; Mickky, B. Kinetin and spermine mediated induction of salt tolerance in wheat plants: Leaf area, photosynthesis and chloroplast ultrastructure of flag leaf at ear emergence. Egypt. J. Basic Appl. Sci. 2014, 1, 77–87. [Google Scholar] [CrossRef]
- SAS Institute. Statistical analysis system for windows version 9.4, SAS Institute Inc., Cary, NC, USA, 2013.
- IBM SPSS. IBM SPSS (Statistical Package for the Social Sciences) Statistics Software for Windows, Version 20.0. Armonk, NY, IBM Corp. 2011. Available at: https://hadoop.apache.org.
- Fischer, R.A.; Maurer, R. Drought resistance in spring wheat cultivars. I. Grain yield responses. Aust. J. Agr. Res. 1978, 29, 897–912. [Google Scholar] [CrossRef]
- Shannon, C.E.; Weaver, W. The mathematical theory of communication. University of Illinois Press, Urbana, 1949.
- Eberhart, S.A.; Russell, W.A. Stability parameters for comparing varieties. Crop Sci. 1966, 6, 36–40. [Google Scholar] [CrossRef]
- Mondal, S.; Rutkoski, J.E.; Velu, G.; Singh, P.K.; Crespo-Herrera, L.A.; Guzman, C.; Bhavani, S.; Lan, C.; He, X.; and Singh, R.P. Harnessing diversity in wheat to enhance grain yield, climate resilience, disease and insect pest resistance and nutrition through conventional and modern breeding approaches. Front. Plant Sci. 2016, 7, 991. [Google Scholar] [CrossRef] [PubMed]
- Dwivedi, S.K.; Basu, S.; Kumar, S.; Kumar, G.; Prakash, V.; Kumar, S.; et al. Heat stress induced impairment of starch mobilisation regulates pollen viability and grain yield in wheat: Study in eastern Indo-Gangetic Plains. Field Crops Res. 2017, 206, 106–114. [Google Scholar] [CrossRef]
- Bita, C.; Gerats, T. Plant tolerance to high temperature in a changing environment: Scientific fundamentals and production of heat stress-tolerant crops. Front. Plant Sci. 2013, 4, 273. [Google Scholar] [CrossRef] [PubMed]
- Gowda, D.S.S.; Singh, G.P.; Singh, A.M. Relationship between canopy temperature depression, membrane stability, relative water content and grain yield in bread wheat (Triticum aestivum) under heat-stress environments. Indian J. Agric. Sci. 2011, 81, 197–202. [Google Scholar]
- Pinto, R.S.; Molero, G.; Reynolds, M.P. Identification of heat tolerant wheat lines showing genetic variation in leaf respiration and other physiological traits. Euphytica 2017, 213, 76. [Google Scholar] [CrossRef]
- Wahid, A.; Gelani, S.; Ashraf, M.; Foolad, M.R. Heat tolerance in plants: An overview. Environ. Exp. Bot. 2007, 61, 199–223. [Google Scholar] [CrossRef]
- Lepekhov, S.B. Canopy temperature depression for drought- and heat stress tolerance in wheat breeding. Vavilov J. Genet. Breed. 2022, 26, 196–201. [Google Scholar] [CrossRef]
- Kaur, V.; Behl, R.K. Grain yield in wheat as affected by short periods of high temperature, drought and their interaction during pre-and post-anthesis stages. Cereal Res. Commun. 2010, 38, 514–520. [Google Scholar] [CrossRef]
- Tomás, D.; Coelho, L.P.; Rodrigues, J.C.; Viegas, W.; Silva, M. Assessment of four Portuguese wheat landrace diversity to cope with global warming. Front. Plant Sci. 2020, 11, 594977. [Google Scholar] [CrossRef]
- Agarwal, V.P.; Gupta, N.K.; Gupta, S.; Singh, G. Screening of wheat germplasm for terminal heat tolerance under hyper-arid conditions. Cereal Res. Commun. 2021, 49, 375–383. [Google Scholar] [CrossRef]
- Shepherd, T.; Griffiths, D.W. The effects of stress on plant cuticular waxes. New Phytol. 2006, 171, 469–499. [Google Scholar] [CrossRef] [PubMed]
- Mohammed, S.; Huggins, T.D.; Beecher, F.; Chick, C.; Sengodon, P.; Mondal, S.; et al. The role of leaf epicuticular wax in the adaptation of wheat (Triticum aestivum L.) to high temperatures and moisture deficit conditions. Crop Sci. 2018, 58, 679–689. [Google Scholar] [CrossRef]
- Soni, A.; Munjal, R. Characterisation and evaluation of wheat genetic resources for heat stress tolerance using stay-green traits. Crop Pasture Sci. 2023. [Google Scholar] [CrossRef]
- Mondal, S.; Dutta, S.; Crespo-Herrera, L.; Huerta-Espino, J.; Braun, H.J.; Singh, R.P. Fifty years of semi-dwarf spring wheat breeding at CIMMYT: Grain yield progress in optimum, drought and heat stress environments. Field Crops Res. 2020, 250, 107757. [Google Scholar] [CrossRef]
- Al-Ashkar, I.; Alotaibi, M.; Refay, Y.; Ghazy, A.; Zakri, A.; Al-Doss, A. Selection criteria for high-yielding and early-flowering bread wheat hybrids under heat stress. PLoS ONE 2020, 15, e0236351. [Google Scholar] [CrossRef]
- Reynolds, M.P.; Pierre, C.S.; Saad, A.S.I.; Vargas, M.; Condon, A.G. Evaluating potential genetic gains in wheat associated with stress-adaptive trait expression in elite genetic resources under drought and heat stress. Crop Sci. 2007, 47, S172–S189. [Google Scholar] [CrossRef]
- Fu, J.; Bowden, R.L.; Jagadish, S.V.K.; Prasad, P.V.V. Genetic variation for terminal heat stress tolerance in winter wheat. Front. Plant Sci. 2023, 14, 1132108. [Google Scholar] [CrossRef]
- Ayeneh, A.; van Ginkel, M.; Reynolds, M.P.; Ammar, K. Comparison of leaf, spike, peduncle and canopy temperature depression in wheat under heat stress. Field Crops Res. 2002, 79, 173–184. [Google Scholar] [CrossRef]
- Bahar, B.; Yildirim, M.; Yucel, C. Heat and drought resistance criteria in spring bread wheat (Triticum aestivum L.): morpho- physiological parameters for heat tolerance. Sci. Res. Essays. 2011, 6, 2212–2220. [Google Scholar] [CrossRef]
- Lordkaew, S.; Yimyam, N.; Wongtamee, A.; Jamjod, S.; Rerkasem, B. Evaluating a heat-tolerant wheat germplasm in a heat stress environment. Plant Genet. Resour. 2019, 17, 339–345. [Google Scholar] [CrossRef]
- Chaubey, R.K.; Bhutia, D.D.; Navathe, S.; Mishra, V.K.; Singh, A.K.; Chand, R. Interrelationships among different grain characteristics of wheat grown under optimum and late sowing date conditions in the Eastern Indo-Gangetic plains of India. Cereal Res. Commun. 2021, 49, 449–455. [Google Scholar] [CrossRef]
- Chiotelli, E.; Le Meste, M. Effect of small and large wheat starch granules on thermomechanical behavior of starch. Cereal Chem. 2002, 79, 286–293. [Google Scholar] [CrossRef]
- Uthayakumaran, S.; Wrigley, C. Wheat: Grain-quality Characteristics and Management of Quality Requirements. In Cereal Grains-Assessing and Managing Quality, Batey, C.W.I., Miskelly, D.,Eds.; Cambridge, England, Woodhead Publishing, 2017; pp. 91–134. [CrossRef]
- Liu, P.; Guo, W.; Jiang, Z.; Pu, H.; Feng, C.; Zhu, X.; Peng, Y.; Kuang, A.; Little, C.R. Effects of high temperature after anthesis on starch granules in grains of wheat (Triticum aestivum L.). J. Agric. Sci. 2011, 149, 159–169. [Google Scholar] [CrossRef] [PubMed]
- Sehgal, A.; Sita, K.; Siddique, K.H.M.; Kumar, R.; Bhogireddy, S.; Varshney, R.K.; et al. Drought or/and heat-stress effects on seed filling in food crops: Impacts on functional biochemistry, seed yields, and nutritional quality. Front. Plant Sci. 2018, 9. [Google Scholar] [CrossRef]
- Braun, H. J.; Atlin, G.; Payne, T. Multi-location testing as a tool to identify plant response to global climate change. In Climate Change and Crop Production, Reynolds, M.P., Ed., CABI, USA, 2010; pp. 115–138.
- Powell, N.; Ji, X.; Ravash, R.; Edlinton, J.; Dolferus, R. Yield stability for cereals in a changing climate. Funct. Plant Biol. 2012, 39, 539–552. [Google Scholar] [CrossRef]
- Gupta, V.; Mehta, G.; Kumar, S.; Ramdas, S.; Tiwari, R.; Singh, G.P.; Sharma, P. AMMI and GGE biplot analysis of yield under terminal heat tolerance in wheat. Mol. Biol. Rep. 2023, 50, 3459–3467. [Google Scholar] [CrossRef]

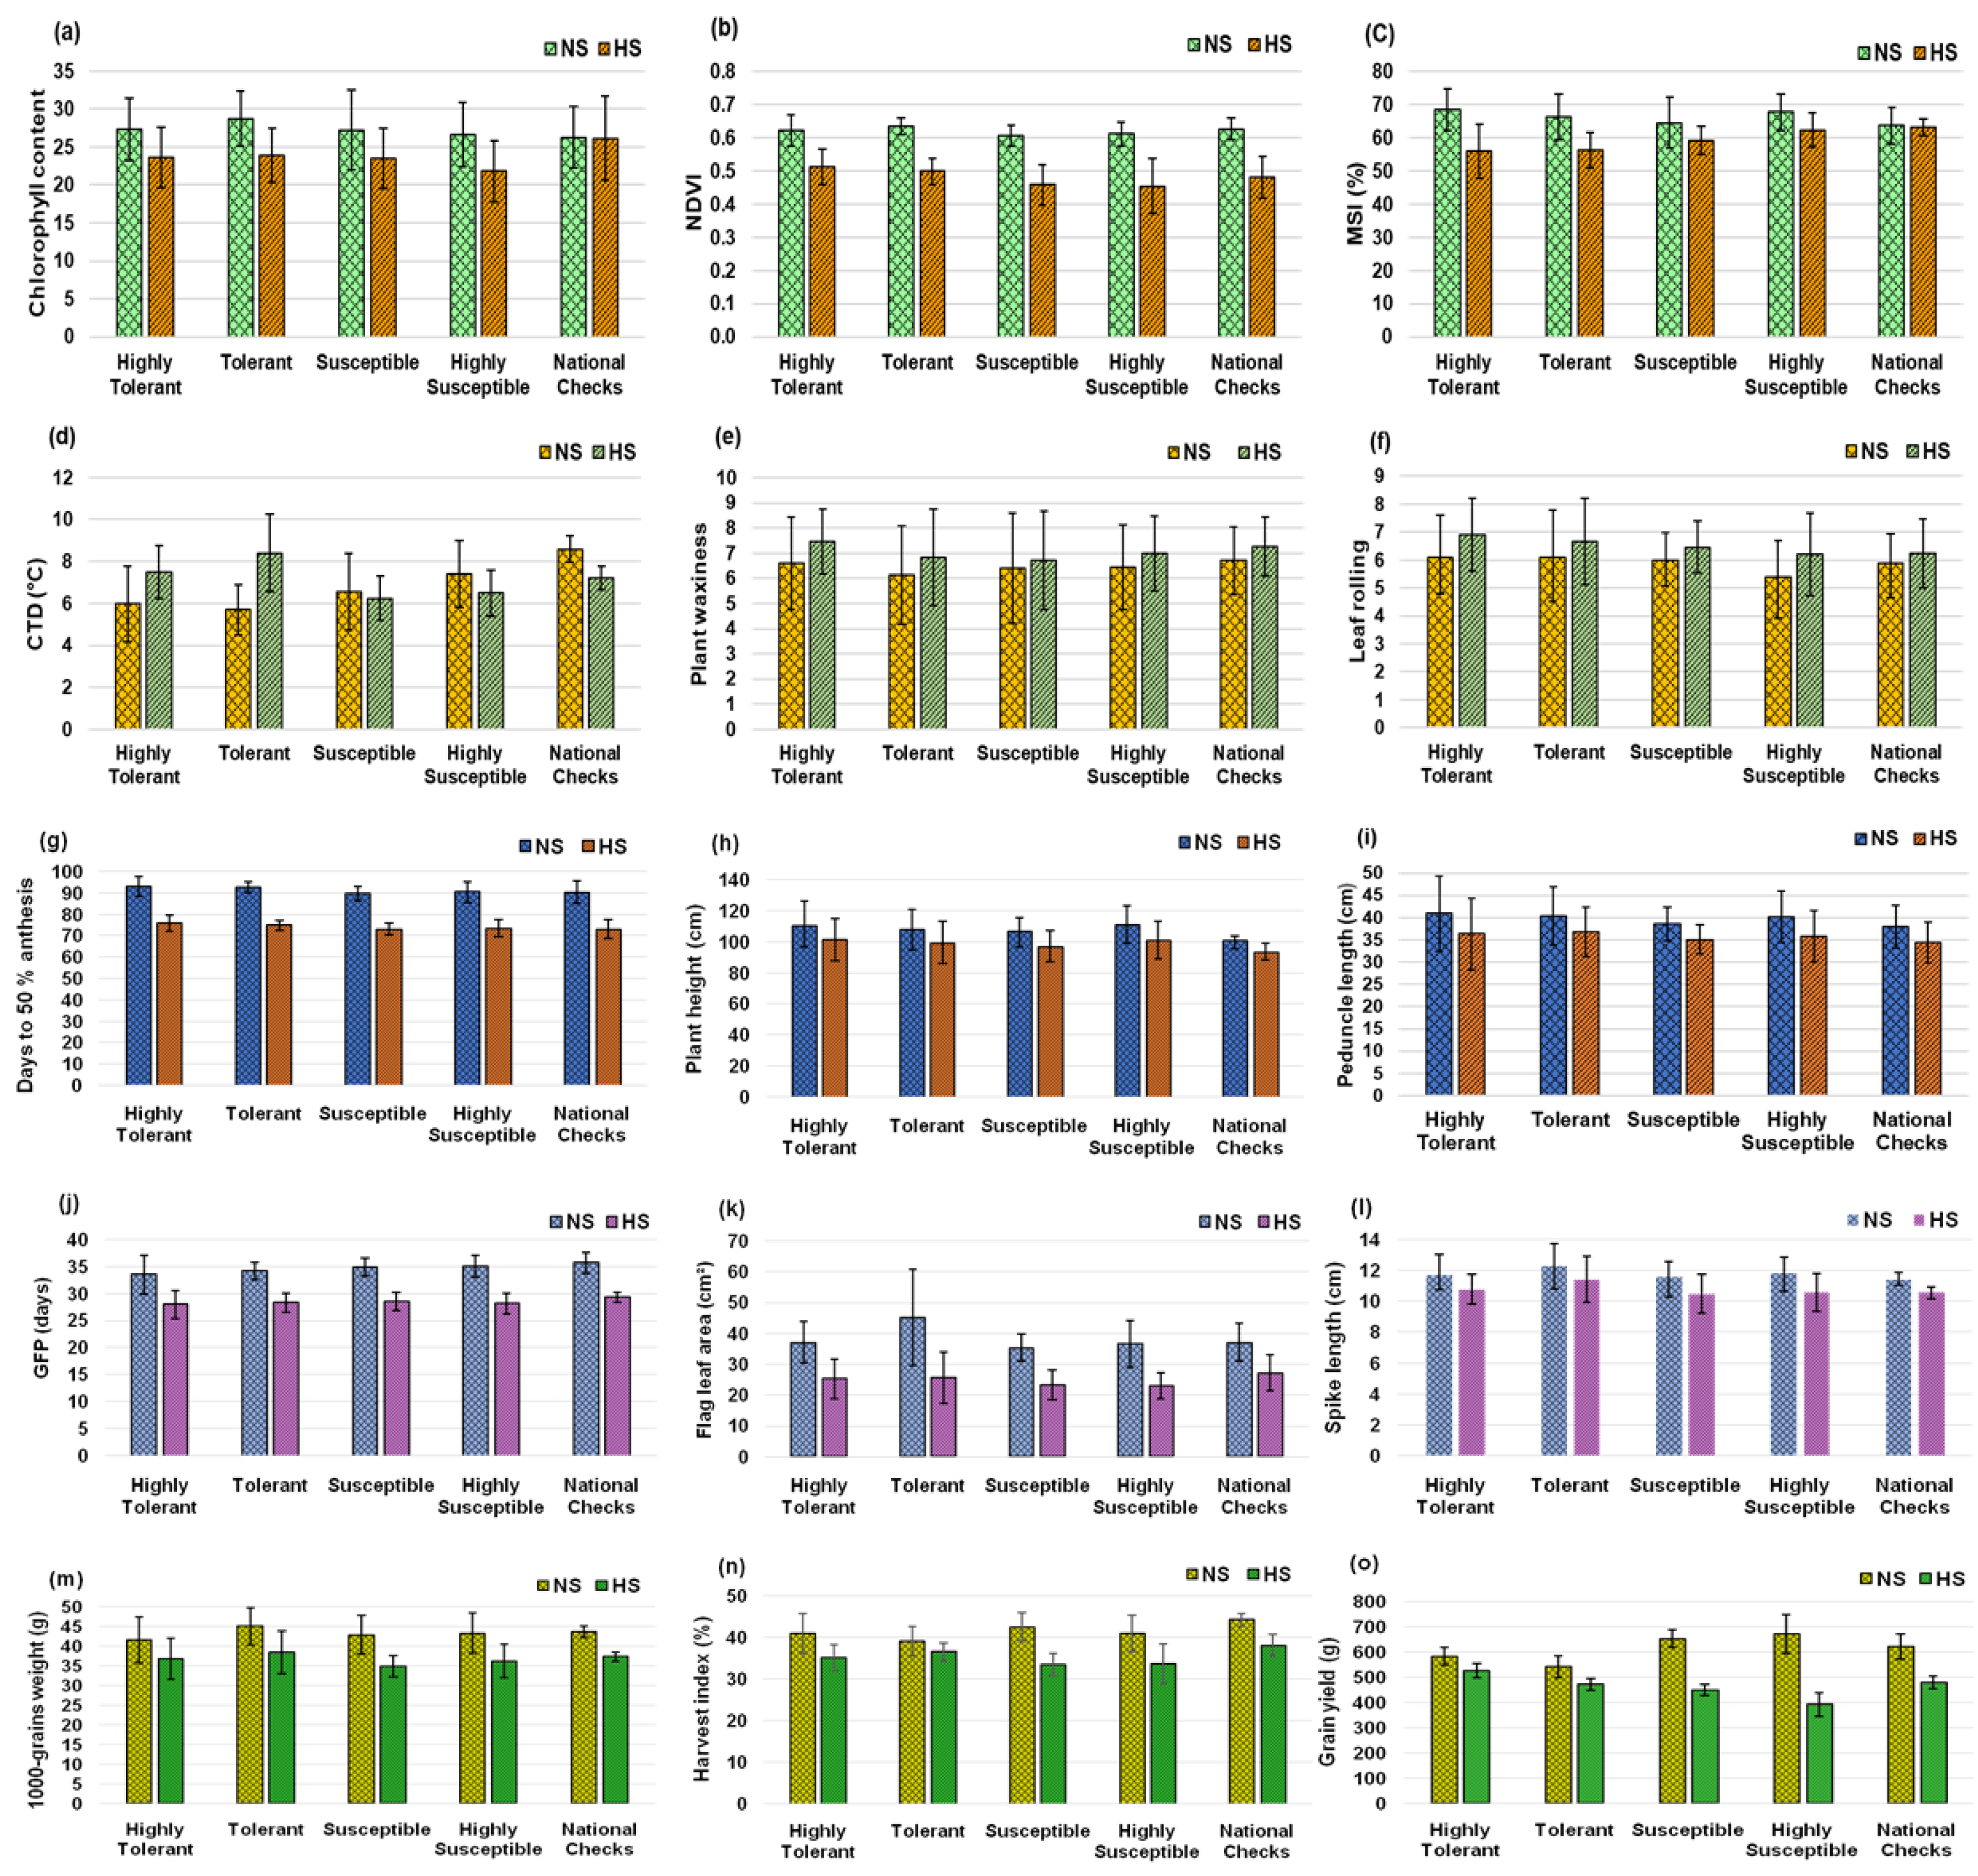
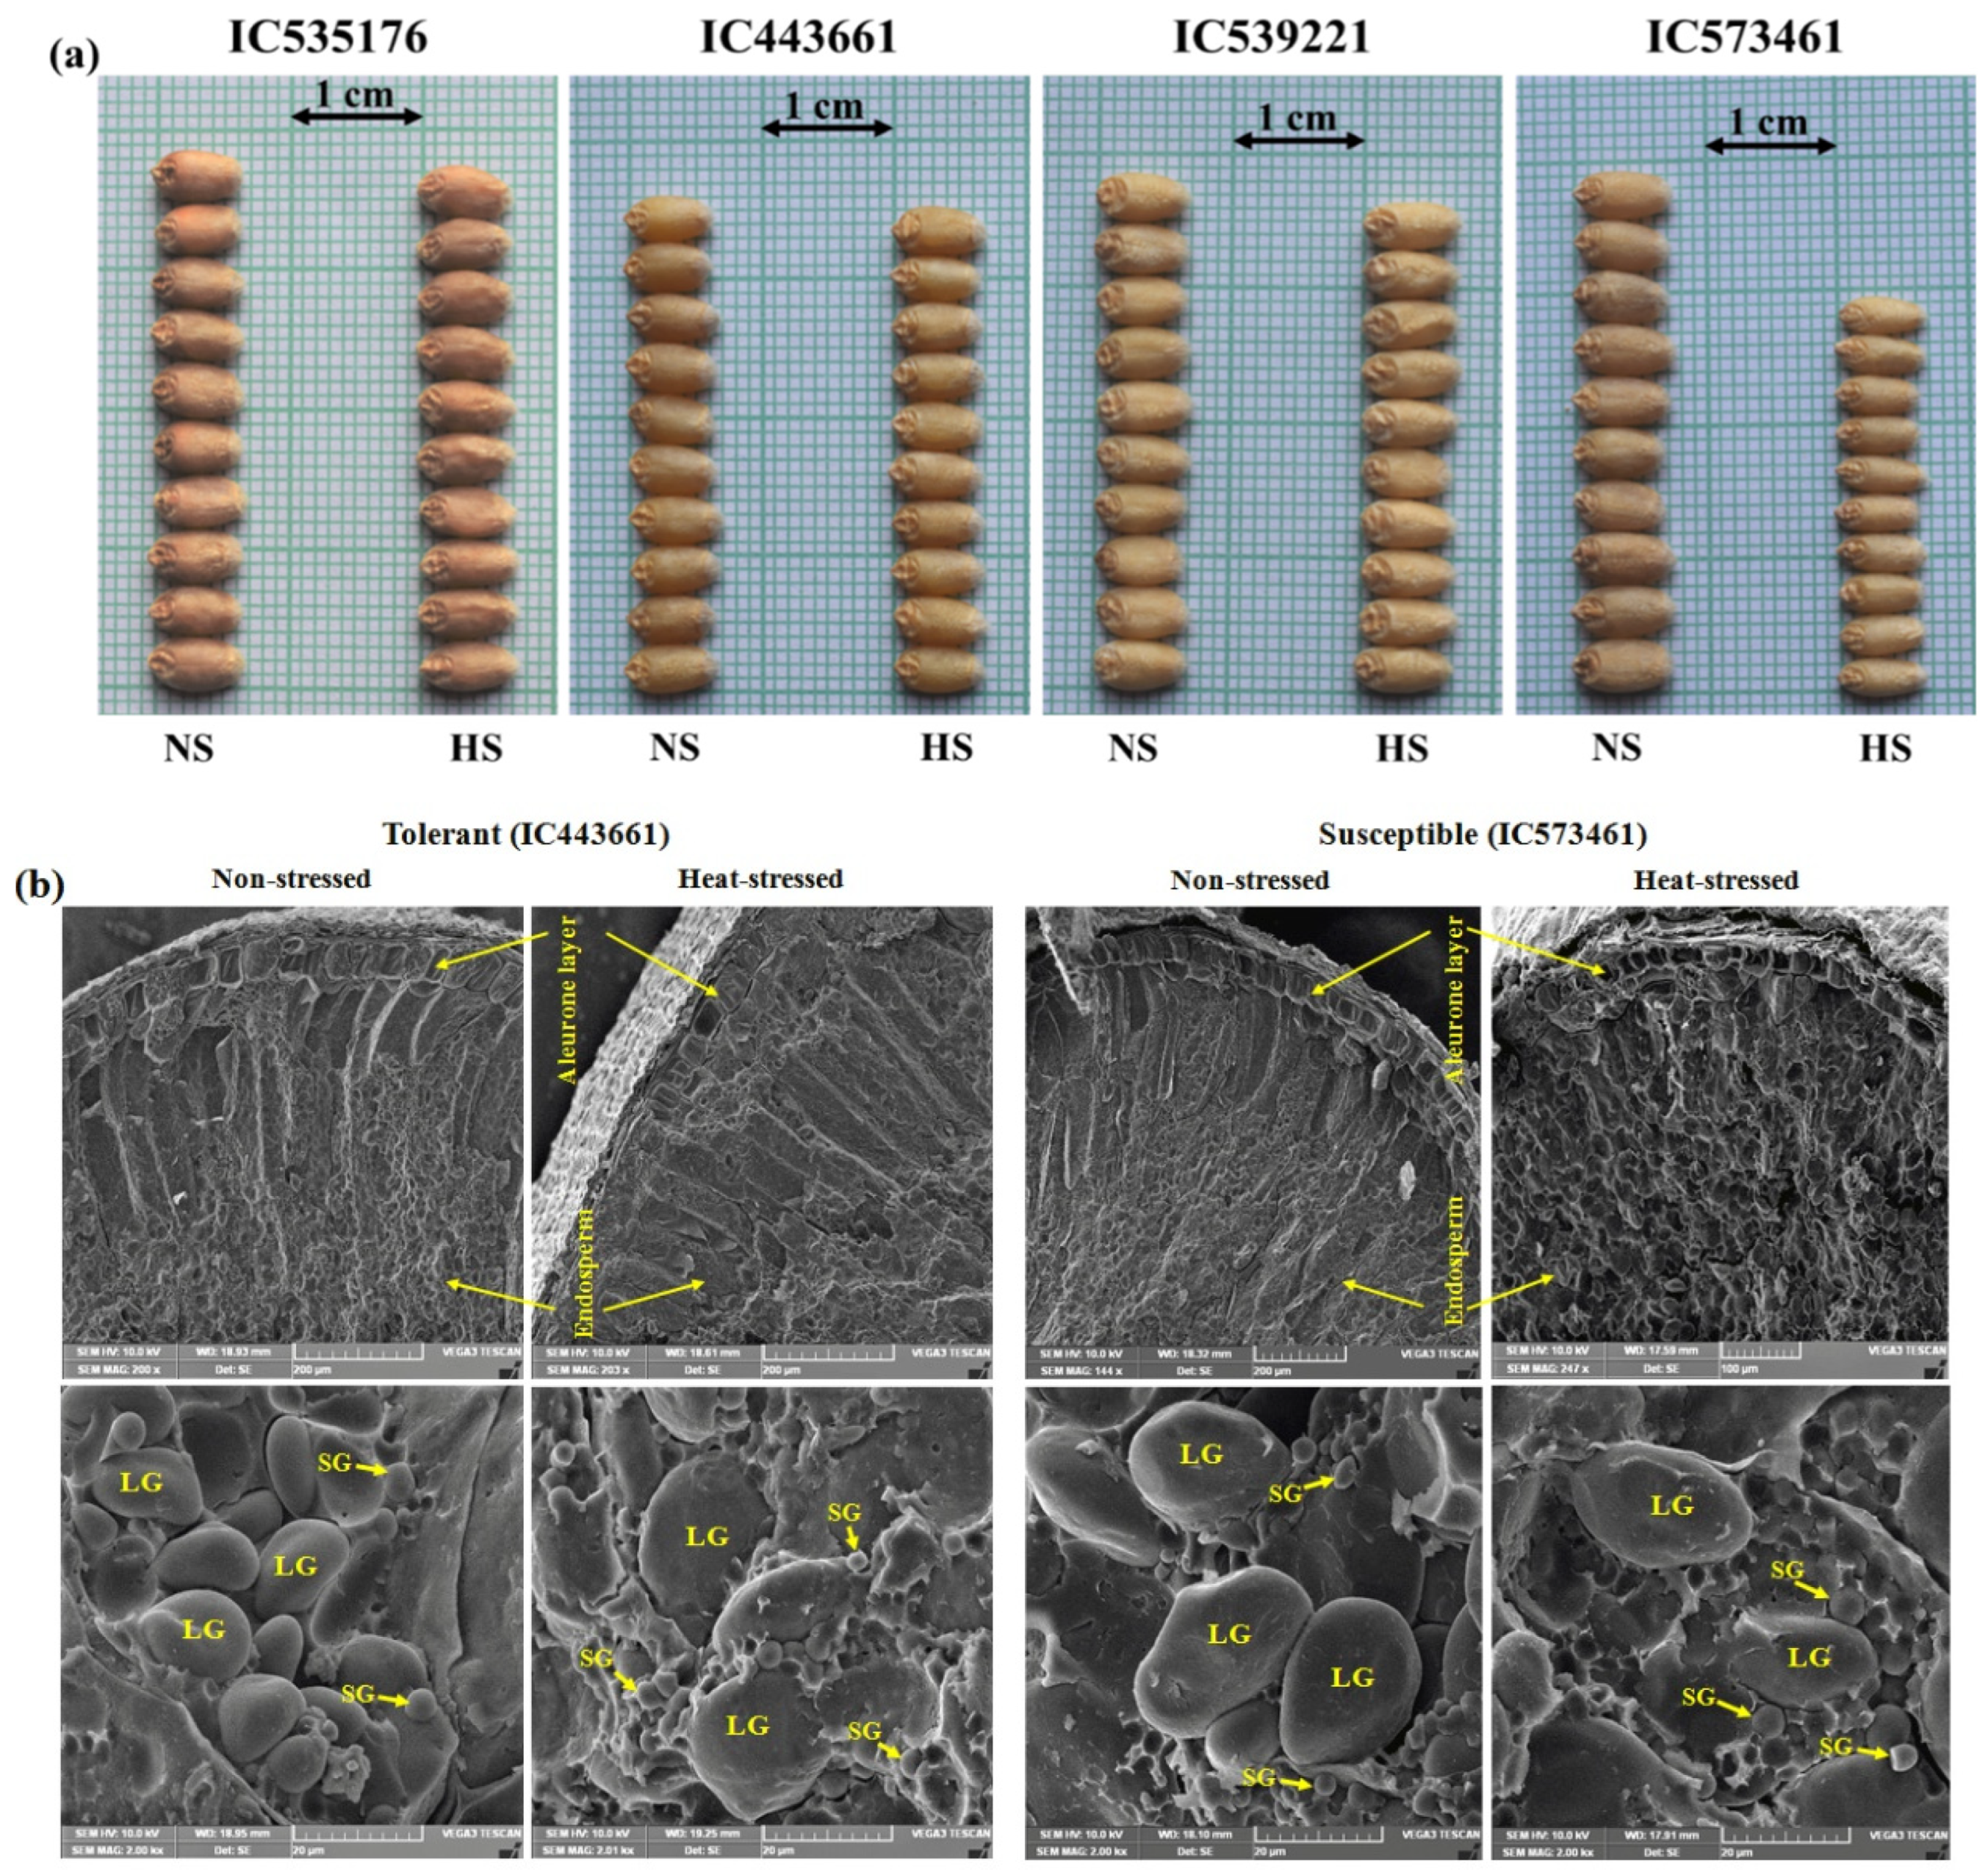
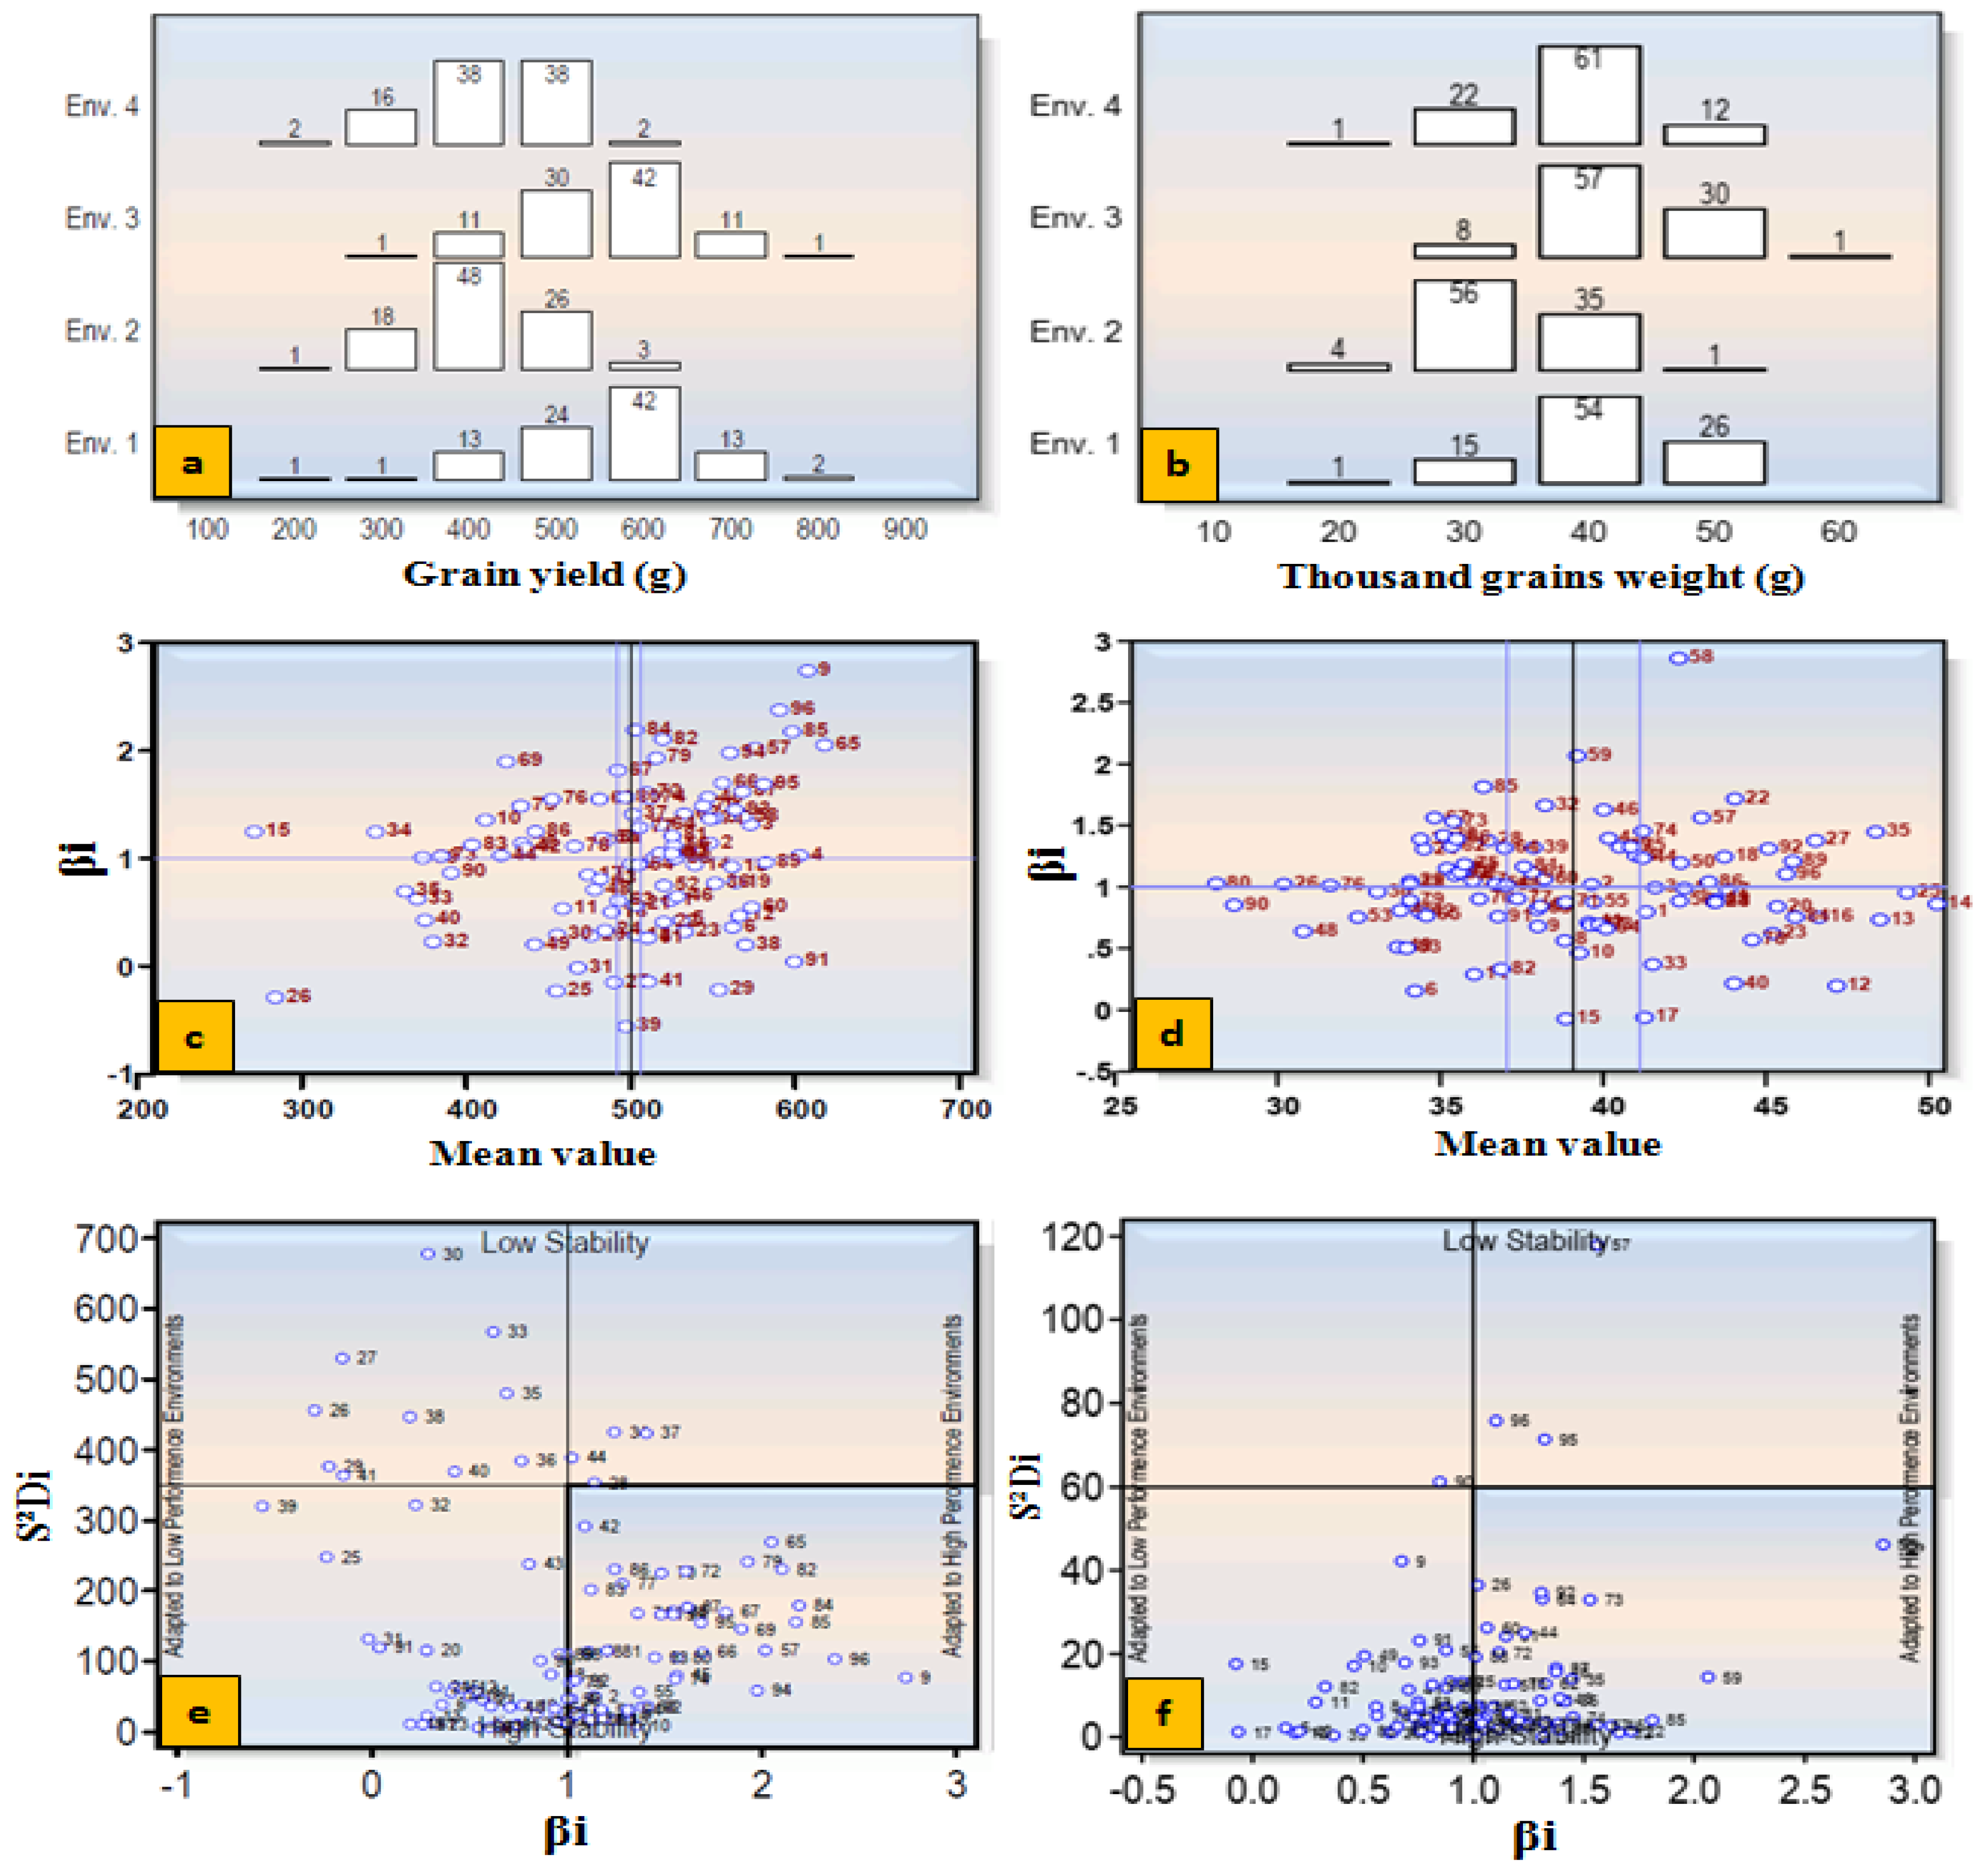
| Sl.No. | Traits studied | Code | How was the trait measured? |
|---|---|---|---|
| 1. | Chlorophyll Content |
CC | Estimated on five flag leaves of main tillers in each accession by non-destructive method using hand-held Chlorophyll Content Meter (Model-CCM-200 plus, Opti- Science, USA) and expressed as chlorophyll content index (CCI) [52]. |
| 2. | Canopy Temp. Depression (°C) | CTD | Measured on warm, sunny and cloudless day using portable Infrared Thermometer (Fisher Scientific, England) [54]. |
| 3. | Normalized Difference Vegetation Index | NDVI | NDVI was recorded using hand-held crop sensor (Green Seeker®, Trimble, USA) covering entire plot. The value for crop canopy ranged from 0 to 1; where 0 represents no green area and 1 represent maximum greenness [55]. |
| 4. | Membrane Stability Index (%) | MSI | MSI estimated as per procedure of Sairam et al. [56]. Leaf samples (0.1 g) from each plot were taken and cut into uniform small discs. MSI was calculated using formula: MSI = [1 - (C1/C2)] × 100, where C1 and C2 represent reading of EC recorded using digital conductivity meter at 45 ºC and 100 ºC, respectively. |
| 5. | Plant Waxiness (0-10 scale) | PW | Plant waxiness measured by visual observations of whole plot during mid of GFP and scored using the scale from 0 (0%) to 10 (100%) in increment of 10 %. |
| 6. | Leaf Rolling (0-10 scale) | LR | Leaf rolling measured at mid grain filling period by visual observation of whole plot and rated the proportion of the leaves showing rolling effect using a scale from 0 (0 %) to 10 (100 %) in increments of 10% [52]. |
| 7. | Days to 50 % Anthesis | DA | Recorded as the period between date of sowing and the date at which 50% of spikes start to extrude their anthers [53]. |
| 8. | Grain Filling Period (days) | GFP | GFP calculated as the difference between days to 50% anthesis and days to physiological maturity. |
| 9. | Plant Height (cm) | PH | Plant height was measured from base of the plant to top of the spike excluding awns of the main tiller at maturity. |
| 10. | Peduncle Length (cm) | PL | Measured from uppermost node to the spike collar of the main tiller at maturity in three plants per accession. |
| 11. | Flag Leaf Area (cm2) | FLA | Derived on five randomly selected plant's flag leaves using following equation [57]: Leaf area = Length × Breadth × 0.75. |
| 12. | Spike Length (cm) | SL | Measured from the spike collar to tip of spike excluding awns of the main tiller in three plants per accession. |
| 13. | Number of Spikelets per Spike | NSS | Spikelets per spike were counted on the main tiller spike of three plants per accession. |
| 14. | Grain Length (mm) | GL | Measured on five grains per accession by Digimatic Caliper (Model-CD-6''ASX, Mitutoyo Corporation, Japan). |
| 15. | Grain Width (mm) | GW | Grain width was measured from randomly selected five grains per accession by Digimatic Caliper. |
| 16. | 1000-Grain Weight (g) | TGW | TGW recorded on randomly selected 1000 grains from plot yield and weighted using sensitive electronic balance (d = 0.1 mg, Sartorius, model CPA64, Germany). |
| 17. | Harvest Index (%) | HI | HI calculated using the following formula: HI = (Grain yield per plant/ Biological yield per plant) × 100. |
| 18. | Grain Yield (g/m2) | GY | Plot yield of individual accession harvested at maturity and threshed manually. Weight of grains recorded using electronic balance and expressed as grain yield per unit area. |
| Trait | Environment | Range | Mean ± S.E. | SD | CV (%) |
PCV (%) |
GCV (%) | H (%) |
GA (%) |
|
|---|---|---|---|---|---|---|---|---|---|---|
| Min. | Maxi. | |||||||||
| CCI | NS | 17.4 | 38.5 | 26.9±0.43 | 4.21 | 15.69 | 18.1 | 15.0 | 68.3 | 25.5 |
| HS | 13.5 | 37.2 | 22.7±0.49 | 4.10 | 18.10 | 18.6 | 16.2 | 75.9 | 29.0 | |
| CTD (°C) | NS | 2.6 | 9.7 | 6.2±0.18 | 1.80 | 29.19 | 23.3 | 10.5 | 20.3 | 9.7 |
| HS | 4.4 | 12.0 | 6.9±0.15 | 1.47 | 21.24 | 26.1 | 11.0 | 17.8 | 9.6 | |
| NDVI (0 - 1) | NS | 0.54 | 0.72 | 0.62±0.01 | 0.04 | 6.03 | 7.5 | 5.1 | 42.9 | 6.6 |
| HS | 0.32 | 0.64 | 0.48±0.01 | 0.06 | 12.61 | 10.9 | 8.5 | 63.8 | 14.3 | |
| MSI (%) | NS | 50.0 | 77.5 | 66.6±0.70 | 6.89 | 10.35 | 10.5 | 6.0 | 33.0 | 7.2 |
| HS | 43.7 | 72.6 | 59.4±0.68 | 6.70 | 11.29 | 8.5 | 2.5 | 8.7 | 1.5 | |
| PW (0 - 10) | NS | 1.0 | 10.0 | 6.2±0.20 | 1.94 | 31.35 | 23.8 | 19.6 | 67.6 | 33.2 |
| HS | 2.0 | 10.0 | 6.9±0.17 | 1.68 | 24.47 | 21.4 | 17.2 | 64.6 | 28.5 | |
| LR (0 - 10) | NS | 2.5 | 9.5 | 5.8±0.13 | 1.28 | 22.04 | 20.8 | 17.5 | 71.4 | 30.5 |
| HS | 4.0 | 10.0 | 6.5±0.13 | 1.26 | 19.29 | 19.1 | 15.0 | 61.4 | 24.1 | |
| Days to 50% anthesis | NS | 83.4 | 119.0 | 91.9±0.48 | 4.72 | 5.13 | 6.1 | 5.6 | 84.9 | 10.6 |
| HS | 66.6 | 94.0 | 74.6±0.40 | 3.88 | 5.20 | 6.8 | 6.3 | 85.4 | 11.9 | |
| GFP (days) | NS | 24.0 | 39.5 | 34.2±0.25 | 2.45 | 7.16 | 19.9 | 10.7 | 29.0 | 11.9 |
| HS | 23.5 | 32.0 | 28.1±0.20 | 1.94 | 6.91 | 8.7 | 5.7 | 43.0 | 7.7 | |
| Plant height (cm) | NS | 84.9 | 150.9 | 106.6±1.31 | 12.83 | 12.03 | 5.9 | 2.5 | 17.8 | 2.2 |
| HS | 73.2 | 127.0 | 96.9±1.25 | 12.23 | 12.63 | 7.1 | 4.4 | 39.1 | 5.7 | |
| Peduncle length (cm) | NS | 29.4 | 60.1 | 39.2±0.61 | 6.00 | 15.33 | 14.7 | 12.1 | 67.7 | 20.6 |
| HS | 27.0 | 53.8 | 35.1±0.54 | 5.27 | 15.04 | 14.5 | 12.9 | 79.4 | 23.7 | |
| Flag leaf area (cm²) | NS | 21.9 | 77.0 | 37.4±0.88 | 8.61 | 23.01 | 20.4 | 16.1 | 62.4 | 26.2 |
| HS | 14.2 | 51.7 | 23.8±0.61 | 5.95 | 24.96 | 17.8 | 14.5 | 66.3 | 24.3 | |
| Spike length (cm) | NS | 8.7 | 15.6 | 11.7±0.12 | 1.18 | 10.14 | 6.8 | 3.0 | 19.4 | 2.7 |
| HS | 8.1 | 13.5 | 10.6±0.11 | 1.10 | 10.38 | 4.8 | 1.3 | 7.1 | 0.7 | |
| Spikelets per spike | NS | 16.0 | 24.0 | 20.2±0.15 | 1.46 | 7.23 | 5.9 | 2.1 | 12.7 | 1.6 |
| HS | 15.5 | 22.7 | 18.7±0.15 | 1.49 | 7.98 | 5.9 | 2.4 | 16.3 | 2.0 | |
| Grain length (mm) | NS | 5.97 | 8.76 | 6.90±0.04 | 0.39 | 5.59 | 5.6 | 4.9 | 77.9 | 9.0 |
| HS | 5.85 | 8.62 | 6.68±0.04 | 0.38 | 5.63 | 6.1 | 5.8 | 89.3 | 11.3 | |
| Grain width (mm) | NS | 2.84 | 4.02 | 3.49±0.02 | 0.19 | 5.31 | 3.5 | 2.0 | 33.0 | 2.4 |
| HS | 2.64 | 3.68 | 3.27±0.02 | 0.18 | 5.52 | 3.3 | 1.4 | 17.9 | 1.2 | |
| 1000-grain weight (g) | NS | 30.0 | 52.2 | 41.5±0.53 | 5.19 | 12.51 | 6.0 | 3.0 | 24.1 | 3.0 |
| HS | 24.9 | 46.6 | 35.5±0.48 | 4.73 | 13.34 | 8.0 | 3.3 | 16.7 | 2.8 | |
| Harvest index (%) | NS | 21.6 | 50.6 | 39.7±0.49 | 4.84 | 12.19 | 9.4 | 1.7 | 13.3 | 0.6 |
| HS | 23.4 | 48.0 | 34.4±0.45 | 4.38 | 12.76 | 9.3 | 3.2 | 11.9 | 2.3 | |
| Grain yield (g/m2) | NS | 300.0 | 802.5 | 562.2±8.77 | 86.00 | 15.30 | 11.3 | 7.3 | 42.1 | 9.8 |
| HS | 176.7 | 598.1 | 423.6±7.34 | 71.95 | 16.97 | 10.5 | 5.8 | 30.2 | 6.6 | |
| Sources of variation | D.F. | TGW (MSS) | Grain Yield (MSS) |
|---|---|---|---|
| Genotypes | 95 | 89.54** | 19206.70** |
| Environment + (G × E) | 288 | 28.00** | 9164.46** |
| Environment | 3 | 1589.07** | 614125.02** |
| Environment G × E | 285 | 11.57 | 2796.45** |
| Environment (Linear) | 1 | 4767.22** | 1842375.06** |
| G × E (Linear) | 95 | 9.53 | 18197.54** |
| Pooled deviation | 192 | 12.46 | 148.88 |
| Total | 383 | 43.27 | 11655.34 |
 |
| Sl. No. | Traits for mapping population | Parents with desirable traits for heat-stress tolerance | |
|---|---|---|---|
| a). | Bi-parental population | Parent(Higher value) | Parent(Lower value) |
| 1. | Plant waxiness | IC529207, IC528965 | IC252431, IC252444 |
| 2. | Leaf rolling | IC416019, IC416055 | IC553599, IC252816 |
| 3. | Earliness | IC296383 | IC542509 |
| 4. | Grain filling period | IC252725 | EC577013 |
| 5. | Grain width | IC401976 | IC112258 |
| 6. | 1000-grain weight | IC539221 | IC542544 |
| 7. | Harvest index | IC443653 | IC542509 |
| 8. | Grain yield | IC566223 | EC577013 |
| b) | MAGIC Population | Parents with desirable traits | |
| 1. | 4-parent MAGIC | IC566223, IC529207, IC416019, IC296383 | |
| 2. | 8-parent MAGIC |
IC128454, IC519900, IC528965, IC416055, IC539221, IC401976, IC535176, IC566223 | |
Disclaimer/Publisher’s Note: The statements, opinions and data contained in all publications are solely those of the individual author(s) and contributor(s) and not of MDPI and/or the editor(s). MDPI and/or the editor(s) disclaim responsibility for any injury to people or property resulting from any ideas, methods, instructions or products referred to in the content. |
© 2023 by the authors. Licensee MDPI, Basel, Switzerland. This article is an open access article distributed under the terms and conditions of the Creative Commons Attribution (CC BY) license (http://creativecommons.org/licenses/by/4.0/).


