Preprint
Article

Low-Temperature Treatment of Boehmitic Bauxite Using the Bayer Reductive Method With the Formation of High-Iron Mag-Netite Concentrate

Altmetrics

Downloads

162

Views

46

Comments

0

A peer-reviewed article of this preprint also exists.

Submitted:

27 May 2023

Posted:

31 May 2023

You are already at the latest version

Alerts
Abstract
The Bayer process is the maim method of alumina production worldwide. The use of low-quality bauxites for alumina production results in the formation of a significant amount of technogenic waste - bauxite residue (BR). The Bayer reductive method is one possible way to eliminate BR stockpiling, but it requires high-pressure leaching at temperatures higher than 220 °C. In this research, the possibility of boehmitic bauxite atmospheric pressure leaching at both the first and second stages or high-pressure leaching at the second stage with the simultaneous reduction of hematite was investigated. Bauxite and solid residue after NaOH leaching were characterized using XRD, SEM-EDS, and Mössbauer spectroscopy methods. The first stage of leaching under atmospheric pressure with the addition of Fe(II) species in a strong alkali solution (330-400 g L–1 Na2O) results in a partial reduction of the iron minerals and an extraction of more than 60% of Si and 5-25% of Al (depending on caustic modulus of solution) after 1 h. The obtained desilicated bauxite was subjected to atmospheric leaching at 120 °C in a strong alkali solution (350 g L-1) or high-pressure leaching at 160-220 °C using the Bayer process mother liquor in order to obtain a concentrate with a magnetite content higher than 83 wt. %.
Keywords: 
Subject: Chemistry and Materials Science  -   Chemical Engineering

1. Introduction

Depending on the composition and properties of the feedstock, alumina (Al2O3) is produced by a variety of industrial processes [1]. Low-silica bauxites are used worldwide for the production of alumina by the most energy-effective Bayer process, which is based on alkaline leaching with continuous regeneration of the solution by the desilication and precipitation of aluminium hydroxide (Al(OH)3) [2]. However, lower quality raw materials with the silica modulus (ηSi, Al2O3 to SiO2 mass ratio) lower than 7 such as high-silica bauxites, kaolin, clays, argillites, alkaline aluminosilicates, coal ash, coal gangue, aluminum dross and other materials will be used in the near future. The use of the Bayer method for treatment of such materials become ineffective because of the formation of high amount of the desilication product (DSP, Na6[Al6Si6O24]·Na2X, where Na2X is inorganic compounds of Na) [1].
Sintering with soda (Na2CO3) and lime (CaO) [3,4], acid methods [5,6] was developed for low-grade ores. However, almost all alumina from such raw materials is currently produced by sintering and combined alkaline sintering processes [7], which are high energy-intensive and produce a large amount of solid waste (red mud or BR).
This is why following modified alkaline methods based on the Bayer process are being developed extensively:
(a) gravity separation followed by the Bayer process [8,9];
(b) aluminosilicate flotation followed by the Bayer process [10,11,12];
(c) chemical pre-desilication followed by the Bayer process [13,14];
(d) the reductive Bayer process [15,16].
The reductive Bayer process is most promising method from view of the BR elimination, because it makes it possible to transfer BR in the easy to process by-product with the high iron content in the form of magnetite (Fe3O4) [17,18]. The mechanism of the magnetite formation can be described by the following Equations (1)-(3). The source of the Fe2+ can be different: iron [19] and aluminium [20] that reacts with the alkaline solution with the formation of H2 and following reduction of Fe3+ to Fe2+; addition of the FeSO4 [21,22], addition of organic matter [23]. The presence of Fe2+ ions also help to reduce the amount of Na and Al that is lost with the BR, that is connected with the formation of other desilication products [24]. But the main disadvantage of these methods is the need of high-pressure leaching process at T > 220 °C.
Fe + H2O + OH = HFeO2 + H2,
Fe2+ + 3OH = HFeO2 + H2O,
Fe2O3 + HFeO2 = Fe3O4 + OH.
In the recent work by Li et al. [23] it was shown that the use of two-stage process, where at the first stage major part of the Si-containing materials from gibbsitic bauxite was transferred to the solution, and the magnetization of goethite (𝛾-FeOOH) was accomplished at the second stage at 270 °C, results in the complete dissolution of Al and the formation of the BR that could be used as substituent for iron concentrates.
In our previous research it was shown that there is possibility to perform the complete magnetization of the 𝛾-FeOOH at atmospheric pressure using highly concentrated alkaline solution (CNa2O > 330 g L–1) [25]. In this research this process was used for magnetization of hematite (Fe2O3), which is a part of high-silica and high-iron boehmitic bauxite. To eliminate DSP formation the process was accomplished in two stages, where at the first stage the desilication of the bauxite was made in the presence of Fe2+ that begins to react with iron minerals. At the second stage, the desilicated bauxite was subjected to atmospheric leaching at 120 °C in strong alkali solution or high-pressure leaching at 160-220 °C in the Bayer process mother liquor to obtain magnetite concentrate with the iron content higher than 58 %. The bauxite and the solid residues were characterized using Mössbauer spectroscopy, X-ray diffraction and SEM-EDS analyses to reveal the transformation of iron minerals to magnetite.

2. Materials and Methods

2.1. Experimental

Pre-desilication with caustic alkali solution and desilicated bauxite leaching were carried out in a thermostatically controlled 0.5 L stainless steel reactor and in high-pressure reactors, respectively. The reactor had openings for loading of chemical reagents, as well as for temperature control and recirculation of evaporated water through a water-cooled condenser. The high-pressure reactors were hermetically sealed steel vessels placed in an air thermostat with mixing through the head. Stirring speed in all experiments was 400 rpm for reactor and 40 rpm for high-pressure reactors, because the leaching efficiency does not increase at higher speeds. Crushed ore and the required amount of lime (analytical purity) were added to a solution with Na2O concentration of 330, 360 or 400 g L–1 and an initial concentration of Al2O3 of 0, 190 and 380 g L–1 on the basis of obtaining the required L:S ratio (ml g–1). For simultaneous process of hematite magnetization, in addition to bauxite the stoichiometric (relative to the trivalent iron in the magnetite) amount of divalent iron as FeSO4-7H2O (analytical purity) was added. After leaching, the pulp was filtered; the solid residue was dried at 110°C for 240 min before analysis.

2.2. Materials

Raw bauxite used in this research was obtained from the RUSAL-Kamensk-Uralsky alumina refinery (56.304530, 61.980334; Kamensk-Uralsky, Russia) that use high-silica boehmitic bauxite from the Timan deposit (Komi Republic, Russia) for alumina production using combined the Bayer-sintering process.
Alkaline solutions were prepared by dissolving a previously determined amount of solid NaOH (JSC Soda, Sterlitamak, Russia) in 300 ml of distilled water. After complete dissolution, the volume was adjusted with water to obtain a solution with Na2O concentration of 330, 360, or 400 g L-1 (CNa2O). To study the effect of Al concentration in the solution on the leaching process, solutions of different initial concentrations of 190 and 380 g L-1 Al2O3 (CAl2O3) were prepared by dissolving Al(OH)3 (JSC BaselCement-Pikalevo, Pikalevo, Russia) in a hot alkaline solution.

2.3. Methods of analysis

Mineralogy of the raw bauxite and the solid residue after alkali leaching were measured using X-ray diffraction (XRD) using a Difrei-401 X-ray diffractometer (JSC Scientific Instruments, Saint Petersburg, Russia) using a Cr-Kα radiation source and a 2θ range from 14° to 140° with 30 min exposure time. The operating mode of the X-ray source was set to 25 kW/4 mA. The mineral phases were analyzed using Match! 3 software (Crystal Impact, Bonn, Germany).
The solid residue after pulp filtration was analyzed by a Axios Max X-ray fluorescence (XRF) spectrometer (Panalytical, Almelo, Netherlands). The surface morphology and elemental composition of the raw bauxite and the samples after NaOH leaching were investigated by scanning electron microscopy energy-dispersive X-ray spectroscopy (SEM-EDX, Vega III, Tescan, Czech Republic).
The particle size distribution of the raw bauxite and the solid residues were determined by laser diffraction method (LD) using a Analysette 22 NanoTec (Fritsch, Idar-Oberstein, Germany).
57Fe Mössbauer absorption spectra were obtained on an express Mössbauer spectrometer MS1104EM (CJSC Kordon, Rostov-on-Don, Russia) at temperatures of 296 ± 3 and 77.7 ± 0.3 K. In this case, the source of γ-radiation with an activity of 40 mCu in the form of 57Co/Rh (Cyclotron Co., Ltd, Obninsk, Russia) was at room temperature. The noise/signal ratio for the spectra did not exceed 2%. Mathematical processing of the experimental Mössbauer spectra was carried out for high-resolution spectra (1024 points) using the SpectRelax 2.8 program (Lomonosov Moscow State University, Russia). The isomeric shifts values are given relative to α-Fe.

2.4. Calculations

The amount of elements extracted from the bauxite (X) was estimated using Equation (4):
X = (m1 × X1 − m2 × X2)/(m1 × X1),
where m1 is the mass of the original sample (g), X1 is the mineral content in the original sample (%), m2 is the mass of the leaching residue (g), and X2 is the mineral content in the leaching residue (%).
To avoid the mutual influence of factors and to reduce the number of experiments, a Box–Benken experimental design created using Statistica 13 software (TIBCO, Hamburg, Germany) was used. The design consists of three blocks of sixteen experiments each, with varying parameters at three levels. The output parameters are the extraction of Al and Si into solution and the content of Fe and Na in the solid residue.
A statistically based automated neural network (SANN) was used to model the Al and Si extraction, as well as Fe and Na content in the solid residue depending on the variables. SANN is an artificial-intelligence-based method that adjusts the result of modeling using learning methods until the desired quality is obtained models using. A multilayer perceptron (MLP) method was used for bauxite leaching process study.

3. Results and discussion

3.1. Raw bauxite charackterization

Raw bauxite was taken from the Timan deposit was pre-crushed using a rod mill and subsequently classified on vibrating sieves (NKP Mekhanobr-Tekhnika, Russia) to achieve particle size of 80 % less than 71 μm. The crushed bauxite before experiments was subjected to sieve analysis to obtain three fractions: -50 μm, +50-71 μm, and +71 μm. The average particle size of each fraction was: 48 μm, 62 μm, and 87 μm. The chemical composition of these three fractions and the raw bauxite is shown in Table 1.
According to the data presented in Table 1, the raw bauxite is high-iron and highly siliceous. Silica modulus of bauxite is 8.36 units, which is at the lower limit of profitability for Bayer's method.
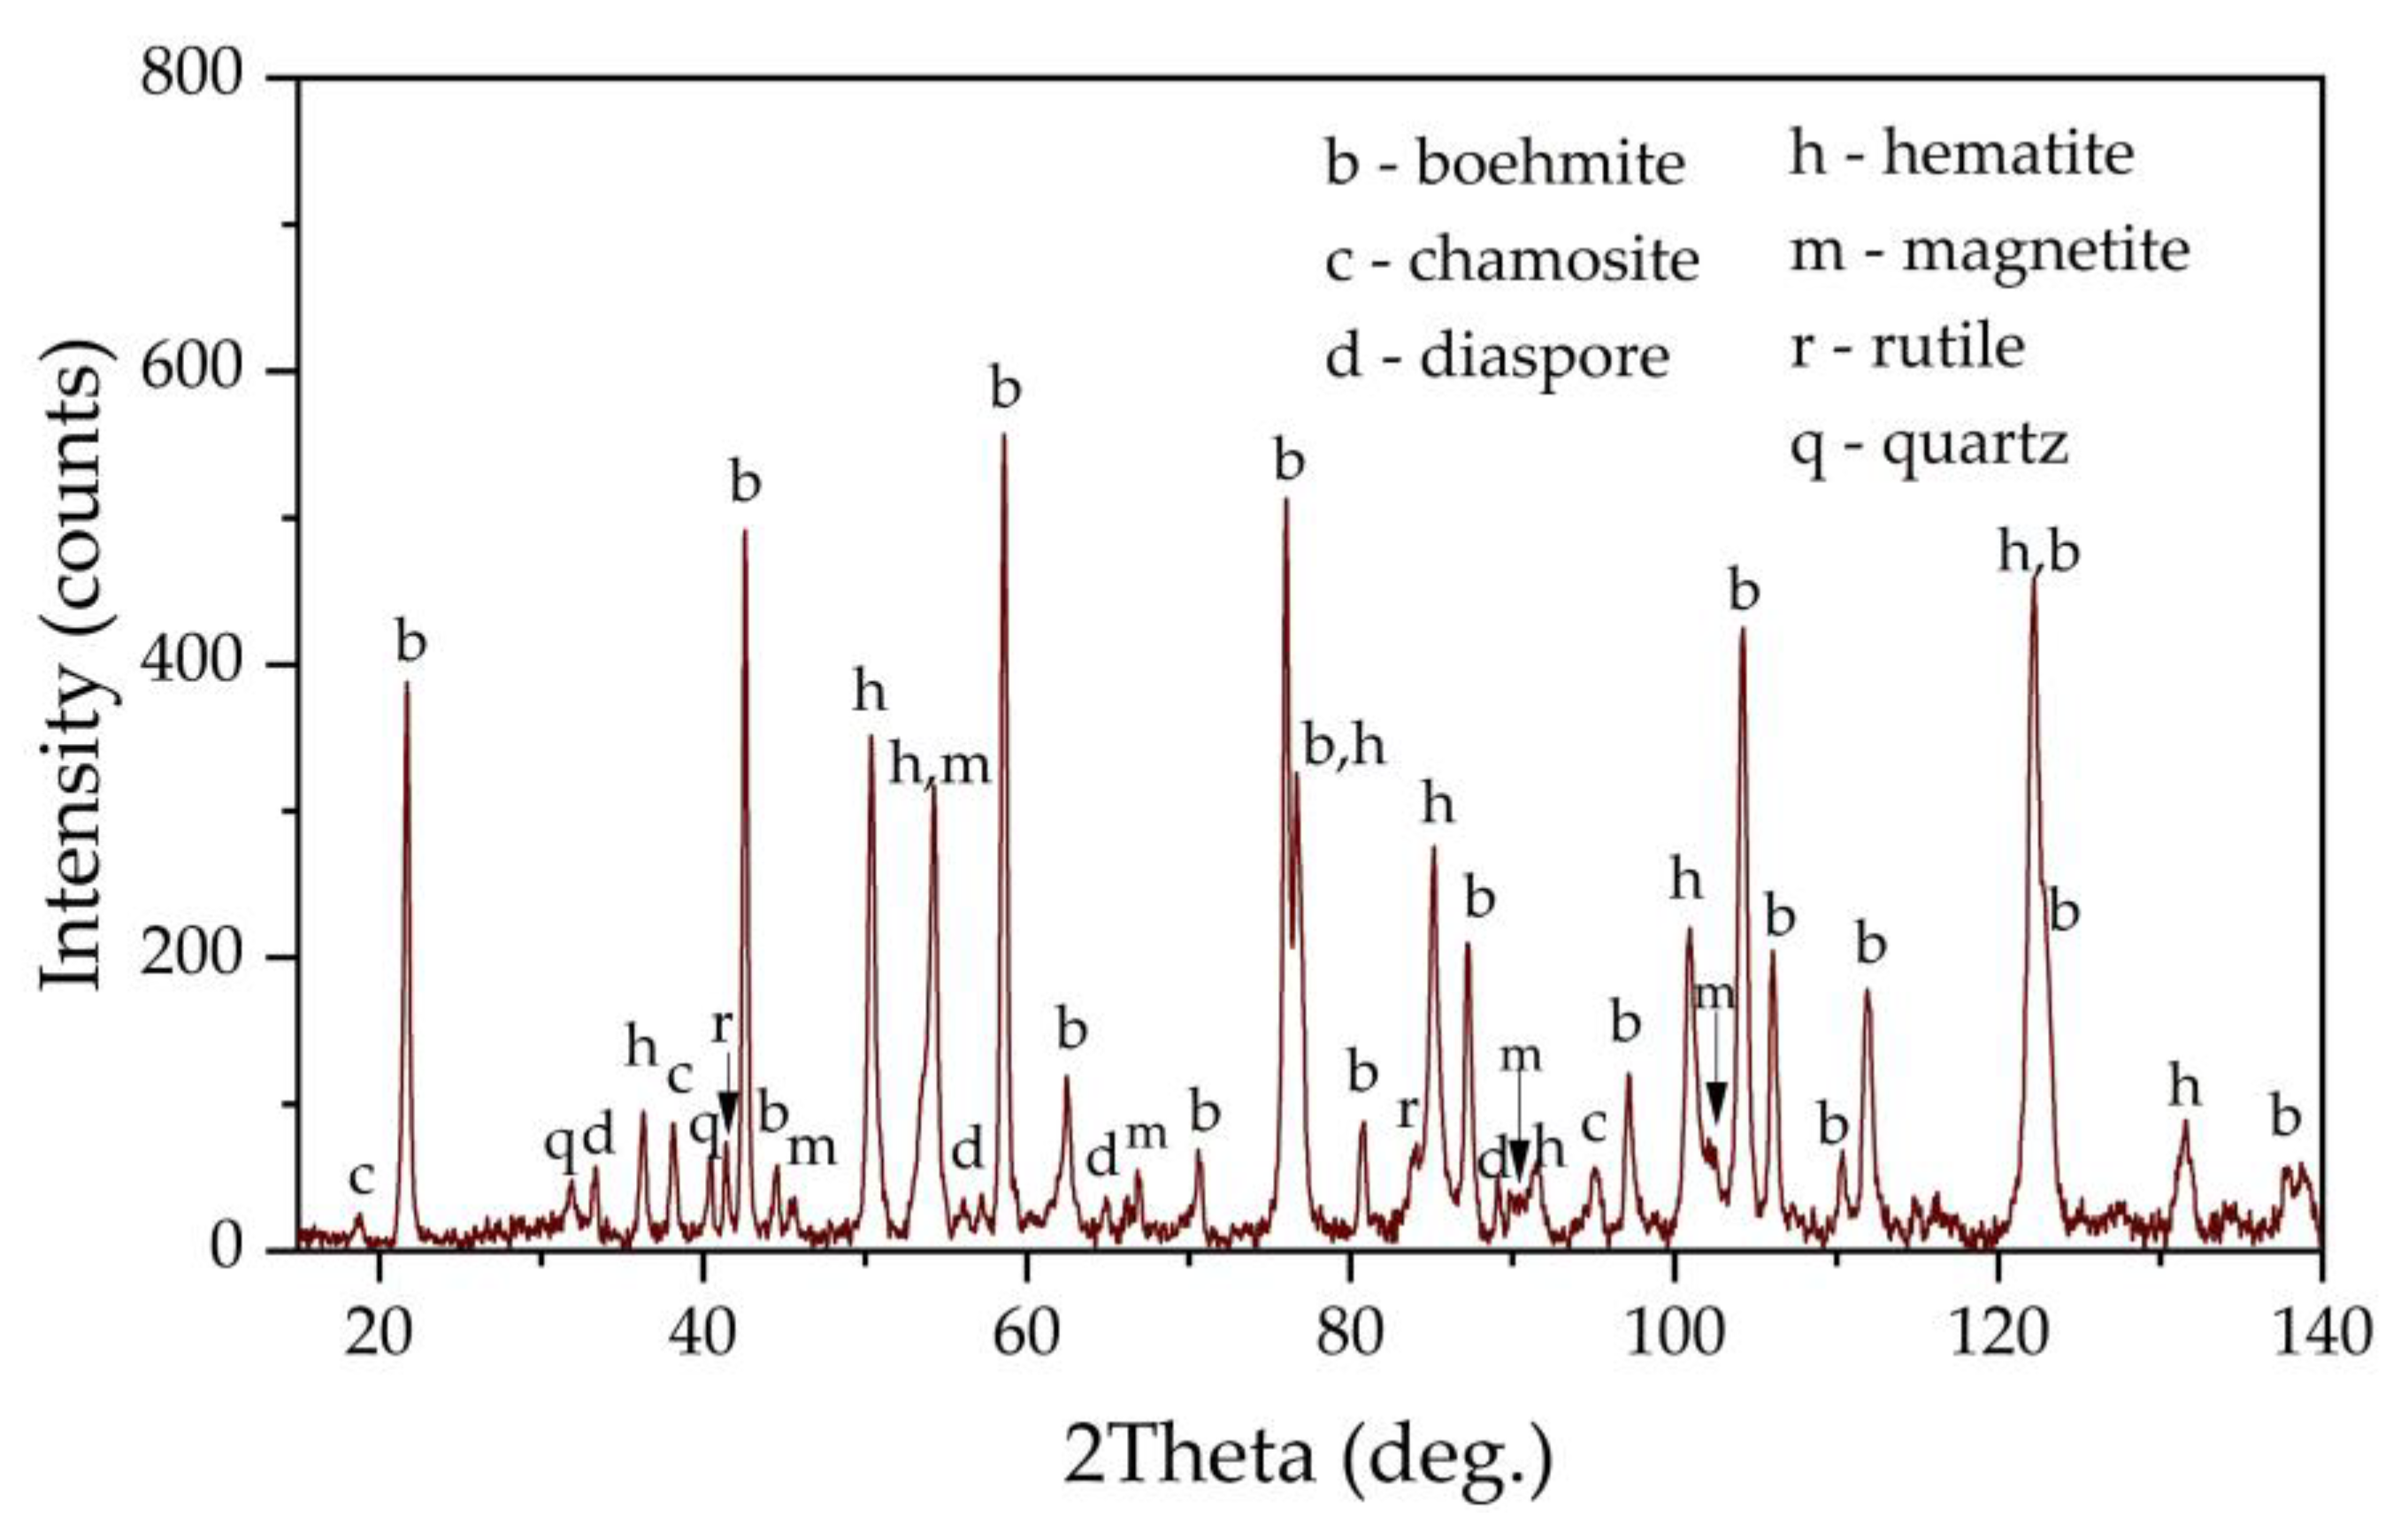
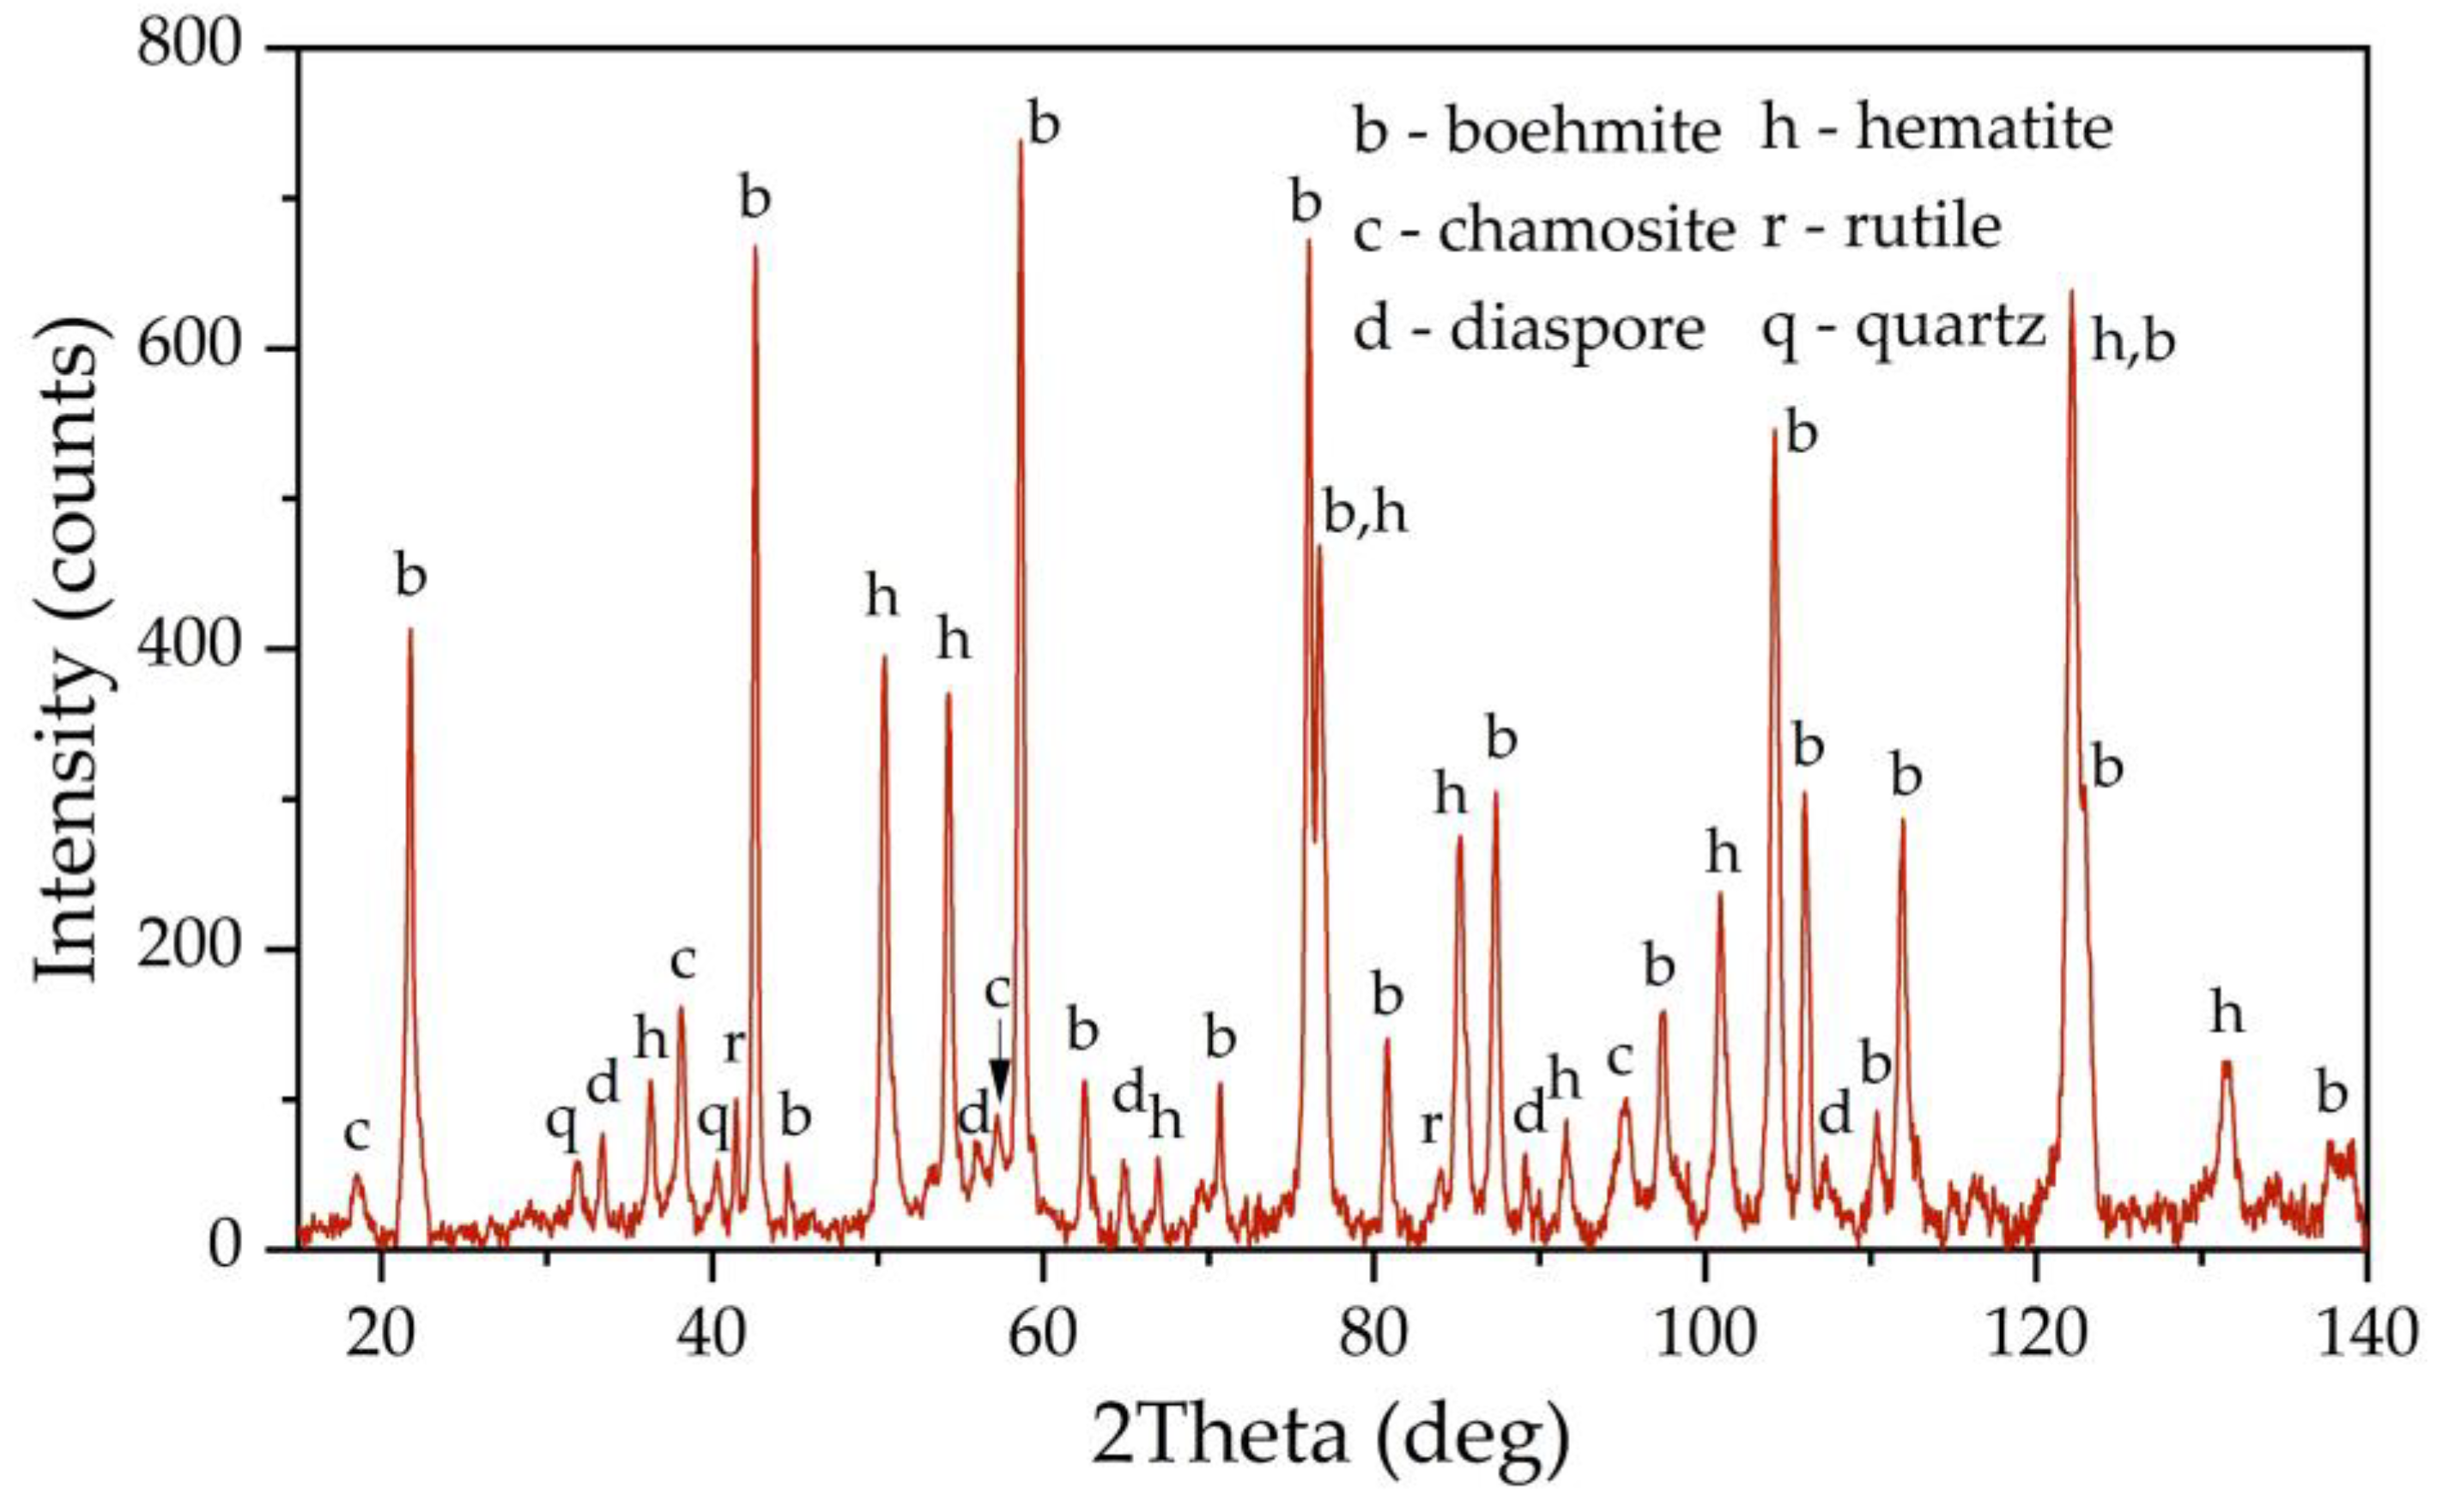
Figure 1 shows an X-ray diagram of the raw bauxite. Raw bauxite consists mainly of boehmite (AlOOH) and hematite (Fe2O3). Also, small amounts of rutile (TiO2), quartz (SiO2), diaspore (AlOOH), chamosite ((Fe²⁺,Mg,Al,Fe³⁺)₆(Si,Al)₄O₁₀(OH,O)₈) are present. A semi-quantitative analysis of the crystalline phases of the bauxite sample is shown in Table 2. According to Table 2, more than 62 % of the original bauxite is represented by boehmite, more than 25 % by hematite, the rest - quartz, rutile and chamosite. However, it should be noted that chamosite also has in its composition both alumina and silica, which may lead to subsequent problems during leaching (secondary aluminum losses due to the formation of DSP), also according to literature data [6] kaolinite is often found in high-silica bauxite, but its content in this sample of Timan bauxite is insignificant or it is poorly crystalized.
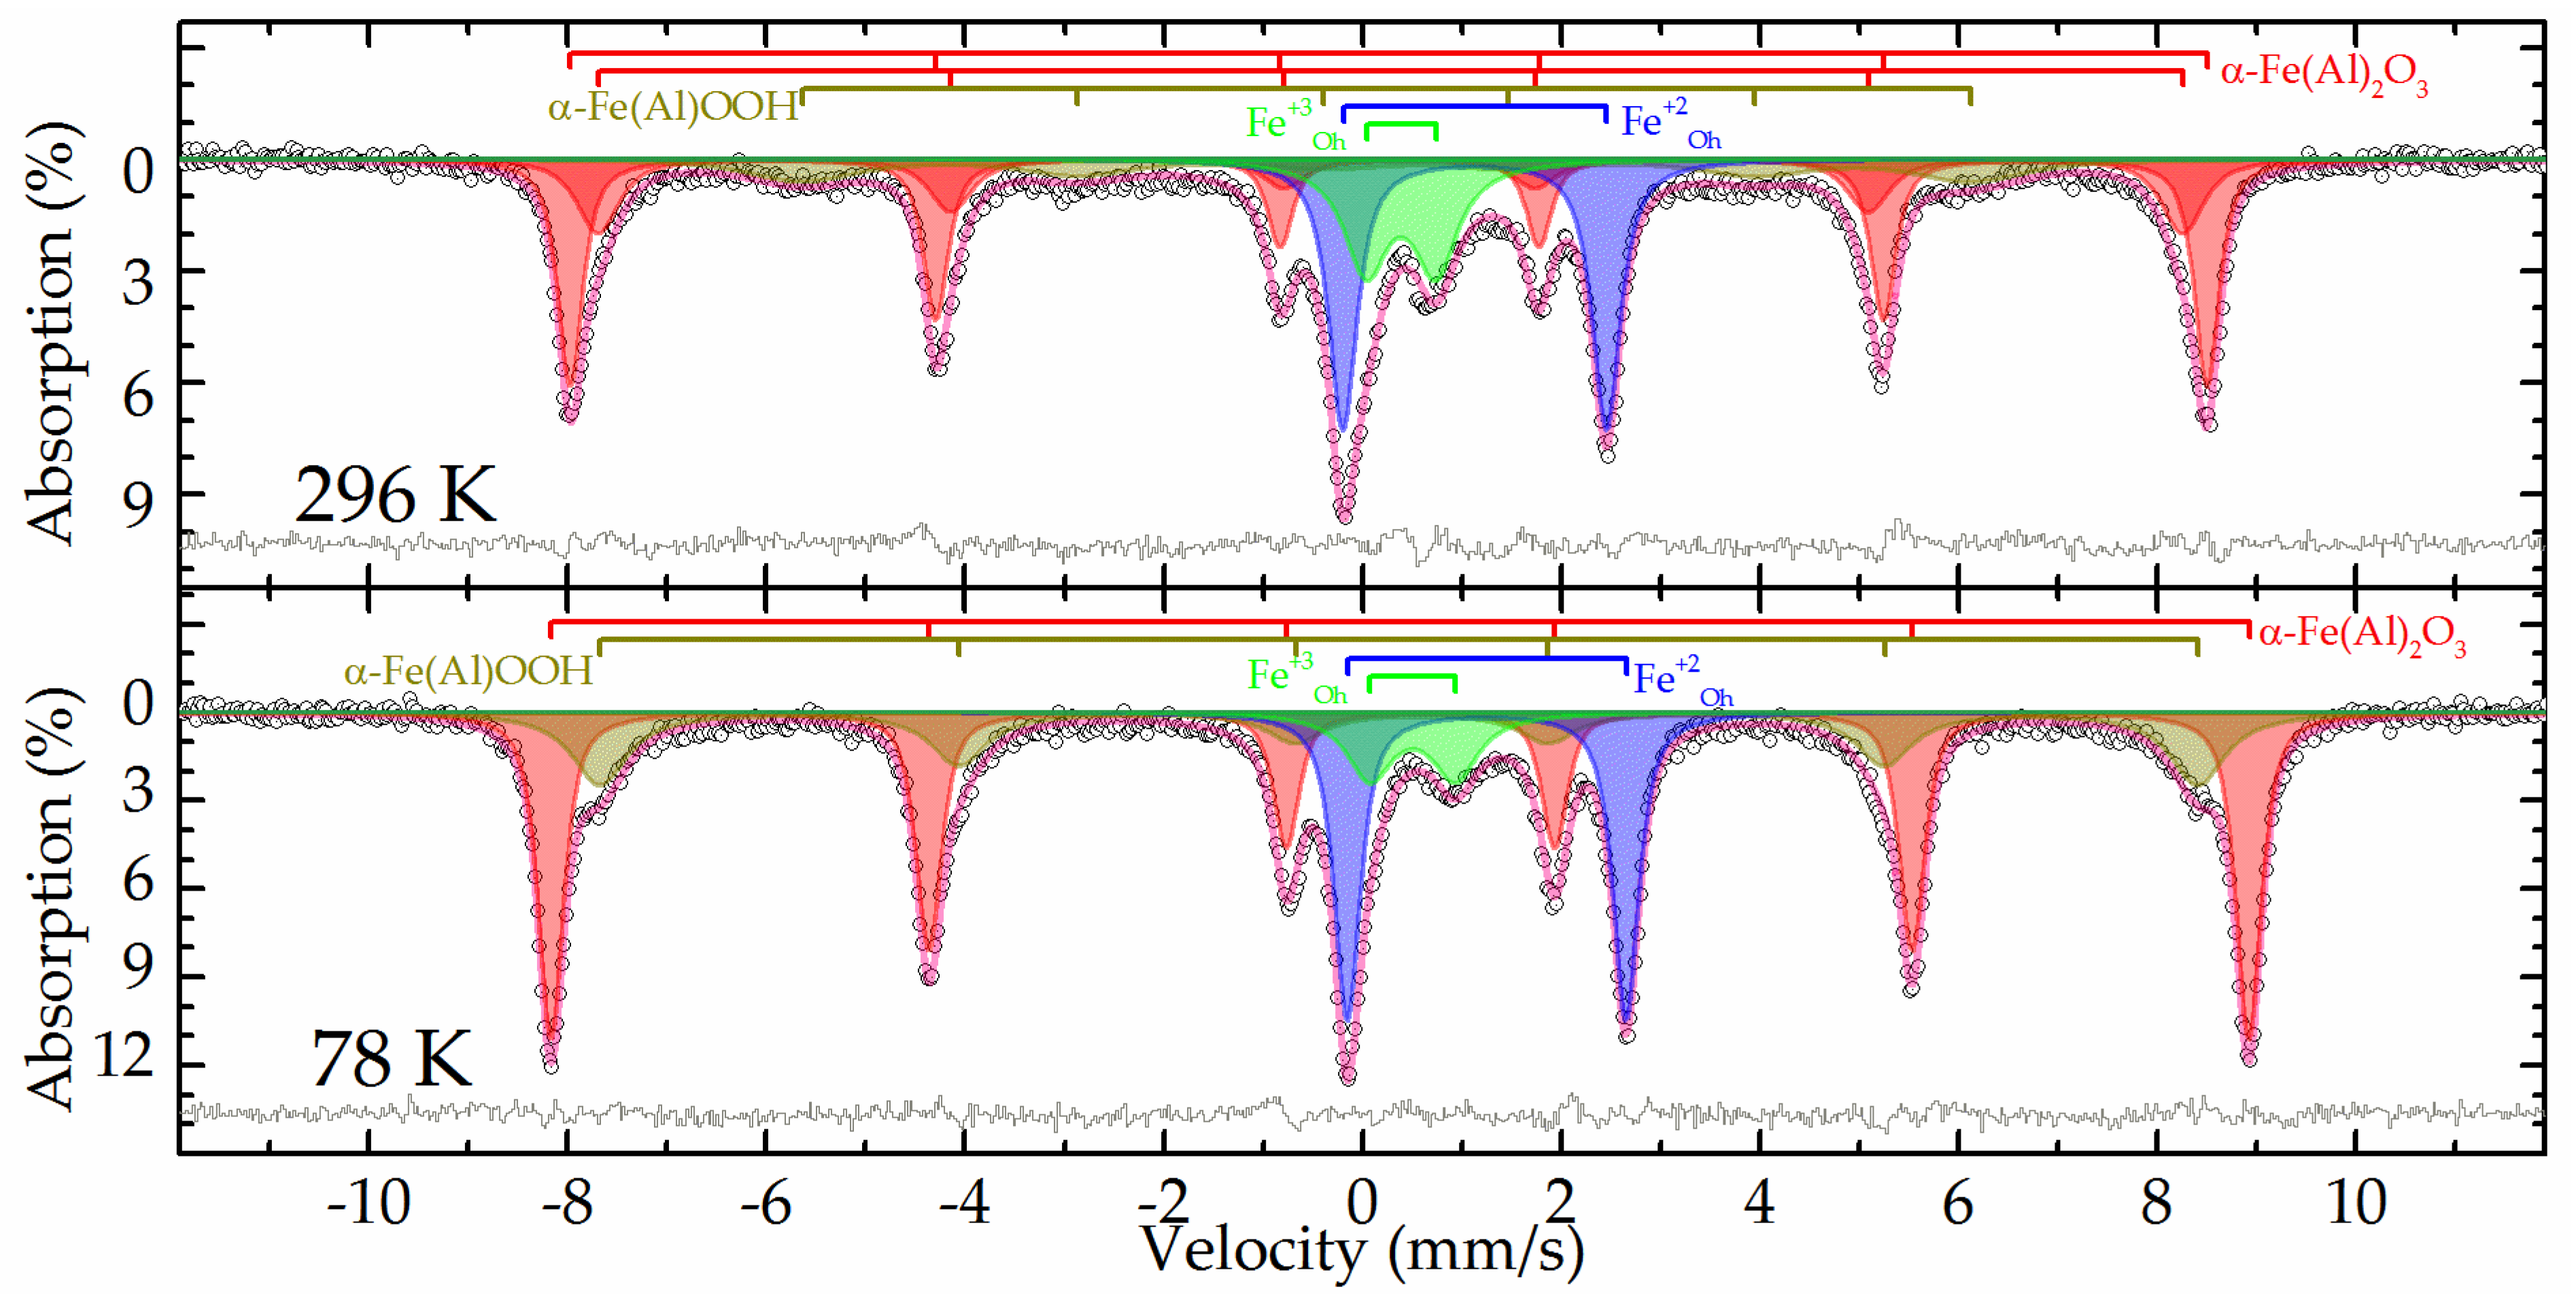
The Mössbauer spectra at both temperatures of the raw bauxite sample are a set of rather narrow resonance lines in which the presence of a sextet and a doublet with a large quadrupole splitting is clearly distinguished (Figure 2). The experimental spectra can be satisfactorily described by a superposition of 4 or 5 subspectra, including two symmetrical doublets and two or three symmetrical sextets (Table 3).
In the spectrum obtained at room temperature, two sextets with the maximum values of hyperfine magnetic splitting (Table 3, subspectra 1 and 2) correspond to hematite - α-Fe2O3, as well as aluminum-substituted hematite [25]. When the sample is cooled to the boiling point of nitrogen, these two sextets combine into one sextet (Figure 2). In this case, the value of the quadrupole shift does not change sign, which indicates the absence of the Morrin transition characteristic of pure hematite, and confirms the hypothesis of alumohematite formation [26]. The remaining sextet demonstrates a strong temperature dependence of both its profile and the hyperfine magnetic splitting (Table 3, subspectrum 3). The hyperfine parameters of this subspectrum and the features of its temperature changes allow it to be attributed to alumogoethite, which we considered in detail in [5]. The rest of the spectrum is described by a pair of doublets corresponding to iron atoms with charges +3 and +2 (Table 3, subspectra 4 and 5) in the high-spin state and octahedral oxygen environment [27]. Considering that the intensity of subspectrum 4 (Table 3) decreases almost twofold with decreasing temperature, it can be assumed that superparamagnetic alumogoethite is partly responsible for the formation of this subspectrum. The rest of this subspectrum, as well as subspectrum 5, obviously belong to a layered aluminosilicate mineral, in particular, the hyperfine parameters make it possible to reliably assign them to chamosite [28,29,30].
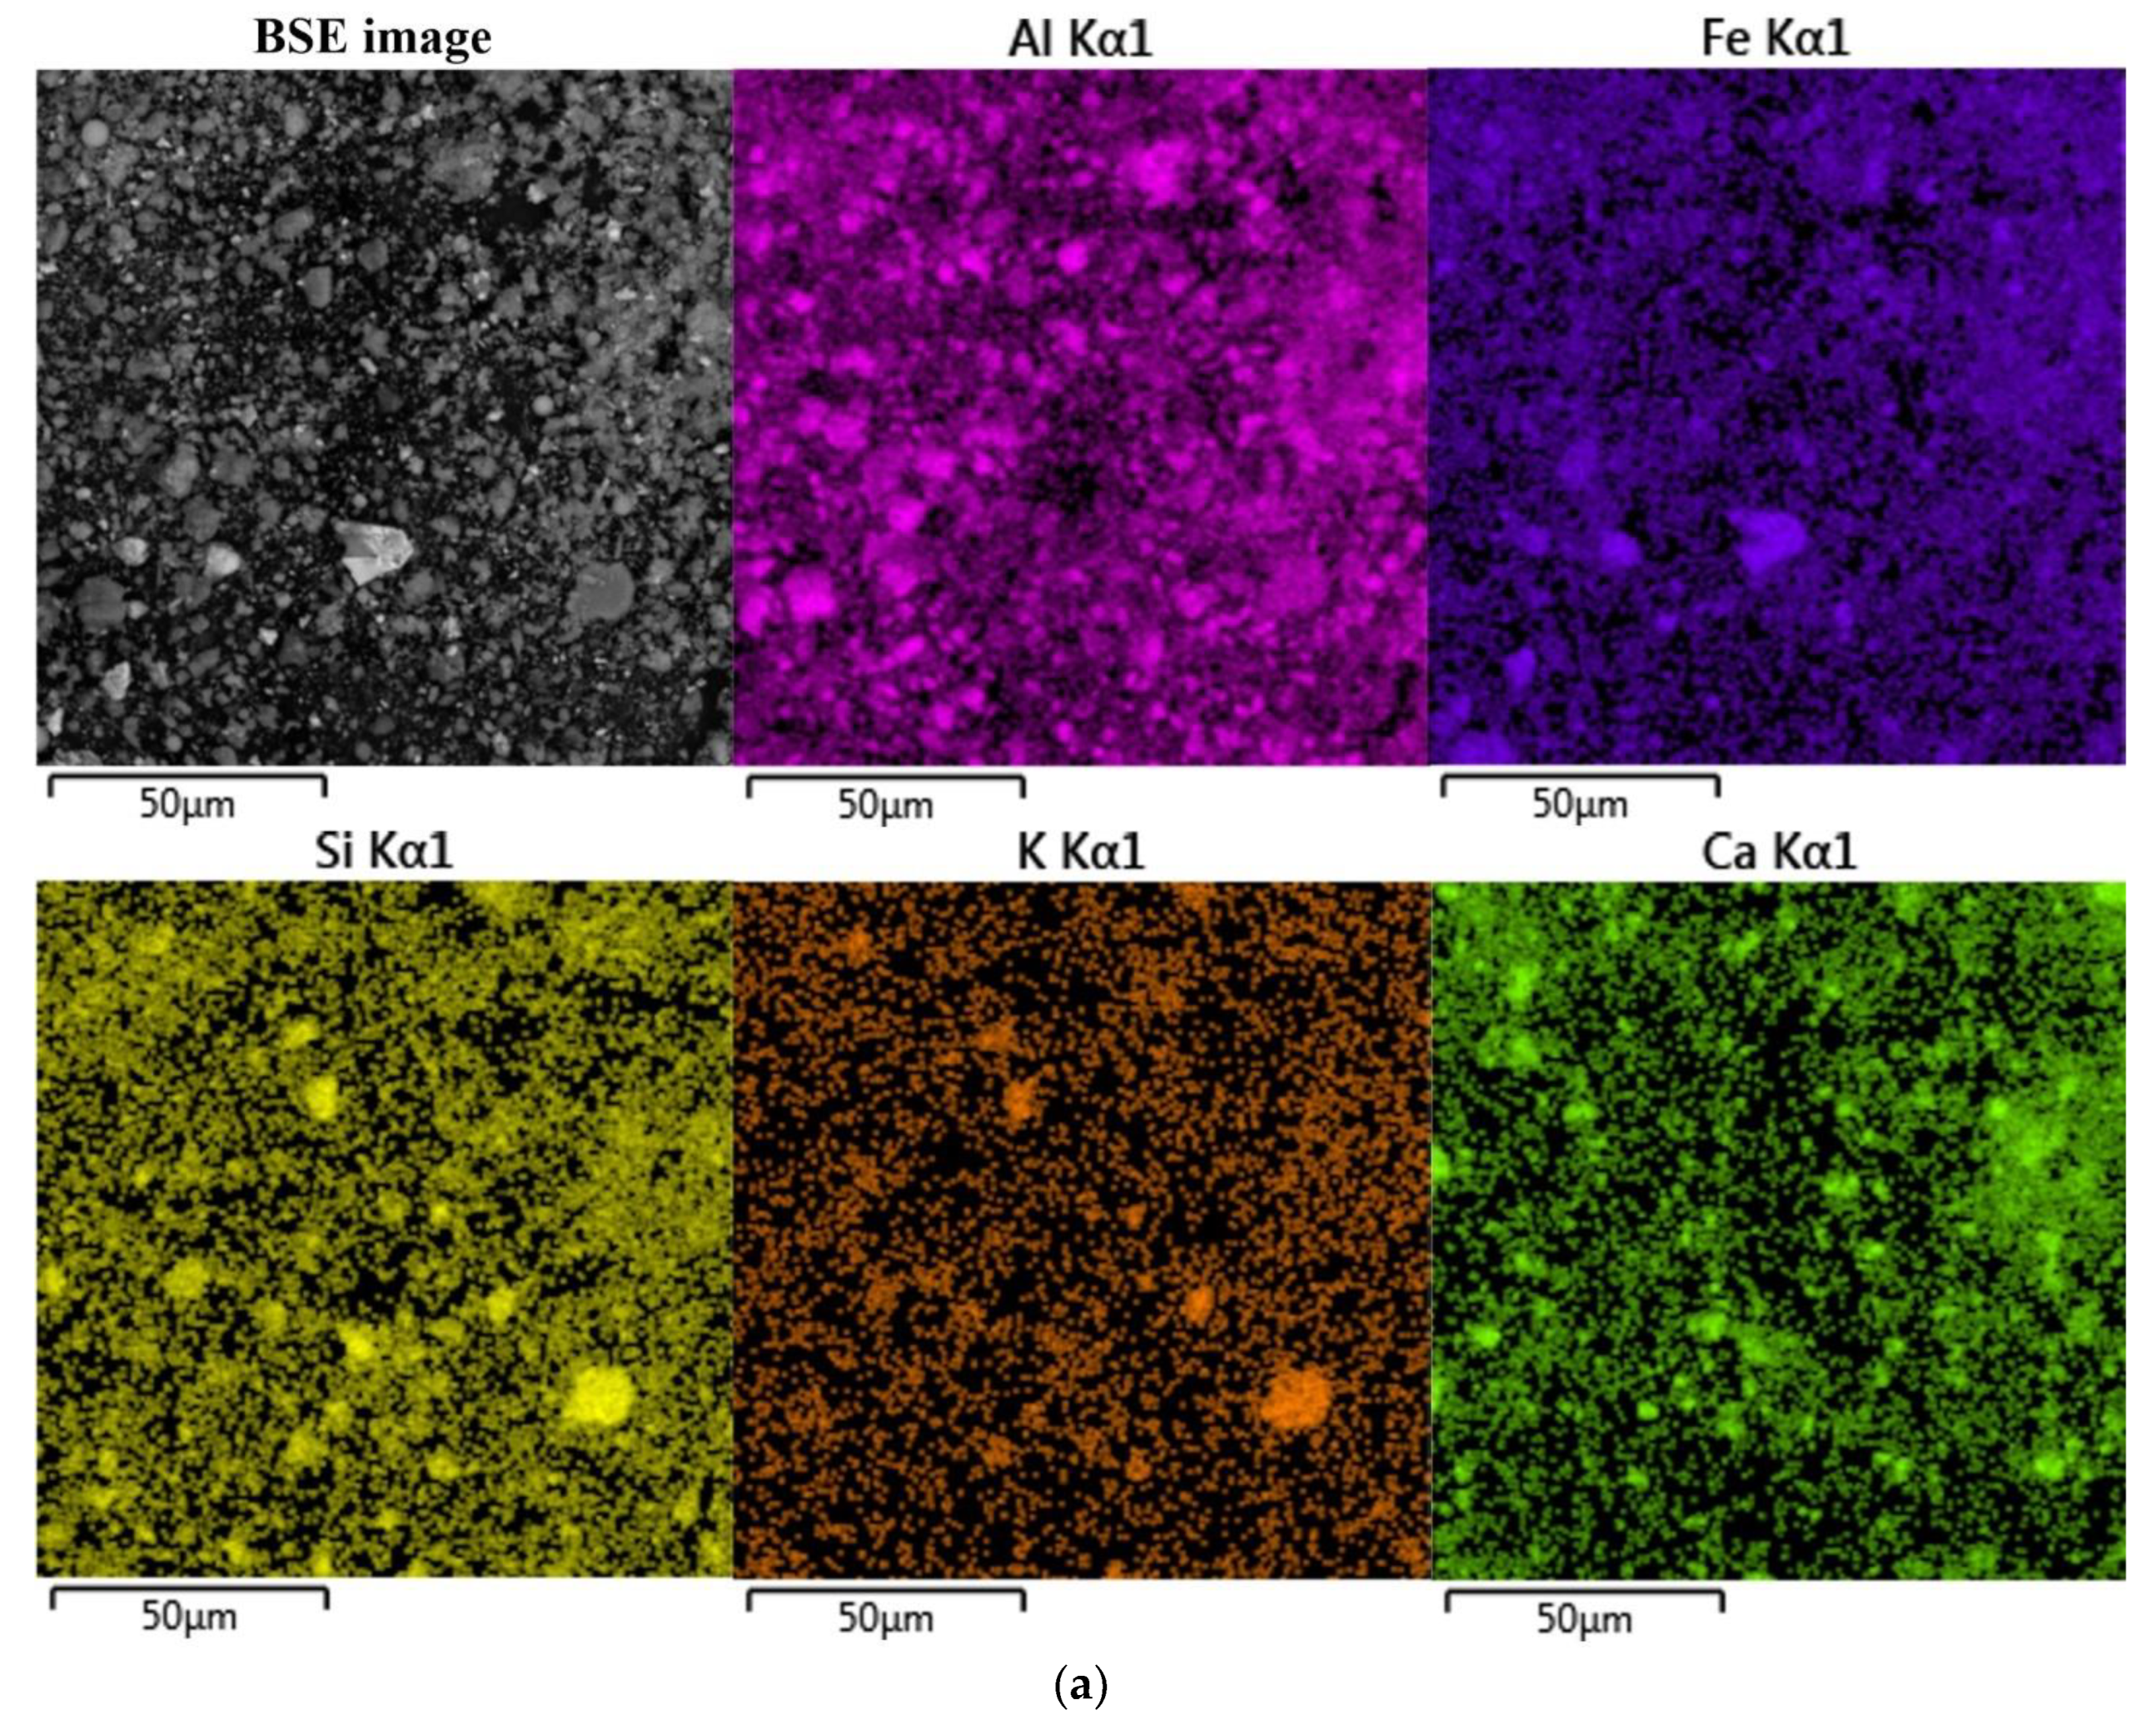
The morphology and chemical composition of the raw bauxite particles were evaluated by SEM-EDS analysis (Figure 3, Table 4). SEM-EDS images in Figure 3 show that aluminum, iron, silicon, and calcium are uniformly distributed over the surface of bauxite particles, but single particles with high content of these elements can be identified. Potassium has a close association with silica, indicating its content in aluminosilicates.
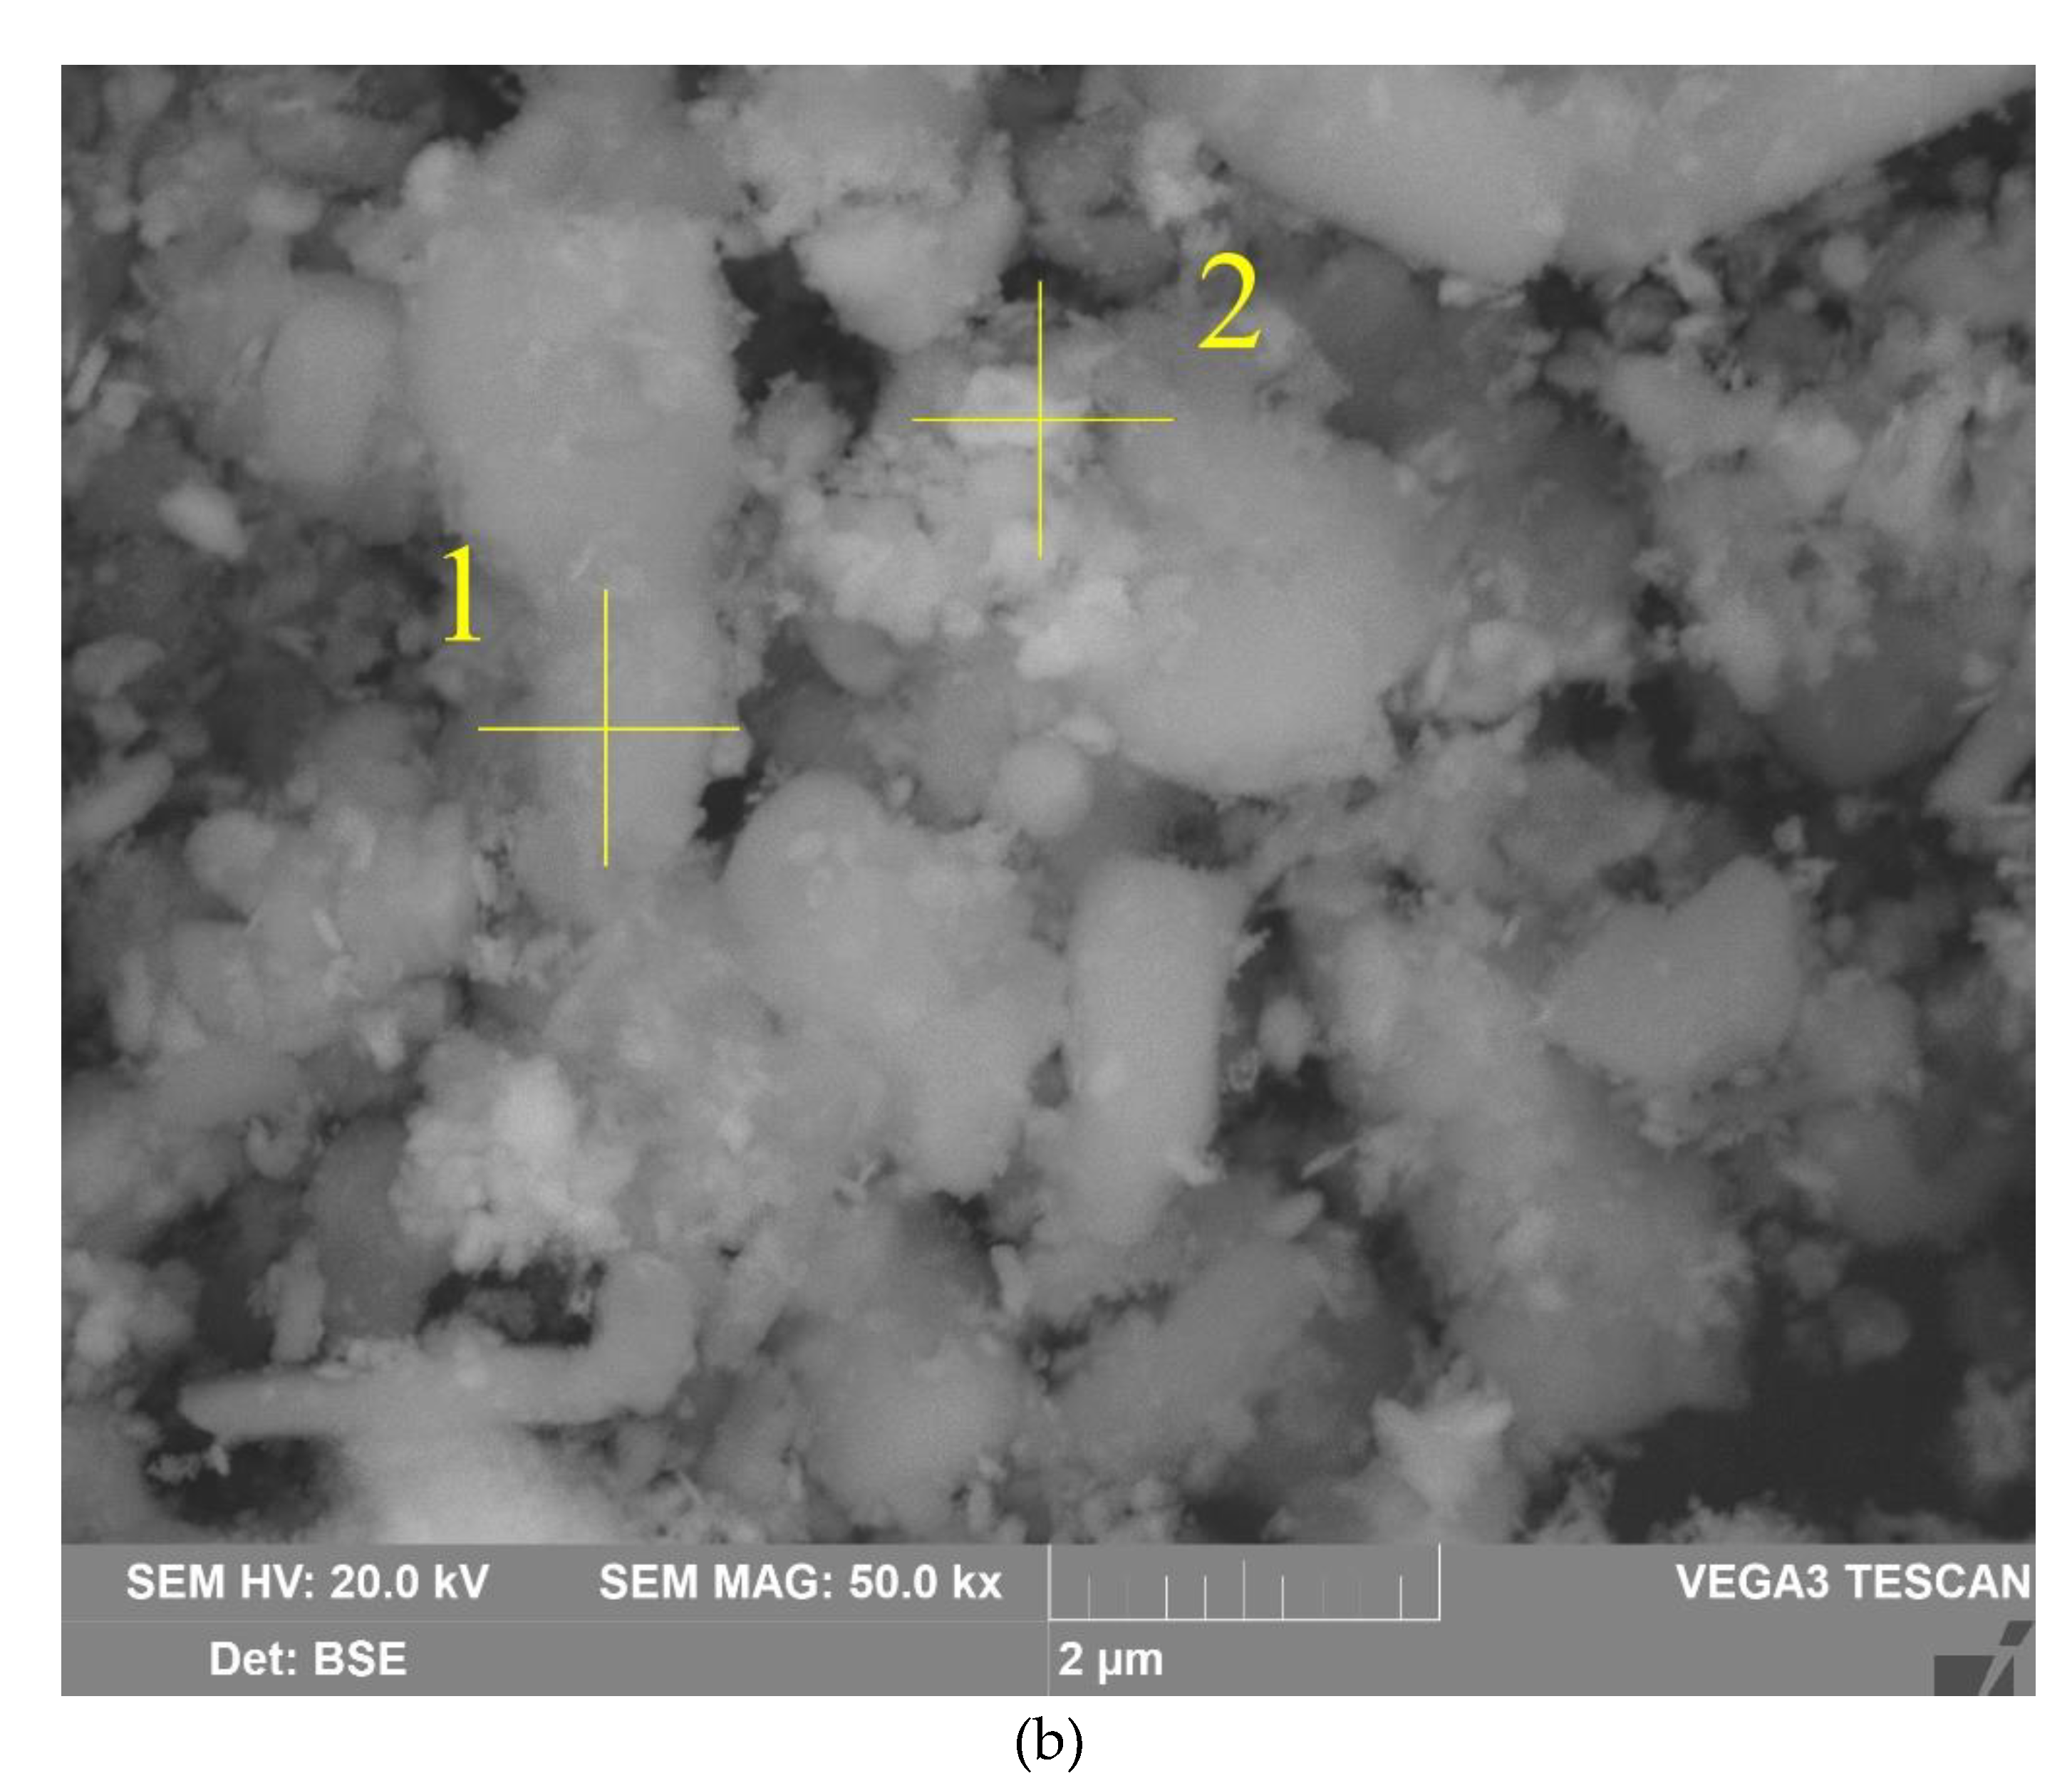
Figure 4b shows that the particles of raw bauxite have irregular shape. After grinding it is possible to observe particles of size from 100 nm to 10 μm. The results of EDS analysis of boehmite and hematite particles are shown in Table 4 There is a close relationship between them, i.e. the boehmite particles are covered with hematite particles and vice versa.

3.2. The effect of leaching parameters on bauxite desilication and transformation of iron minerals on the first stage

Modeling of the process of bauxite pretreatment with highly concentrated alkaline solutions was carried out using SANN model.
As revealed in previous study [25], the use of high alkali concentrations and the L:S ratio eliminates the formation of DSP due to silicon retention in the solution. This allows complete extraction of alumina even from such highly silica raw materials as fly ash, regardless of how much silica was contained in the feedstock. Moreover, the boiling temperature of the highly concentrated NaOH solution (more than 330 g L-1 Na2O) exceeds 120 °C. This makes leaching at atmospheric pressure possible at temperatures above 100 °C. The matrix of experiments created with the Statistica 13 software package and the results of Al and Si extraction from the different bauxite fractions and the Fe and Na2O content in the solid residue are shown in Table 5.
As was shown [31,32], the use of machine learning produces more accurate models than the use of mathematical methods. The closest to the experimental data SANN model (R2 = 0,96) obtained for alumina extraction was the multilayer perceptron (MLP) 6.10.4, where 6 is the number of input parameters, 10 is the number of hidden layers and 4 is the number of output layers.
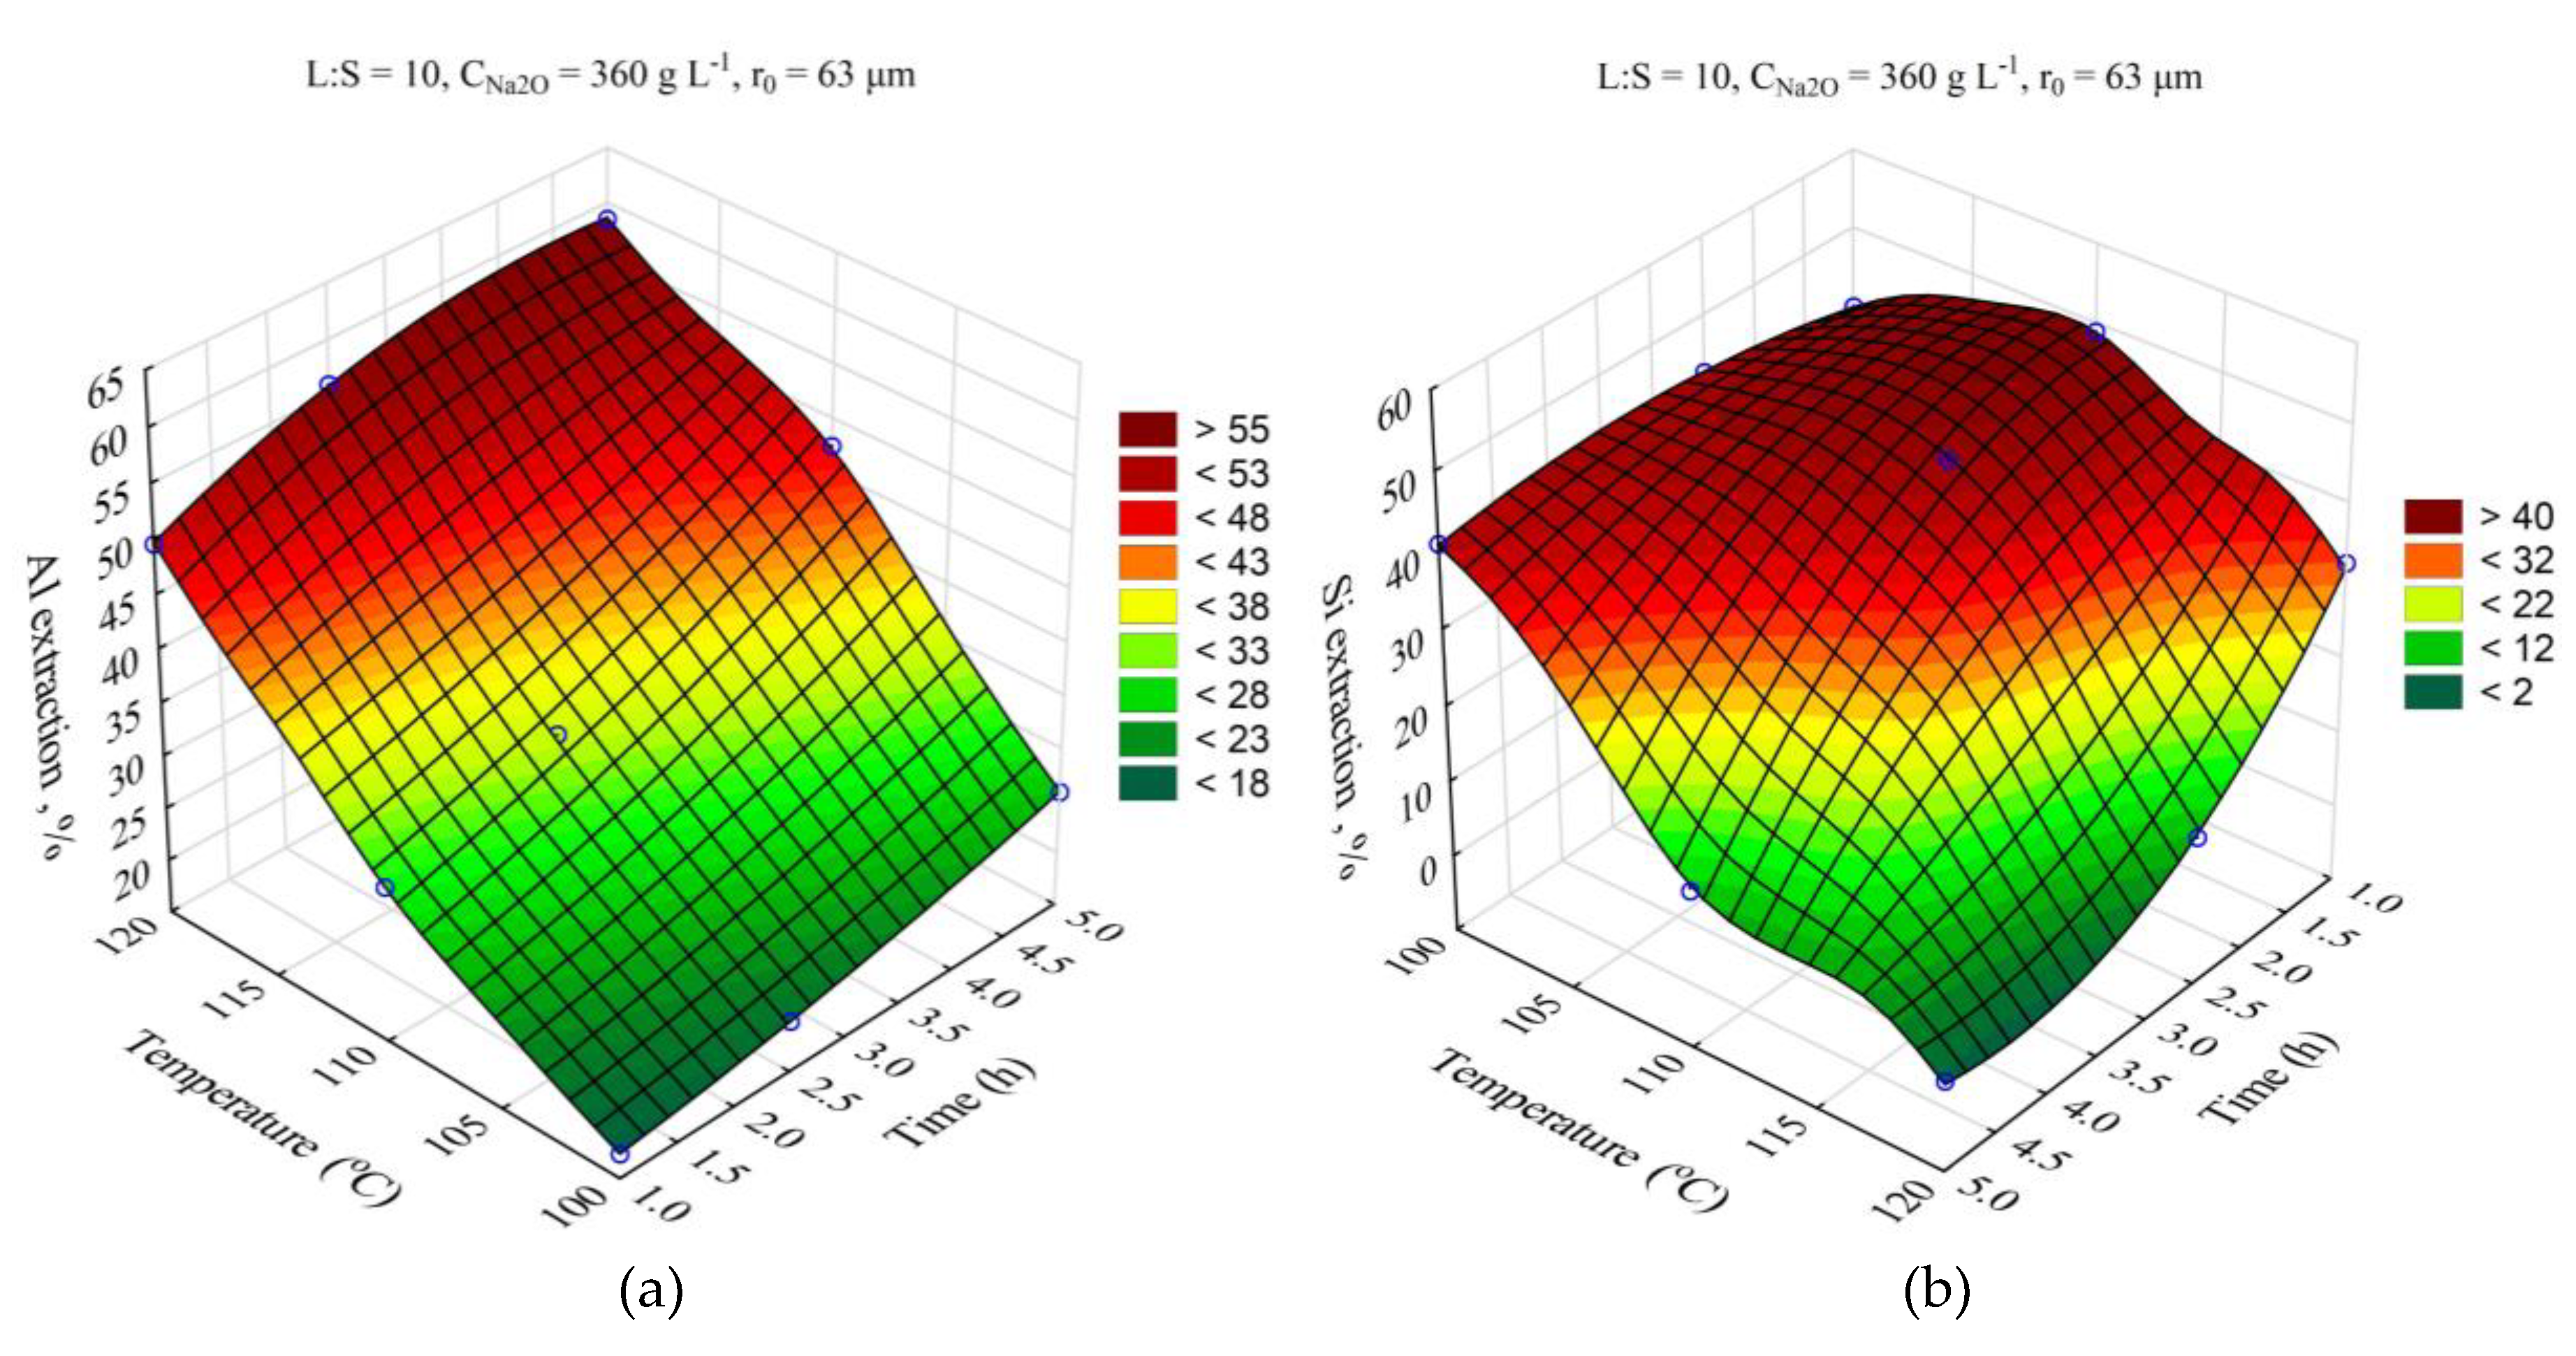
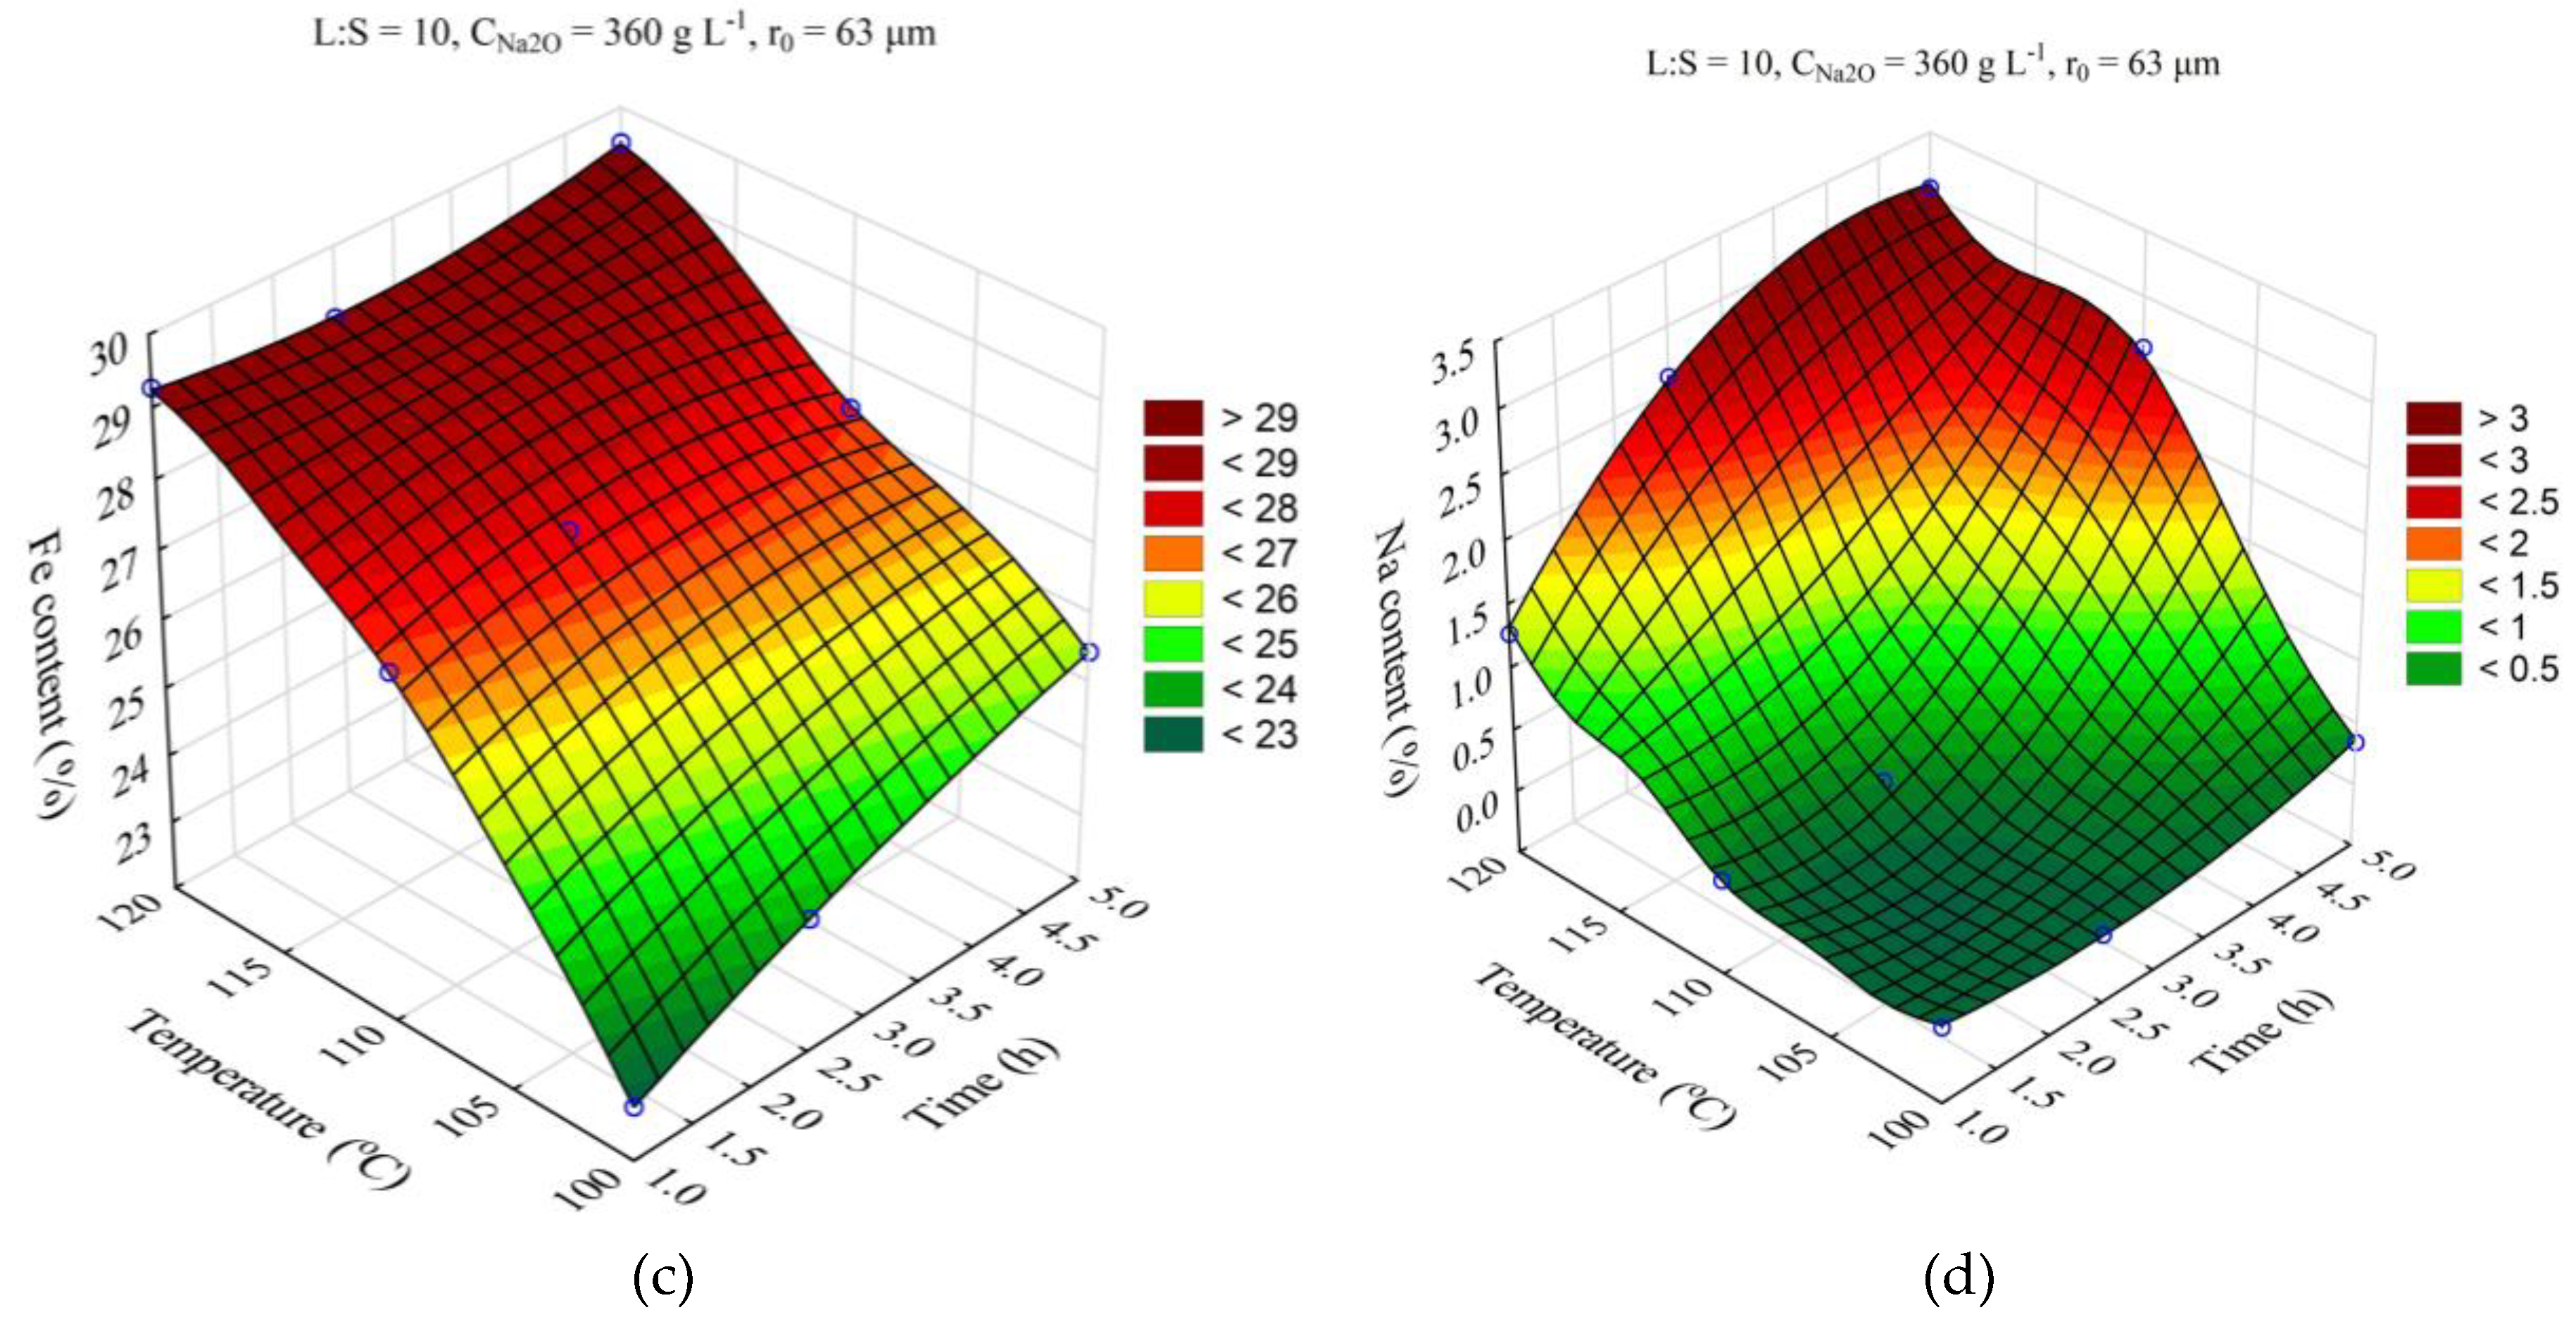
The response surfaces predicted by the SANN model for the effect of time and temperature on the degree of Al and Si extraction and the Fe and Na content in the solid residue are shown in Figure 4. The leaching time (τ, min) was varied from 1 to 5 h, the temperature (T, °C) from 100 to 120 °C. L:S ratio, Na2O concentration (CNa2O, g L–1), initial Al2O3 concentration (CAl2O3, g L–1), and initial mean particle size (r0, μm) were fixed at L:S = 10, r0 = 63 μm, CNa2O = 360 g L–1, CAl2O3 = 0 g L–1.
Obviously, increasing the temperature and time allows to increase the Al and Si extraction up to 60 and 40-50 %, respectively. However, the effect of time on the Fe content in the solid residue was low, especially at high temperature, this may be due to the fact that the desilication was completed in the first hour. Then, according to Figure 4d, DSP begins to precipitate, which leads to an increase in the Na2O content in the precipitate up to 3.2 % and, accordingly, it leads to decrease in the Fe content.
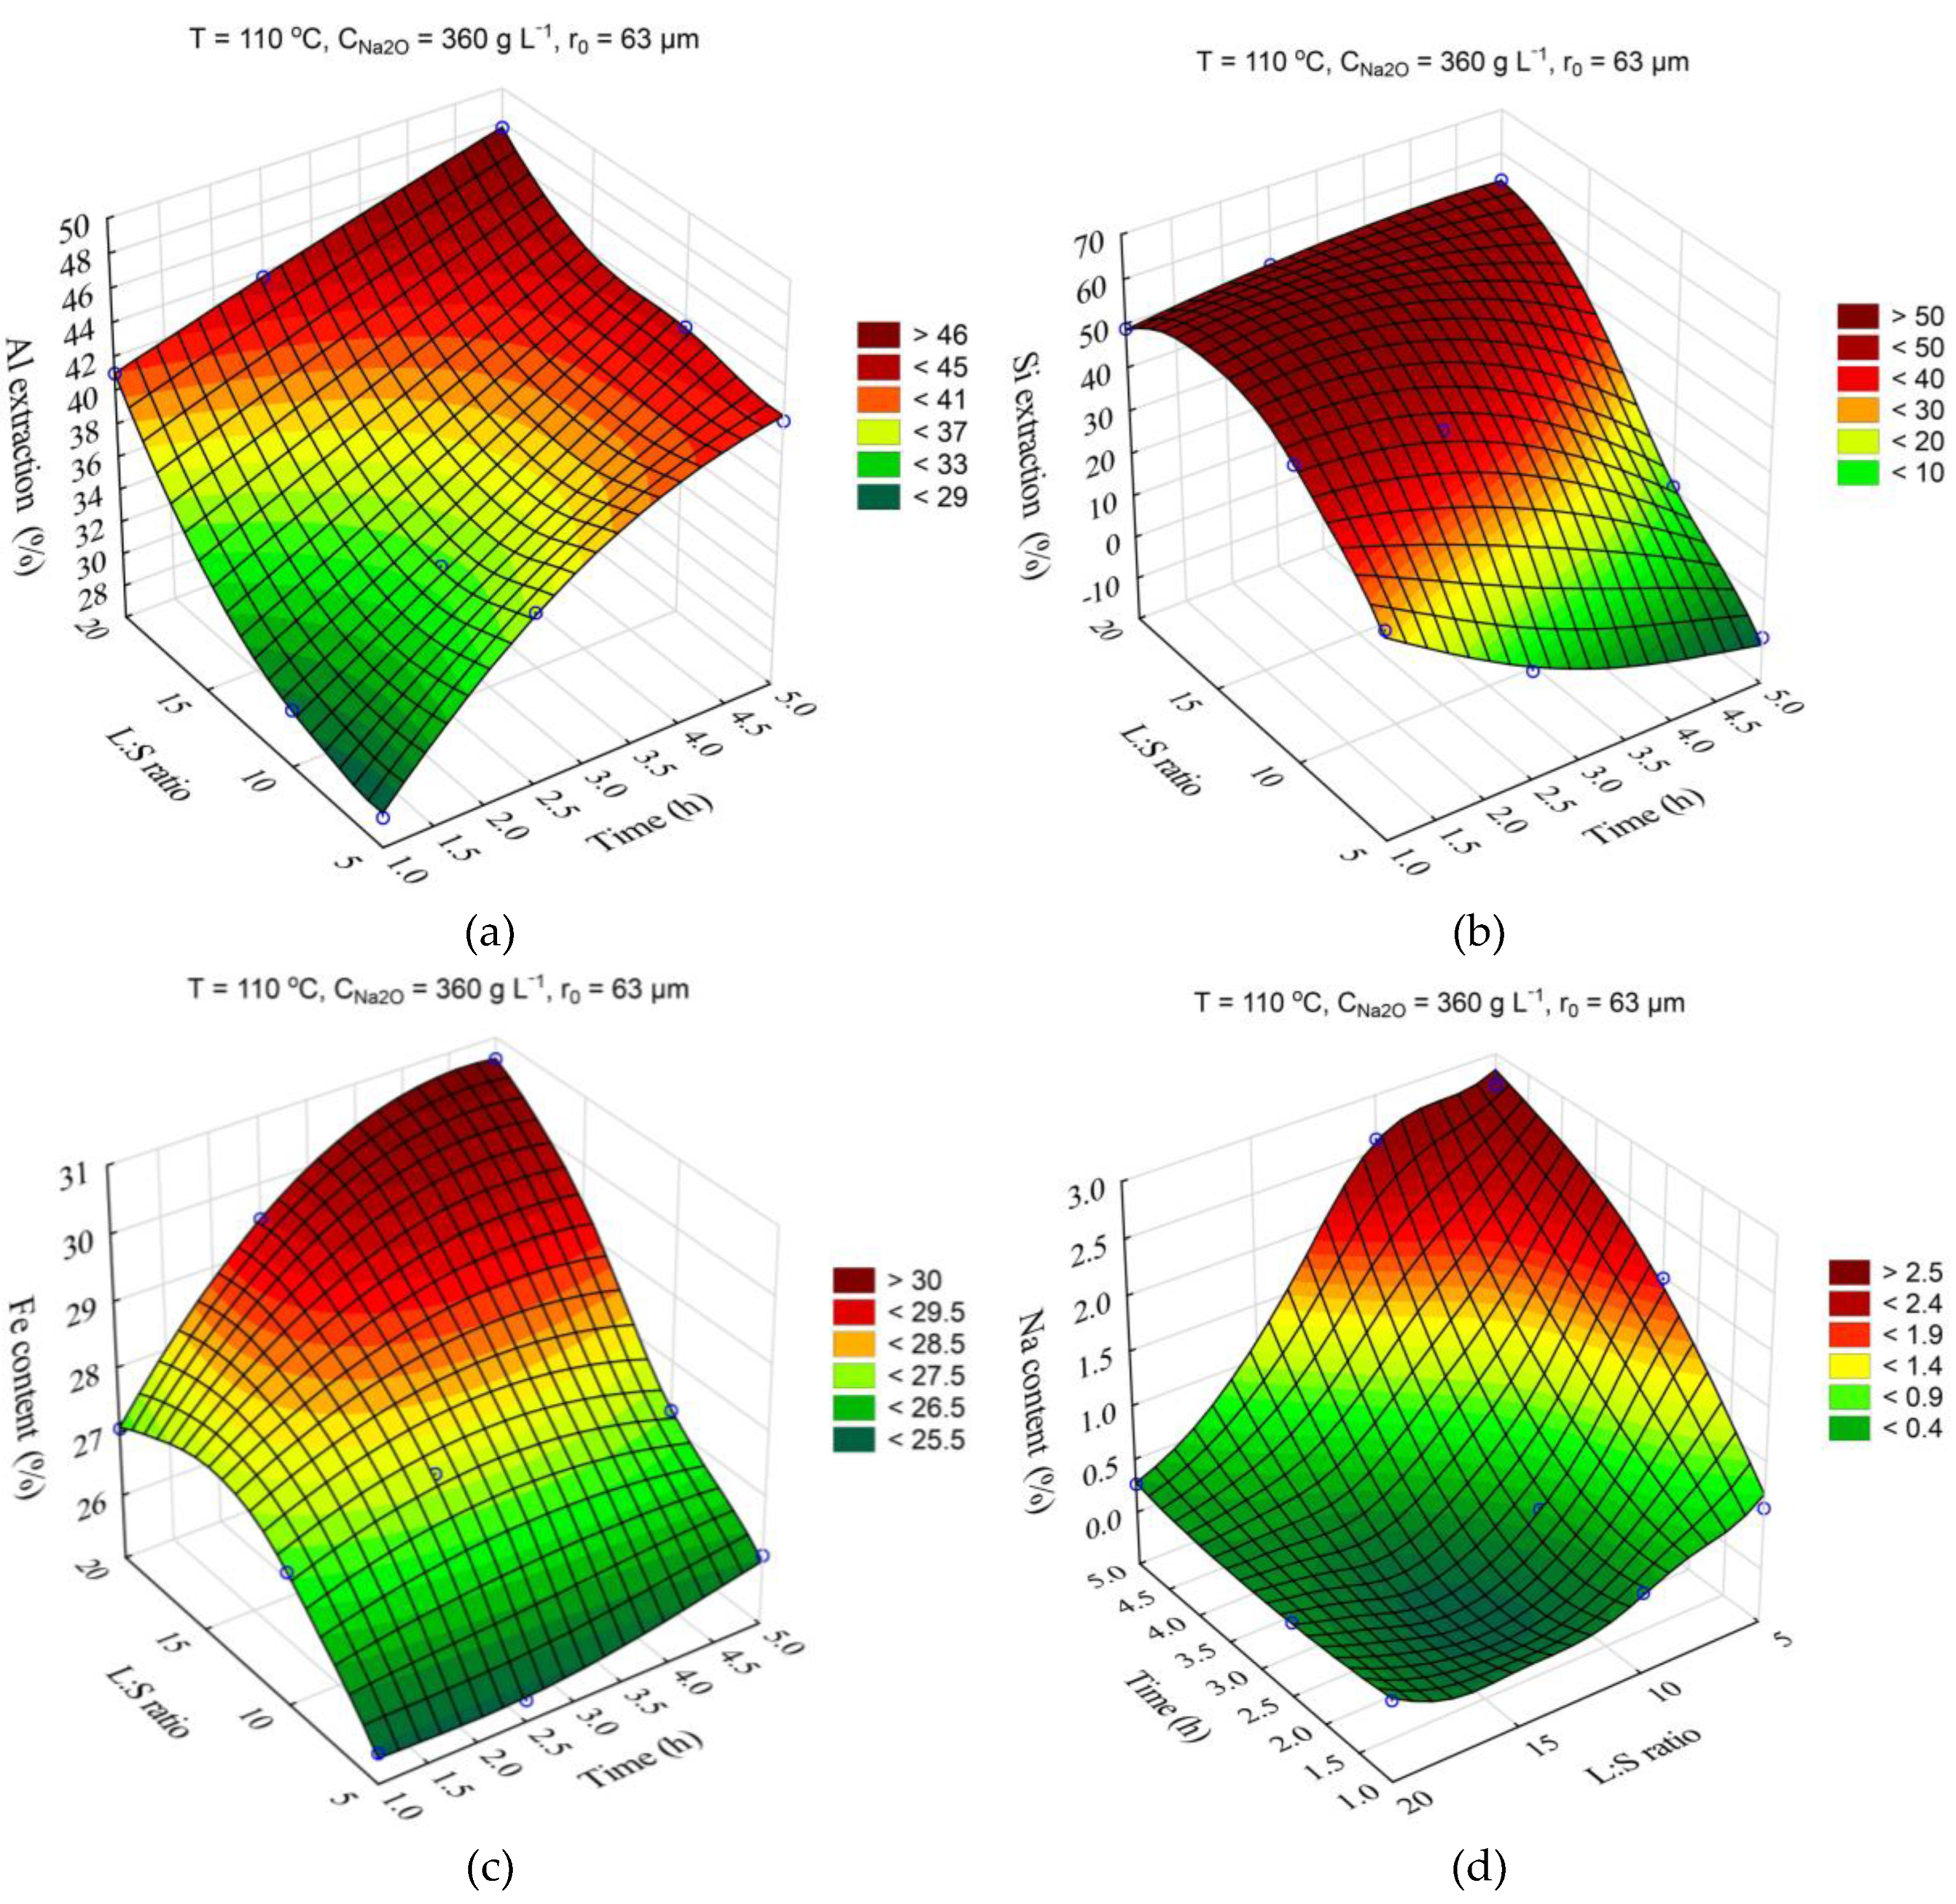
The response surfaces predicted by the SANN model for the effect of the time and the L:S ratio on the Al and Si extraction, as well as the Fe and Na content in the solid residue, are shown in Figure 5. The leaching duration (τ, h) was varied from 1 to 5 h, the ratio L:S from 5 to 20. Other parameters were fixed at T = 110 °C, r0 = 63 µm, CNa2O = 360 g L–1, CAl2O3 = 0 g L–1.
The increase of the L:S ratio from 5 to 20 allows to increase the solutional extraction from 28 to 41 % after 1 h of leaching (Figure 5a), after 5 h of leaching the increase of the L:S ration from 5 to 20 results in the Al extraction increase only by 6 %. At the same time, the increase of L:S allows to significantly increase the Si extraction (Figure 5b), which is associated with its retention in the solution, as evidenced by the Na content in the solid residue, which increases to 3 % after 5 h at L:S = 5. The high Al and Si extraction at L:S above 10 also leads to an increased Fe content in the solid residue since Fe is not leached out during the alkaline treatment and concentrates in the residue.
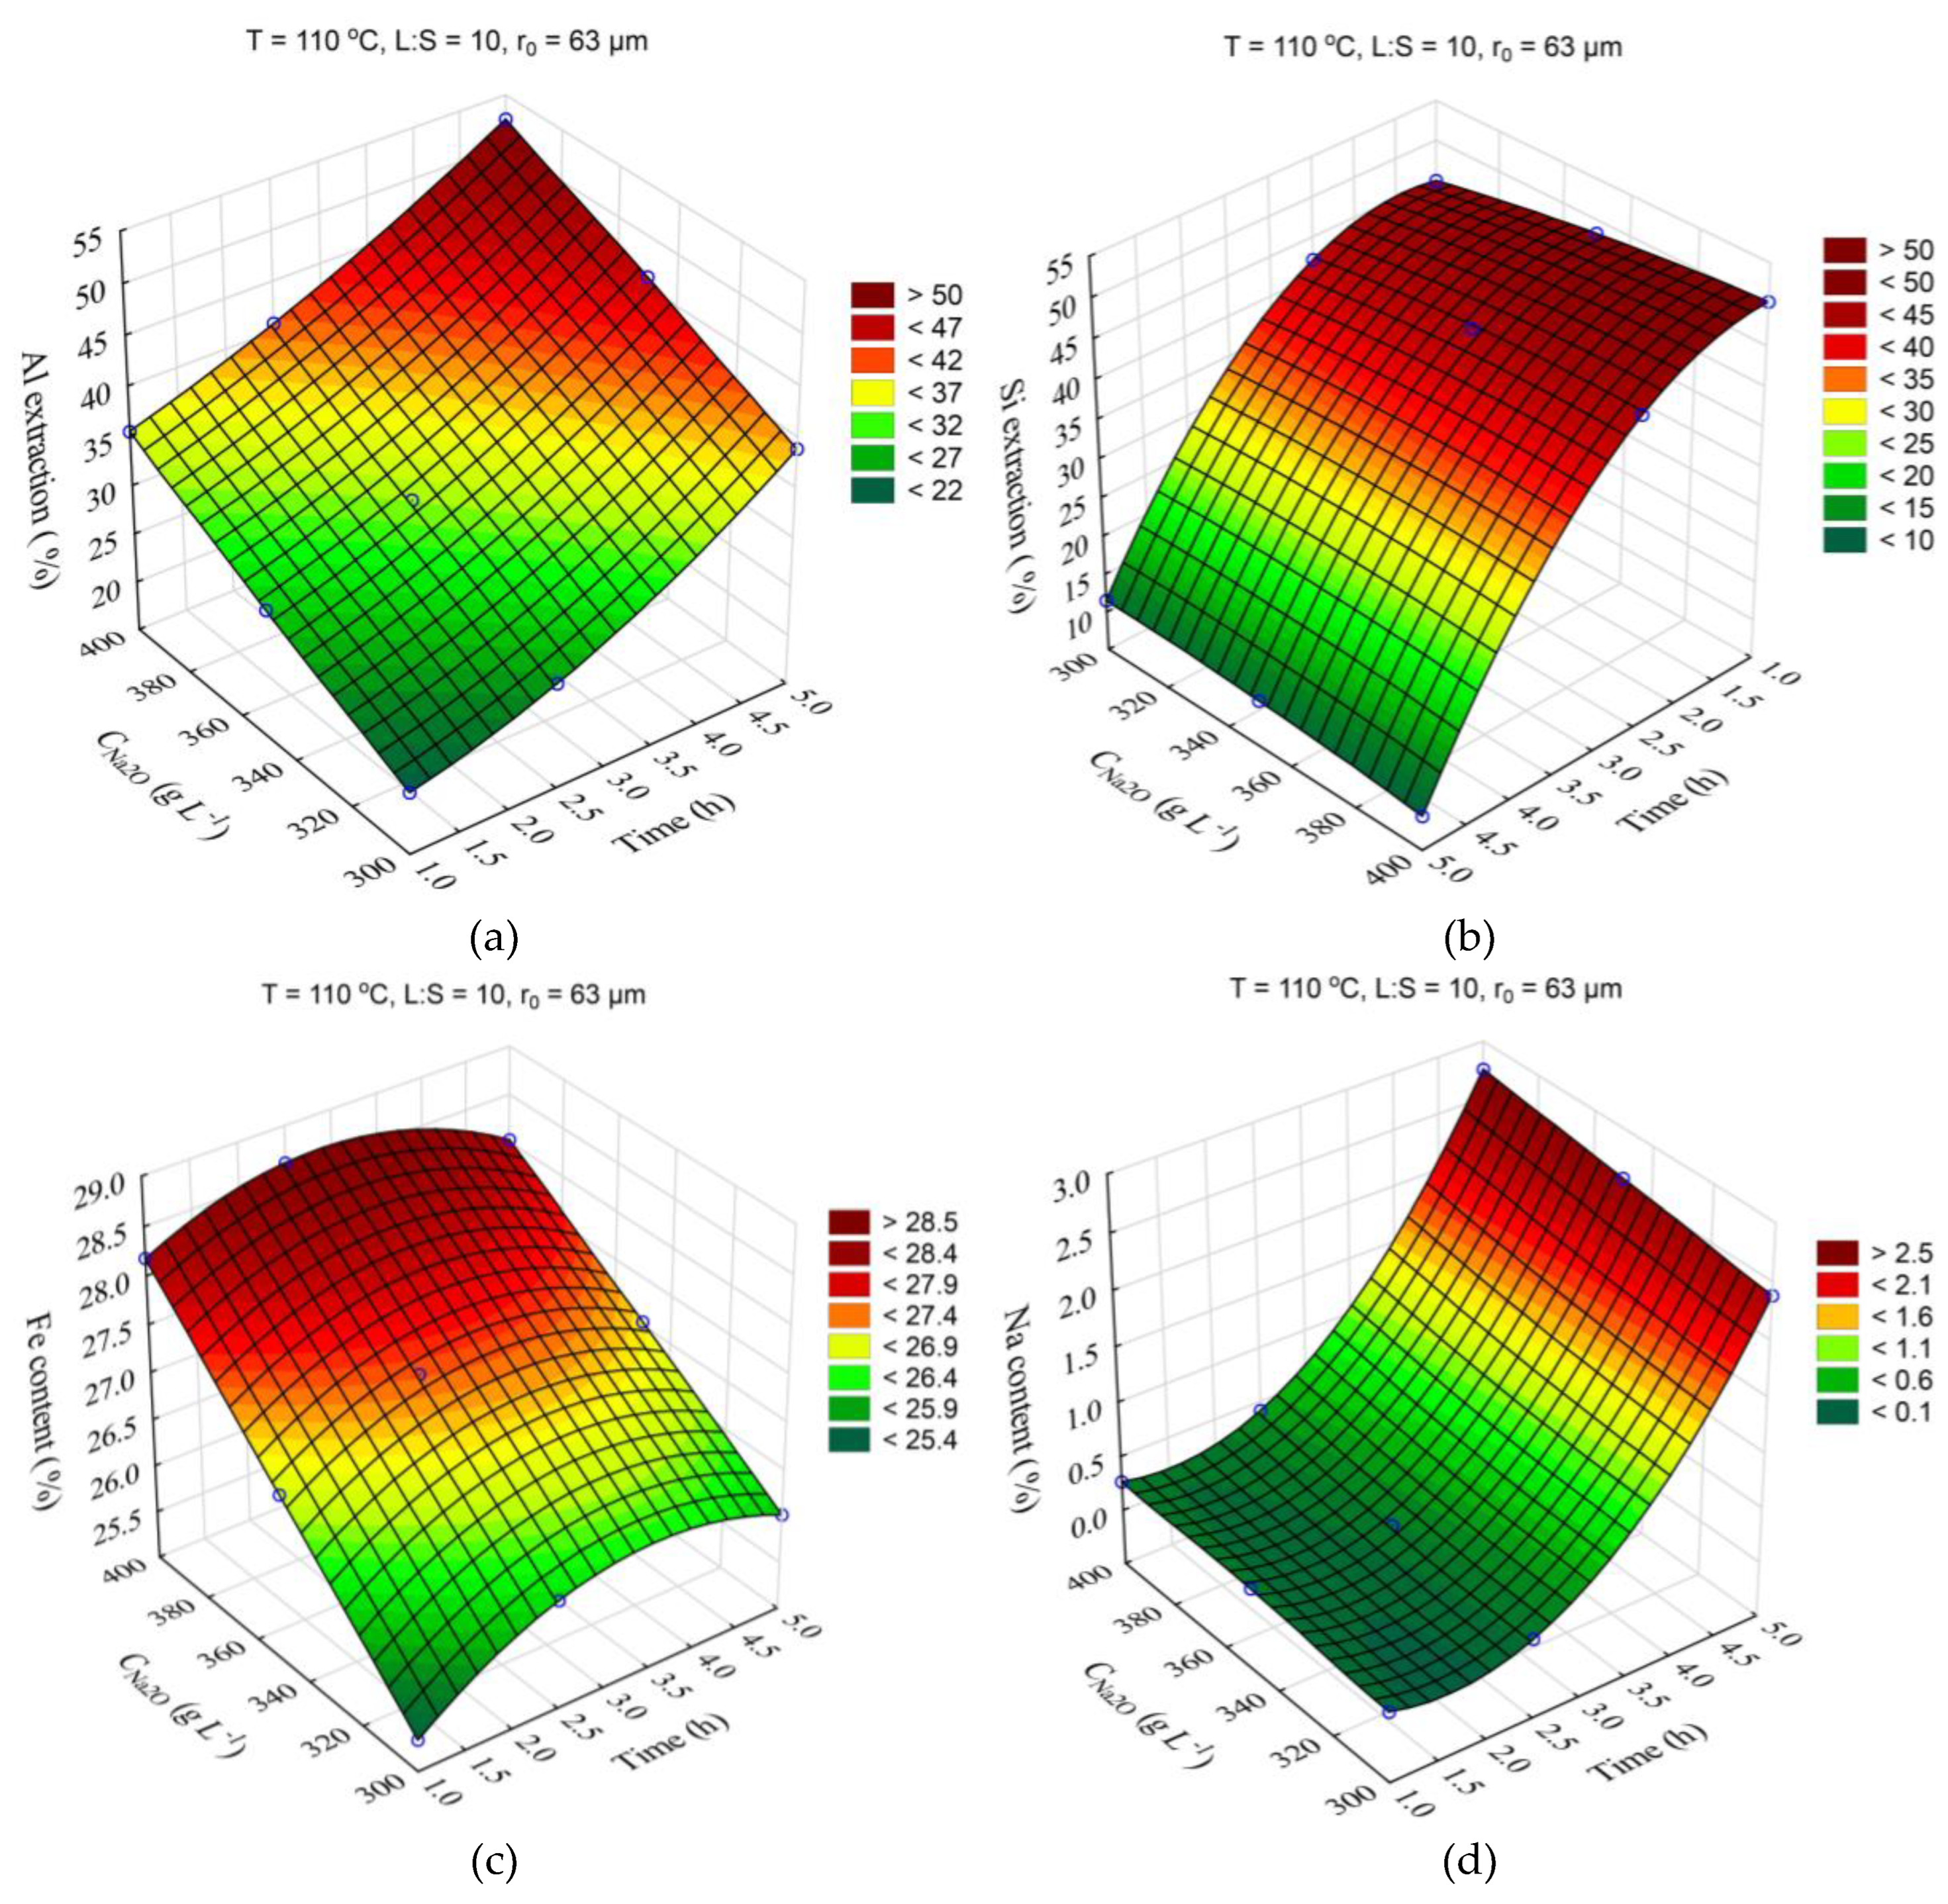
The response surfaces predicted by the SANN model for the effects of time and Na2O concentration on the Al and Si extraction and the Fe and Na content in the solid residue are shown in Figure 6. The leaching time (τ, min) was varied from 1 to 5 h, the Na2O concentration – from 330 to 400 g L–1. The other parameters were fixed at T = 110 °C, r0 = 63 µm, L:S = 10, CAl2O3 = 0 g L–1.
The data shown in Figure 6a show that solution composition has a significant impact on the Al extraction, which seems to be associated with an increase in caustic modulus and as a consequence with the incresed equilibrium concentration of Al in solution. Thus, an increase in Na2O concentration from 330 to 400 g L–1 after 5 h of leaching leads to an increase in Al extraction from 40 to 54%. The effect of solution concentration on the Si extraction and Na2O content in the solid residue was insignificant (Figure 6b,d). Increased Al extraction at high concentration reduces the yield of the solid residue and, accordingly, increases the iron content. As the leaching duration increases from 3 h to 5 h, DSP begins to form, resulting in an increased yield and higher Na2О content in the solid residue (Figure 6c,d).
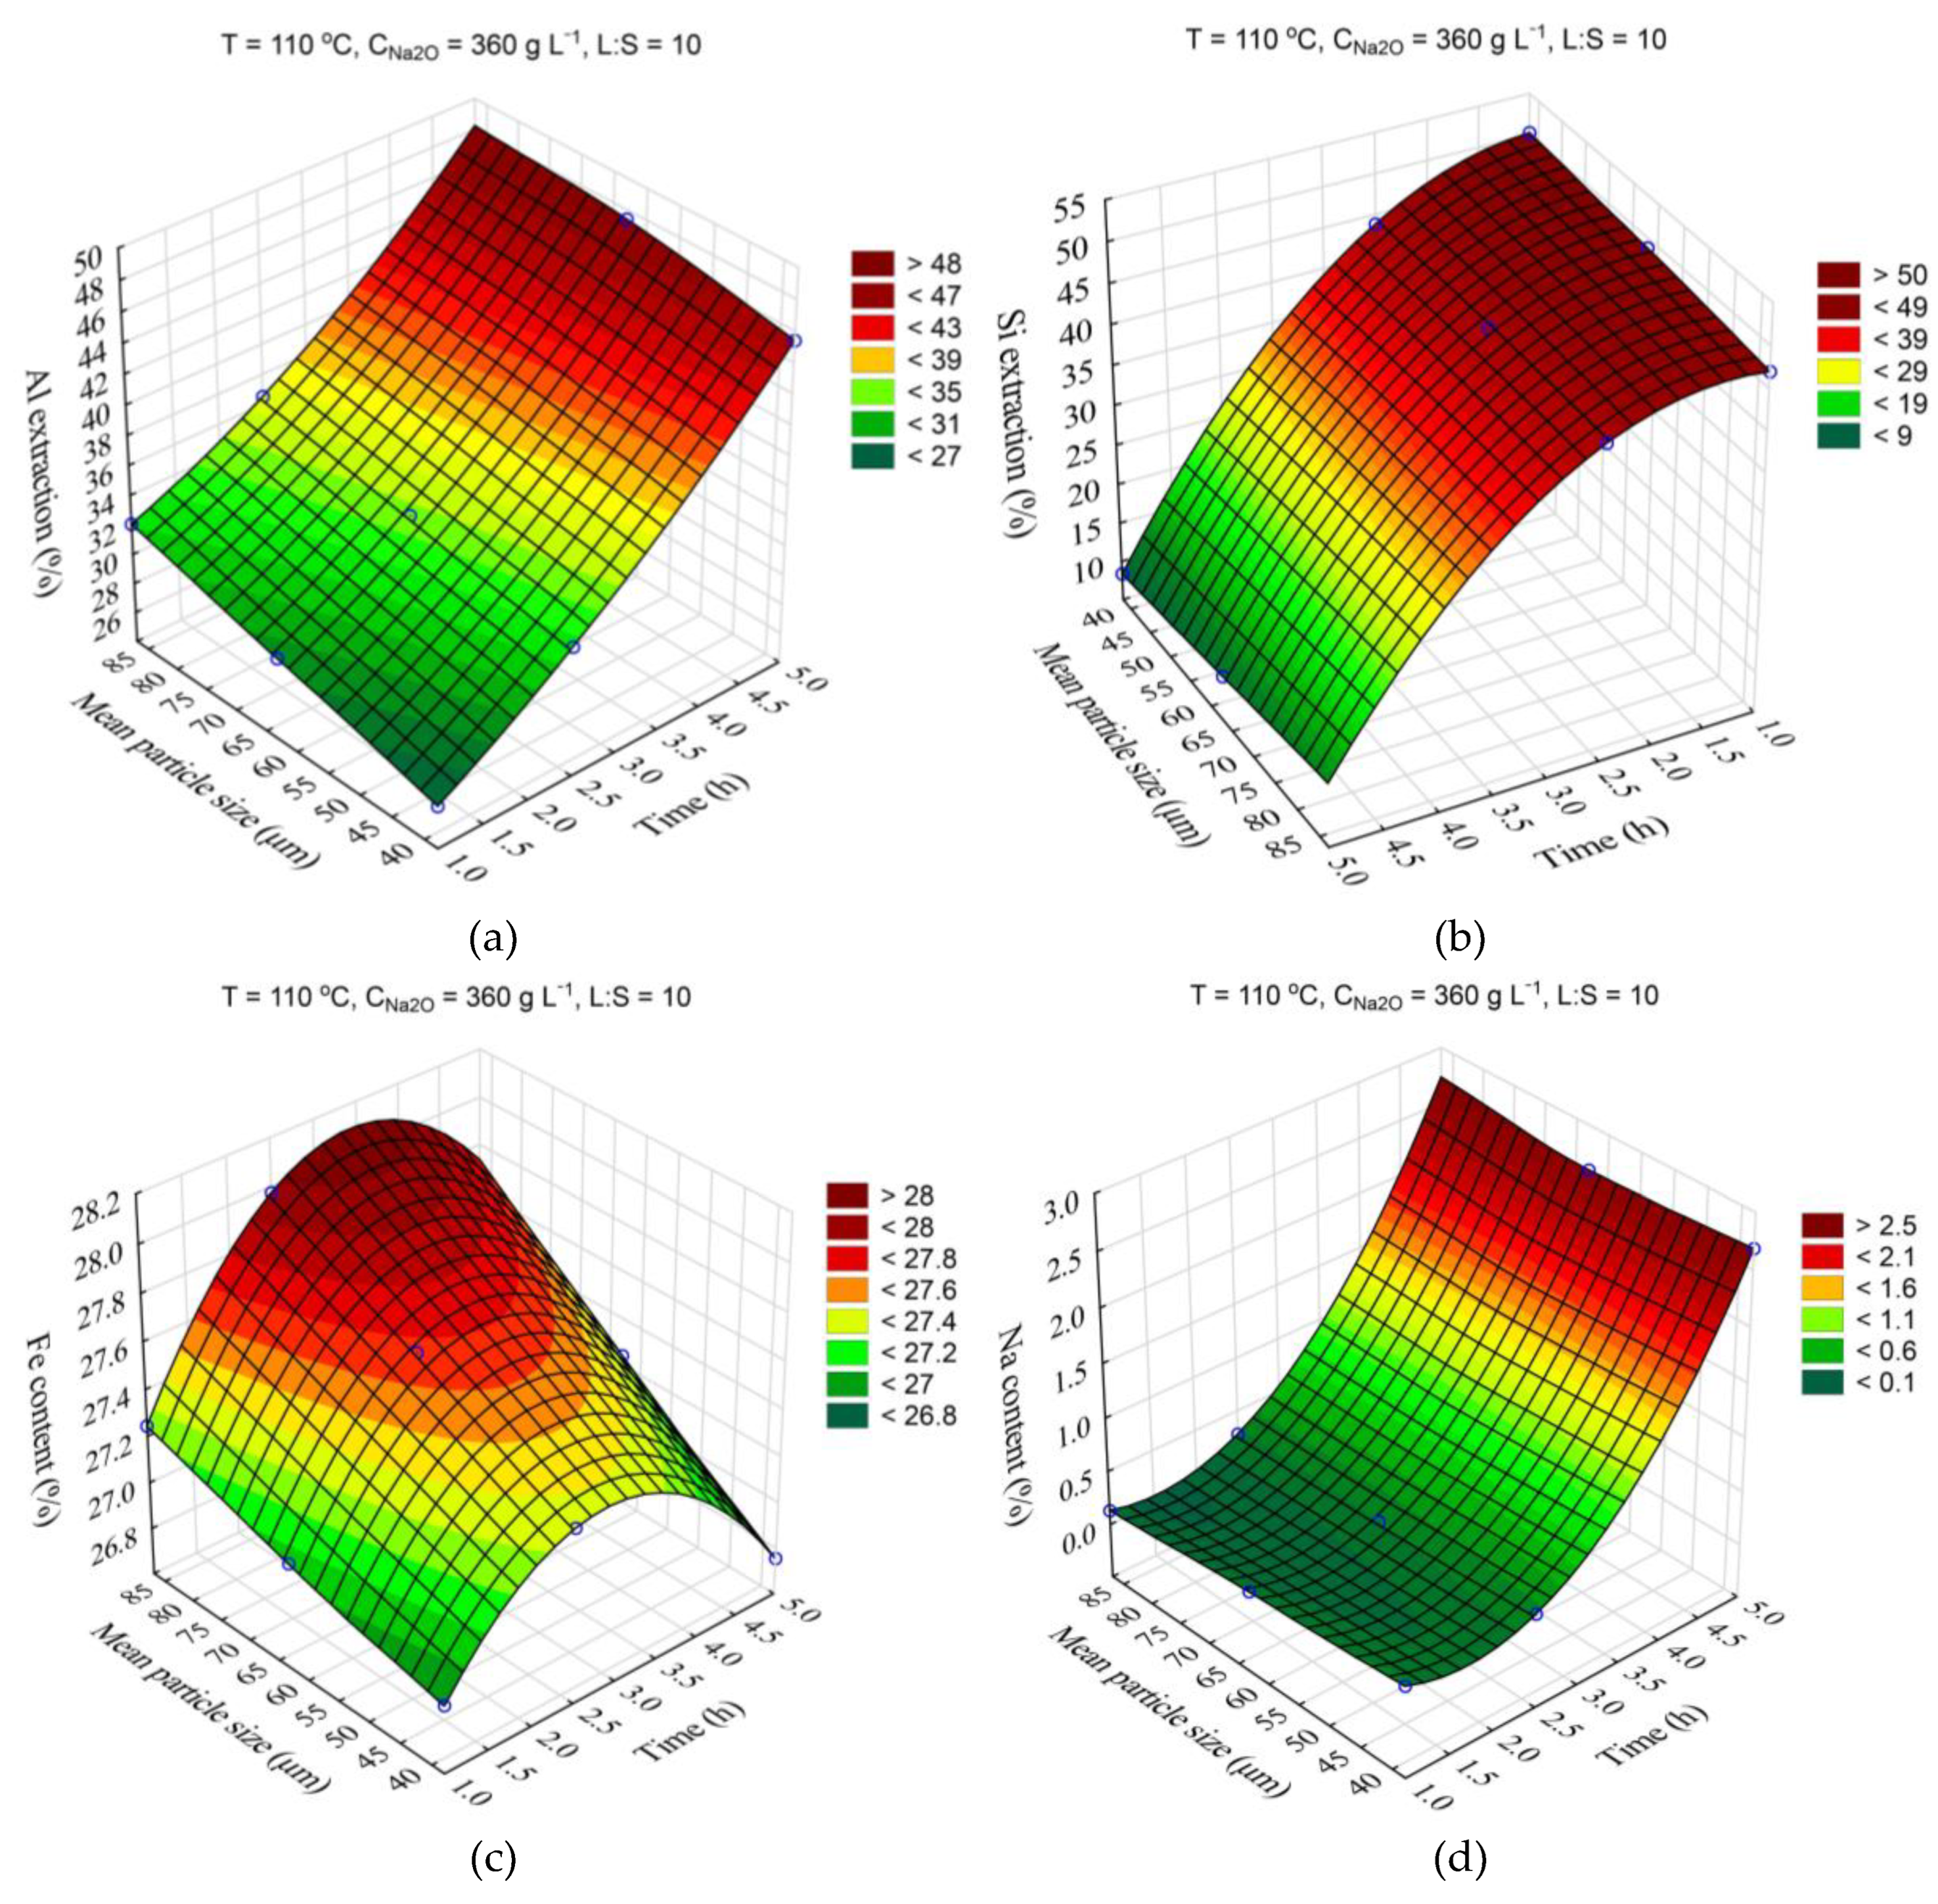
The response surfaces predicted by the SANN model for the effects of time and initial mean particle size (r0) on the Al and Si extraction and the Fe and Na content in the solid residue are shown in Figure 7. The leaching time was varied from 1 to 5 h, the mean particle size from 38 to 78 μm. Other parameters were fixed at T = 110 °C, CNa2O = 360 g L–1, L:S = 10, CAl2O3 = 0 g L–1.
Decrease in the average particle size from 78 to 38 μm resulted in only a slight (2–4 %) increase of Al and Si extraction (Figure 7a,b). The Fe content also slightly increases with the decrese of the r0 (Figure 8c), which is associated with a higher Al and Si extraction. After 2.5 h of leaching the Fe content begins to decrease, which is connected with the beginning of DSP formation (Figure 7d).
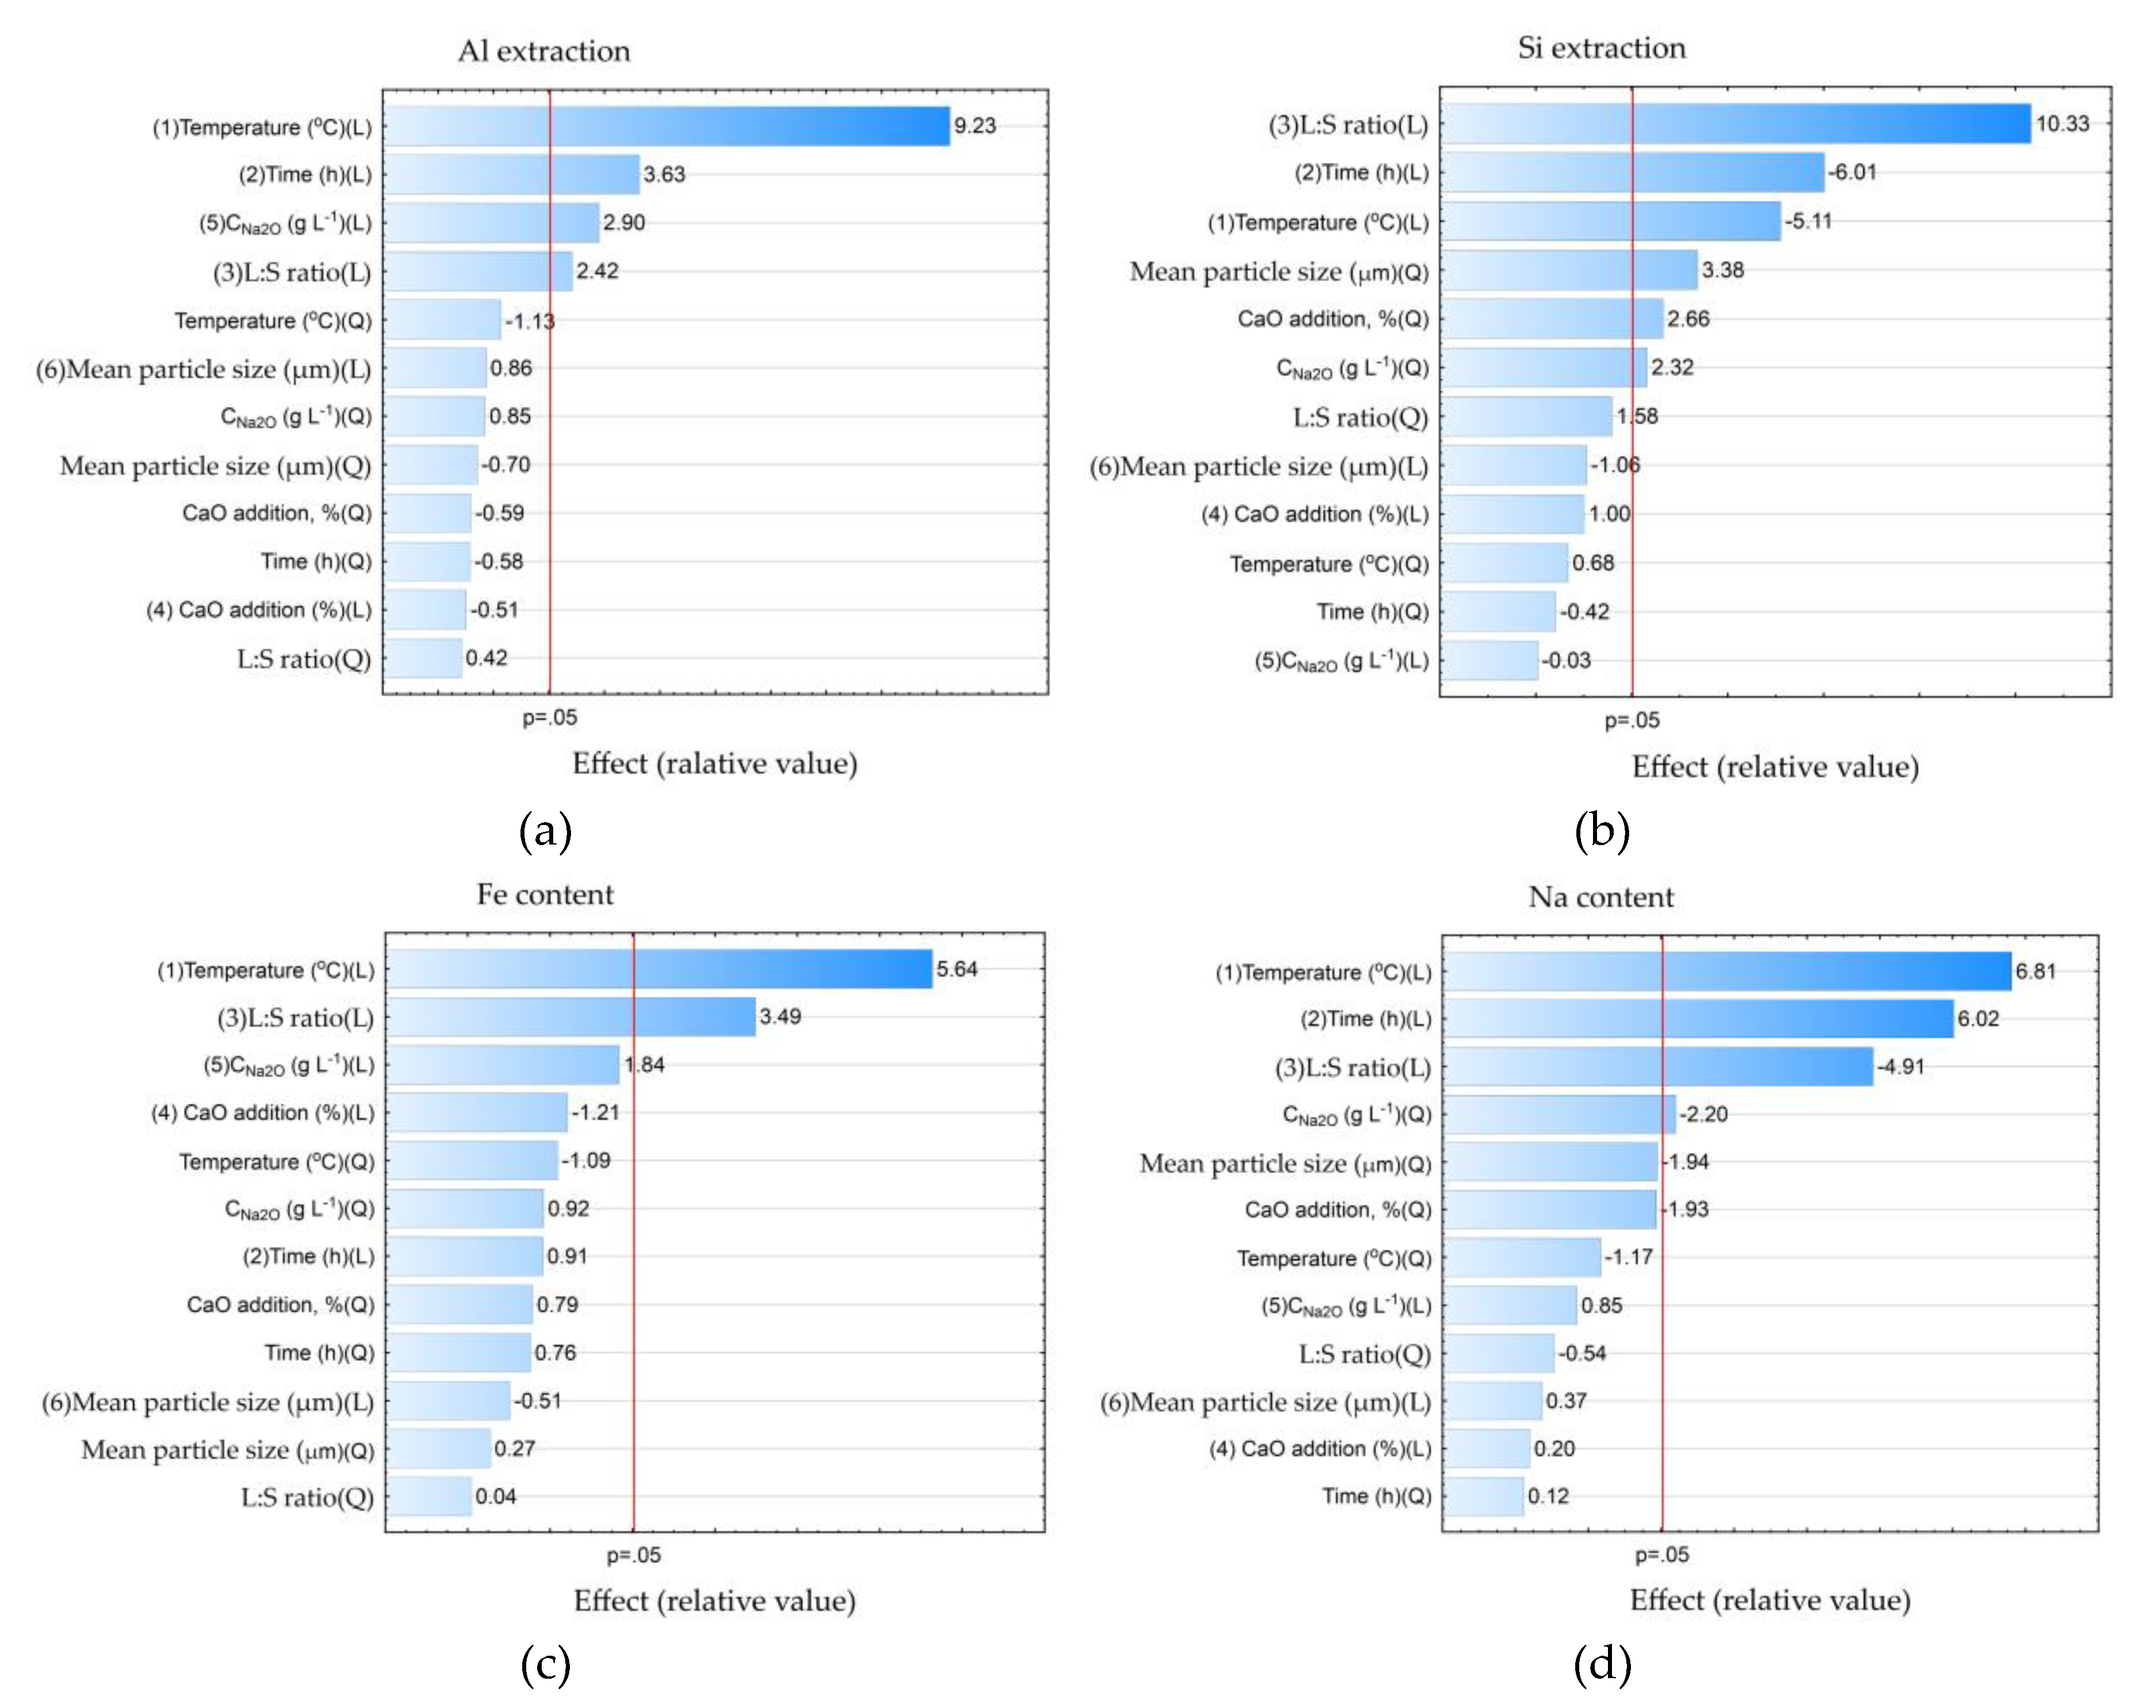
The data presented in Table 4 were further processed in the Statistica using the ANOVA (Analysis of variance) method to study the statistical significance of certain process parameters. Pareto diagrams for each variable were constructed based on the results of ANOVA (Figure 8).
According to the results shown in Figure 8 with 0.95 confidence level (or significance level of 0.05), the temperature, time, concentration and L:S ratio were statistically significant for Al and Si extraction: L:S ratio, time (negative effect), temperature (negative effect), average particle size (Q – quadratic dependence); for Na in solid residue, temperature and duration were significant, while L:S ratio was significant for Na reduction in solid residue. Thus, if the task of the first stage is a selective Si extraction with minimization of Al extraction, it is necessary to take the minimum values of temperature and time and the maximum value L:S. The other parameters are of little importance for Al and Si extraction. Accordingly, the recommended parameters can be as follows: T = 100 °C, τ = 1 h and L:S = 20. At these parameters it is possible to extract up to 60 % of Si, the Al extraction can be as low as 20–24 %.
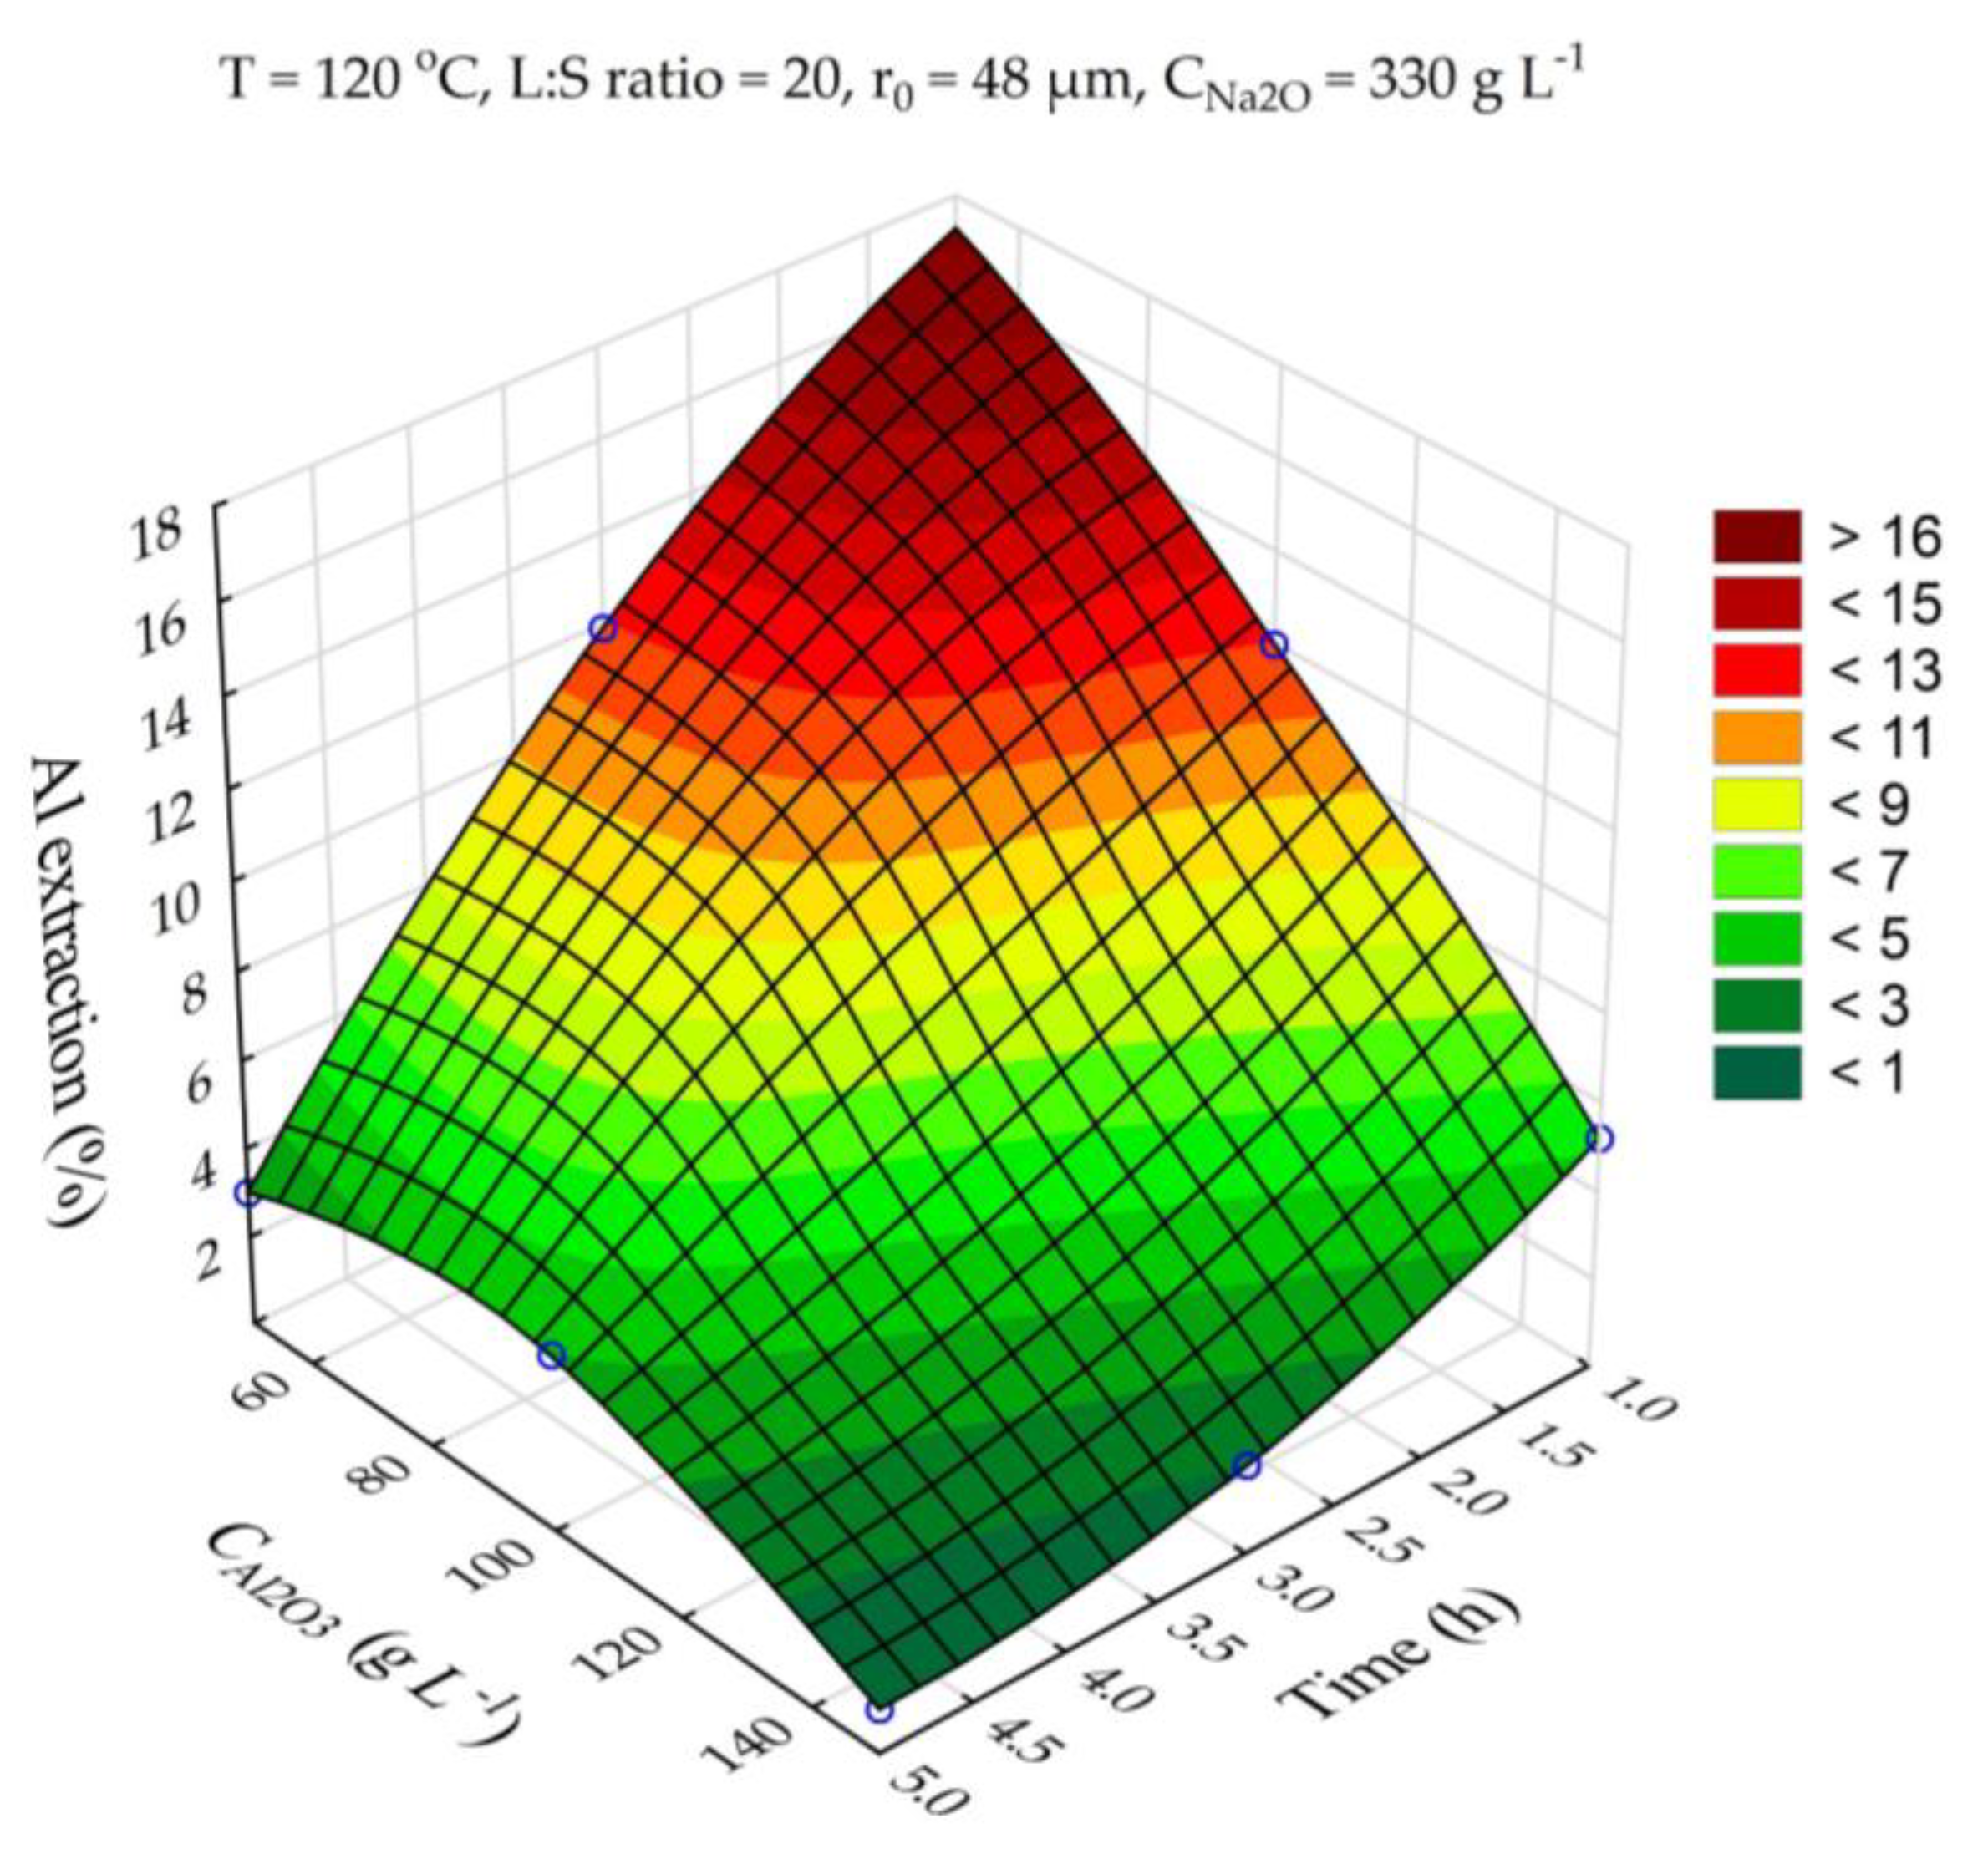
Experiments on desilication with the use of aluminate solutions of different Al concentrations were carried out to investigate the possibility of reducing Al co-extraction. It is known that the solubility of boehmite at atmospheric pressure is very low [33], but when using highly concentrated NaOH solutions, it is sufficient to extract more than 50% of aluminum at L:S above 10. The results of experiments on the effect of Al concentration (in terms of Al2O3, g L–1) on the Al extraction from bauxite during frist stage of leaching are shown in Figure 9.
It is obvious that the use of aluminate solution can suppress the process of Al co-extraction from bauxite during its desilication even at the most severe conditions: T = 120 °C, Na2O = 330 g L–1 and the L:S ratio = 20. When aluminate solution with an Al2O3 concentration of 150 g L–1, Na2O = 330 g L–1used for desilication at 100 ° C, τ = 1h and L:S ratio = 20 the Al and Si extraction were 5.1%, and 60.5%, respectively. Chemical composition of the concentrate (desilicated bauxite – DB) obtained under these conditions is shown in Table 5. As can be seen, the silica modulus of bauxite after desilication increased to 21.34 units compared with 8.36 units for the original bauxite. The maximum theoretically Al extraction from this bauxite by the Bayer method is 95.3%.
Table 5. Chemical composition of the desilicated bauxite (DB) obtained at optimal conditions (Al2O3 concentration of 150 g L–1, Na2O = 330 g L–1 used for desilication at 100 °C and L:S ratio = 20, τ = 1h).
Main components, wt. %
Al2O3 Fe2O3 SiO2 CaO TiO2 CO2 Na2O MnO MgO K2O LOI
47.61 34.79 2.23 1.45 2.39 0.67 0.19 0.58 0.54 0.12 9.44

3.2. The effect of leaching parameters on Al extraction from desilicated bauxite (DB)

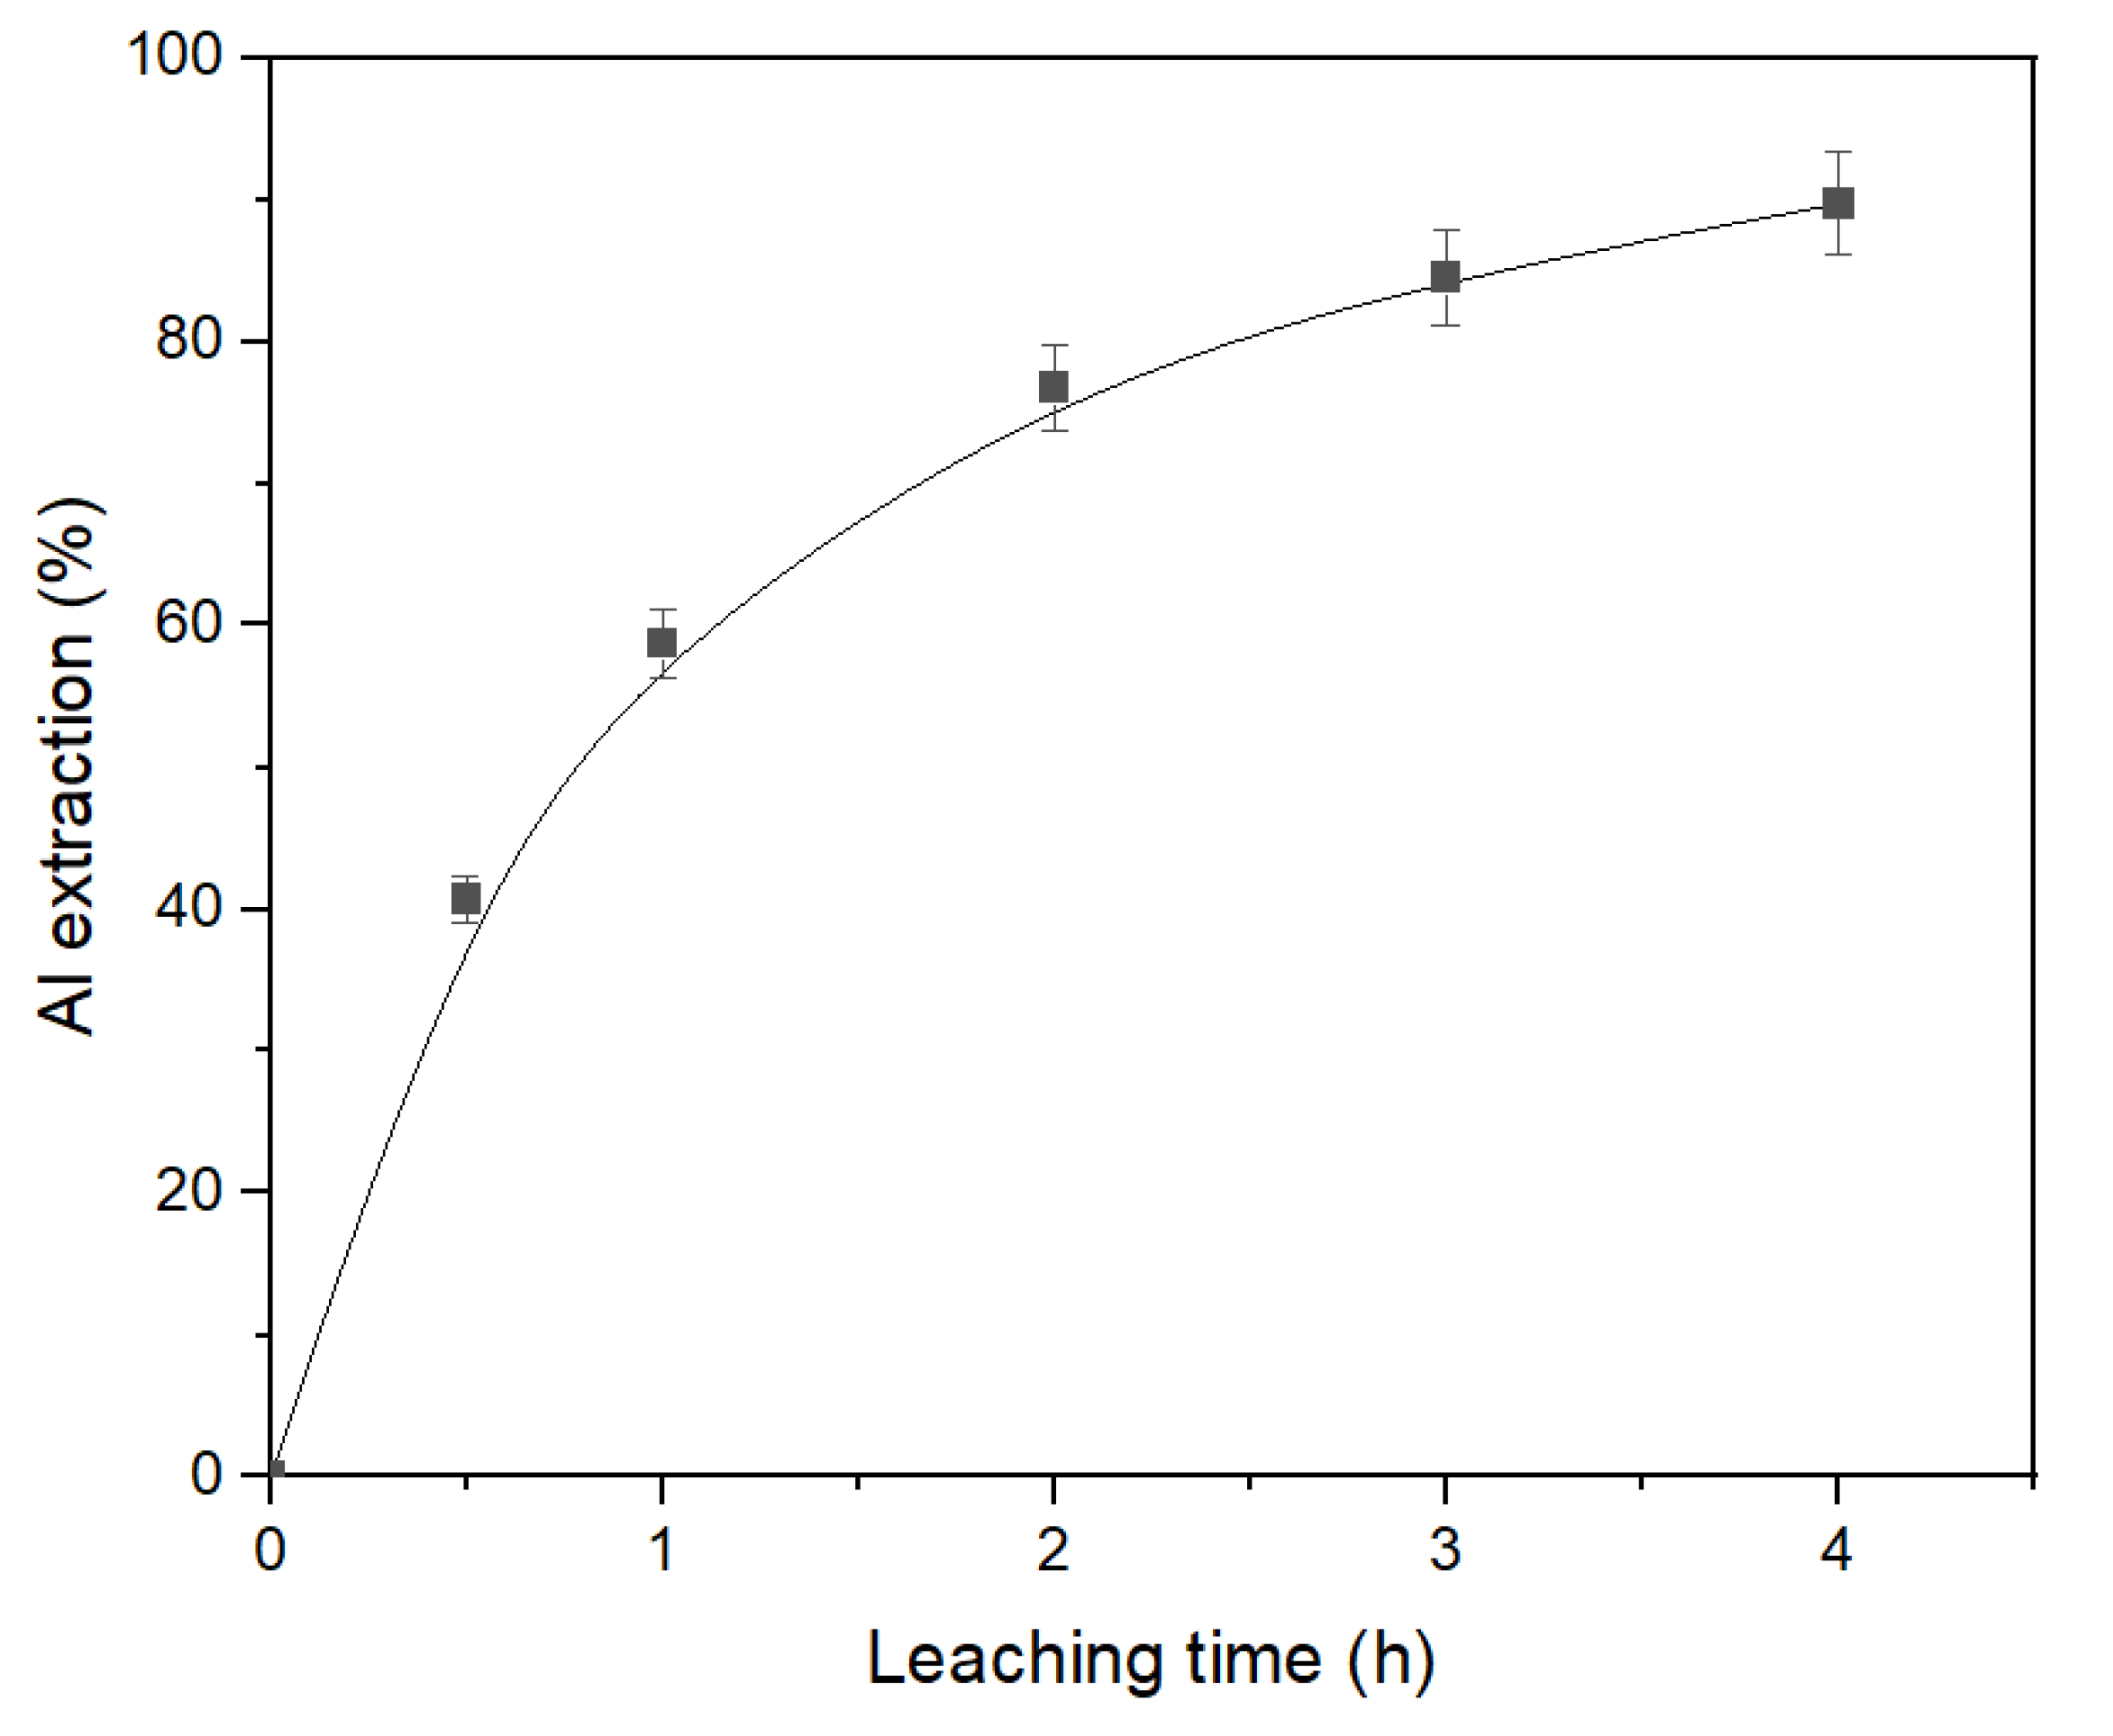
Desilicated bauxite obtained in section 3.1, Table 5 was subjected to the second stage leaching under atmospheric pressure. The parameters of the leaching were: T = 120 °C, CNa2O = 360 g L–1, CAl2O3 = 0 g L-1 and the L:S ratio = 20. Th result of the effect of time on Al extraction under these condition are shown in Figure 10. As can be seen, DB can be efficiently treated using atmospheric leaching process. After leaching the hematite transformation to magnetite was completed on 75,6 %. However, leaching time should be more than 4 h for extraction of 90 % of Al. Th resulting pregnant solution contains only 32.6 g L-1 Al2O3 and can not be processed using the Bayer process. Therefore, the high-pressure leaching of DB was studied.
The results of high-pressure Al leaching from DB were also processed using neural network modeling in the Statistica application package. The matrix of experiments and the results of Al extraction from desilicated bauxite are shown in Table 6.
Table 6. Experimental matrix and results obtained for the extraction of Al from desilicated bauxite.
Exp.№ Time (min) Temperature (°C) r0 (μm) Al extraction (%)
1 10 220 38 58.00
2 30 220 38 76.82
3 40 220 38 86.07
4 60 220 38 94.04
5 22.5 220 38 74.20
6 40 180 38 65.80
7 60 180 38 77.00
8 15 140 38 36.70
9 60 140 38 55.79
10 10 220 78 57.30
11 30 220 78 68.20
12 60 220 78 77.80
13 30 220 63 79.62
14 10 220 63 66.50
15 60 220 63 92.52
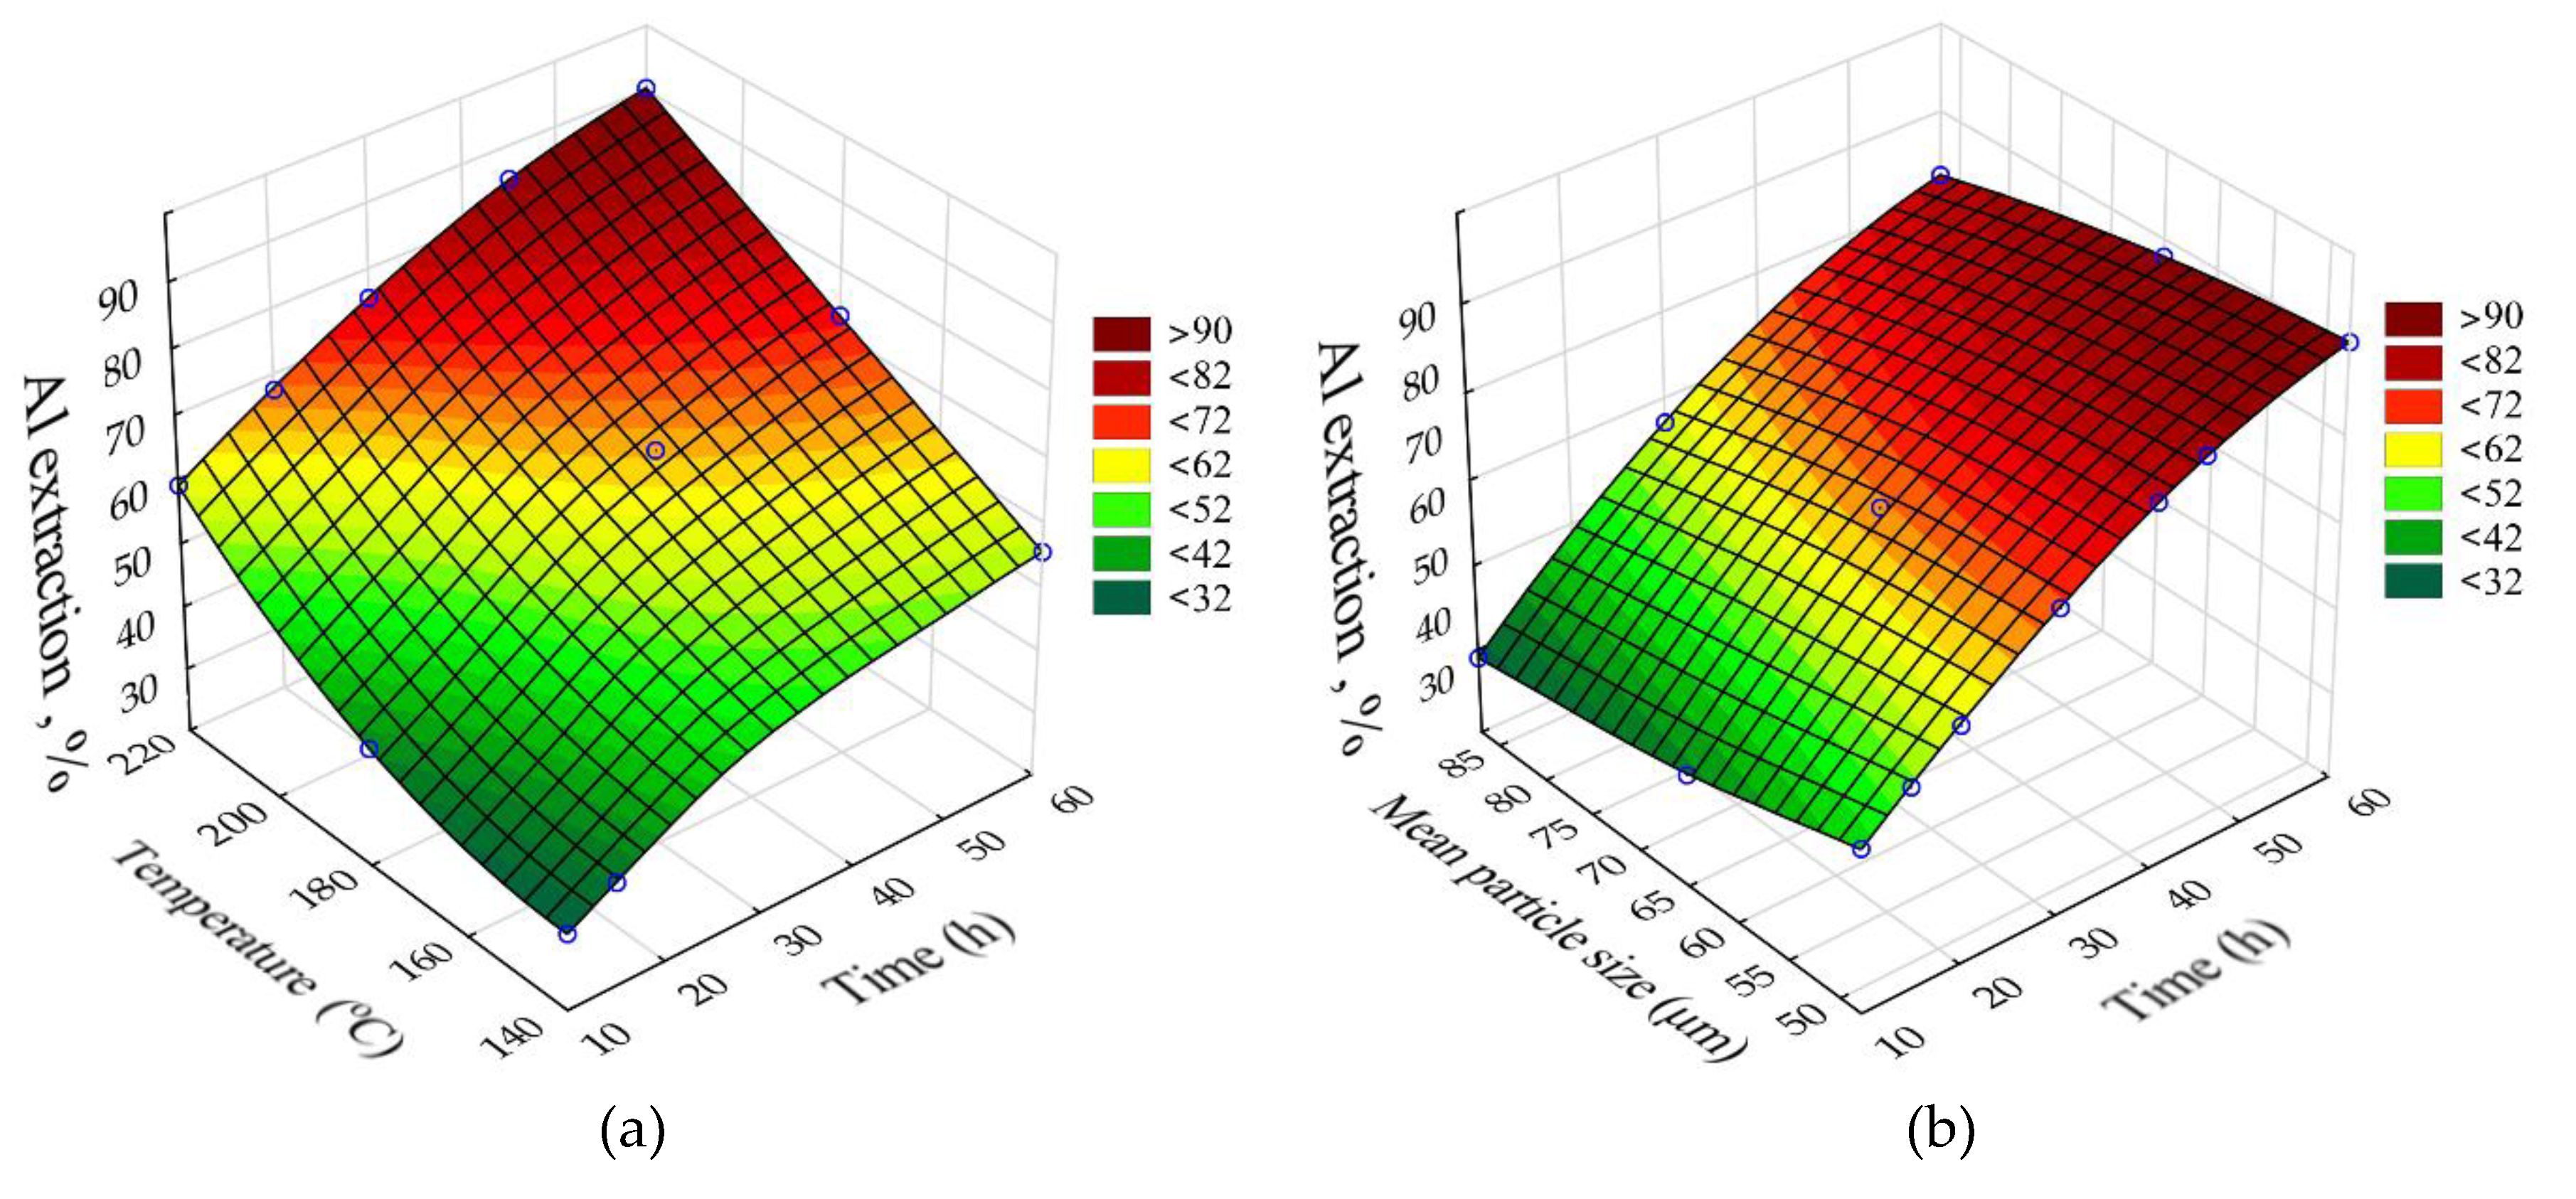
The SANN model that was better fitted to the experimental data of Al extraction was the multilayer perceptron (MLP) 5.9.1 (R2 = 0.98). The response surfaces predicted by the SANN model for Al recovery as a function of leaching time (τ, h), temperature (T, °C), and initial average bauxite particle size (r0, μm) are shown in Figure 11. The fixed values were CNa2O = 330 g L–1, CAl2O3 = 150 g L–1, L:S for the obtaining caustic modulus of the pregnant solution αk = 1.65.
The greatest influence (Figure 11) on Al extraction is caused by the leaching time and temperature. Increasing the temperature from 140 °C to 220 °C increases the Al extraction after 60 min of leaching from 56 to 92 % (Figure 11a). This may indicate that the surface chemical reaction is the limiting stage of the process. Increasing the initial particle size from 48 μm to 78 μm results in a decrease of Al extraction from 90 to 85% (Figure 11b), which may indicate that diffusion has no influence on the kinetics of leaching process.
In order to identify the mechanism of the leaching process, the physico-chemical properties of the solid residue were studied.

3.3. Solid resue characterization

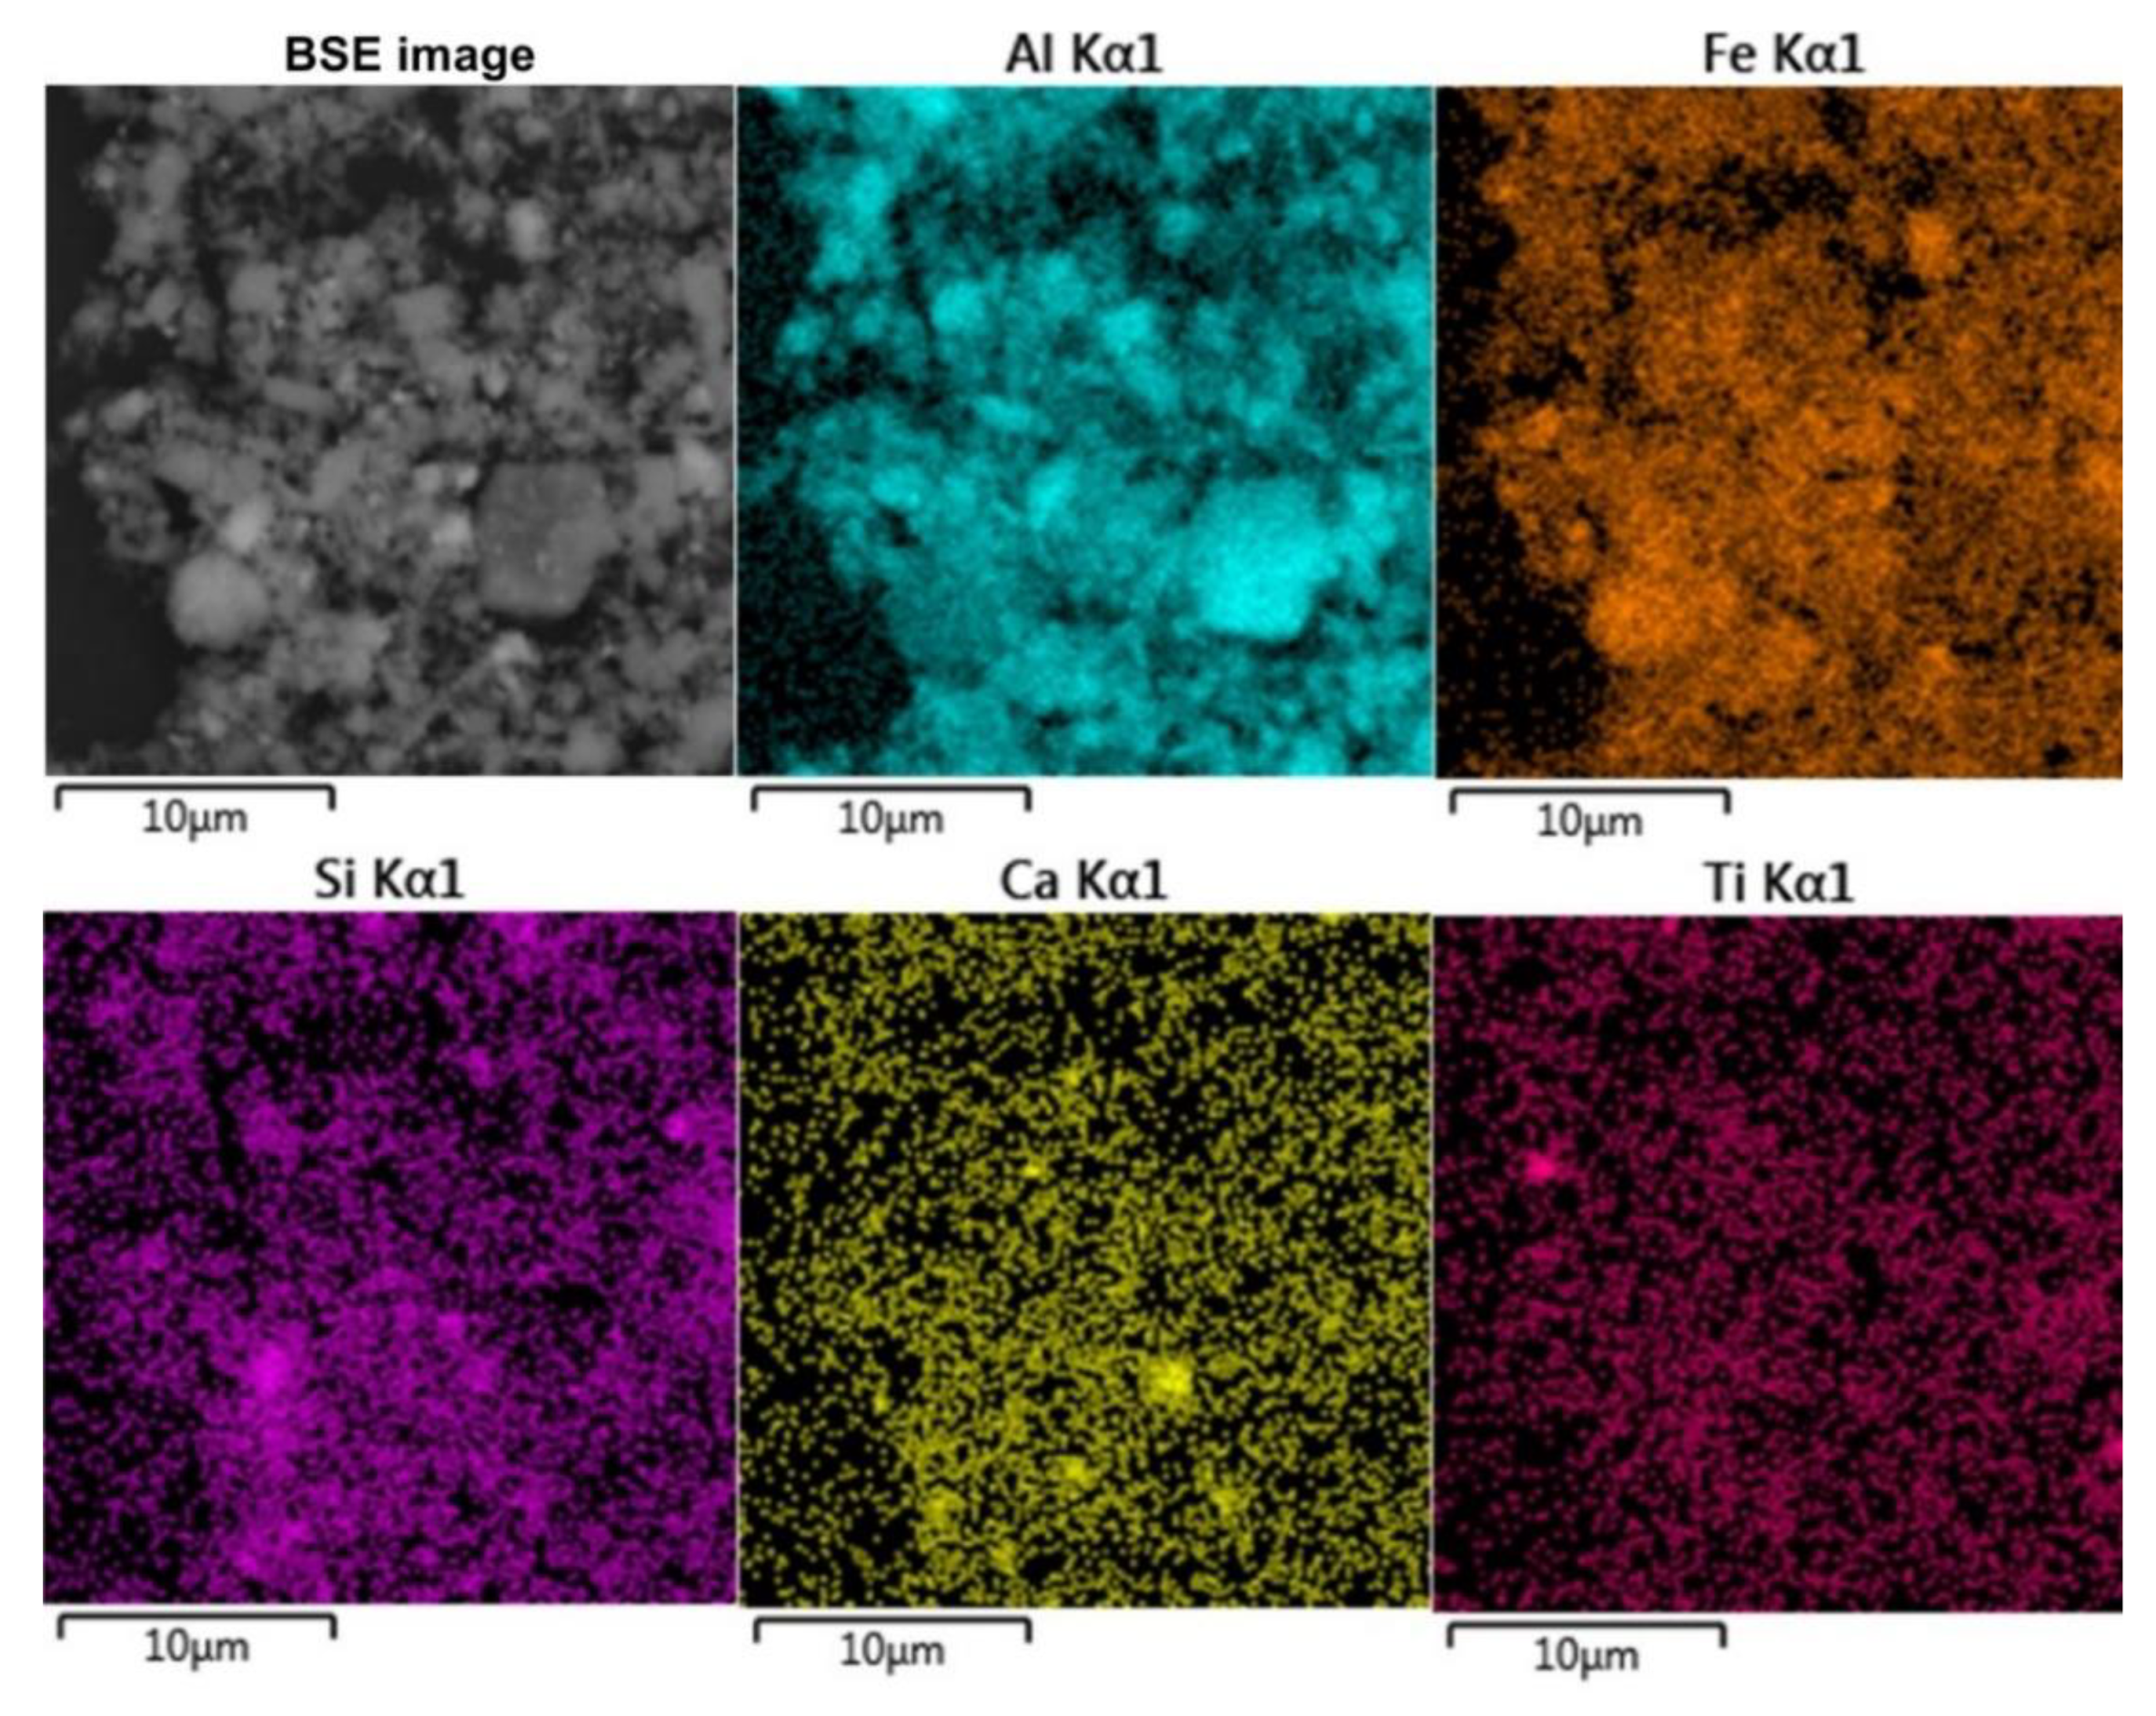
Figure 12 shows the elemental surface distribution maps for desilicated bauxite after first stage of leaching at T = 100 °C, CNa2O = 330 g L–1 CAl2O3 150 g L–1 and L:S ratio = 20. According to the elemental distribution, Fe, Si, Ca, and Ti are evenly distributed over the particle surfaces. Particles of boehmite (particles with high Al content) may be clearly visible. Fragmented iron particles are also found, but in general the iron particles after magnetization appear to be sufficiently finely dispersed. Figure 13 shows an XRD patter of bauxite desilicated under optimum conditions. After desilication in the presence of divalent iron a new phase, magnetite, appeared, although the intensity of the peaks is low. Also, after desilication and the magnetization the chamosite peaks disappeared, but quartz, which is insoluble at atmospheric pressure, is visible in the solid residue. It should be noted that under parameters of the Bayer process chamosite is almost inert until 200 °C [34].
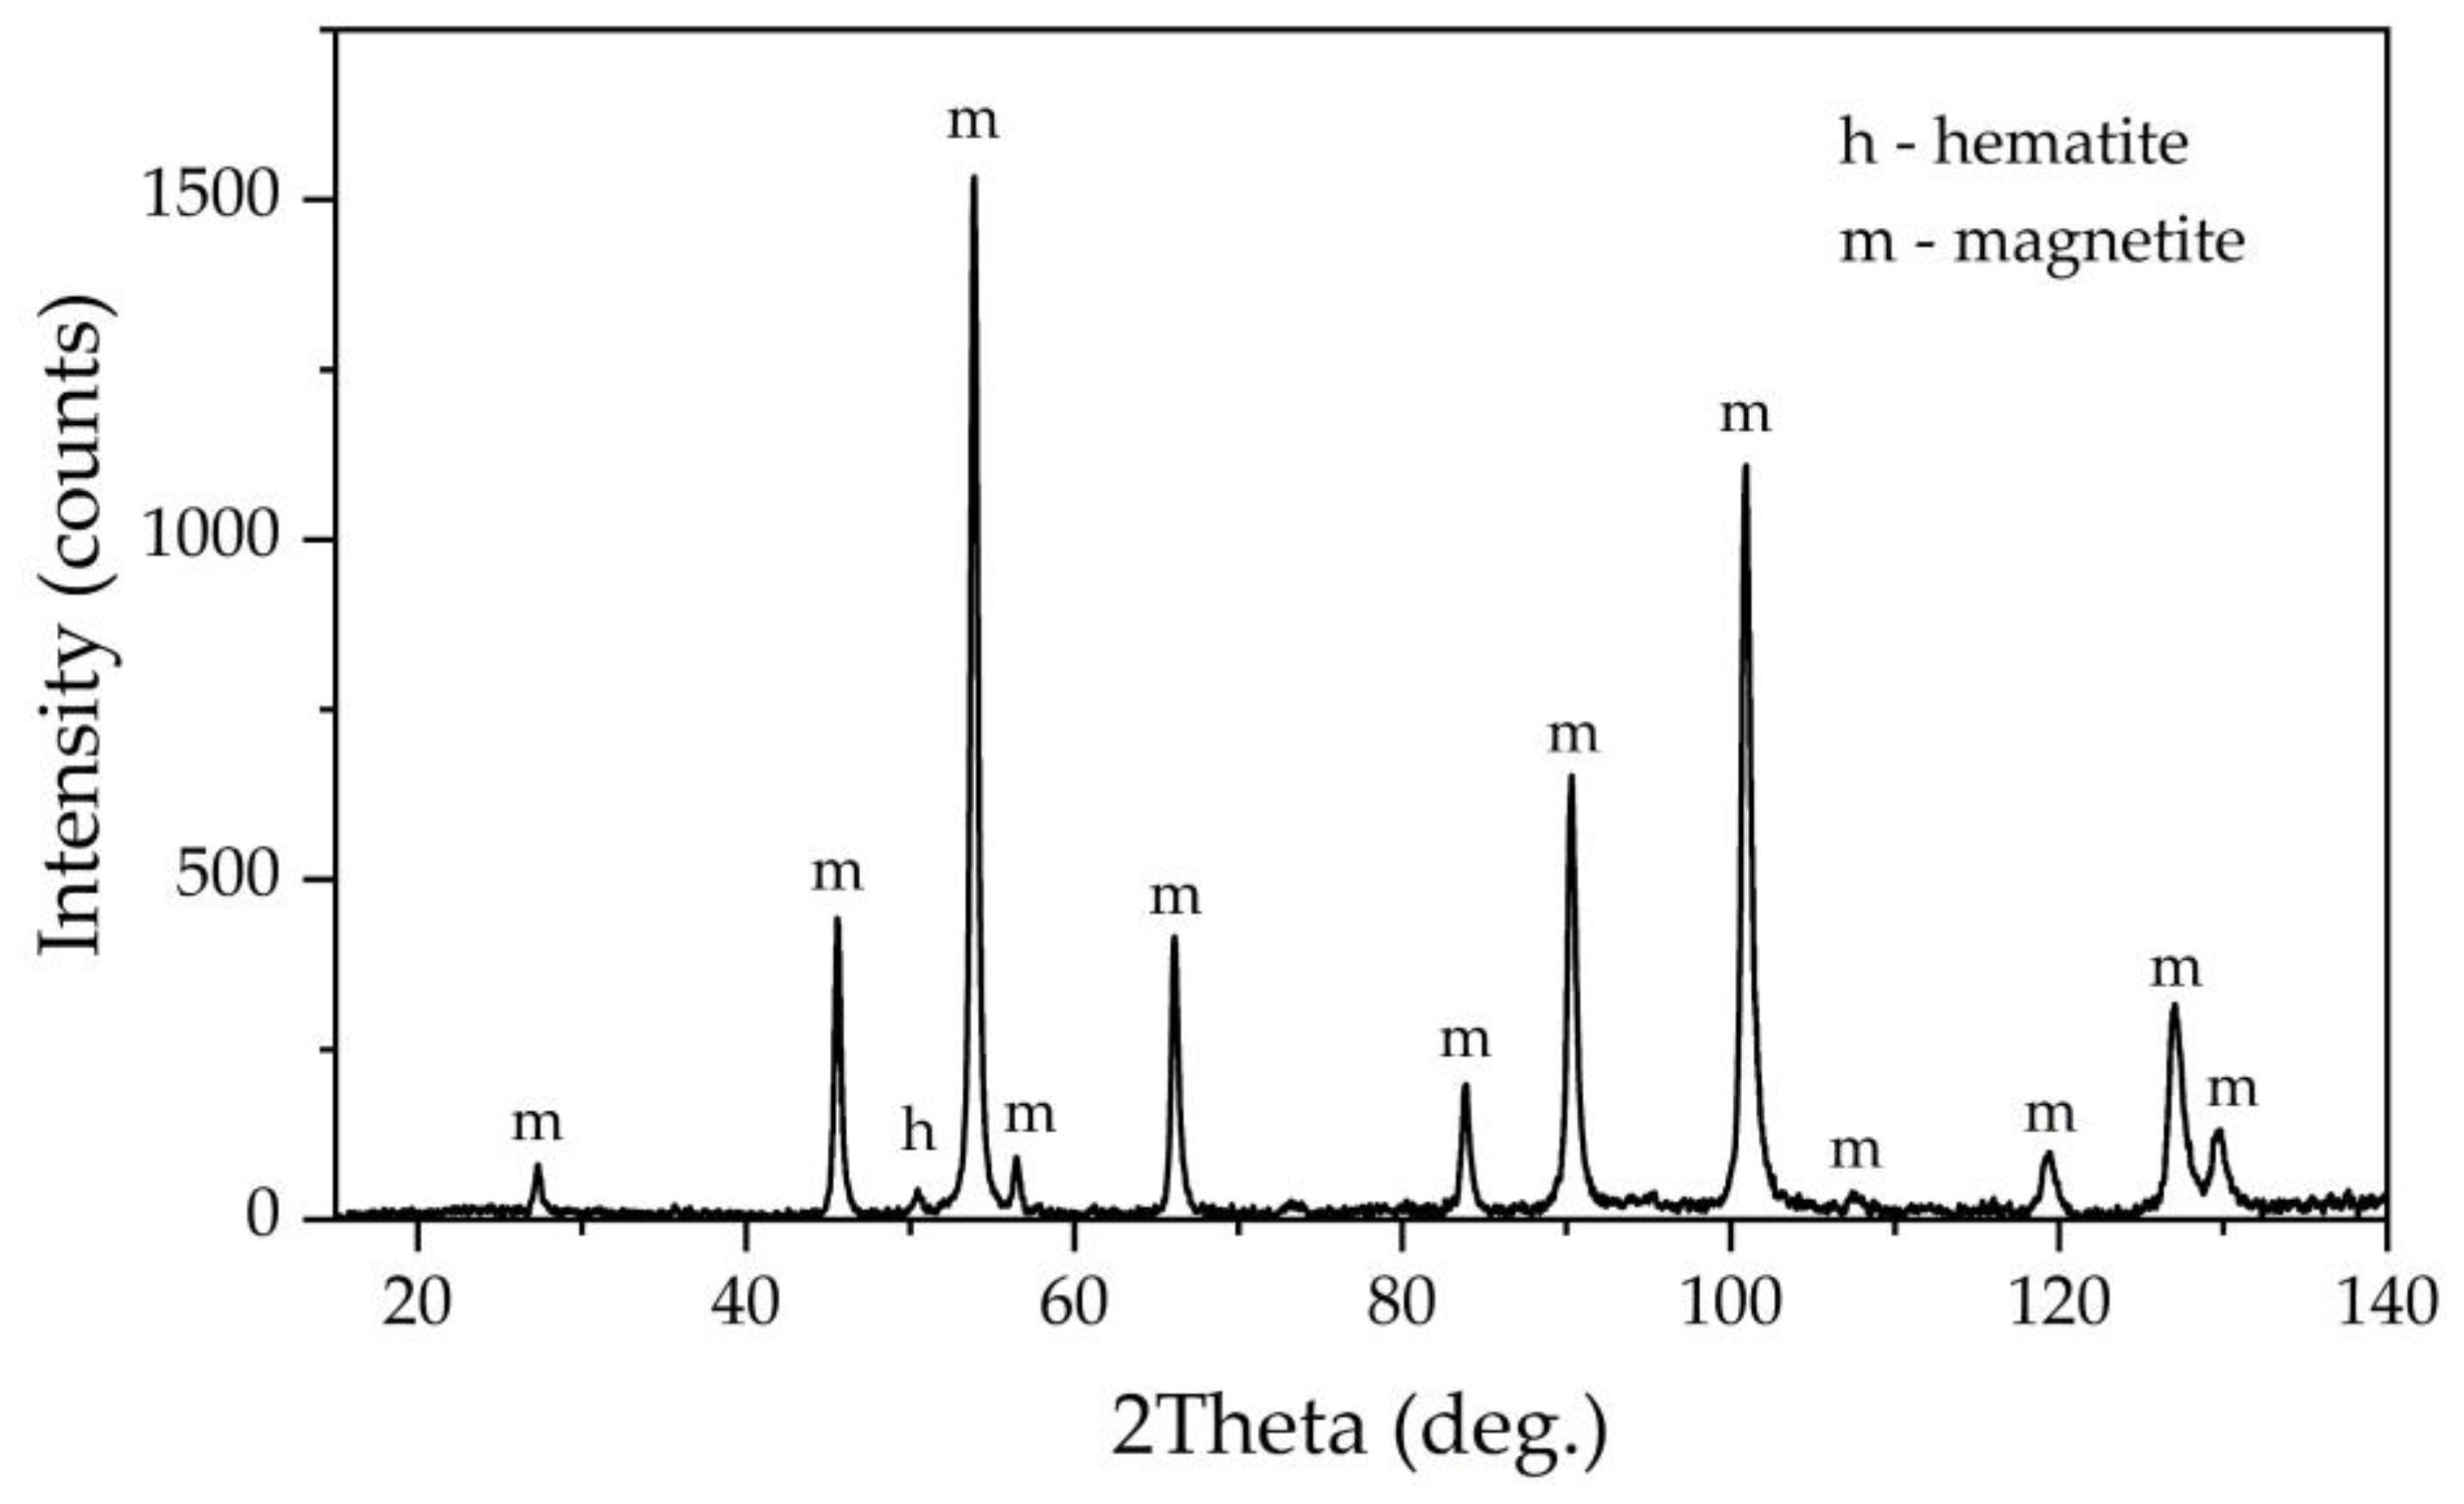
Chemical composition of the solid residue obtained after leaching of the DB under conditions similar to the industrial one (T = 220 °C, τ = 120 min, CNa2O = 330 g L–1, CAl2O3 = 150 g L–1 and L:S ratio that needed to obtain caustic modulus 1.65 in the pregnant solution) is presented in Table 7. The yield of the solid residue was 41.5 % from the initial mass of the bauxite sample before desilication. It can be seen that Fe and Ti content in the residue increased significantly compared to the feedstock, and, according to XRD analysis, almost all iron is represented by magnetite. Alumina content was decreased by a factor of 20, and silica content by a factor of two. This indicates that practically all the alumina from the chamosite and all the boehmite were leached after 2 h of leaching - the total Al extraction after two stages was 97 %. At the same time, the Na2O content remained very low even after two stages; this means that DSP was practically not formed in the leaching of DB in the simultaneous presence of ferrous iron, which was also confirmed by XRD analysis (Figure 14).
Table 7. Chemical composition of the solid residue (red mud) obtained by leaching of desilicated bauxite by mother aluminate solution T = 220 °C, τ = 120 min, CNa2O = 330 g L-1, CAl2O3 = 150 g L-1.
Main components, wt. %
Fe3O4 TiO2 Al2O3 SiO2 CaO MgO Na2O MnO CO2 SO3 P2O5
83.82 6.60 2.67 1.60 1.56 1.11 1.03 0.96 0.45 0.05 0.01
As can be seen from the XRD pattern in Figure 14, the peaks of boehmite and hematite was disappeared, while the peaks of magnetite was increased significantly - magnetite remains almost the only phase in this BR. This fact suggests that the leaching of boehmite is complete. However, the absence of DSP and rutile on the XRD means that magnetization also helps to transform both silica and titania in a new phase [23].
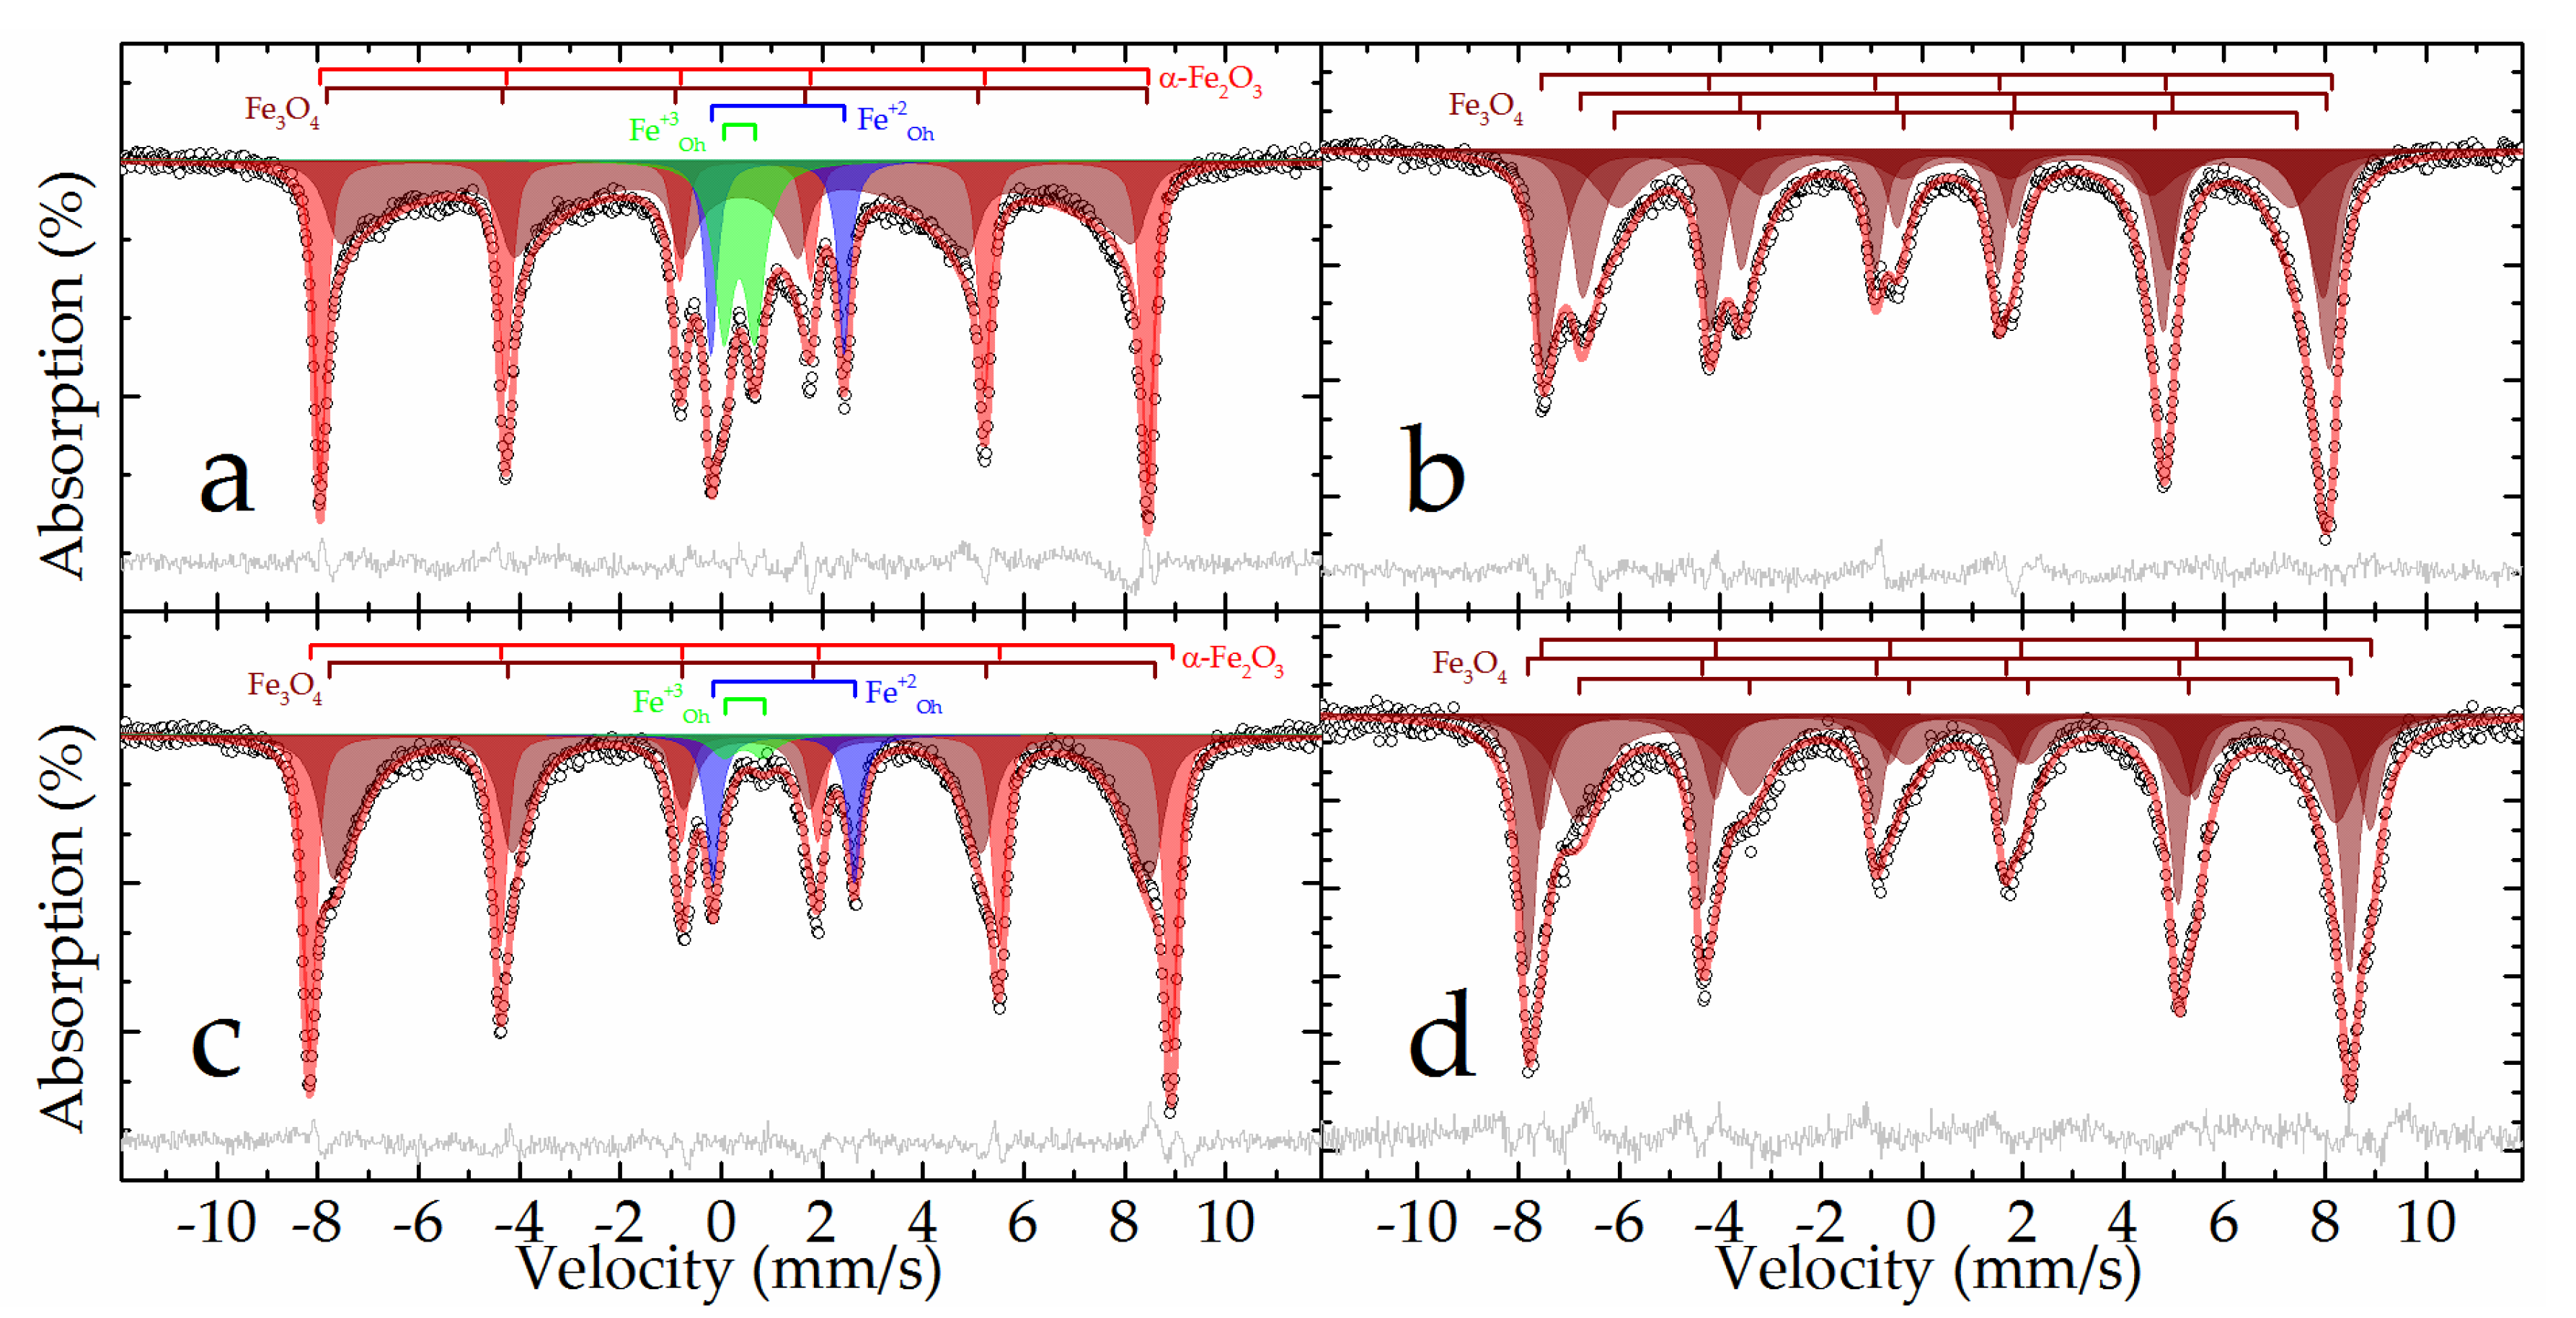
The results of the XRD patterns in Figure 13 and 14 was confirmed by Mössbauer spectroscopy. The Mössbauer spectra of DB sample obtained at both temperatures (Figure 15a,c) can be satisfactorily described by the superposition of two sextets and two doublets (Table 3).
The outer sextet with the maximum hyperfine magnetic splitting and narrow resonance lines corresponds to hematite partially substituted by aluminum and is close in parameters to the analogous subspectrum of the raw bauxite sample (Table 3). The intensity of this sextet noticeably increases when going from 296 to 78 K, with a simultaneous decrease in the intensity of the doublet described by subspectrum 3 (Table 3), which suggests that this doublet mainly corresponds to superparamagnetic nanosized hematite. The hyperfine parameters of subspectrum 4, corresponding to iron(+2) atoms, are similar to the corresponding parameters for the initial bauxite, and obviously correspond to the incompletely reacted chamosite (Table 3). There were no subspectra that could correspond to goethite in this sample. The rest of the spectrum can only be described using the many-state superparamagnetic relaxation model [35]. The models for the spectra obtained at different temperatures were consistent with each other through the ratio of the energy of the magnetic anisotropy of particles to the thermal energy:
α = K V / kB T,
where K - magnetic anisotropy constant, V - volume of the magnetic domain, kB - Boltzmann constant, T - temperature [36]. Obviously, this subspectrum refers to the forming particles of nanomagnetite, possibly partially oxidized [37]. From the parameters obtained using Equation (5) and making the assumption that the particles are spherical, and the magnetic anisotropy constant does not depend on temperature and is equal to 2*104 J m-3 [38,39], one can estimate the sizes of magnetic domains for nanomagnetite as 10.32±0.06 nm.
The Mössbauer spectra of the BR sample have a form characteristic of magnetite [40]: a sextet with a characteristic splitting of 1-3 resonance lines and an increased intensity of 4-6 lines in the spectra at room temperature; a noticeable asymmetric distortion of the sextet resonance lines in the spectra at the boiling point of nitrogen (Figure 15b,d). The general broadening of resonance lines to the inner region of the spectrum indicates the manifestation of superparamagnetism by the material [36]. Both spectra are satisfactorily described by the superposition of three sextets, the profile of each of which is specified within the many-state superparamagnetic relaxation model [35] (Table 3). In this case, within the same spectrum, the sextets were interconnected by relaxation parameters, and the spectra at different temperatures were additionally consistent with each other through the ratio of the energy of the magnetic anisotropy of particles to the thermal energy (Equation (4)). Similar to the method described above for the example of the DB sample, the sizes of the magnetic domains of nanomagnetite were estimated, which amounted to 19.2 ± 0.2 nm. No other components corresponding to those observed in the raw bauxite or DB samples or not observed in them were recorded in the described spectra, that means the complete magnetization of iron minerals after high-pressure leaching of the DB.
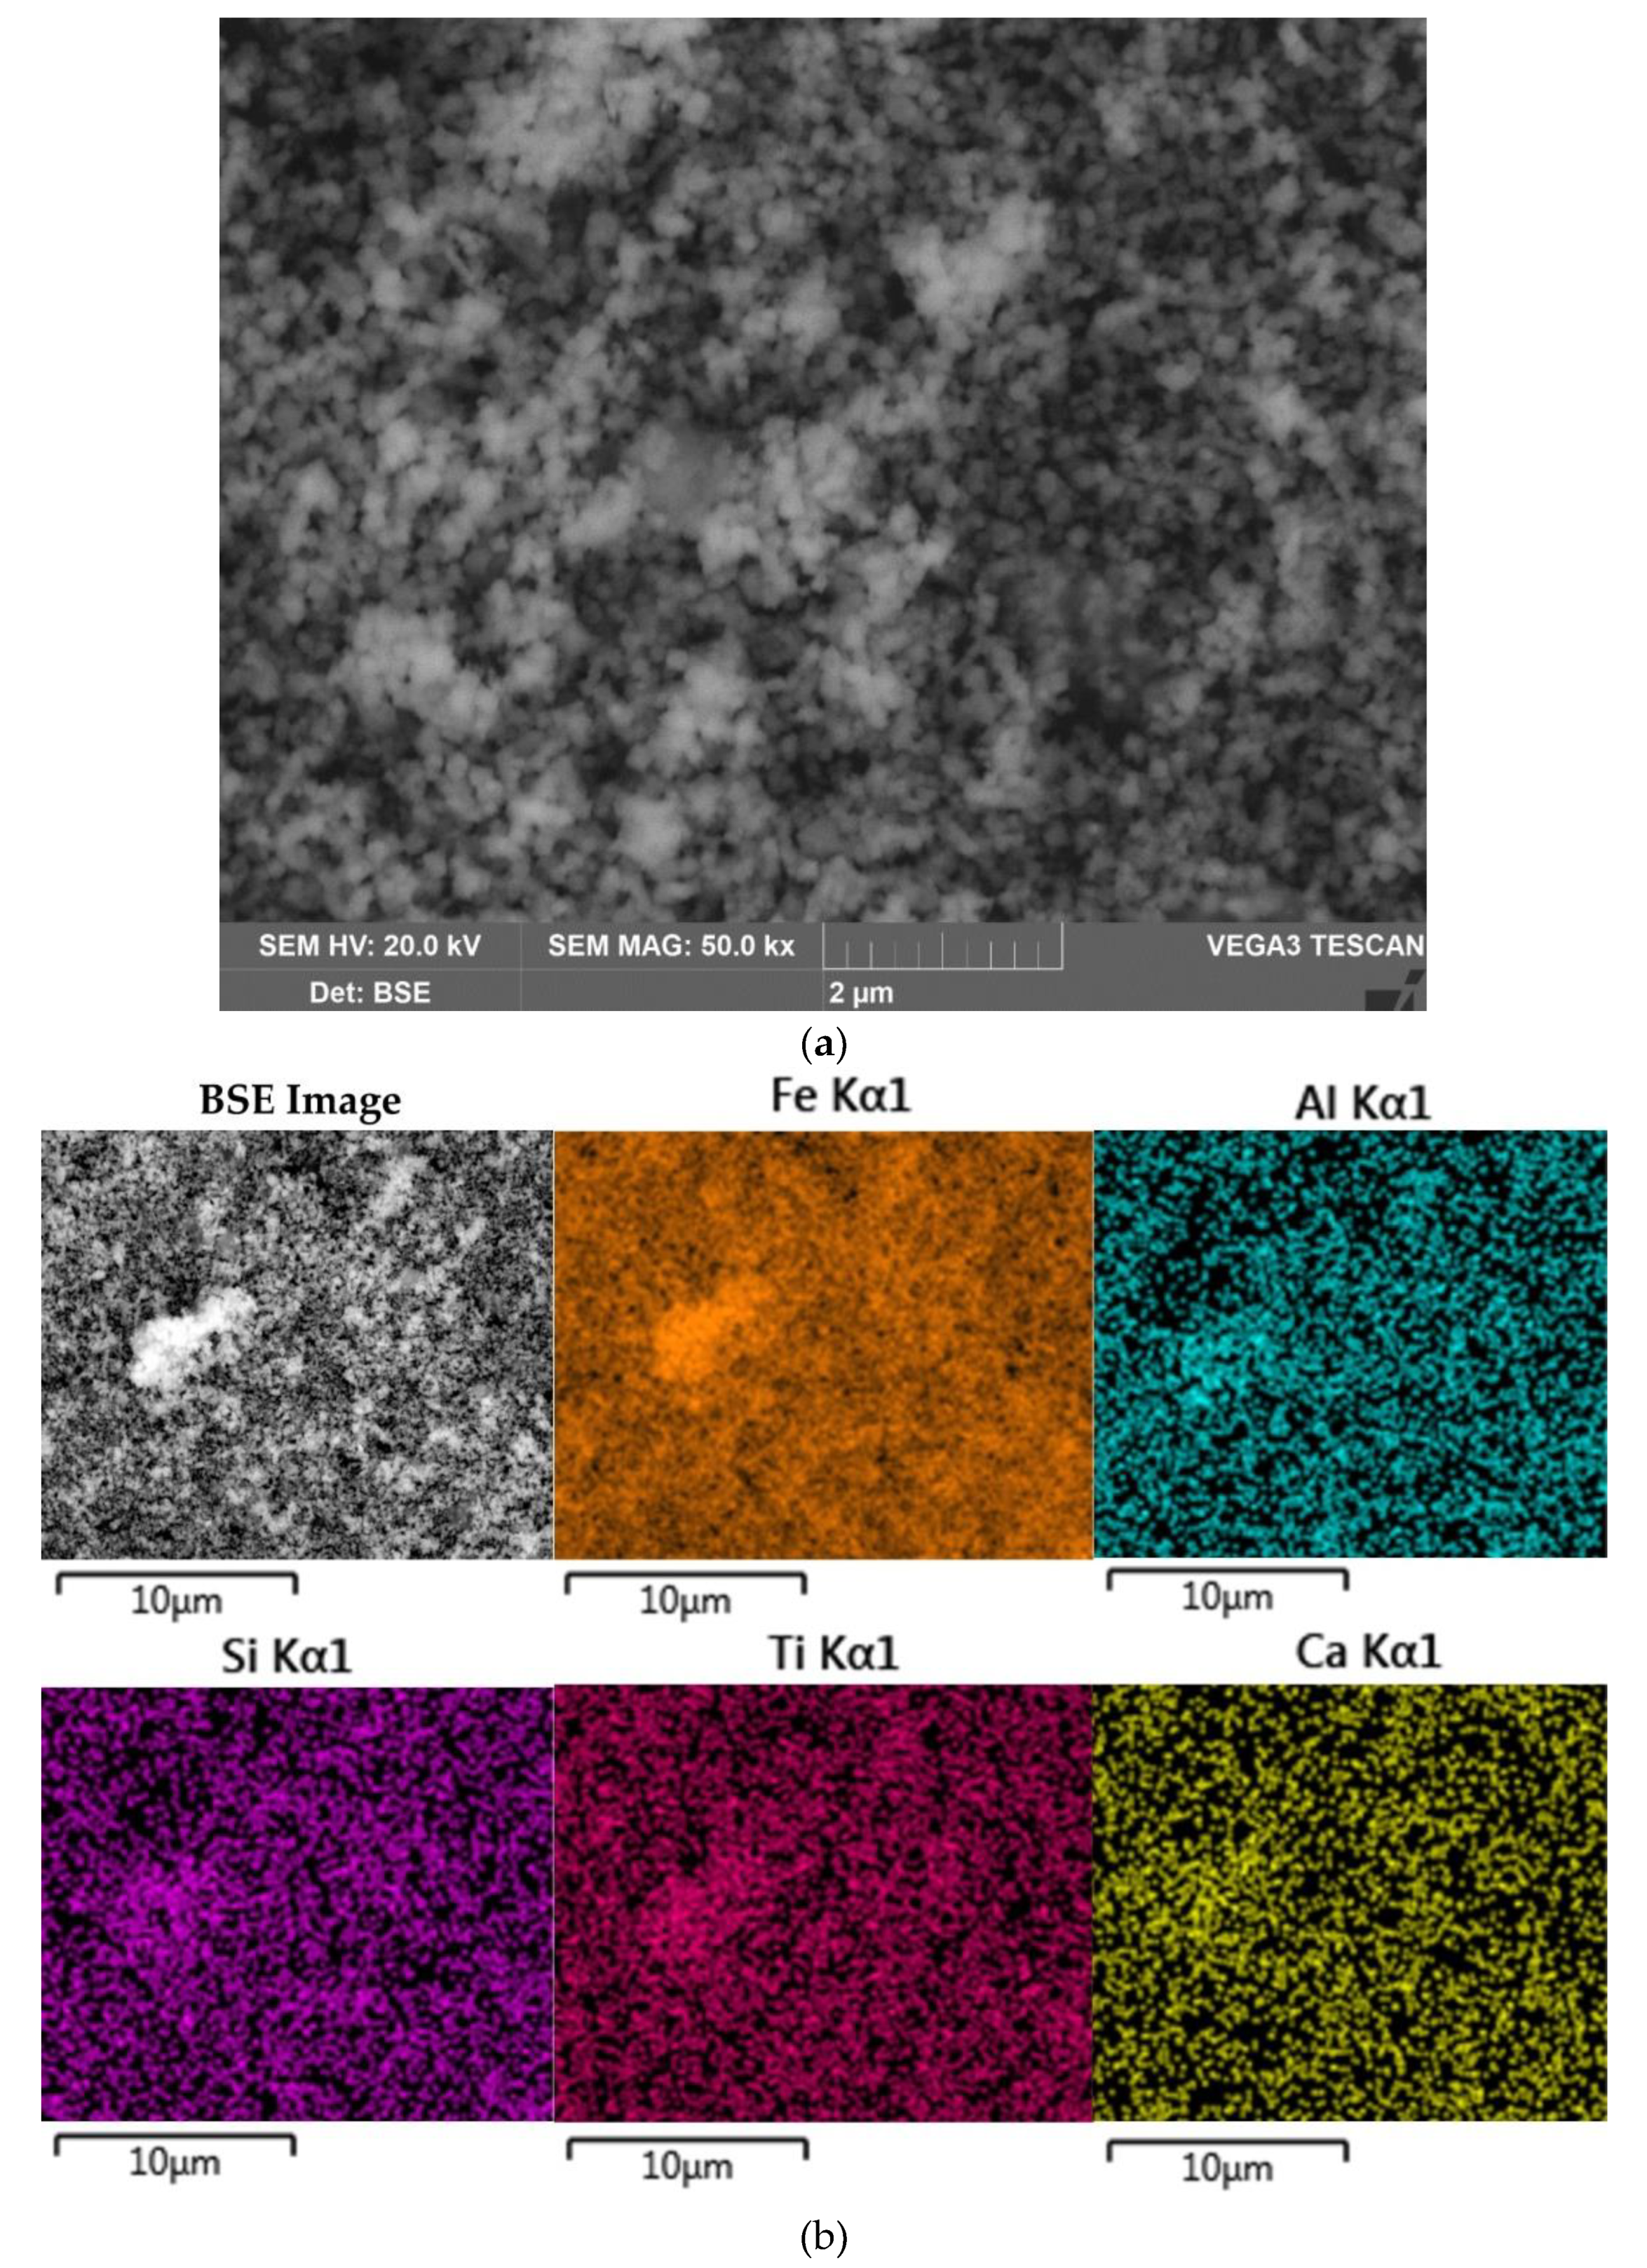
The morphology and elemental composition of the bauxite residue particles were also investigated using SEM EDS analysis (Figure 16).
The data obtained above are confirmed by SEM-EDS analysis (Figure 16). Figure 16a,b show that the particle size of BR (mostly magnetite) is less than 200 nm. At the same time Al, Si, Ti and Ca are evenly distributed on the particle surface which may indicate their inclusion in the iron containing phases. It should be noted that, because of the complete Al extraction and no DSP formation, the obtained BR is enriched in rare-earth elements (REE). For example, the scandium content in BR reaches 130 mg kg-1. Therefore, high iron content and concentration of REE makes this BR are valuable by-product for metals extraction.
4. Conclusions

A new method of pre-treating boehmitic bauxite by leaching at atmospheric pressure in the presence of Fe2+ has been investigated. According to XRD, Mössbauer spectroscopy and chemical analysis, Al in this type of bauxite is mainly represented by boehmite and diaspore, some Al and Si is represented by aluminosilicates - chamosite and small amounts of kaolinite. Silica is also contained in quartz. The presence of Fe2+ facilitates the Al and Si extraction from the aluminosilicates (chamosite) and from the solid matrix of iron minerals (Al-goethite and Al-hematite). This effect is due to the magnetization (conversion to magnetite) of hematite and chamosite after their dissolution in a concentrated alkaline solution in the presence of Fe2+. The results on Al and Si extraction, Fe and Na content in the solid residue obtained by alkaline treatment in the presence of Fe2+ were analyzed using artificial neural networks and machine learning. It was found that the optimum leaching parameters of pretreatment contributing to maximum Si extraction with minimum aluminium loss are T = 100 °C, τ = 1 h, CNa2O = 330 g L–1, CAl2O3 = 150 g L–1 and L:S ratio = 20. Under these conditions the Si extraction was higher than 60 %, while Al co-extraction was lower than 10 %. After desilication in the presence of ferrous iron a new phase - magnetite - appeared in the solid residue, according to X-ray diffraction analysis. According to SEM-EDS analysis and Mössbauer spectra the particle size of magnetite is less than 100 nm. The presence of Fe2+ during subsequent leaching of desilicated bauxite using the Bayer process leaching promotes Al extraction from Al-hematite and chamosite. Also, in the presence of Fe2+ and low Si content in the feedstock there is no formation of DSP, which further increases the degree of Al extraction. The optimum leaching parameters for Al extraction from desilicated bauxites were T = 220°C, τ = 2 h, CNa2O = 330 g L–1, CAl2O3 = 150 g L–1. Under these conditions the total Al extraction from the high-iron and high-silica boehmitic bauxite reached more than 97%. The content of magnetite in the solid residue was 83.82%.

Author Contributions

Conceptualization, A.S. and I.L.; methodology, A.S.; software, D.V.; validation, D.V. and D.P.; formal analysis, I.L.; investigation, A.S. and D.V..; resources, A.S.; data curation, A.S.; writing—original draft preparation, A.S. and D.V.; writing—review and editing, D.V. and D.P.; visualization, A.S.; supervision, D.P.; project administration, I.L.; funding acquisition, I.L. All authors have read and agreed to the published version of the manuscript.

Funding

The SEM-EDS, VSM and XRD analysis was funded by the Project of the State Assignment, FEUZ-2021-0017. The method for determining the chemical composition of raw BR and solid residue after pulp filtration by XRF (see Section 2.3. " Methods of analysis ") were funded by the Project of the State Assignment (Vernadsky Institute of Geochemistry and Analytical Chemistry of Russian Academy of Sciences, № FMUS-2019-24). Mössbauer analysis was performed in accordance with the state assignment of Lomonosov Moscow State University “Solving of problems of nuclear energy and environmental safety problems, as well as diagnostics of materials using ionizing radiation” (Project Reg. No. 122030200324-1).

Data Availability Statement

All data presented in this article.

Acknowledgments

The authors express our gratitude to Evgeny Kolesnikov from NUST MISiS for assistance of the SEM, and XRD analyses of solid samples.

Conflicts of Interest

The authors declare no conflict of interest.

References

  1. Smith, P. The Processing of High Silica Bauxites - Review of Existing and Potential Processes. Hydrometallurgy 2009, 98, 162–176. [Google Scholar] [CrossRef]
  2. Swain, B.; Akcil, A.; Lee, J. Red Mud Valorization an Industrial Waste Circular Economy Challenge; Review over Processes and Their Chemistry. Critical Reviews in Environmental Science and Technology 2022, 52, 520–570. [Google Scholar] [CrossRef]
  3. Fomina, E.Y.; Vlasova, V.V. Development of Alumina Production Technology by Sintering of TPP Waste. IOP Conference Series: Earth and Environmental Science 2020, 408, 12070. [Google Scholar] [CrossRef]
  4. Bai, G.H.; Teng, W.; Wang, X.G.; Qin, J.G.; Xu, P.; Li, P.C. Alkali Desilicated Coal Fly Ash as Substitute of Bauxite in Lime-Soda Sintering Process for Aluminum Production. Transactions of Nonferrous Metals Society of China (English Edition) 2010, 20, s169–s175. [Google Scholar] [CrossRef]
  5. Valeev, D.; Pankratov, D.; Shoppert, A.; Sokolov, A.; Kasikov, A.; Mikhailova, A.; Salazar-Concha, C.; Rodionov, I. Mechanism and Kinetics of Iron Extraction from High Silica Boehmite–Kaolinite Bauxite by Hydrochloric Acid Leaching. Transactions of Nonferrous Metals Society of China 2021, 31, 3128–3149. [Google Scholar] [CrossRef]
  6. Valeev, D.; Shoppert, A.; Dogadkin, D.; Romashova, T.; Kuz’mina, T.; Salazar-Concha, C. Extraction of Al and Rare Earth Elements via High-Pressure Leaching of Boehmite-Kaolinite Bauxite Using NH4HSO4 and H2SO4. Hydrometallurgy 2023, 215, 105994. [Google Scholar] [CrossRef]
  7. Loginova, I.V.; Shoppert, A.A.; Chaikin, L.I. Effect of Adding Sintering Furnace Electrostatic Precipitator Dust on Combined Leaching of Bauxites and Cakes. Metallurgist 2015, 59, 698–704. [Google Scholar] [CrossRef]
  8. Beavogui, M.C.; Balmaev, B.G.; Kaba, O.B.; Konaté, A.A.; Loginova, I.V. Bauxite Enrichment Process (Bayer Process): Bauxite Cases from Sangaredi (Guinea) and Sierra Leone.; Nizhny Tagil, Russia, 2022; p. 020003.
  9. He, J.; Bai, Q.; Du, T. Beneficiation and Upgrading of Coarse Sized Low-Grade Bauxite Using a Dry-Based Fluidized Bed Separator. Advanced Powder Technology 2020, 31, 181–189. [Google Scholar] [CrossRef]
  10. Chang, Z.; Sun, C.; Kou, J.; Fu, G.; Qi, X. Experimental and Molecular Dynamics Simulation Study on the Effect of Polyacrylamide on Bauxite Flotation. Minerals Engineering 2021, 164, 106810. [Google Scholar] [CrossRef]
  11. Palit, C. Suliestyah Removal of Silicates from Gibbsite-Bauxite Ore by Using Cationic Reverse Flotation.; Yogyakarta, Indonesia, 2021; p. 030010.
  12. Li, H.; Chai, W.; Cao, Y.; Yang, S. Flotation Enhancement of Low-Grade Bauxite Using Oxalic Acid as Surface Pretreatment Agent. Applied Surface Science 2022, 577, 151964. [Google Scholar] [CrossRef]
  13. DUBOVIKOV, O.A.; JASKELAINEN, E.E. PROCESSING OF LOW-QUALITY BAUXITE FEEDSTOCK BY THERMOCHEMISTRY-BAYER METHOD. Journal of mining institute 2016, 5(221), 668–674. [Google Scholar] [CrossRef]
  14. Vaughan, J.; Peng, H.; Seneviratne, D.; Hodge, H.; Hawker, W.; Hayes, P.; Staker, W. The Sandy Desilication Product Process Concept. Jom 2019. [Google Scholar] [CrossRef]
  15. Li, X.; Wang, Y.; Zhou, Q.; Qi, T.; Liu, G.; Peng, Z.; Wang, H. Transformation of Hematite in Diasporic Bauxite during Reductive Bayer Digestion and Recovery of Iron. Transactions of Nonferrous Metals Society of China 2017, 27, 2715–2726. [Google Scholar] [CrossRef]
  16. Zhou, G.; Wang, Y.; Qi, T.; Zhou, Q.; Liu, G.; Peng, Z.; Li, X. Enhanced Conversion Mechanism of Al-Goethite in Gibbsitic Bauxite under Reductive Bayer Digestion Process. Transactions of Nonferrous Metals Society of China 2022, 32, 3077–3087. [Google Scholar] [CrossRef]
  17. Li, X.; Yu, S.; Dong, W.; Chen, Y.; Zhou, Q.; Qi, T.; Liu, G.; Peng, Z.; Jiang, Y. Investigating the Effect of Ferrous Ion on the Digestion of Diasporic Bauxite in the Bayer Process. Hydrometallurgy 2015, 152, 183–189. [Google Scholar] [CrossRef]
  18. Wang, Y.; Li, X.; Zhou, Q.; Wang, B.; Qi, T.; Liu, G.; Peng, Z.; Pi, J.; Zhao, Z.; Wang, M. Reduction of Red Mud Discharge by Reductive Bayer Digestion: A Comparative Study and Industrial Validation. JOM. [CrossRef]
  19. Wang, Y.; Li, X.; Zhou, Q.; Qi, T.; Liu, G.; Peng, Z.; Zhou, K. Effects of Si-Bearing Minerals on the Conversion of Hematite into Magnetite during Reductive Bayer Digestion. Hydrometallurgy 2019, 189, 105126. [Google Scholar] [CrossRef]
  20. Zhou, G.; Wang, Y.; Qi, T.; Zhou, Q.; Liu, G.; Peng, Z.; Li, X. Cleaning Disposal of High-Iron Bauxite Residue Using Hydrothermal Hydrogen Reduction. Bull Environ Contam Toxicol 2022, 109, 163–168. [Google Scholar] [CrossRef]
  21. Pasechnik, L.A.; Skachkov, V.M.; Bogdanova, E.A.; Chufarov, A.Y.; Kellerman, D.G.; Medyankina, I.S.; Yatsenko, S.P. A Promising Process for Transformation of Hematite to Magnetite with Simultaneous Dissolution of Alumina from Red Mud in Alkaline Medium. Hydrometallurgy 2020, 196, 105438. [Google Scholar] [CrossRef]
  22. Zhou, X.; Liu, G.; Qi, T.; Zhao, J.; Peng, Z.; Wang, Y.; Shen, L. Increasing Iron Recovery from High-Iron Red Mud by Surface Magnetization. J. Sustain. Metall. 2023. [Google Scholar] [CrossRef]
  23. Zhou, G.; Wang, Y.; Zhang, Y.; Qi, T.; Zhou, Q.; Liu, G.; Peng, Z.; Li, X. A Clean Two-Stage Bayer Process for Achieving near-Zero Waste Discharge from High-Iron Gibbsitic Bauxite. Journal of Cleaner Production 2023, 405, 136991. [Google Scholar] [CrossRef]
  24. Li, L.; Wu, Z.; Lv, H.; Liu, F.; Zhao, H. Reaction Behavior of Aluminogoethite and Silica Minerals in Gibbsite Bauxite in High-Temperature Digestion. J. Sustain. Metall. 2022, 8, 360–369. [Google Scholar] [CrossRef]
  25. Shoppert, A.; Valeev, D.; Diallo, M.M.; Loginova, I.; Beavogui, M.C.; Rakhmonov, A.; Ovchenkov, Y.; Pankratov, D. High-Iron Bauxite Residue (Red Mud) Valorization Using Hydrochemical Conversion of Goethite to Magnetite. Materials 2022, 15, 8423. [Google Scholar] [CrossRef] [PubMed]
  26. Valeev, D.; Zinoveev, D.; Kondratiev, A.; Lubyanoi, D.; Pankratov, D. Reductive Smelting of Neutralized Red Mud for Iron Recovery and Produced Pig Iron for Heat-Resistant Castings. Metals 2020, 10. [Google Scholar] [CrossRef]
  27. Pankratov, D.A. Mössbauer Study of Oxo Derivatives of Iron in the Fe2O3-Na2O2 System. Inorg Mater 2014, 50, 82–89. [Google Scholar] [CrossRef]
  28. Smyth, J.R. Crystal Structure Refinement and Mössbauer Spectroscopy of an Ordered, Triclinic Clinochlore. Clays and Clay Minerals 1997, 45, 544–550. [Google Scholar] [CrossRef]
  29. Rivas-Sanchez, M.L.; Alva-Valdivia, L.M.; Arenas-Alatorre, J.; Urrutia-Fucugauchi, J.; Ruiz-Sandoval, M.; Ramos-Molina, M.A. Berthierine and Chamosite Hydrothermal: Genetic Guides in the Peña Colorada Magnetite-Bearing Ore Deposit, Mexico. Earth Planet Sp 2006, 58, 1389–1400. [Google Scholar] [CrossRef]
  30. Lempart, M.; Derkowski, A.; Luberda-Durnaś, K.; Skiba, M.; Błachowski, A. Dehydrogenation and Dehydroxylation as Drivers of the Thermal Decomposition of Fe-Chlorites. American Mineralogist 2018, 103, 1837–1850. [Google Scholar] [CrossRef]
  31. Xie, Y.; Wei, S.; Wang, X.; Xie, S.; Yang, C. A New Prediction Model Based on the Leaching Rate Kinetics in the Alumina Digestion Process. Hydrometallurgy 2016, 164, 7–14. [Google Scholar] [CrossRef]
  32. Shokri, A. Degradation of 4-Chloro Phenol in Aqueous Media Thru UV/Persulfate Method by Artificial Neural Network and Full Factorial Design Method. International Journal of Environmental Analytical Chemistry 2022, 102, 5077–5091. [Google Scholar] [CrossRef]
  33. Alex, T.C.; Kumar, R.; Roy, S.K.; Mehrotra, S.P. Towards Ambient Pressure Leaching of Boehmite through Mechanical Activation. Hydrometallurgy 2014, 144–145, 99–106. [Google Scholar] [CrossRef]
  34. Loginova, I.V.; Shoppert, A.A.; Kryuchkov, E.Yu. Kinetics Investigation and Optimal Parameters of Alumina Extraction during the Middle Timan Bauxites Leaching. tsm 2018, 63–68. [Google Scholar] [CrossRef]
  35. Jones, D.H.; Srivastava, K.K.P. Many-State Relaxation Model for the Mössbauer Spectra of Superparamagnets. Phys. Rev. B 1986, 34, 7542–7548. [Google Scholar] [CrossRef] [PubMed]
  36. Dzeranov, A.; Bondarenko, L.; Pankratov, D.; Dzhardimalieva, G.; Jorobekova, S.; Saman, D.; Kydralieva, K. Impact of Silica-Modification and Oxidation on the Crystal Structure of Magnetite Nanoparticles. Magnetochemistry 2023, 9, 18. [Google Scholar] [CrossRef]
  37. Pankratov, D.A.; Anuchina, M.M.; Spiridonov, F.M.; Krivtsov, G.G. Fe3 – ΔO4 Nanoparticles Synthesized in the Presence of Natural Polyelectrolytes. Crystallogr. Rep. 2020, 65, 393–397. [Google Scholar] [CrossRef]
  38. Goya, G.F.; Berquó, T.S.; Fonseca, F.C.; Morales, M.P. Static and Dynamic Magnetic Properties of Spherical Magnetite Nanoparticles. Journal of Applied Physics 2003, 94, 3520–3528. [Google Scholar] [CrossRef]
  39. Hadadian, Y.; Masoomi, H.; Dinari, A.; Ryu, C.; Hwang, S.; Kim, S.; Cho, B.K.; Lee, J.Y.; Yoon, J. From Low to High Saturation Magnetization in Magnetite Nanoparticles: The Crucial Role of the Molar Ratios Between the Chemicals. ACS Omega 2022, 7, 15996–16012. [Google Scholar] [CrossRef]
  40. Pankratov, D.A.; Anuchina, M.M. Nature-Inspired Synthesis of Magnetic Non-Stoichiometric Fe3O4 Nanoparticles by Oxidative in Situ Method in a Humic Medium. Materials Chemistry and Physics 2019, 231, 216–224. [Google Scholar] [CrossRef]
Figure 1. XRD pattern of the raw bauxite of the Timan deposit.
Preprints 74906 g001
Figure 2. Experimental Mössbauer spectra and models for their description for raw bauxite sample.
Preprints 74906 g002
Figure 3. Results of bauxite surface elemental analysis by SEM-EDS (a); bauxite particles with spectra points (b).
Preprints 74906 g003aPreprints 74906 g003b
Figure 4. Response surfaces for the effect of time and temperature on: Al extraction (a); Si extraction (b); Fe content in the solid residue (c); Na content in the solid residue (d).
Preprints 74906 g004aPreprints 74906 g004b
Figure 5. Response surfaces for the effect of time and L:S ration on: Al extraction (a); Si extraction (b); Fe content in the solid residue (c); Na content in the solid residue (d).
Preprints 74906 g005
Figure 6. Response surfaces for the effect of time and Na2O concentration in the solution on: Al extraction (a); Si extraction (b); Fe content in the solid residue (c); Na content in the solid residue (d).
Preprints 74906 g006
Figure 7. Response surfaces for the effect of time and initial median particle size (r0) on: Al extraction (a); Si extraction (b); Fe content in the solid residue (c); Na content in the solid residue (d).
Preprints 74906 g007
Figure 8. Pareto charts obtained using ANOVA analysis for: Al extraction (a); Si extraction (b); Fe content in the solid residue (c); Na content in the solid residue (d).
Preprints 74906 g008
Figure 9. Influence of leaching time and Al2O3 concentration in solution on Al extraction at the first stage.
Preprints 74906 g009
Figure 10. Results of atmospheric leaching of desilicated bauxite (DB) at T = 120 °C, CNa2O = 360 g L–1, CAl2O3 = 0 g L-1 and the L:S ratio = 20.
Preprints 74906 g010
Figure 11. Response surfaces for the effect of time and temperature on the Al extraction from desilicated bauxite (a); effect of duration and initial particle size on the Al extraction from desilicated bauxite (b).
Preprints 74906 g011
Figure 12. Results of elemental analysis (SEM-EDS) of the surface of desilicated under optimum conditions bauxite.
Preprints 74906 g012
Figure 13. XRD patter of the desilicated bauxite.
Preprints 74906 g013
Figure 14. XRD pattern of bauxite residue obtained by leaching of desilicated bauxite at T = 220 °C, τ = 120 min, CNa2O = 330 g L-1, CAl2O3 = 150 g L-1: m - magnetite, h - hematite, b - boehmite, r - rutile.
Preprints 74906 g014
Figure 15. Experimental Mössbauer spectra at 296 (a, b) and 78 (c, d) K for samples DB (a, c) and bauxite residue (b, d) and models for their description.
Preprints 74906 g015
Figure 16. SEM images of the BR: BSE image of BR at 50000x magnification (a); surface of the BR with element distribution maps (b).
Preprints 74906 g016
Table 1. Chemical composition of the Timan bauxite and three size fractions obtained by sieve analysis.
Fraction Main components, wt. %
Al2O3 Fe2O3 SiO2 CaO TiO2 CO2 Na2O MnO MgO K2O LOI1
Raw bauxite 52.83 25.90 6.32 0.75 2.70 0.86 0.07 0.51 0.46 0.20 9.62
–50 µm 53.60 25.74 5.76 0.49 2.71 0.86 0.06 0.45 0.42 0.18 9.74
+50–71 µm 53.09 25.84 6.13 0.67 2.71 0.86 0.07 0.49 0.45 0.19 9.51
+71 µm 52.58 25.95 6.51 0.84 2.70 0.86 0.07 0.54 0.47 0.20 9.28
1 Lost on ignition at 1000 °C.
Table 2. Semi-quantitative mineral composition of the raw bauxite.
Phase Content (%)
Boehmite 62.3
Hematite 25.7
Rutile 2.6
Quartz 3.6
Chamosite 3.4
Table 3. Parameters of the Mössbauer spectra for the samples.
Temperature, K 77.7±0.3 296±3
Sample Phase δ ε (Δ=2ε) Γexp Heff {Hext} α S δ ε (Δ=2ε) Γexp Heff {Hext} α S
mm/s kOe % mm/s kOe %
Raw bauxite 1 α-Fe(Al)2O3 0.48±0.01 -0.10±0.01 0.31±0.01 529.9±0.1 46.0±0.8 0.37±0.01 -0.11±0.01 0.30±0.01 510.8±0.1 32±1
2 0.38±0.01 -0.10±0.01 0.51±0.02 494.5±0.9 18±1
3 α-Fe(Al)OOH 0.48±0.01 -0.11±0.01 0.67±0.02 498.6±0.5 24.4±0.9 0.39±0.02 -0.15±0.02 1.31±0.07 365±2 13.7±0.6
4 Fe+3Oh 0.51±0.01 (0.86±0.01) 0.55±0.02 8.3±0.3 0.39±0.01 (0.70±0.01) 0.53±0.01 14.0±0.3
5 Fe+2Oh 1.25±0.01 (2.81±0.01) 0.31±0.01 21.3±0.2 1.13±0.01 (2.65±0.01) 0.34±0.01 21.9±0.3
DB 1 α-Fe2O3 0.48±0.01 -0.09±0.01 0.33±0.01 530.0±0.1 38.6±0.7 0.37±0.01 -0.11±0.01 0.31±0.01 509.1±0.1 31±1
2 Fe3O4 0.47±0.01 -0.05±0.01 0.52±0.01 508.0±0.4 10.74±0.05 49.0±0.7 0.35±0.01 -0.03±0.01 0.37±0.01 504±3 2.81±0.05 47±1
3 Fe+3Oh 0.46±0.02 (0.78±0.04) 0.60±0.01 2.6±0.2 0.37±0.01 (0.61±0.01) 0.46±0.01 12.4±0.2
4 Fe+2Oh 1.25±0.01 (2.8±0.01) 0.32±0.01 9.8±0.2 1.13±0.01 (2.64±0.01) 0.29±0.01 9.2±0.2
Bauxite residue 1 Fe3O4 0.36±0.01 -0.01±0.01 0.42±0.01 505.5±0.1 69.08±0.6 38±1 0.31±0.01 0.00±0.01 0.38±0.01 485.8±0.2 18.3±0.6 42.7±0.6
2 0.68±0.01 0.00±0.01 0.52±0.02 510.4±0.3 21±1 0.65±0.01 -0.02±0.01 0.47±0.01 458.9±0.3 33±1
3 0.82±0.01 -0.10±0.01 1.11±0.02 466.2±0.7 41±1 0.69±0.01 -0.02±0.01 1.11±0.03 420±1 25±1
δ - isomeric shift, ε - quadrupole shift, (Δ=2ε) - quadrupole splitting, Γexp - linewidth, Heff - hyperfine magnetic field, α – division of particle anisotropy energy by thermal energy, S - relative subspectrum area.
Table 4. Results of EDS analysis of the raw bauxite (spectra numbers are given in Figure 3), wt.%.
Spectra № O Al Fe Si Ca Ti Mn Phase
1 56.6 27.4 12.9 1.9 1.1 - - Boehmite (AlOOH)
2 46.5 14.8 36.5 1.0 0.5 0.4 0.4 Hematite (Fe2O3)
Table 5. Matrix for experiments on desillication of Middle Timan bauxite at atmospheric pressure.
Time (h) Temperature (°C) L:S ratio r0 (µm) CNa2O (g L–1) CaO addition (%) Аl extraction (%) Si extrcaction (%) Fe content (%) Na content %)
1.0 100 10 63 360 0 20.95 42.69 24.23 0.16
1.0 120 10 63 360 0 31.90 33.10 26.52 0.24
5.0 100 10 63 360 0 24.97 40.80 24.91 0.24
5.0 120 10 63 360 0 51.05 0.00 29.49 2.03
1.0 100 10 63 360 6 23.35 46.36 23.97 0.16
1.0 120 10 63 360 6 73.80 40.77 35.26 0.92
5.0 100 10 63 360 6 26.42 44.71 24.50 0.28
5.0 120 10 63 360 6 62.56 0.00 28.03 4.70
1.0 110 5 63 330 3 13.94 27.34 23.24 0.47
5.0 110 5 63 330 3 36.78 0.00 25.54 2.03
1.0 110 20 63 330 3 28.78 57.70 25.43 0.086
5.0 110 20 63 330 3 39.67 58.72 27.63 0.13
1.0 110 5 63 400 3 33.93 24.98 25.50 0.76
5.0 110 5 63 400 3 46.64 0.00 26.57 2.53
1.0 110 20 63 400 3 24.27 63.46 27.39 0.16
5.0 110 20 63 400 3 58.04 58.55 32.32 0.40
2.5 110 5 38 360 0 25.16 0.00 23.90 1.65
2.5 110 20 38 360 0 36.90 50.14 27.81 0.23
2.5 110 5 38 360 6 30.39 9.95 23.85 1.34
2.5 110 20 38 360 6 32.20 45.89 27.92 0.26
2.5 110 5 87 360 0 59.36 2.00 33.53 2.50
2.5 110 20 87 360 0 46.01 49.68 29.77 0.28
2.5 110 5 87 360 6 28.46 4.35 22.68 1.32
2.5 110 20 87 360 6 44.32 47.97 27.34 0.22
2.5 100 10 63 330 0 19.17 33.01 24.52 0.28
2.5 120 10 63 330 0 46.47 1.78 28.69 2.99
2.5 100 10 63 330 6 7.09 36.58 23.13 0.2
2.5 120 10 63 330 6 41.24 23.44 26.97 1.8
2.5 100 10 63 400 0 14.55 50.50 25.16 0.25
2.5 120 10 63 400 0 59.15 1.70 33.53 2.50
2.5 100 10 63 400 6 26.06 51.58 24.91 0.24
2.5 120 10 63 400 6 57.56 4.50 28.07 2.52
1.0 110 10 38 330 3 18.42 52.13 24.42 0.11
5.0 110 10 38 330 3 37.84 5.18 26.72 2.45
1.0 110 10 38 400 3 29.35 45.75 26.14 0.19
5.0 110 10 38 400 3 47.90 0.00 26.75 2.39
1.0 110 10 87 330 3 26.99 45.85 25.22 0.24
5.0 110 10 87 330 3 36.62 0.00 24.70 1.77
1.0 110 10 87 400 3 33.97 35.37 25.76 0.26
5.0 110 10 87 400 3 43.37 3.66 27.52 2.91
2.5 100 5 38 360 3 19.10 36.49 24.02 0.19
2.5 120 5 38 360 3 42.49 4.03 28.70 2.15
2.5 100 20 38 360 3 32.72 48.51 26.68 0.20
2.5 120 20 38 360 3 75.57 58.20 42.86 0.66
2.5 100 5 87 360 3 14.61 6.72 23.03 0.43
2.5 120 5 87 360 3 47.95 3.93 26.91 2.50
2.5 100 20 87 360 3 27.75 47.49 25.47 0.19
2.5 120 20 87 360 3 54.14 55.60 31.31 0.30
2.5 110 10 63 360 3 31.81 43.88 26.43 0.31
2.5 110 10 63 360 3 32.54 44.48 26.43 0.31
2.5 110 10 63 360 3 32.84 44.73 26.43 0.31
2.5 110 10 63 360 3 26.66 38.25 26.67 0.52
2.5 110 10 63 360 3 33.99 45.96 29.14 0.35
Disclaimer/Publisher’s Note: The statements, opinions and data contained in all publications are solely those of the individual author(s) and contributor(s) and not of MDPI and/or the editor(s). MDPI and/or the editor(s) disclaim responsibility for any injury to people or property resulting from any ideas, methods, instructions or products referred to in the content.
Copyright: This open access article is published under a Creative Commons CC BY 4.0 license, which permit the free download, distribution, and reuse, provided that the author and preprint are cited in any reuse.
Prerpints.org logo

Preprints.org is a free preprint server supported by MDPI in Basel, Switzerland.

Subscribe

© 2024 MDPI (Basel, Switzerland) unless otherwise stated