Preprint
Article

Dynamic Fitting Strategy for Physiological Models: A Case Study of Cardiorespiratory Model for Simulation of Incremental Aerobic Exercise

Altmetrics

Downloads

125

Views

45

Comments

0

A peer-reviewed article of this preprint also exists.

Submitted:

29 May 2023

Posted:

31 May 2023

You are already at the latest version

Alerts
Abstract
The use of mathematical models of physiological systems in medicine has allowed the development of diagnostic, treatment, and medical educational tools, but their application for predictive, preventive, and personalized purposes is restricted by their complexity. Although there are strategies that reduce the complexity of applying models by fitting techniques, they focus on a single instant of time, neglecting the effect of the system's temporal evolution. The aim of this work is to propose a dynamic fitting strategy of physiological models with large number of parameters and a constrained amount of experimental data, focused on obtaining better predictions based on the system's temporal trend and useful to predict future states. It was applied in a cardiorespiratory model as a case study. Experimental data from a longitudinal study of healthy adult subjects under aerobic exercise were used for fitting and validation. The model predictions obtained at steady-state using the proposed strategy and the nominal values of the parameters were compared. The best results corresponded mostly to the proposed strategy, mainly regarding the overall prediction error. The results evidenced the usefulness of the dynamic fitting strategy, highlighting its use for predictive, preventive, and personalized applications.
Keywords: 
Subject: Engineering  -   Bioengineering

1. Introduction

The increase and variety of chronic diseases, the consequences of the reactive medical approach, and the unsatisfactory results of generic diagnoses and treatments suggest the need for a predictive, preventive, and personalized medical paradigm [1,2]. It is based on integrating healthcare personalization concepts, anticipation and risks assessment, and determination of optimal treatment based on predictive tools [2,3]. Among its applications, those that predict the personalized health status and the risk of presenting pathologies based on physiological information stand out [4,5,6].
The mathematical modeling and computational simulation of physiological systems is a support tool for medical science, whose application has allowed the evaluation of clinical treatments, the development of training tools and medical education, and the design of medical equipment [7,8,9,10]. These applications are possible due to models’ ability to predict clinically critical physiological variables considering different conditions, subjects, and stimuli. The detailed description of the elements, functions, and interactions stand out among its characteristics, differentiating it from other prediction tools and allowing the correct understanding of complex regulations and physiological processes [11,12].
The models of the cardiorespiratory system stand out as one of the most relevant for clinical applications because their predicted variables are the result of complex regulatory processes aimed at maintaining homeostasis, whose analysis is essential for the diagnosis, monitoring, and treatment of different diseases [13,14,15]. Nowadays, there are several studies focused on verifying and using cardiorespiratory models in different situations, including exercise [16,17], cardiovascular surgeries [18], respiratory disorders [19,20], mechanical ventilatory support [21,22], and others. Among these situations, physical exercise is especially important for diagnosis and clinical prediction because it is a natural stimulus that generates significant variations of the related systems and whose simulation results are characterized for healthy human subjects [23,24].
Despite the advantages and variety of validated mathematical models of physiological systems, their usefulness in medical practice, especially under the predictive, preventive, and personalized approach, is restricted by different factors. One of the most important is the mathematical complexity, which is greater as precision and biological relevance increase, and is related to a large number of parameters that are difficult to measure experimentally [11,12]. Although there are reported nominal values of parameters for the model simulation, these were obtained under specific experimental conditions and subject characteristics. Their use for predictions gives a constrained and general idea of the physiological system dynamics, neglecting the properties that vary between people and conditions [11].
There are reported fitting techniques that, based on experimental data such as vital signs, allow the personalization of models. They are related to the identification of parameters that are difficult to measure experimentally [12,25,26]. Even so, these techniques only focus on identifying constant characteristics, so the usefulness of the fitted models is constrained to the static prediction of the physiological response.
In this context, a correct application of physiological models as a predictive, preventive, and personalized medicine tool would involve a strategy to continuously optimize and customize their parameters as a function of time. There are reported works in which a continuous optimization of model parameters is considered to account for the effect of time on the change in the systems’ behavior, obtaining good prediction results for applications related to electronic, control, and image processing systems [27,28,29,30]. This approach, known as time-varying systems modeling, has also been applied to models of physiological systems, but, its application has focused mainly on small models (i.e., a single system model described by a small number of equations), for which the experimental data are directly related to the prediction of the interest variables [31]. Although its application could be extended to more complex models, in which a complete self-regulation of the system is considered, and the responses of different physiological variables are evaluated, this approach assumes that predictions at each time instant depend on the directly related parameters. Therefore, its use neglects the possibility that the changes in the system responses are due to the closed-loop effect of other mechanisms, systems, or controllers, in which the parameter optimizations are related to a better fit of the model.
This work aims to propose a novel strategy for the dynamic fitting of physiological models with complete self-regulation. This strategy will help to predict the future state of the modeled physiological system under the consideration of a large number of parameters and a limited amount of experimental data for fitting. This strategy is composed of the following procedures: a) the dynamic fitting of the physiological model, b) the modeling of the parameters’ time trend, and c) the strategy validation considering the future steady-state response of the modeled physiological system. As a case study, the application of the strategy in a cardiorespiratory model under dynamic aerobic exercise is described in detail. Experimental records obtained from a longitudinal study were used as evaluation scenarios from a population and personalized perspective.
This work is structured as follows. First, the dynamic fitting strategy is presented, including identifying the parameter values at different time instants, modeling their temporal trend, and validating its use to predict future states of the modeled physiological system. Subsequently, the case study is presented, including the qualitative description of the cardiorespiratory model, the experimental data, the computational implementation, and the data analysis. Then, the results of each procedure are presented for the two fitting scenarios, focusing on the strategy validation. Finally, the results of the proposed strategy are discussed.

2. Materials and Methods

2.1. Dynamic Fitting Strategy

The proposed strategy is based on the consecutive application of a static fitting technique of physiological models based on experimental observations of a longitudinal study. The fitting technique should focus on finding the model parameter values that minimize the differences between the predictions and experimental data in each instant. As physiological systems modify their characteristics over time due to natural biological degradation and factors related to different habits, events, and diseases [32,33,34,35,36], the proposed strategy uses the longitudinal results of the static fit of the models. Thus, the variations of the optimized parameters values at different instants expose the temporal changes of the physiological system characteristics, wherein the modeling of their time-trend allows predicting future parameters values.
The strategy includes procedures of dynamic fitting of the physiological model, modeling the time-trend of parameters as a function of their previous results and related factors, and validating the model simulation results using predicted parameter values. These procedures are explained in detail in the following sub-sections.

2.1.1. Dynamic Fitting of the Physiological Model

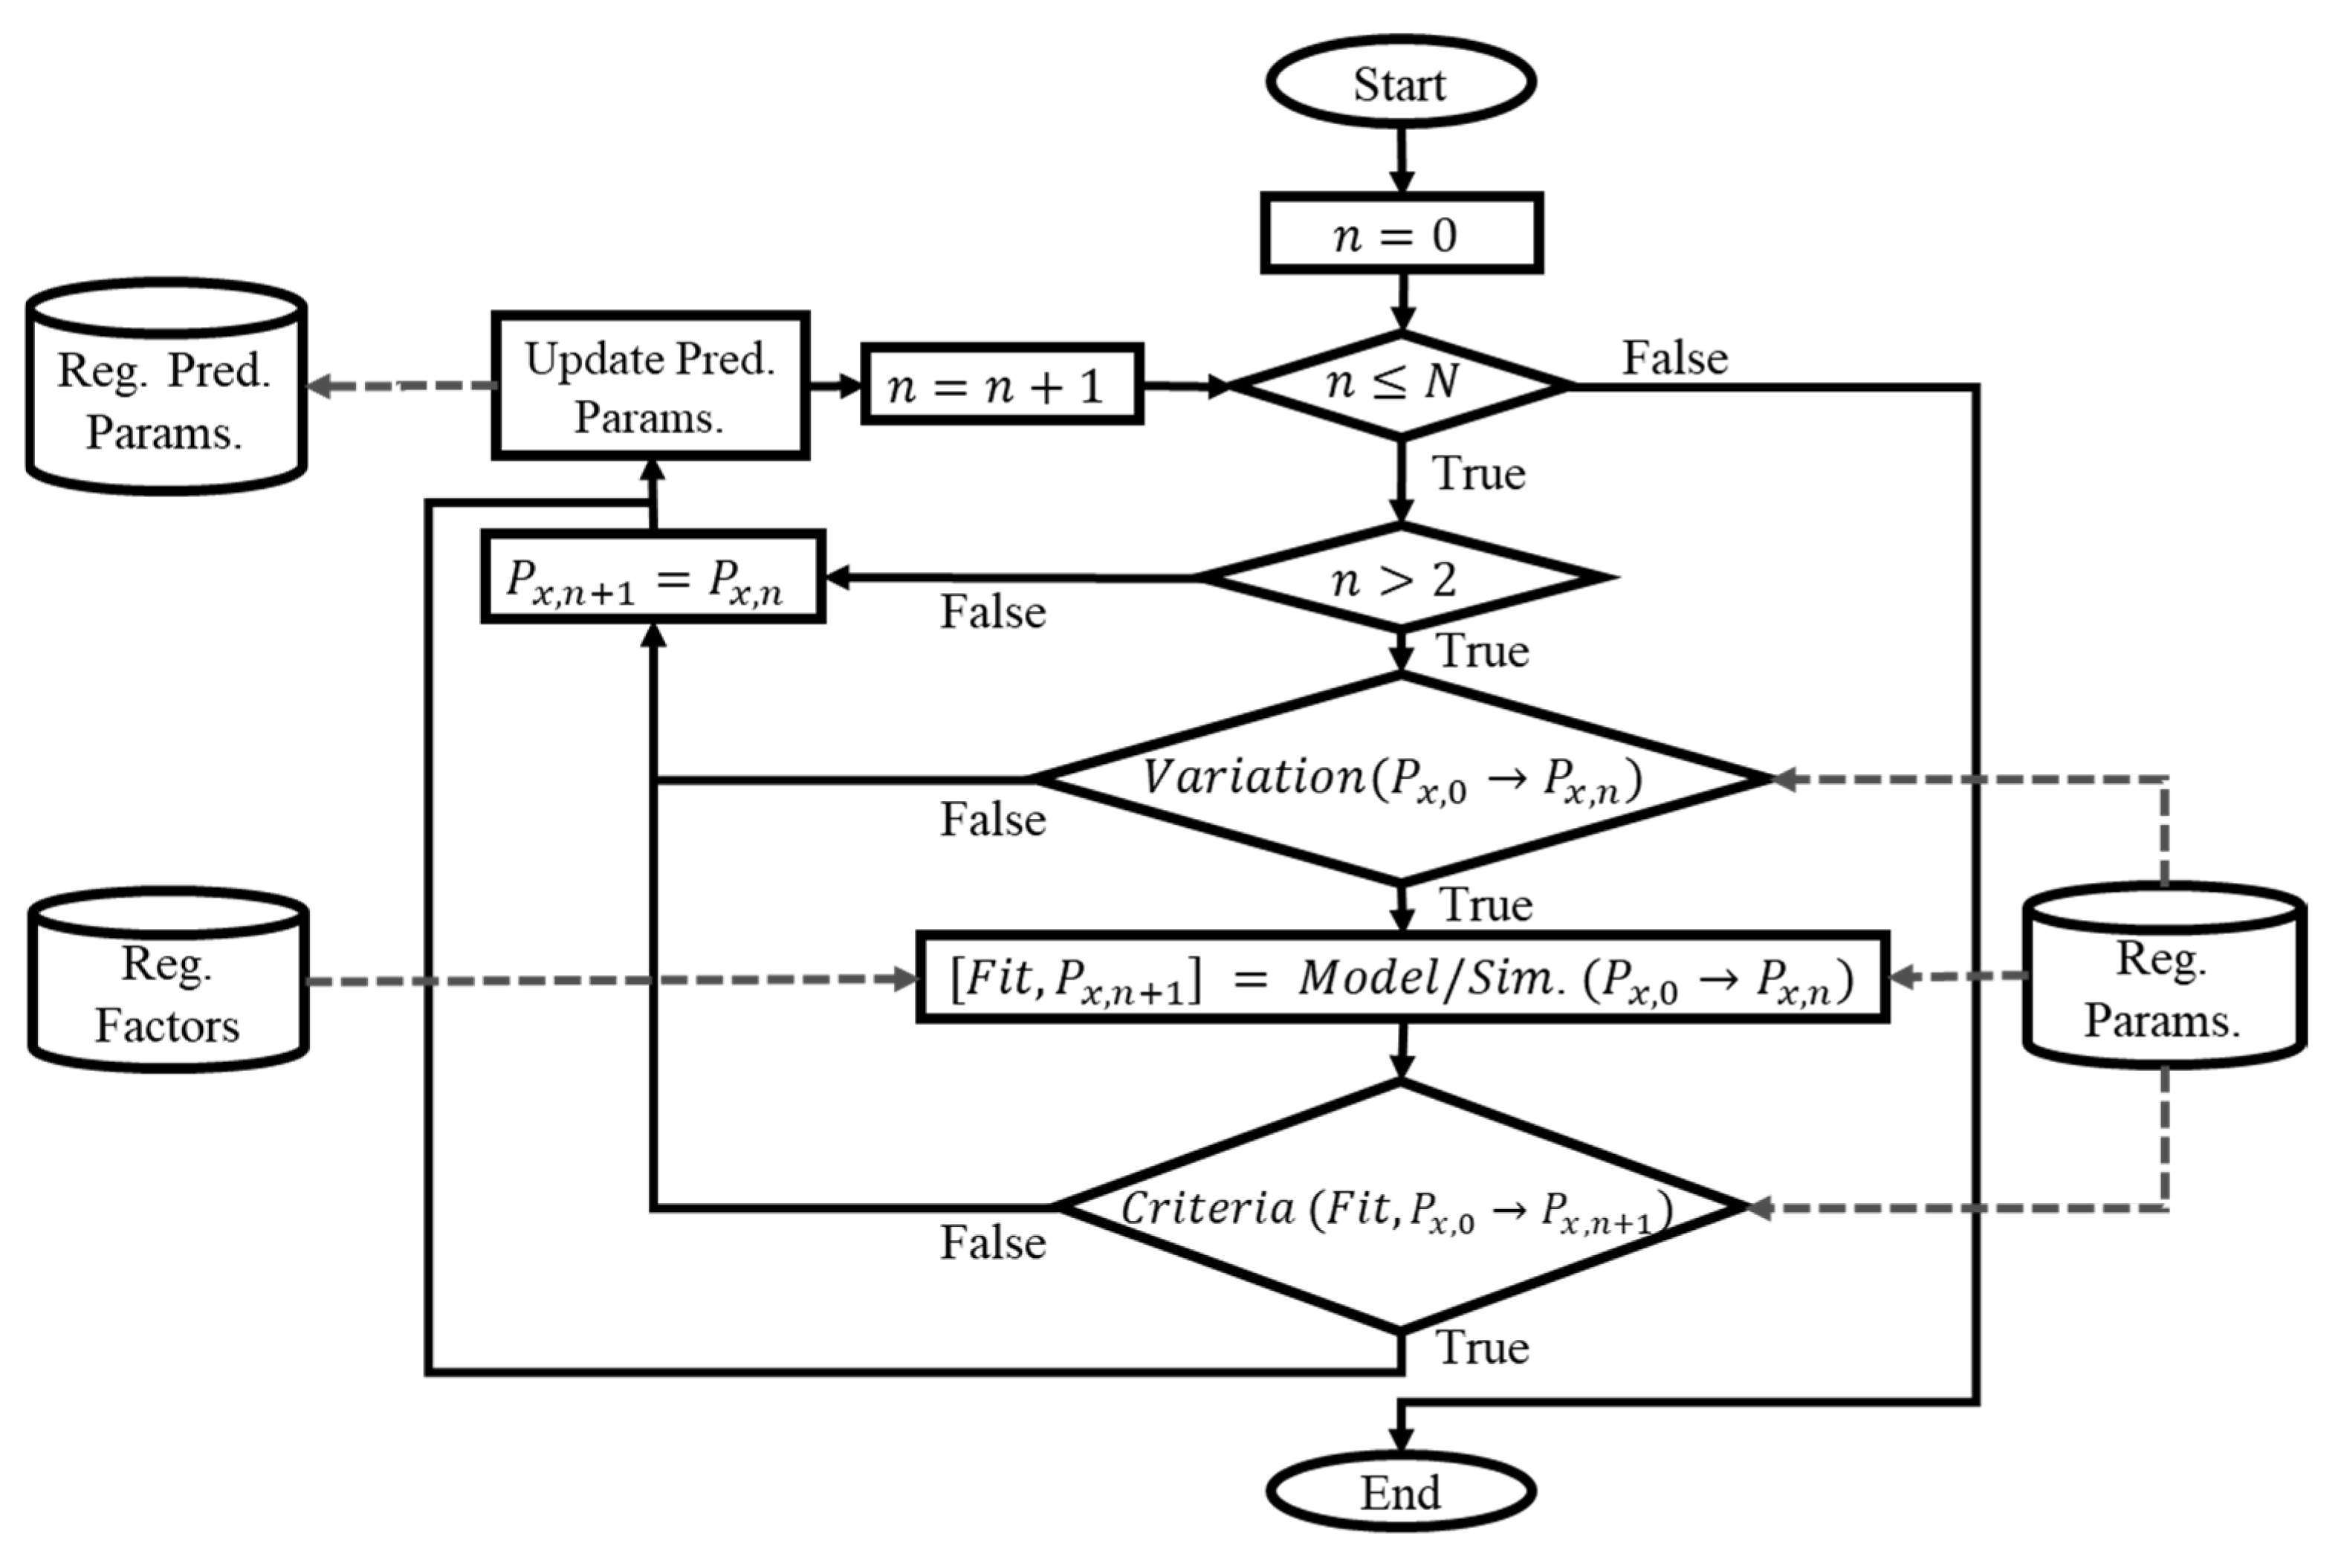
This procedure focuses on obtaining the parameter optimizations that fit the physiological model at different instants regarding experimental observations from a longitudinal study. The number of results will depend on the number of study samples ( N ) since each one ( n ) corresponds to a static fit of the model regarding the data recorded at each instant of time ( Exp .   Data   t n ). It is composed of different sub-processes that must be applied sequentially in time, considering that the results will reflect the temporal evolution of the physiological system for the same subject or population. The first fit ( n = 1 ) is based on the nominal values of the model parameters and the subsequent ones on the immediately preceding optimization result (Params. t n 1 ). The procedure also involves the temporary recording of the parameter optimizations’ results (Reg. Params.) and experimental information related to factors that significantly influence the modeled system (Reg. Factors), useful for the subsequent dynamic parameter modeling procedure. Figure 1 shows the general flowchart for the dynamic fitting of the physiological model.
Physiological systems models are highly complex, as demonstrated by their large number of parameters. Attempting to fit them using a limited amount of experimental data can be computationally expensive and results in multiple optimization solutions that lack physiological meaning [12]. For this reason, the proposed procedure is based on the sequential application of a static fitting and validation strategy of physiological models aimed at solving those problems [37]. It is based on techniques of complementary approaches of classification, selection, and optimization of a reduced set of parameters, allowing predictions with adequate precision and accuracy for models under the consideration of a large number of parameters and different stimuli and populations. The effectiveness of this procedure has already been tested in a case study involving a comprehensive cardiorespiratory model.
The main sub-procedures, corresponding to the standardization of the simulation conditions, the classification and selection of parameters, and the parameter optimizations, are described below. Each is based on different techniques and must be applied sequentially for a single fitting procedure. The reader can refer to the paper on the static fitting and validation strategy for full details [37].
Standardization of simulation conditions
It consists of modifying the values of the model parameters by those that can be obtained from the experimental observations (the result is related to the first Update params. process in Figure 1). As a result, the simulation conditions of the model are closer to those used as a reference for the fit, and the computational cost is reduced by not considering the subsequent optimization of the modified parameters. The replaced values are generally related to the characteristics of the subjects, the stimulus evaluated, or the environmental conditions. The parameters unchanged during the standardization, which cannot be associated with the available experimental measures, remain equivalent to the nominal values. Then, they will be subsequently considered in the classification and selection sub-procedures.
Classification and Selection of Parameters
It aims to reduce the complexity of the optimization problem by identifying the reduced set of parameters most representative to be used during the model fitting [37]. It initially consists of classifying parameters based on their role, identifiability, sensitivity to variations, and relationship with the evaluated stimulus. Subsequently, the resulting parameters are selected according to different fitting approaches.
The classification by role consists of grouping the parameters into five sets according to the functions generally found in physiological models, corresponding to time constants, conversion parameters, covariates, initial values, and gain and thresholds. Considering that the implemented static fitting strategy focuses on adjusting the model predictions in steady-state, only the sets of parameters with the role of gain and threshold, whose variations have physiological sense, are selected for the application of the subsequent classification techniques.
The following classification is related to the application of the techniques of subset selection and analysis of the sensitivity. Both generate rankings for the classification of the parameters considering different and complementary criteria. The subset selection classifies the parameters according to how well-conditioned they are to be identified [38]. The sensitivity analysis technique ranks them according to their variation effect in the model predictions [12]. Both are based on measures of finite differences obtained from simulated data. According to the static fitting strategy, their application involves improvements that allow evaluating different levels of stimulus and parameter values and considering the error contribution regarding the experimental data [37].
Finally, selection criteria are applied to define which classified parameters will be considered for optimization. According to the referenced strategy, the selection of the parameters is related to three different optimization processes that must be applied sequentially [37]. The first one corresponds to the base fitting approach of the model, for which parameters with the best results of subset selection and the highest total sensitivity are selected. The second one is the specific fitting approach, for which the parameters with the best relative sensitivities for each variable, which, in turn, have a non-significant effect concerning the others, are selected. The third one is related to the stimulus, wherein the parameters that measure the impact of relevant mechanisms, based on their classification by role, are selected.
Parameters Optimization
It involves identifying the values of previous selected parameters that reduce the difference between the model predictions and the experimental data [31] (the result is related to the second Update params. process in Figure 1). This procedure consists of solving an optimization problem, in which the result is related to the selection and parametrization of an optimization algorithm, the definition of evaluation ranges of parameters, and the choice of a metric to evaluate the prediction error [26]. According to the referenced static fitting and validation strategy, three optimization stages must be applied sequentially, each related to each parameter selection criteria. The first stage corresponds to the base fitting approach and is based on the identification of the most significant parameters of the model. The second stage consists of the specific fitting approach, which aims to reduce the prediction error of each variable without significantly affecting the result of the others. The last stage is the stimulus-related fitting approach, which focuses on bringing the behavior of predictions closer to what is expected by modifying the related mechanisms.

2.1.2. Dynamic Parameter Modeling

Its objective is to model the temporal trend of the parameters so that their simulation results build the prediction of a future fit of the physiological model. There is no specific structure defined for this modeling. Still, applying autoregressive techniques is recommended considering their simplicity and the cumulative effect regarding time and other factors on physiological systems [32,33,34,35,36]. Therefore, the design of a MISO (Multiple-Input Single-Output) model is proposed for each parameter. This latter allows predictions based on their past values and the temporal record of significant factors such as habits, events, or diseases.
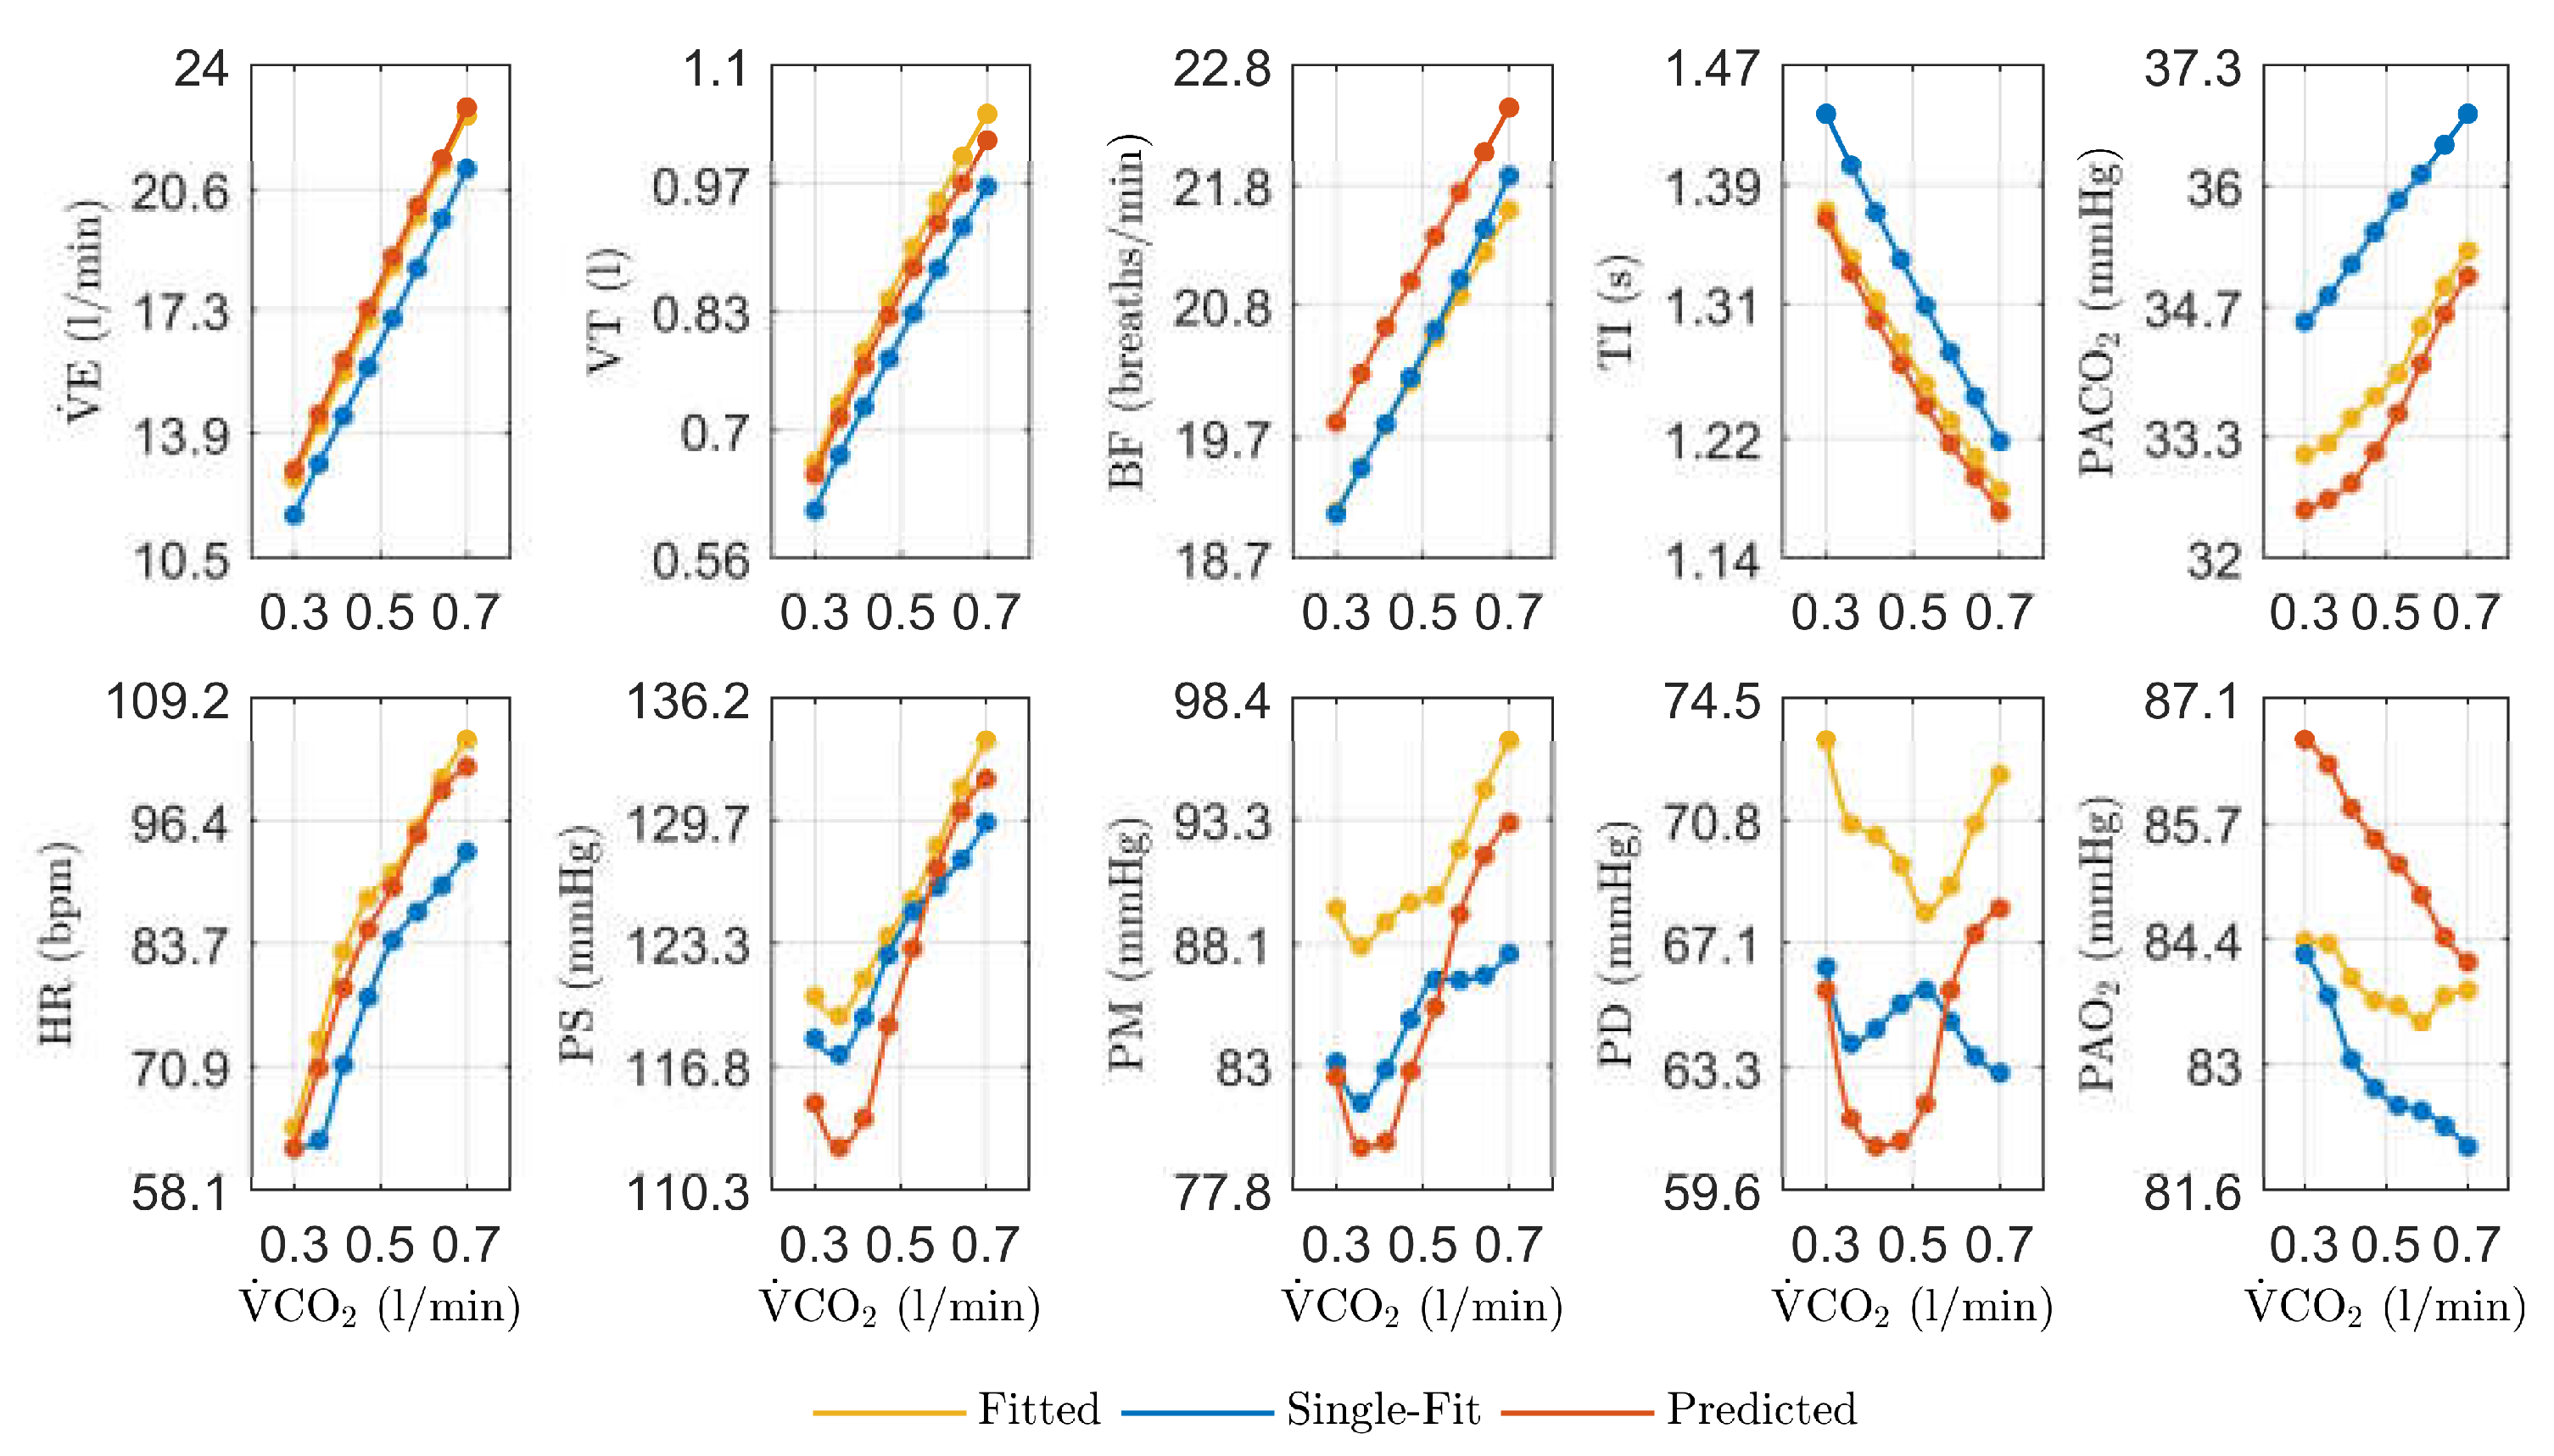
Figure 2 shows the general flowchart for the dynamic modeling of one parameter ( P x ). This procedure focuses on predicting and storing its value (Reg. Pred. Params.) at the next instant of time ( n + 1 ) regarding the samples used for modeling ( 0 n ). N denotes the total number of time instances available. Only the parameters that modify their value as a result of the dynamic fitting procedure ( V a r i a t i o n ( P x , 0 P x , n ) ) are modeled and simulated ( M o d e l / S i m . ), the others remain with previous defined value (the nominal value for the parameters that are not modified as a result of the standardization of the simulation conditions). Similar to the optimization process, it is essential to note that the predictions of the parameters could lack a physiological justification and should be evaluated before being accepted. The goodness-of-fit measures of the models and the rate of change of the values can be used as a criteria to define the use of the predictions or keep the previous values ( C r i t e r i a ( F i t , P x , 0 P x , n ) ).

2.1.3. Validation

This procedure focuses on evaluating the result of the proposed strategy from the approach of predicting the future fit of the physiological model. For this purpose, the experimental values of the variables at each instant are compared against the respective predictions of the physiological model using three sets of parameters: (a) the predicted parameters, (b) the parameters fitted for the used experimental data for each time instant, and (c) the parameters resulting from the traditional single-fit approach, which consists of a population fit in a single instant of time (the first optimization process).
Considering that the sequentially implemented static fitting strategy does not involve the response in a transitory regime, criteria of precision, accuracy, and direction of the physiological model predictions are only evaluated once the steady-state of the variables is reached. This involves the selection and use of a metric that allows the assessment of the model’s performance, usually associated with the calculation of the prediction error.

2.2. Case Study

2.2.1. Cardiorespiratory Model

The mathematical model is a compartmental self-regulated model of the cardiorespiratory system. It comprises 316 parameters and 170 equations distributed in different mechanisms that are integrated to represent the cardiovascular circulation system, the respiratory mechanics system, the gas exchange system, and the respiratory and cardiovascular controllers. It is the result of the adaptation of different previous models reported of systems, controllers, and mechanisms. It has been fitted and validated regarding experimental data from healthy adult subjects under conditions of resting and incremental aerobic exercise [37].

2.2.2. Experimental Data

The experimental data used to evaluate the strategy correspond to signals and measurements from cardiorespiratory variables recorded in an observational and longitudinal study. This was based on an incremental, submaximal, and multistate cardiopulmonary exercise test performed using a programmable cycle ergometer under controlled environmental conditions. The duration of the test was 45 minutes, divided into five stages: rest (2 minutes), warm-up (4 minutes), exercise (25 minutes), recovery (9 minutes), and final rest (5 minutes). Five consecutive steps with load increments of 25 W, each five minutes, and at a constant pedaling speed of 60 RPM were carried out during the exercise stage.
The recorded information was divided into two databases to analyze the usefulness of the dynamic fitting strategy from a population and personalized perspective. The first database (DB1) corresponds to the longitudinal record of twenty-seven male adult volunteers in three different instants with more than six months of difference between them. The second database (DB2) corresponds to the records of three male adult volunteers matched by the degree of consanguinity, medical history, and lifestyle but with different ages, which is proposed as an approximation of the longitudinal record of the same subject at six different stages of his life, and which is consistent with the approach of stratified medicine [39,40,41,42]. These subjects are male members of the same family, corresponding to the father and his two sons, who live together and have similar habits. The first two records correspond to the youngest subject, the next three to his brother, and the last one to his father.
All participants were considered healthy, with a physical fitness that included both sedentary and accustomed to physical training subjects, non-smokers, no history or symptoms of cardiovascular, pulmonary, metabolic, or neurological diseases, and without pacemakers or other implanted electrical stimulators. The records are composed of signals of oxygen uptake (   V ˙ O 2 ), carbon dioxide output (   V ˙ CO 2 ), total minute ventilation (   V ˙ E ), inspiratory time (TI), tidal volume (VT), breathing frequency (BF), heart rate (HR), alveolar oxygen partial pressure ( PAO 2 ) and alveolar carbon dioxide partial pressure ( PACO 2 ); measurements of systolic blood pressure (PS), diastolic blood pressure (PD), and mean arterial blood pressure (PM). Records comprised of characteristics of the environment, such as the atmospheric pressure ( P atm ), inspired fraction of dry CO 2 ( FiCO 2 ) and inspired fraction of dry O 2 ( FiO 2 ).
Quantifiable information related to factors other than age, reported as significantly influencing the cardiorespiratory system, was also recorded. These data account for habits such as diet [33], physical activity [35], and quality of sleep [34,43], related to measures of the body mass index, average hours of weekly physical activity, and average hours of daily sleep, respectively. Other relevant factors, such as accidents or illnesses, habits such as smoking, or family history of illnesses, are not reported considering that they were considered as exclusion criteria. The use of medication was only reported by the oldest subject of the DB2 and is related to blood pressure control.
Table 1 presents the information recorded for each database related to environmental conditions, characteristics of volunteers, and factors mentioned above. The data presented for DB1 correspond to the mean and standard deviation of the measurements.
All procedures were approved by the Human Research Ethical Committee of the Department of University Research (SIU) of the University of Antioquia (approval certificates 16-59-711, 17-59-711, and 18-59-711). They are conformed to the Declaration of Helsinki. The written consent of all volunteers was obtained after giving them complete information about the experimental protocol and the related risks.

2.2.3. Computational Implementation and Data Analysis

The experimental values of   V ˙ O 2 and   V ˙ CO 2 were used as model inputs to simulate the levels of the stimulus of exercise. This implementation has been applied to simulate aerobic exercise in physiological models [18,44,45,46]. It is justified because the physiological response under this stimulus is directly related to metabolic gas rates of O 2 consumption and CO 2 production, which is directly affected by the workload during exercises (the physiological model does not consider the workload as a model input).
The average of each measurement during the last minute for each subject (except for PS, PM, and PD) was used as a representative sample of each phase of the exercise test at steady-state conditions. All experimental data were restricted using   V ˙ CO 2 as a reference, starting at 0.3 l/min, considered the state of rest, coinciding with the common minimum value for records of all subjects, and ending at the respective calculated value of AT (Anaerobic threshold) because the model is defined only for aerobic exercise.
The parameters values used as reference in each parameter temporal fit of the model corresponded to the immediately preceding optimization result, except for the first fit of each database, in which the nominal values reported in [47] were used (traditional single-fit approach).
The simulation time for each stimulus level was 2000 s, which was enough to guarantee the reported settling time measure of all variables evaluated [47]. The model responses in steady-state corresponded to the mean values of each variable at the last minute of each simulated stimulus level.
The model simulations and data processing were implemented in SIMULINK/MATLAB®. The computational characteristics for the simulation were the same as reported for the model validation, corresponding to the numerical solver ODE23 (Bogacki and Shampine BS23 algorithm for solution of ordinary non-rigid differential equations) and variable step size between 1 x 10 2 s and 1 x 10 3 s. The simulations were run once due to all the model equations are determinists. The specific implementation characteristics for each procedure are described below.
Dynamic Model Fitting
Standardization of simulation conditions
The parameters of the physiological model that were assigned according to experimental data corresponded to FiO 2 , FiCO 2 , P atm , basal respiratory tidal volume ( VT n ), anaerobic threshold ( AT ), total blood volume ( V tot ) and constant values of unstressed blood volumes. FiO 2 , FiCO 2 and P atm account for the environmental conditions, were considered constant in all records and equal to 640 mmHg, 0.0421 %, and 21.0379 %, respectively. Values of VT n , AT , V tot and the unstressed blood volumes are related to specific characteristics of the subjects. The value of VT n was determined from VT measurements; AT was calculated using the noninvasive technique v-slope [20,48]. V tot in ml was also estimated for each record as a function of the body surface area (BSA) in m 2 according to the Equations (1) and (2) [49,50]. Finally, the parameters related to the unstressed blood volumes were calculated using the proportion of their reported nominal values regarding V tot [47].
BSA = ( Weigth · High ) 3600 ,
V tot = 1000   ( 3.29 · BSA   1.29 ) ,
The values of VT n , AT and V tot used for the standardization of each fit are presented in Table 2. The data presented for DB1 correspond to the mean and standard deviation, except for AT whose value corresponds to the median and interquartile range considering the data distribution.
Classification and Selection of Parameters
Steady-state simulation results for variations of stimulus level and parameter values were used for classification techniques. The number, order, and values of stimulus levels and parameter variations were the same as reported for the static fitting strategy previously applied to the same model [37]. Three simulated exercise stimulus levels (using   V ˙ O 2 and   V ˙ CO 2 as model inputs) were evaluated as incremental steps, corresponding to states of rest, an intermediate level of exercise, and A T . Five uniformly distributed percentage variations in a range of ± 5% of the reference value were evaluated for the selected parameters.
Regarding the selection, the fitting approach related to the stimulus was not applied because its result does not represent a significant decrease in the prediction error, and the exercise mechanisms had already been fitted for the model [37]. The selection criteria and the number of parameters defined were also the same as those reported for the model according to the static fitting strategy.
Parameters Optimization
The optimization algorithm implemented corresponds to the evolutionary strategy with covariance matrix and adaptation (CMA-ES). It is a stochastic global optimization algorithm based on adaptive and evolutionary strategies [51]. It was selected considering the reported results of convergence speed, precision, and accuracy for the fitting of the case study model [37] and other related ones [26]. The parameter values used for implementing CMA-ES algorithm are the same as those reported for the model according to the static fitting strategy [37].
The evaluation ranges for the parameter optimizations were in accordance with the static fitting strategy [37]. The parameter values reported as nominal for the model were used as variation reference [47]. It was established as a general evaluation range of ± 30% regarding the nominal value, expanded to ± 50% only for weighting parameters that are unrelated to direct physiological measures. These ranges were modified according to the information reported about optimization results or physiological sense (values with physiological justification).
The evaluated model predictions corresponded to the simulation results in steady-state under eight consecutive, equidistant, and incremental steps of the values of   V ˙ O 2 and   V ˙ CO 2 between rest and AT. The experimental data for comparison were the same as the parameter’s classification procedure. The cost function implemented corresponds to Equation (3), the same RMSE-based metric used for the reported fit of the case study model [37].
CF = 1 I i = 1 I 1 K k = 1 K ( y exp i , k y sim i , k y exp i , k ) 2   ,
Where CF denotes de cost function for the model; y exp and y sim represent the experimental and simulated values of the variable, respectively; I and K denote the number of variables and stimuli levels; the subscripts i and k indicate each variable and stimulus level.
Dynamic Parameter Modeling
The parameter values corresponding to five records were predicted for the case study. For DB1 the optimized parameter values of the record three were predicted, and for DB2 the optimized parameter values of the records from three to six were predicted. Only the parameters that presented variations in their value due to the previous fit procedures were modeled (dynamic parameters). The others remain with their same value (nominal value or standardization result of the simulation conditions).
Deterministic and parametric MISO models were implemented for each dynamic parameter. The implemented model structure corresponded to an ARX model (autoregressive with exogenous input), selected to consider the effect of the past values of the outputs and inputs on the current value [31]. Equation (4) corresponds to the representation of the model structure.
A ( q ) P ( t ) = i = 1 I B i ( q ) F i ( t n k i ) + e ( t ) ,
Where P represents the value of the parameter at each instant of time; F i is the i th input, which is associated with the factors evaluated; A and B are polynomials expressed in the time-shift operator q 1 and are related to the parameter and the inputs, respectively; I is the total number of inputs; n k i is the input delay; and e ( t ) is considered random noise.
As inputs of each model, the time between records, the average weekly physical activity, the average daily sleep hours (Table 1), and AT (Table 2) were used. The time was considered as the accumulated difference between the ages in each record, assigning the value zero to the first fit of the model for each database. The AT values were used because they account for the metabolic response of the subject to cardiorespiratory changes [48,52]. Except for time, the values of the inputs of the previous record were considered as the equivalent values in the record to be predicted.
Different model orders associated with the polynomials were evaluated for each parameter, and the model with the best fit was selected. The past values of the parameter and the inputs were interpolated, considering that the design of the models requires constant sampling times. Sampling times between 0.1 and 0.4 years were evaluated in this work considering the temporal difference between records for each fit. The orders of polynomials A and B were evaluated from zero to the maximum number of samples available. n k i was considered zero regarding all inputs due to the limited number of available records. The coefficients of the polynomials for each model were estimated using the least-squares method. The best-order selection was based on applying Akaike’s Information Criterion (AIC) according to Equation (5).
AIC = log ( V ) + 2 d N   ,
Where V is the loss function (normalized sum of squared prediction errors), d is the total number of parameters in the structure in question, and N is the number of data points used for the estimation.
Criteria based on the goodness of fit of the models and on the variation of the predicted value regarding a bounded range were applied to evaluate the physiological justification of the predictions. Model with goodness of fit less than 60%, with the sign change, or variations greater than 50% regarding the range of recorded values were discarded, and the values corresponding to the immediately previous record were used instead.
Validation
The validation consisted of comparing the simulation results of the case study model using the optimized parameter values for the records (from the dynamic fitting of the physiological model), the predicted values (from the dynamic parameter modeling), and the nominal values. The experimental values of variables for the respective record were used as reference. These comparisons were aimed at demonstrating the usefulness of the dynamic fitting strategy from the perspective of predicting the future state of the modeled system against the traditional approach of using population fit results in a single instant (single-fit).
The model performances were evaluated by the measure of the prediction error (PE) regarding the steady-state experimental measures of the cardiorespiratory variables. The metric used to calculate the PE corresponds to Equation (6), which is a modification of the Mean Absolute Error (MAE) that allows an interpretation of the differences as a proportion of the experimental data. It consider the error for each subject, variable and level of stimulus; and it is the same reported in the validation work of the case study model [37].
PE ( % ) = 100 · 1 N j = 1 N ( Median i , k ( | y exp i , j , k y sim i , j , k y exp i , j , k | ) ) ,
Where y exp is the experimental variable value; y sim is the simulation prediction value; N denotes the number of variables; the subscripts i, j and k are indexes that represent each subject, variable, and stimulus level, respectively.

3. Results

3.1. Dynamic Fitting of the Physiological Model

Table 3 shows the PE results for the model fitted to each record of the databases. The results regarding the variables correspond to the median and the interquartile range.
For both databases, it is observed that the highest PE values are generally related to the respiratory variables and the lowest to the gas exchange variables. More specifically, DB2’s fittings generally show results with lower variabilities and lower overall PEs. It is also highlighted that the highest values of overall PE in DB2 are related to the most significant changes in the cardiorespiratory system according to the proposed approach (section 2.2.2. Experimental Data).

3.2. Dynamic Parameter Modeling

Table 4 and Table 5 compare the parameter predictions (Pred.) with the optimized results (Fitted) for the records evaluated of each database. The results for each parameter are grouped according to the directly related system or controller. The definition and description of each parameter are not presented in this section for brevity reasons. The interested reader can refer to the work of the case study model for complete details [47]. The symbol (*) indicates that the parameter was not predicted for the record because there was no modification regarding previous values, but it was optimized for the evaluated record. The symbol (**) indicates that the predicted value did not satisfy the physiological justification criteria and, therefore, the value from the previous record was used instead.
Most of the parameters optimized for DB1 show slight differences regarding the predicted ones and those that were not modified (*) (variations less than 10%). Therefore, similar simulation results could be expected. In this case, all predictions were in accordance with the defined physiological justification criteria, which suggests good fits for the restricted number of samples, and predictions with consistent variations considering the prediction time and the input data.
From the results related to DB2, it was observed that the number of non-modeled parameters (*) decreases with the number of samples, which is related to a greater coverage of prediction of the physiological characteristics related to cardiorespiratory variations. Even so, the predictions that did not satisfy the physiological justification criteria increased in the last two records (**), related to lower goodness-of-fit measures and most significant variations, mainly for record six, considering the longer prediction time. The most significant differences were obtained for the respiratory controller parameters due to the results of the static fit in each record. They could be related to higher reported errors of the physiological model regarding the respiratory variables [37].

3.3. Validation

The validation results correspond to the comparison of simulations in steady-state and the PE values in each instant evaluated. The compared simulations correspond to those obtained by using the set of parameters resulting from the predictive approach (Predicted) against those of the traditional single-fit approach (Single-Fit). The model-specific fit results for each record in the databases are presented as reference (Fitted). For the PE results, in addition to the overall value, mean, median, interquartile range, and statistically significant differences among predictions are presented.
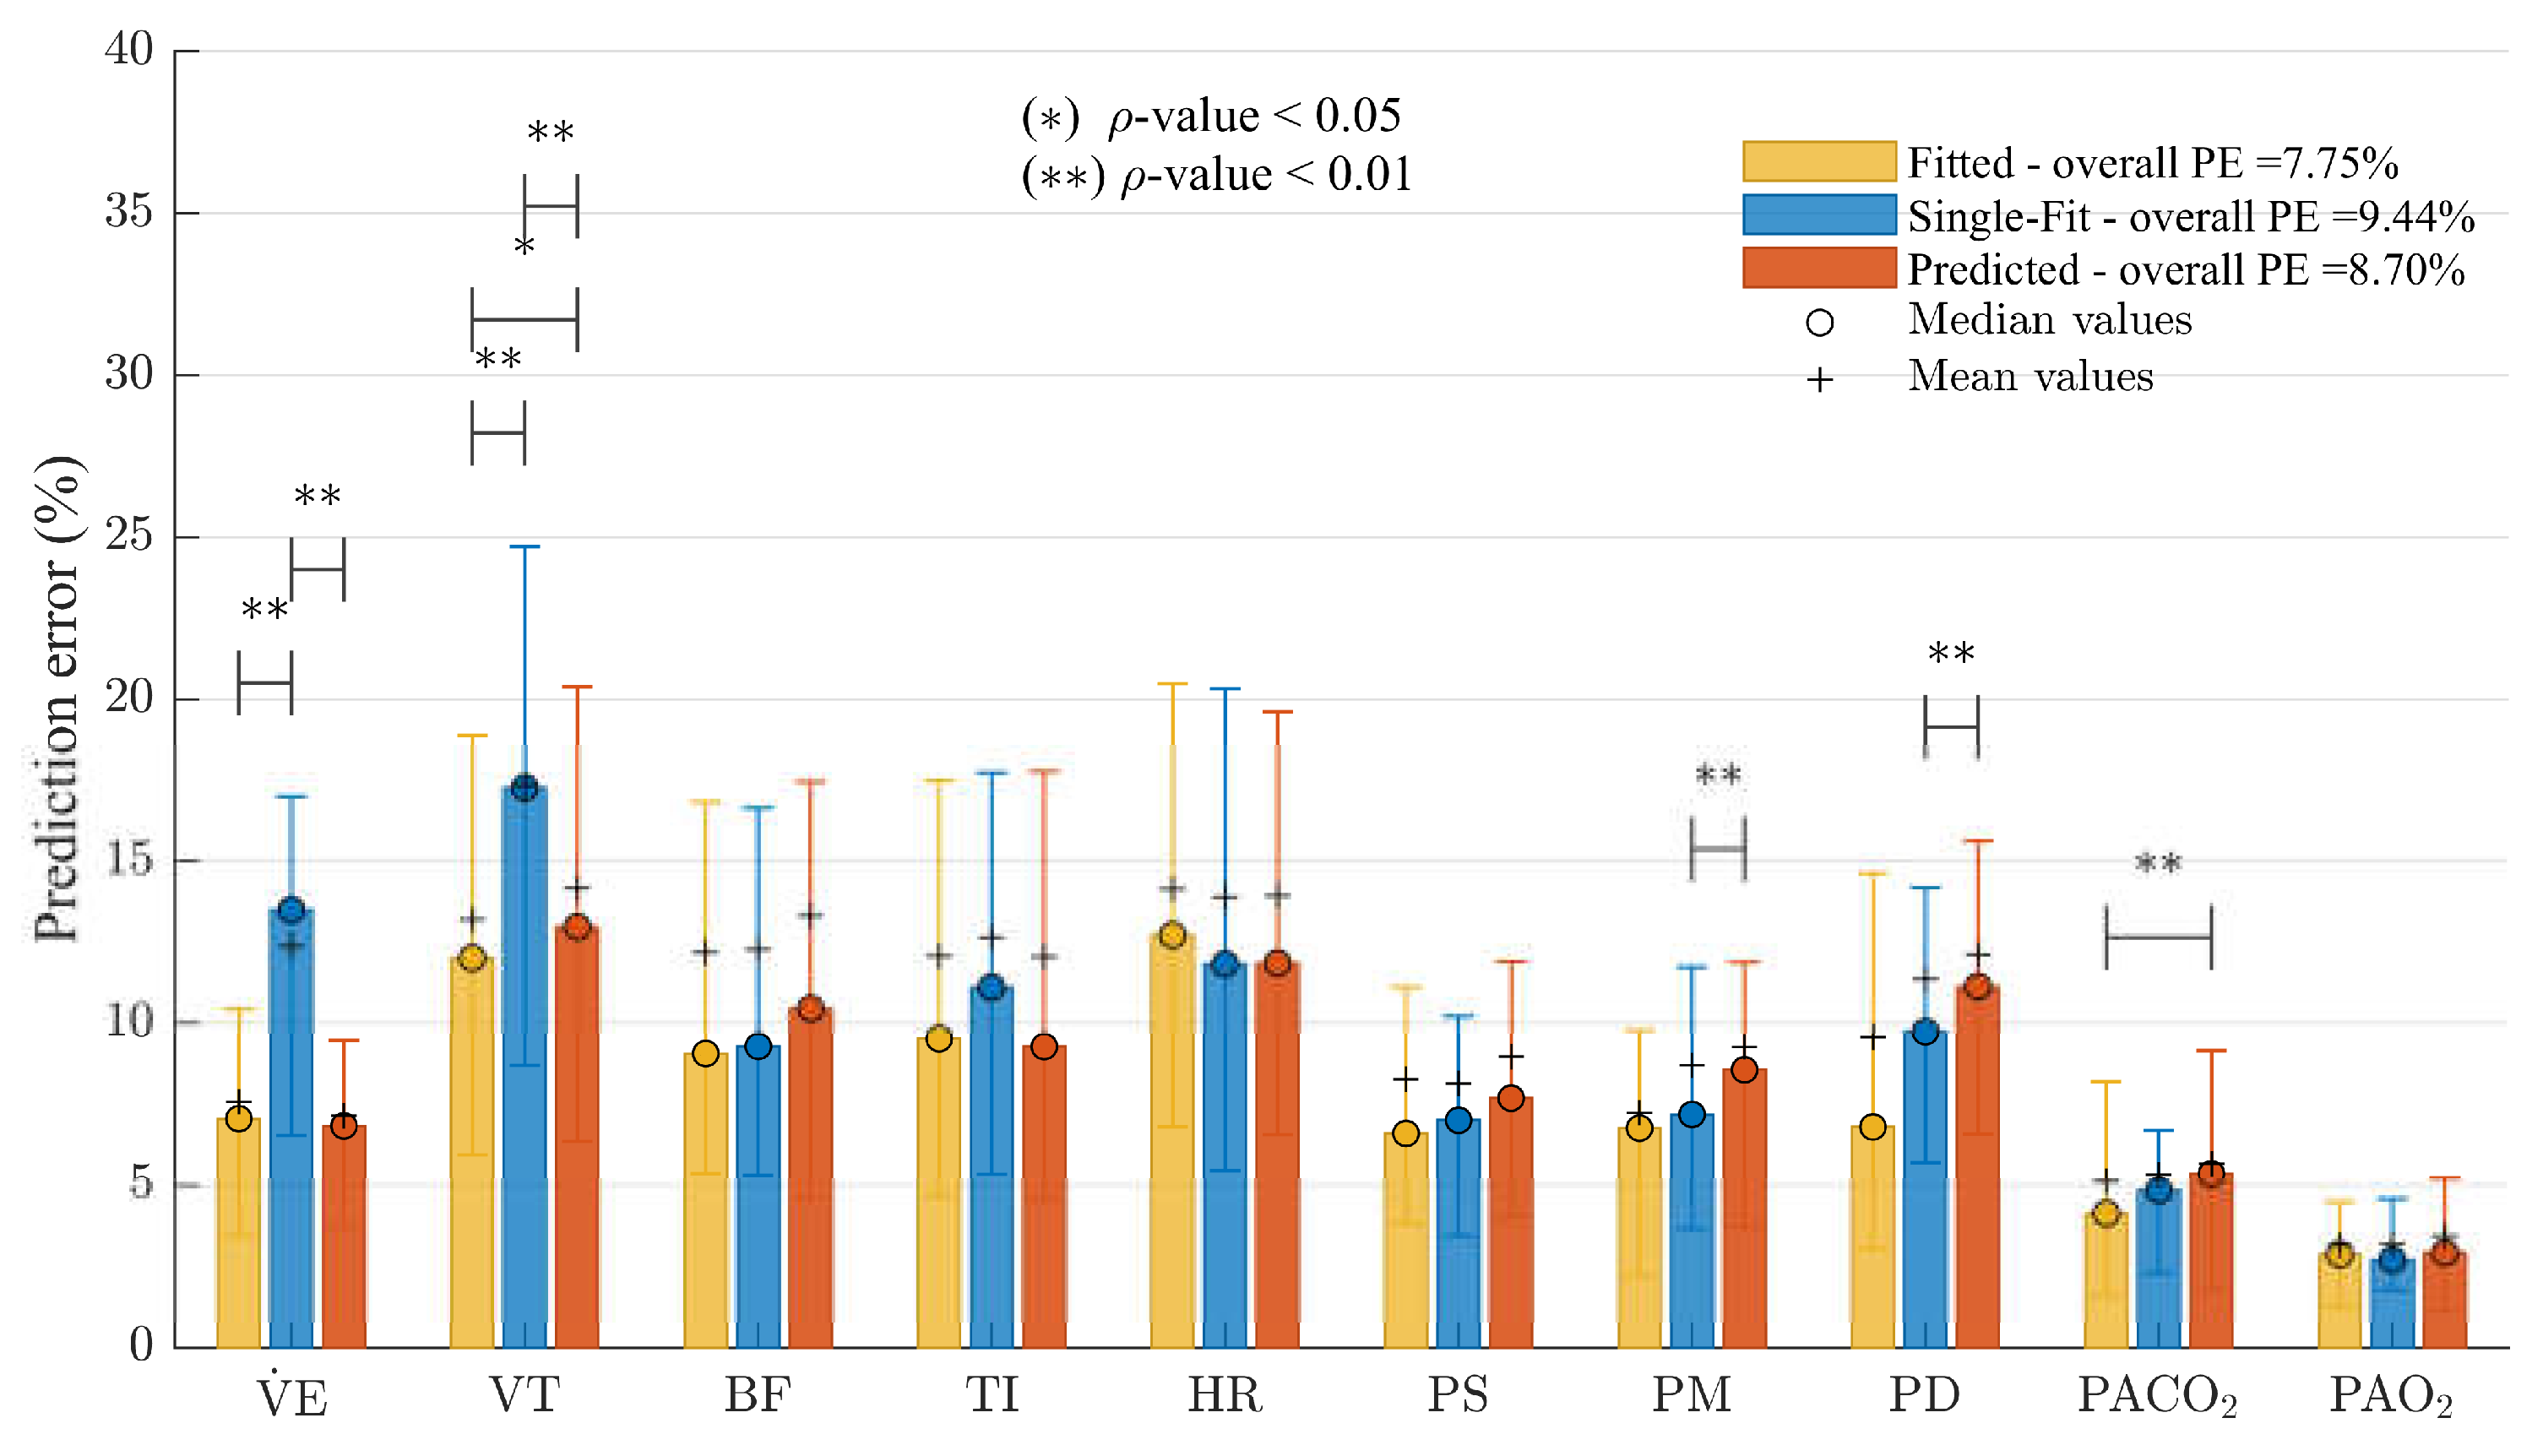
Figure 3 shows the steady-state results of the physiological model simulations regarding the third DB1 record. It was shown that the simulations of the predictive approach were the most similar to those of the fitted model for this record, mainly for the variables   V ˙ E , VT , TI , PACO 2 and HR , both in magnitude and behavior. Although PM and PD show some of the most significant differences in magnitude, their behaviors concerning the stimulus are similar, mainly for PD , compared to the results of the traditional single-fit approach. Some variables that present the most significant differences for the predictive approach are related to the parameter values with the highest variations regarding those optimized for the record. Thus, the results of PM and PD can be attributed mainly to the value of I 0 , met and PaCO 2 , n , and BF to the value of λ 2 and P max (Table 4). For PAO 2 , the differences in the parameter values are not so significant, so the results can be mainly related to the effect of the systemic arterial pressures on the blood flows that enter the gas exchange system (Equations of Gas Exchange and Mixing, and Gas transport in the Supplementary Material).
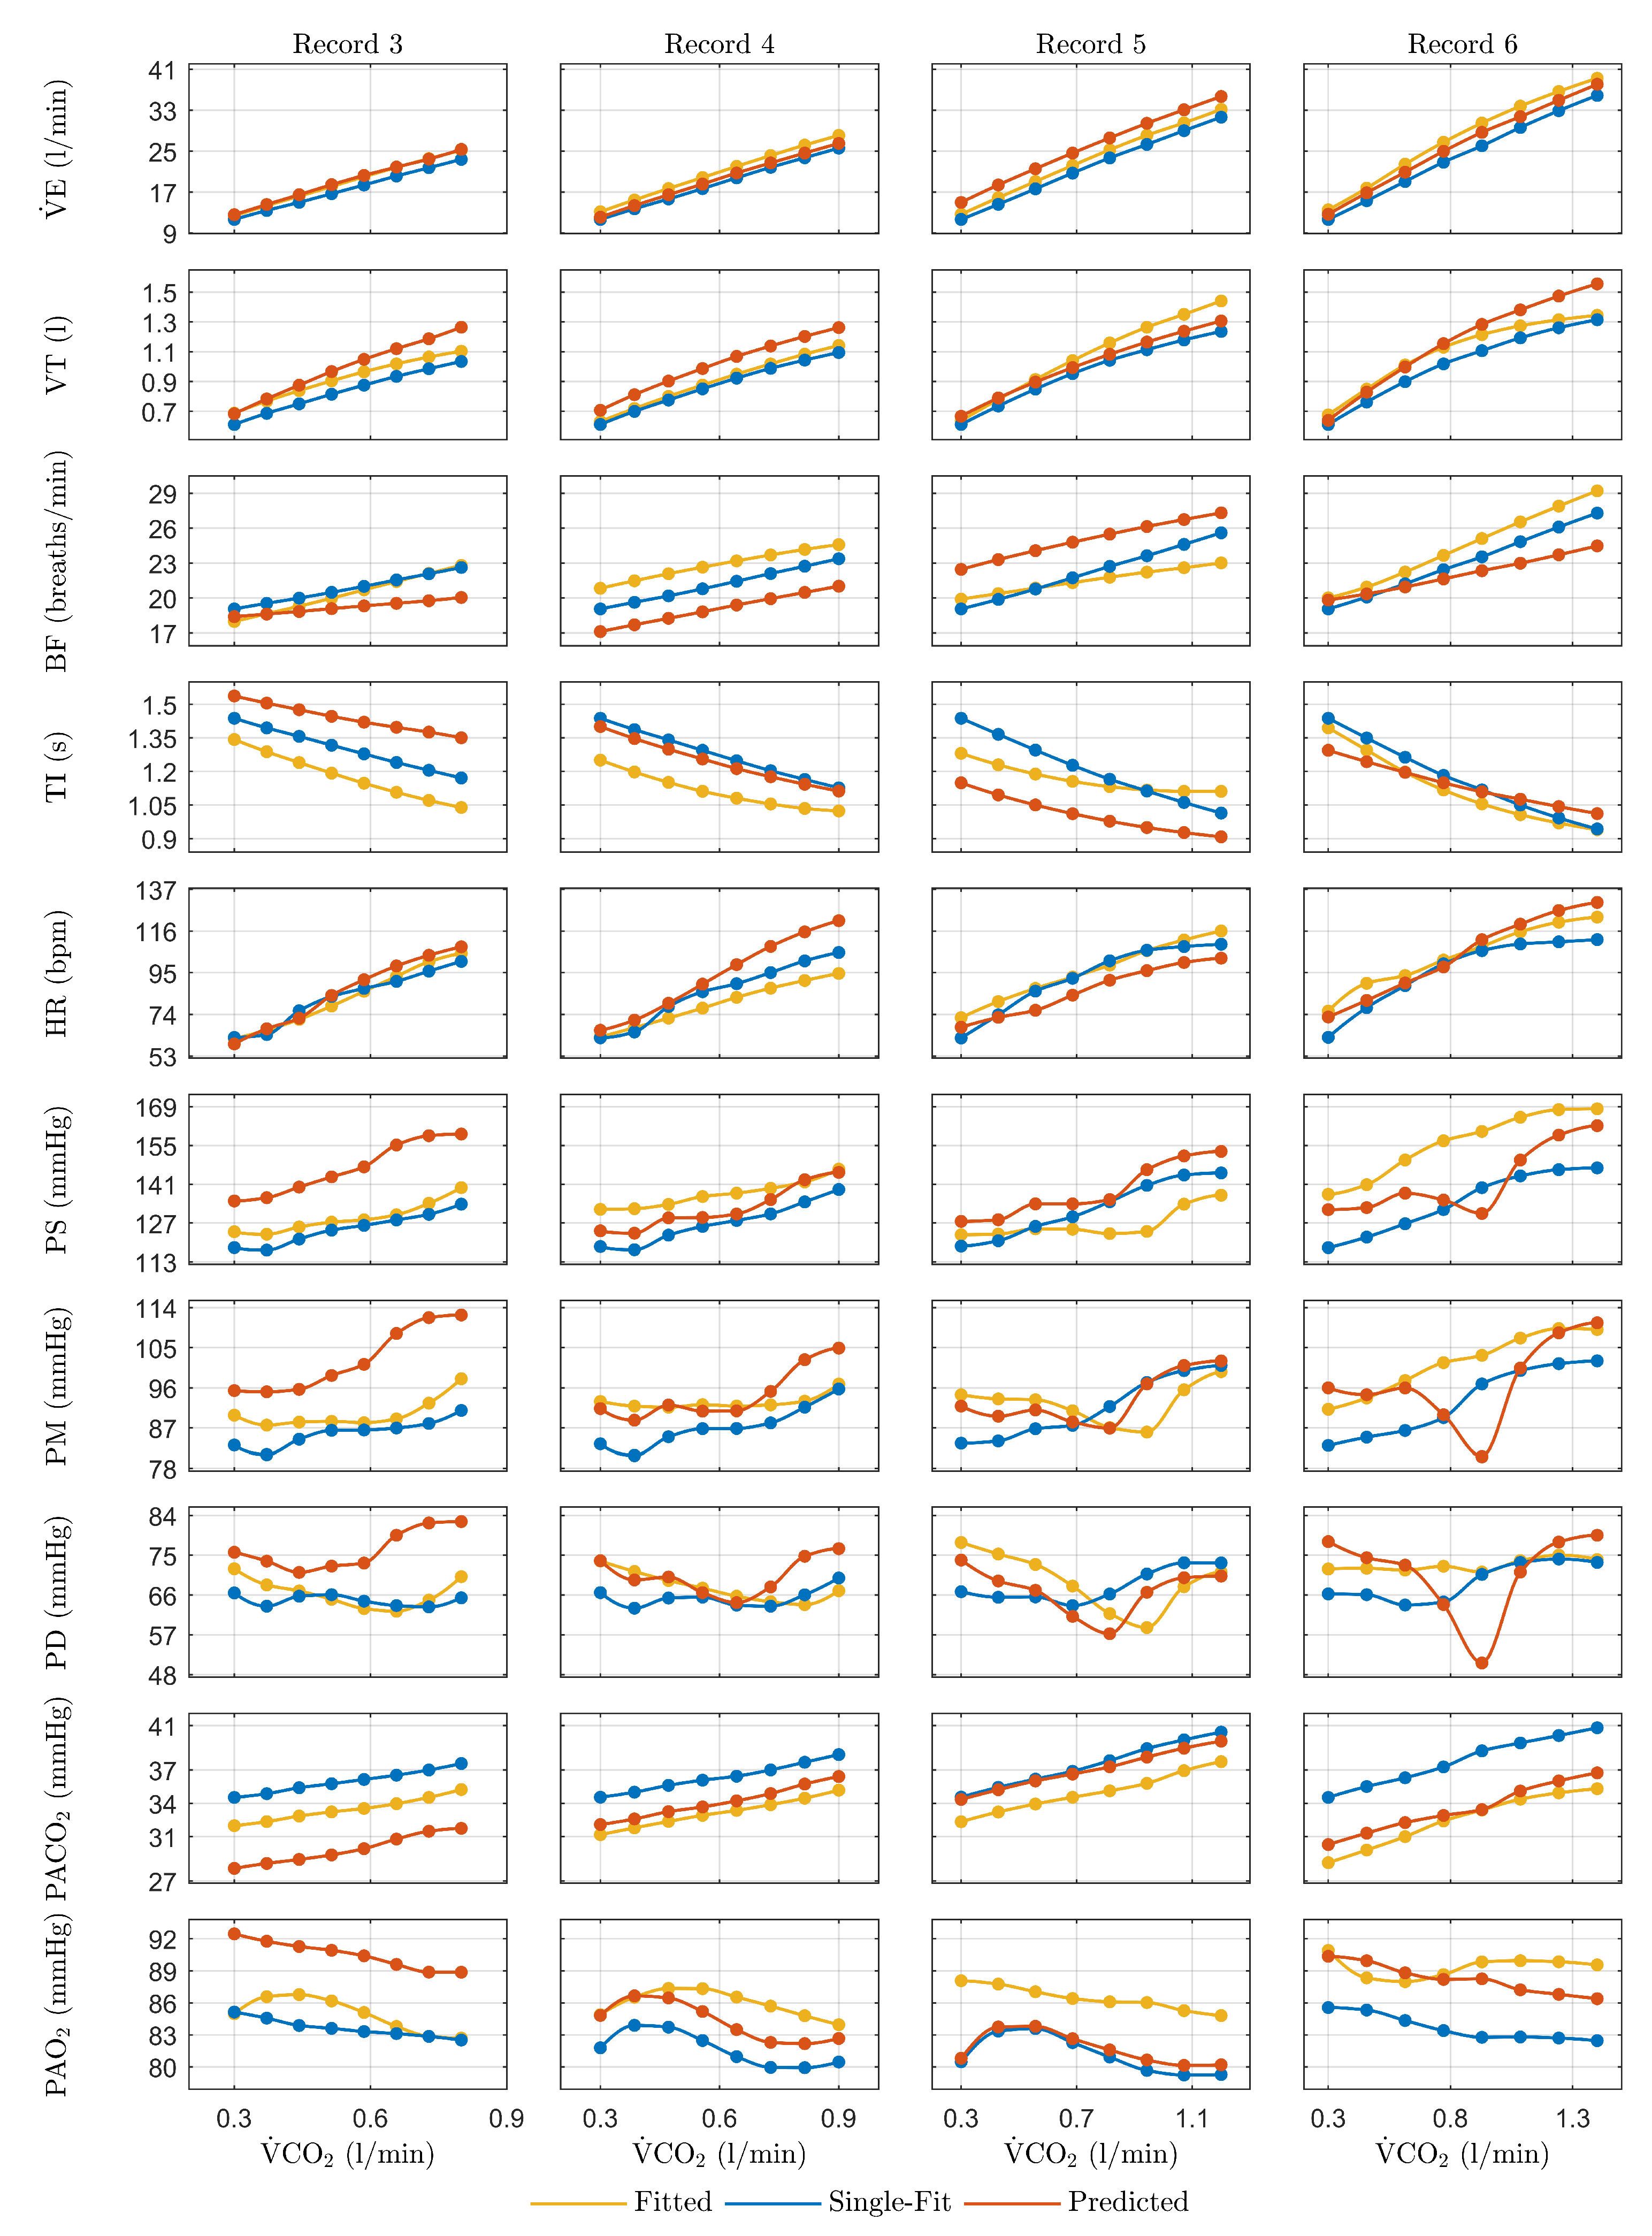
Figure 4 shows the PE values obtained for the physiological model predictions regarding the third DB1 record. The obtained overall results indicate that the simulations related to the predictive approach are more suitable than those of the traditional single-fit approach. The highest errors associated with the traditional single-fit approach are for   V ˙ E and VT , in which the most statistically significant differences are obtained regarding the results of the model fitted to the record. It is also evidenced that the most significant PE’s contribution to the predictive approach is mainly related to the variables PM and PD .
Figure 5 shows the comparison results of the steady-state model simulations against the third to the sixth DB2 records. The results obtained for each record are described below.
The simulations of the predictive approach related to the third DB2 record show less similarity to the model-fitted results than for DB1, despite the fact that they match the same record number. The most significant differences are presented for the variables BF , TI , PS , PM , PD , PACO 2 and PAO 2 , and are related to the parameter values used for the simulations (Table 5). The value of λ 2 , which is a weighting factor that relates the work of breathing during expiration, significantly affects the regulation of BF and TI (Equations of the Breathing Pattern Optimizer in the Supplementary Material). The lower magnitudes of the systemic arterial pressures are related to a lower predicted value of KE lv , due to its effect on the left ventricular pressure signal (Equations of The Heart in the Supplementary Material). For PACO 2 and PAO 2 , although the differences could also be related to the parameter values, especially K 2 for PACO 2 , considering the high sensitivity of the gas exchange system to cardiovascular feedback (Equations of the Gas Exchange and Mixing in the Supplementary Material), it could be mainly attributed to the lower systemic blood pressures.
In the case of the fourth DB2 record, the predictive approach results showed improvements in the behavior and magnitude of the variables regarding the previous one, mainly for TI , PACO 2 and PAO 2 . The difference shown for the respiratory variables could be related to the high variation between the predicted and optimized parameters regarding the respiratory controller (Table 5). The difference between the HR slopes regarding the stimulus is mainly due to the prediction of higher sympathetic activity ( G T , s ) and lower parasympathetic activity ( G T , v ) (Equations of the Effectors for Reflex Control in the Supplementary Material), a result that is coherent considering the time trend of the previous records of these parameters. The improvement in the simulations of systemic blood pressure is due to the increased similarity between the predicted and optimized values of KE lv . Regarding PACO 2 and PAO 2 , considering that the differences in the related parameters are not significant, the improvement can be attributed mainly to the best predicted systemic blood pressure values.
As shown in Figure 5, the results from the predictive approach for the fifth DB2 record show more similar behaviors to those from the fitted model, mainly for the variables BF, TI, PS, PM, and PD. This can be attributed to a smaller difference between the predicted and optimized parameter values compared to previous records due to better predictions and the use of values of earlier optimizations that are not modified for the last fit (Table 5). Regarding the differences in magnitude between the predictive approach results and the fitted model, a higher   V ˙ E value could be mainly related to a high dead space volume ( V 0 dead ) (Equations of the Ventilation Controller in the Supplementary Material); the lower TI and the higher BF are related to a higher P max value [46]; a lower HR is due to a higher T 0 (Equations of the Effectors for Reflex Control in the Supplementary Material); and the differences in PACO 2 and PAO 2 could be attributed to the variation in the concentration of hemoglobin ( C 1 ) and to the difference in the blood and respiratory flows (related to   V ˙ E and the systemic arterial pressures).
The predictive approach results for the sixth DB2 record present magnitudes more similar to those of the fitted model than those of the traditional single-fit approach. Regarding behavior, there was an increase in the variation regarding the results in previous records, which coincides with the increase in the differences between the predicted and optimized parameter values. The main differences occur for systemic arterial pressures and are due to the predicted value of PaCO 2 , n is higher than the optimized (Table 5). The predicted value for this parameter is similar to the optimized for the previous record, and its effect on many of the cardiovascular controller mechanisms is related to an inflection behavior of systemic arterial pressures at mid-stimulus levels (Equations of the Afferent Pathways, Blood Flow Local Control and CNS Ischemic Response in the Supplementary Material). Other major differences are related to the lower slopes and offset of BF and TI and could be related to a higher value of n and P max [46].
Figure 6 shows the PE results obtained for the model predictions regarding the DB2 records from third to sixth. The results for each record are described below.
The results for the third record corroborate the significant difference in the simulations related to the predictive approach compared to those of the fitted model. The above evidence, similar as for dynamic fitting results (Table 3), a high sensitivity of the predictive approach regarding significant changes in the variables evaluated. For this record, the significant change mentioned evidence a limitation of the strategy proposed for DB2 regarding the personalized approach (section 2.2.2. Experimental Data), considering a small number of samples used for the prediction (only two), that corresponds to a different subject from the one trying to predict.
The values presented for the fourth record evidence an improvement of the predictive approach, even presenting better overall results than the traditional single-fit approach. Although the distribution of the PE values is similar to the previous record, the improvement in the behavior of the variables allows results closer to those of the fitted model, mainly for the gas exchange variables.
The values for the predictive approach in the fifth record also show better results than the traditional single-fit approach, even for more variables than in the previous record. This consecutive improvement is related to the greater similarity regarding the magnitudes and behaviors of the variables (Figure 5), a consequence of the smaller overall difference between the predicted and optimized parameter values (Table 5).
The results for the sixth record show better results of the predictive approach than the traditional one for most of the variables evaluated. The differences obtained regarding the fitted model are related to that described for the steady-state results and were expected considering the long prediction time for this record (see Table 1).

4. Discussion

4.1. Dynamic Model Fitting

It is highlighted that the highest deviations and errors are mainly related to the respiratory variables, contrary to what is presented for the gas exchange variables (Table 3). These results are similar to those reported in the building and validation works of the case study model [37,47] and, therefore, could be mainly related to the predictability characteristics of the model rather than as a result of the method presented.
It was also evidenced that the variabilities and overall PE values were lower for DB2 (Table 3). These results are related to the characteristic dispersion of the DB1 records and show the better performance of the model under a personalized fitting perspective.
Regarding DB2, there were continuous decreases in the overall PE value between the first and second records and from the third to the fifth (Table 3). These results could be related to a sensitivity characteristic of the dynamic fitting strategy, which shows the records with significant changes in the cardiorespiratory response. Thus, considering the approximation proposed for DB2 (section 2.2.2. Experimental Data), the model presents better results between successive records of the same subject due to the use and accumulation of previously optimized parameter values (which do not change regarding the next fit). Still, when there is a significant change in the response of the system, which in this case is due to the variation of the recorded subject, the prediction error of the variables increases. This can not be observed for DB1, possibly due to the variability of the experimental data in its records.

4.2. Dynamic Parameter Modeling

The number of parameters that were not modeled regarding the third record was higher for DB2 (see Table 4 and Table 5). This evidence a significant change in the cardiorespiratory characteristics, which is related to the change of subject recorded according to the approximation implemented (section 2.2.2. Experimental Data). In the case of DB1, despite the variability of a popu.ation record, this effect is attenuated considering the fit regarding the mean trend of the data.
It was also observed that the number of parameters that did not satisfy the physiological justification criteria was higher for DB2, and the highest number is presented for its sixth record (see Table 4 and Table 5). The above also shows the sensitivity of the strategy in relation to significant changes in the records, which for DB1 are attenuated considering the fit regarding the mean trend of the experimental data. For DB2, these results are related to greater difficulty in modeling the temporal behavior of the parameters regarding the available factors and optimization records. This complexity increases, considering a longer prediction time for the sixth record (see Table 1).
It should be noted that as the number of records increases, so does the number of parameters to be modeled. This is because the optimized parameters are not necessarily the same between consecutive model fits. According to the incorporated static fitting strategy, the selection of the parameters contemplates the evaluation of the differences between the experimental data and the model predictions, so that the variations between characteristics or magnitudes promote the optimization of the most related parameter.
Although a greater number of model parameters is consistent, considering that all physiological characteristics change with time, this also implies a greater computational load, which may not be justified regarding the temporal trends of the optimizations.   V ˙ max and VTCO 2 regarding DB2 are examples of the above, and although their values are modified in some of the records, they do not change again for subsequent ones, or their variations are not representative (see Table 5).

4.3. Validation

Regarding the simulation comparisons for the third record of DB1, the higher overall PE value of the traditional single-fit approach evidence the change in the cardiorespiratory system over time and, therefore, the importance of a dynamic fit of the model to obtain more adequate predictions of the variables (Figure 4). Additionally, the greater similarity of the results related to the predictive approach with those of the fitted model, both in magnitude and behavior (Figure 3), indicates the usefulness of considering the temporal trend of associated factors and parameter optimizations to predict the future state of the modeled system.
The predictive approach results evidenced a greater sensitivity of the strategy regarding the personalized records (DB2) than with population records (DB1) (Figure 3 to Figure 6). This sensitivity is related to the significant variation of the variables to be predicted regarding their previous records and the few samples used for the prediction. Although the predictive approach considered the same number of samples regarding the third record of both databases, the variation in the temporal trend of the records of DB1 is less than DB2 due to the mean trend of the registered subjects. For DB2, the mentioned variation evidences a limitation of the approximation used for the personalized records (section 2.2.2. Experimental Data), since the records used for the prediction correspond to a different subject from the one attempted to predict.
As the number of temporary records evaluated for DB2 increases, the predictive approach exhibits better overall results regarding accuracy and behavior than the traditional single-fit approach (¡Error! No se encuentra el origen de la referencia. Figure 5 and Figure 6). This can be mainly attributed to two characteristics of the proposed strategy. Firstly, using a more significant number of samples allows us to obtain model parameters with more precise predictions regarding the optimized results (see Table 5). Secondly, using previously fitted parameters, some of which do not change between optimizations, allows us to get predictions with behaviors and magnitudes more similar to those of the model fitted to each record. The above confirms the advantage of dynamic fit regarding the traditional application of a fitted model in a single instant, in addition to evidence that a personalized approach is more appropriate than a population one.
Regarding the last DB2 record, despite the good overall result of the personalized approach, the difference in the behavior of some variables regarding the fitted model simulations was highlighted (Figure 5). Mainly, this difference was because using previous values of optimized parameters implies results with characteristics of previous fittings (see Table 5). In this sense, when evaluating a longer prediction time and, therefore, significant variations of the variables (due to the expected change of the modeled system in relation to age), the memory characteristic of the proposed strategy could be evidenced.

4.4. Application, Limitations, and Future Work

In this work, a dynamic fitting strategy of physiological models was proposed and evaluated regarding a model of the cardiorespiratory system. Experimental data from a longitudinal study of healthy subjects under aerobic exercise were used. The validation of the strategy consisted of comparing the model prediction results using the proposed strategy against those of the traditional approach of the population fit in a single instant of time. The comparison was made from a population and individualized perspective, and its objective was to demonstrate the importance of dynamic fitting of the physiological model.
In accordance with what is presented in this work, the proposed strategy can be considered more proper to represent the cardiorespiratory system. This is due to generally better results in terms of accuracy and behavior of the predicted variables, which validate the strategy both for the fitting of the model at each instant of time and for the prediction of the future state of the physiological system. The above evidence the importance of considering the temporal evolution of the physiological systems and associated factors such as habits, accidents, illnesses, clinical history, among others.
The results obtained also show the usefulness of the proposed strategy in relation to medical practice, mainly under the predictive, preventive, and personalized approach. Thus, it can be considered a tool that allows mathematical models to be suitable for applications of analysis and simulation of the temporal response of the physiological systems, both from a population and personalized perspective. In addition, it provides the ability to anticipate physiological behavior by predicting the future state of physiological systems.
This work also identified aspects that may limit the application of the proposed strategy. The sensitivity of the results regarding significant changes of variables to be predicted between records is highlighted, both for the dynamic fitting of the physiological model and for the prediction of the future state of the system. This aspect can be related to large time differences between consecutive records and specifically to the predictive approach with a short number of samples. The memory characteristic is also standing out, so the quality of the experimental data records can significantly influence the results. Finally, the availability of sufficient and adequate factors related to the temporal response of the system can also affect the results of the predictive approach.
The proposed strategy can have various future applications due to the good validation results. Considering that in this study, the strategy and the procedures that comprise it were generically described, its application regarding other physiological systems, stimuli, characteristics of subjects, and experimental recording conditions can also be evaluated. Works related to the temporal analysis and the prediction of subjects with different pathologies, clinical treatments, medication, or physical conditioning could be considered for the case study model.
Although the proposed methodology was adequate to validate the strategy, some aspects could be considered for future studies. These include the evaluation of the effect of time between records; the evaluation of different strategies for modeling the time trend of parameters; the identification, analysis, and evaluation of different factors related to the temporal response of the system to the predictive approach; and the definition and evaluation of criteria that allow defining which parameters justify being modeled based on the time trend of their optimizations.

5. Conclusions

This paper presents the description, application, and validation of a dynamic fitting strategy of physiological models under the consideration of a large number of parameters and a limited amount of experimental data. The strategy consists of different procedures that allow the dynamic fit of the model, the modeling of the temporal trend of their parameters, and the validation considering its usefulness to predict the future state of the modeled system. The results allow us to conclude that the proposed strategy provides the physiological models with the ability to be used in applications with a predictive, preventive, and personalized approach.

Supplementary Materials

The following supporting information can be downloaded at: www.mdpi.com/xxx/s1. Model equations and parameters.

Author Contributions

Conceptualization, C.A.S., A.M.H., L.Y.S., and M.Á.M.; methodology, C.A.S., A.M.H., L.Y.S., and M.Á.M.; software, C.A.S.; validation, C.A.S., A.M.H., L.Y.S., and M.Á.M.; formal analysis, C.A.S., and A.M.H.; investigation, C.A.S., A.M.H., L.Y.S., and M.Á.M.; data curation, C.A.S.; writing original draft preparation, C.A.S., and A.M.H.; writing review and editing, C.A.S., A.M.H., L.Y.S., and M.Á.M.; visualization, C.A.S., and A.M.H.; supervision, C.A.S., and A.M.H.; project administration, A.M.H.; funding acquisition, A.M.H., and M.Á.M. All authors have read and agreed to the published version of the manuscript.

Funding

This research was funded by the Administrative Department of Science, Technology, and Innovation (Colciencias), Colombia, scholarship 647 of 2014; Ministerio de Ciencia, Tecnología e Innovación (MINCIENCIAS), Colombia, under the project “Desarrollo y validación de un dispositivo para la terapia y el monitoreo de pacientes con enfer-medad pulmonar obstructiva crónica en manejo domiciliario e intrahospitalario”, code 111593093015; and the Ministry of Science and Innovation (MICINN), Spain, under contract PID2020-117751RB-I00.

Institutional Review Board Statement

The study related to the experimental data used in this work was conducted in accordance with the Declaration of Helsinki and approved by the Human Research Ethical Committee of the Department of University Research (SIU) of the University of Antioquia (approval certificates 16-59-711, 17-59-711 and 18-59-711).

Informed Consent Statement

Informed consent was obtained from all subjects involved in the study related to the experimental data used in this work.

Data Availability Statement

The complete description of the procedures and characteristics of the experimental design is reported in the paper on the model building and evaluation [47]. The information required to replicate the cardiorespiratory model and the static fitting strategy can be found in the previous papers [37,47]. The equations and parameter values to implement and replicate the proposed strategy are described throughout this work.

Acknowledgments

We thank all the subjects who participated in this study, especially the Guerrero family for their important support in the creation of the databases.

Conflicts of Interest

The authors declare no conflict of interest.

References

  1. Healthcare in overview across the globe. EPMA J. 2011, 2, 71–89. [CrossRef]
  2. Golubnitschaja, O.; Kinkorova, J.; Costigliola, V. Predictive, Preventive and Personalised Medicine as the hardcore of ‘Horizon 2020’: EPMA position paper. EPMA J. 2014, 5, 6–6. [Google Scholar] [CrossRef] [PubMed]
  3. Liao, W.-L.; Tsai, F.-J. Personalized medicine: A paradigm shift in healthcare. Biomed. Pharmacother. 2013, 3, 66–72. [Google Scholar] [CrossRef]
  4. Habetha, J. The myheart project - Fighting cardiovascular diseases by prevention and early diagnosis. Conference Proceedings. Annual International Conference of the IEEE Engineering in Medicine and Biology Society. LOCATION OF CONFERENCE, United StatesDATE OF CONFERENCE; pp. 6746–6749.
  5. Lai, L.; Wang, Z.; Wu, X. The Progress of Research on Prediction Model for Acute Hypotensive Episodes. In Proceedings of the 2010 3rd International Conference on Biomedical Engineering and Informatics; IEEE, October 2010; Vol. 3; pp. 1067–1070. [Google Scholar]
  6. Pantelopoulos, A.; Bourbakis, N. A Health Prognosis Wearable System with Learning Capabilities Using NNs. In Proceedings of the 2009 21st IEEE International Conference on Tools with Artificial Intelligence; 2009; pp. 243–247. [Google Scholar]
  7. Batzel, J.J.; Bachar, M.; Karemaker, J.M.; Kappel, F. Mathematical Modeling and Validation in Physiology; Batzel, J.J. , Bachar, M., Kappel, F., Eds.; Lecture Notes in Mathematics; Springer Berlin Heidelberg: Berlin, Heidelberg, 2013; ISBN 978-3-642-32881-7. [Google Scholar]
  8. Batzel, J.J.; Kappel, F.; Schneditz, D.; Tran, H.T. Cardiovascular and Respiratory Systems : Modeling, Analysis, and Control; 1st ed.; SIAM: Philadelphia, United States, 2007; ISBN 9780898716177. [Google Scholar]
  9. Das, A.; Menon, P.P.; Hardman, J.G.; Bates, D.G. Optimization of Mechanical Ventilator Settings for Pulmonary Disease States. IEEE Trans. Biomed. Eng. 2013, 60, 1599–1607. [Google Scholar] [CrossRef] [PubMed]
  10. Marmarelis, V.Z. Nonlinear Dynamic Modeling of Physiological Systems; 1st ed.; John Wiley & Sons, Inc.: Hoboken, NJ, USA, 2004; ISBN 9780471679370.
  11. Ellwein, L.M. Cardiovascular and Respiratory Regulation, Modeling and Parameter Estimation, North Carolina State University: Ann Arbor, United States, 2008.
  12. Ellwein, L.; Pope, S.; Xie, A.; Batzel, J.; Kelley, C.; Olufsen, M. Patient-specific modeling of cardiovascular and respiratory dynamics during hypercapnia. Math. Biosci. 2013, 241, 56–74. [Google Scholar] [CrossRef]
  13. Cardona-Morrell, M.; Prgomet, M.; Turner, R.M.; Nicholson, M.; Hillman, K. Effectiveness of continuous or intermittent vital signs monitoring in preventing adverse events on general wards: a systematic review and meta-analysis. Int. J. Clin. Pr. 2016, 70, 806–824. [Google Scholar] [CrossRef] [PubMed]
  14. Cheng, L.; Albanese, A.; Ursino, M.; Chbat, N.W. An integrated mathematical model of the human cardiopulmonary system: model validation under hypercapnia and hypoxia. Am. J. Physiol. Circ. Physiol. 2016, 310, H922–H937. [Google Scholar] [CrossRef] [PubMed]
  15. Haouzi, P.; Poon, C.-S.; Secher, N.H.; Keslacy, S.; Matecki, S.; Carra, J.; Borrani, F.; Candau, R.; Prefaut, C.; Ramonatxo, M.; et al. Ventilatory control in hypercapnia and exercise: optimization hypothesis. J. Appl. Physiol. 1987, 62, 2447–2459. [Google Scholar] [CrossRef]
  16. Serna, L.Y.; Mañanas, M.A.; Hernández, A.M.; Rabinovich, R.A. An Improved Dynamic Model for the Respiratory Response to Exercise. Front. Physiol. 2018, 9, 69. [Google Scholar] [CrossRef]
  17. Tehrani, F.T. Optimal Control of Respiration in Exercise. In Proceedings of the Proceedings of the 20th Annual International Conference of the IEEE Engineering in Medicine and Biology Society.; pp. 2020009836286200263211–3214.
  18. Magosso, E.; Cavalcanti, S.; Ursino, M. Theoretical analysis of rest and exercise hemodynamics in patients with total cavopulmonary connection. Am. J. Physiol. Circ. Physiol. 2002, 282, H1018–H1034. [Google Scholar] [CrossRef]
  19. Cheng, L.; Ivanova, O.; Fan, H.-H.; Khoo, M.C. An integrative model of respiratory and cardiovascular control in sleep-disordered breathing. Respir. Physiol. Neurobiol. 2010, 174, 4–28. [Google Scholar] [CrossRef] [PubMed]
  20. Hernández, A.M. Sistema de Control Respiratorio Ante Estímulos y Patologías: Análisis, Modelado y Simulación; OmniScript.; Publicia, 2014; ISBN 978-3-639-55914-9.
  21. Karamolegkos, N.; Albanese, A.; Isaza, F.; Chbat, N.W. Patient Emulator: A Tool for Testing Mechanical Ventilation Therapies. In Proceedings of the 2016 38th Annual International Conference of the IEEE Engineering in Medicine and Biology Society (EMBC); IEEE, August 2016; Vol. 2016; pp. 4321–4324. [Google Scholar]
  22. Tehrani, F.T. Automatic Control of Mechanical Ventilation and the Inspired Fraction of Oxygen in the Premature Infant: A Simulation Study. In Proceedings of the Proceedings of the First Joint BMES/EMBS Conference.; p. 1999211999993701519991339.
  23. Magosso, E.; Ursino, M. Cardiovascular response to dynamic aerobic exercise: A methematical model. Med Biol. Eng. Comput. 2002, 40, 660–674. [Google Scholar] [CrossRef] [PubMed]
  24. da Silva, S.C.; Monteiro, W.D.; Farinatti, P.d.T.V. Avaliação da capacidade máxima de exercício: uma revisão sobre os protocolos tradicionais e a evolução para modelos individualizados. Rev. Bras. de Med. do Esporte 2011, 17, 363–369. [Google Scholar] [CrossRef]
  25. Fonoberova, M.; Mezić, I.; Buckman, J.F.; Fonoberov, V.A.; Mezić, A.; Vaschillo, E.G.; Mun, E.-Y.; Vaschillo, B.; Bates, M.E. A computational physiology approach to personalized treatment models: the beneficial effects of slow breathing on the human cardiovascular system. Am. J. Physiol. Circ. Physiol. 2014, 307, H1073–H1091. [Google Scholar] [CrossRef]
  26. Serna, L.Y.; Mañanas, M. .; Marín, J.; Hernández, A.M.; Benito, S. Optimization techniques in respiratory control system models. Appl. Soft Comput. 2016, 48, 431–443. [Google Scholar] [CrossRef]
  27. Kovacs, F.; Hosszu, G. A proposed method for dynamic fitting of MOS model parameters. IEEE Trans. Comput. Des. Integr. Circuits Syst. 1993, 12, 1503–1507. [Google Scholar] [CrossRef]
  28. Lingxiong Shao, L.; Smith, R.; Freifelder, R.; Karp, J.S. Practical Approaches for Oxygen Flow Studies in PET. In Proceedings of the Proceedings of 1994 IEEE Nuclear Science Symposium - NSS’94; pp. 199431416–1420.
  29. Shande, S.; Shouzhen, Z.; Bo, H. Identification of Parameters of Synchronous Machine and Excitation System by On-Line Test. In Proceedings of the International Conference on Advances in Power System Control, Operation and Management; IET; 1991; pp. 716–719. [Google Scholar]
  30. Yanjun Yan, Y.; Osadciw, L.A.; Benson, G.; White, E. Inverse Data Transformation for Change Detection in Wind Turbine Diagnostics. In Proceedings of the 2009 Canadian Conference on Electrical and Computer Engineering; IEEE, May 2009; pp. 944–949. [Google Scholar]
  31. Khoo, M.C.K. Physiological Control Systems: Analysis, Simulation, and Estimation; 2nd ed.; Wiley-IEEE Press: New Jersey, 2018; ISBN 978-1-119-05880-9. [Google Scholar]
  32. Christensen, K.; Doblhammer, G.; Rau, R.; Vaupel, J.W. Ageing populations: the challenges ahead. Lancet 2009, 374, 1196–1208. [Google Scholar] [CrossRef]
  33. Eslami, O.; Zarei, M.; Shidfar, F. The association of dietary patterns and cardiorespiratory fitness: A systematic review. Nutr. Metab. Cardiovasc. Dis. 2020, 30, 1442–1451. [Google Scholar] [CrossRef]
  34. Jerath, R.; Harden, K.; Crawford, M.; Barnes, V.A.; Jensen, M. Role of cardiorespiratory synchronization and sleep physiology: effects on membrane potential in the restorative functions of sleep. Sleep Med. 2014, 15, 279–288. [Google Scholar] [CrossRef]
  35. Myers, J.; McAuley, P.; Lavie, C.J.; Despres, J.-P.; Arena, R.; Kokkinos, P. Physical Activity and Cardiorespiratory Fitness as Major Markers of Cardiovascular Risk: Their Independent and Interwoven Importance to Health Status. Prog. Cardiovasc. Dis. 2015, 57, 306–314. [Google Scholar] [CrossRef]
  36. World Health Organization: Ageing and Health. Available online: https://www.who.int/news-room/fact-sheets/detail/ageing-and-health (accessed on 1 February 2023).
  37. Sarmiento, C.A.; Serna, L.Y.; Hernández, A.M.; Mañanas, M. . A Novel Strategy to Fit and Validate Physiological Models: A Case Study of a Cardiorespiratory Model for Simulation of Incremental Aerobic Exercise. Diagnostics 2023, 13, 908. [Google Scholar] [CrossRef]
  38. Burth, M.; Verghese, G.; Velez-Reyes, M. Subset selection for improved parameter estimation in on-line identification of a synchronous generator. IEEE Trans. Power Syst. 1999, 14, 218–225. [Google Scholar] [CrossRef]
  39. Ginsburg, G.S.; Willard, H.F. Genomic and personalized medicine: foundations and applications. Transl. Res. 2009, 154, 277–287. [Google Scholar] [CrossRef] [PubMed]
  40. Jørgensen, J.T. A challenging drug development process in the era of personalized medicine. Drug Discov. Today 2011, 16, 891–897. [Google Scholar] [CrossRef] [PubMed]
  41. Wani, A.L. Personalized medicine: A near future or yet miles to go? Adv. Integr. Med. 2015, 2, 112–113. [Google Scholar] [CrossRef]
  42. Tutton, R.; Jamie, K. Personalized medicine in context: social science perspectives. Drug Discov. Today: Ther. Strat. 2013, 10, e183–e187. [Google Scholar] [CrossRef]
  43. Strand, L.B.; Laugsand, L.E.; Wisløff, U.; Nes, B.M.; Vatten, L.; Janszky, I. Insomnia Symptoms and Cardiorespiratory Fitness in Healthy Individuals: The Nord-Trøndelag Health Study (HUNT). Sleep 2013, 36, 99–108. [Google Scholar] [CrossRef] [PubMed]
  44. Harada, T.; Kubo, H.; Mori, T.; Sato, T. Pulmonary and Cardiovascular Integrated Model Controlled with Oxygen Consumption. In Proceedings of the 2005 IEEE Engineering in Medicine and Biology 27th Annual Conference; IEEE, 2005; Vol. 7 VOLS; pp. 304–307. [Google Scholar]
  45. Mananas, M.A.; Hernandez, A.M.; Romero, S.; Grino, R.; Rabinovich, R.; Benito, S.; Caminal, P. Analysis of Respiratory Models at Different Levels of Exercise, Hypercapnia and Hypoxia. In Proceedings of the Proceedings of the 25th Annual International Conference of the IEEE Engineering in Medicine and Biology Society (IEEE Cat.; pp. 0337439200332754–2757.
  46. Poon, C.-S.; Lin, S.L.; Knudson, O.B.; Secher, N.H.; Racca, F.; Appendini, L.; Gregoretti, C.; Stra, E.; Patessio, A.; Donner, C.F.; et al. Optimization character of inspiratory neural drive. J. Appl. Physiol. 1992, 72, 2005–2017. [Google Scholar] [CrossRef]
  47. Sarmiento, C.A.; Hernández, A.M.; Serna, L.Y.; Mañanas, M. . An integrated mathematical model of the cardiovascular and respiratory response to exercise: model-building and comparison with reported models. Am. J. Physiol. Circ. Physiol. 2021, 320, H1235–H1260. [Google Scholar] [CrossRef]
  48. American Thoracic Society. American College of Chest Physicians ATS/ACCP Statement on Cardiopulmonary Exercise Testing. Am. J. Respir. Crit. Care Med. 2003, 167, 211–277. [Google Scholar] [CrossRef]
  49. Baker, R.J.; Kozoll, D.D.; A Meyer, K. The use of surface area as a basis for establishing normal blood volume. . 1957, 104, 183–9. [Google Scholar] [PubMed]
  50. Mosteller, R.D. Simplified Calculation of Body-Surface Area. New Engl. J. Med. 1987, 317, 1098–1098. [Google Scholar] [CrossRef] [PubMed]
  51. Hansen, N.; Ostermeier, A. Completely Derandomized Self-Adaptation in Evolution Strategies. Evol. Comput. 2001, 9, 159–195. [Google Scholar] [CrossRef] [PubMed]
  52. Evans, C.H.; White, R.D. Exercise Stress Testing for Primary Care and Sports Medicine; Evans, C.H. , White, R.D., Eds.; Springer New York: New York, NY, 2009; ISBN 978-0-387-76596-9. [Google Scholar]
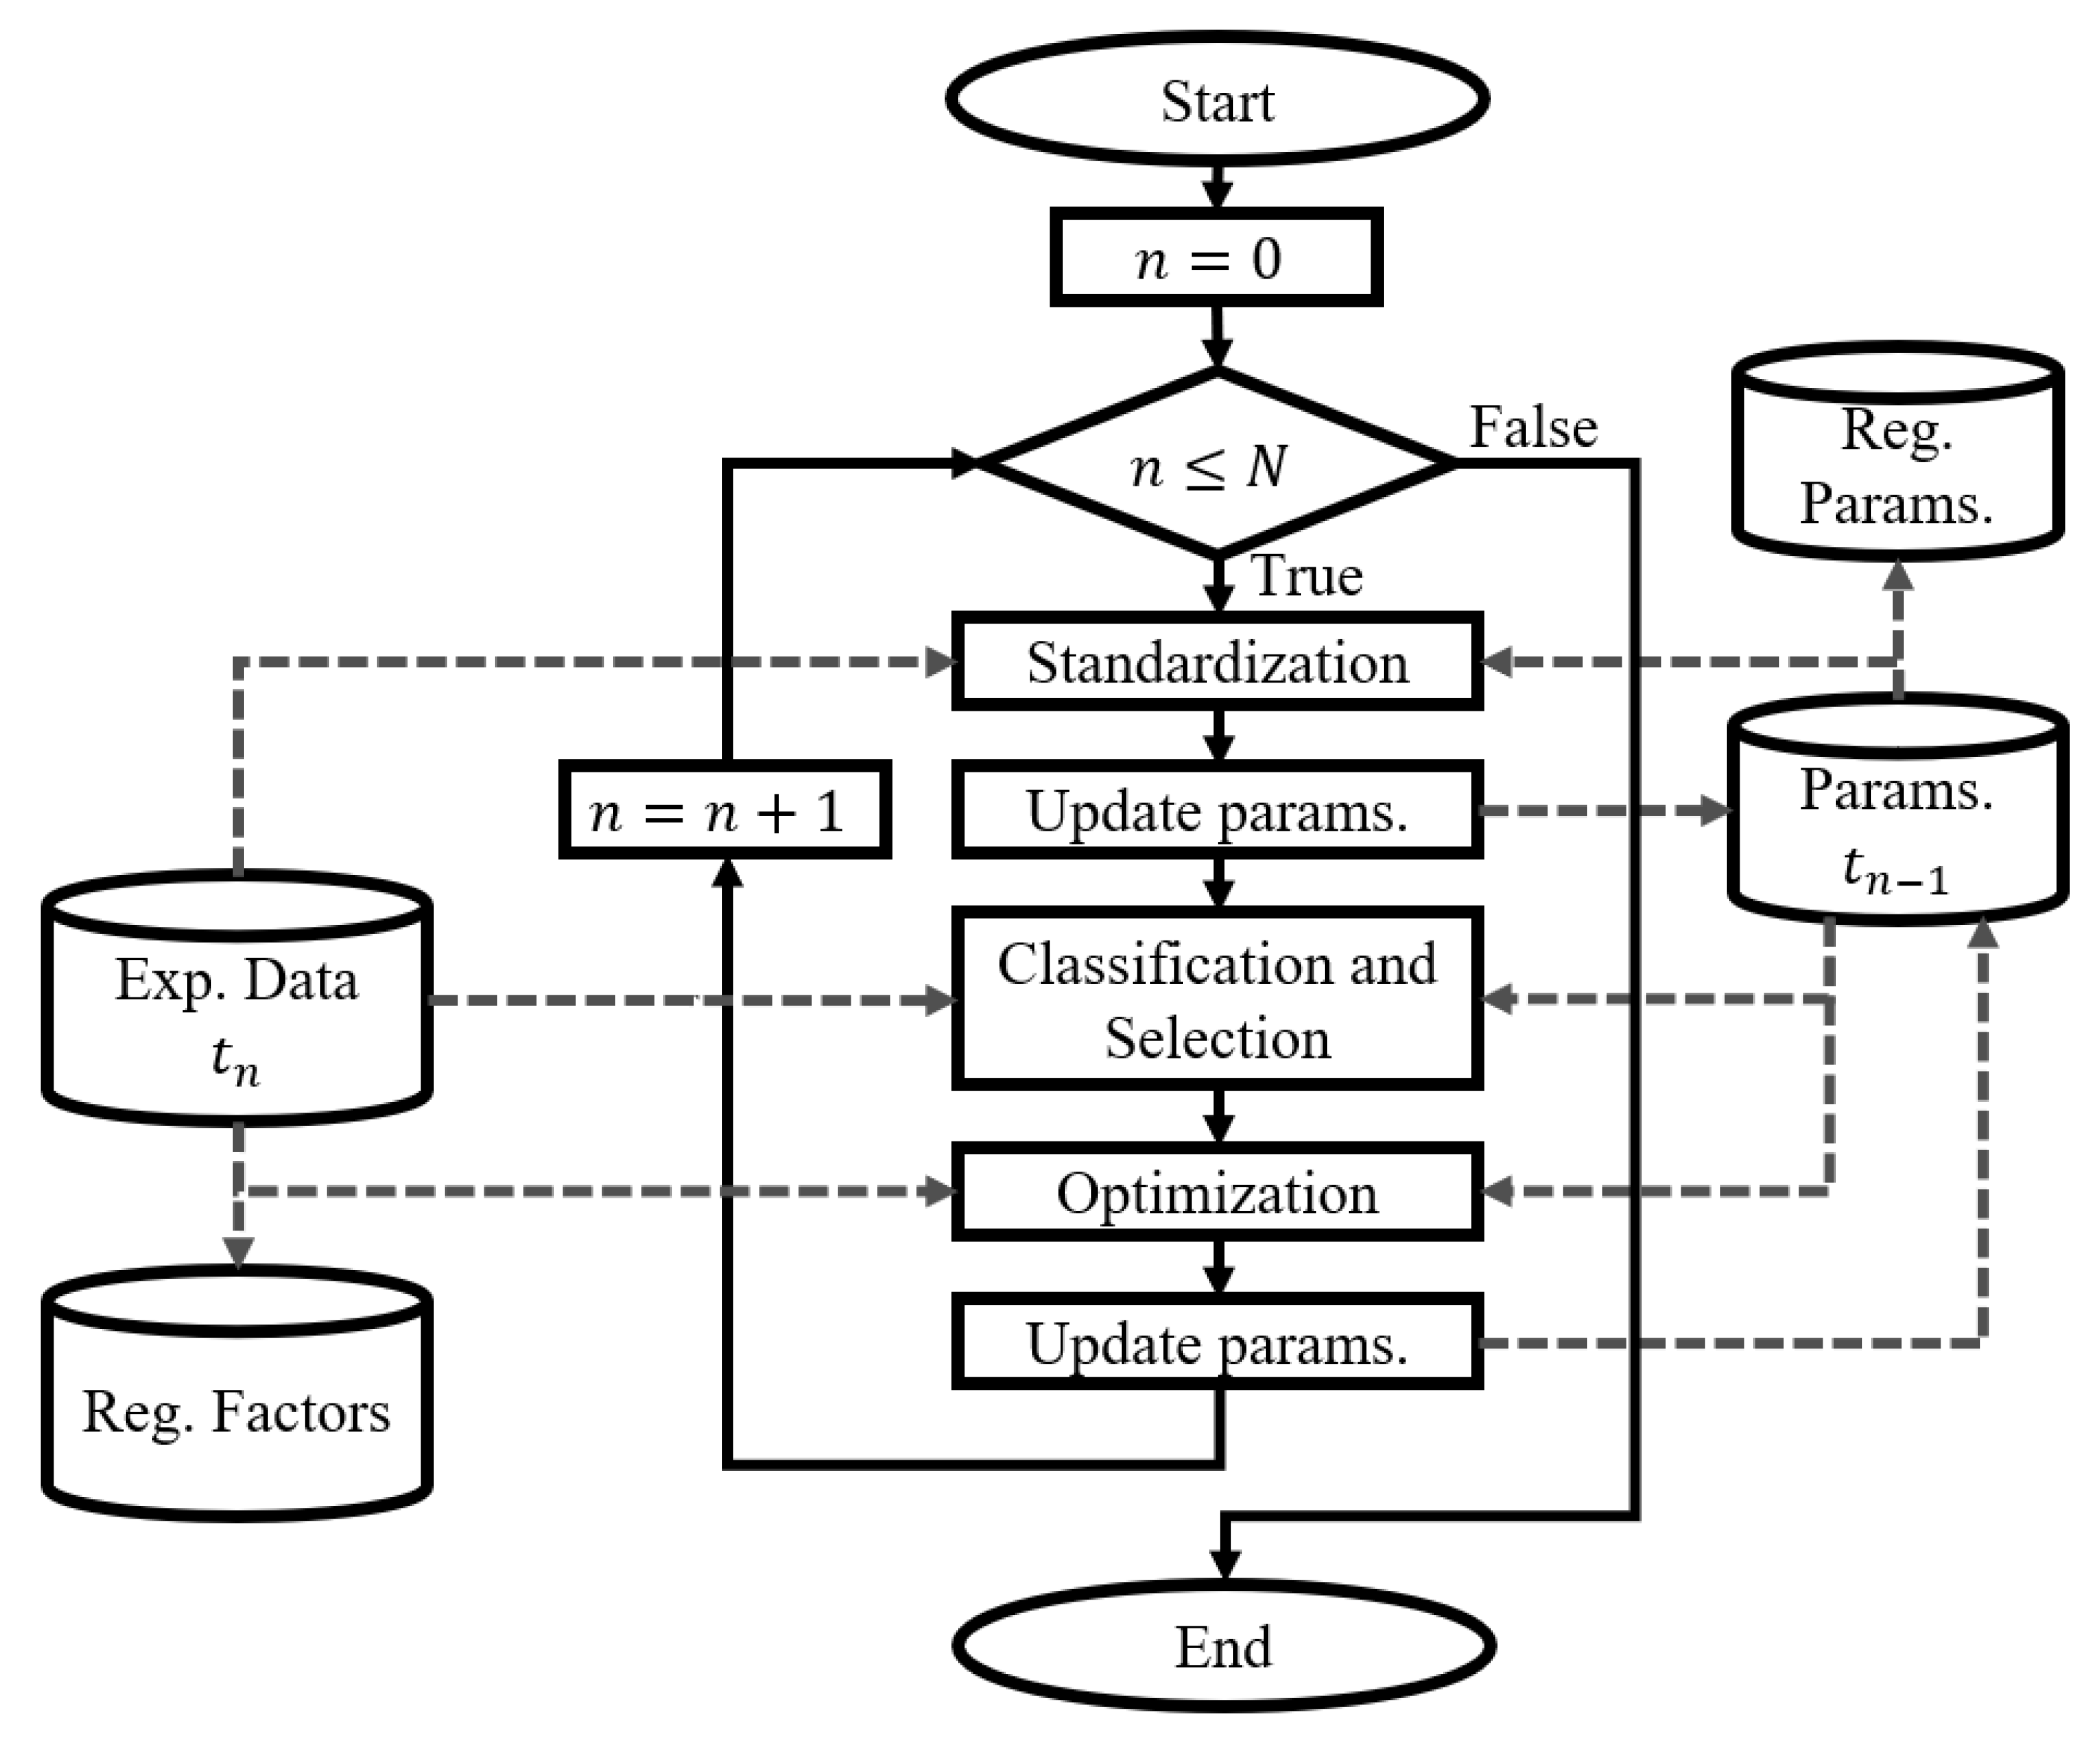
Figure 1. Flowchart for the dynamic fitting procedure.
Preprints 75058 g001
Figure 2. Flowchart for the Dynamic Parameter Modeling.
Preprints 75058 g002
Figure 3. Steady-state simulation results against experimental data from the third DB1 record.
Preprints 75058 g003
Figure 4. PE values obtained for the physiological model predictions regarding the third DB1 record.
Preprints 75058 g004
Figure 5. Steady-state simulation results against experimental data from the third to the sixth DB2 record. The results are presented in a matrix, such that the rows correspond to each of the evaluated variables and the columns to the compared records.
Preprints 75058 g005
Figure 6. PE values obtained for the physiological model predictions regarding the DB2 records from third to sixth. (a) presents the results for each of the variables evaluated in a matrix, and (b) presents the overall results of each approach for the records.
Preprints 75058 g006
Table 1. Information recorded for each database of the experimental study.
Registered information DB1 records DB2 records
1 2 3 1 2 3 4 5 6
Environmental conditions
Ambient temperature (ºC) 26.6 ± 1.5 27.0 ± 1.6 25.9 ± 1.3 25.0 26.0 28.0 25.0 27.0 26.0
Relative humidity (%) 63.7 ± 5.0 58.7 ± 4.5 61.8 ± 7.1 56.0 56.0 64.0 49.0 70.0 49.0
Subject data
Age (years) 28.3 ± 6.8 29.0 ± 6.9 29.9 ± 6.9 25.2 26.0 29.9 30.8 31.5 63.1
Height (cm) 173.6 ± 6.3 173.6 ± 6.3 173.6 ± 6.3 163.0 163.0 167.4 167.4 167.4 165.0
Weight (kg) 76.7 ± 9.6 76.6 ± 10.8 77.6 ± 11.4 71.8 70.9 83.3 79.2 81.6 71.3
Body   mass   index   ( kg / m 2 ) 25.5 ± 2.8 25.4 ± 3.0 25.7 ± 3.2 27.0 26.7 29.7 28.3 29.1 26.2
Average sleep (hours per day) 6.6 ± 0.9 6.6 ± 1.0 6.7 ± 1.0 7.0 7.0 6.5 7.0 8.0 6.0
Average physical activity (hours per week) 6.4 ± 4.5 4.4 ± 4.5 3.3 ± 3.5 5.0 2.0 0.0 4.0 0.0 0.0
Table 2. Values of parameters calculated from experimental data.
Parameter DB1 DB2
1 2 3 1 2 3 4 5 6
V tot (ml) 5025.9 ± 454.6 5022.2 ± 497.4 5062.4 ± 526.0 4642.0 4604.7 5185.1 5023.7 5118.7 4657.5
AT   for   V ˙ CO 2   ( l min ) 0.9 ± 0.5 0.7 ± 0.3 0.8 ± 0.6 0.9 0.8 1.0 1.2 1.4 1.4
VT n (ml) 0.72 ± 0.12 0.76 ± 0.13 0.78 ± 0.13 0.60 0.73 0.77 0.67 0.66 0.74
Table 3. Prediction error (%) of the model fitted to each record.
PE DB1 DB2
1 2 3 1 2 3 4 5 6
Overall 7.57 8.42 8.03 8.51 6.13 7.24 5.25 5.13 6.84
  V ˙ E 7.40 ± 7.90 7.37 ± 9.81 7.19 ± 7.47 10.27 ± 2.63 15.07 ± 5.47 17.07 ± 9.93 14.89 ± 7.15 16.21 ± 2.73 17.05 ± 5.94
VT 11.10 ± 12.26 11.81 ± 15.53 12.56 ± 13.56 12.96 ± 16.26 1.76 ± 5.86 5.52 ± 9.69 12.99 ± 3.79 4.56 ± 11.39 16.23 ± 8.75
BF 10.08 ± 13.58 12.06 ± 13.12 9.83 ± 12.46 16.19 ± 14.23 10.31 ± 6.47 13.52 ± 14.61 4.64 ± 6.27 6.68 ± 5.97 3.49 ± 4.44
TI 10.41 ± 12.46 11.88 ± 13.57 10.03 ± 13.36 8.56 ± 10.17 7.83 ± 7.02 10.67 ± 11.78 3.88 ± 9.62 6.42 ± 5.06 6.03 ± 2.72
HR 10.50 ± 11.19 13.44 ± 14.18 12.81 ± 14.81 8.69 ± 5.84 11.05 ± 4.42 6.77 ± 13.87 2.26 ± 5.71 1.73 ± 2.85 3.79 ± 3.71
PS 5.08 ± 7.35 5.36 ± 6.04 6.41 ± 7.57 9.67 ± 9.54 2.45 ± 1.79 4.22 ± 4.25 2.70 ± 6.86 2.11 ± 2.88 3.91 ± 6.81
PM 5.47 ± 7.23 5.15 ± 7.10 7.00 ± 7.89 5.62 ± 4.87 2.31 ± 1.17 6.18 ± 3.84 3.46 ± 3.13 3.89 ± 8.28 4.80 ± 2.22
PD 8.94 ± 12.64 10.39 ± 10.05 7.49 ± 11.29 10.45 ± 10.12 8.54 ± 1.06 6.48 ± 5.31 5.23 ± 6.21 6.12 ± 10.60 3.74 ± 1.89
PACO 2 4.29 ± 4.83 4.43 ± 4.37 4.38 ± 6.67 1.06 ± 1.43 1.80 ± 0.66 0.90 ± 0.96 2.04 ± 1.18 2.63 ± 1.22 7.44 ± 4.81
PAO 2 2.48 ± 3.10 2.33 ± 3.05 2.62 ± 3.34 1.65 ± 1.06 0.17 ± 0.13 1.09 ± 1.73 0.38 ± 1.31 0.98 ± 0.78 1.98 ± 1.28
Table 4. Parameter optimization trend and prediction results for DB1 records.
Parameter DB1
1 2 3
Fitted Fitted Fitted Pred.
Cardiovascular Controller
G T , v 0.0792 0.0886 0.0840 0.0967
T 0 0.6704 0.6712 0.6712 0.6709
I 0 , m e t 0.4266 0.4266 0.3845 *
I 0 , s p 0.650 0.461 0.461 0.550
P a C O 2 , n 41.5 41.5 39.0 *
k m e t 0.180 0.173 0.162 0.172
Cardiovascular System
K R l v 0.000437 0.000448 0.000475 0.000463
L p a 0.000180 0.000181 0.000175 0.000176
L s a 0.000220 0.000184 0.000236 0.000256
R s a 0.0478 0.0488 0.0476 0.0479
Gas Exchange System
α 2 0.0559 0.0559 0.0609 *
C 1 8.80 9.21 8.84 9.02
K 2 194.40 207.10 207.10 196.29
M R B C O 2 0.00074 0.00074 0.00106 0.00092
Respiratory Controller
K b g 17.42 17.69 18.97 17.99
K c C O 2 0.2792 0.2967 0.2989 0.2923
K p C O 2 0.20250 0.20238 0.20238 0.20241
K p O 2 6.79x10⁻⁹ 8.69x10⁻⁹ 7.80x10⁻⁹ 1.14x10⁻⁸
λ 1 0.876 0.825 0.819 0.838
λ 2 0.368 0.343 0.397 0.334
n 1.722 1.878 1.676 1.730
P m a x 94.9 82.1 82.1 93.0
Respiratory Mechanics
E r s 27.47 24.37 25.56 28.08
R r s 3.53 2.97 3.08 3.15
Table 5. Parameter optimization trend and prediction results for DB2 records.
Parameter DB2
1 2 3 4 5 6
Fitted Fitted Fitted Pred. Fitted Pred. Fitted Pred. Fitted Pred.
Cardiovascular Controller
G T , s -0.130 -0.130 -0.130 -0.130 -0.092 * -0.092 ** -0.092 -0.113
G T , v 0.102 0.108 0.081 0.109 0.081 0.066 0.045 0.041 0.054 **
G R e p 1.940 1.940 1.940 1.940 1.876 * 1.876 2.432 1.613 **
T 0 0.588 0.588 0.549 * 0.581 0.542 0.571 0.631 0.571 **
I 0 , m e t 0.55254 0.55254 0.55360 * 0.55360 0.55384 0.55360 0.55503 0.55360 0.55360
k m e t 0.180 0.182 0.182 0.189 0.182 0.181 0.182 0.178 0.182 0.182
P a C O 2 , n 40.0 40.0 46.2 * 46.2 ** 55.4 51.8 39.8 58.3
P n 117.3 96.2 74.5 ** 92.6 ** 92.6 68.4 92.3 90.7
Φ m a x 22.03 22.03 26.00 * 26.00 26.47 26.00 25.25 26.00 26.00
Cardiovascular System
K E l v 0.0105 0.0098 0.0098 0.0068 0.0098 0.0099 0.0098 0.0109 0.0098 0.0097
K E r v 0.0116 0.0078 0.0078 ** 0.0079 0.0078 0.0087 0.0071 0.0109 **
K R l v 0.000477 0.000469 0.000486 0.000434 0.000363 0.000488 0.000488 ** 0.000431 0.000233
K R r v 0.0014 0.0014 0.0014 0.0014 0.0013 * 0.0013 ** 0.0013 **
R s a 0.053 0.054 0.053 0.055 0.053 0.053 0.046 0.052 0.090 **
Gas Exchange System
a 2 1.819 1.819 1.819 1.819 1.819 1.819 1.819 1.819 2.365 *
α 2 0.05591 0.05591 0.05591 0.05591 0.06029 * 0.06029 ** 0.06029 0.05792
C 1 11.10 11.10 10.65 10.68 10.14 10.54 9.64 ** 10.05 9.64
C 2 87.00 93.77 93.77 88.29 93.77 93.76 93.77 ** 93.77 **
K 2 194.40 194.40 149.91 * 149.91 ** 149.91 149.91 149.91 **
M R B C O 2 0.00098 0.00081 0.00075 ** 0.00063 0.00076 0.00066 0.00053 0.00065 **
V T C O 2 15.0 15.0 15.0 15.0 15.0 15.0 15.1 * 15.1 **
Respiratory Controller
K b g 25.13 22.98 22.73 24.65 20.72 21.33 21.76 21.95 20.33 **
K c C O 2 0.4385 0.4573 0.4481 0.5398 0.4559 0.4167 0.4664 0.4593 0.4664 0.5005
K p C O 2 0.20250 0.17739 0.16777 ** 0.16777 0.16555 0.15523 ** 0.19200 **
K p O 2 2.69x10⁻⁹ 3.76x10⁻⁹ 3.85x10⁻⁹ ** 2.36x10⁻⁹ ** 4.80x10⁻⁹ 3.06x10⁻⁹ 3.54x10⁻⁹ **
λ 1 0.458 0.752 0.899 ** 0.609 0.933 0.609 ** 1.099 **
λ 2 0.468 0.245 0.691 ** 0.348 0.794 0.348 ** 0.348 **
n 1.362 0.834 0.899 ** 1.123 1.794 1.016 ** 1.348 **
P ˙ m a x 1055.4 1055.4 1069.8 * 1069.8 1072.9 1069.8 1069.8 1069.8 1069.8
P m a x 72.2 47.7 51.2 68.5 63.5 90.1 93.9 ** 58.7 **
V 0 d e a d 0.2381 0.2278 0.2381 0.1831 0.2273 0.2358 0.2273 0.3339 0.2319 0.2057
Respiratory Mechanics
E r s 19.86 29.00 29.00 21.60 26.72 27.14 29.00 29.01 26.21 **
R r s 3.06 3.06 3.50 * 3.50 3.60 3.50 4.10 3.50 3.50
Disclaimer/Publisher’s Note: The statements, opinions and data contained in all publications are solely those of the individual author(s) and contributor(s) and not of MDPI and/or the editor(s). MDPI and/or the editor(s) disclaim responsibility for any injury to people or property resulting from any ideas, methods, instructions or products referred to in the content.
Copyright: This open access article is published under a Creative Commons CC BY 4.0 license, which permit the free download, distribution, and reuse, provided that the author and preprint are cited in any reuse.
Prerpints.org logo

Preprints.org is a free preprint server supported by MDPI in Basel, Switzerland.

Subscribe

© 2024 MDPI (Basel, Switzerland) unless otherwise stated