Submitted:
30 May 2023
Posted:
31 May 2023
You are already at the latest version
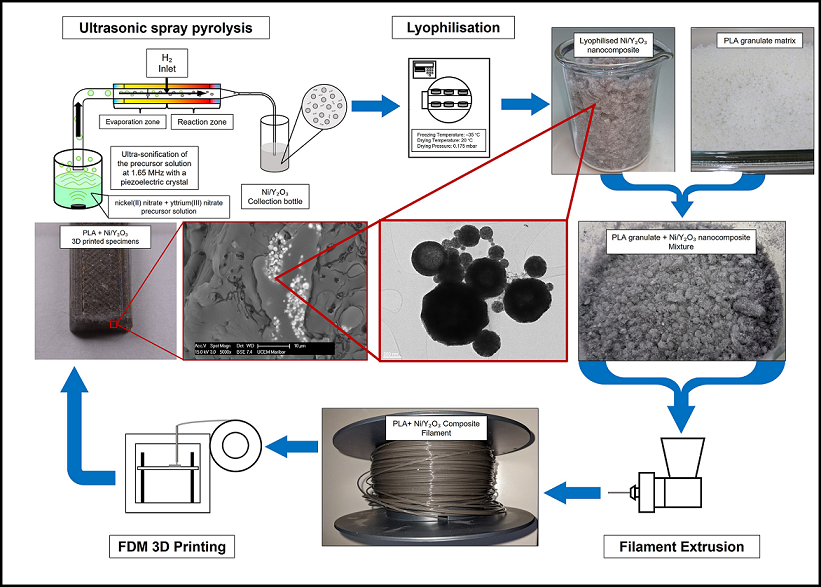
Abstract
Keywords:
1. Introduction
2. Materials and Methods
2.1. Materials
2.2. Nanocomposite particle synthesis
2.2.1. Ultrasound spray pyrolysis
2.2.1. Lyophilisation
2.3. Composite preparation
2.3.1. Extrusion process
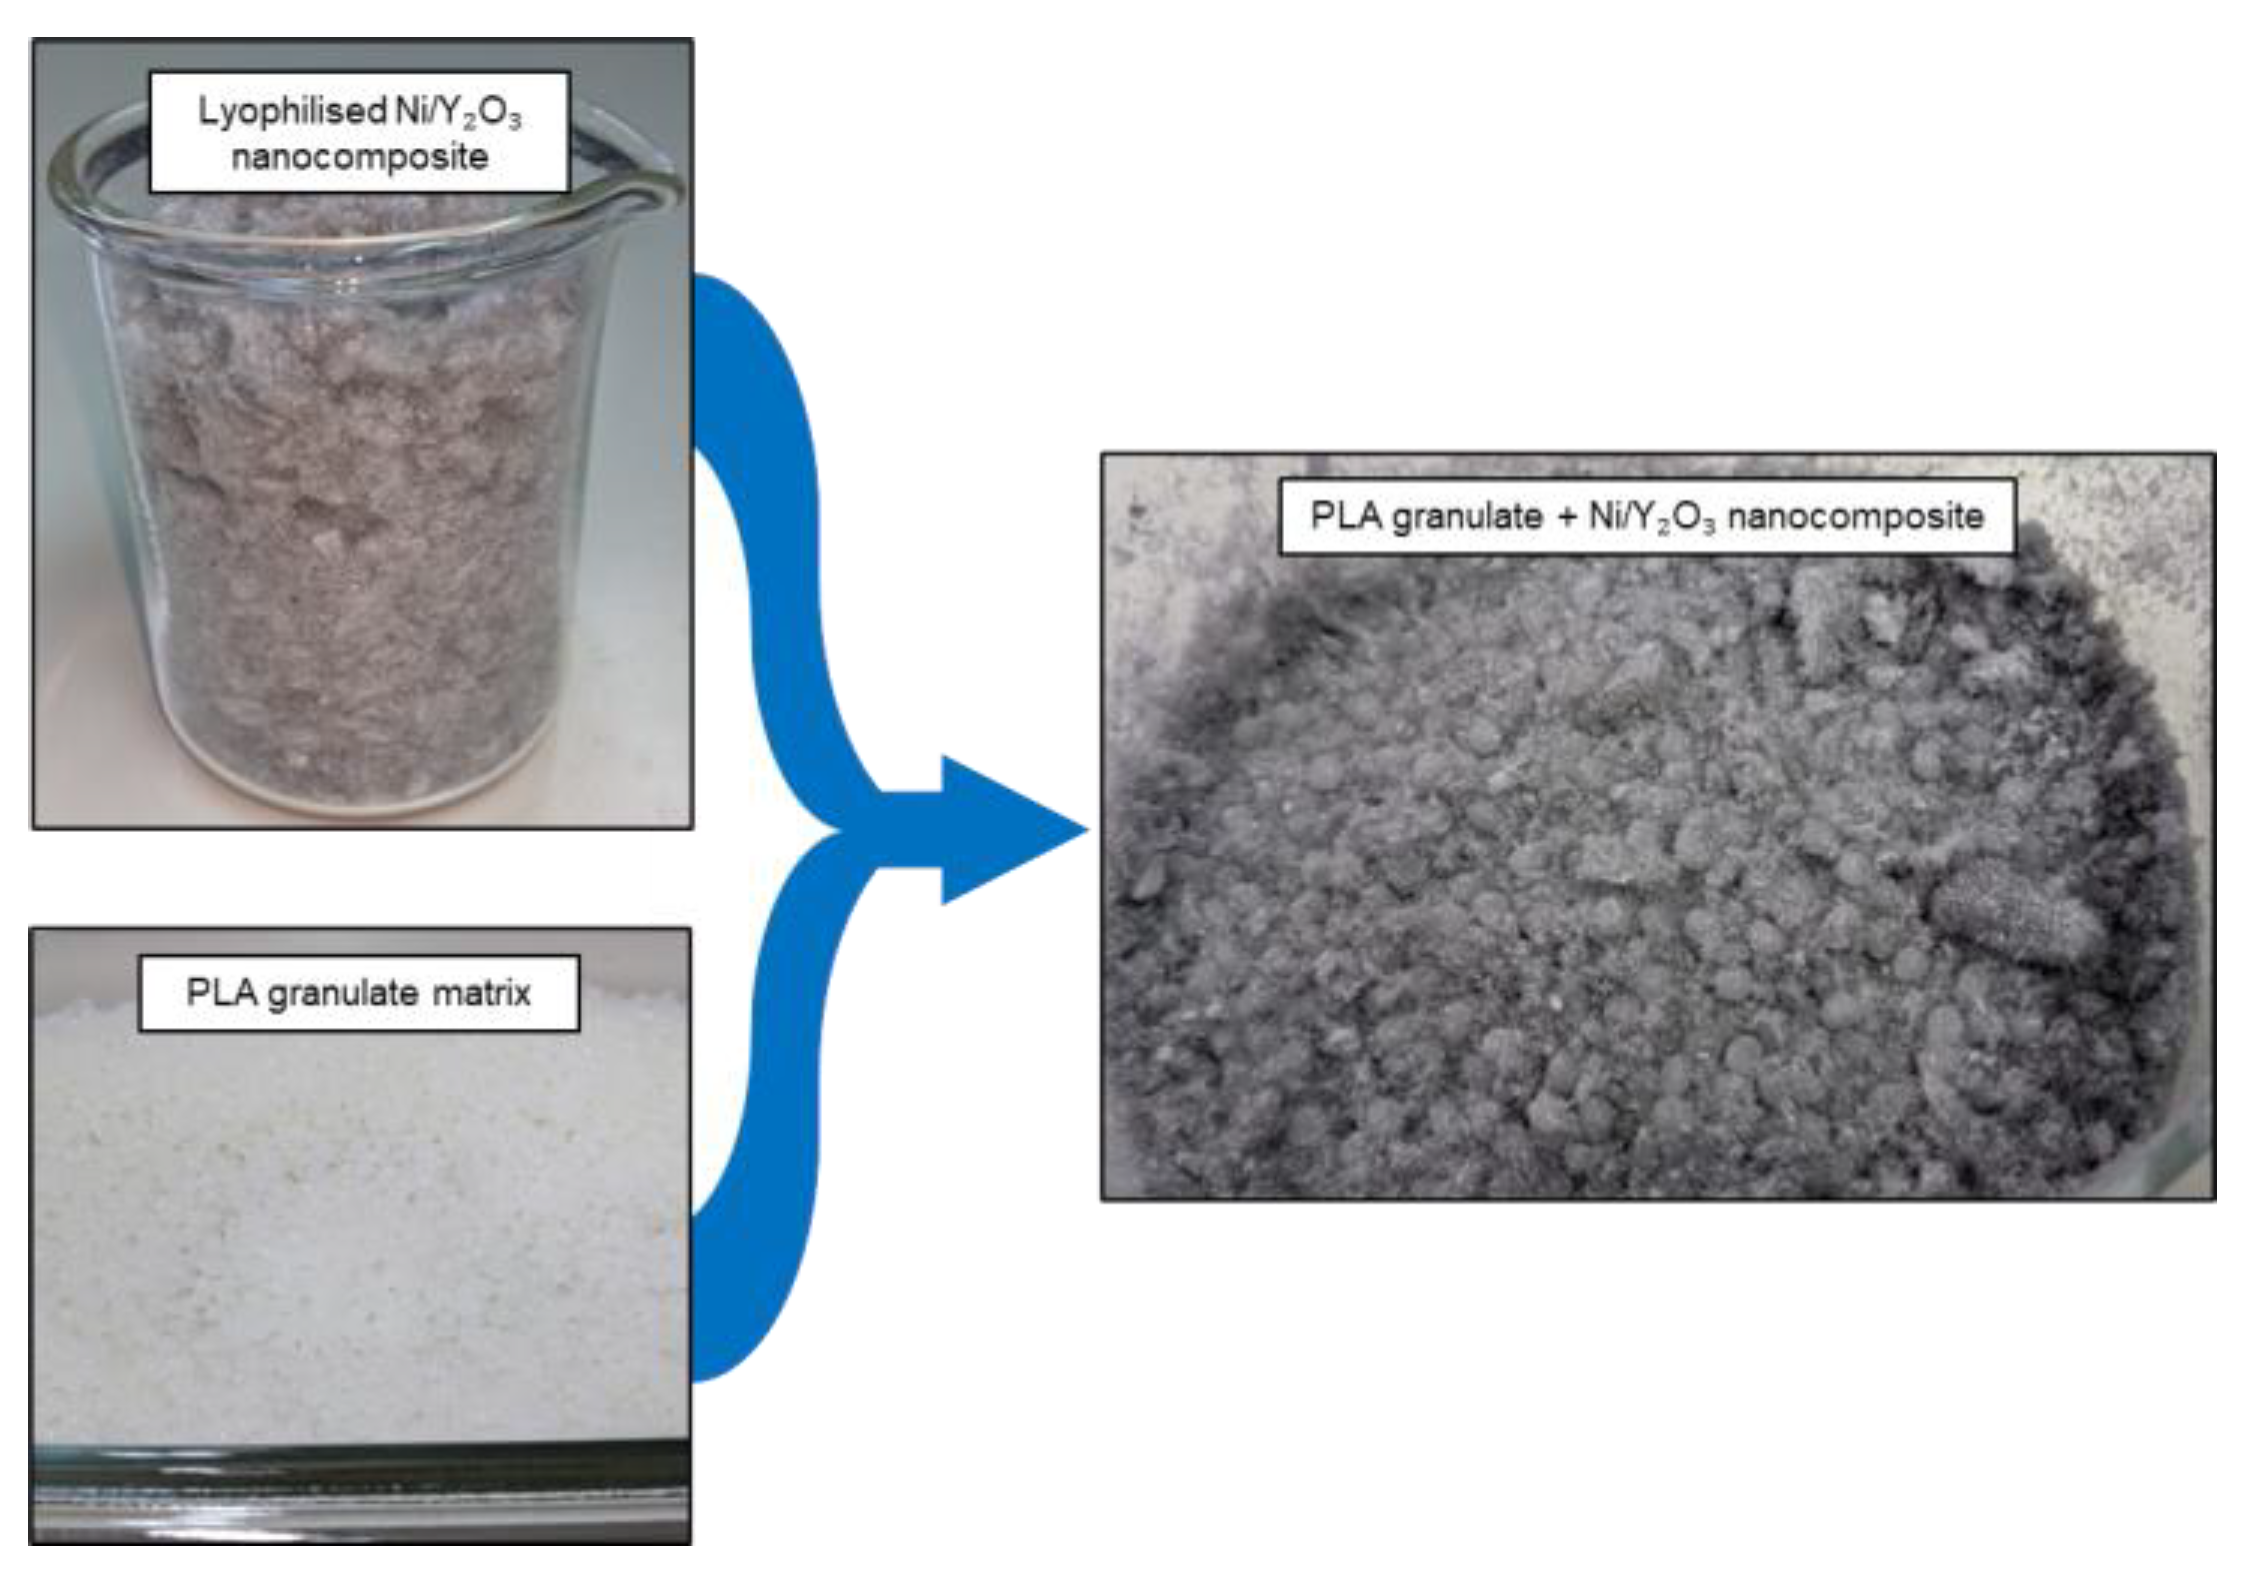
2.3.2. FFF 3D printing
2.4. Nanocomposite characterization methods
2.4.1. Transmission electron microscopy
2.4.2. Viscosity and drying times
2.5. PLA Ni/Y2O3 composite characterization methods
2.5.1. Mechanical properties
2.5.2. Scanning electron microscopy
3. Results and discussion
3.1. Transmission electron microscopy
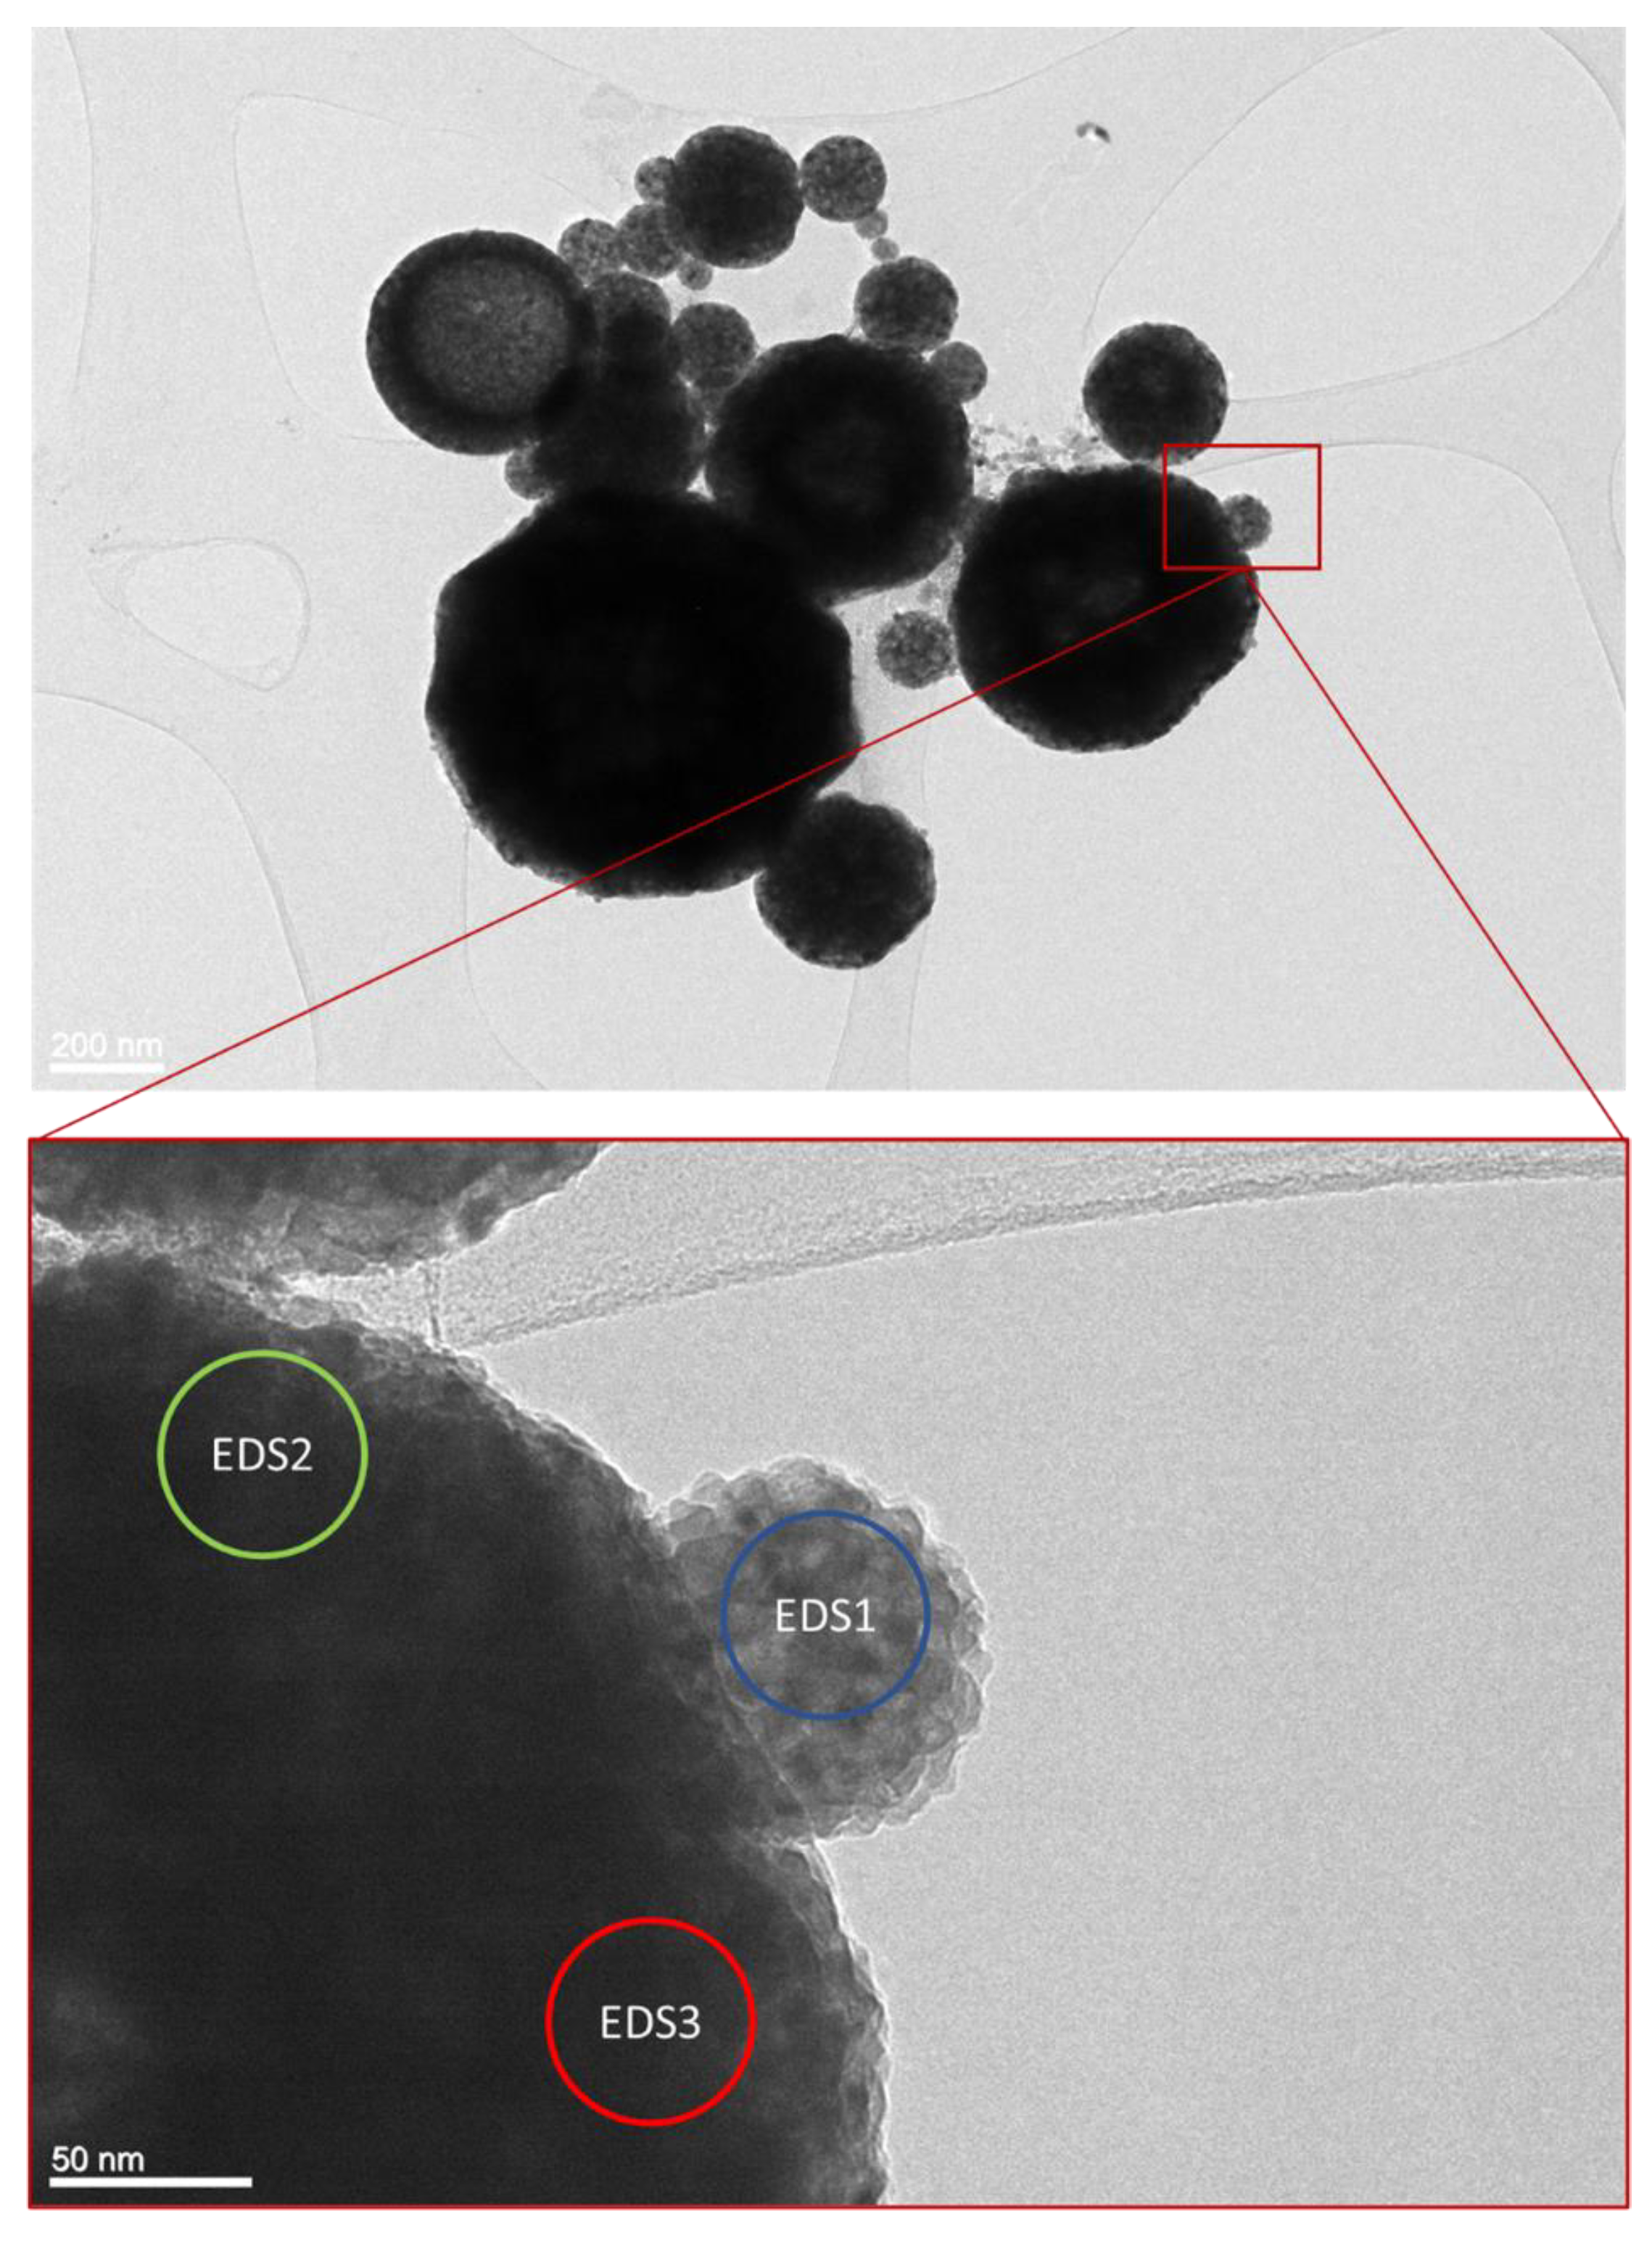
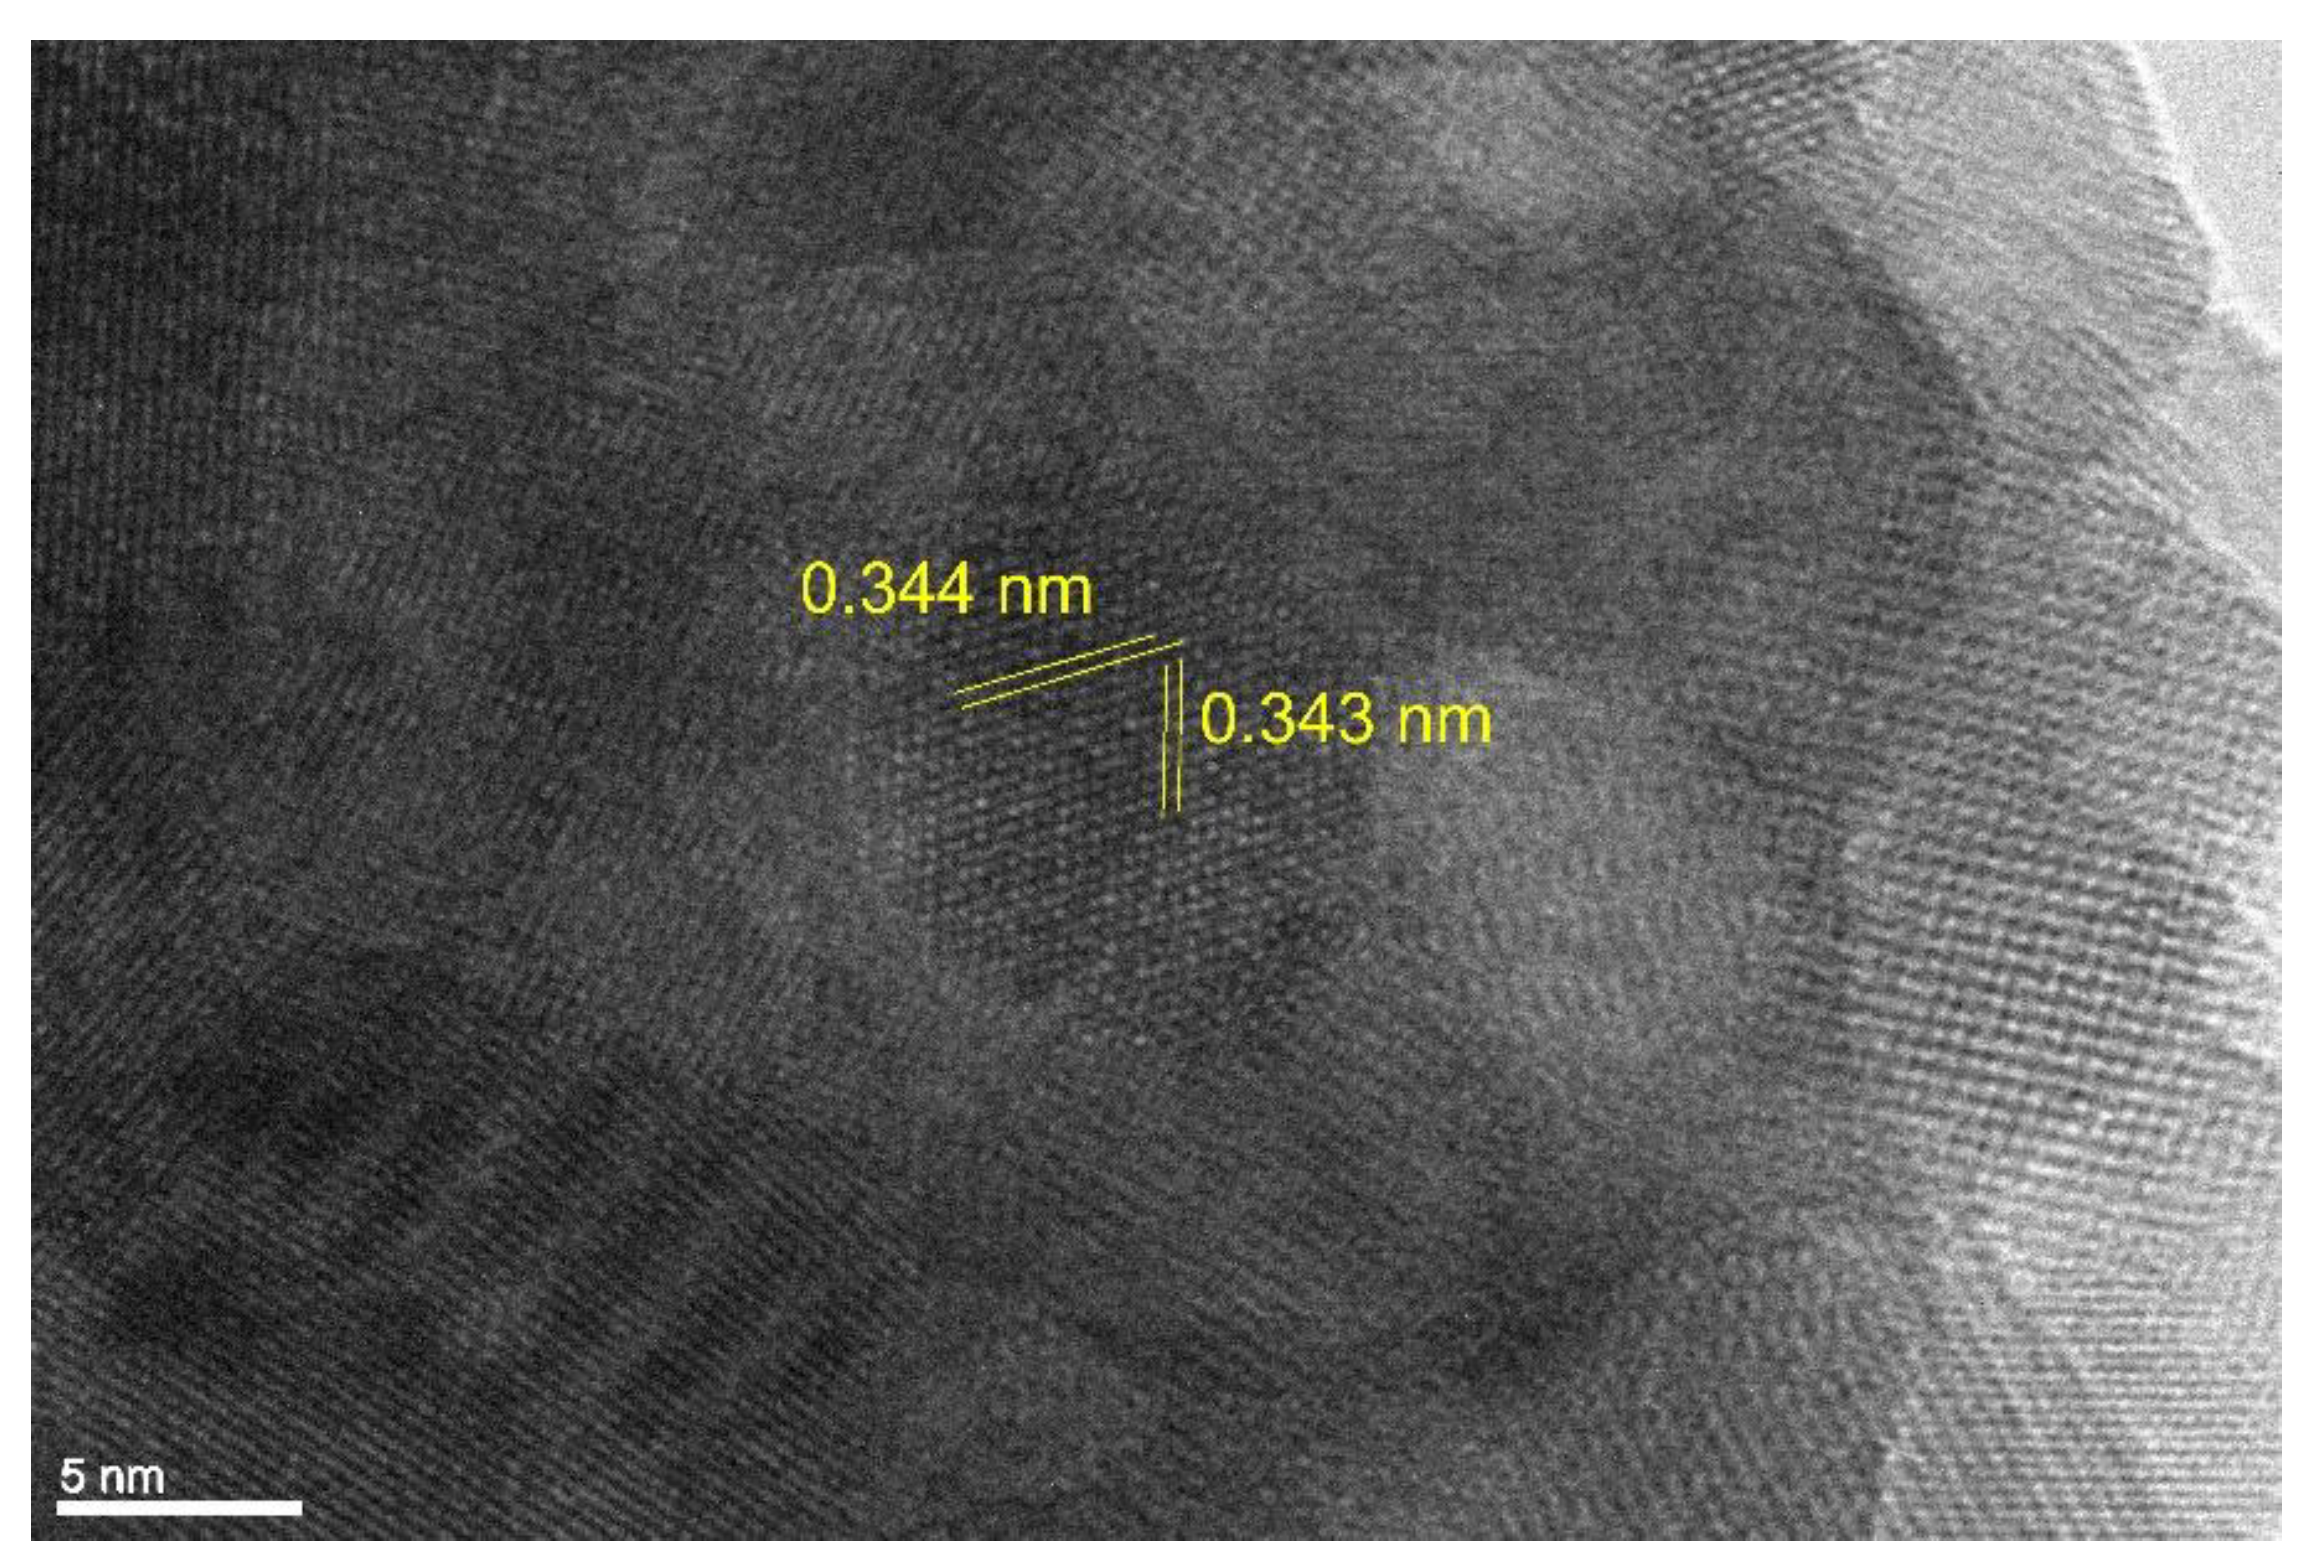
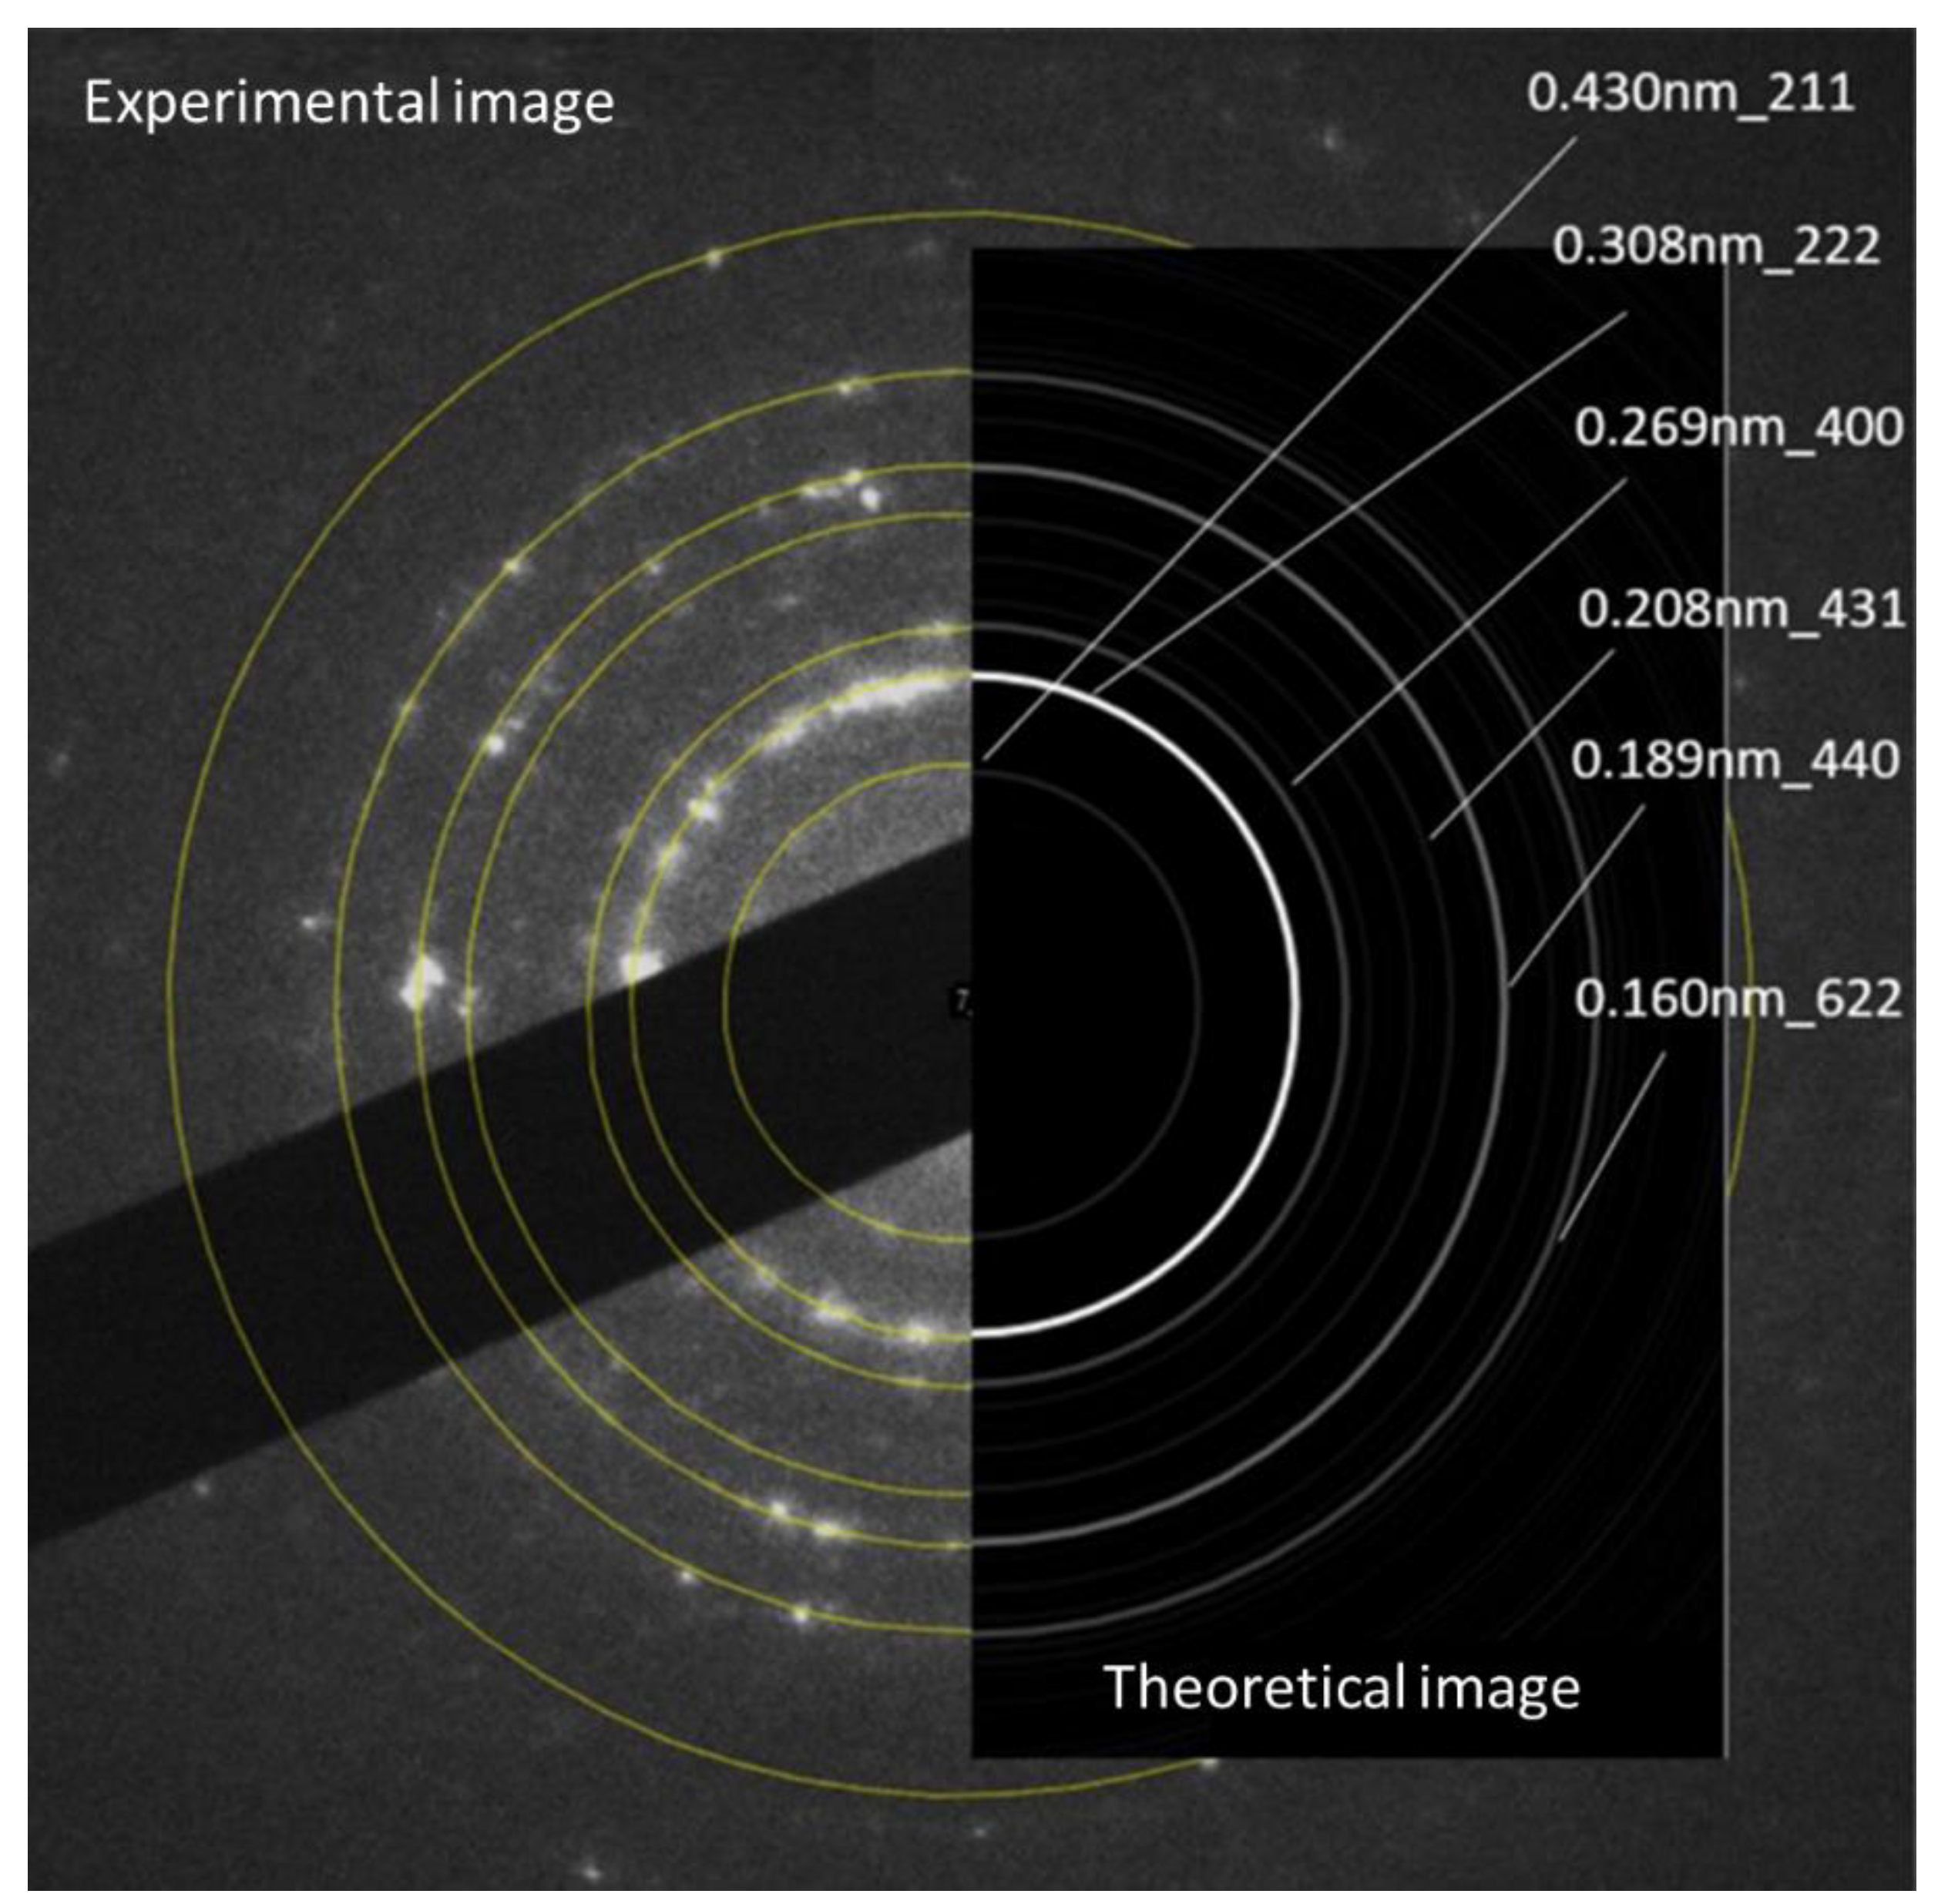
| Element | EDS 1 [at. %] | EDS 2 [at. %] | EDS 3 [at. %] |
|---|---|---|---|
| O | 54.09 | 51.35 | 57.95 |
| Ni | 5.16 | 7.19 | 3.04 |
| Y | 40.75 | 41.46 | 39.01 |
| Total | 100.00 | 100.00 | 100.00 |
3.2. Viscosity and drying time
| PVP concentration [g/L] | Viscosity of water [mPa·s] | Viscosity of Ni/Y2O3 particles suspension [mPa·s] |
|---|---|---|
| 0.0 | 0.8±0.05 | 0.82±0.04 |
| 2.5 | 0.90±0.01 | 0.92±0.04 |
| 5.0 | 0.98±0.05 | 0.98±0.04 |
| 10.0 | 1.10±0.07 | 1.05±0.06 |
| 20.0 | 1.36±0.05 | 1.42±0.13 |
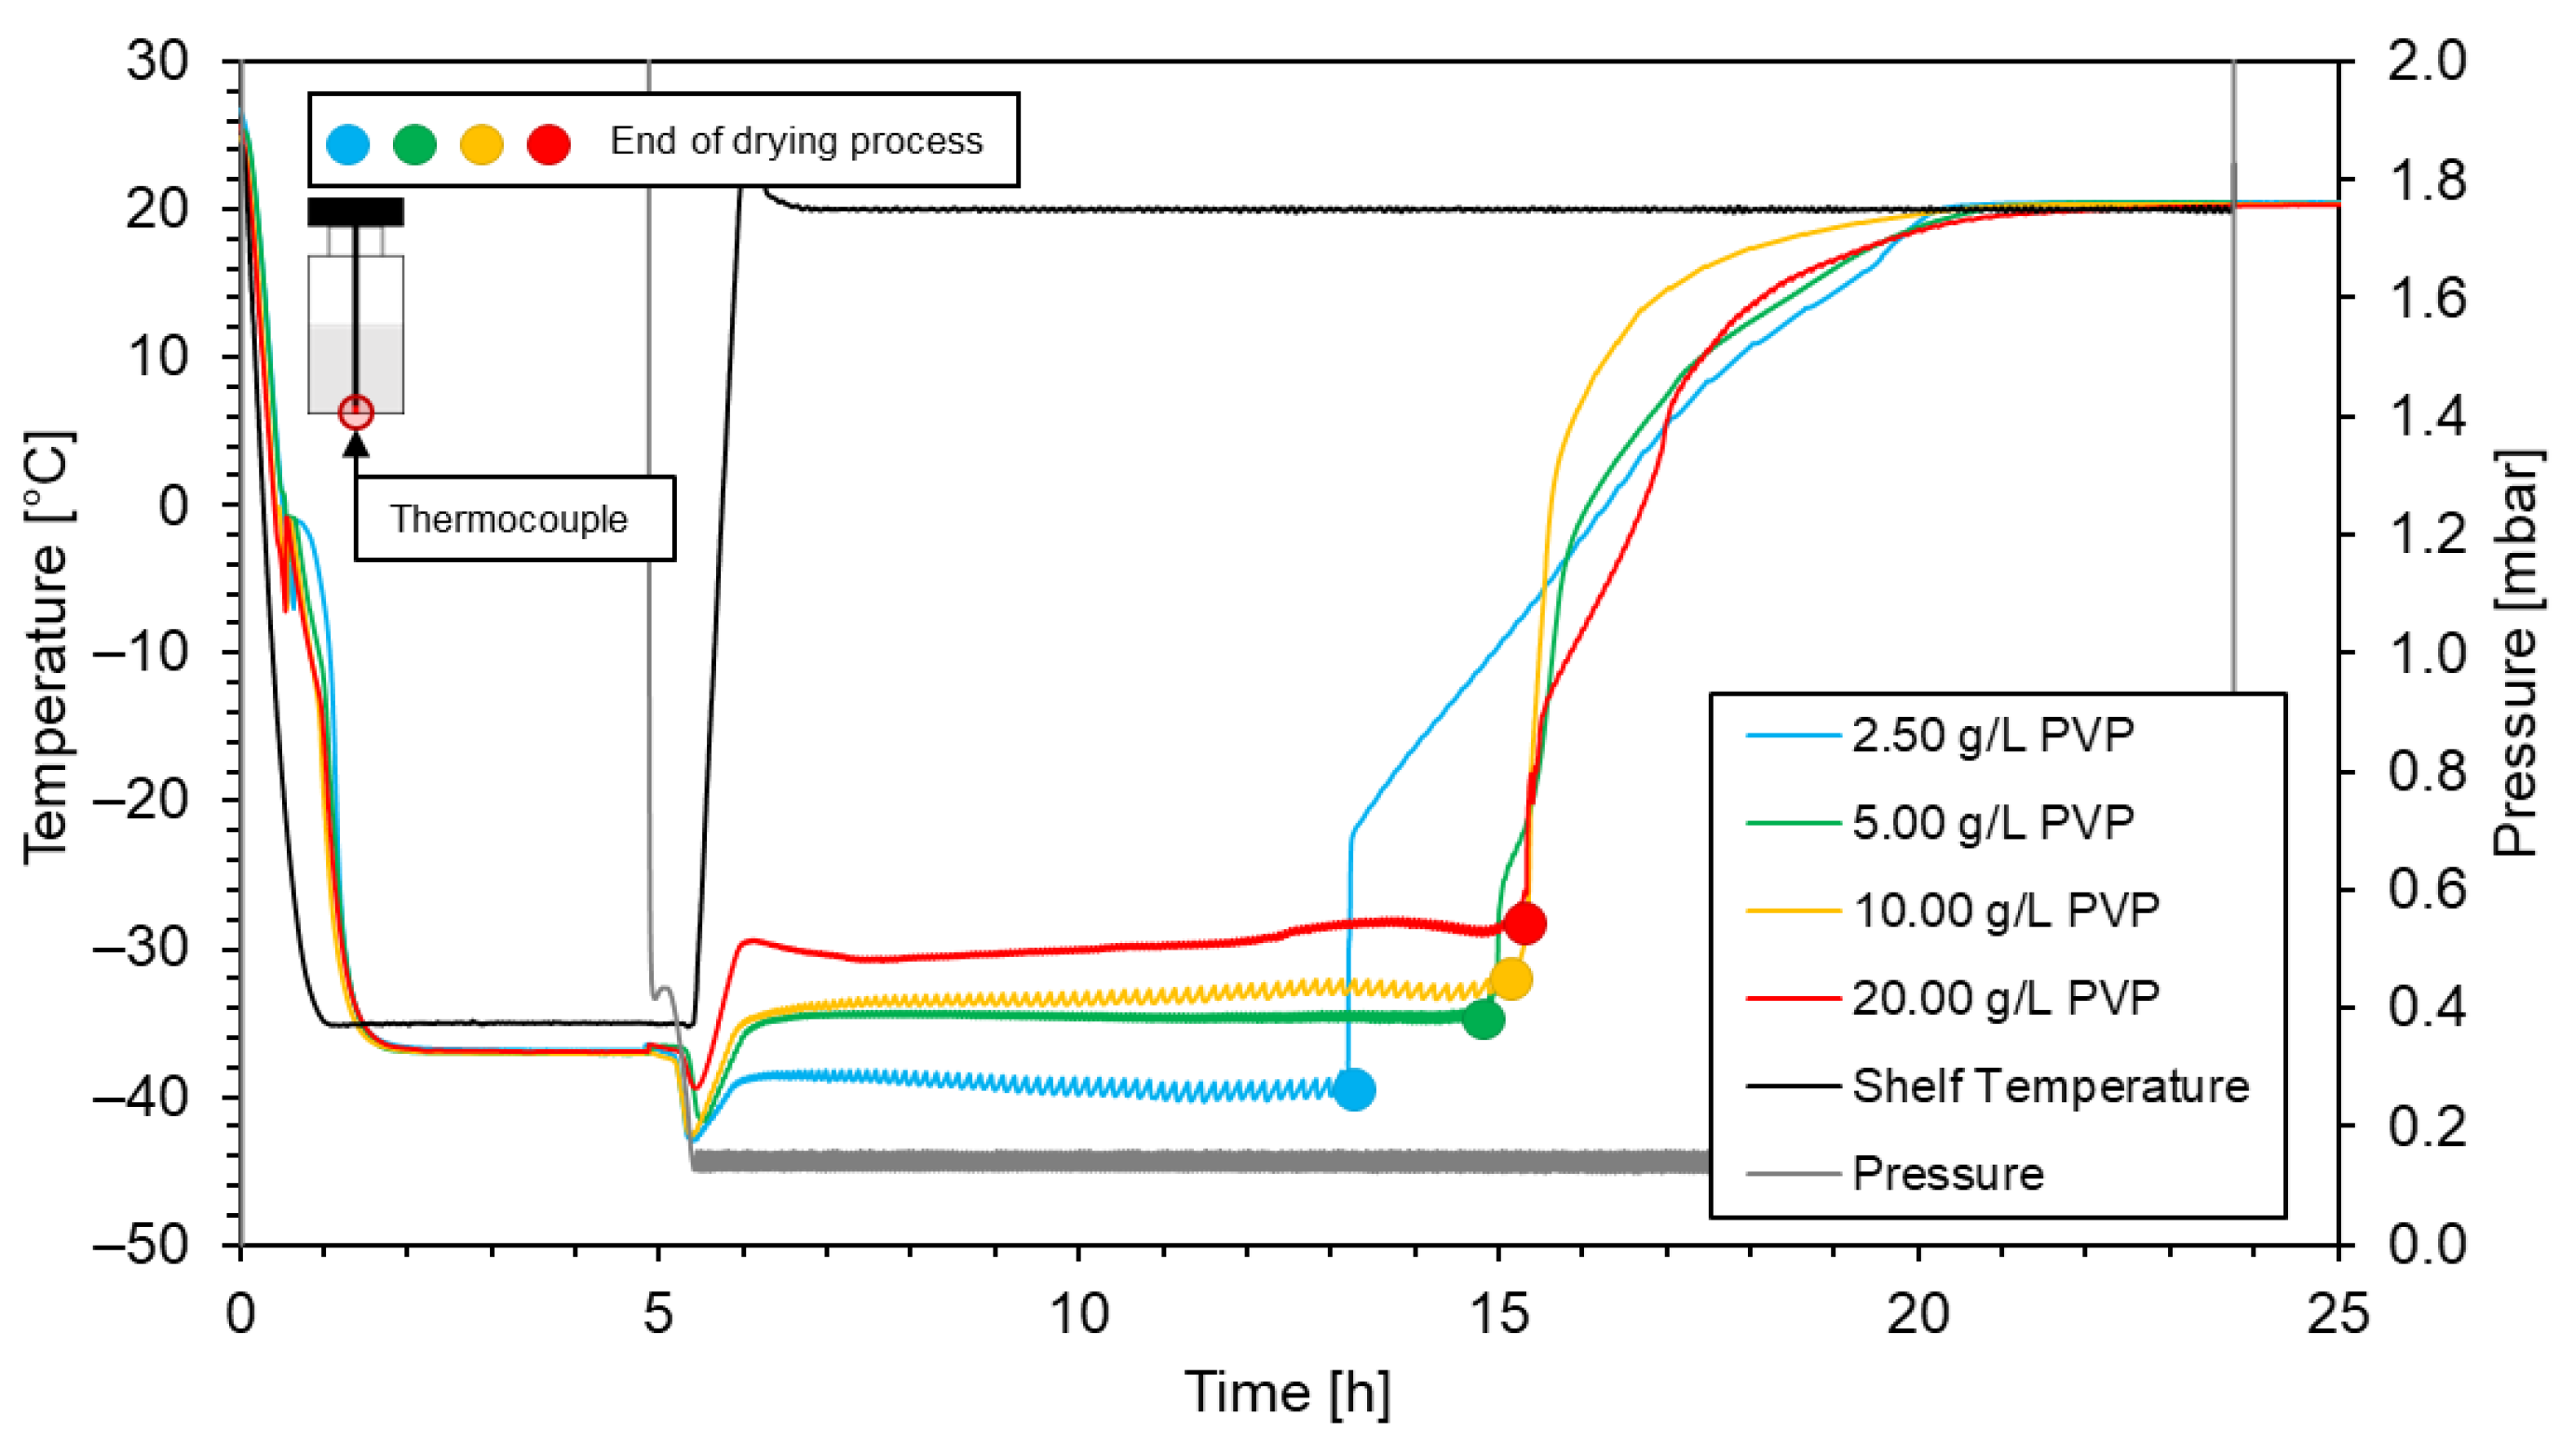
| PVP concentration [g/L] | Drying time |
|---|---|
| 2.50 | 7 h 36 min |
| 5.00 | 9 h 06 min |
| 10.00 | 9 h 30 min |
| 20.00 | 9 h 48 min |
3.3. Mechanical properties
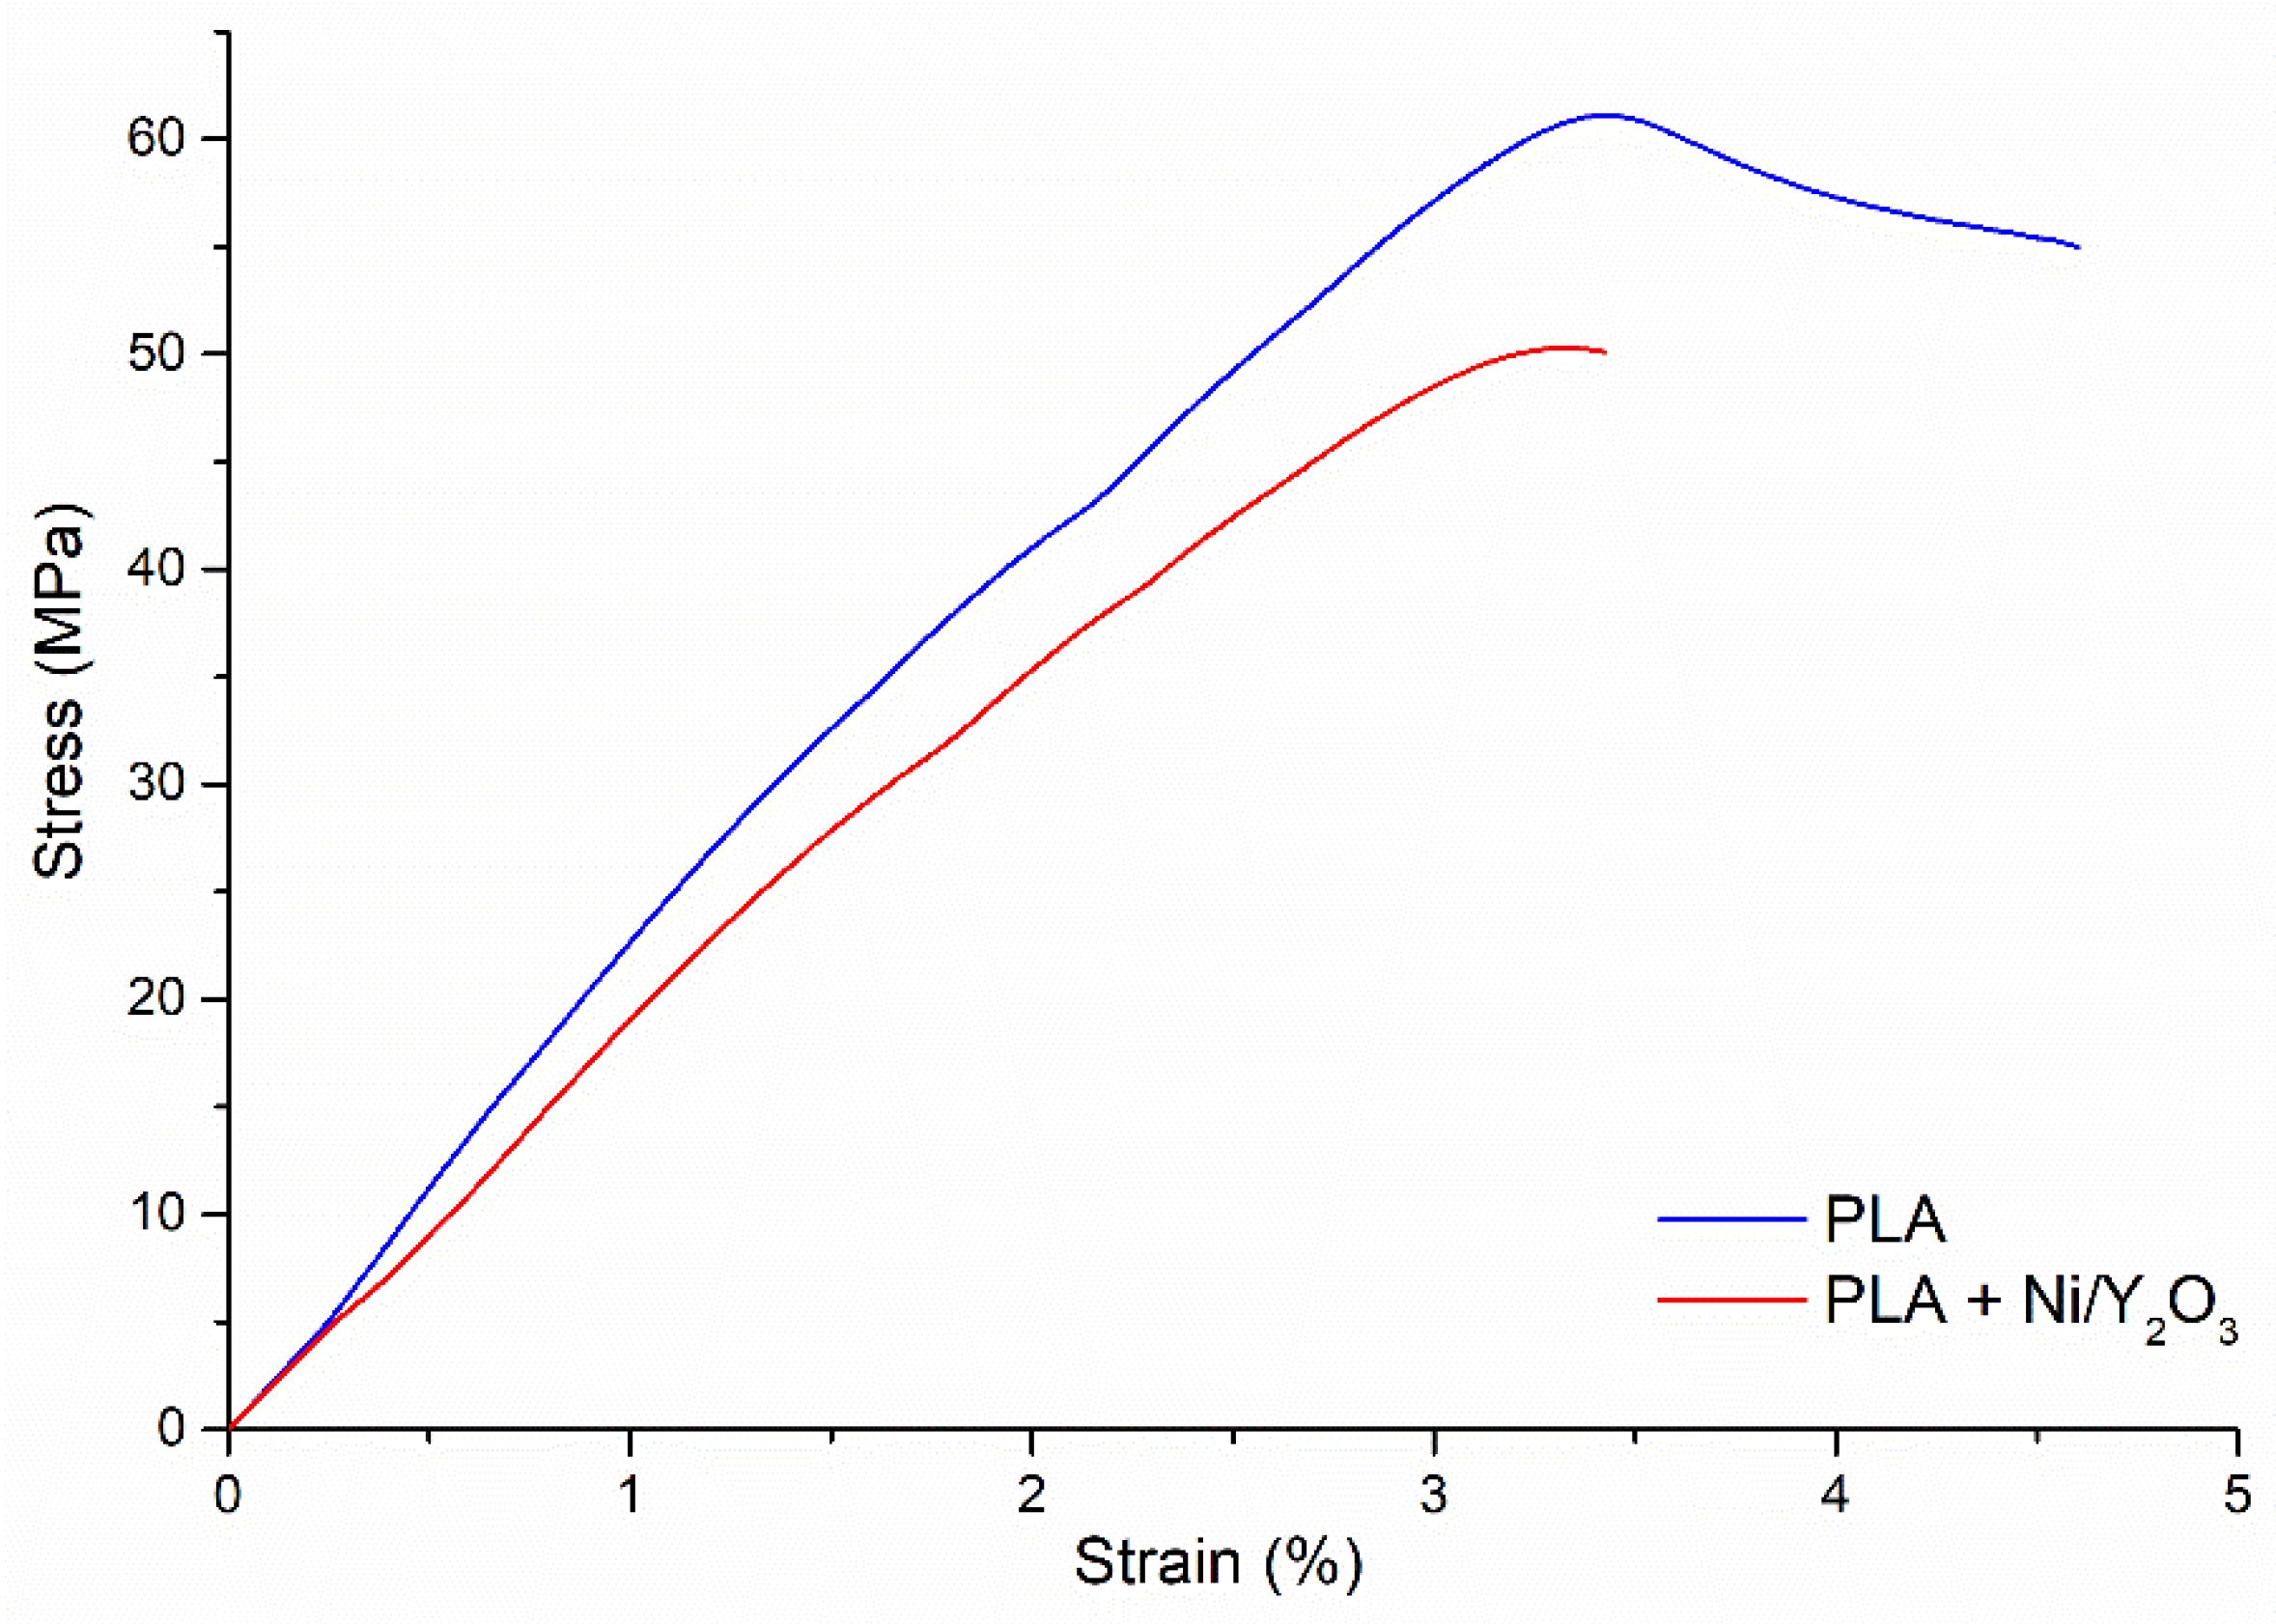
| Sample | Tensile modulus [MPa] | Tensile strength [MPa] | Strain at tensile strength [%] | Strain at break [%] |
|---|---|---|---|---|
| PLA | 2.62 ± 0.28 | 60.0 ± 1.1 | 3.3 ± 0.2 | 4.6 ± 0.5 |
| PLA/Ni/Y2O3 | 2.77 ± 0.32 | 50.8 ± 1.28 | 3.3 ± 0.1 | 3.6 ± 0.2 |
3.4. Scanning electron microscopy
4. Conclusions
- The USP method proved to be a highly effective green chemistry approach in the successful synthesis of Ni/Y2O3 nanocomposite particles.
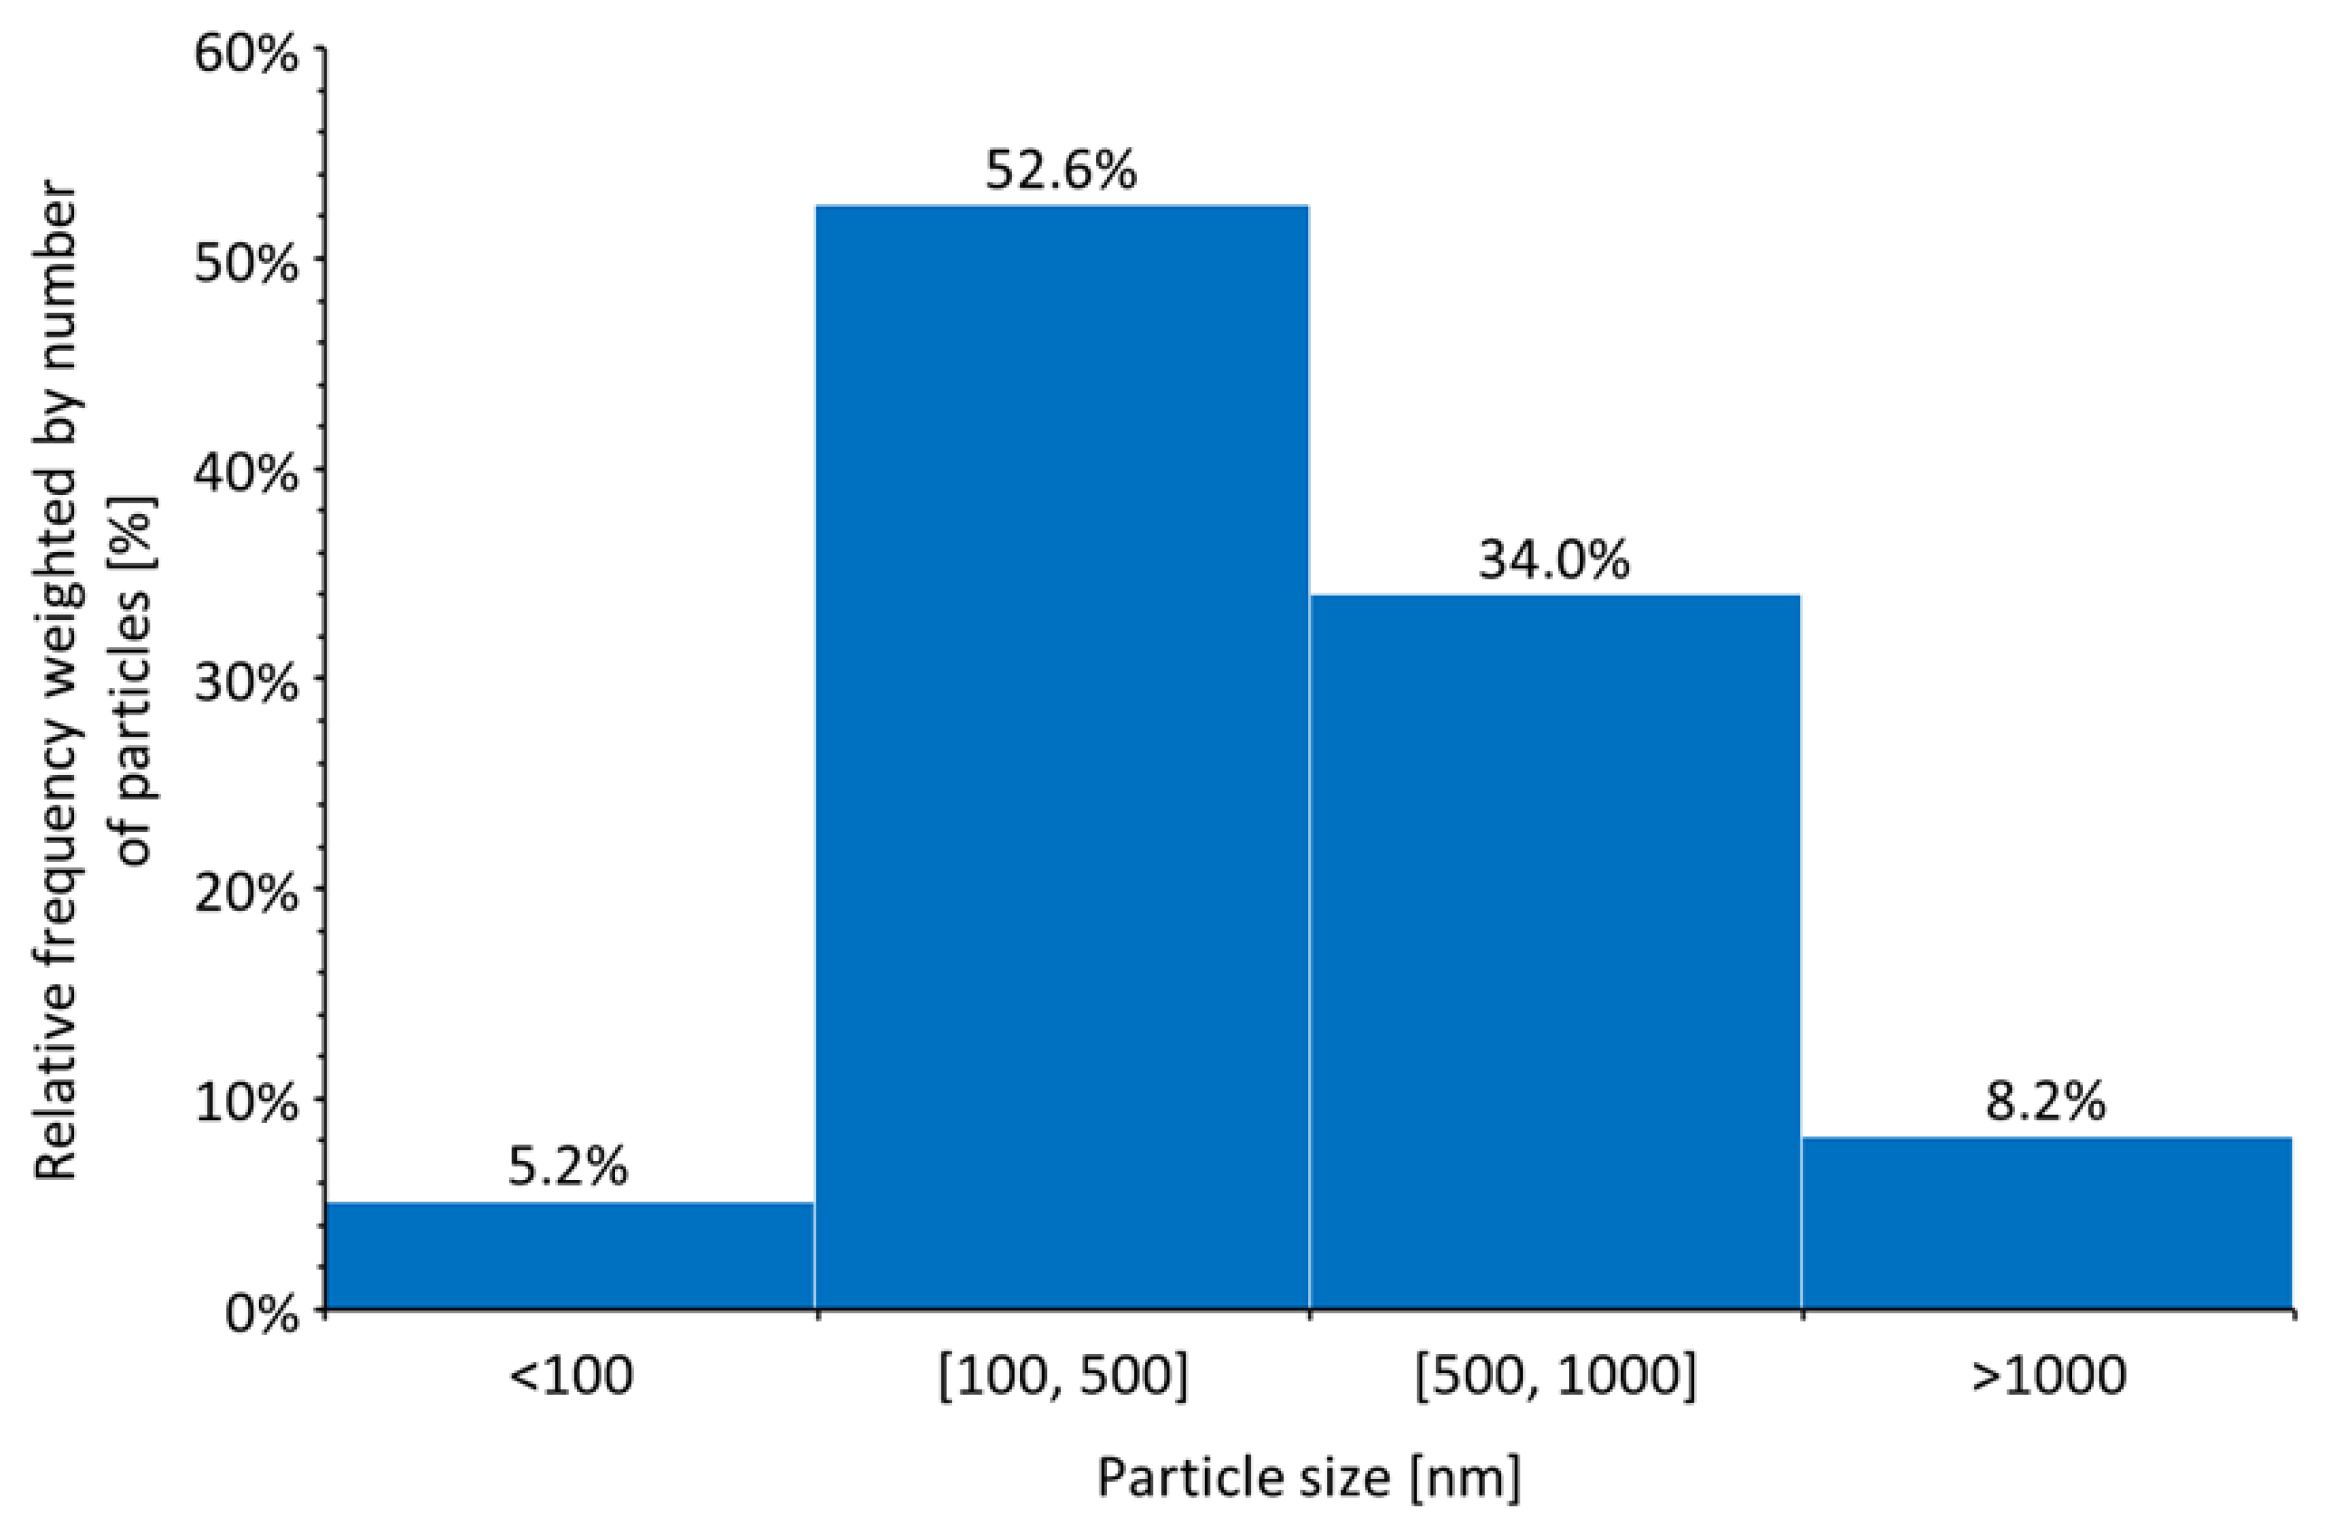
- The use of a modified, previously presented equation, allowed for accurate prediction of the particle size, which was confirmed by TEM analysis.
- The presence of the Y2O3 core and Ni shell was also confirmed with TEM and electron diffraction.
- The proper concentration of PVP in the nanoparticle suspension before lyophilisation leads to different cryostabilisation effects, stabilisation effects and optimal drying times.
- The lyophilisation process proved successful in obtaining a dried Ni/Y2O3 nanocomposite particle powder, and the PLA/Ni/Y2O3 composite material was extruded successfully and 3D printed using FDM technology.
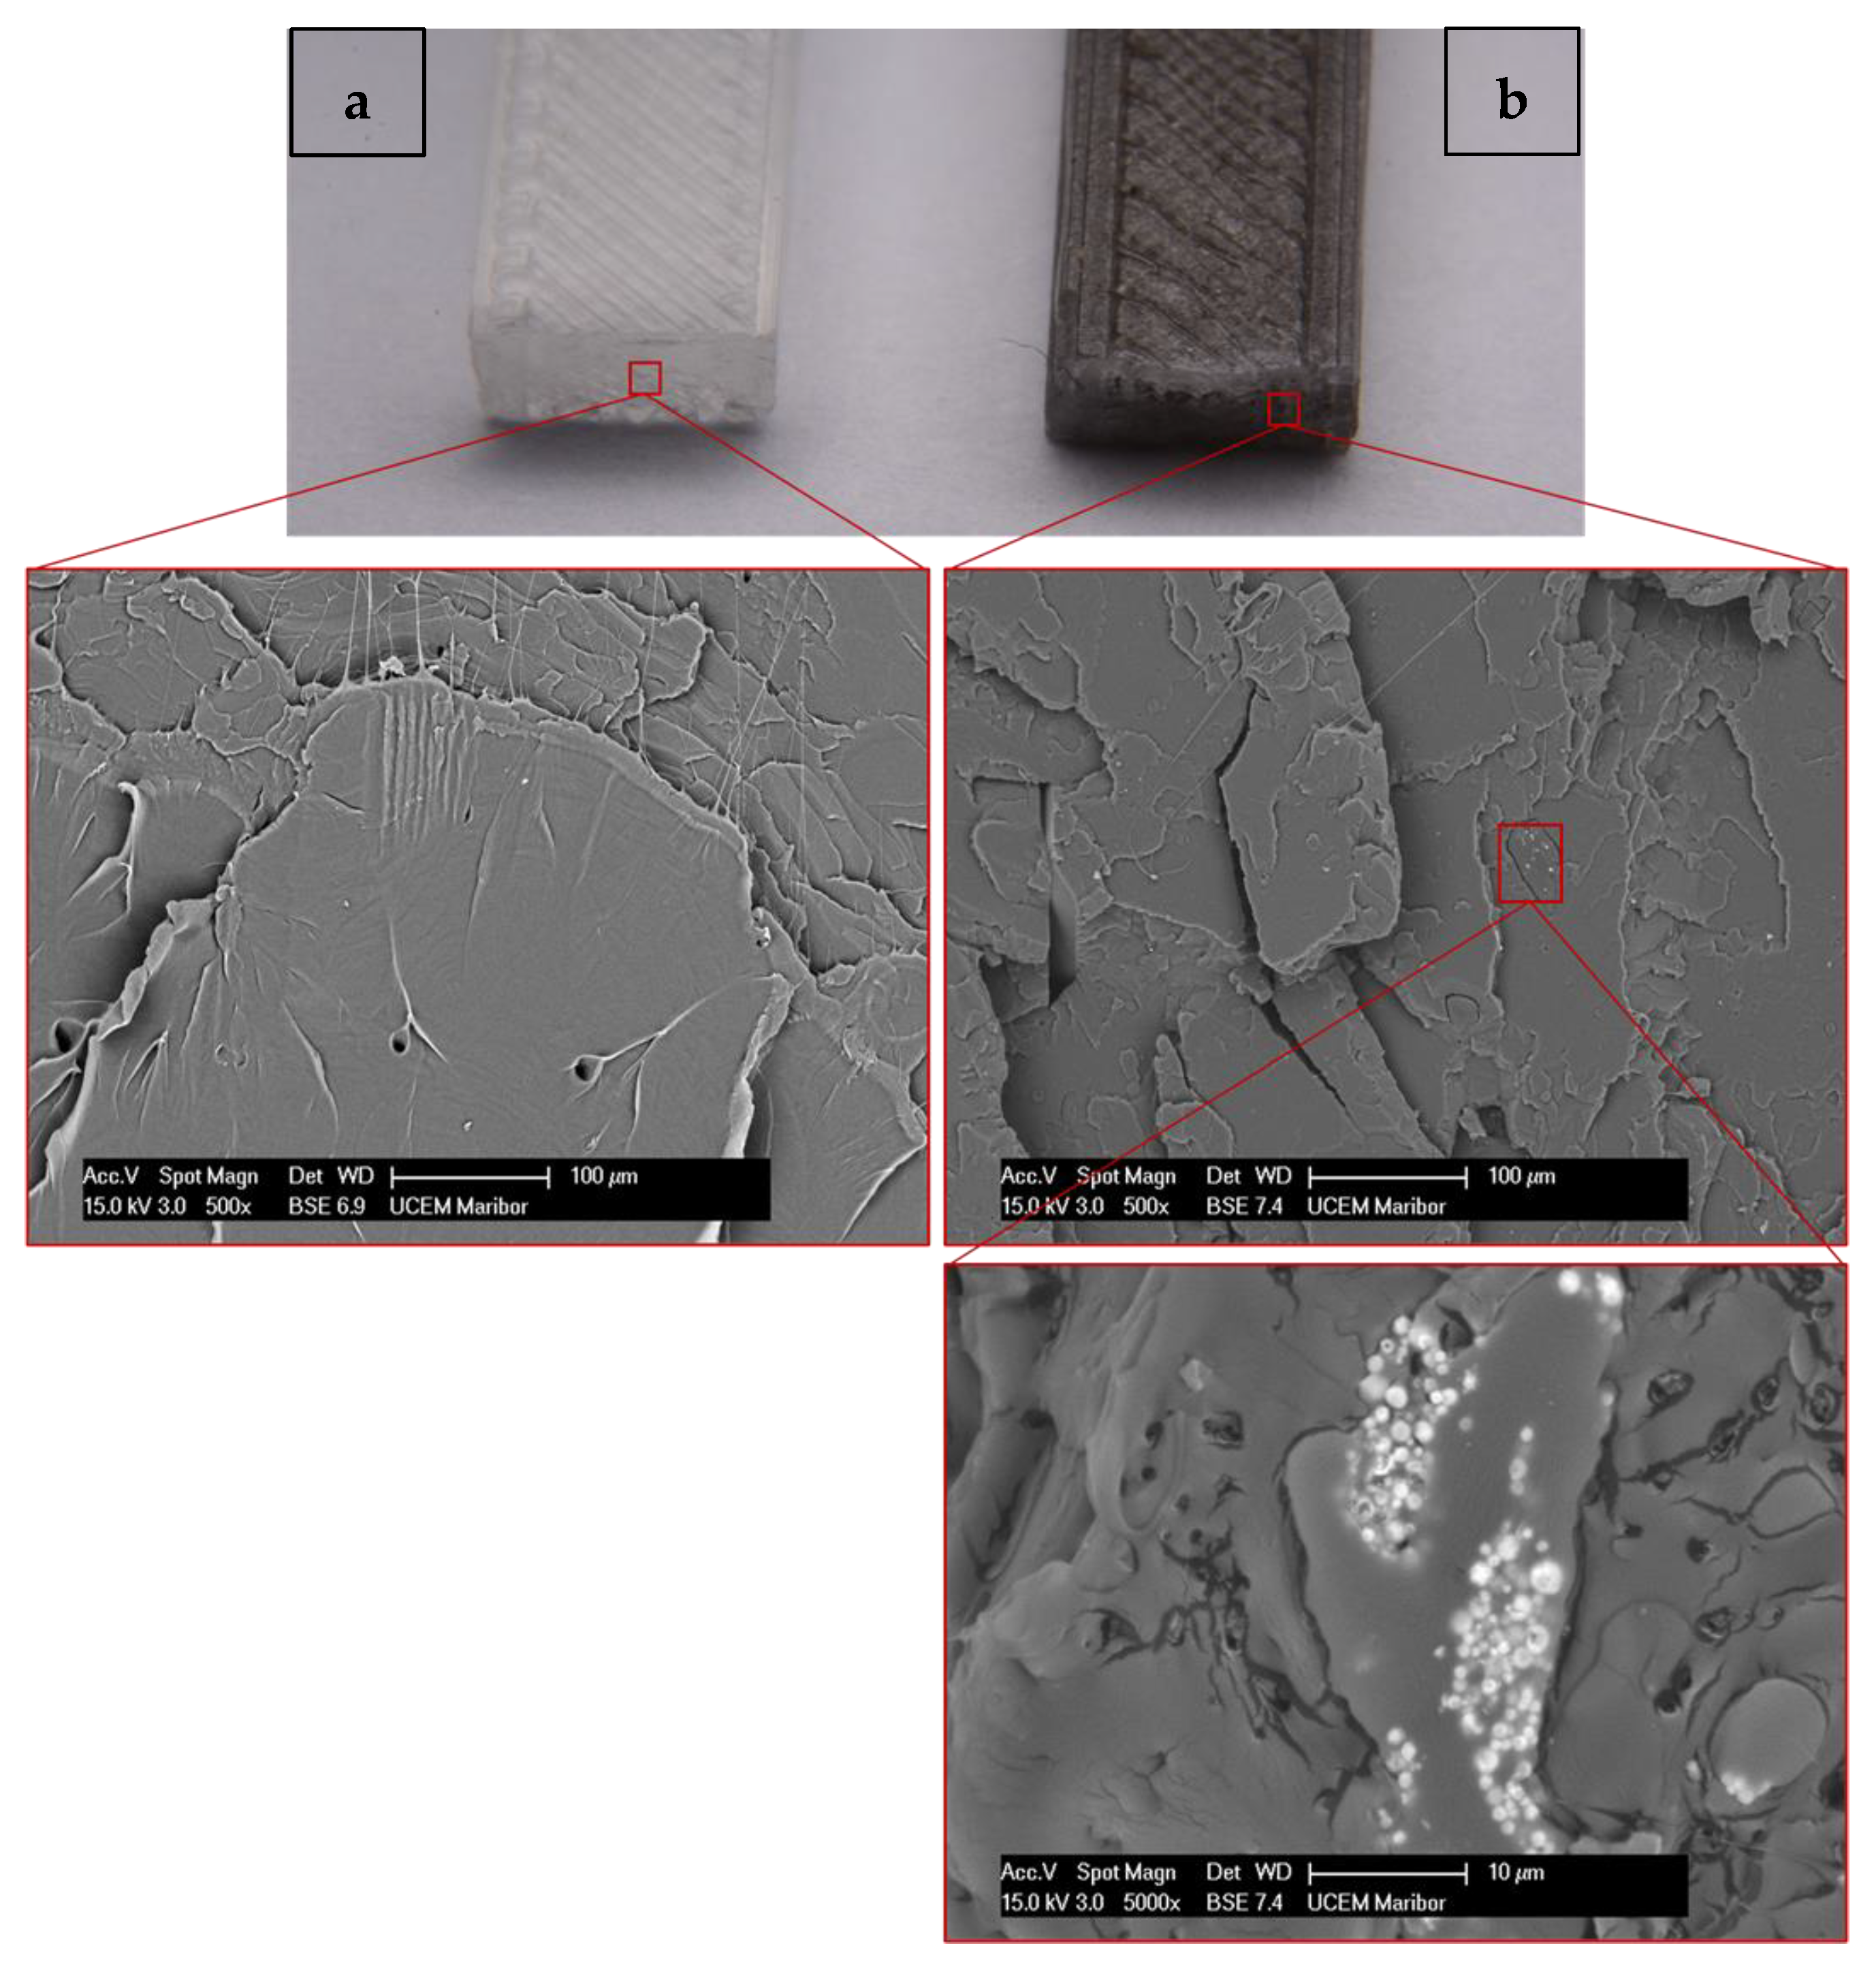
- Tensile strength decreased with the addition of Ni/Y2O3 nanoparticles, which is the result of their agglomeration in the PLA matrix.
- The fracture surfaces are different, as the fracture facets were significantly longer in the case of pure PLA, which indicates a higher toughness of PLA compared to the PLA/Ni/Y2O3 composite.
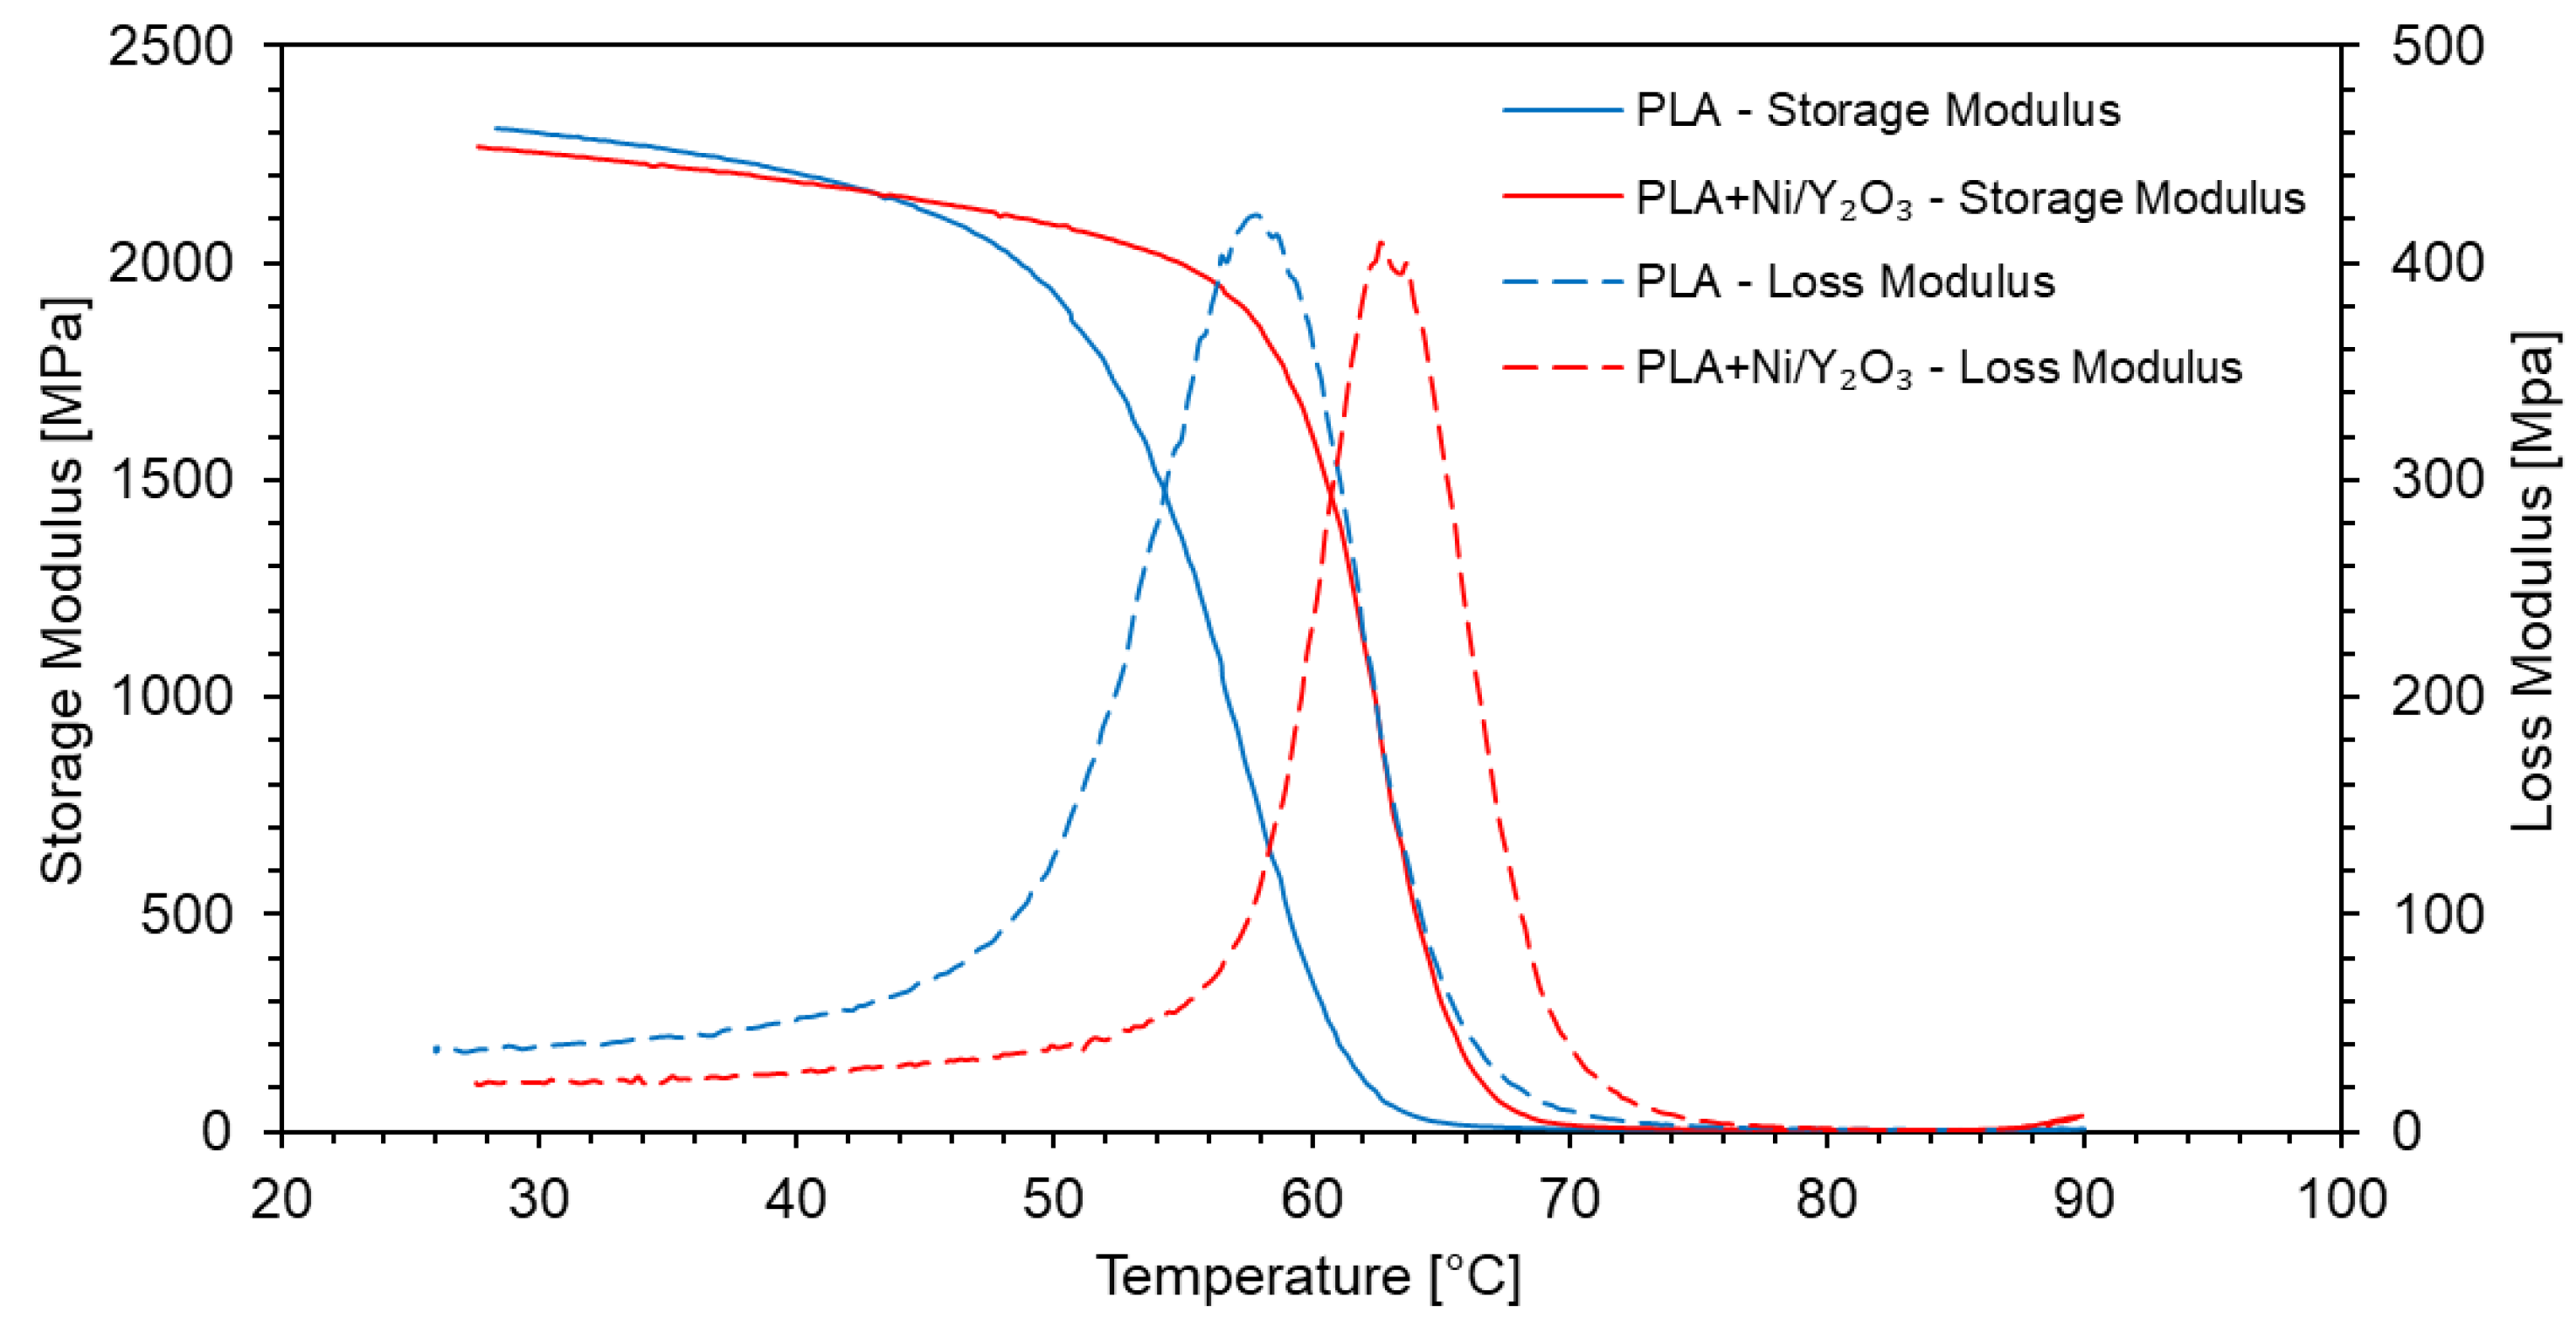
- The addition of Ni/Y2O3 particles in PLA resulted in an increase of 5 °C in the glass transition temperature, also evident from the position of the peak of the loss modulus.
Author Contributions
Funding
Acknowledgments
Conflicts of Interest
References
- Veleva, L.; Diaz-Ballote, L.; Wipf, D.O. An In Situ Electrochemical Study of Electrodeposited Nickel and Nickel-Yttrium Oxide Composite Using Scanning Electrochemical Microscopy. J. Electrochem. Soc. 2003, 150, C1. [Google Scholar] [CrossRef]
- Adekoya, J. A. , Ogunniran, K. O., Siyanbola, T. O., Dare, E. O., Revaprasadu, N. Band Structure, Morphology, Functionality, and Size- Dependent Properties of Metal Nanoparticles. In Noble and Precious Metals - Properties, Nanoscale Effects and Applications; Seehra, M. S., Bristow, A.D., Ed.; IntechOpen, 2018; pp. 15–42.
- Hamidi, R.; Ghasemi, S.; Hosseini, S.R. Ultrasonic Assisted Synthesis of Ni3(VO4)2-Reduced Graphene Oxide Nanocomposite for Potential Use in Electrochemical Energy Storage. Ultrason. Sonochem. 2020, 62, 104869. [Google Scholar] [CrossRef] [PubMed]
- Lou, B.S.; Rajaji, U.; Chen, S.M.; Chen, T.W. A Simple Sonochemical Assisted Synthesis of NiMoO4/Chitosan Nanocomposite for Electrochemical Sensing of Amlodipine in Pharmaceutical and Serum Samples. Ultrason. Sonochem. 2020, 64, 104827. [Google Scholar] [CrossRef] [PubMed]
- Abdullah, B.; Abd Ghani, N.A.; Vo, D.V.N. Recent Advances in Dry Reforming of Methane over Ni-Based Catalysts. J. Clean. Prod. 2017, 162, 170–185. [Google Scholar] [CrossRef]
- Aramouni, N.A.K.; Touma, J.G.; Tarboush, B.A.; Zeaiter, J.; Ahmad, M.N. Catalyst Design for Dry Reforming of Methane: Analysis Review. Renew. Sustain. Energy Rev. 2018, 82, 2570–2585. [Google Scholar] [CrossRef]
- Abdulrasheed, A.; Jalil, A.A.; Gambo, Y.; Ibrahim, M.; Hambali, H.U.; Shahul Hamid, M.Y. A Review on Catalyst Development for Dry Reforming of Methane to Syngas: Recent Advances. Renew. Sustain. Energy Rev. 2019, 108, 175–193. [Google Scholar] [CrossRef]
- 8Islam, M.H.; Burheim, O.S.; Pollet, B.G. Sonochemical and Sonoelectrochemical Production of Hydrogen. Ultrason. Sonochem. 2019, 51, 533–555. [Google Scholar] [CrossRef]
- Sun, G.B.; Hidajat, K.; Wu, X.S.; Kawi, S. A Crucial Role of Surface Oxygen Mobility on Nanocrystalline Y2O3 Support for Oxidative Steam Reforming of Ethanol to Hydrogen over Ni/Y2O3 Catalysts. Appl. Catal. B Environ. 2008, 81, 303–312. [Google Scholar] [CrossRef]
- Li, Y.; Men, Y.; Liu, S.; Wang, J.; Wang, K.; Tang, Y.; An, W.; Pan, X.; Li, L. Remarkably Efficient and Stable Ni/Y2O3 Catalysts for CO2 Methanation: Effect of Citric Acid Addition. Appl. Catal. B Environ. 2021, 293, 120206. [Google Scholar] [CrossRef]
- Taherian, Z.; Khataee, A.; Orooji, Y. Facile Synthesis of Yttria-Promoted Nickel Catalysts Supported on MgO-MCM-41 for Syngas Production from Greenhouse Gases. Renew. Sustain. Energy Rev. 2020, 134, 110130. [Google Scholar] [CrossRef]
- Guo, K.; Li, H.; Yu, Z. Size-Dependent Catalytic Activity of Monodispersed Nickel Nanoparticles for the Hydrolytic Dehydrogenation of Ammonia Borane. ACS Appl. Mater. Interfaces 2018, 10, 517–525. [Google Scholar] [CrossRef] [PubMed]
- Rahemi Ardekani, S.; Sabour Rouh Aghdam, A.; Nazari, M.; Bayat, A.; Yazdani, E.; Saievar-Iranizad, E. A Comprehensive Review on Ultrasonic Spray Pyrolysis Technique: {Mechanism}, Main Parameters and Applications in Condensed Matter. J. Anal. Appl. Pyrolysis 2019, 141, 104631. [Google Scholar] [CrossRef]
- Li, C.; Hsieh, J.H.; Hung, M.; Huang, B.Q.; Song, Y.L.; Denayer, J.; Aubry, P.; Bister, G.; Spronck, G.; Colson, P.; et al. Ultrasonic Spray Pyrolysis for Nanoparticles Synthesis. J. Mater. Sci. 2004, 9, 3647–3657. [Google Scholar]
- Švarc, T.; Stopić, S.; Jelen, Ž.; Zadravec, M.; Friedrich, B.; Rudolf, R. Synthesis of Ni/Y2O3 Nanocomposite through USP and Lyophilisation for Possible Use as Coating. Materials (Basel). 2022, 15, 1–17. [Google Scholar] [CrossRef] [PubMed]
- Majerič, P.; Rudolf, R. Advances in Ultrasonic Spray Pyrolysis Processing of Noble Metal Nanoparticles-Review. Materials (Basel). 2020, 13. [Google Scholar] [CrossRef]
- Pyrolysis, S.; Synthesis, O.; Mihailovi, M.; Stevanovi, J. Characterization of Defined Pt Particles Prepared by Ultrasonic. 2022, 2. 2.
- Shih, S.J.; Tzeng, W.L.; Jatnika, R.; Shih, C.J.; Borisenko, K.B. Control of Ag Nanoparticle Distribution Influencing Bioactive and Antibacterial Properties of Ag-Doped Mesoporous Bioactive Glass Particles Prepared by Spray Pyrolysis. J. Biomed. Mater. Res. - Part B Appl. Biomater. 2015, 103, 899–907. [Google Scholar] [CrossRef]
- Golub, D.; Ivanič, A.; Majerič, P.; Tiyyagura, H.R.; Anžel, I.; Rudolf, R. Synthesis of Colloidal Au Nanoparticles through Ultrasonic Spray Pyrolysis and Their Use in the Preparation of Polyacrylate-AuNPs’ Composites. Materials (Basel). 2019, 12, 1–17. [Google Scholar] [CrossRef]
- Shariq, M.; Marić, N.; Gorše, G.K.; Kargl, R.; Rudolf, R. Synthesis of Gold Nanoparticles with Ultrasonic Spray Pyrolysis and Its Feasibility for Ink-Jet Printing on Paper. Micro Nanosyst. 2018, 10, 102–109. [Google Scholar] [CrossRef]
- Majerič, P.; Jenko, D.; Friedrich, B.; Rudolf, R. Formation of Bimetallic Fe/Au Submicron Particles with Ultrasonic Spray Pyrolysis. Metals (Basel). 2018, 8. [Google Scholar] [CrossRef]
- Shariq, M.; Majerič, P.; Friedrich, B.; Budic, B.; Jenko, D.; Dixit, A.R.; Rudolf, R. Application of Gold(III) Acetate as a New Precursor for the Synthesis of Gold Nanoparticles in PEG Through Ultrasonic Spray Pyrolysis. J. Clust. Sci. 2017, 28, 1647–1665. [Google Scholar] [CrossRef]
- Jelen, Ž.; Majerič, P.; Zadravec, M.; Anžel, I.; Rakuša, M.; Rudolf, R. Study of Gold Nanoparticles’ Preparation through Ultrasonic Spray Pyrolysis and Lyophilisation for Possible Use as Markers in LFIA Tests. Nanotechnol. Rev. 2021, 10, 1978–1992. [Google Scholar] [CrossRef]
- Majerič, P.; Feizpour, D.; Friedrich, B.; Jelen, Ž.; Anžel, I.; Rudolf, R. Morphology of Composite Fe@Au Submicron Particles, Produced with Ultrasonic Spray Pyrolysis and Potential for Synthesis of Fe@Au Core-Shell Particles. Materials (Basel). 2019, 12, 10–12. [Google Scholar] [CrossRef] [PubMed]
- Rudolf, R.; Majerič, P.; Štager, V.; Albreht, B. The Process of Production Gold Nanoparticles with Modified Ultrasonic Spray Pyrolysis.
- Gurmen, S.; Guven, A.; Ebin, B.; Stopić, S.; Friedrich, B. Synthesis of Nano-Crystalline Spherical Cobalt-Iron (Co-Fe) Alloy Particles by Ultrasonic Spray Pyrolysis and Hydrogen Reduction. J. Alloys Compd. 2009, 481, 600–604. [Google Scholar] [CrossRef]
- Özcelik, D.Y.; Ebin, B.; Stopic, S.; Gürmen, S.; Friedrich, B. Mixed Oxides NiO/ZnO/Al2O3 Synthesized in a Single Step via Ultrasonic Spray Pyrolysis (USP) Method. Metals (Basel). 2022, 12. [Google Scholar] [CrossRef]
- Stopic, S.; Friedrich, B.; Schroeder, M.; Weirich, T.E. Synthesis of TiO2 Core/RuO2 Shell Particles Using Multistep Ultrasonic Spray Pyrolysis. Mater. Res. Bull. 2013, 48, 3633–3635. [Google Scholar] [CrossRef]
- Köroğlu, M.; Ebin, B.; Stopic, S.; Gürmen, S.; Friedrich, B. One Step Production of Silver-Copper (Agcu) Nanoparticles. Metals (Basel). 2021, 11, 1–11. [Google Scholar] [CrossRef]
- Bang, J.H.; Suslick, K.S. Applications of Ultrasound to the Synthesis of Nanostructured Materials. Adv. Mater. 2010, 22, 1039–1059. [Google Scholar] [CrossRef]
- Majerič, P.; Jenko, D.; Friedrich, B.; Rudolf, R. Formation Mechanisms for Gold Nanoparticles in a Redesigned Ultrasonic Spray Pyrolysis. Adv. Powder Technol. 2017, 28, 876–883. [Google Scholar] [CrossRef]
- Shih, S.J.; Wu, Y.Y.; Chen, C.Y.; Yu, C.Y. Morphology and Formation Mechanism of Ceria Nanoparticles by Spray Pyrolysis. J. Nanoparticle Res. 2012, 14. [Google Scholar] [CrossRef]
- Winkler, N.; Wibowo, R.A.; Kautek, W.; Dimopoulos, T. Influence of the Aqueous Solution Composition on the Morphology of Zn1−xMgxO Films Deposited by Spray Pyrolysis. J. Mater. Chem. C 2019, 7, 3889–3900. [Google Scholar] [CrossRef]
- Wright, L.D.; Lowe, J.C.; Bliss, M.; Tsai, V.; Togay, M.; Betts, T.R.; Walls, J.M.; Malkov, A. V.; Bowers, J.W. Water Based Spray Pyrolysis of Metal-Oxide Solutions for Cu2ZnSn(S,Se)4 Solar Cells Using Low Toxicity Amine/Thiol Complexants. Thin Solid Films 2019, 669, 588–594. [Google Scholar] [CrossRef]
- Varničić, M.; Pavlović, M.M.; Pantović, S.E.; Mihailović, M.; Pantović Pavlović, M.R.; Stopić, S.; Friedrich, B. Spray-Pyrolytic Tunable Structures of Mn Oxides-Based Composites for Electrocatalytic Activity Improvement in Oxygen Reduction. Metals (Basel). 2022, 12. [Google Scholar] [CrossRef]
- Stopić, S.; Ilić, I.; Uskoković, D. Structural and Morphological Transformations during NiO and Ni Particles Generation from Chloride Precursor by Ultrasonic Spray Pyrolysis. Mater. Lett. 1995, 24, 369–376. [Google Scholar] [CrossRef]
- Trenkenschuh, E.; Friess, W. Freeze-Drying of Nanoparticles: How to Overcome Colloidal Instability by Formulation and Process Optimization. Eur. J. Pharm. Biopharm. 2021, 165, 345–360. [Google Scholar] [CrossRef] [PubMed]
- Chen, G.; Wang, W. Role of Freeze Drying in Nanotechnology. Dry. Technol. 2007, 25, 29–35. [Google Scholar] [CrossRef]
- Takenaka, S.; Shimizu, T.; Otsuka, K. Complete Removal of Carbon Monoxide in Hydrogen-Rich Gas Stream through Methanation over Supported Metal Catalysts. Int. J. Hydrogen Energy 2004, 29, 1065–1073. [Google Scholar] [CrossRef]
- Hasan, M.; Asakoshi, T.; Muroyama, H.; Matsui, T.; Eguchi, K. CO2methanation Mechanism over Ni/Y2O3: Anin Situdiffuse Reflectance Infrared Fourier Transform Spectroscopic Study. Phys. Chem. Chem. Phys. 2021, 23, 5551–5558. [Google Scholar] [CrossRef]
- Wang, B. Recent Development of Non-Platinum Catalysts for Oxygen Reduction Reaction. J. Power Sources 2005, 152, 1–15. [Google Scholar] [CrossRef]
- Lano, J. Ultrasonic Atomization of Liquids. Acustica 1962, 341, 28–30. [Google Scholar]
- Dittrich, R.; Stopić, S.; Friedrich, B. Mechanism of Nanogold Formation by Ultrasonic Spray Pyrolysis; 2011; Vol. 3;
- Amis, T.M.; Renukuntla, J.; Bolla, P.K.; Clark, B.A. Selection of Cryoprotectant in Lyophilization of Progesterone-Loaded Stearic Acid Solid Lipid Nanoparticles. Pharmaceutics 2020, 12, 1–15. [Google Scholar] [CrossRef]
- Dzimitrowicz, A.; Jamroz, P.; Greda, K.; Nowak, P.; Nyk, M.; Pohl, P. The Influence of Stabilizers on the Production of Gold Nanoparticles by Direct Current Atmospheric Pressure Glow Microdischarge Generated in Contact with Liquid Flowing Cathode. J. Nanoparticle Res. 2015, 17. [Google Scholar] [CrossRef]
- Abdelwahed, W.; Degobert, G.; Stainmesse, S.; Fessi, H. Freeze-Drying of Nanoparticles: Formulation, Process and Storage Considerations. Adv. Drug Deliv. Rev. 2006, 58, 1688–1713. [Google Scholar] [CrossRef] [PubMed]
- ISO 527-2:2012 Plastics — Determination of Tensile Properties — Part 2: Test Conditions for Moulding and Extrusion Plastics 2012.
- Schneider, C.A.; Rasband, W.S.; Eliceiri, K.W. NIH Image to ImageJ: 25 Years of Image Analysis. Nat. Methods 2012, 9, 671–675. [Google Scholar] [CrossRef] [PubMed]
- ISO 527-1:2019 Plastics — Determination of Tensile Properties — Part 1: General Principles 2019.
- ASTM D5418-15 Standard Test Method for Plastics: Dynamic Mechanical Properties: In Flexure (Dual Cantilever Beam) 2015.
- Arnipally, S.K.; Kuru, E. Settling Velocity of Particles in Viscoelastic Fluids: A Comparison of the Shear-Viscosity and Elasticity Effects. SPE J. 2018, 23, 1689–1705. [Google Scholar] [CrossRef]
- Krasnou, I.; Tarabukina, E.; Melenevskaya, E.; Filippov, A.; Aseyev, V.; Hietala, S.; Tenhu, H. Rheological Behavior of Poly(Vinylpyrrolidone)/Fullerene C60 Complexes in Aqueous Medium. J. Macromol. Sci. Part B 2008, 47, 500–510. [Google Scholar] [CrossRef]
- Singh, M.; Kumar, S. Viscometric Studies of Poly(N-Vinyl-2-Pyrrolidone) in Water and in Water and 0.01% Bovine Serum Albumin at 283.15, 288.15, 293.15, 298.15, 303.15, 308.15, and 313.15 K. J. Appl. Polym. Sci. 2003, 87, 1001–1015. [Google Scholar] [CrossRef]
Disclaimer/Publisher’s Note: The statements, opinions and data contained in all publications are solely those of the individual author(s) and contributor(s) and not of MDPI and/or the editor(s). MDPI and/or the editor(s) disclaim responsibility for any injury to people or property resulting from any ideas, methods, instructions or products referred to in the content. |
© 2023 by the authors. Licensee MDPI, Basel, Switzerland. This article is an open access article distributed under the terms and conditions of the Creative Commons Attribution (CC BY) license (http://creativecommons.org/licenses/by/4.0/).


