Submitted:
30 May 2023
Posted:
01 June 2023
You are already at the latest version
Abstract
Keywords:
1. Introduction
2. Materials and Methods
- Human-induced Pluripotent Stem Cell (hiPSC) line and cell culture maintenance
- Human astrocytes differentiation
- Quantitative RT-PCR
- Immunofluorescence staining
- Synaptoneurosomes isolation and staining
- Synaptoneurosomes engulfment assay and analysis
- Immunoblotting
- Cytokine quantification
- Statistical analyses
3. Results
3.1. mGluR5 Blockade Attenuates Early rTNF-α-Induced Proinflammatory Response in Human Astrocytes
3.2. mGluR5 Modulates the Expression of the Pan-Reactive Astrocytic Marker SERPINA3 in Human Astrocytes
3.3. CTEP Treatment Leads to Enhanced Synaptic Material Engulfment by Human Astrocytes
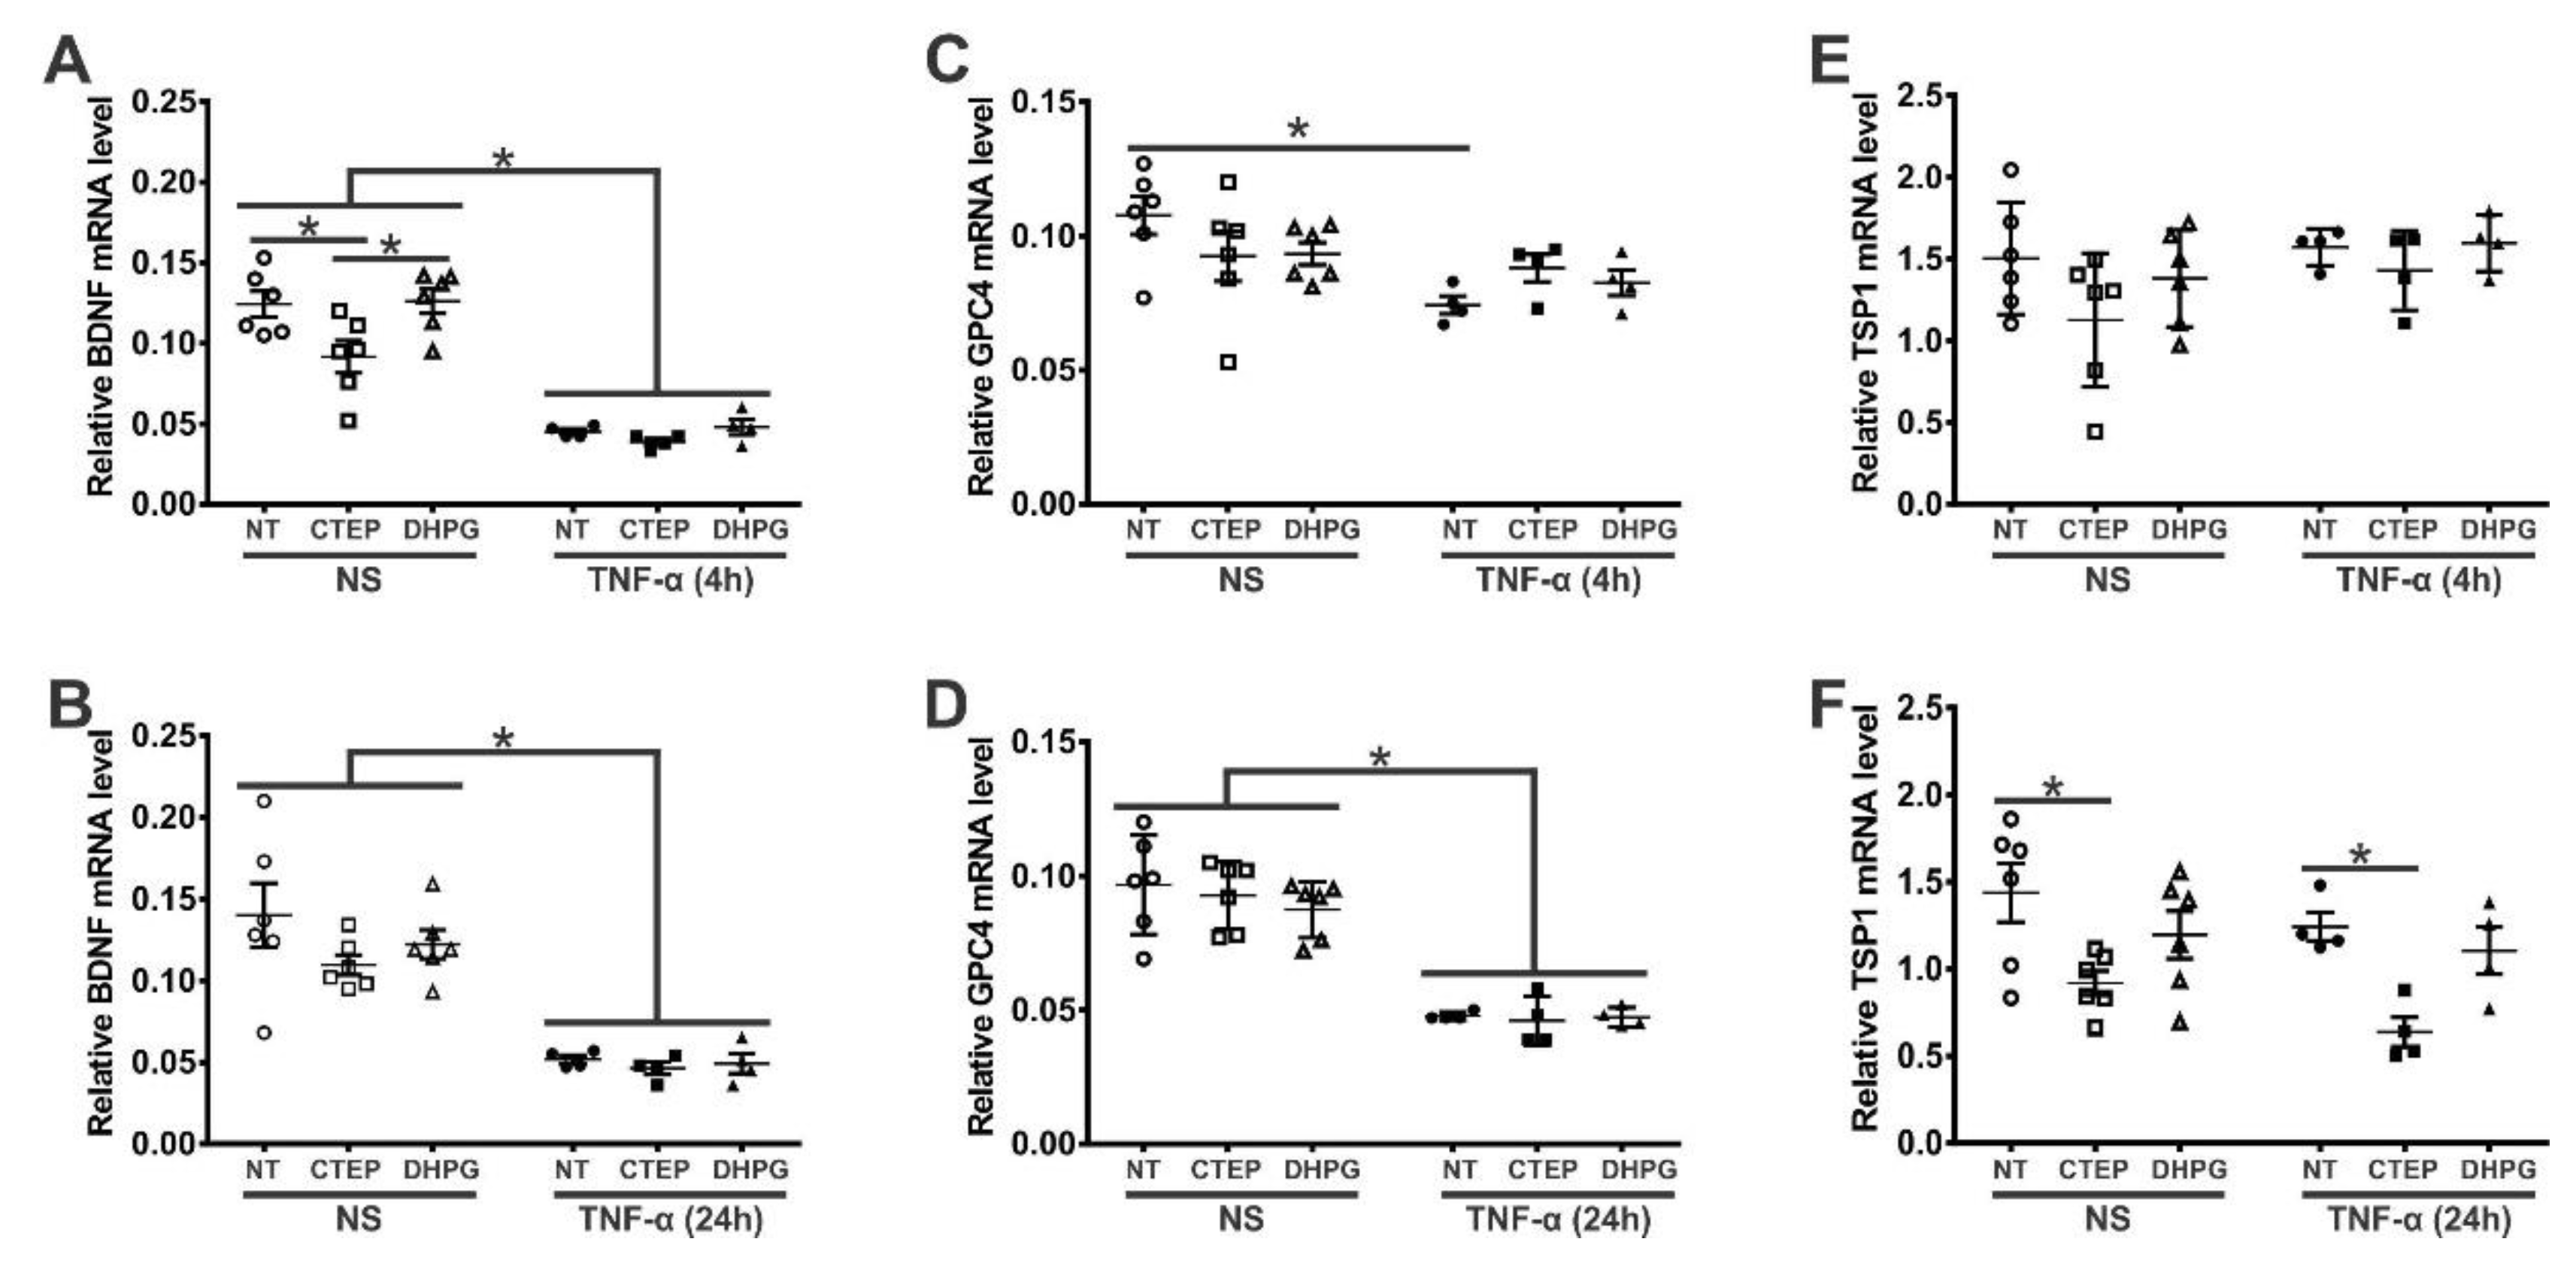
3.4. rTNF-α Stimulation and mGluR5 Blockade Decrease the Expression of Synaptogenic Molecules in Human Astrocytes
4. Discussion
Supplementary Materials
Author Contributions
Funding
Institutional Review Board Statement
Data Availability Statement
Conflicts of Interest
References
- Lee, H.G.; Wheeler, M.A.; Quintana, F.J. Function and therapeutic value of astrocytes in neurological diseases. Nat Rev Drug Discov 2022, 21, 339–358. [Google Scholar] [CrossRef]
- Olabarria, M.; Noristani, H.N.; Verkhratsky, A.; Rodriguez, J.J. Concomitant astroglial atrophy and astrogliosis in a triple transgenic animal model of Alzheimer's disease. Glia, 2010, 58, 831–838. [Google Scholar] [CrossRef]
- Huang, S.; Tong, H.; Lei, M. , et al. Astrocytic glutamatergic transporters are involved in Abeta-induced synaptic dysfunction. Brain Res. 2018, 1678, 129–137. [Google Scholar] [CrossRef]
- de Lima, I.B.Q.; Ribeiro, F.M. The Implication of Glial Metabotropic Glutamate Receptors in Alzheimer's Disease. Curr. Neuropharmacol. 2023, 21, 164–182. [Google Scholar] [CrossRef]
- Matos, M.; Augusto, E.; Machado, N.J. , et al. Astrocytic adenosine A2A receptors control the amyloid-beta peptide-induced decrease of glutamate uptake. J Alzheimers Dis. 2012, 31, 555–567. [Google Scholar] [CrossRef] [PubMed]
- Reichenbach, N.; Delekate, A.; Plescher, M., et al. Inhibition of Stat3-mediated astrogliosis ameliorates pathology in an Alzheimer's disease model. EMBO Mol Med. 2019, 11. [CrossRef]
- Habib, N.; McCabe, C.; Medina, S.; Varshavsky, M.; Kitsberg, D.; Dvir-Szternfeld, R.; Green, G.; Dionne, D.; Nguyen, L.; Marshall, J.L.; et al. Disease-associated astrocytes in Alzheimer’s disease and aging. Nat. Neurosci. 2020, 23, 701–706. [Google Scholar] [CrossRef]
- Bradford, J.; Shin, J.Y.; Roberts, M.; Wang, C.E.; Li, X.J.; Li, S. Expression of mutant huntingtin in mouse brain astrocytes causes age-dependent neurological symptoms. Proceedings of the National Academy of Sciences of the United States of America 2009, 106, 22480–22485. [Google Scholar] [CrossRef] [PubMed]
- Wood, T.E.; Barry, J.; Yang, Z.; Cepeda, C.; Levine, M.S.; Gray, M. Mutant huntingtin reduction in astrocytes slows disease progression in the BACHD conditional Huntington's disease mouse model. Human molecular genetics 2019, 28, 487–500. [Google Scholar] [CrossRef]
- Nagai, M.; Re, D.B.; Nagata, T.; Chalazonitis, A.; Jessell, T.M.; Wichterle, H.; Przedborski, S. Astrocytes expressing ALS-linked mutated SOD1 release factors selectively toxic to motor neurons. Nature neuroscience 2007, 10, 615–622. [Google Scholar] [CrossRef]
- Yamanaka, K.; Komine, O. The multi-dimensional roles of astrocytes in ALS. Neurosci Res 2018, 126, 31–38. [Google Scholar] [CrossRef]
- Izrael, M.; Slutsky, S.G.; Revel, M. Rising Stars: Astrocytes as a Therapeutic Target for ALS Disease. Frontiers in neuroscience 2020, 14, 824. [Google Scholar] [CrossRef]
- Rothhammer, V.; Mascanfroni, I.D.; Bunse, L.; Takenaka, M.C.; Kenison, J.E.; Mayo, L.; Chao, C.C.; Patel, B.; Yan, R.; Blain, M.; et al. Type I interferons and microbial metabolites of tryptophan modulate astrocyte activity and central nervous system inflammation via the aryl hydrocarbon receptor. Nat Med 2016, 22, 586–597. [Google Scholar] [CrossRef] [PubMed]
- Rothhammer, V.; Borucki, D.M.; Tjon, E.C.; Takenaka, M.C.; Chao, C.C.; Ardura-Fabregat, A.; de Lima, K.A.; Gutierrez-Vazquez, C.; Hewson, P.; Staszewski, O.; et al. Microglial control of astrocytes in response to microbial metabolites. Nature 2018, 557, 724–728. [Google Scholar] [CrossRef] [PubMed]
- Wheeler, M.A.; Clark, I.C.; Tjon, E.C.; Li, Z.; Zandee, S.E.J.; Couturier, C.P.; Watson, B.R.; Scalisi, G.; Alkwai, S.; Rothhammer, V.; et al. MAFG-driven astrocytes promote CNS inflammation. Nature 2020, 578, 593–599. [Google Scholar] [CrossRef] [PubMed]
- Gu, X.L.; Long, C.X.; Sun, L.; Xie, C.; Lin, X.; Cai, H. Astrocytic expression of Parkinson's disease-related A53T alpha-synuclein causes neurodegeneration in mice. Molecular brain 2010, 3, 12. [Google Scholar] [CrossRef] [PubMed]
- Yun, S.P.; Kam, T.I.; Panicker, N.; Kim, S.; Oh, Y.; Park, J.S.; Kwon, S.H.; Park, Y.J.; Karuppagounder, S.S.; Park, H.; et al. Block of A1 astrocyte conversion by microglia is neuroprotective in models of Parkinson's disease. Nat Med 2018, 24, 931–938. [Google Scholar] [CrossRef]
- Verkhratsky, A.; Nedergaard, M. Physiology of Astroglia. Physiological reviews 2018, 98, 239–389. [Google Scholar] [CrossRef]
- Verkhratsky, A.; Li, B.; Scuderi, C.; Parpura, V. Principles of Astrogliopathology. Adv Neurobiol 2021, 26, 55–73. [Google Scholar] [CrossRef]
- Moulson, A.J.; Squair, J.W.; Franklin, R.J.M.; Tetzlaff, W.; Assinck, P. Diversity of Reactive Astrogliosis in CNS Pathology: Heterogeneity or Plasticity? Frontiers in cellular neuroscience 2021, 15, 703810. [Google Scholar] [CrossRef]
- Paolicelli, R.C.; Bolasco, G.; Pagani, F.; Maggi, L.; Scianni, M.; Panzanelli, P.; Giustetto, M.; Ferreira, T.A.; Guiducci, E.; Dumas, L.; et al. Synaptic pruning by microglia is necessary for normal brain development. Science 2011, 333, 1456–1458. [Google Scholar] [CrossRef] [PubMed]
- Trachtenberg, J.T.; Chen, B.E.; Knott, G.W.; Feng, G.; Sanes, J.R.; Welker, E.; Svoboda, K. Long-term in vivo imaging of experience-dependent synaptic plasticity in adult cortex. Nature 2002, 420, 788–794. [Google Scholar] [CrossRef] [PubMed]
- Hong, S.; Beja-Glasser, V.F.; Nfonoyim, B.M.; Frouin, A.; Li, S.; Ramakrishnan, S.; Merry, K.M.; Shi, Q.; Rosenthal, A.; Barres, B.A.; et al. Complement and microglia mediate early synapse loss in Alzheimer mouse models. Science 2016, 352, 712–716. [Google Scholar] [CrossRef] [PubMed]
- Chung, W.S.; Clarke, L.E.; Wang, G.X.; Stafford, B.K.; Sher, A.; Chakraborty, C.; Joung, J.; Foo, L.C.; Thompson, A.; Chen, C.; et al. Astrocytes mediate synapse elimination through MEGF10 and MERTK pathways. Nature 2013, 504, 394–400. [Google Scholar] [CrossRef]
- Koistinaho, M.; Lin, S.; Wu, X.; Esterman, M.; Koger, D.; Hanson, J.; Higgs, R.; Liu, F.; Malkani, S.; Bales, K.R.; et al. Apolipoprotein E promotes astrocyte colocalization and degradation of deposited amyloid-beta peptides. Nat Med 2004, 10, 719–726. [Google Scholar] [CrossRef] [PubMed]
- Gomez-Casati, M.E.; Murtie, J.C.; Rio, C.; Stankovic, K.; Liberman, M.C.; Corfas, G. Nonneuronal cells regulate synapse formation in the vestibular sensory epithelium via erbB-dependent BDNF expression. Proc Natl Acad Sci U S A 2010, 107, 17005–17010. [Google Scholar] [CrossRef]
- Allen, N.J.; Bennett, M.L.; Foo, L.C.; Wang, G.X.; Chakraborty, C.; Smith, S.J.; Barres, B.A. Astrocyte glypicans 4 and 6 promote formation of excitatory synapses via GluA1 AMPA receptors. Nature 2012, 486, 410–414. [Google Scholar] [CrossRef]
- Kucukdereli, H.; Allen, N.J.; Lee, A.T.; Feng, A.; Ozlu, M.I.; Conatser, L.M.; Chakraborty, C.; Workman, G.; Weaver, M.; Sage, E.H.; et al. Control of excitatory CNS synaptogenesis by astrocyte-secreted proteins Hevin and SPARC. Proc Natl Acad Sci U S A 2011, 108, E440–E449. [Google Scholar] [CrossRef]
- Christopherson, K.S.; Ullian, E.M.; Stokes, C.C.; Mullowney, C.E.; Hell, J.W.; Agah, A.; Lawler, J.; Mosher, D.F.; Bornstein, P.; Barres, B.A. Thrombospondins are astrocyte-secreted proteins that promote CNS synaptogenesis. Cell 2005, 120, 421–433. [Google Scholar] [CrossRef]
- Ribeiro, F.M.; Vieira, L.B.; Pires, R.G.; Olmo, R.P.; Ferguson, S.S. Metabotropic glutamate receptors and neurodegenerative diseases. Pharmacological research 2017, 115, 179–191. [Google Scholar] [CrossRef]
- Biber, K.; Laurie, D.J.; Berthele, A.; Sommer, B.; Tolle, T.R.; Gebicke-Harter, P.J.; van Calker, D.; Boddeke, H.W. Expression and signaling of group I metabotropic glutamate receptors in astrocytes and microglia. Journal of neurochemistry 1999, 72, 1671–1680. [Google Scholar] [PubMed]
- Miller, S.; Romano, C.; Cotman, C.W. Growth factor upregulation of a phosphoinositide-coupled metabotropic glutamate receptor in cortical astrocytes. The Journal of neuroscience : the official journal of the Society for Neuroscience 1995, 15, 6103–6109. [Google Scholar] [CrossRef]
- Pasti, L.; Volterra, A.; Pozzan, T.; Carmignoto, G. Intracellular calcium oscillations in astrocytes: a highly plastic, bidirectional form of communication between neurons and astrocytes in situ. The Journal of neuroscience : the official journal of the Society for Neuroscience 1997, 17, 7817–7830. [Google Scholar] [CrossRef]
- Paquet, M.; Ribeiro, F.M.; Guadagno, J.; Esseltine, J.L.; Ferguson, S.S.; Cregan, S.P. Role of metabotropic glutamate receptor 5 signaling and homer in oxygen glucose deprivation-mediated astrocyte apoptosis. Molecular brain 2013, 6, 9. [Google Scholar] [CrossRef] [PubMed]
- Servitja, J.M.; Masgrau, R.; Sarri, E.; Picatoste, F. Group I metabotropic glutamate receptors mediate phospholipase D stimulation in rat cultured astrocytes. Journal of neurochemistry 1999, 72, 1441–1447. [Google Scholar] [CrossRef] [PubMed]
- Peavy, R.D.; Conn, P.J. Phosphorylation of mitogen-activated protein kinase in cultured rat cortical glia by stimulation of metabotropic glutamate receptors. Journal of neurochemistry 1998, 71, 603–612. [Google Scholar] [CrossRef]
- Cai, Z.; Schools, G.P.; Kimelberg, H.K. Metabotropic glutamate receptors in acutely isolated hippocampal astrocytes: developmental changes of mGluR5 mRNA and functional expression. Glia 2000, 29, 70–80. [Google Scholar] [CrossRef]
- Sun, W.; McConnell, E.; Pare, J.F.; Xu, Q.; Chen, M.; Peng, W.; Lovatt, D.; Han, X.; Smith, Y.; Nedergaard, M. Glutamate-dependent neuroglial calcium signaling differs between young and adult brain. Science 2013, 339, 197–200. [Google Scholar] [CrossRef]
- Aronica, E.; Catania, M.V.; Geurts, J.; Yankaya, B.; Troost, D. Immunohistochemical localization of group I and II metabotropic glutamate receptors in control and amyotrophic lateral sclerosis human spinal cord: upregulation in reactive astrocytes. Neuroscience 2001, 105, 509–520. [Google Scholar] [CrossRef]
- Geurts, J.J.; Wolswijk, G.; Bo, L.; van der Valk, P.; Polman, C.H.; Troost, D.; Aronica, E. Altered expression patterns of group I and II metabotropic glutamate receptors in multiple sclerosis. Brain 2003, 126, 1755–1766. [Google Scholar] [CrossRef]
- Shrivastava, A.N.; Kowalewski, J.M.; Renner, M.; Bousset, L.; Koulakoff, A.; Melki, R.; Giaume, C.; Triller, A. beta-amyloid and ATP-induced diffusional trapping of astrocyte and neuronal metabotropic glutamate type-5 receptors. Glia 2013, 61, 1673–1686. [Google Scholar] [CrossRef] [PubMed]
- Byrnes, K.R.; Stoica, B.; Loane, D.J.; Riccio, A.; Davis, M.I.; Faden, A.I. Metabotropic glutamate receptor 5 activation inhibits microglial associated inflammation and neurotoxicity. Glia 2009, 57, 550–560. [Google Scholar] [CrossRef]
- Loane, D.J.; Stoica, B.A.; Pajoohesh-Ganji, A.; Byrnes, K.R.; Faden, A.I. Activation of metabotropic glutamate receptor 5 modulates microglial reactivity and neurotoxicity by inhibiting NADPH oxidase. The Journal of biological chemistry 2009, 284, 15629–15639. [Google Scholar] [CrossRef] [PubMed]
- Fulmer, C.G.; VonDran, M.W.; Stillman, A.A.; Huang, Y.; Hempstead, B.L.; Dreyfus, C.F. Astrocyte-derived BDNF supports myelin protein synthesis after cuprizone-induced demyelination. The Journal of neuroscience : the official journal of the Society for Neuroscience 2014, 34, 8186–8196. [Google Scholar] [CrossRef]
- Saitta, K.S.; Lercher, L.D.; Sainato, D.M.; Patel, A.; Huang, Y.; McAuliffe, G.; Dreyfus, C.F. CHPG enhances BDNF and myelination in cuprizone-treated mice through astrocytic metabotropic glutamate receptor 5. Glia 2021, 69, 1950–1965. [Google Scholar] [CrossRef] [PubMed]
- Shah, A.; Silverstein, P.S.; Singh, D.P.; Kumar, A. Involvement of metabotropic glutamate receptor 5, AKT/PI3K signaling and NF-kappaB pathway in methamphetamine-mediated increase in IL-6 and IL-8 expression in astrocytes. J Neuroinflammation 2012, 9, 52. [Google Scholar] [CrossRef]
- Rossi, D.; Brambilla, L.; Valori, C.F.; Roncoroni, C.; Crugnola, A.; Yokota, T.; Bredesen, D.E.; Volterra, A. Focal degeneration of astrocytes in amyotrophic lateral sclerosis. Cell Death Differ 2008, 15, 1691–1700. [Google Scholar] [CrossRef]
- Kim, H.; Woo, J.H.; Lee, J.H.; Joe, E.H.; Jou, I. 22(R)-hydroxycholesterol induces HuR-dependent MAP kinase phosphatase-1 expression via mGluR5-mediated Ca(2+)/PKCalpha signaling. Biochim Biophys Acta 2016, 1859, 1056–1070. [Google Scholar] [CrossRef]
- Aronica, E.; Gorter, J.A.; Rozemuller, A.J.; Yankaya, B.; Troost, D. Activation of metabotropic glutamate receptor 3 enhances interleukin (IL)-1beta-stimulated release of IL-6 in cultured human astrocytes. Neuroscience 2005, 130, 927–933. [Google Scholar] [CrossRef]
- Degl'Innocenti, E.; Dell'Anno, M.T. Human and mouse cortical astrocytes: a comparative view from development to morphological and functional characterization. Front Neuroanat 2023, 17, 1130729. [Google Scholar] [CrossRef]
- Li, J.; Pan, L.; Pembroke, W.G.; Rexach, J.E.; Godoy, M.I.; Condro, M.C.; Alvarado, A.G.; Harteni, M.; Chen, Y.W.; Stiles, L.; et al. Conservation and divergence of vulnerability and responses to stressors between human and mouse astrocytes. Nat Commun 2021, 12, 3958. [Google Scholar] [CrossRef] [PubMed]
- Escartin, C.; Galea, E.; Lakatos, A.; O'Callaghan, J.P.; Petzold, G.C.; Serrano-Pozo, A.; Steinhauser, C.; Volterra, A.; Carmignoto, G.; Agarwal, A.; et al. Reactive astrocyte nomenclature, definitions, and future directions. Nat Neurosci 2021, 24, 312–325. [Google Scholar] [CrossRef] [PubMed]
- Cardozo, P.L.; de Lima, I.B.Q.; Maciel, E.M.A.; Silva, N.C.; Dobransky, T.; Ribeiro, F.M. Synaptic Elimination in Neurological Disorders. Curr Neuropharmacol 2019, 17, 1071–1095. [Google Scholar] [CrossRef]
- Kwart, D.; Gregg, A.; Scheckel, C.; Murphy, E.A.; Paquet, D.; Duffield, M.; Fak, J.; Olsen, O.; Darnell, R.B.; Tessier-Lavigne, M. A Large Panel of Isogenic APP and PSEN1 Mutant Human iPSC Neurons Reveals Shared Endosomal Abnormalities Mediated by APP beta-CTFs, Not Abeta. Neuron 2019, 104, 256–270. [Google Scholar] [CrossRef] [PubMed]
- Trindade, P.; Loiola, E.C.; Gasparotto, J.; Ribeiro, C.T.; Cardozo, P.L.; Devalle, S.; Salerno, J.A.; Ornelas, I.M.; Ledur, P.F.; Ribeiro, F.M.; et al. Short and long TNF-alpha exposure recapitulates canonical astrogliosis events in human-induced pluripotent stem cells-derived astrocytes. Glia 2020, 68, 1396–1409. [Google Scholar] [CrossRef] [PubMed]
- Molla Kazemiha, V.; Shokrgozar, M.A.; Arabestani, M.R.; Shojaei Moghadam, M.; Azari, S.; Maleki, S.; Amanzadeh, A.; Jeddi Tehrani, M.; Shokri, F. PCR-based detection and eradication of mycoplasmal infections from various mammalian cell lines: a local experience. Cytotechnology 2009, 61, 117–124. [Google Scholar] [CrossRef] [PubMed]
- Untergasser, A.; Nijveen, H.; Rao, X.; Bisseling, T.; Geurts, R.; Leunissen, J.A. Primer3Plus, an enhanced web interface to Primer3. Nucleic Acids Res 2007, 35, 71–74. [Google Scholar] [CrossRef]
- Villasana, L.E.; Klann, E.; Tejada-Simon, M.V. Rapid isolation of synaptoneurosomes and postsynaptic densities from adult mouse hippocampus. J Neurosci Methods 2006, 158, 30–36. [Google Scholar] [CrossRef]
- Berger, J.V.; Dumont, A.O.; Focant, M.C.; Vergouts, M.; Sternotte, A.; Calas, A.G.; Goursaud, S.; Hermans, E. Opposite regulation of metabotropic glutamate receptor 3 and metabotropic glutamate receptor 5 by inflammatory stimuli in cultured microglia and astrocytes. Neuroscience 2012, 205, 29–38. [Google Scholar] [CrossRef]
- Budgett, R.F.; Bakker, G.; Sergeev, E.; Bennett, K.A.; Bradley, S.J. Targeting the Type 5 Metabotropic Glutamate Receptor: A Potential Therapeutic Strategy for Neurodegenerative Diseases? Front Pharmacol 2022, 13, 893422. [Google Scholar] [CrossRef]
- Kumar, A.; Dhull, D.K.; Mishra, P.S. Therapeutic potential of mGluR5 targeting in Alzheimer's disease. Front Neurosci 2015, 9, 215. [Google Scholar] [CrossRef] [PubMed]
- Planas-Fontanez, T.M.; Dreyfus, C.F.; Saitta, K.S. Reactive Astrocytes as Therapeutic Targets for Brain Degenerative Diseases: Roles Played by Metabotropic Glutamate Receptors. Neurochem Res 2020, 45, 541–550. [Google Scholar] [CrossRef]
- Spampinato, S.F.; Copani, A.; Nicoletti, F.; Sortino, M.A.; Caraci, F. Metabotropic Glutamate Receptors in Glial Cells: A New Potential Target for Neuroprotection? Front Mol Neurosci 2018, 11, 414. [Google Scholar] [CrossRef] [PubMed]
- Zhang, Y.N.; Fan, J.K.; Gu, L.; Yang, H.M.; Zhan, S.Q.; Zhang, H. Metabotropic glutamate receptor 5 inhibits alpha-synuclein-induced microglia inflammation to protect from neurotoxicity in Parkinson's disease. J Neuroinflammation 2021, 18, 23. [Google Scholar] [CrossRef] [PubMed]
- Zamanian, J.L.; Xu, L.; Foo, L.C.; Nouri, N.; Zhou, L.; Giffard, R.G.; Barres, B.A. Genomic analysis of reactive astrogliosis. J Neurosci 2012, 32, 6391–6410. [Google Scholar] [CrossRef]
- Fan, Y.Y.; Huo, J. A1/A2 astrocytes in central nervous system injuries and diseases: Angels or devils? Neurochem Int 2021, 148, 105080. [Google Scholar] [CrossRef]
- Liddelow, S.A.; Guttenplan, K.A.; Clarke, L.E.; Bennett, F.C.; Bohlen, C.J.; Schirmer, L.; Bennett, M.L.; Munch, A.E.; Chung, W.S.; Peterson, T.C.; et al. Neurotoxic reactive astrocytes are induced by activated microglia. Nature 2017, 541, 481–487. [Google Scholar] [CrossRef]
- Heit, C.; Jackson, B.C.; McAndrews, M.; Wright, M.W.; Thompson, D.C.; Silverman, G.A.; Nebert, D.W.; Vasiliou, V. Update of the human and mouse SERPIN gene superfamily. Hum Genomics 2013, 7, 22. [Google Scholar] [CrossRef]
- Leng, K.; Rose, I.V.L.; Kim, H.; Xia, W.; Romero-Fernandez, W.; Rooney, B.; Koontz, M.; Li, E.; Ao, Y.; Wang, S.; et al. CRISPRi screens in human iPSC-derived astrocytes elucidate regulators of distinct inflammatory reactive states. Nat Neurosci 2022, 25, 1528–1542. [Google Scholar] [CrossRef]
- Konishi, H.; Koizumi, S.; Kiyama, H. Phagocytic astrocytes: Emerging from the shadows of microglia. Glia 2022, 70, 1009–1026. [Google Scholar] [CrossRef]
- Kim, S.K.; Hayashi, H.; Ishikawa, T.; Shibata, K.; Shigetomi, E.; Shinozaki, Y.; Inada, H.; Roh, S.E.; Kim, S.J.; Lee, G.; et al. Cortical astrocytes rewire somatosensory cortical circuits for peripheral neuropathic pain. J Clin Invest 2016, 126, 1983–1997. [Google Scholar] [CrossRef] [PubMed]
- Danjo, Y.; Shigetomi, E.; Hirayama, Y.J.; Kobayashi, K.; Ishikawa, T.; Fukazawa, Y.; Shibata, K.; Takanashi, K.; Parajuli, B.; Shinozaki, Y.; et al. Transient astrocytic mGluR5 expression drives synaptic plasticity and subsequent chronic pain in mice. J Exp Med 2022, 219. [Google Scholar] [CrossRef]
- Spurrier, J.; Nicholson, L.; Fang, X.T.; Stoner, A.J.; Toyonaga, T.; Holden, D.; Siegert, T.R.; Laird, W.; Allnutt, M.A.; Chiasseu, M.; et al. Reversal of synapse loss in Alzheimer mouse models by targeting mGluR5 to prevent synaptic tagging by C1Q. Sci Transl Med 2022, 14, eabi8593. [Google Scholar] [CrossRef] [PubMed]
- de Souza, J.M.; Ferreira-Vieira, T.H.; Maciel, E.M.A.; Silva, N.C.; Lima, I.B.Q.; Doria, J.G.; Olmo, I.G.; Ribeiro, F.M. mGluR5 ablation leads to age-related synaptic plasticity impairments and does not improve Huntington's disease phenotype. Sci Rep 2022, 12, 8982. [Google Scholar] [CrossRef] [PubMed]
- Ronco, V.; Grolla, A.A.; Glasnov, T.N.; Canonico, P.L.; Verkhratsky, A.; Genazzani, A.A.; Lim, D. Differential deregulation of astrocytic calcium signalling by amyloid-beta, TNFalpha, IL-1beta and LPS. Cell Calcium 2014, 55, 219–229. [Google Scholar] [CrossRef]
- Casley, C.S.; Lakics, V.; Lee, H.G.; Broad, L.M.; Day, T.A.; Cluett, T.; Smith, M.A.; O'Neill, M.J.; Kingston, A.E. Up-regulation of astrocyte metabotropic glutamate receptor 5 by amyloid-beta peptide. Brain Res 2009, 1260, 65–75. [Google Scholar] [CrossRef]
- Lim, D.; Iyer, A.; Ronco, V.; Grolla, A.A.; Canonico, P.L.; Aronica, E.; Genazzani, A.A. Amyloid beta deregulates astroglial mGluR5-mediated calcium signaling via calcineurin and Nf-kB. Glia 2013, 61, 1134–1145. [Google Scholar] [CrossRef]
- Grolla, A.A.; Fakhfouri, G.; Balzaretti, G.; Marcello, E.; Gardoni, F.; Canonico, P.L.; DiLuca, M.; Genazzani, A.A.; Lim, D. Abeta leads to Ca(2)(+) signaling alterations and transcriptional changes in glial cells. Neurobiol Aging 2013, 34, 511–522. [Google Scholar] [CrossRef]
- Grolla, A.A.; Sim, J.A.; Lim, D.; Rodriguez, J.J.; Genazzani, A.A.; Verkhratsky, A. Amyloid-beta and Alzheimer's disease type pathology differentially affects the calcium signalling toolkit in astrocytes from different brain regions. Cell Death Dis 2013, 4, e623. [Google Scholar] [CrossRef]
- Oliver, J.C.; Bland, L.A.; Oettinger, C.W.; Arduino, M.J.; McAllister, S.K.; Aguero, S.M.; Favero, M.S. Cytokine kinetics in an in vitro whole blood model following an endotoxin challenge. Lymphokine Cytokine Res 1993, 12, 115–120. [Google Scholar]
- Liu, C.; Chu, D.; Kalantar-Zadeh, K.; George, J.; Young, H.A.; Liu, G. Cytokines: From Clinical Significance to Quantification. Adv Sci (Weinh) 2021, 8, e2004433. [Google Scholar] [CrossRef] [PubMed]
- Mao, L.; Wang, J.Q. Phosphorylation of cAMP response element-binding protein in cultured striatal neurons by metabotropic glutamate receptor subtype 5. Journal of neurochemistry 2003, 84, 233–243. [Google Scholar] [CrossRef] [PubMed]
- Doria, J.G.; de Souza, J.M.; Andrade, J.N.; Rodrigues, H.A.; Guimaraes, I.M.; Carvalho, T.G.; Guatimosim, C.; Dobransky, T.; Ribeiro, F.M. The mGluR5 positive allosteric modulator, CDPPB, ameliorates pathology and phenotypic signs of a mouse model of Huntington's disease. Neurobiology of disease 2015, 73, 163–173. [Google Scholar] [CrossRef] [PubMed]
- Doria, J.G.; de Souza, J.M.; Silva, F.R.; Olmo, I.G.; Carvalho, T.G.; Alves-Silva, J.; Ferreira-Vieira, T.H.; Santos, J.T.; Xavier, C.Q.S.; Silva, N.C.; et al. The mGluR5 positive allosteric modulator VU0409551 improves synaptic plasticity and memory of a mouse model of Huntington's disease. Journal of neurochemistry 2018, 147, 222–239. [Google Scholar] [CrossRef] [PubMed]
- Wang, H.; Zhuo, M. Group I metabotropic glutamate receptor-mediated gene transcription and implications for synaptic plasticity and diseases. Front Pharmacol 2012, 3, 189. [Google Scholar] [CrossRef] [PubMed]
- Lee, J.H.; Kim, J.Y.; Noh, S.; Lee, H.; Lee, S.Y.; Mun, J.Y.; Park, H.; Chung, W.S. Astrocytes phagocytose adult hippocampal synapses for circuit homeostasis. Nature 2021, 590, 612–617. [Google Scholar] [CrossRef]
- Gomez-Arboledas, A.; Davila, J.C.; Sanchez-Mejias, E.; Navarro, V.; Nunez-Diaz, C.; Sanchez-Varo, R.; Sanchez-Mico, M.V.; Trujillo-Estrada, L.; Fernandez-Valenzuela, J.J.; Vizuete, M.; et al. Phagocytic clearance of presynaptic dystrophies by reactive astrocytes in Alzheimer's disease. Glia 2018, 66, 637–653. [Google Scholar] [CrossRef]
- Sanchez-Mico, M.V.; Jimenez, S.; Gomez-Arboledas, A.; Munoz-Castro, C.; Romero-Molina, C.; Navarro, V.; Sanchez-Mejias, E.; Nunez-Diaz, C.; Sanchez-Varo, R.; Galea, E.; et al. Amyloid-beta impairs the phagocytosis of dystrophic synapses by astrocytes in Alzheimer's disease. Glia 2021, 69, 997–1011. [Google Scholar] [CrossRef]
- Iram, T.; Trudler, D.; Kain, D.; Kanner, S.; Galron, R.; Vassar, R.; Barzilai, A.; Blinder, P.; Fishelson, Z.; Frenkel, D. Astrocytes from old Alzheimer's disease mice are impaired in Abeta uptake and in neuroprotection. Neurobiology of disease 2016, 96, 84–94. [Google Scholar] [CrossRef]
- Lindemann, L.; Jaeschke, G.; Michalon, A.; Vieira, E.; Honer, M.; Spooren, W.; Porter, R.; Hartung, T.; Kolczewski, S.; Buttelmann, B.; et al. CTEP: a novel, potent, long-acting, and orally bioavailable metabotropic glutamate receptor 5 inhibitor. J Pharmacol Exp Ther 2011, 339, 474–486. [Google Scholar] [CrossRef]
- Gwak, Y.S.; Hulsebosch, C.E. Upregulation of Group I metabotropic glutamate receptors in neurons and astrocytes in the dorsal horn following spinal cord injury. Exp Neurol 2005, 195, 236–243. [Google Scholar] [CrossRef] [PubMed]
- Iyer, A.M.; van Scheppingen, J.; Milenkovic, I.; Anink, J.J.; Lim, D.; Genazzani, A.A.; Adle-Biassette, H.; Kovacs, G.G.; Aronica, E. Metabotropic glutamate receptor 5 in Down's syndrome hippocampus during development: increased expression in astrocytes. Curr Alzheimer Res 2014, 11, 694–705. [Google Scholar] [CrossRef] [PubMed]
- Krabbe, G.; Halle, A.; Matyash, V.; Rinnenthal, J.L.; Eom, G.D.; Bernhardt, U.; Miller, K.R.; Prokop, S.; Kettenmann, H.; Heppner, F.L. Functional impairment of microglia coincides with Beta-amyloid deposition in mice with Alzheimer-like pathology. PLoS One 2013, 8, e60921. [Google Scholar] [CrossRef] [PubMed]
| Gene | Forward primer (5’-3’) | Reverse primer (5’-3’) |
|---|---|---|
| C3 | CTGCCCAGTTTCGAGGTCAT | CGAGCCATCCTCAATCGGAA |
| IPO8 | TCCGAACTATTATCGACAGGACC | GTTCAAAGAGCCGAGCTACAA |
| RPLP0 | TTAAACCCTGCGTGGCAATC | ATCTGCTTGGAGCCCACATT |
| MERTK | TGGCGTAGAGCTATCACTG | CTGGCGTGAGGAAGGGATAA |
| SERPINA3 | CCTGAGGCAGAGTTGAGAATGG | TCAAGTGGGCTGTTAGGGTG |
| VCAM1 | CGAACCCAAACAAAGGCAGA | ACAGGATTTTCGGAGCAGGA |
| S100A10 | AACAAAGGAGGACCTGAGAGTAC | CTTTGCCATCTCTACACTGGTCC |
| BDNF | AGTTGGGAGCCTGAAATAGTGG | AGGATGCTGGTCCAAGTGGT |
| GPC4 | GTCAGCGAACAGTGCAATCAT | ACATTTCCCACCACGTAGTAAC |
| TSP1 | GCCAACAAACAGGTGTGCAA | GCAGATGATGCCATTGCCAG |
| TNF-α | CTGCACTTTGGAGTGATCGG | TGAGGGTTTGCTACAACATGGG |
Disclaimer/Publisher’s Note: The statements, opinions and data contained in all publications are solely those of the individual author(s) and contributor(s) and not of MDPI and/or the editor(s). MDPI and/or the editor(s) disclaim responsibility for any injury to people or property resulting from any ideas, methods, instructions or products referred to in the content. |
© 2023 by the authors. Licensee MDPI, Basel, Switzerland. This article is an open access article distributed under the terms and conditions of the Creative Commons Attribution (CC BY) license (http://creativecommons.org/licenses/by/4.0/).


