1. Introduction
Additives can have a significant impact on the efficiency of anaerobic digestion (AD) [
1,
2,
3]. The dosage and types of additives used can influence the efficiency of AD, which mainly depends on the substrate material [
1]. Inhibitors such as volatile fatty acids accumulation, high levels of total ammoniacal nitrogen (TAN), sulfur, and heavy metals can slow down the AD process and reduce its efficiency. However, the use of additives can also have advantages, such as reducing greenhouse gas emissions and converting carbon dioxide energy to methane [
2]. Enzyme additives have been shown to increase the efficiency of AD. Overall, using additives in AD can be an effective way to improve biogas production and increase the energetic efficiency of biogas plants [
1,
3]
The performance of a biogas production plant depends on the conditions prevailing inside the bioreactor during AD. Anaerobic digestion is the decomposition and stabilization of organic materials by microbial organisms under anaerobic conditions, which leads to the production of biogas (a mixture of carbon dioxide and methane, a renewable energy source) and microbial biomass [
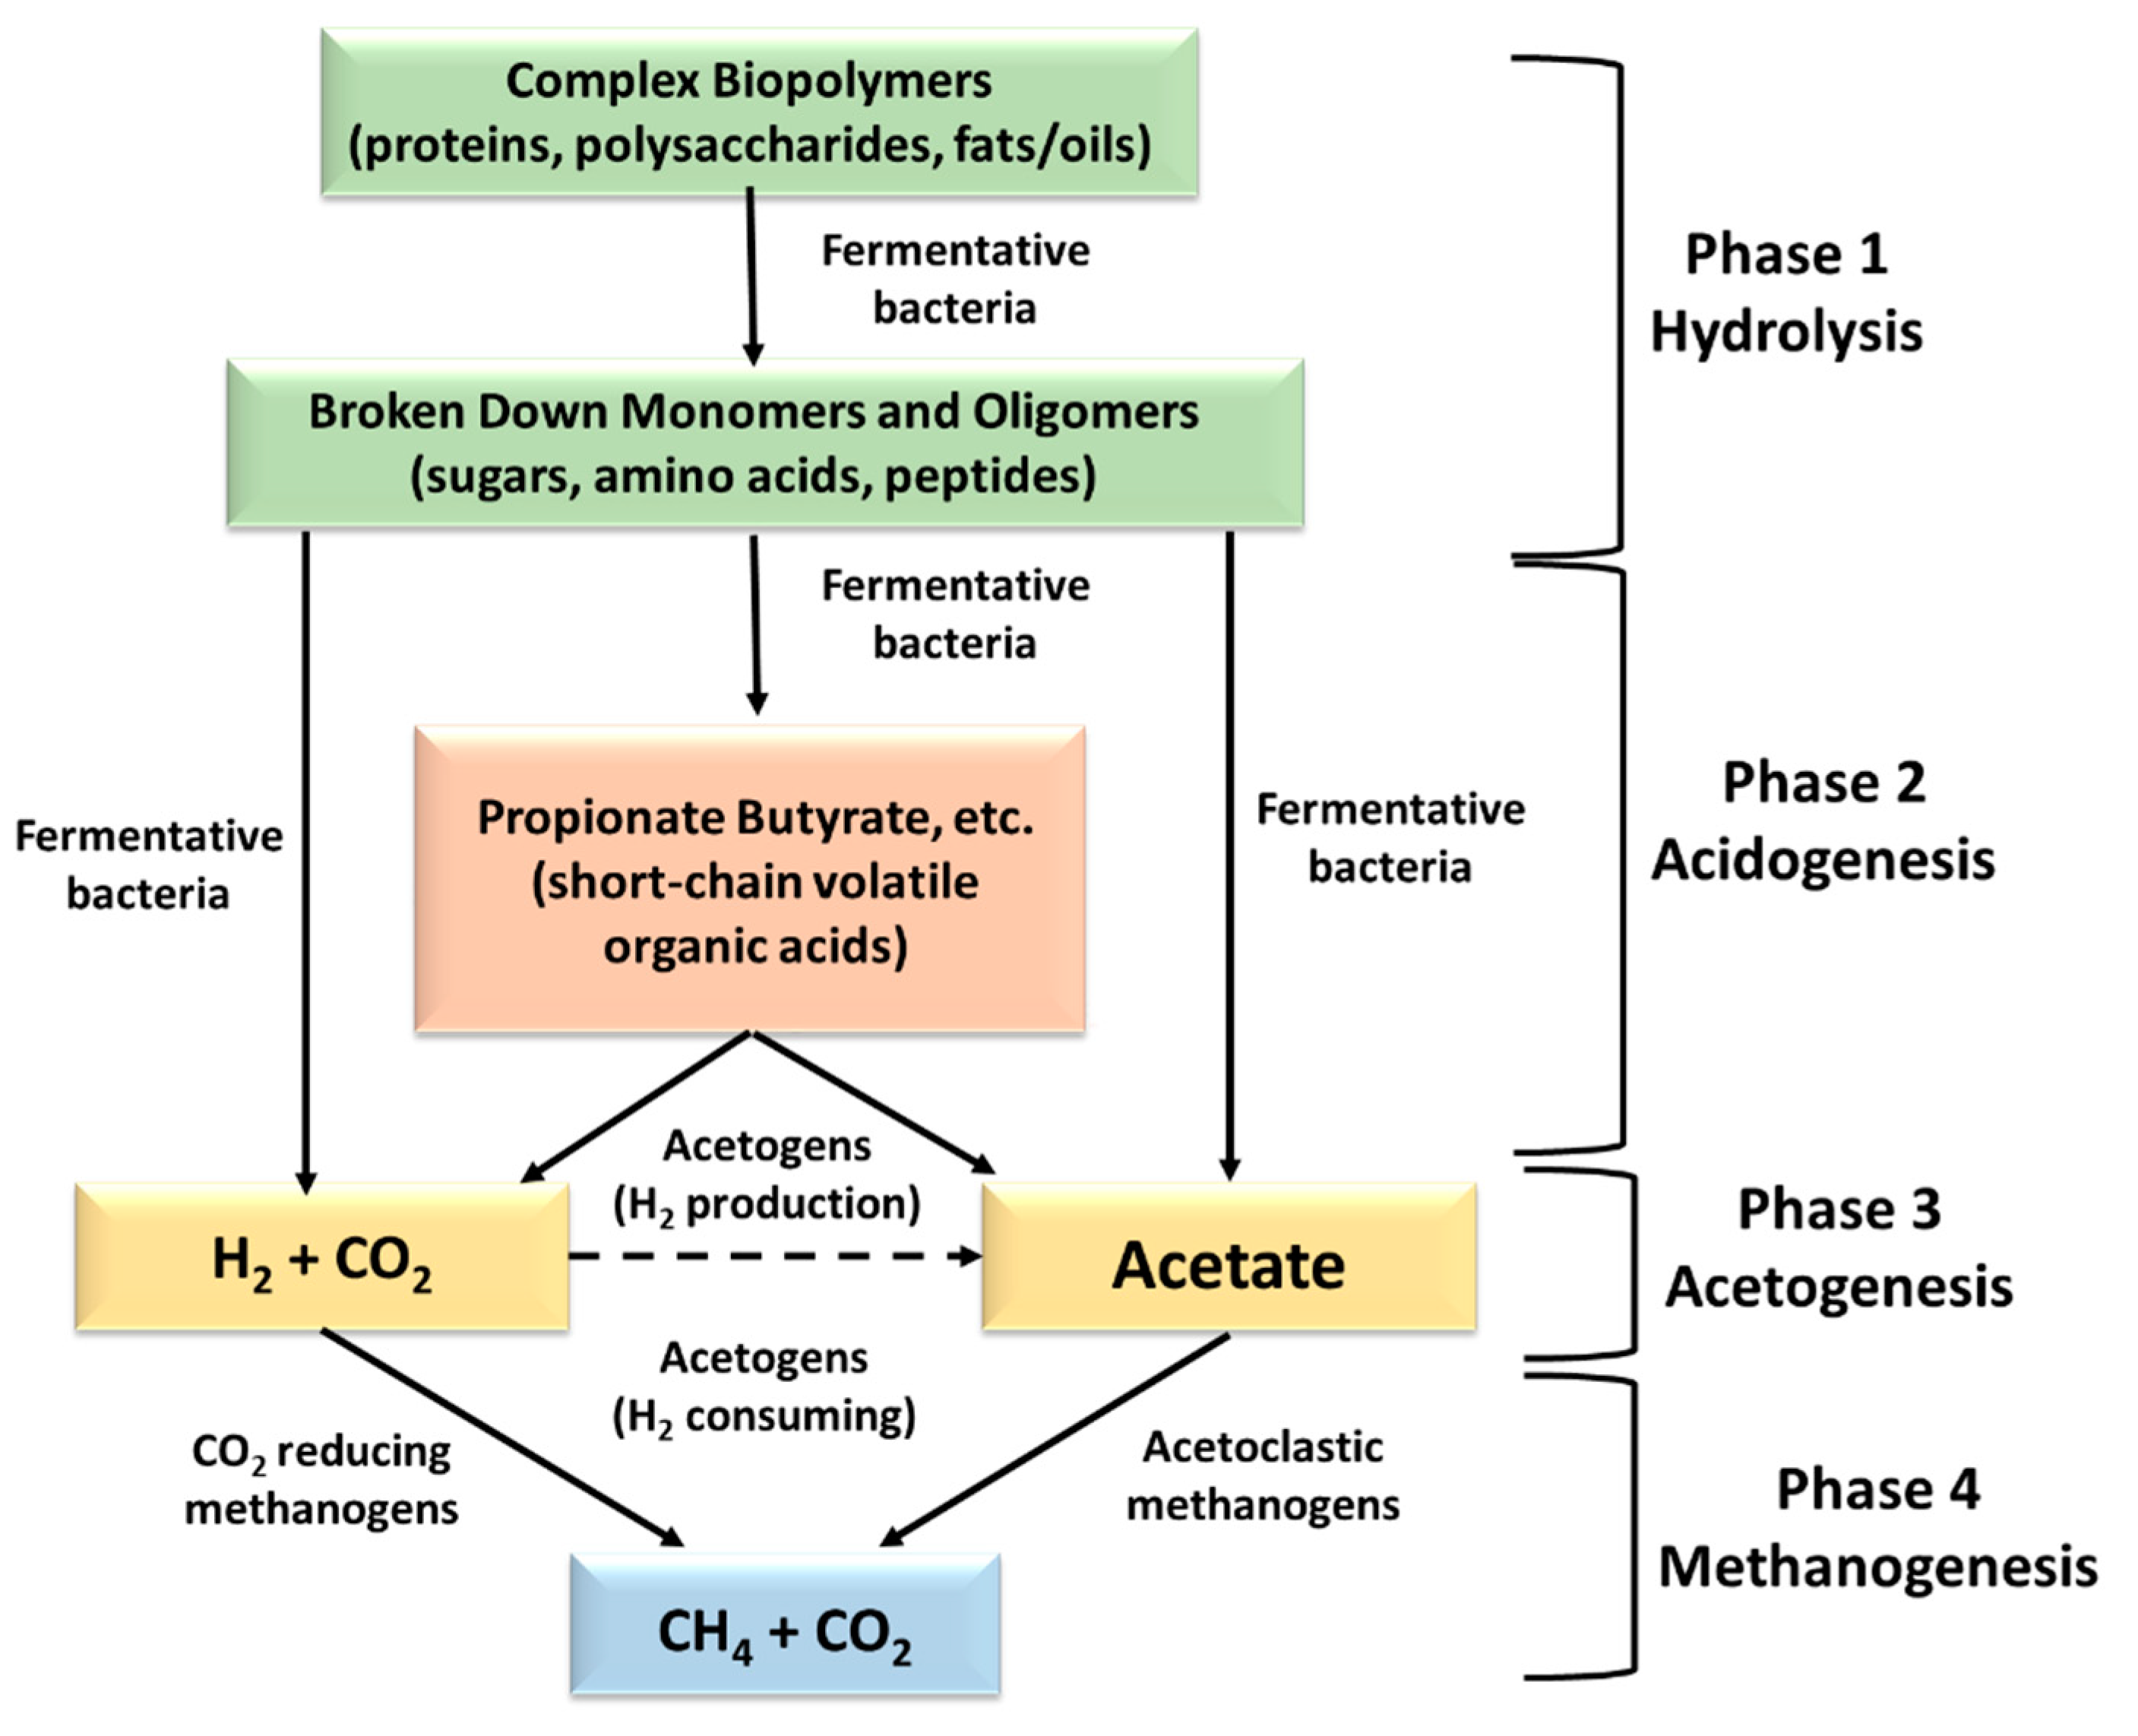
4]. Anaerobic digestion is a synergistic process that uses mainly anaerobic microbes and consists of four phases: 1) hydrolysis, 2) acidogenesis, 3) acetogenesis, and 4) methanogenesis.
Figure 1 exhibits the progression and metabolic chemical compounds for each phase [
5].
Many variables can limit anaerobic digestion, including unstable feed, temperature and pH variations, a shortage of trace elements that are required for the "community" of bacteria to function, and the presence of interfering factors such as ammonia and other substances. One of the most critical parameters of anaerobic digestion is ammonia. Free ammonia creates dysfunctional blockages. Its non-polar chemical structure has the ability to easily pass through the cell membrane causing fluctuations in the chemical balance of protons and loss of potassium (K). Methanogenic microorganisms are considered to be the most sensitive to the increase in ammonia concentration. The concentration of free ammonia and ammonium are inextricably linked through chemical equilibrium. Through rising temperatures, the ratio of free ammonia to ammonium increases. The main destabilizing factors of ammonia are pH and temperature [
6]. pH is a fundamental parameter that directly affects anaerobic digestion. The consistency of the pH value reveals the stability of the system and the lack of any interfering elements. Potential pH variations might be a sign of existing toxicity and a lack of buffering power. Free ammonia and ammonium are in equilibrium in aqueous solution, high pH values favor the formation of free ammonia, which is the most toxic form of ammonia for the methanogens, instead of ammonium, limiting methane production [
7]. While low pH values inhibit the action of methanogenic bacteria and, by extension, methane production [
8].
Determining the buffering capacity of digester contents is the most direct and reliable method for evaluating the smooth operation of the process. The total of the various volatile fatty acids produced during the acidogenesis phase is expressed through the FOS index (mg CH
3COOH/L). The total carbonate in the reactor is the TAC and consists of the fraction of carbonate derived from microbial metabolism plus carbonate derived from the reactor feed. The pH inside the reactor is controlled by the concentration of carbon dioxide in the gas phase and the concentration of carbonate ions in the liquid phase. In case of low buffering capacity (low TAC) of the digester material it is recommended to reduce the supply, add salts leading to carbonate production or directly add carbonate with the supply. Volatile fatty acid (VFA) concentrations and acetic acid equivalent are quite critical parameters for the anaerobic digestion process, as it gives an accurate picture of the prevailing situation inside the digesters. VFAs are a product of the metabolic acidogenesis stage of the anaerobic digestion process. It is necessary to check the profile of volatile fatty acids as there is a possibility of some acid accumulation. Accumulation of some acid is more often than not capable of causing a decrease in efficiency in the unit as supply accumulates, which cannot be degraded by the micro-organisms [
9].
Products based on zeolite, trace elements, tri-valent iron, activated carbon, enzymes, buffer solutions (for pH adjustment) and bacteria cultures are additives or supplements that can improve the performance of anaerobic digestion. Zeolite has been shown to have a good adsorption effect on ammonia nitrogen in anaerobic digestion [
10], and therefore has been proposed as additives to alleviate ammonia toxicity. Trace element supplements, such as iron, cobalt, nickel and selenium can improve the economic viability and conductivity of anaerobic digesters [
2], especially under deficit conditions of these cations, while buffer solutions have been used to regulate the pH [
11]. These additives can promote gas production and improve process stability, system recovery time from volatile fatty acids inhibition, and microbial community dynamics in anaerobic digestion [
12]. Although there is extensive literature concerning the use of these supplements in laboratory scale reactors, reports about their use in full scale biogas plants are limited. In this study, the application of specialized supplements for the stabilization of the anaerobic digestion process in two cases of full-scale biogas plants operating under high ammonia concentrations and high pH, as well as a case where a deficiency of trace elements was observed.
2. Results
2.1. Operating Conditions of Biogas Plants and Additives Application
Data were collected from three different biogas plants (BG01, BG02, and BG03), in order to monitor the pre-additive state of phases. Each plant exhibited different operational issues, for which a plant-individual approach was used to provide solutions. Analyses were performed on digester material samples (digestate), and operational parameters such as pH, total ammonia nitrogen concentration, FOS/TAC, VFA profile, and trace elements concentration were verified.
Table 1 exhibits the operating conditions of the three examined biogas production plants.
A customized monitoring plan was implemented to enhance each plant's performance and address any issues. The usage of the proper additive was advised for each plant, either on a daily or weekly basis. Zeolite was added in plants BG01 and BG03 to reduce total ammoniacal nitrogen levels, and an acidic buffer solution was added to adjust the pH. A trace element mixture was applied to plant BG02. The quantity and frequency of use for each plant are detailed in
Table 2.
2.2. The Effect of Additives Zeolites and Buffer Solution in the Stabilization of the Biogas BG01 Plant
The pH and total ammoniacal nitrogen values were decreased by utilizing zeolite and the buffer solution in plants BG01 and BG03. Additionally, in the instance of plant BG03, digester D2 similarly showed a decrease in VFA accumulation. Zeolite was used as an additive in both situations, which enhanced the performance of the plant. The BG02 plant’s requirements for crucial trace elements for the operation were similarly provided by the addition of trace elements. Both the number of additives and the frequency of their addition to the digesters were fundamental in combating plant malfunctions.
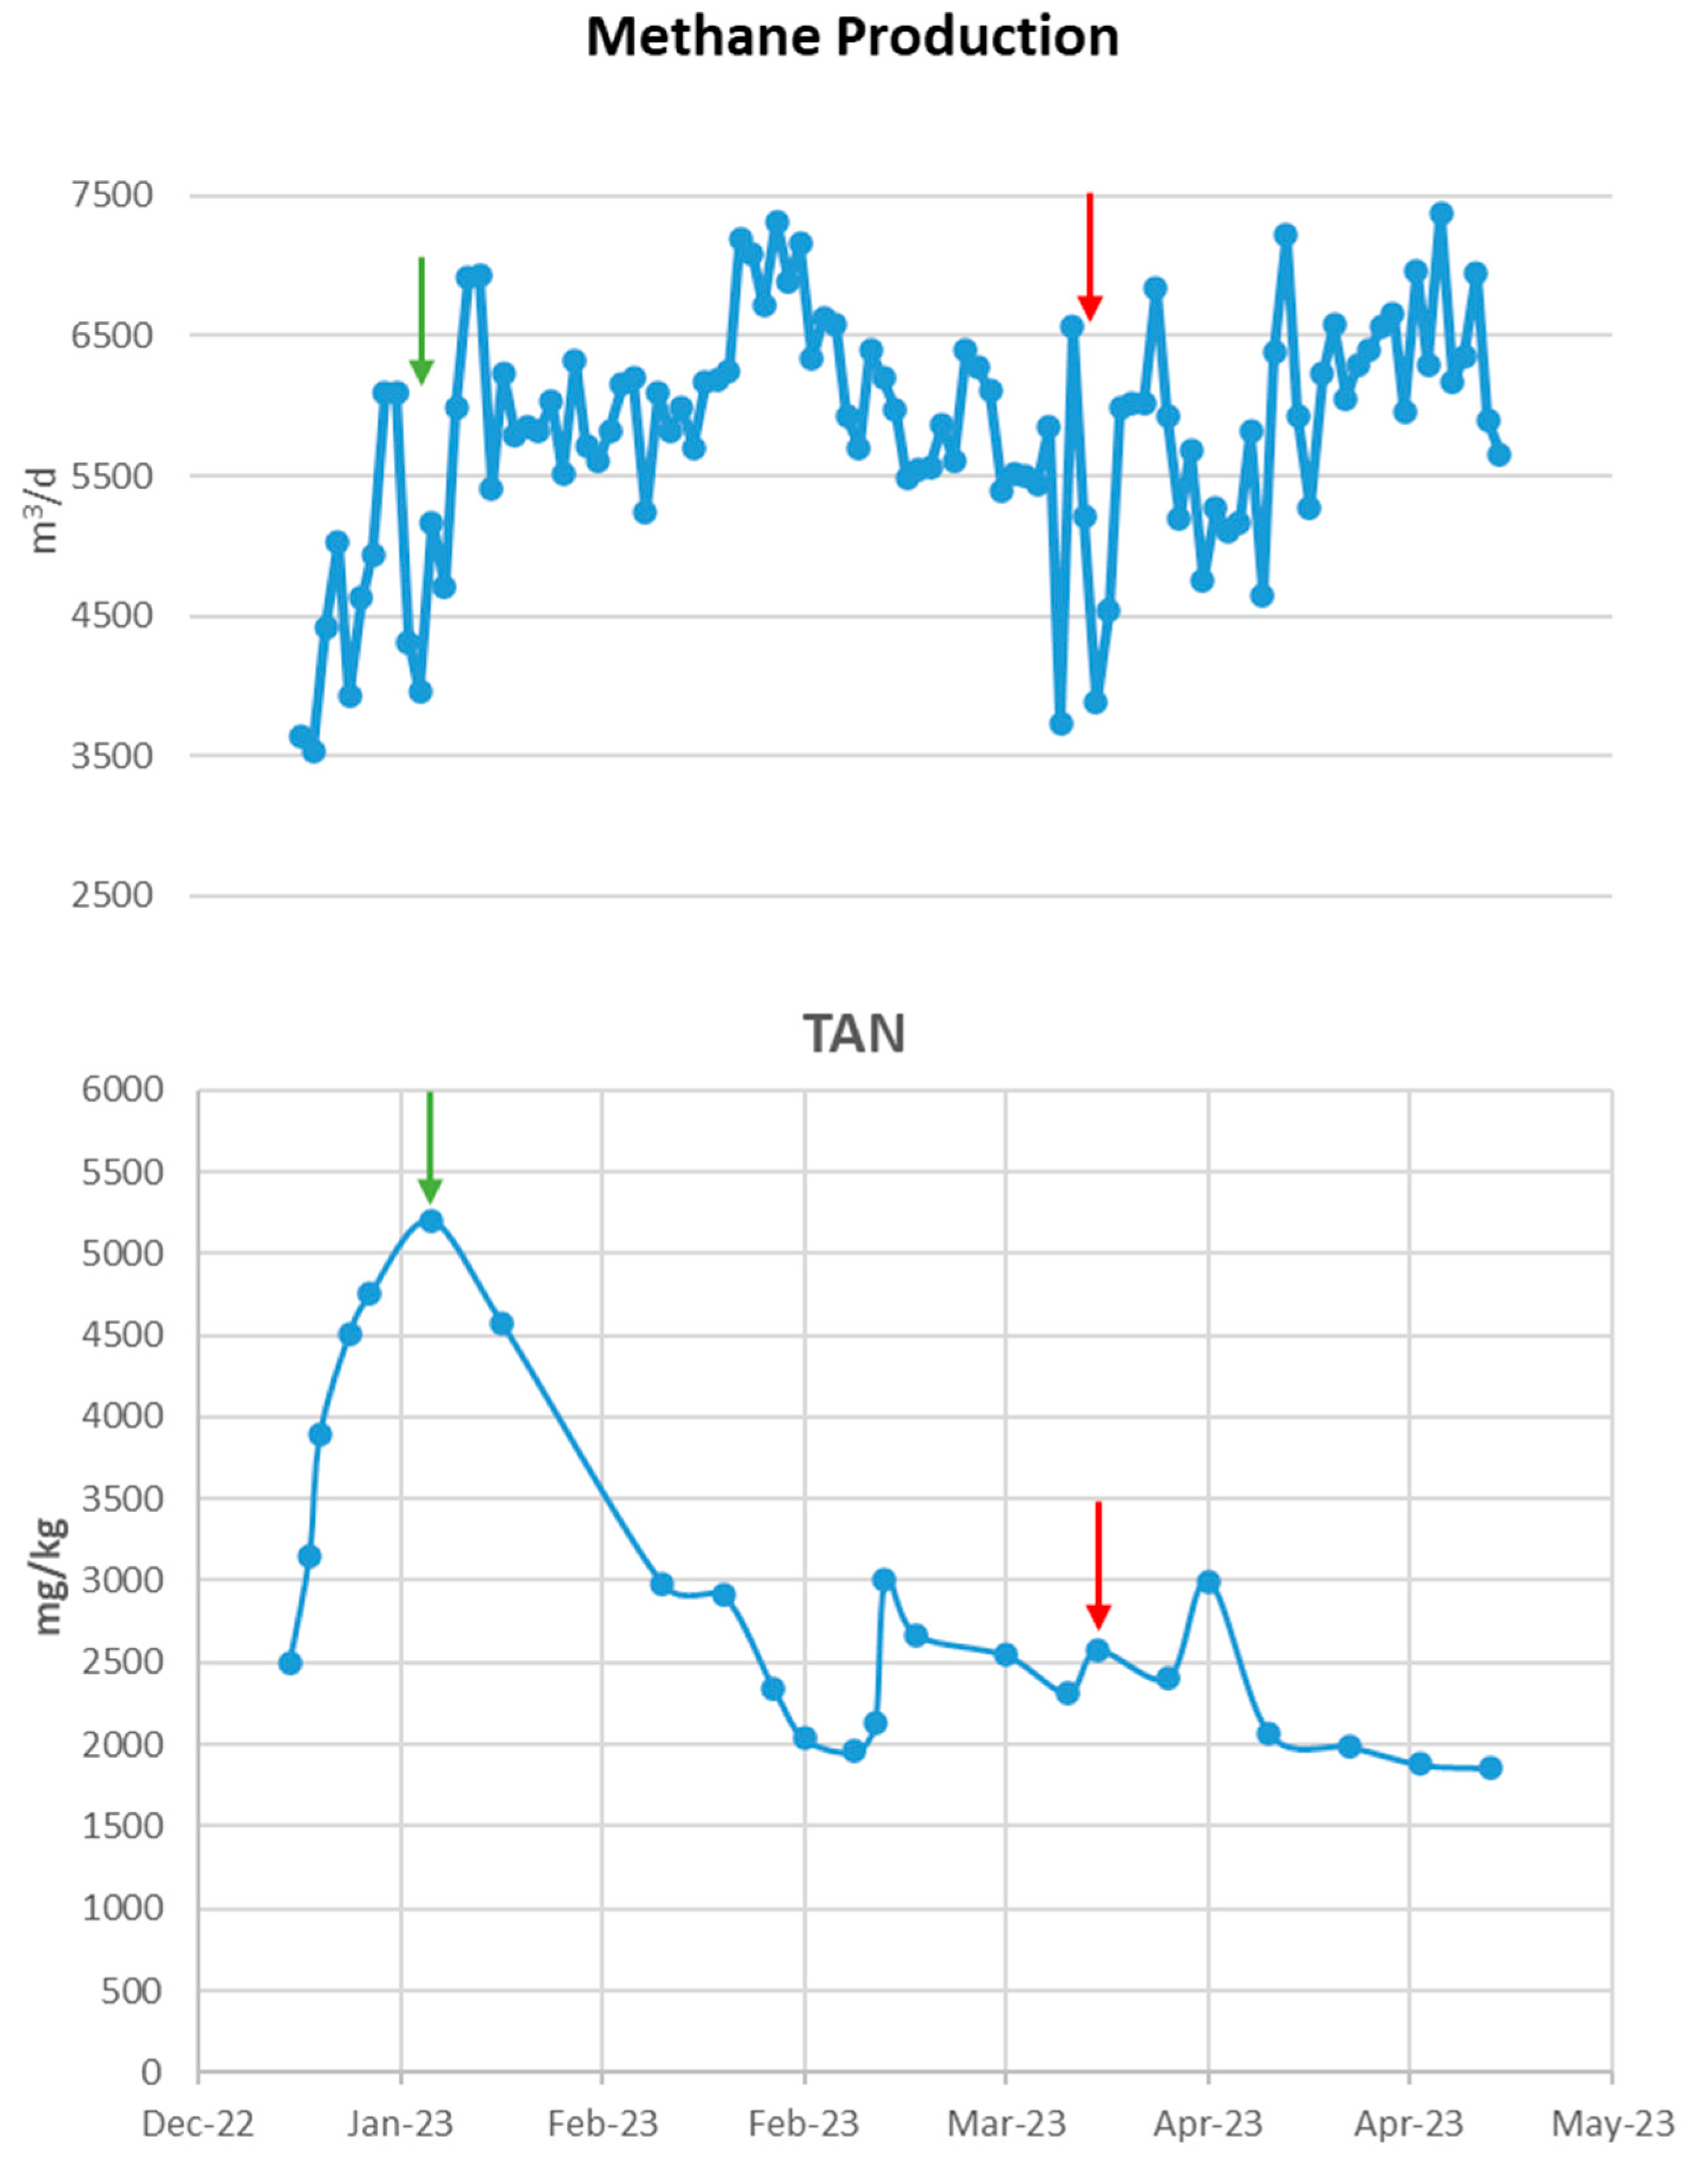
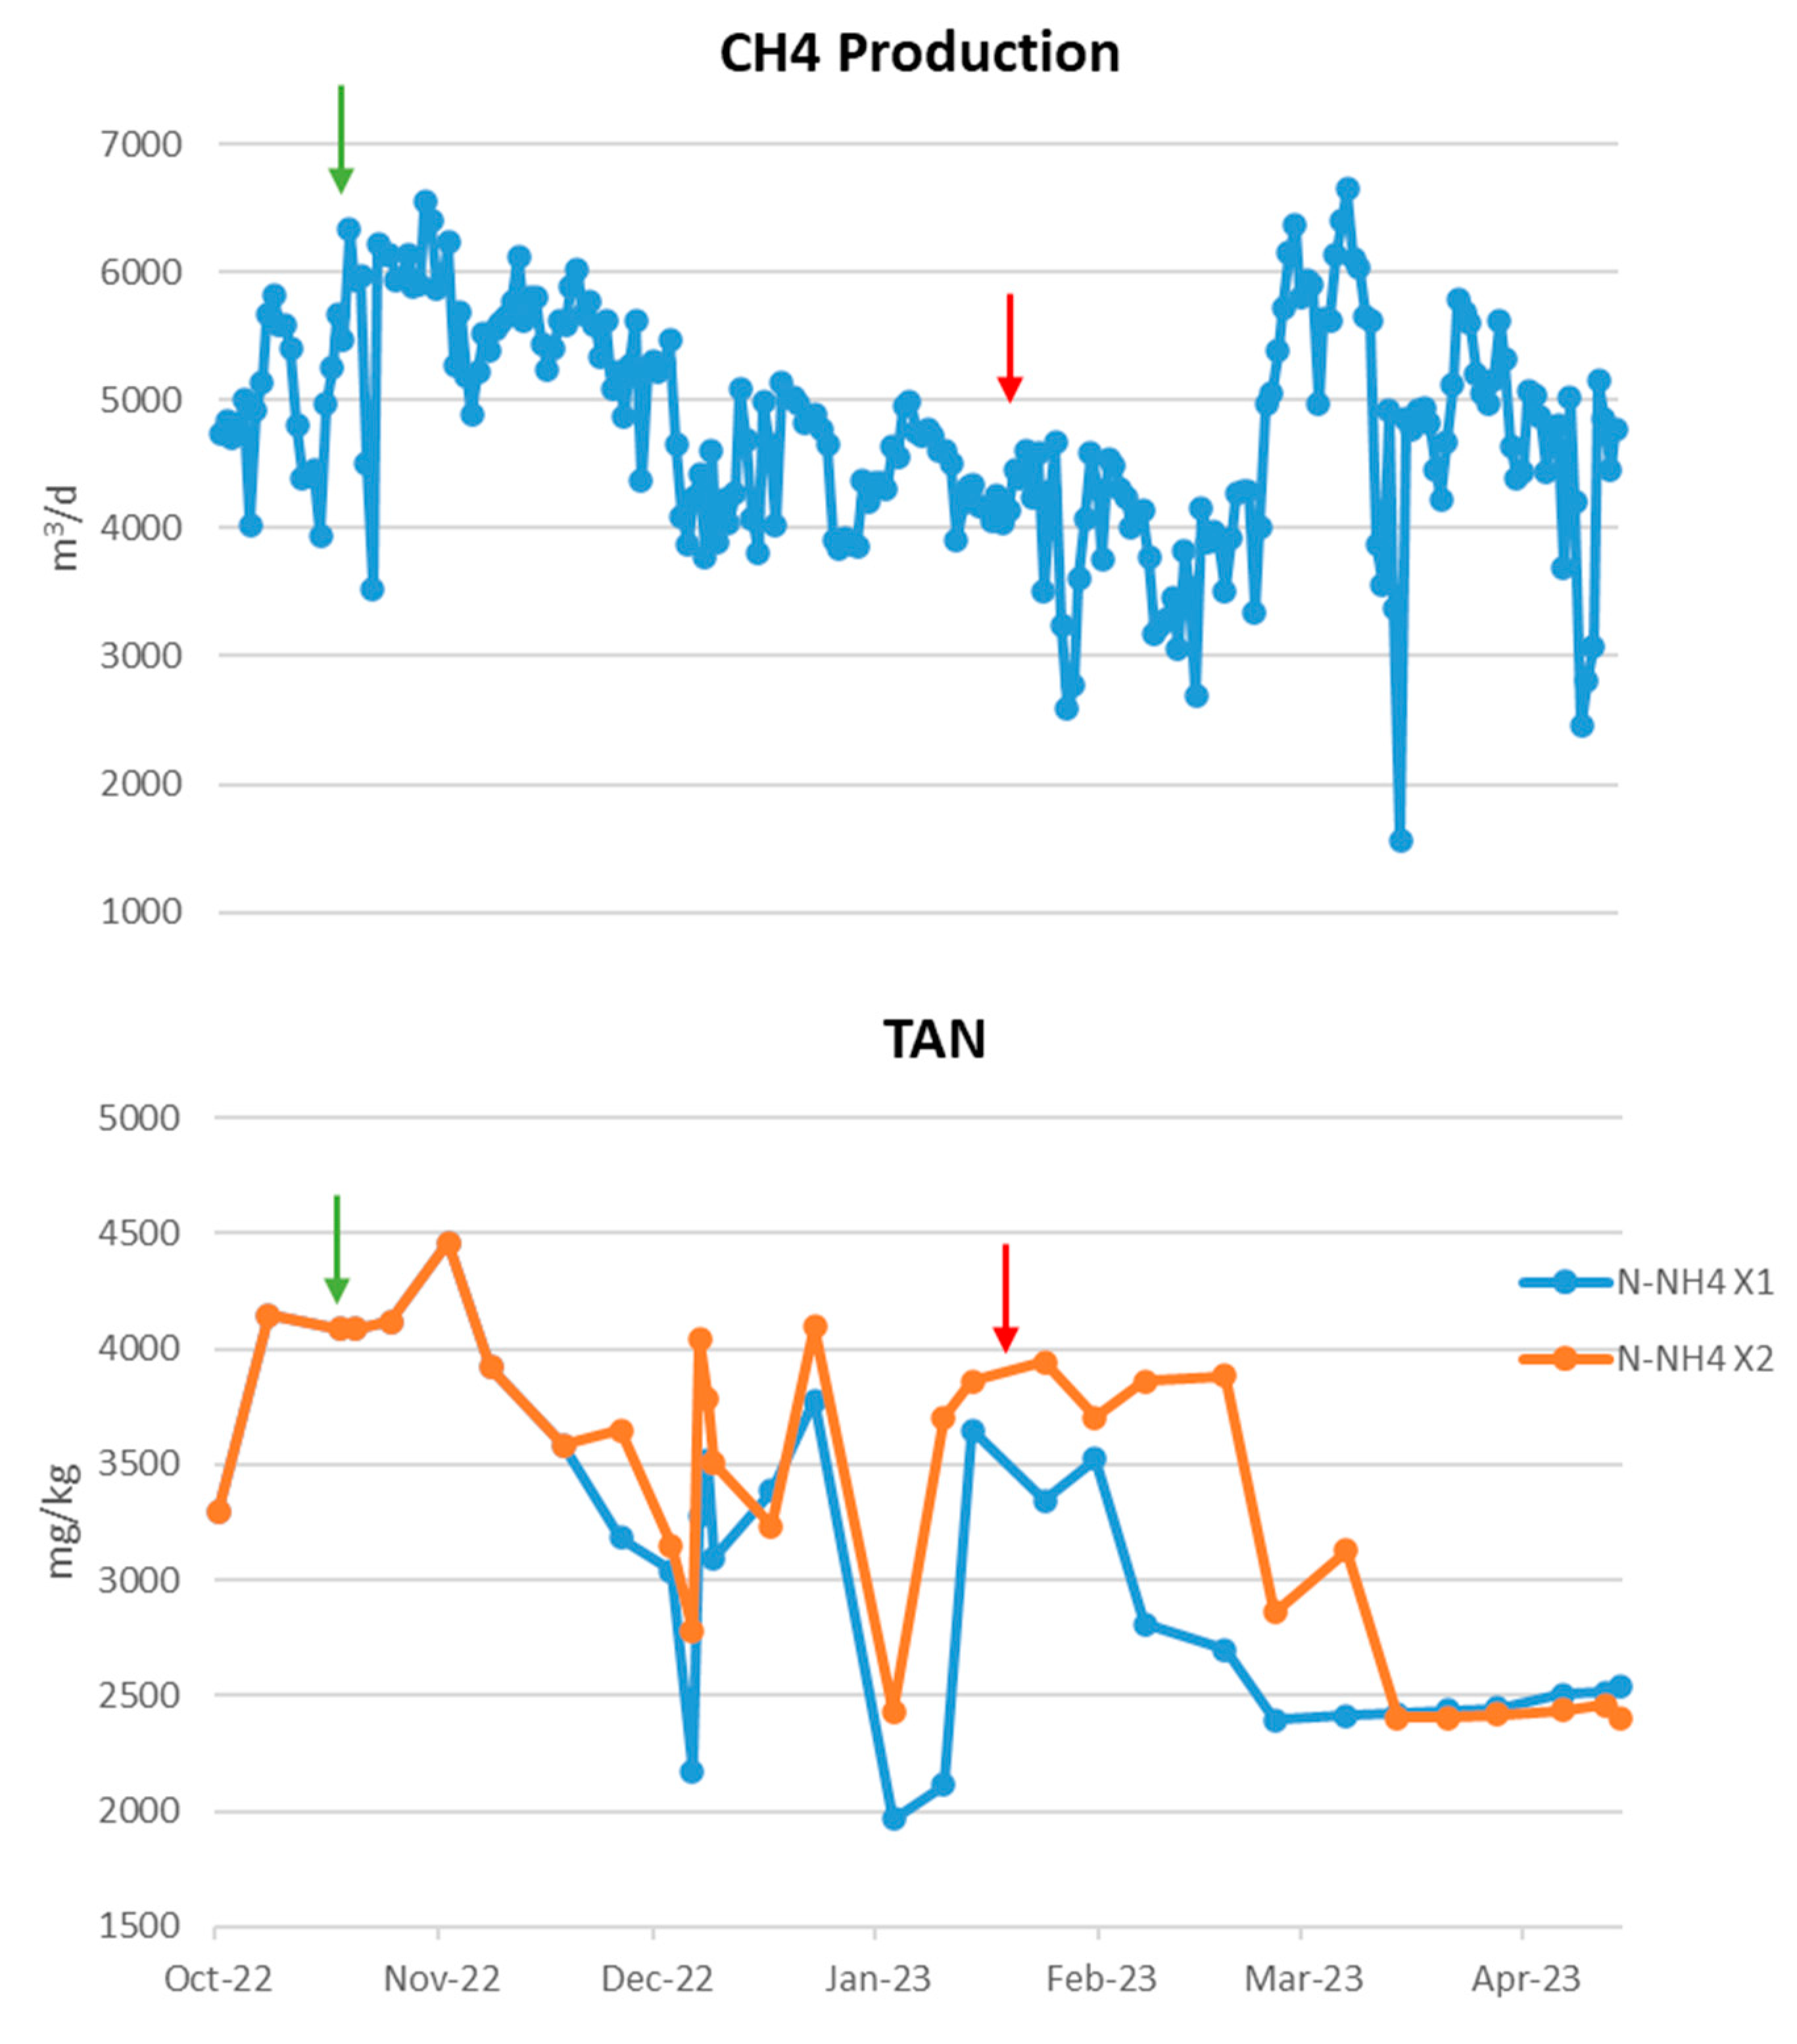
The BG01 biogas plant operated under unstable conditions as shown in Figure 2. Along with the increase in pH to 8.5, there was also a significant rise in ammonia exceeding 5000 ppm, which in combination affected the significant reduction in methane production by approximately 2000 m3 per day, just before the additives are introduced. The high value of ammonia as well as the increase in pH, since at increased pH ammonia transforms into free ammonia, which is the toxic form of ammonia for methanogenic populations, contributed to the significant reduction of methane. To address this situation, the biogas plant stopped feeding it with poultry manure, which due to its protein composition is rich in ammonia, and at the same time, zeolite and buffer solution were introduced into the reactor as shown in Table 2. With the combination solution chosen, immediately within a few days, the biogas plant recovered, presenting an increase in the daily production of methane by >2500 m3, and on average >5906 m3 during the period when the additives were introduced day 11 to day 72 in relation to the production of methane before the introduction of additives. The introduction of additives combined with the discontinuation of poultry manure supplement helped to reduce the ammonia concentration in the biogas plant and to stabilize the pH resulting in the treatment of the ammonia toxicity that had occurred. The drastic reduction in ammonia is due in part to the addition of the zeolite which adsorbed some of the ammonium ions. It is noteworthy that the reactor maintained steady conditions long after the additives’ inclusion.
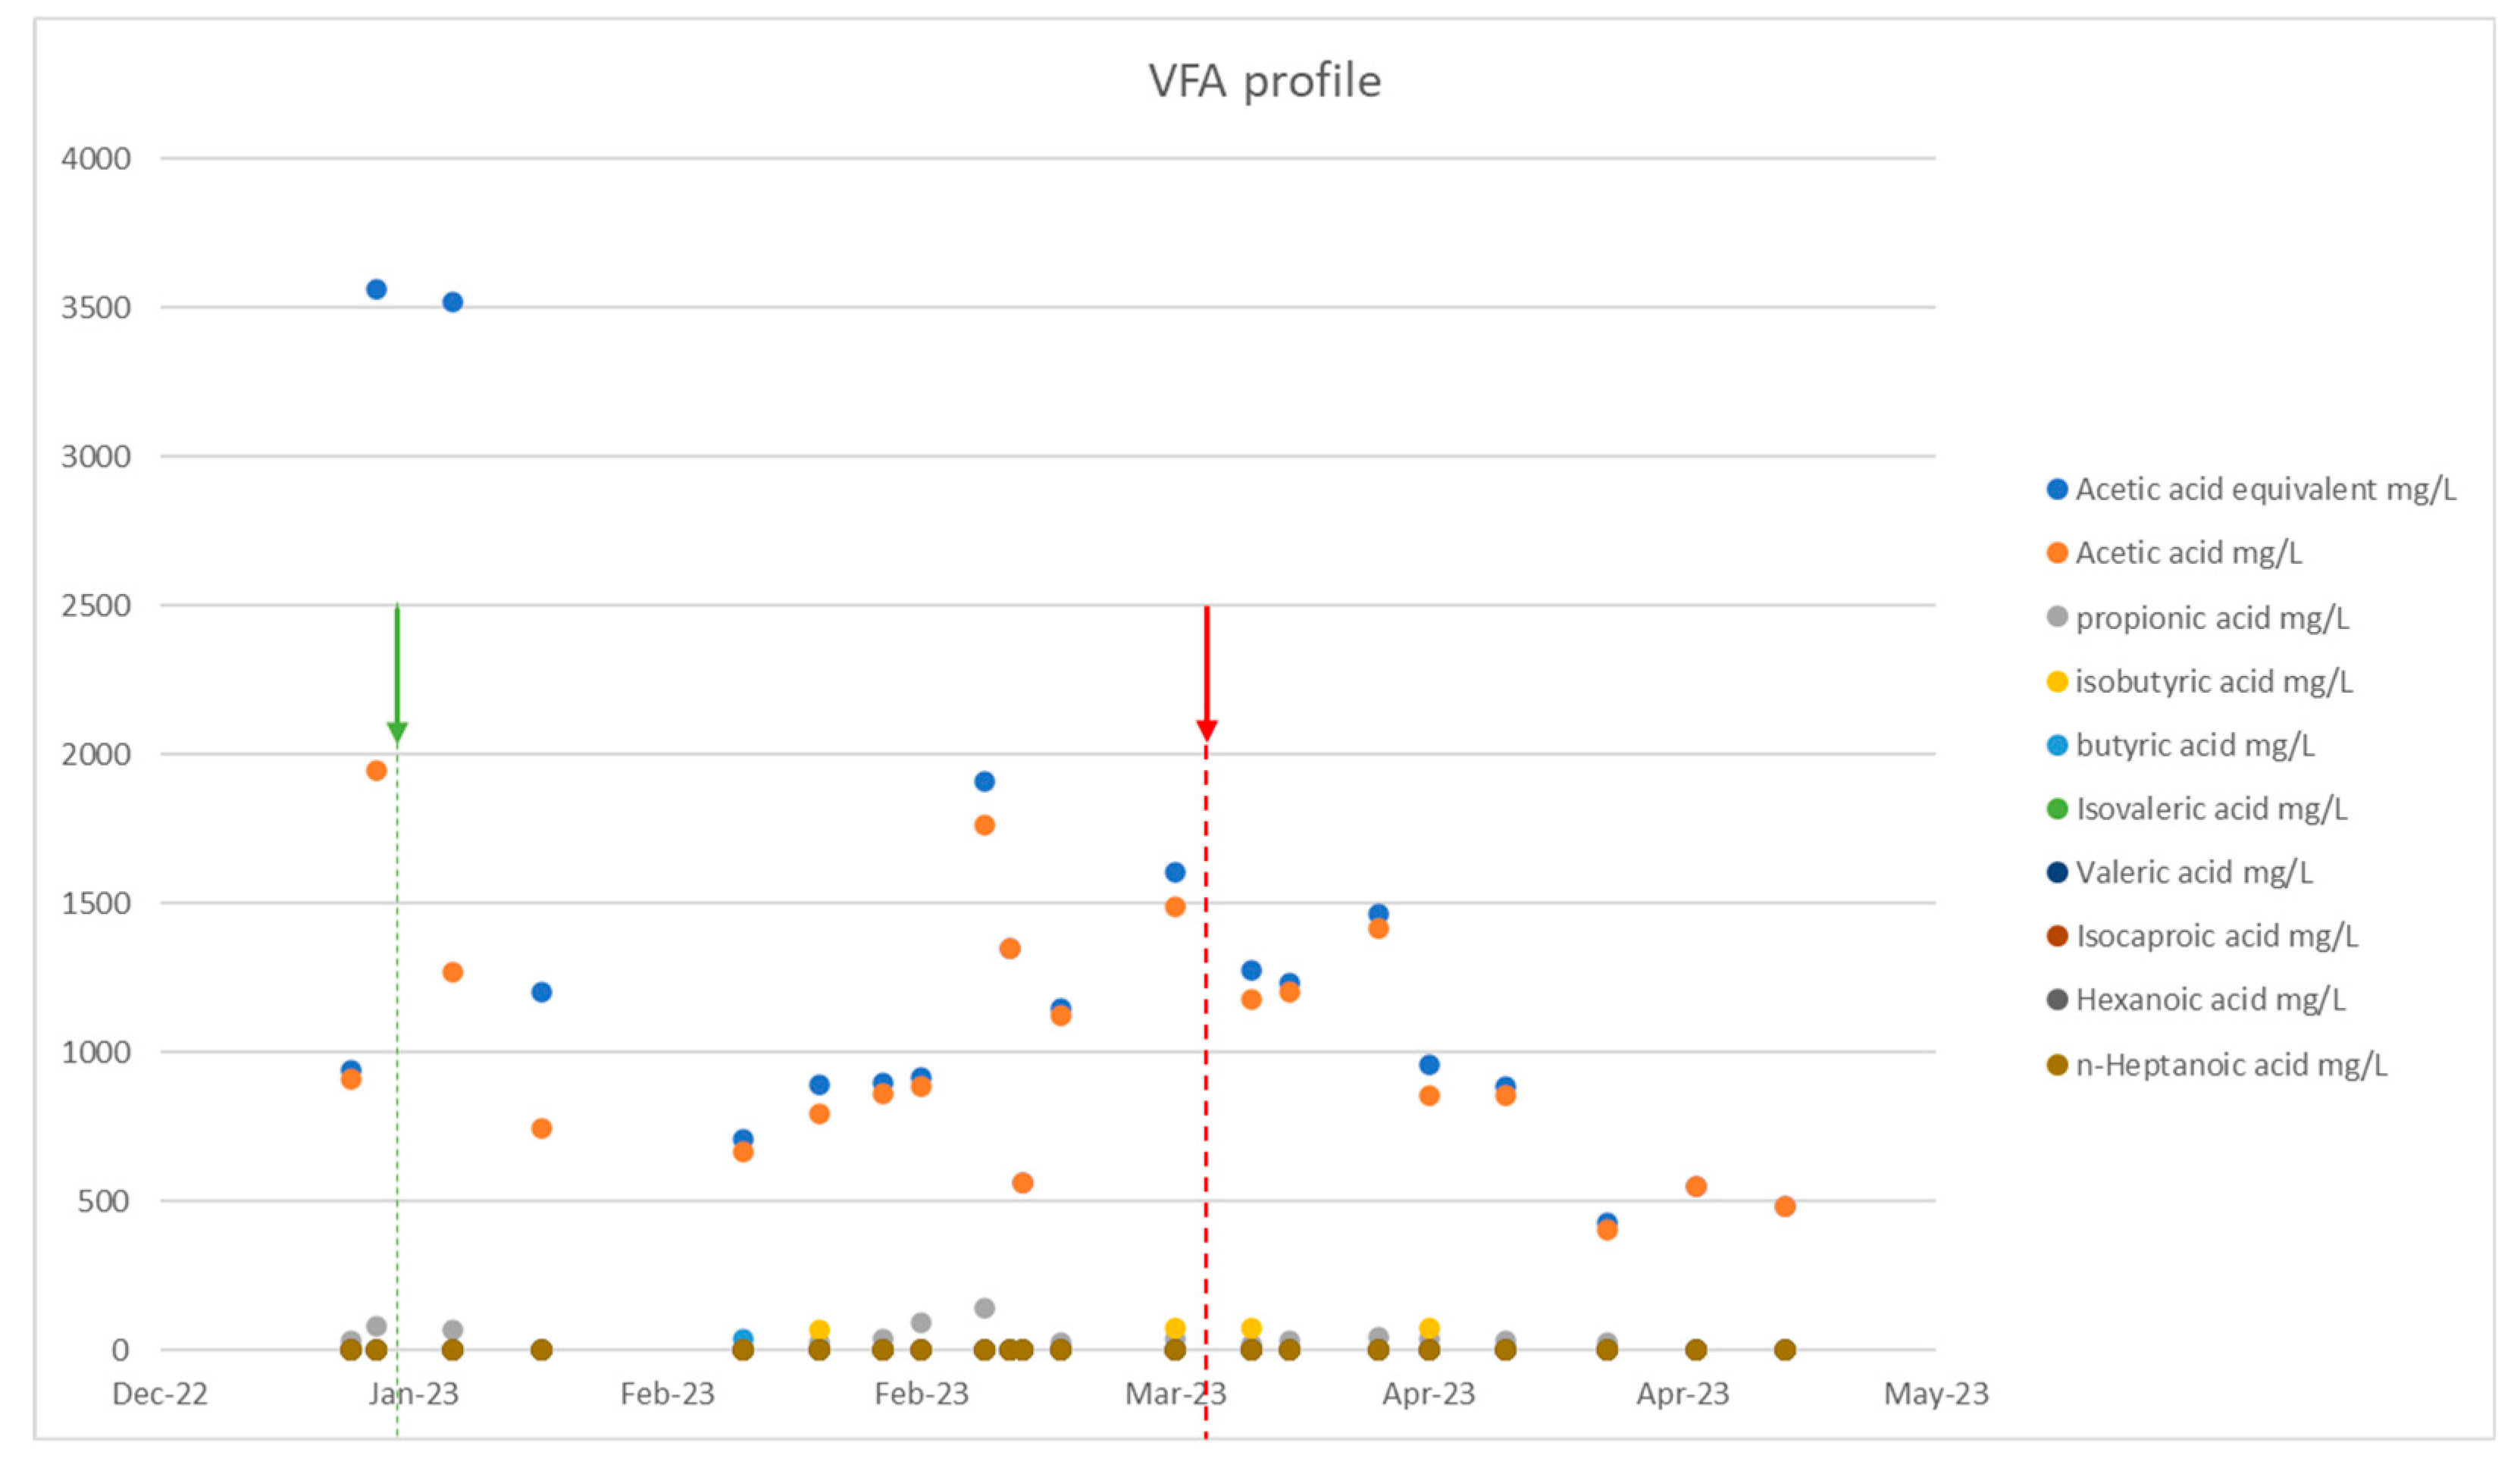
Figure 3 shows the VFAs of the plant which were elevated during the toxicity period and which decreased with the introduction of the additives, which results are consistent with the increased methane production that occurred during this period. It should be noted that increased volatile fatty acid concentrations in a reactor, especially propionic acid, are an indicator of anaerobic degradation instability.
2.2. The Effect of Additives Zeolites and Buffer Solution in the Stabilization of the Biogas BG02 Plant
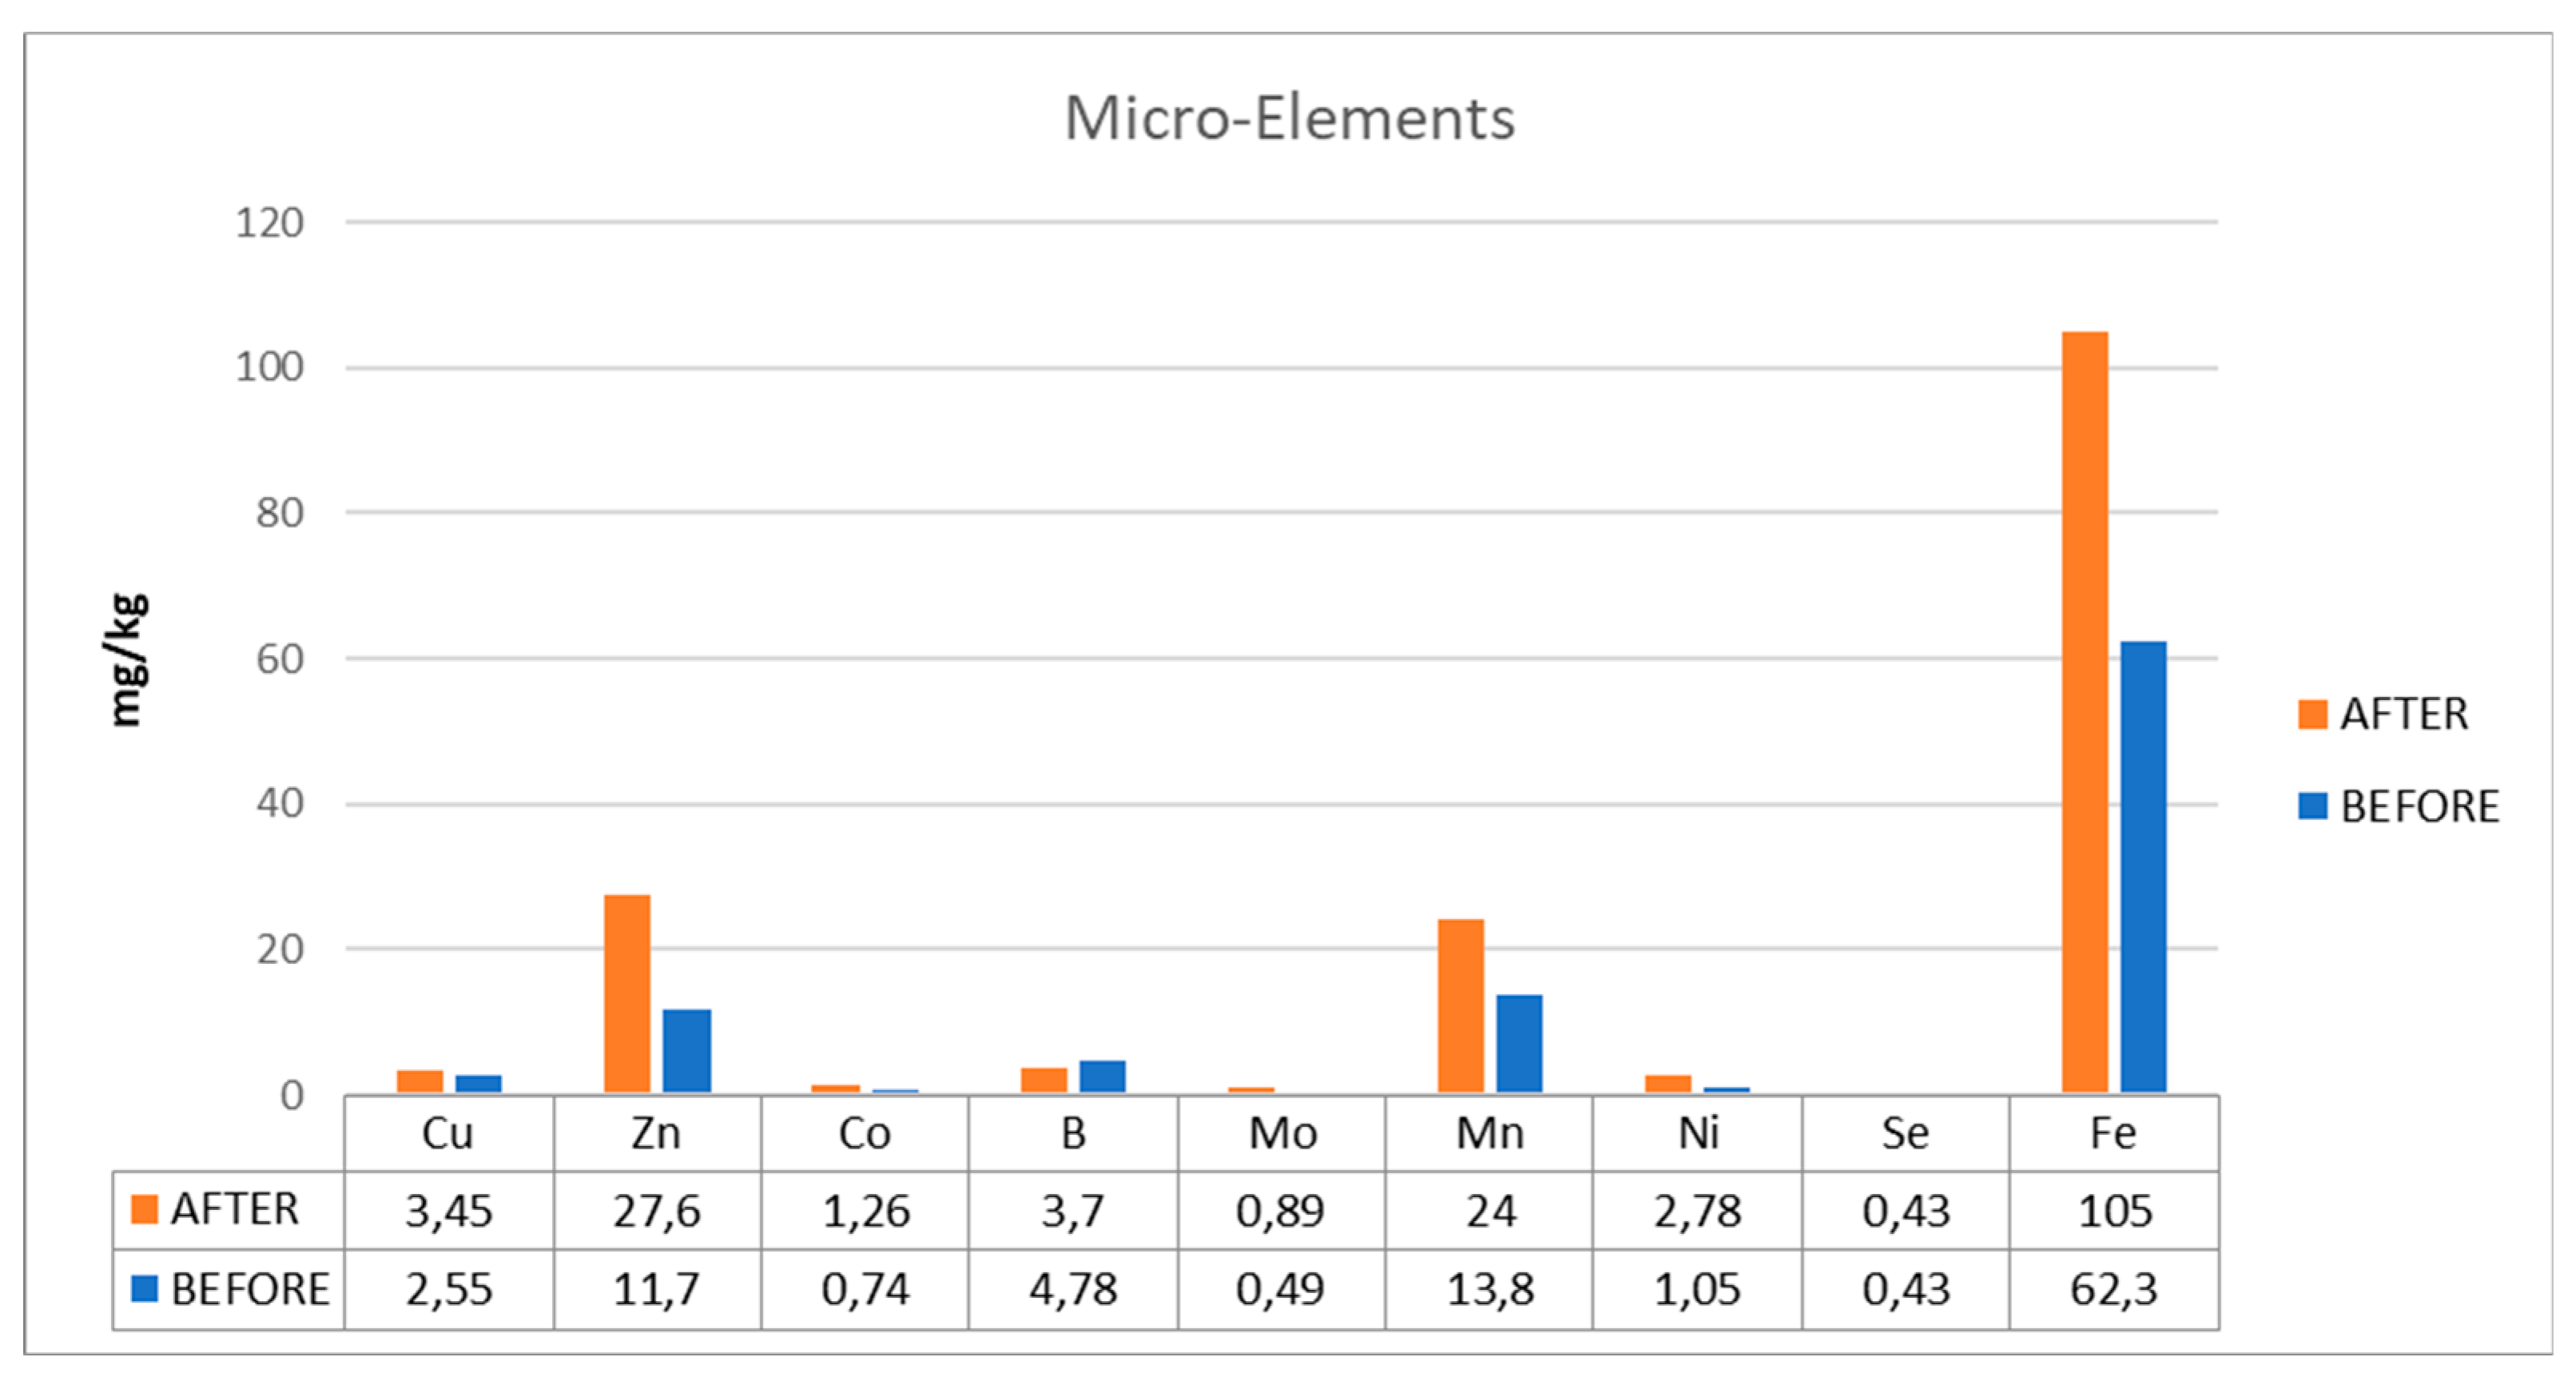
Due to nutritional deficits in the digesters, the plant had operational issues with reduced yields and unstable operation. Low quantities of copper (Cu), zinc (Zn), iron (Fe), manganese (Mn), calcium (Ca), and sodium (Na), six elements that are crucial to the process, were present in the biogas plant. In digester D1, elevated VFA values were additionally noted.
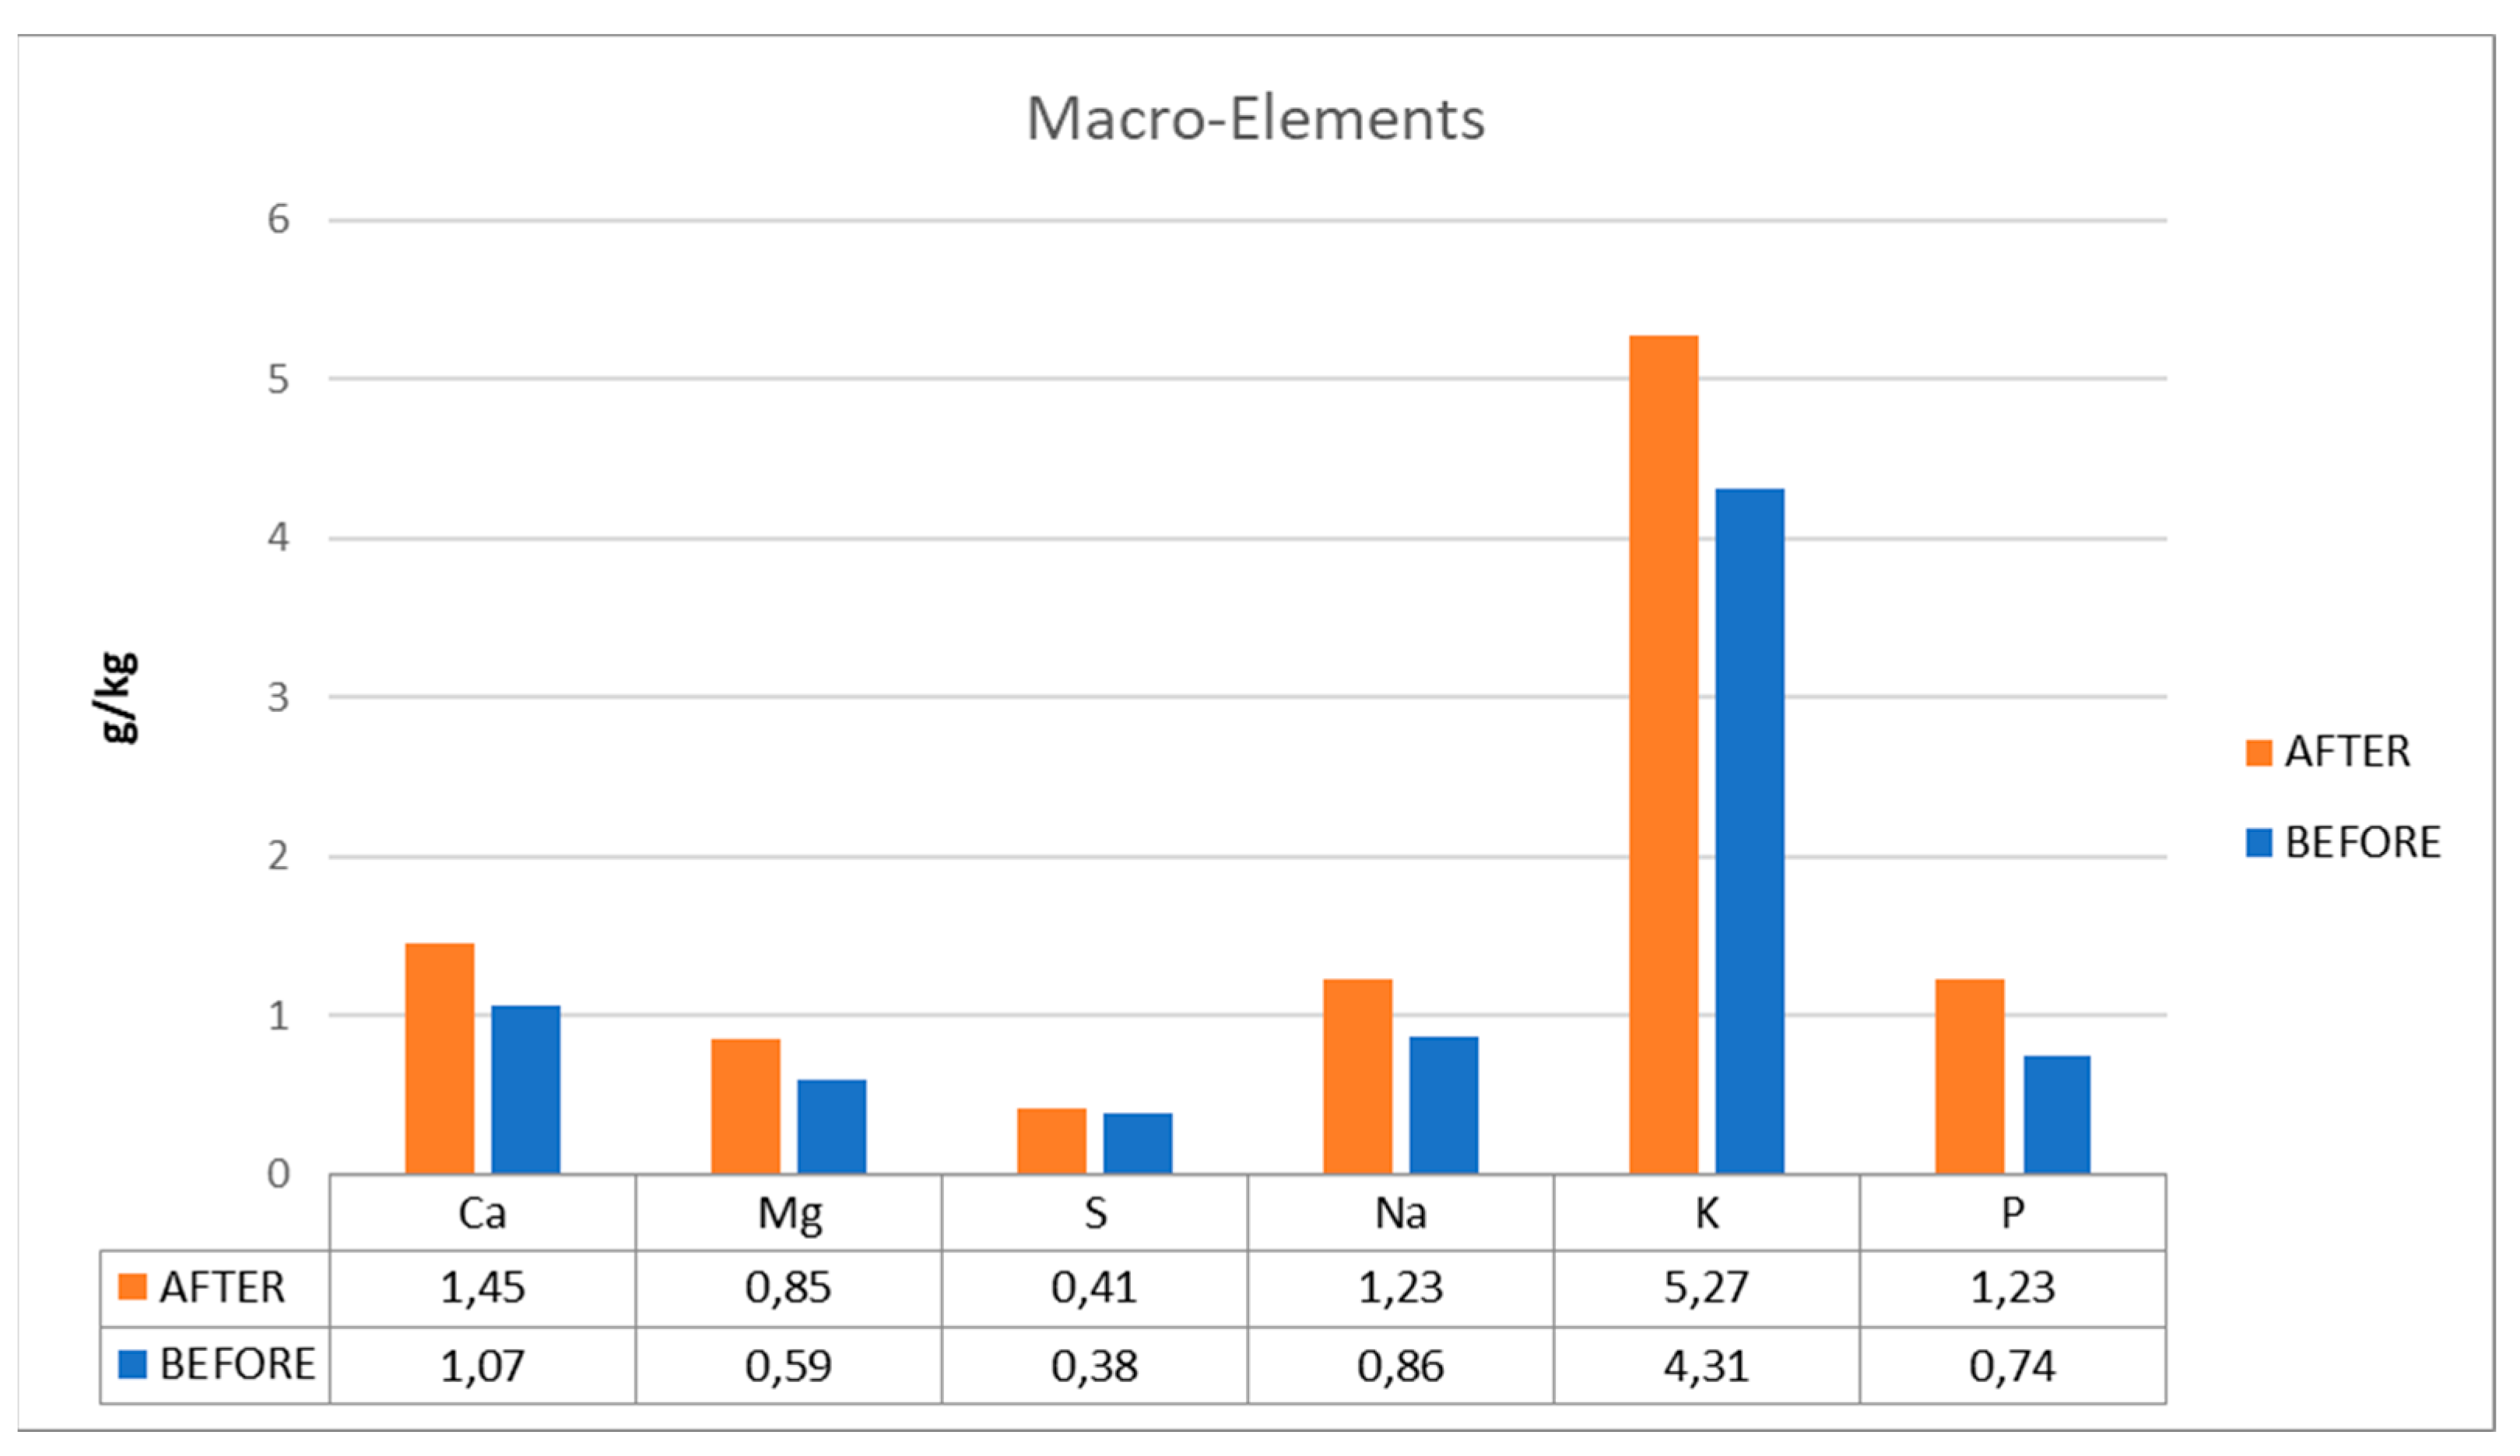
The variation diagrams of trace element values, before and after their addition to the plant's digester, are shown in
Figure 4 and
Figure 5 (micro- and macro-elements). The use of the additive contributed to the increase of critical for the plant trace elements (Cu, Zn, Fe, Mn, Ca, and Na), which are responsible for combating the toxicity that may occur in the plant and expanding to ensure its steady operating state.
2.3. The Effect of Additives Zeolites and Buffer Solution in the Stabilization of the Biogas BG03 Plant
It was considered reasonable to test the same recipe as the prior plant, in which the introduction showed positive results, in a plant that ran with reduced methane output, at relatively high ammonia concentrations, and at a high pH. While the reactor initially produced more methane after the addition of the supplements (during the first days after the addition of the supplements,
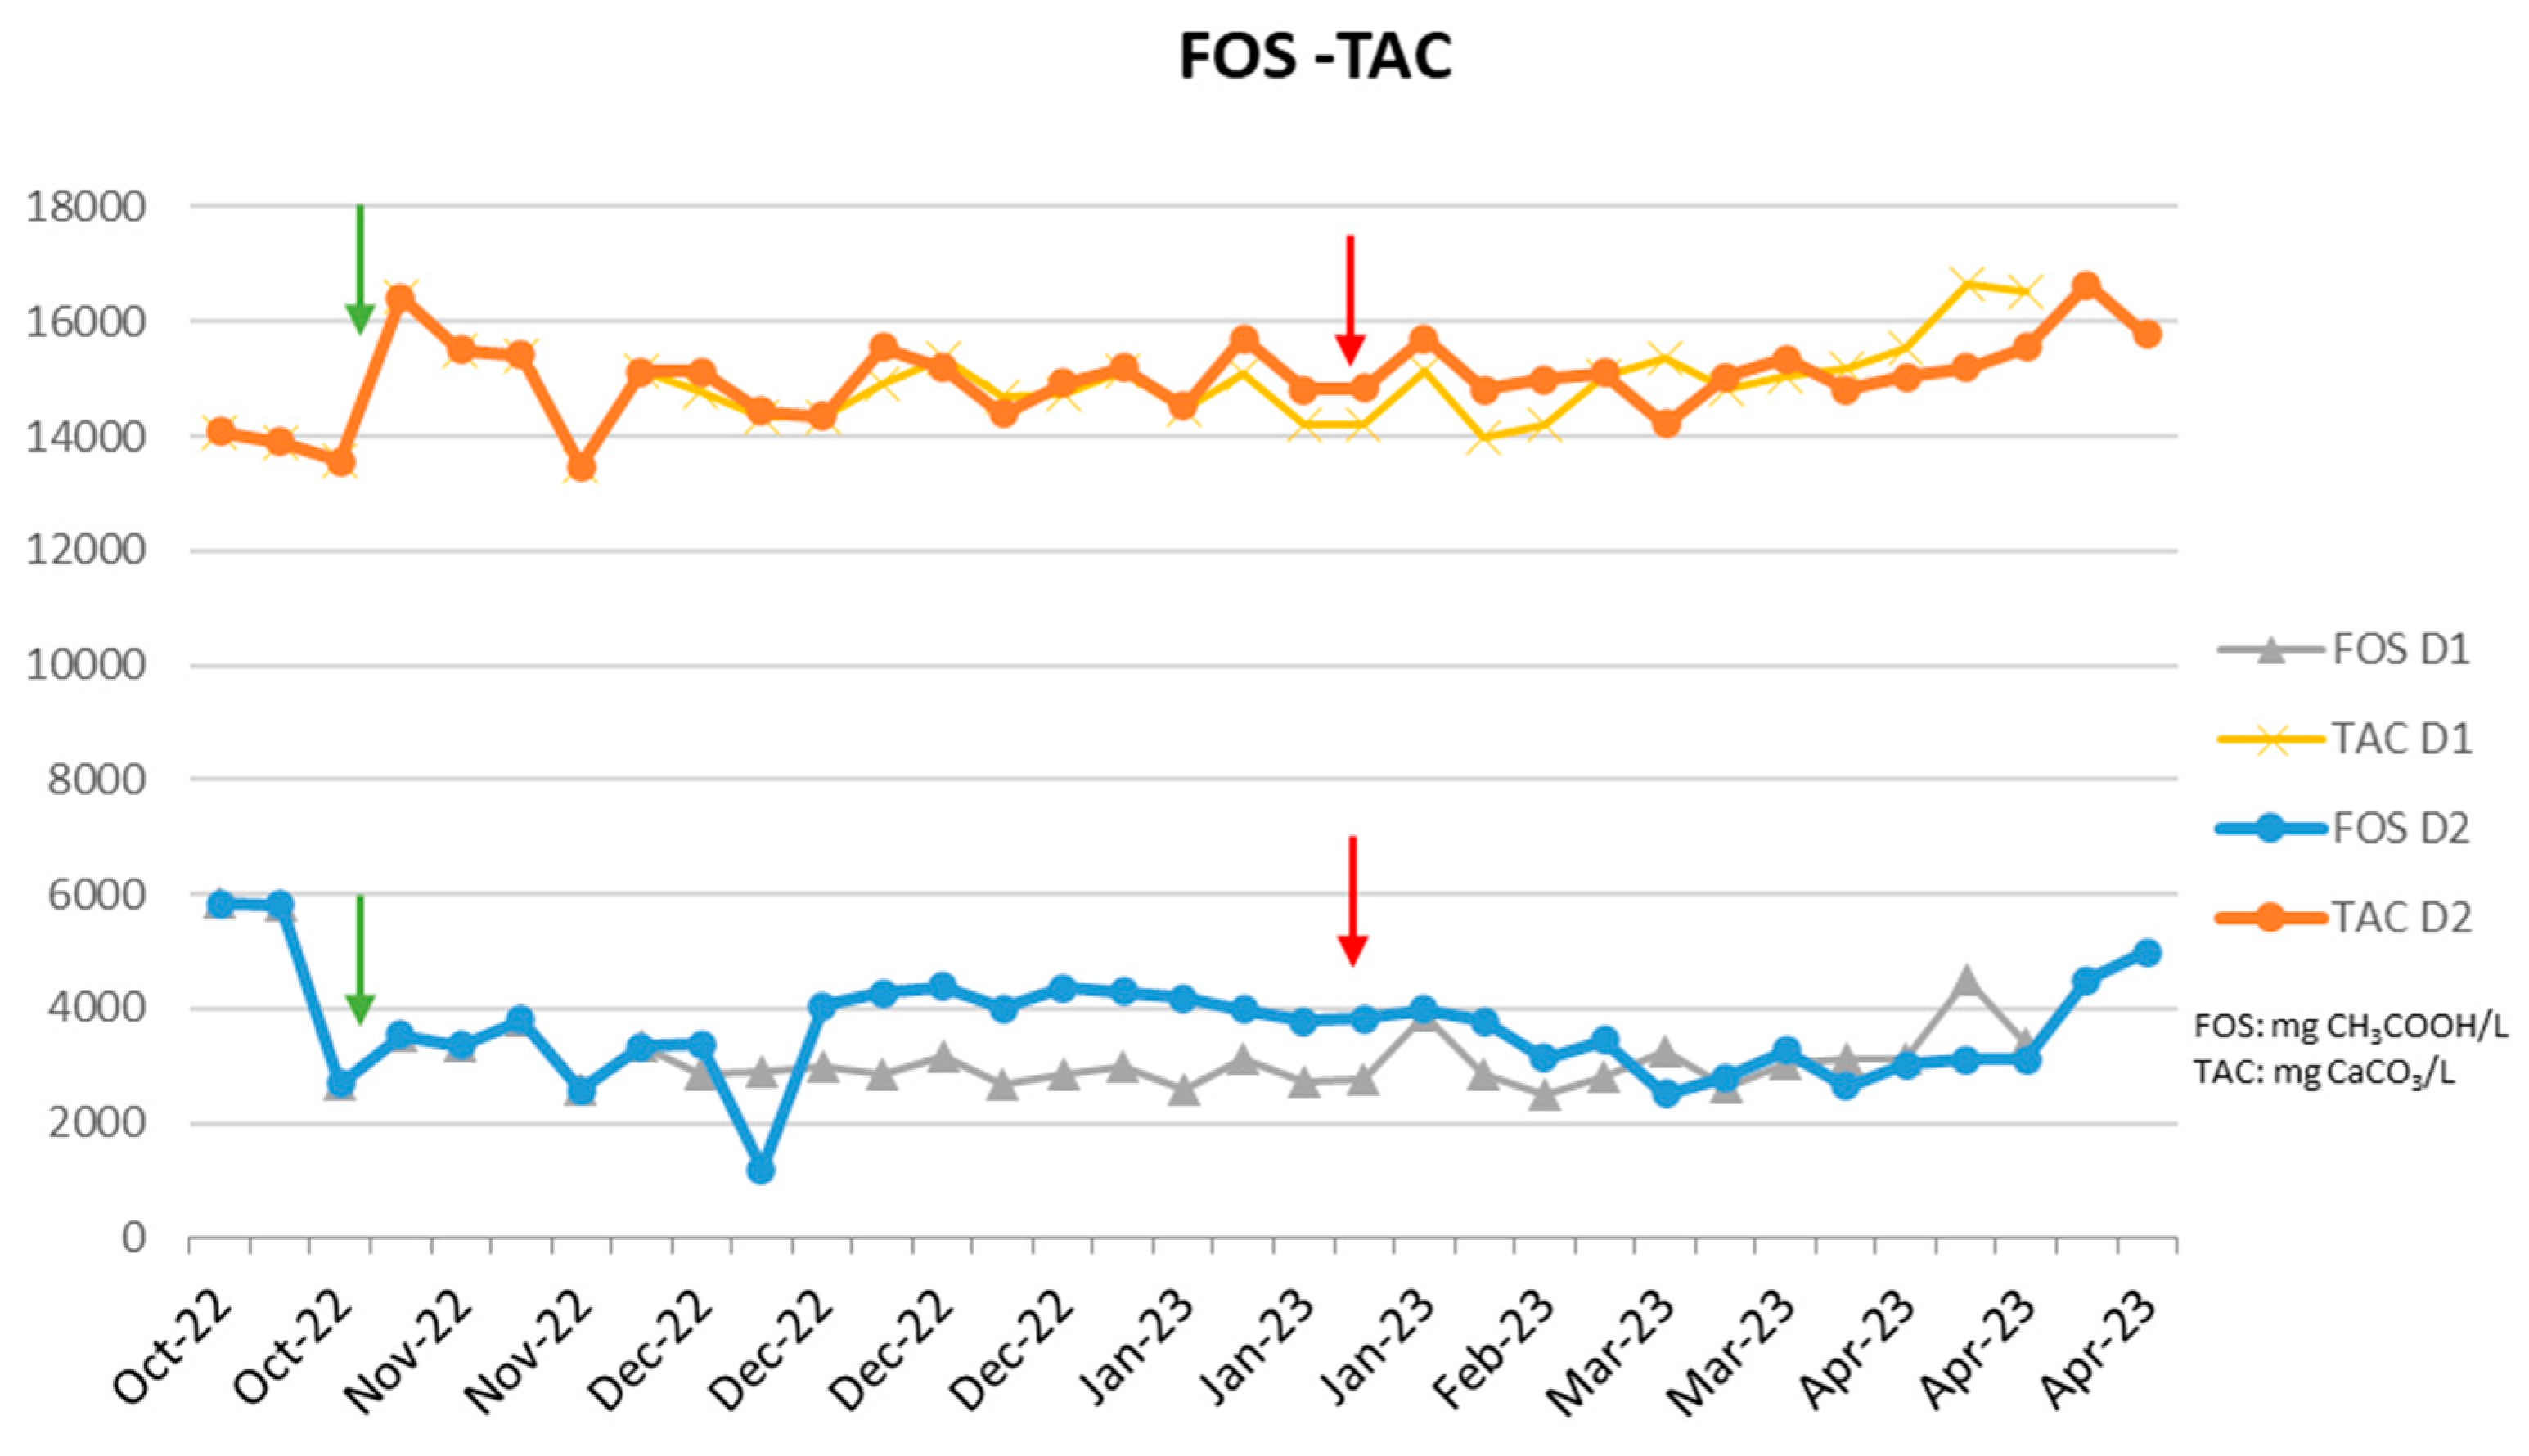
Figure 6), this improvement was not maintained after the addition of the zeolite and the buffer solution. As shown in
Figure 7, the FOS-TAC remained unaffected by the addition of the supplements, and while the increased production of methane during the initial period was seen, this was not maintained, meaning that this reactor was not operating under ammonia toxicity conditions, but another was the reason for the reduced methane production during the initial period (probably the phenols as high amounts of olive mill waste were employed, and therefore this mixture of additives was not able to address the real cause of the problem and therefore the increase in methane production was not maintained and the following days.
These two cases showed that the use of zeolite that adsorbs ammonia and buffers to stabilize the pH contributed to the immediate treatment of ammonia toxicity. Before the use of additives, the problem of the instability of anaerobic degradation should be correctly diagnosed. It's important that the problem to be addressed should first be correctly diagnosed and then the appropriate additives should be used, as the supplements are customized for specific problems and on the individual technical specifications of each biogas plant.
3. Discussion
The performance of a biogas production plant depends on the conditions prevailing inside the bioreactor during anaerobic digestion (AD). The use of additives contributes to the better performance and operation of bioreactors. In this research, issues encountered by three biogas plants (BG01, BG02 and BG03) have been identified and AD supplements were offered to address them. The malfunctions displayed by the plants are mainly due to their seasonal feedstock variation, the temperature prevailing inside the digesters and various operational parameters, such as the frequency of mixing the substrate material. In particular, in plant BG01, high pH and total ammoniacal nitrogen values were observed at the beginning of the recording of the plant’s digester conditions. The use of the buffer solution to reduce the pH value and the addition of zeolite to maintain the values at a constant level resulted in the smooth operation of the digester. Accordingly, the combination of the two additives resulted in the reduction of total ammoniacal nitrogen recorded in the digester.
The phenomenon of high pH values also appeared in plant BG03, where the pH value in both digesters was above 8,2. Additionally, high ammoniacal nitrogen values and accumulation of volatile fatty acids were observed in digester D2. To improve the operation system of the plant’s digesters, a buffer solution and zeolite were used in a quantity and frequency that corresponded to the size and needs of the digesters.
BG02 biogas plant, however, showed deficiencies in trace elements that contribute to its improper functioning. The use of trace elements in the D2 digester, which due to the recirculation of the digested substrate material also affected the microbiome of the D1 digester, helped to restore the trace element concentrations to optimal values. This had a positive impact on AD process instability, which was observed during the period of their shortage, reducing the efficiency rate of the plant.
4. Materials and Methods
Additives used for the treatment of anaerobic digestion destabilization in a biogas plant were zeolite (Quartz Sand, Industrial Minerals, Olympus SA, Thessaloniki, citric acid, phosphoric acid (food grade) and trace elements (Methodo Chemicals, Via A.M. Ampère, 19/21/33, 42017 Novellara (RE) - Italy).
4.1. Determination of Trace Elements
An Agilent 7850 ICP-MS (Agilent Technologies, Santa Clara, CA, USA) equipped with the ORS
4 collision cell was used for the analysis of macro-elements and trace metals. Sampling was performed using an Agilent SPS 4 autosampler. The 7850 ICP-MS was configured with the standard ISIS 3 injection system. The IntelliQuant function in the ICP-MS MassHunter 5.1 software provides the capability of a full mass-spectrum scan with only two seconds additional measurement time, though the samples were quantitated by internal standard seven-point calibration. The samples were prepared for analysis according to the digestion procedure outlined in ISO 17294 Part I & II and APHA 3125 [
14,
15,
16].
The sample is decomposed in acid at a high digestion vessel pressure with the help of a Milestone Ethos Up microwave oven and the resulting solution is analyzed. First, an amount of sample (0.5-1.0 g) was weighed and HNO3 and H2O2 were added to the sample followed by digestion gradually up to 210°C. The sample was then diluted and analyzed by ICP-MS. Its concentration calculation occurs using templates.
4.2. Determination of Moisture
For moisture determination, an amount of sample (1 g) was weighed in a pre-weighed crucible and placed in an oven at 105
oC for 18 hours. The sample was then re-moved from the oven and placed in a desiccator until it returned to ambient temperature and reweighed. The moisture content as a percentage of the sample is calculated as follows:
WI: initial container weight (dry), in grams, WS: weight of the sample amount, in grams and WF: final weight of the container with the dry sample, in grams.
4.3. Determination of Ash
For the determination of ash, an amount of sample (2 g) was weighed in a pre-weighed crucible and placed in a furnace at 550
oC for 3 hours. The sample was then removed from the furnace and placed in a desiccator until it returned to ambient temperature and reweighed. The crude ash content as a percentage of the sample is calculated as follows:
WI: initial container weight (dry), in grams, WS: weight of the sample amount, in grams and WF: final weight of the container with ash, in grams.
4.4. Determination of Total Ammoniacal Nitrogen (TAN) Concentration by Nessler Method
The determination of total ammoniacal nitrogen (TAN) concentration was held using a Vapodest (Vapodest 40s Gerhardt, S.N. 7340130001) for steam distillation of and receival of ammonia in aqueous solution, based on a modified method according to A.P.H.A. The digester sample bottle was sufficiently stirred on a magnetic stirrer. A sample weighing 5 g (with an accuracy of ± 0.05 g) was taken and weighed in a 50 mL falcon tube and 45 mL of deionized water was added. Another identical falcon tube was prepared to balance the centrifuge. Centrifugation was applied at 6000 rpm for 20 mins.
The samples were removed from the centrifuge, and a volume of 5 mL of the supernatant was extracted from them (without shaking) and brought up to the required volume in a 250 mL volumetric flask with deionized water. The flask was then vigorously shaken and a volume of 5 mL was transferred to a 25 mL volumetric flask with deionized water. Then, 3 drops of Mineral Stabilizer were added, 3 drops of Polyvinyl Alcohol Dispersing Agent followed by agitation, and finally 1 mL of Nessler Reagent. The sample was left to rest for 15 min.
Using 10 mm optical path cells, the concentration of NH
4+ was determined photometrically in the JASCO V-630 Spectrophotometer after 15 minutes. The range of the measurement is 0.1 mg/L to 2 mg/L. The Nitrogen (Ammoniacal) APHA 4500-NH3 B & C method was used to base the measurement (APHA, 2017).
: Concentration of ammonium nitrogen (ppm), : Concentration of ammonia (ppm), : Dilution factor (sample weight corrected), and : Absorbance concentration at 420nm (nm).
4.5. Determination of FOS/TAC Ratio
The FOS/TAC ratio is an indicator for assessing fermentation processes. The TAC value is an estimation of the total inorganic carbon while the ratio corresponds to the alkalinity buffer capacity of the sample and the FOS value corresponds to the volatile fatty acids content. It is calculated empirically according to the Nordmann method. A sample of 5 mL of fermentation substrate is titrated by 0.1 N of sulfuric acid solution (H
2SO
4) up to pH 5.0 to calculate the TAC value, expressed in mg/L of calcium carbonate (CaCO
3). Then the FOS value is obtained after a second titration step between pH 5.0 and pH 4.4. It is expressed in mg/L of acetic acid (CH
3COOH) [
13].
4.6. Determination of Volatile Fatty Acids (VFAs)
The Eppendorf minispin table centrifuge is used to centrifuge a 1.5 ml sample in a 2 ml Eppendorf tube for 10 minutes at 12.000 rpm. In order to have the VFAs (acetate, propionate, butyrate, iso-butyrate, valerate, and iso-valerate) in their acidic form and saturate the basic sites on the analytical column, the sample is acidified with 100 μL ortho-phosphoric acid to pH 2 prior to centrifugation. 100 μL of the injection standard and 1 mL are added to the GC vial. A flame-ionization-detector (FID)-equipped GC Shimadzu GC - 2010 Plus High-End gas chromatography system is used to inject the liquid phase. The column used was an Altmann Anaytik AS-FFAP EXT, 30m × 0.25mm x 0.25μm. Helium (grade 99.999%) was used as a carrier gas at a flow rate of 1.9 mL/min. The injection volume was 1 μL with a split ratio of 1:10 and the injector temperature at 250 oC. The detector temperature was set at 250 oC. The temperature program employed was: initial oven temperature at 100 °C (hold time: 2 min), increasing at 10 °C/min to 220 °C (hold time: 0 min), then in the last step at 30 °C/min to 240 °C (hold time: 12 min). The total run time was: 27 min. The VFA concentration is determined by a linear calibration curve obtained by calibration standards and adjusted by the injection standard.
Author Contributions
Conceptualization, T.S.; methodology, T.S., E.A.E and I.D.; validation, T.S. and E.A.E.; formal analysis, E.A.E.; investigation, G.D. and N.P.; resources, T.S.; data curation, N.P.; writing—original draft preparation, E.A.E., G.D. and T.S.; writing—review and editing, T.S.; visualization, E.A.E.; supervision, T.S.; project administration, T.S.; funding acquisition, T.S. All authors have read and agreed to the published version of the manuscript.
Funding
This research was co-funded by the European Regional Development Fund of the European Union and Greek national funds through the Operational Program Competitiveness, Entre-preneurship and Innovation, under the call RESEARCH—CREATE—INNOVATE (project code: T2EDK-00359).
Data Availability Statement
The data presented in this study are available upon request from the corresponding author.
Acknowledgments
The authors wish to acknowledge Professor Thomas A. Kotsopoulos and Christos A. Tzenos from the Department of Hydraulics, Soil Science and Agricultural Engineering, AUTh, whose input was greatly appreciated. Finally, the authors acknowledge all staff members of Qlab P.C. for their individual roles that contributed to the implementation of this study.
Conflicts of Interest
The authors declare that they have no known competing financial interests or personal relationships that could have appeared to influence the work reported in this paper.
References
- Liu, Minrui, Yaqin Wei, and Xiaoyun Leng. "Improving biogas production using additives in anaerobic digestion: A review." Journal of Cleaner Production 2021, 297, 126666.
- Paritosh, Kunwar, et al. "Additives as a support structure for specific biochemical activity boosts in anaerobic digestion: a review." Frontiers in Energy Research 2020, 8, 88.
- Fugol, Małgorzata, et al. "Improving the energetic efficiency of biogas plants using enzymatic additives to anaerobic digestion." Energies 16.2023, 4, 1845.
- Kelleher, B. P., et al. "Advances in poultry litter disposal technology–a review." Bioresource technology 83.2002, 1, 27-36.
- Clifford, C. B. "EGEE 439: Alternative fuels from Biomass sources." Lesson 7.2. Energy Institute, The Pennsylvania State University (2021).
- Tang, Ke, et al. "Ammonia detoxification promotes CD8+ T cell memory development by urea and citrulline cycles." Nature Immunology 2023, 24, 162-173.).
- Christou, M. L., et al. "Ammonia-induced inhibition of manure-based continuous biomethanation process under different organic loading rates and associated microbial community dynamics." Bioresource technology 2021, 320, 124323.
- Zheng, Hang, Raymond J. Zeng, and Irini Angelidaki. "Biohydrogen production from glucose in upflow biofilm reactors with plastic carriers under extreme thermophilic conditions (70 C)." Biotechnology and bioengineering 2008, 100, 1034-1038.
- Rezaee, Ramin, et al. "Cardioprotective effects of hesperidin on carbon monoxide poisoned in rats." Drug and Chemical Toxicology 2021, 44, 668-673.).
- Li, Xuemei, et al. "Performance of zeolite and trace elements on biogas production from alkaline hydrogen peroxide pretreated sweet sorghum bagasse slurry." (2023)., Ciezkowska, Martyna, et al. "Effect of clinoptilolite and halloysite addition on biogas production and microbial community structure during anaerobic digestion." Materials 2020, 13, 4127.
- Li, Xuemei, et al. "Performance of zeolite and trace elements on biogas production from alkaline hydrogen peroxide pretreated sweet sorghum bagasse slurry." (2023)., Ciezkowska, Martyna, et al. "Effect of clinoptilolite and halloysite addition on biogas production and microbial community structure during anaerobic digestion." Materials 2020, 13, 4127.
- Wang, Hanxi, et al. "Anaerobic digestion technology for methane production using deer manure under different experimental conditions." Energies 2019, 12, 1819.
- Determination of FOS/TAC Value in Biogas Reactors, Based on the Nordmann method.
- ISO 17294-1:2004 Water quality — Application of inductively coupled plasma mass spectrometry (ICP-MS) — Part 1: General guidelines. 2004; Available from: https://www.iso.org/standard/32957.html.
- ISO 17294-2:2016 Water quality — Application of inductively coupled plasma mass spectrometry (ICP-MS) — Part 2: Determination of selected elements including uranium isotopes [Internet]. 2016. Available from: https://www.iso.org/standard/62962.html.
- Lipps WC BTBHE. 3125 Metals by Inductively Coupled Plasma-Mass Spectrometry. In: Standard Methods For the Examination of Water and Wastewater [Internet]. American Public Health Association; 2018. (Standard Methods for the Examination of Water and Wastewater). Available from. [CrossRef]
|
Disclaimer/Publisher’s Note: The statements, opinions and data contained in all publications are solely those of the individual author(s) and contributor(s) and not of MDPI and/or the editor(s). MDPI and/or the editor(s) disclaim responsibility for any injury to people or property resulting from any ideas, methods, instructions or products referred to in the content. |
© 2024 by the authors. Licensee MDPI, Basel, Switzerland. This article is an open access article distributed under the terms and conditions of the Creative Commons Attribution (CC BY) license (https://creativecommons.org/licenses/by/4.0/).
