Submitted:
31 May 2023
Posted:
01 June 2023
You are already at the latest version
Abstract
Keywords:
1. Introduction
2. Materials and Methods
Statistic alanalyses
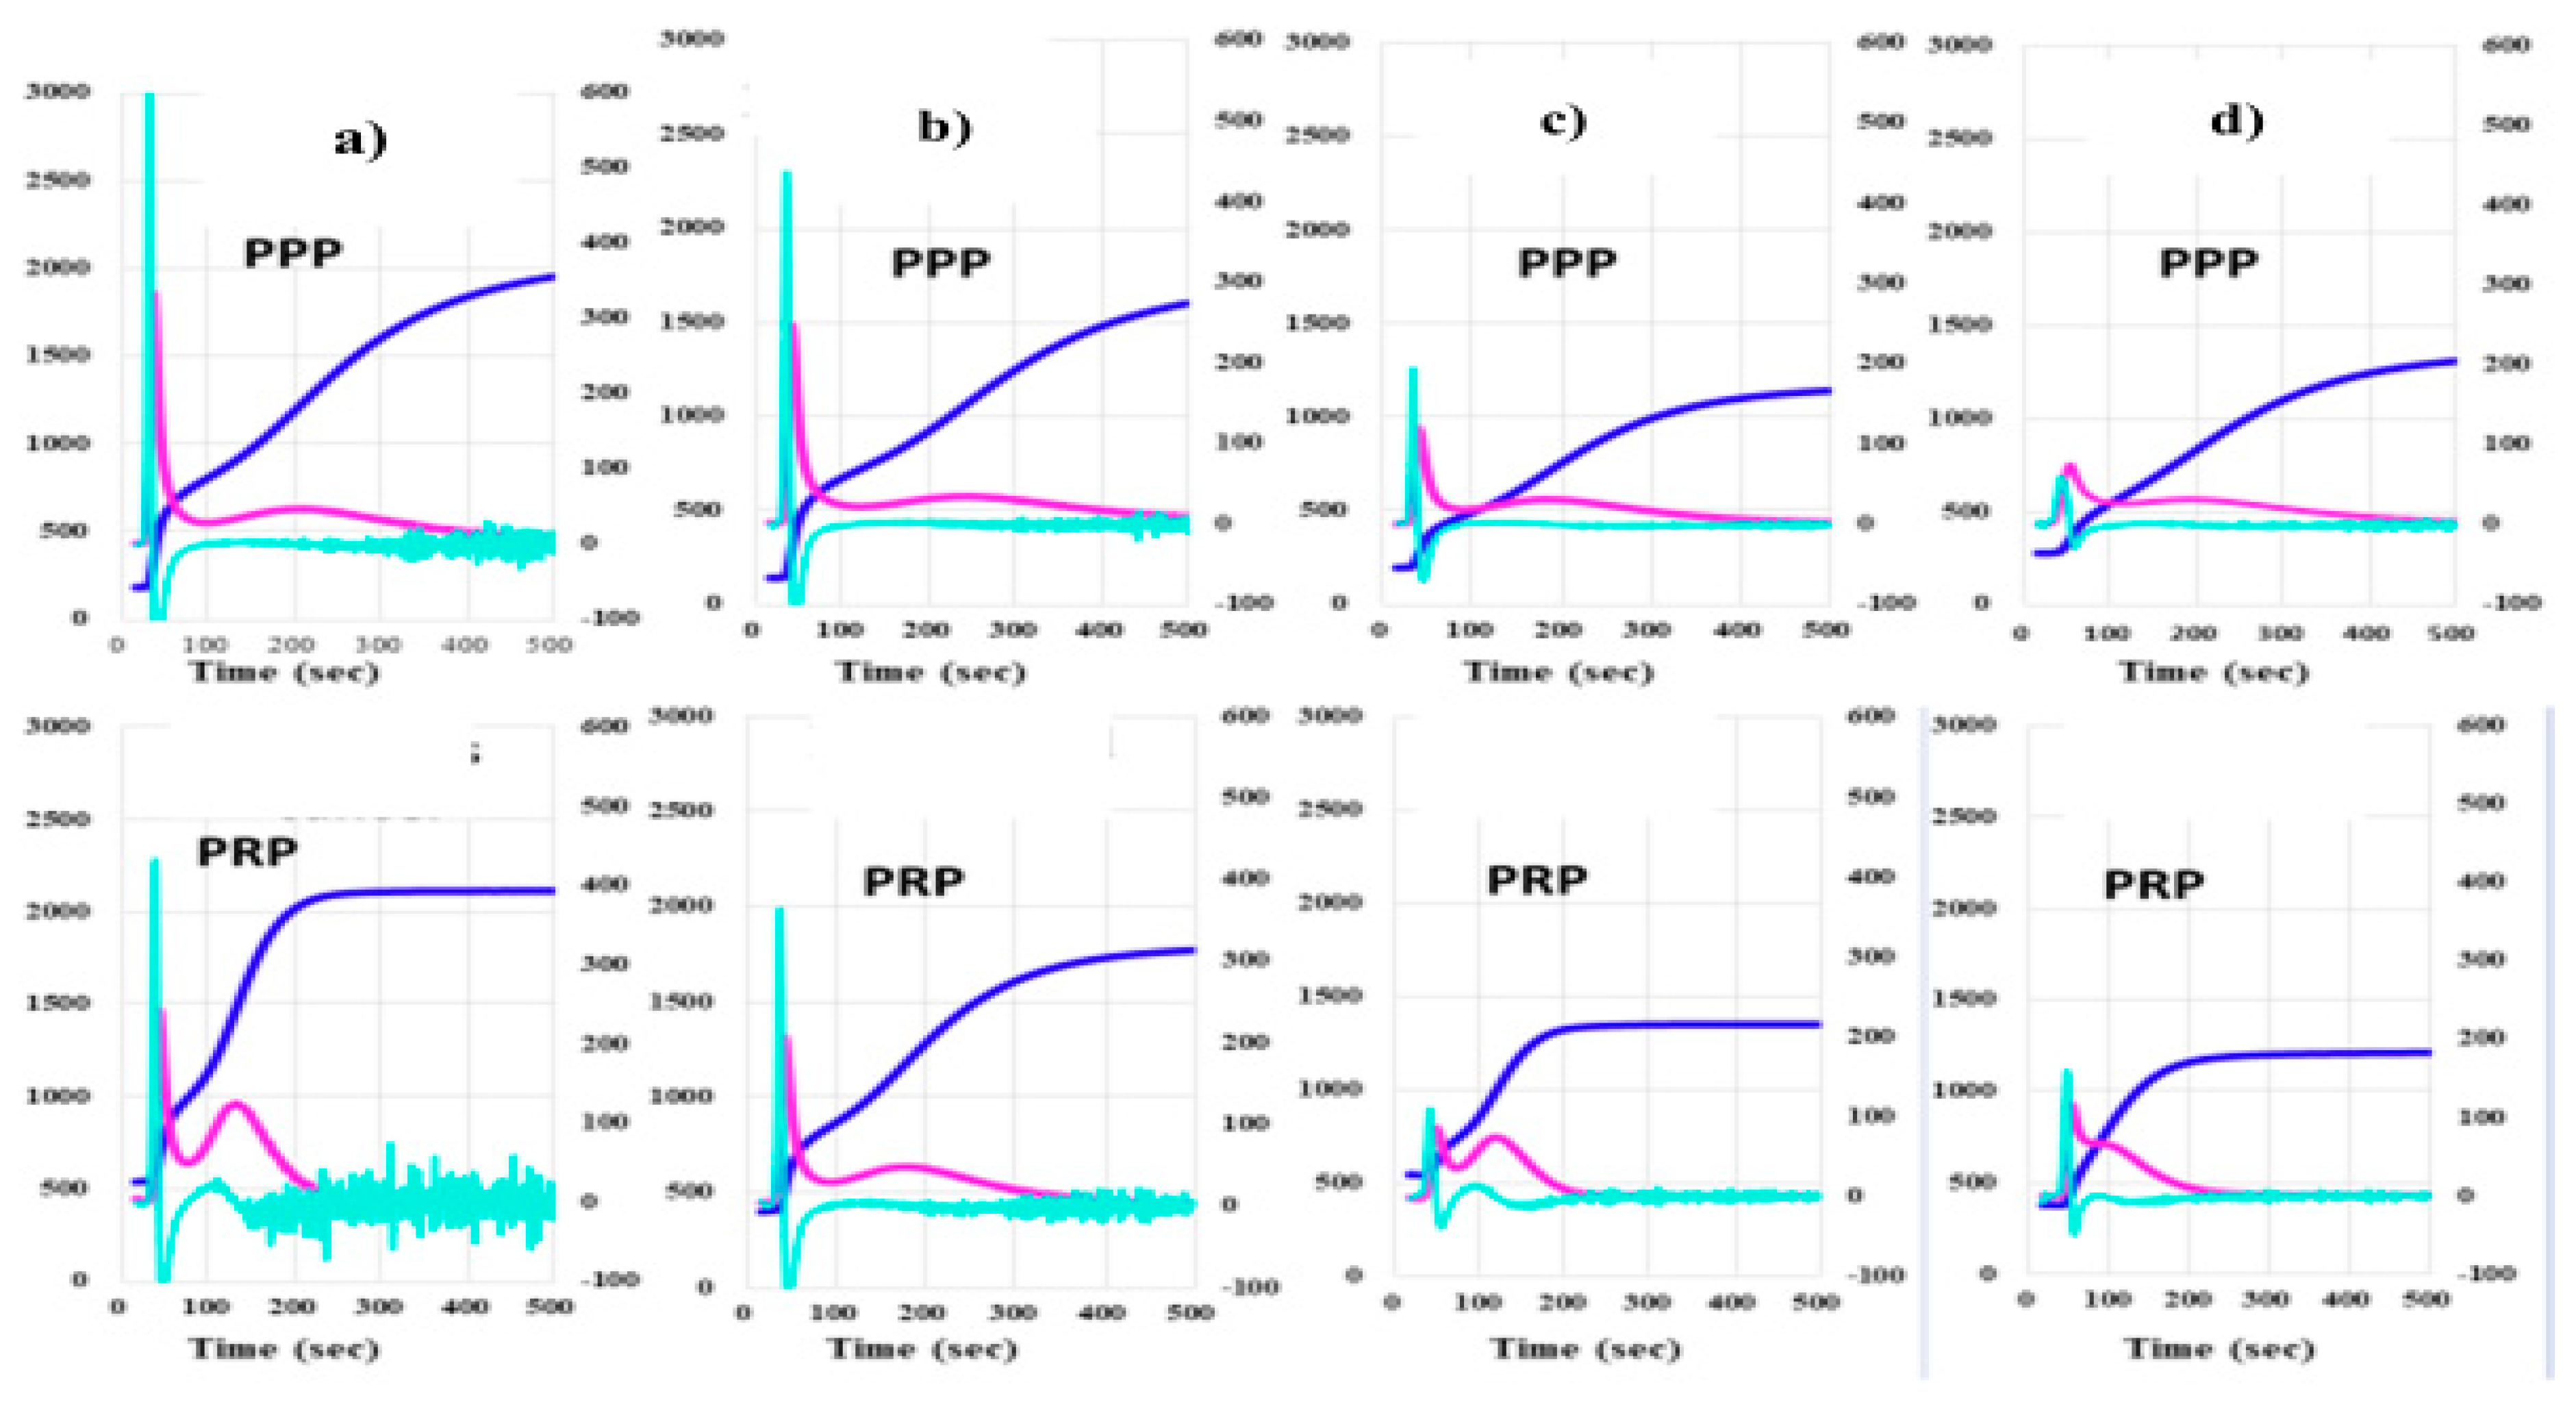
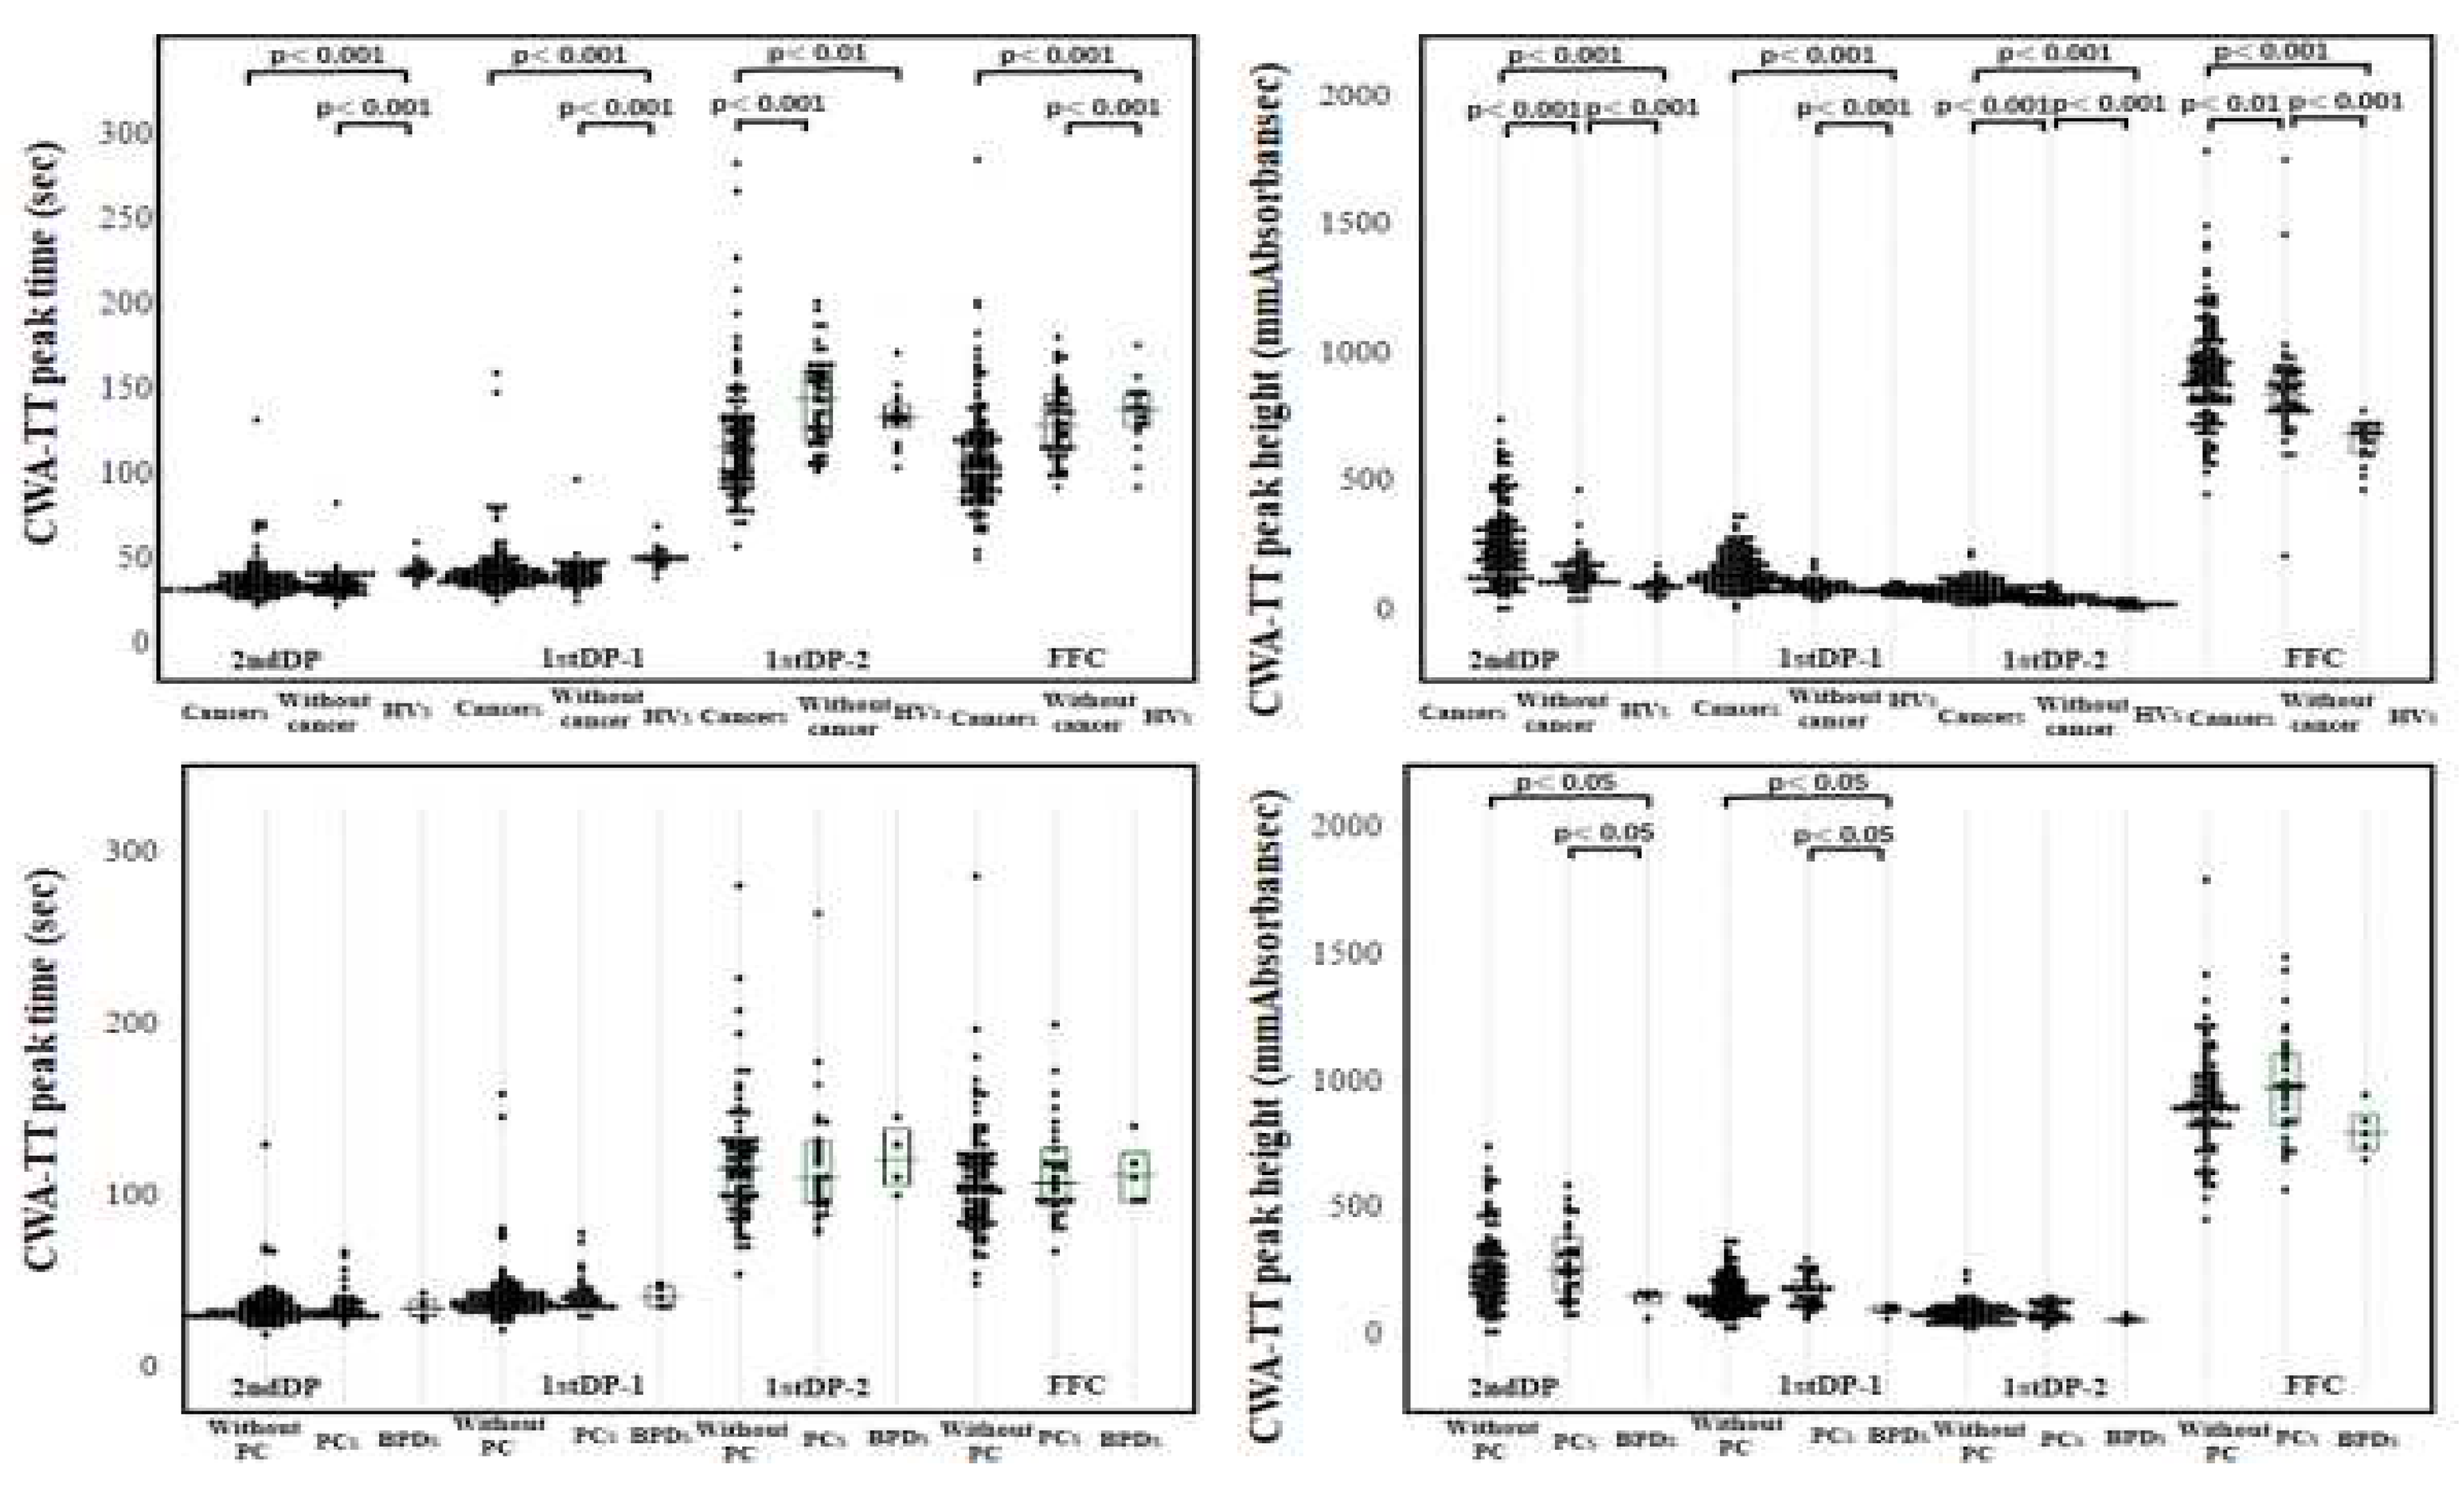
3. Results
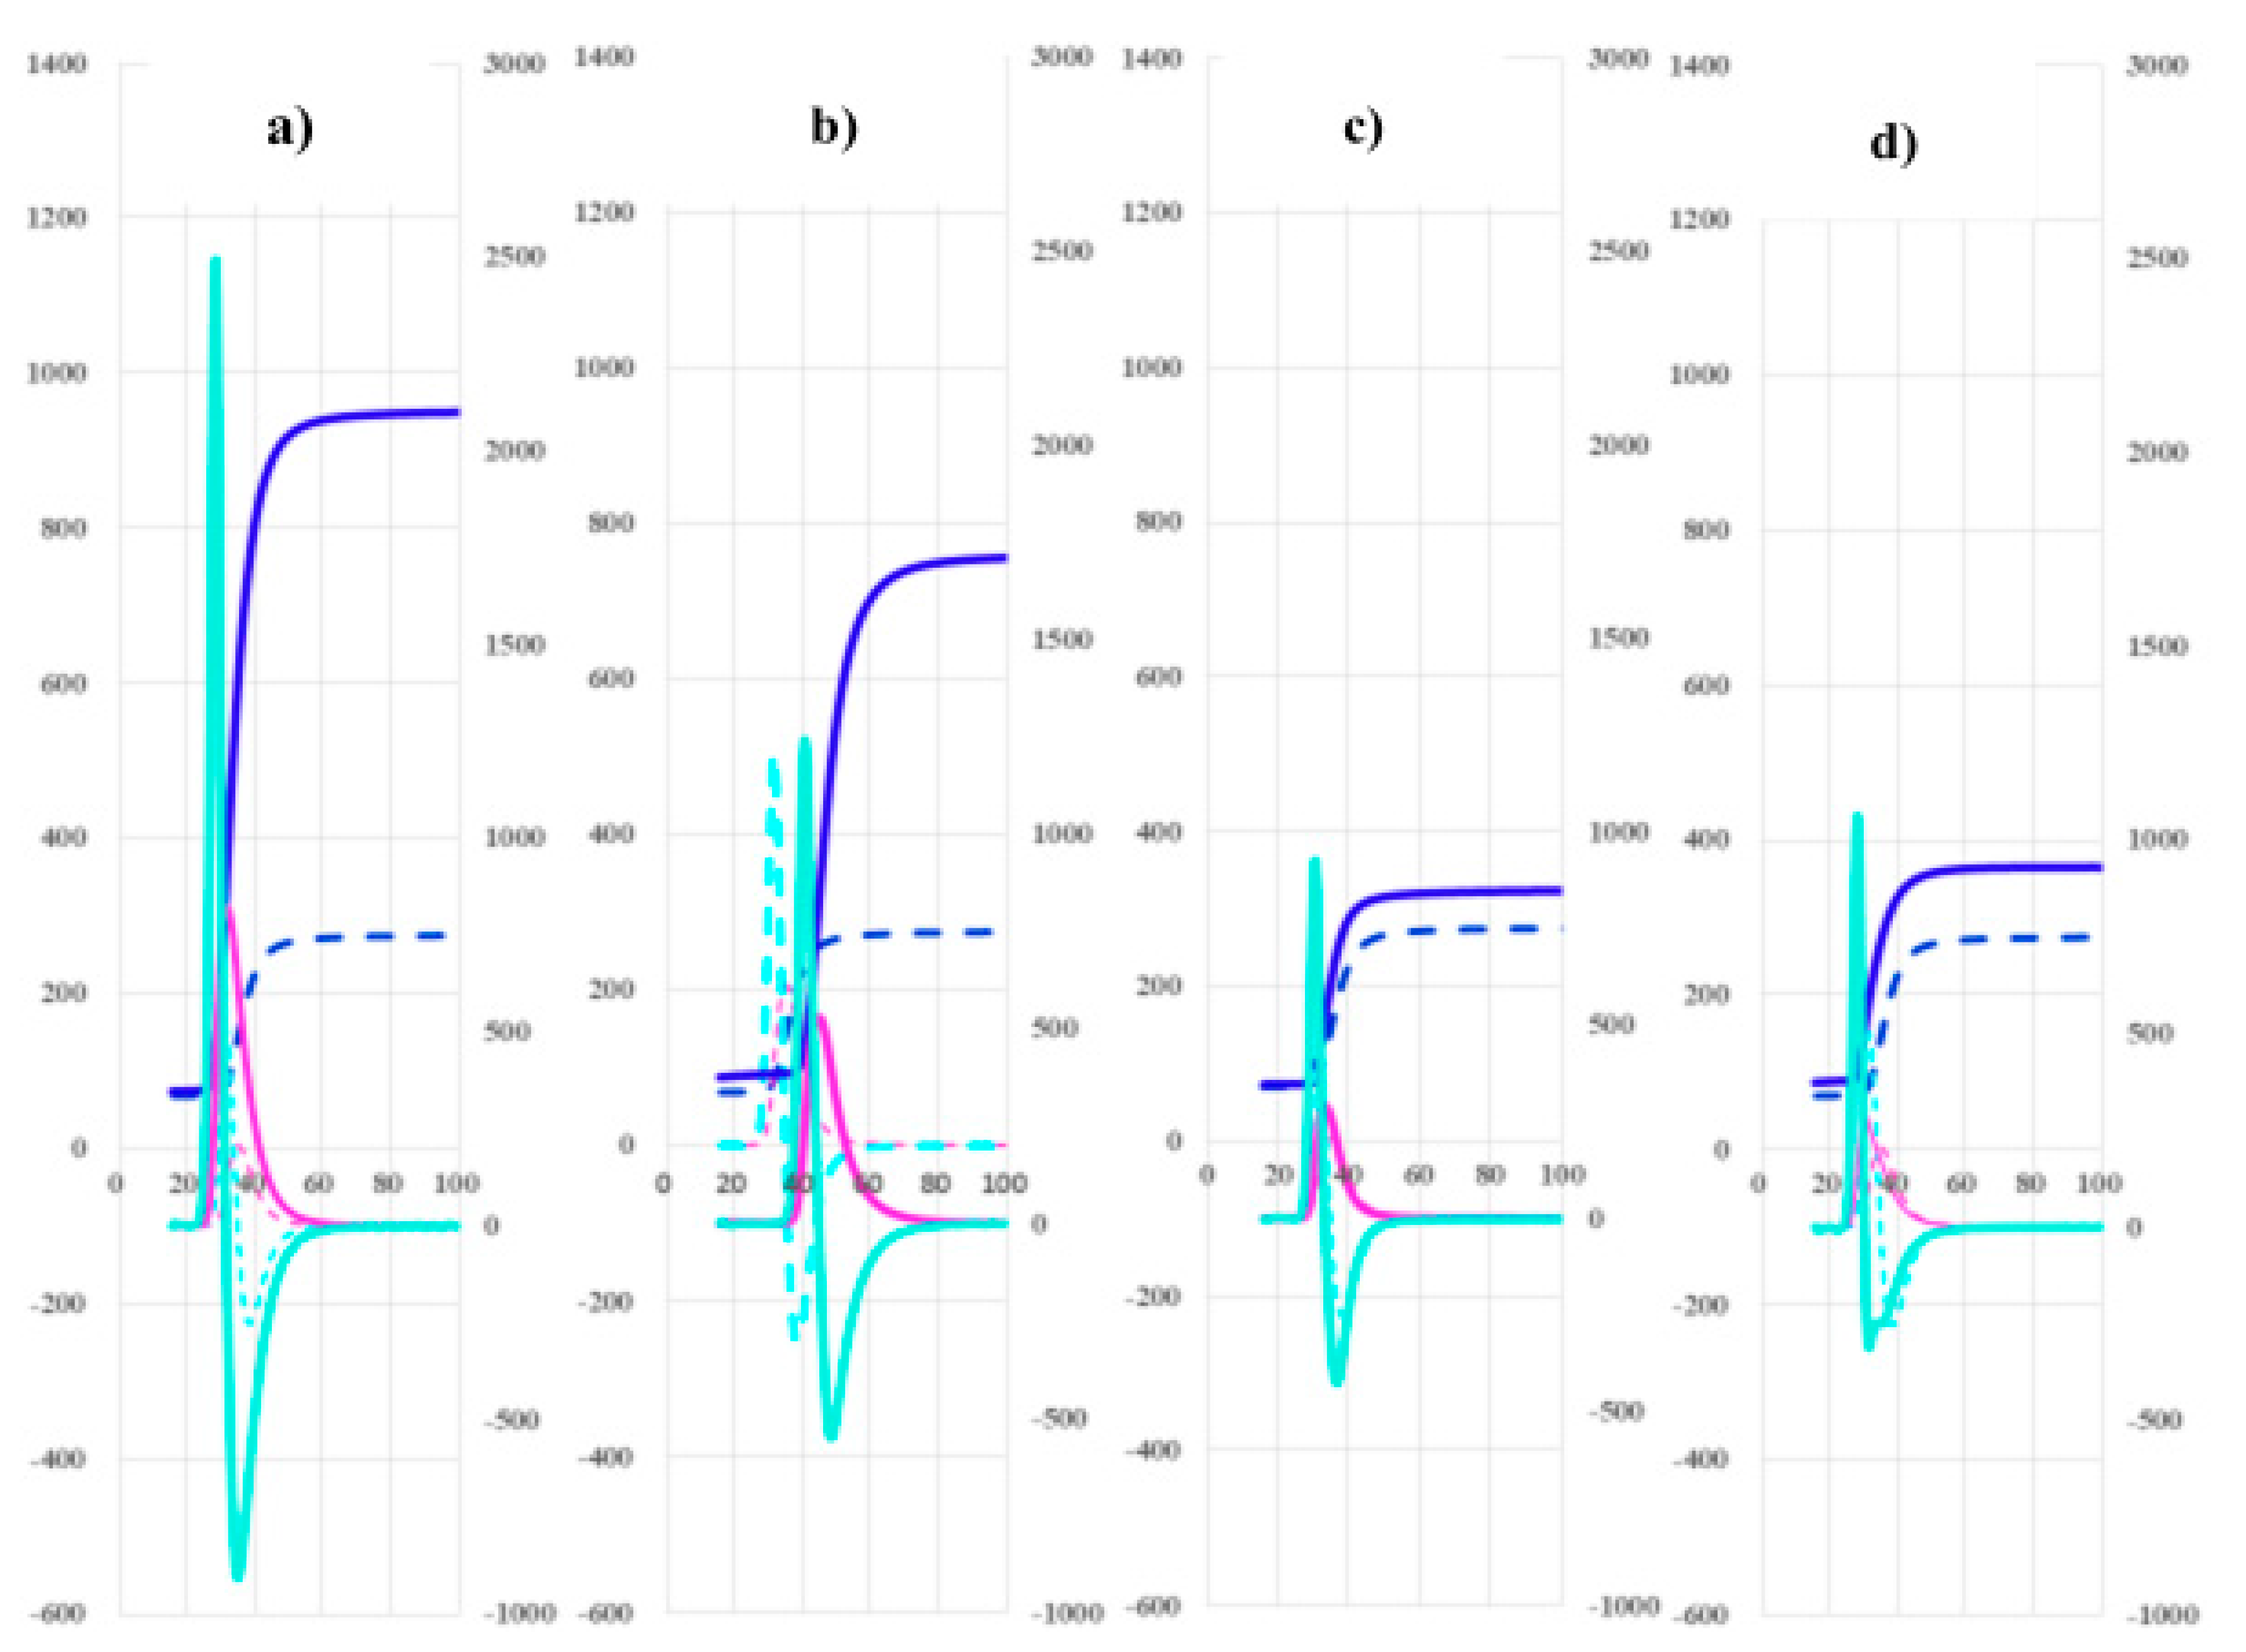
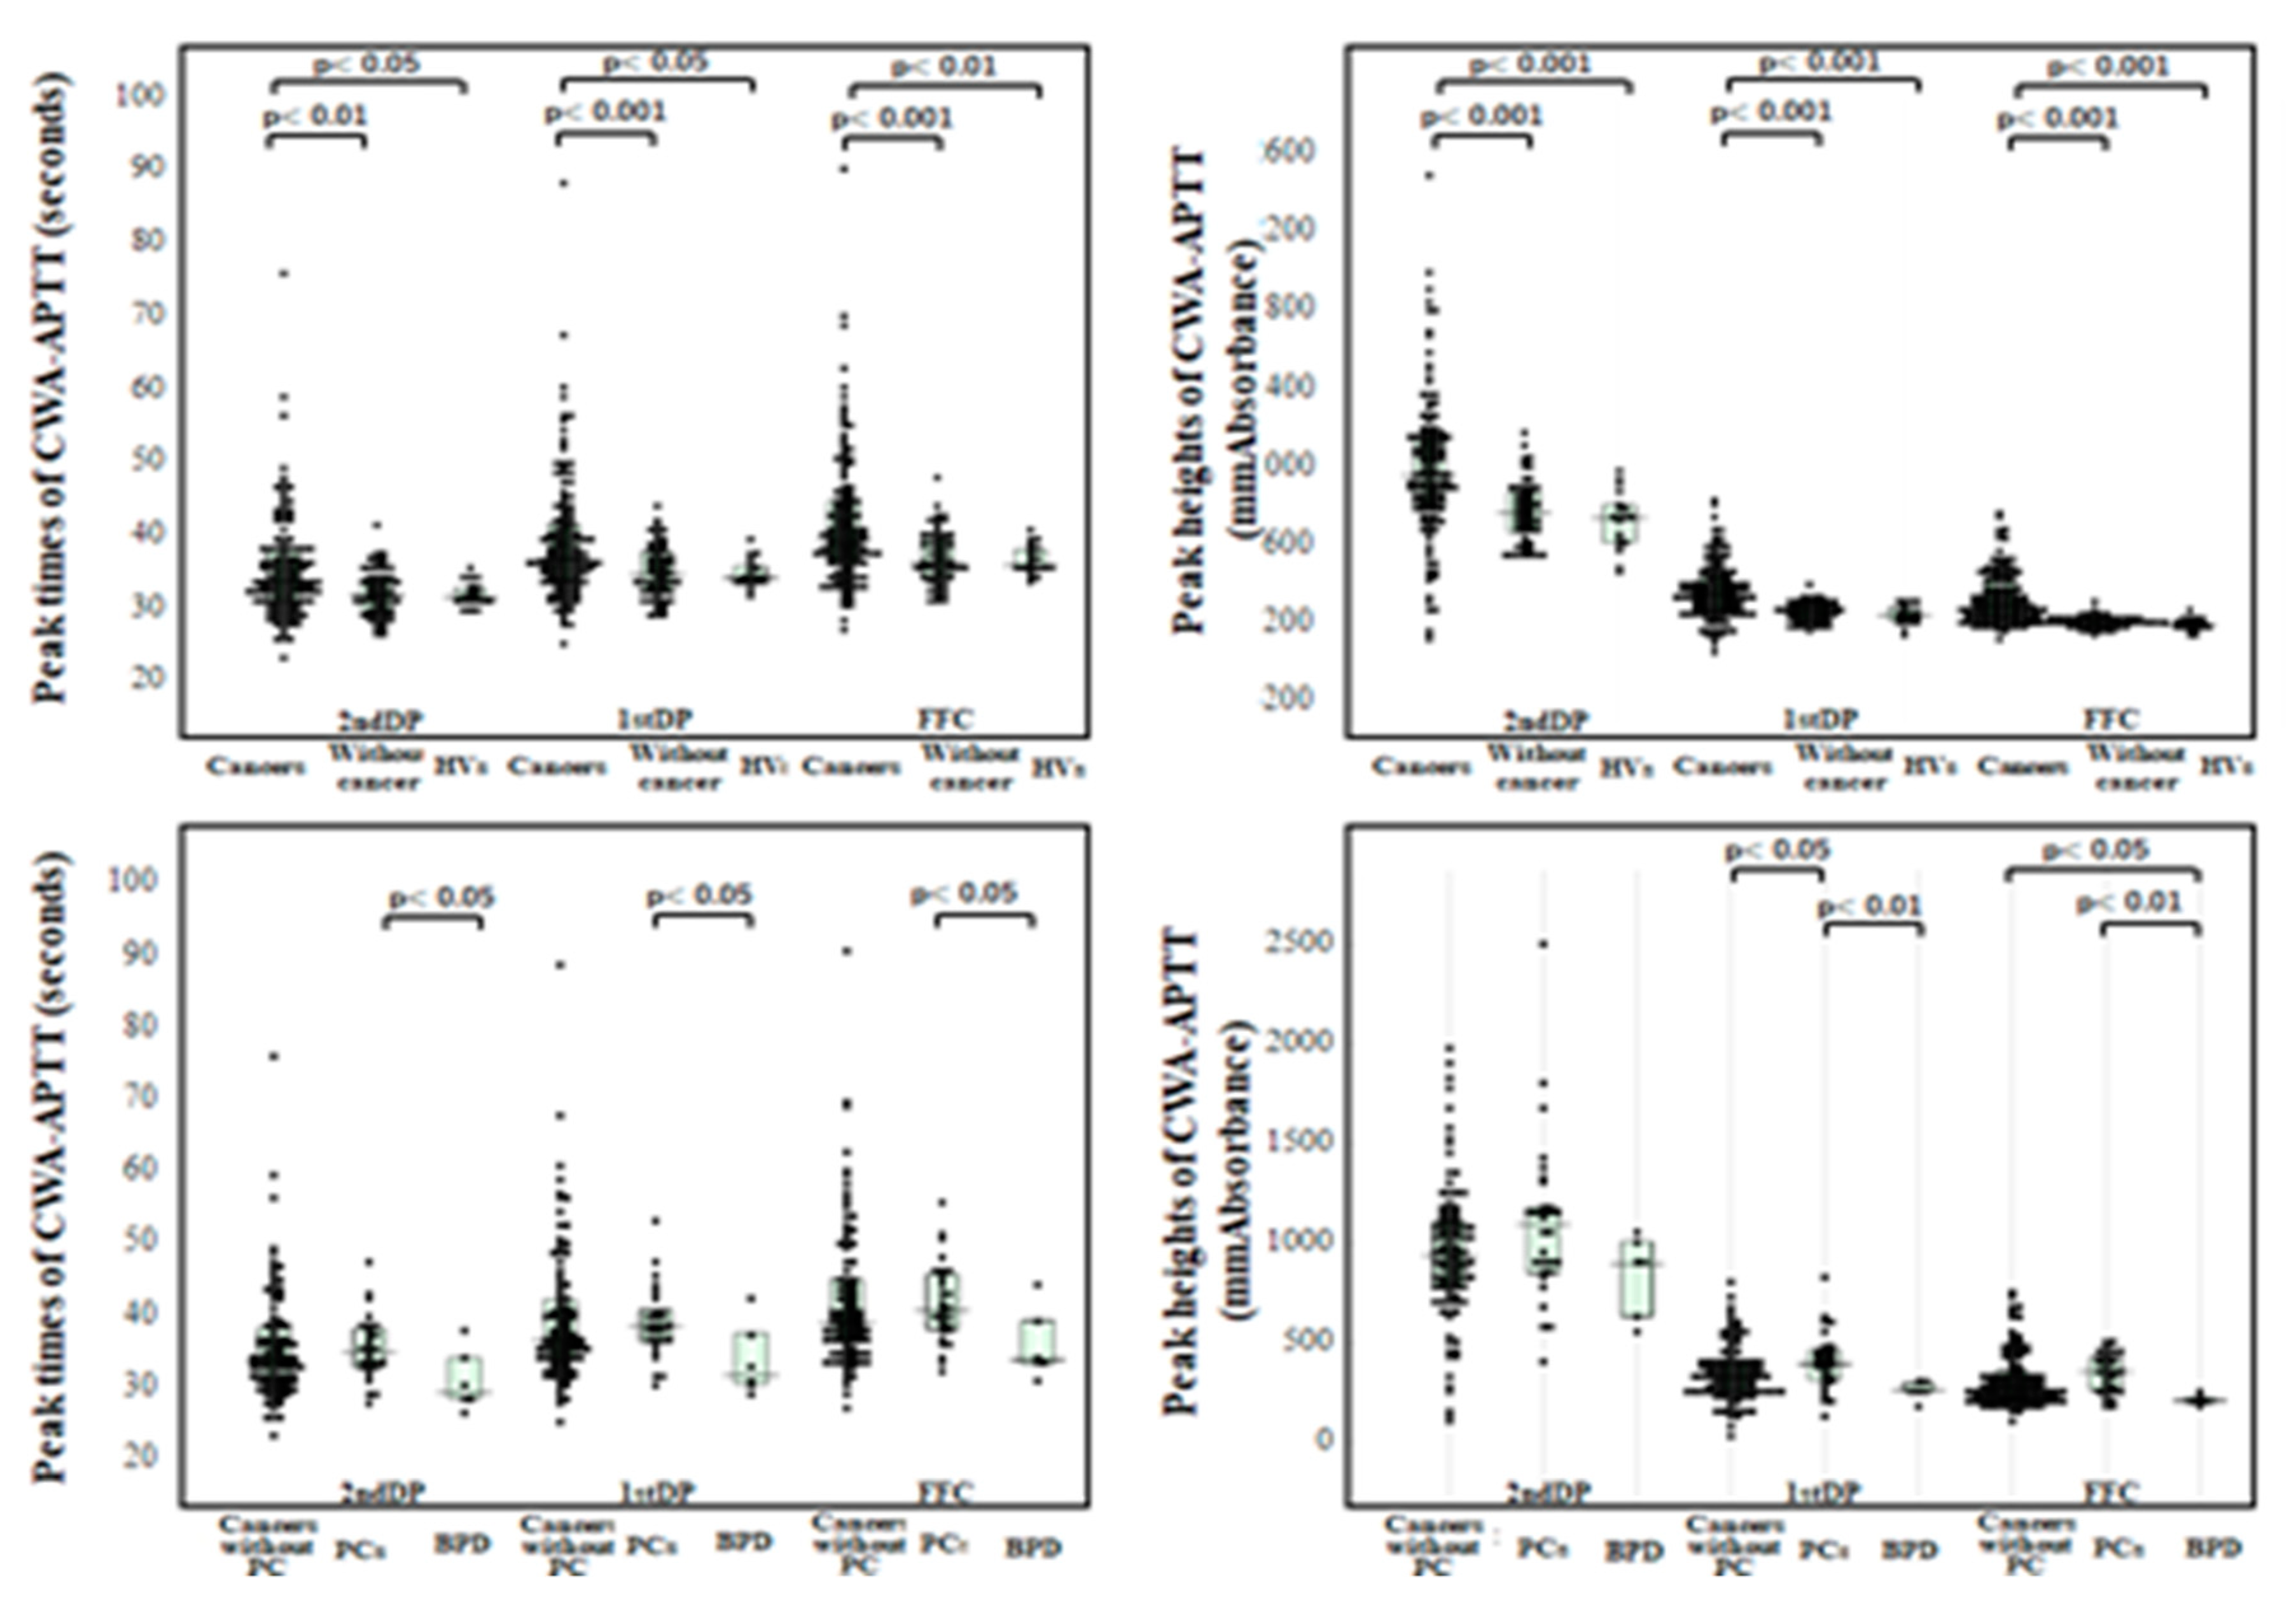
| Cancers | Without cancer | PCs | Without PC | BPDs | HVs | |
| 2nd DPT (sec) |
33.9 (31.1-38.1) |
31.9 (29.7-34.4) |
34.8 (32.6-38.0) |
33.6 (30.8-38.1) |
29.1 (28.3-33.9) |
31.7 (31.1-32.9) |
| 2nd DPH (mmAbsorbance) |
953 (792-1143) |
761 (661-866) |
1094 (850-1181) |
940 (786-1110) |
898 (633-1007) |
734 (609-800) |
| 1st DPT (sec) |
36.9 (34.0-41.7) |
34.8 (32.5-37.8) |
38.4 (36.2-40.6) |
36.5 (33.6-42.0) |
31.5 (30.3-37.4) |
34.3 (33.8-35.9) |
| 1st DPH (mmAbsorbance) |
345 (258-434) |
255 (212-292) |
353 (264-436) |
331 (257-406) |
325 (263-459) |
235 (209-270) |
| FFC (sec) |
39.5 (36.4-44.8) |
36.4 (34.5-39.7) |
38.9 (36.1-44.8) |
40.6 (37.9-45.6) |
33.7 (33.0-39.1) |
36.0 (35.6-38.2) |
| FFH (mmAbsorbance) |
285 (225-411) |
201 (185-220) |
355 (263-426) |
274 (221-361) |
211 (202-225) |
187 (170-206) |
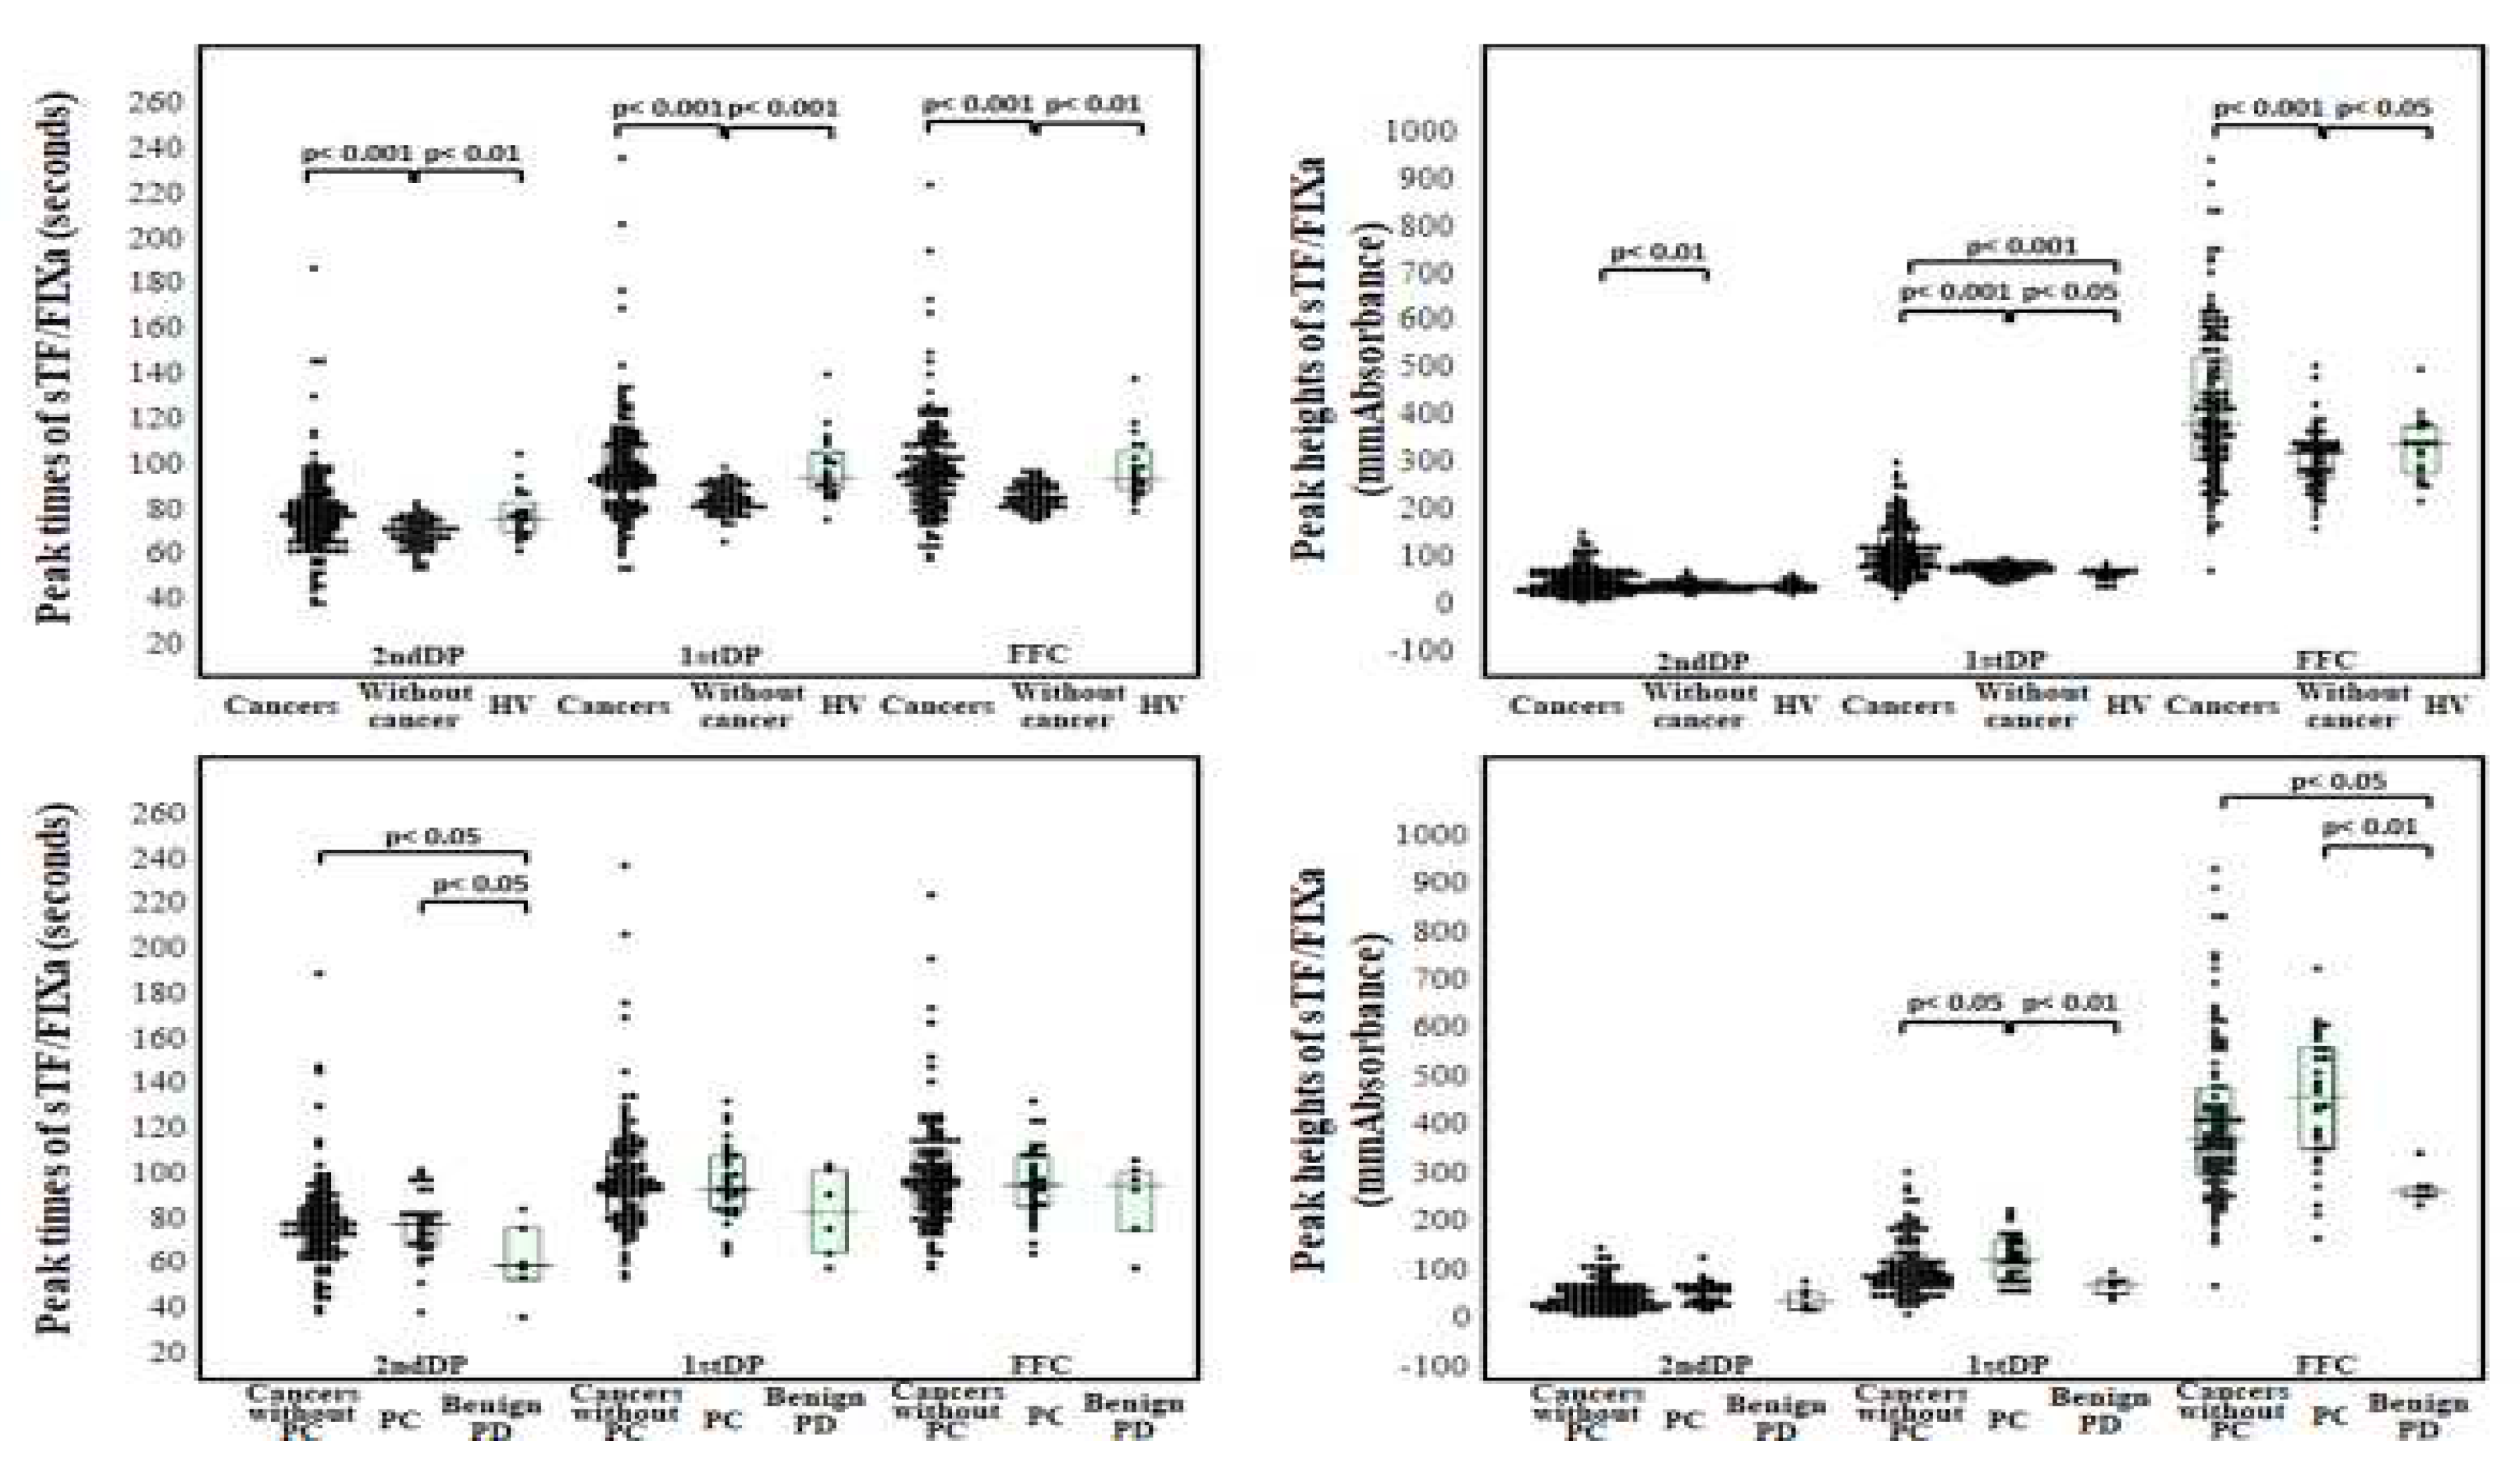
| Cancers | Without cancer | PCs | Without PC | BPDs | HVs | |
| 2ndDPT (sec) |
78.3 (67.5-87.0) |
70.2 (66.1-75.4) |
78.1 (68.9-83.6) |
78.3 (67.1-86.9) |
59.7 (53.5-76.8) |
76.9 (70.1-84.0) |
| 2ndDPH (mmAbsorbance) |
47.1 (29.4-68.2) |
36.9 (31.5-43.1) |
61.5 (36.3-70.3) |
44.8 (28.3-67.5) |
40.3 (22.7-58.8) |
37.4 (31.0-48.1) |
| 1stDPT (sec) |
95.9 (84.0-110.3) |
85.0 (81.2-90.9) |
93.8 (84.5-108.7) |
96.0 (82.8-110.7) |
83.6 (65.5-102.3) |
95.3 (89.8-106.4) |
| 1stDPH (mmAbsorbance) |
104 (74.9-155) |
75.6 (65.8-83.7) |
127 (84.8—165.0) |
96.1 (72.1-139.6) |
74.7 (55.5-84.7) |
67.8 (58.2-74.5) |
| FFC (sec) |
97.2 (86.0-110.4) |
86.2 (82.2-91.6) |
95.7 (86.1-109.1) |
97.4 (84.8-111.2) |
95.4 (75.2-101.4) |
94.6 (89.4-106.9) |
| FFH (mmAbsorbance) | 384 (306-526) |
324 (267-344) |
463 (354-565) |
374 (301-482) |
268 (256-275) |
341 (278-378) |
4. Discussion
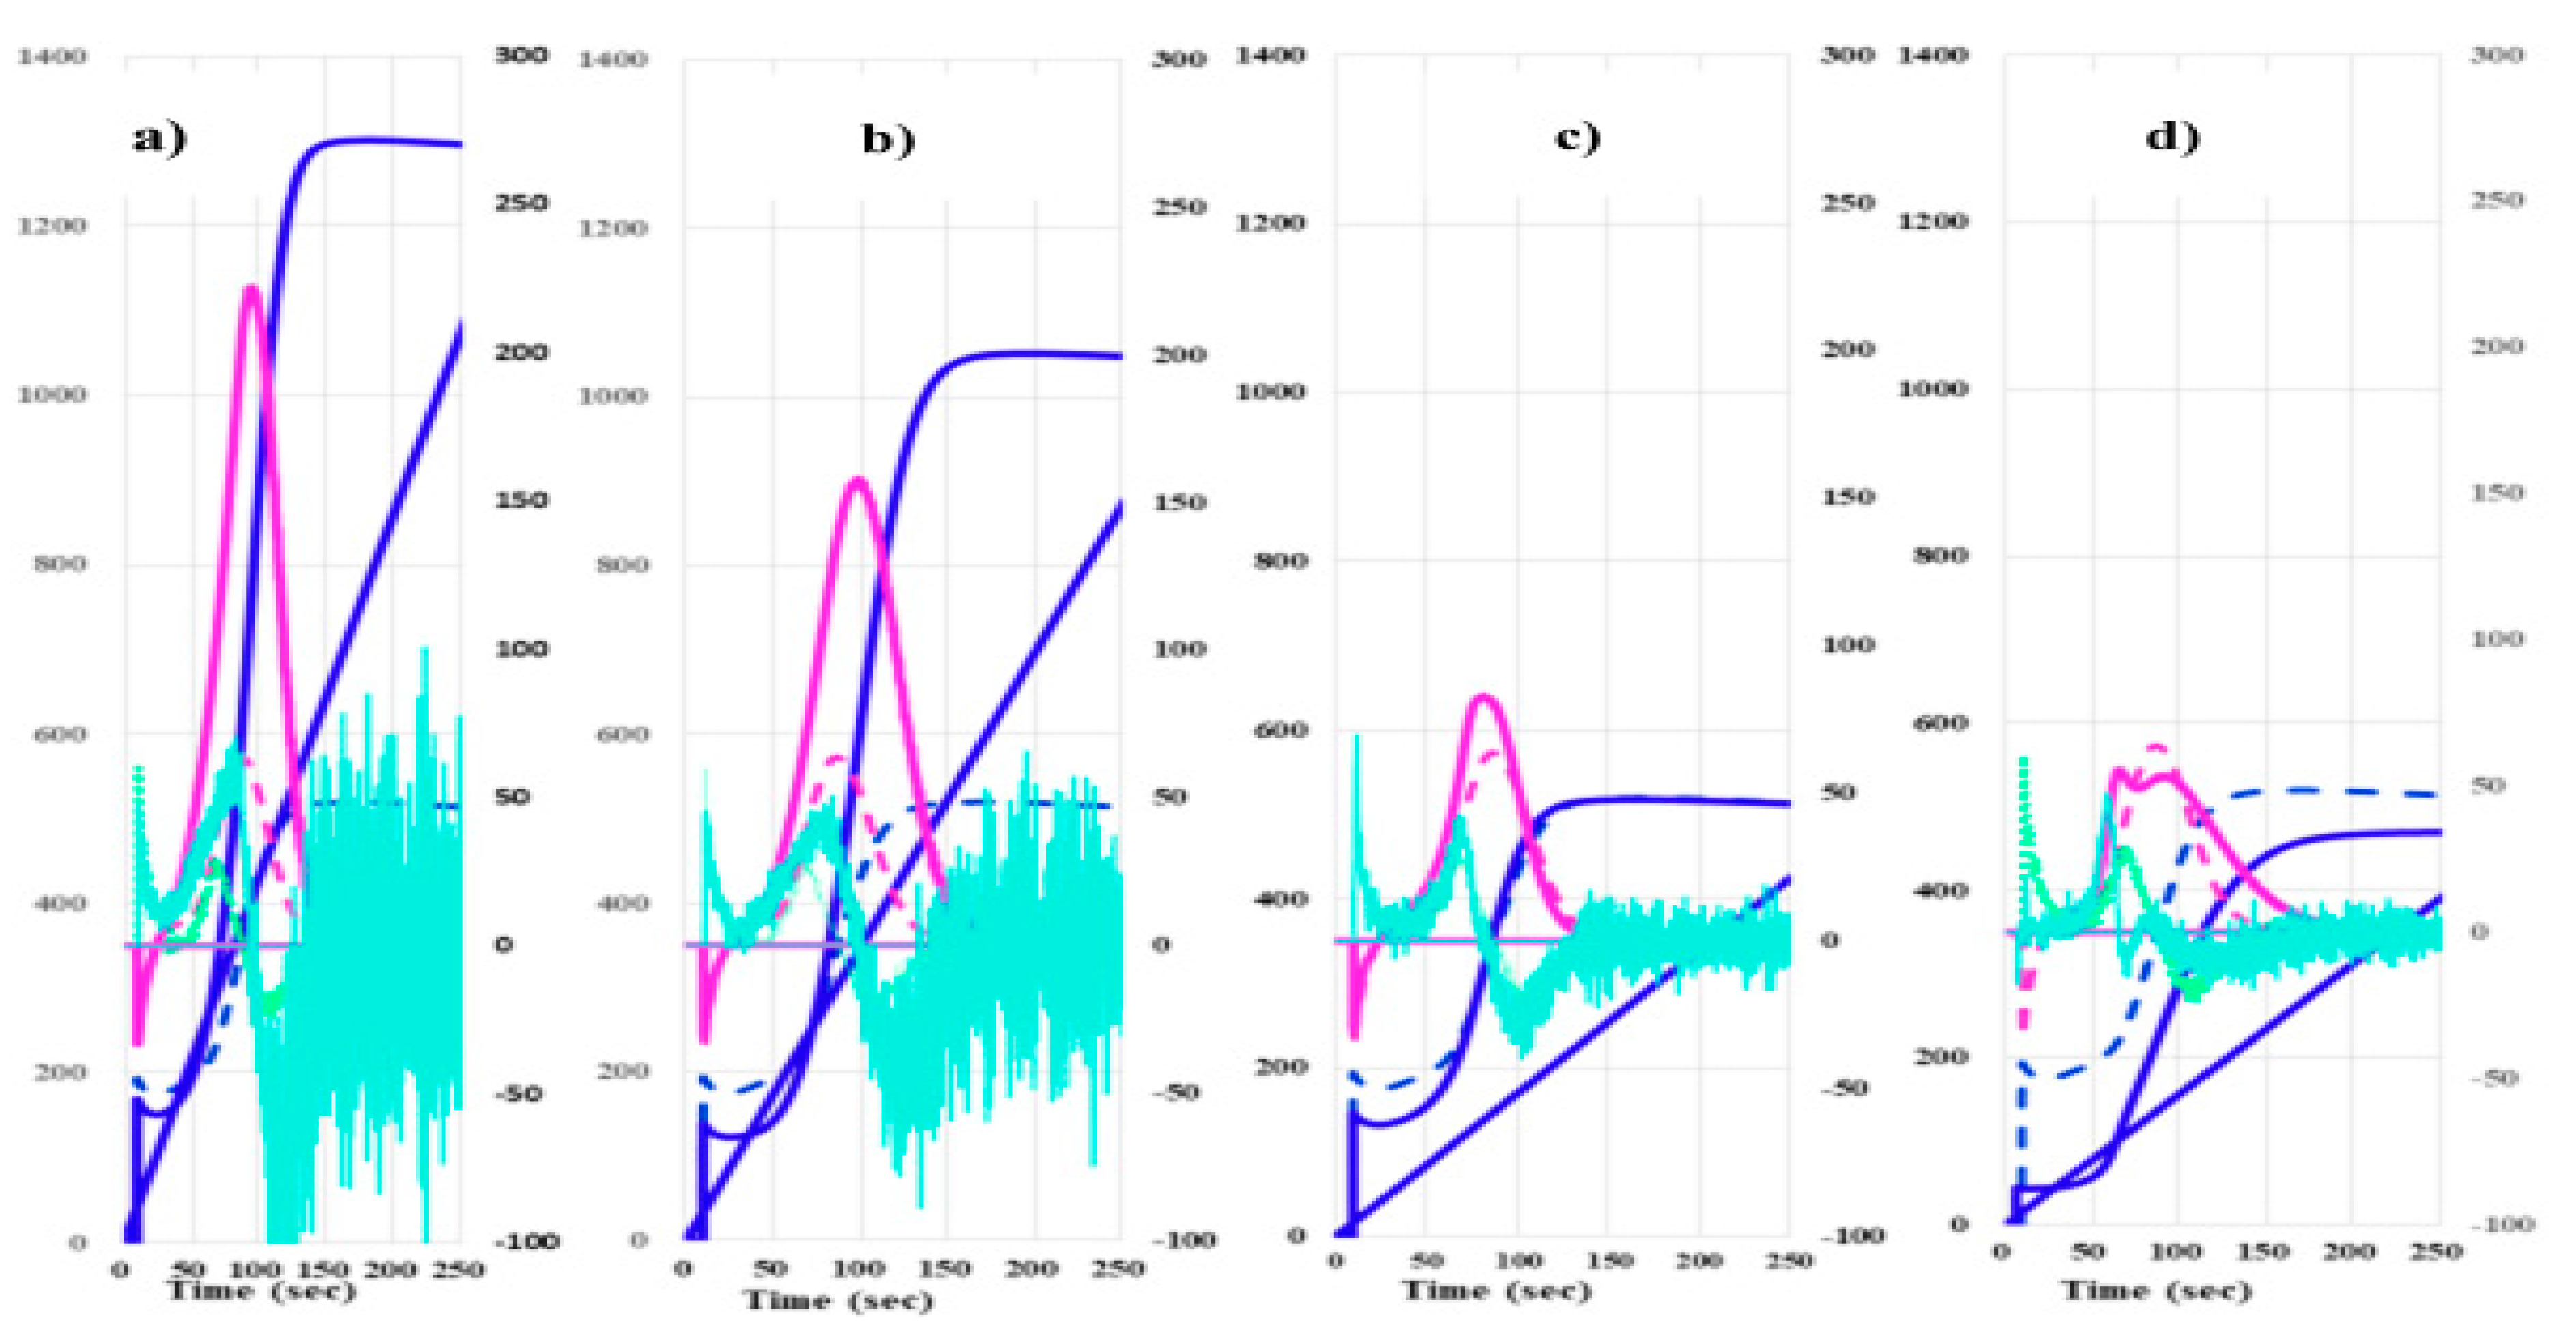
| Cancers | Without cancer | PCs | Without PC | BPDs | HVs | |
| 2ndDPT (sec) |
34.6 (31.6-39.8) |
34.7 (31.3-39.9) |
35.8 (32.0-41.1) |
34.0 (30.9-39.6) |
35.9 (31.2-41.1) |
42.7 (40.3-45.8) |
| 2ndDPH (mmAbsorbance) |
241 (148-352) |
141 (112-185) |
261 (167-387) |
237 (150-351) |
157 (122-160) |
102 (83.7-113.4) |
| 1stDPT-1 (sec) |
40.5 (36.3-46.0) |
41.0 (36.9-46.3) |
41.7 (37.1-47.0) |
39.9 (35.6-46.0) |
42.6 (36.5-49.3) |
49.9 (47.9-52.9) |
| 1stDPH-1 (mmAbsorbance) |
146 (109-205) |
92.4 (81.0-110) |
176 (118-218) |
141 (106-204) |
98.5 (89.2-117) |
82.5 (74.8-94.9) |
| 1stDPT-2 (sec) |
116 (97.3-133.7) |
145 (121-161) |
112 (97.3-133.2) |
117 (97.4-133.6) |
122 (NC) |
133 (127-141) |
| 1stDPH-2 (mmAbsorbance) |
82.6 (60.3-106.3) |
51.8 (42.6-68.0) |
81.4 (64.5-122.2) |
83.6 (58.4-104.8) |
56.5 (NC) |
27.9 (23.3-32.9) |
| FFC (sec) |
108 (90.7-124.5) |
129 (114-147) |
109 (95.1-128.8) |
107 (88.9-124.3) |
113 (98.1-126.6) |
138 (128-147) |
| FFH (mmAbsorbance) |
922 (822-1055) |
850 (779-933) |
975 (827-1113) |
911 (821-1032) |
796 (729-869) |
695 (618-729) |
5. Conclusions
Author Contributions
Funding
Institutional Review Board Statement
Informed Consent Statement
Data Availability Statement
Acknowledgments
Conflicts of Interest
References
- Hisada Y, Mackman N. Cancer-associated pathways and biomarkers of venous thrombosis. Blood. 2017, 130, 1499–1506. [Google Scholar] [CrossRef]
- Mahajan A, Brunson A, White R, Wun T. The Epidemiology of Cancer-Associated Venous Thromboembolism: An Update. Semin Thromb Hemost. 2019, 45, 321–325. [Google Scholar] [CrossRef]
- Cohen O, Caiano LM, Tufano A, Ageno W. Cancer-Associated Splanchnic Vein Thrombosis. Semin Thromb Hemost. 2021, 47, 931–941. [Google Scholar] [CrossRef] [PubMed]
- Fernandes CJ, Morinaga LTK, Alves JL Jr, Castro MA, Calderaro D, Jardim CVP, Souza R. Cancer-associated thrombosis: the when, how and why. Eur Respir Rev. 2019, 28, 180119. [Google Scholar] [CrossRef] [PubMed]
- Fernandes CJ, Morinaga LTK, Alves JL Jr, Castro MA, Calderaro D, Jardim CVP, Souza R. Cancer-associated thrombosis: the when, how and why. Eur Respir Rev. 2019, 28, 180119. [Google Scholar] [CrossRef] [PubMed]
- Kim AS, Khorana AA, McCrae KR. Mechanisms and biomarkers of cancer- associated thrombosis. Transl Res. 2020, 225, 33–53. [Google Scholar] [CrossRef] [PubMed]
- Timp JF, Braekkan SK, Versteeg HH, Cannegieter SC. Epidemiology of cancer- associated venous thrombosis. Blood. 2013, 122, 1712–1723. [Google Scholar] [CrossRef] [PubMed]
- Zeller JA, Tschoepe D, Kessler C. Circulating platelets show increased activation in patients with acute cerebral ischemia. Thromb Haemost. 1999, 81, 373–377. [Google Scholar] [CrossRef]
- Ferroni P, Riondino S, Vazzana N, Santoro N, Guadagni F, Davì G. Biomarkers of platelet activation in acute coronary syndromes. Thromb Haemost. 2012, 108, 1109–1123. [Google Scholar] [CrossRef]
- Varki A: Trousseau's syndrome: multiple definitions and multiple mechanisms. Blood. 2007, 110, 1723–1729.
- Bao L, Zhang S, Gong X, Cui G. Trousseau Syndrome Related Cerebral Infarction: Clinical Manifestations, Laboratory Findings and Radiological Features. J Stroke Cerebrovasc Dis. 2020, 29, 104891. [Google Scholar] [CrossRef] [PubMed]
- Sharma BK, Flick MJ, Palumbo JS. Cancer-Associated Thrombosis: A Two-Way Street. Semin Thromb Hemost. 2019, 45, 559–568. [Google Scholar] [CrossRef] [PubMed]
- Suzuki-Inoue, K. Platelets and cancer-associated thrombosis: focusing on the platelet activation receptor CLEC-2 and podoplanin. Blood. 2019, 134, 1912–1918. [Google Scholar] [CrossRef] [PubMed]
- Maestre A, Trujillo-Santos J, Visoná A, Lobo JL, Grau E, Malý R, Duce R, Monreal M; RIETE Investigators. D-dimer levels and 90-day outcome in patients with acute pulmonary embolism with or without cancer. Thromb Res. 2014, 133, 384–389. [Google Scholar]
- Gerotziafas GT, Mahé I, Lefkou E, AboElnazar E, Abdel-Razeq H, Taher A, Antic D, Elalamy I, Syrigos K, Van Dreden P. Overview of risk assessment models for venous thromboembolism in ambulatory patients with cancer.Thromb Res. 2020, 191, S50–S57.
- Litvinov RI, Pieters M, de Lange-Loots Z, Weisel JW. Fibrinogen and Fibrin. Subcell Biochem. 2021, 96, 471–501. [Google Scholar]
- Wada H, Matsumoto T, Ohishi K, Shiraki K, Shimaoka M: Update on the Clot Waveform Analysis. Clin Appl Thromb Hemost. 2020, 26, 1076029620912027.
- Matsumoto T, Nogami K, Shima M. A combined approach using global coagulation assays quickly differentiates coagulation disorders with prolonged aPTT and low levels of FVIII activity. Int J Hematol 2017, 105, 174–183. [Google Scholar] [CrossRef]
- Nogami, K. Clot Waveform Analysis for Monitoring Hemostasis. Semin Thromb Hemost Online ahead of print. 2022. [Google Scholar]
- Konstantinidi A, Sokou R, Parastatidou S, Lampropoulou K, Katsaras G, Boutsikou T, Gounaris AK, Tsantes AE, Iacovidou N: Clinical Application of Thromboelastography/Thromboelastometry (TEG/TEM) in the Neonatal Population: A Narrative Review. Semin Thromb Hemost. 2019, 45, 449–457. [CrossRef]
- Tripodi A: Thrombin Generation Assay and Its Application in the Clinical Laboratory. Clin Chem. 2016, 62, 699–707. [CrossRef] [PubMed]
- Wada H, Ichikawa Y, Ezaki E, Matsumoto T, Yamashita Y, Shiraki K, Shimaoka M, Shimpo H: The reevaluation of thrombin time using a clot waveform analysis. J. Clin. Med. 2021, 10, 4840. [CrossRef] [PubMed]
- Kobayashi N, Maegawa T, Takada M, Tanaka H, Gonmori H: Criteria for diagnosis of DIC based on the analysis of clinical and laboratory findings in 345 DIC patients collected by the Research Committee on DIC in Japan. Bibl Haemotol, 1983, 49, 265–275.
- Ezaki M, Wada H, Ichikawa Y, Ikeda N, Shiraki K, Yamamoto A, Moritani I, Shimaoka M, Shimpo H. Plasma Soluble Fibrin Is Useful for the Diagnosis of Thrombotic Diseases. J Clin Med. 2023, 12, 2597. [Google Scholar] [CrossRef]
- Mohamad Dbouk, Bryson W. Katona, Randall E. Brand, Amitabh Chak, Sapna Syngal, James J. Farrell, Fay Kastrinos, Elena M. Stoffel, Amanda L. Blackford, Anil K. Rustgi, Beth Dudley, Linda S. Lee, Ankit Chhoda, Richard Kwon, Gregory G. Ginsberg, Alison P. Klein, Ihab Kamel, Ralph H. Hruban, Jin He, Eun Ji Shin, Anne Marie Lennon, Marcia Irene Canto, Michael Goggins: The Multicenter Cancer of Pancreas Screening Study: Impact on Stage and Survival. J Clin Oncol. 2022, 40, 3257–3266. [Google Scholar]
- Kobayashi M, Wada H, Fukui S, Mizutani H, Ichikawa Y, Shiraki K, Moritani I, Inoue H, Shimaoka M, Shimpo H. A Clot Waveform Analysis Showing a Hypercoagulable State in Patients with Malignant Neoplasms. J Clin Med. 2021, 10, 5352. [Google Scholar] [CrossRef] [PubMed]
- Matsumoto T, Wada H, Toyoda H, Hirayama M, Yamashita Y, Katayama N. Modified clot waveform analysis to measure plasma coagulation potential in the presence of the anti-factor IXa/factor X bispecific antibody emicizumab: comment. J Thromb Haemost. 2018, 16, 1665–1666. [Google Scholar] [CrossRef]
- Wada H, Shiraki K, Matsumoto T, Ohishi K, Shimpo H, Shimaoka M: Effects of platelet and phospholipids on clot formation activated by a small amount of tissue factor. Thromb Res 2020, 193, 146–153. [CrossRef]
- Fernandes CJ, Morinaga LTK, Alves JL Jr, Castro MA, Calderaro D, Jardim CVP, Souza R. Cancer-associated thrombosis: the when, how and why. Eur Respir Rev. 2019, 28, 180119. [Google Scholar] [CrossRef]
- Hisada Y, Mackman N. Cancer-associated pathways and biomarkers of venous thrombosis. Blood. 2017, 130, 1499–1506. [Google Scholar] [CrossRef]
- Falanga A, Marchetti M, Russo L. Hemostatic Biomarkers and cancer prognosis: Where Do We Stand? Semin Thromb Hemost. Online ahead of print. 2021.
- Johnson ED, Schell JC, Rodgers GM. The D-dimer assay. Am J Hematol. 2019, 94, 833–839. [Google Scholar] [CrossRef]
- Suzuki-Inoue, K. Platelets and cancer-associated thrombosis: focusing on the platelet activation receptor CLEC-2 and podoplanin. Blood. 2019, 134, 1912–1918. [Google Scholar] [CrossRef]
- Campello E, Bosch F, Simion C, Spiezia L, Simioni P. Mechanisms of thrombosis in pancreatic ductal adenocarcinoma. Best Pract Res Clin Haematol. 2022, 35, 101346. [Google Scholar] [CrossRef] [PubMed]
- Campello E, Ilich A, Simioni P, Key NS: The relationship between pancreatic cancer and hypercoagulability: a comprehensive review on epidemiological and biological issues. Br J Cancer 2019, 121, 359–371. [CrossRef]
- Sun W, Ren H, Gao CT, W. D. Ma WD, Luo L, Liu Y, et al. Clinical and prognostic significance of coagulation assays in pancreatic cancer patients with absence of venous thromboembolism. Am J Clin Oncol 2015, 38, 550–556. [Google Scholar] [CrossRef] [PubMed]
- Zalatnai A, Perjesi E, Galambos E: Much more than trousseau syndrome. The broad spectrum of the pancreatic paraneoplastic syndromes. Pathol Oncol Res 2018, 24, 1–10. [Google Scholar] [CrossRef] [PubMed]
- Falanga A: Thrombophilia in cancer. Semin Thromb Hemost 2005, 31, 104–110.
- Vormittag R, Simanek R, Ay C, Dunkler D, Quehenberger P, Marosi C, et al. High factor VIII levels independently predict venous thromboembolism in cancer patients: the cancer and thrombosis study. Arterioscler Thromb Vasc Biol 2009, 29, 2176–2181. [Google Scholar]
- Khorana AA, Fine RL: Pancreatic cancer and thromboembolic disease. Lancet Oncol 2004, 5, 655–663. [CrossRef]
- van den Berg YW, Osanto S, P. H. Reitsma PH, Versteeg HH: The relationship between tissue factor and cancer progression: insights from bench and bedside. Blood 2012, 119, 924–932. [Google Scholar] [CrossRef] [PubMed]
- Unsal E, Atalay F, Atikcan S, Yilmaz A: Prognostic significance of hemostatic parameters in patients with lung cancer. Respir Med 2004, 98, 93–98. [CrossRef]
- Heinmoller E, Schropp T, Kisker O, Simon B, Seitz R, Weinel RJ. Tumor cell-induced platelet aggregation in vitro by human pancreatic cancer cell lines. Scand. J. Gastroenterol. 1995, 30, 1008–1016. [Google Scholar] [CrossRef] [PubMed]
- Sawai H, Liu J, Reber HA, Hines OJ, Eibl G. Activation of peroxisome proliferator-activated receptor-gamma decreases pancreatic cancer cell invasion through modulation of the plasminogen activator system. Mol. Cancer Res. 2006, 4, 159–167. [Google Scholar] [CrossRef] [PubMed]
- Hwang IG, Choi JH, Park SH, Oh SY, Kwon HC, Lee SI, Lim DH, Lee GW, Kang JH. Chemotherapy in advanced gastric cancer patients associated with disseminated intravascular coagulation. Cancer Res Treat. 2014, 46, 27–32. [Google Scholar]
- Geddings JE, Mackman N. Tumor-derived tissue factor-positive microparticles and venous thrombosis in cancer patients. Blood. 2013, 122, 1873–1880. [Google Scholar]
- Seruga B, Zhang H, Bernstein LJ, Tannock IF. Cytokines and their relationship to the symptoms and outcome of cancer. Nat. Rev. Cancer. 2008, 8, 887–899. [Google Scholar] [CrossRef]
- Abdol Razak Norbaini: Elaskalani Omar, Metharom Pat. Pancreatic Cancer-Induced Neutrophil Extracellular Traps: A Potential Contributor to Cancer-Associated Thrombosis. International Journal of Molecular Sciences. 2017, 18, 487. [Google Scholar]
| N | Age (years) | Sex (F:M) | Thrombosis | |
|---|---|---|---|---|
| Pancreatic cancer | 30 | 70.3±10.7 | 12:18 | 11/30 (36.7%) |
| Uterine cancer | 4 | 60.5±9.7 | 4:0 | 1/4 (25.0%) |
| Prostate cancer | 7 | 76.9±6.3 | 0:7 | 3/7 (43.0%) |
| Hepatocellular carcinoma | 15 | 72.3±8.1 | 0:15 | 3/15 (20.0%) |
| Malignant lymphoma | 9 | 68.2±19.1 | 6:3 | 4/9 (44.4%) |
| Leukemia/myelodysplastic syndrome | 11 | 74.3±14.1 | 4:7 | 1/11 (6.7%) |
| Lung cancer | 11 | 69.6±11.0 | 3:8 | 3/11 (27.3%) |
| Breast cancer | 5 | 69.8±11.9 | 5:0 | 0/5 (0%) |
| Biliary tract cancer | 11 | 78.7±6.2 | 6:5 | 1/11 (9.1%) |
| Colon cancer | 10 | 73.6±11.6 | 4:6 | 0/10 (0%) |
| Gastric cancer | 12 | 76.8±10.9 | 0:12 | 3/12 (25.0%) |
| Esophageal cancer | 5 | 66.8±9.5 | 0:5 | 1/5 (20.0%) |
| Others | 8 | 77.4±10.5 | 1:7 | 3/8 (37.5%) |
| Total | 138 | 72.4±11.4 | 45:93 | 34/138 (24.6%) |
| Stage | n | Age (years) | Sex (F:M) | Thrombosis (n, %) | |
|---|---|---|---|---|---|
| Pancreatic cancer |
I | 5 | 73.5±13.0 | 3:2 | 3$1, 60% |
| II | 4 | 80.7±5.7 | 1:3 | 0, 0% | |
| III | 3 | 72.5±13.4 | 2:1 | 2$3, 66.7% | |
| IV | 18 | 67.4±11.1 | 6:12 | 6$4, 33.3% | |
| Total | 30 | 70.2±11.4 | 12:18 | 11, 36.7% | |
| Other cancers |
I | 24 | 76.4±8.9 | 7:30 | 3#1, 12.5% |
| II | 19 | 71.6±9.0 | 4:14 | 3#2, 15.8% | |
| III | 18 | 73.0±11.2 | 5:14 | 4#3, 22.2% | |
| IV | 37 | 69.5±11.1 | 10:14 | 9#4, 24.3% | |
| Total | 98 | 73.2±10.2 | 26:72 | 19, 19.4% |
Disclaimer/Publisher’s Note: The statements, opinions and data contained in all publications are solely those of the individual author(s) and contributor(s) and not of MDPI and/or the editor(s). MDPI and/or the editor(s) disclaim responsibility for any injury to people or property resulting from any ideas, methods, instructions or products referred to in the content. |
© 2023 by the authors. Licensee MDPI, Basel, Switzerland. This article is an open access article distributed under the terms and conditions of the Creative Commons Attribution (CC BY) license (http://creativecommons.org/licenses/by/4.0/).


