1. Introduction
Confined masonry (CM) system consists of load-bearing masonry walls which are constructed first, one floor at a time, followed by the cast-in-place reinforced concrete (RC) tie-columns. Finally, RC tie-beams are constructed on top of the walls, simultaneously with the floor/roof slab construction. Horizontal and vertical RC confining elements (tie-beams and tie-columns) provide confinement to masonry walls and significantly contribute to their lateral load resistance. Key design and construction concepts related to confined masonry have been presented elsewhere [
1,
2,
3].
The first reported use of CM construction was in the reconstruction of buildings destroyed by the 1908 Messina, Italy earthquake (M 7.2), which killed over 70,000 people. The evidence from numerous past earthquakes which affected some of the most seismically-prone areas of the world confirmed good performance of CM structures which were designed and constructed according to the codes [
3,
4]. Although CM buildings experienced damage in a few severe earthquakes, such as the 2010 Maule, Chile earthquake (M 8.8), collapse of these buildings rarely occurs and the number of fatalities and overall losses have been small given the earthquake intensity [
5]. Many earthquake engineers believe that CM construction represents a viable alternative to inadequately designed and/or constructed reinforced concrete (RC) frames with masonry infills and unreinforced masonry (URM) construction. A few international initiatives are directed at promoting the application of CM construction in countries and regions characterized by moderate to high seismic hazard [
6].
CM construction has been practiced in a few European countries (Italy, Slovenia, Croatia, North Macedonia, Romania, Serbia), Latin America (Mexico, Chile, Peru, Colombia, Argentina, and Venezuela), the Middle East (Iran, Algeria, Morocco), South Asia (Indonesia), and the Far East (China). The combined population of countries in which CM construction has been practiced is over 3.5 billion, which represents nearly one-half of the world’s population and spans five continents [
7]. Examples of global CM applications have been documented by Brzev and Mitra [
1]. A review of international seismic design codes and guidelines for CM buildings was presented by Brzev et al. [
8].
This paper presents an overview of past research studies related to the behaviour of CM wall structures subjected to the effects of axial loading, flexure and shear due to in-plane and out-of-plane seismic actions and complements previous review efforts related to the seismic performance of CM structures focused on the European research studies [
9].
Results of extensive research studies on seismic behaviour of CM structures which were performed mainly in Latin American countries, e.g. Mexico, Peru, and Chile from the 1960s to date have been used for this study. The authors also acknowledge the contributions to research and state of practice of CM construction by researchers from other Latin American countries which have not been included in the paper, e.g. Argentina, Colombia, Venezuela, etc. The following text provides a historic overview of research studies on structural and seismic performance of CM structures from Mexico, Peru, and Chile.
Formal investigations on the behaviour of masonry structures in Mexico began after the 1957 earthquake. Early research studies were focused on axial strength of masonry walls [
10], the effect of eccentric axial forces [
11,
12], and ductility [
11,
13]. Subsequently, extensive research effort was directed to study mechanical properties of masonry components [
14], cracking of walls due to differential settlements [
15], and the behaviour of walls under cyclic loading [
16]. The results of previous Mexican research studies were summarized in a report, which also included some post-earthquake observations and design recommendations [
17]. A significant analytical research study was subsequently published [
18].
Performance of high-strength reinforcing bars for masonry walls was studied [
19,
20], along with different reinforcing strategies [
21,
22,
23]. Expressions for estimating the contribution of horizontal reinforcement were proposed based on the Mexican research studies [
24,
25,
26,
27]. Strategies for retrofitting and design of CM shear walls with external welded wire mesh were explored [
28,
29,
30]. In 1991, the National Center for Disaster Prevention (CENAPRED) was created in Mexico City. New facilities included the fully equipped Structures Laboratory donated by the Japanese government, which greatly enhanced experimental research capabilities. In 1997, the first shaking table in Mexico, donated by the Kajima Technical Research Institute of Japan, was inaugurated at UNAM (4 m x 4 m dimensions, single degree of freedom, and 20-ton load capacity), and the first CM building model was tested in 1999 [
31].
The results of previous investigations culminated in the development of a new design code for CM structures [
32]. Active research in the subsequent years led to the development of subsequent edition of the code in 2017 [
33,
34]. Shear strength design provisions for CM walls were fully revised based on several research studies [
35,
36,
37,
38,
39]. Contribution of joint reinforcement to the shear resistance of CM walls was also studied [
40,
41]. Design expressions for masonry walls supported by beams and the related numerical models were developed [
42,
43,
44]. A state-of-the-art approach for analysis and design of masonry structures, including CM structures, was presented in major publications [
45,
46]. Shaking-table investigations have continued to produce much needed data related to seismic behaviour of mid-rise CM structures [
47,
48,
49]. Performance of CM walls under out-of-plane lateral loading and the corresponding design approaches have been extensively studied in recent years [
50].
The first application of CM construction in Peru was reported in the 1940s. Experimental testing of masonry wall specimens started after the inauguration of the Structures Laboratory of the Catholic University of Peru (PUCP) in 1979 [
51]. Professor Angel San Bartolomé conducted several experimental studies on CM walls, including the effect of horizontal reinforcement and the level of axial load on the response of walls subjected to lateral cyclic loading, as well as the effect of in-plane slenderness [
52,
53]. Shaking-table testing of a half-scale three-storey CM building was performed [
54]. Another study was focused on the comparison of behaviour of CM walls with toothed masonry-concrete interface versus the walls with horizontal steel dowels. The study was motivated by the good performance of CM walls with horizontal dowels in the 1985 Llolleo, Chile earthquake. The Japan-Peru Center for Seismic Research and Disaster Mitigation (UNI-CISMID) was inaugurated in 1989 and included a strong wall facility which enabled pseudo-dynamic testing of multi-storey CM walls [
55]. For more details on research studies and code development related to CM structures in Peru refer to Quiun and Santillán [
56].
CM construction has been practiced in Chile since 1930s, and has demonstrated good seismic performance in numerous damaging earthquakes [
5,
57]. Experimental studies on 22 CM wall specimens subjected to in-plane reversed cyclic loading performed in the 1990s were used to develop an analytical model for predicting nonlinear behaviour of CM structures [
58]. Another experimental study was performed on CM walls with openings subjected to reversed cyclic loading and involved the testing of 16 full-size specimens. A few research studies were focused on the effect of wall density on the seismic vulnerability of CM buildings in Chile [
59,
60], and prediction of seismic displacement demands in CM structures [
61].
The following sections of the paper present a review of previous experimental research studies related to the behaviour of CM wall structures subjected to axial loading, flexure, and shear due to in-plane and out-of-plane seismic actions. Experimental databases have been compiled and analysed to identify relevant design and construction parameters and their influence on the seismic behaviour of CM buildings. A few other important design and construction aspects, such as the influence of masonry materials, effect of openings in CM walls, and the interface between the masonry and adjacent RC confining elements, are also discussed. The paper is focused on engineered CM structures, which have been designed according to the codes and guidelines, as opposed to non-engineered CM structures which are constructed without engineering input and are found in many countries.
2. In-Plane Shear Behaviour
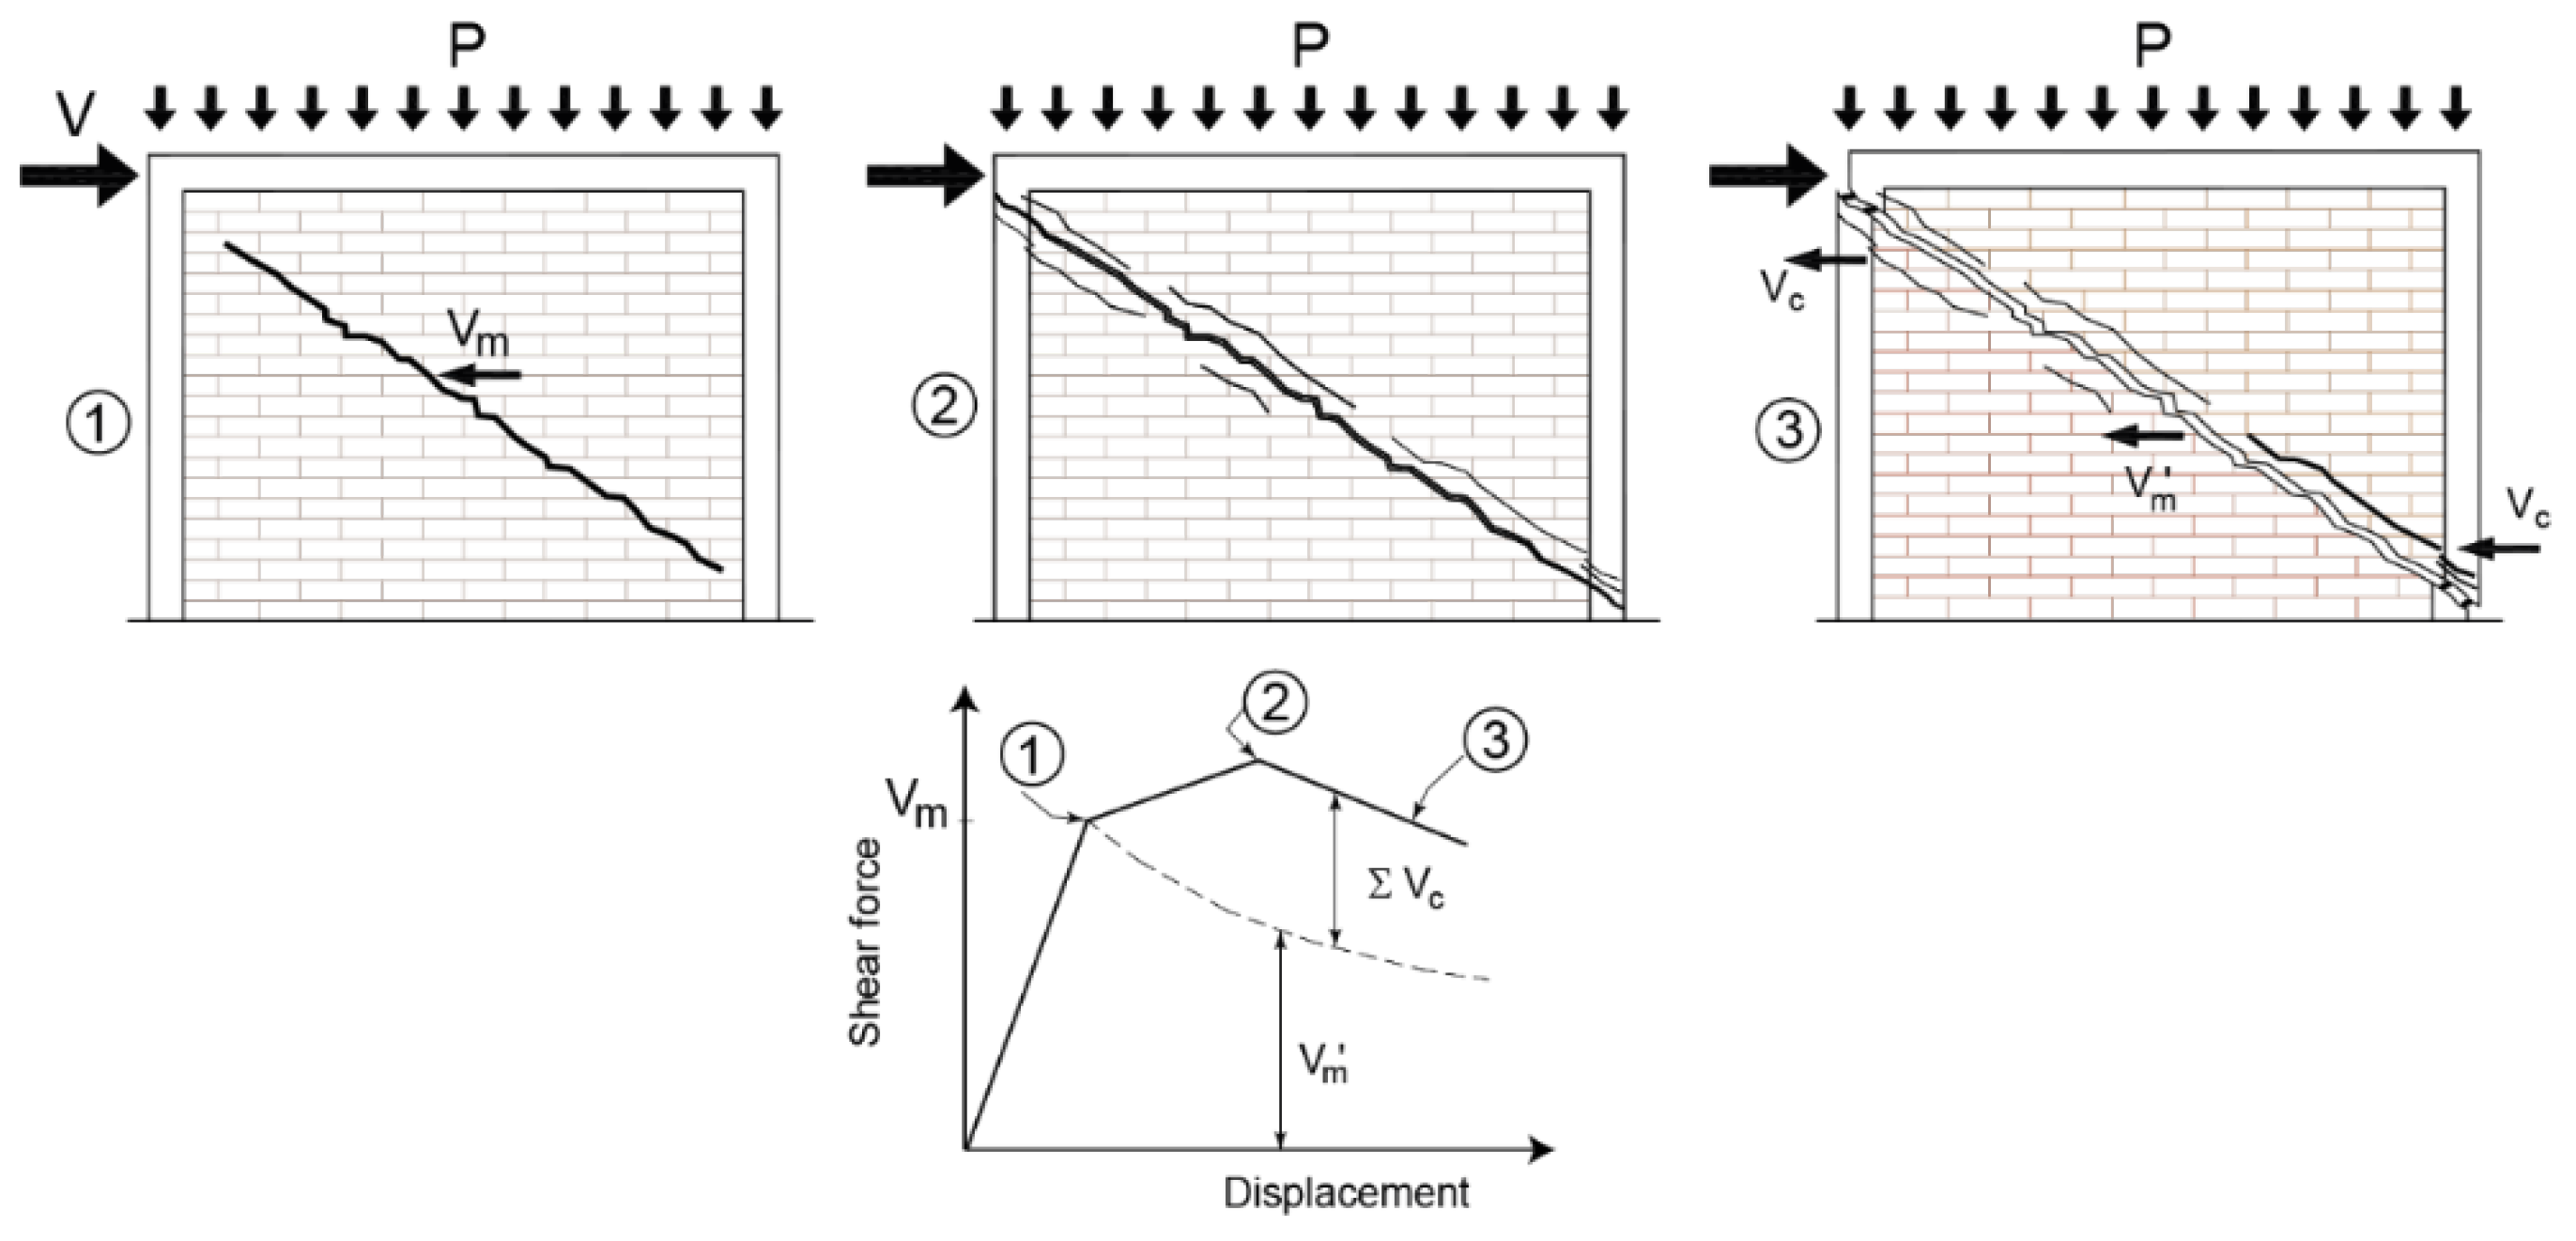
CM walls subjected to in-plane lateral loads most often experience behaviour leading to a diagonal tension shear failure mechanism [
62]. The mechanism is characterized by the development of inclined cracks in masonry walls which propagate into RC confining elements before the failure takes place [
3] (
Figure 1). It is important to note that some codes, e.g. Mexican [
33] and Peruvian [
63], define the shear strength of CM walls without horizontal reinforcement as the strength at the onset of cracking (stage 1), while the maximum shear strength which considers steel contribution (stage 2) is used for design of walls with horizontal reinforcement. The shear strength of a CM wall,
, is determined as the sum of several components, including masonry,
, axial stress
, and horizontal reinforcement
, as follows.
A review of the key parameters which influence shear strength of CM walls, primarily based on findings of previous international research studies, is presented in this section. The authors also performed a statistical analysis using a database compiled by Treviño [
64], which contains detailed data on 105 CM wall specimens from 29 experimental studies performed in Mexico, Peru, Venezuela and Chile (see Appendix for more info). The test specimens were subjected to either monotonic or reversed cyclic lateral loading, subjected to different axial stress level, with different wall dimensions and masonry material properties (masonry units and mortar), and RC tie-column materials and reinforcement. All specimens included in the database were solid walls (without openings). The experimental data was used to establish relationships between different specimen parameters and masonry strength, using simple univariate analysis.
2.1. Masonry Component
It has been recognized by numerous researchers that several parameters influence shear strength of unreinforced masonry,
, including the wall’s aspect ratio (
), shear-moment interaction, and axial stress level. For the purpose of this study masonry component of the shear strength can be presented in the following form
Where 𝑎 is an empirical constant, which is usually in the range from 0.3 to 0.5 (based on previous research studies), is the diagonal compression strength, and is a factor that considers the wall’s aspect ratio.
2.1.1. The Effect of Tensile Strength of the Masonry
The notion that the shear strength of a wall at the onset of cracking is related to the masonry tensile strength and the corresponding axial stress is based on the stress analysis at the section located at the centre of a wall [
65] (
Figure 2). Shear strength is calculated by setting the principal tensile stress equal to the masonry tensile strength,
, which may be estimated experimentally. If a wall is not subjected to axial compression, masonry shear strength depends only on the masonry tensile strength – but that is a hypothetical scenario. The masonry shear strength,
, is obtained from diagonal compression tests. Alternatively, it can be estimated as a function of
, where
denotes masonry compression strength (which can be determined based on either gross or net area of the section).
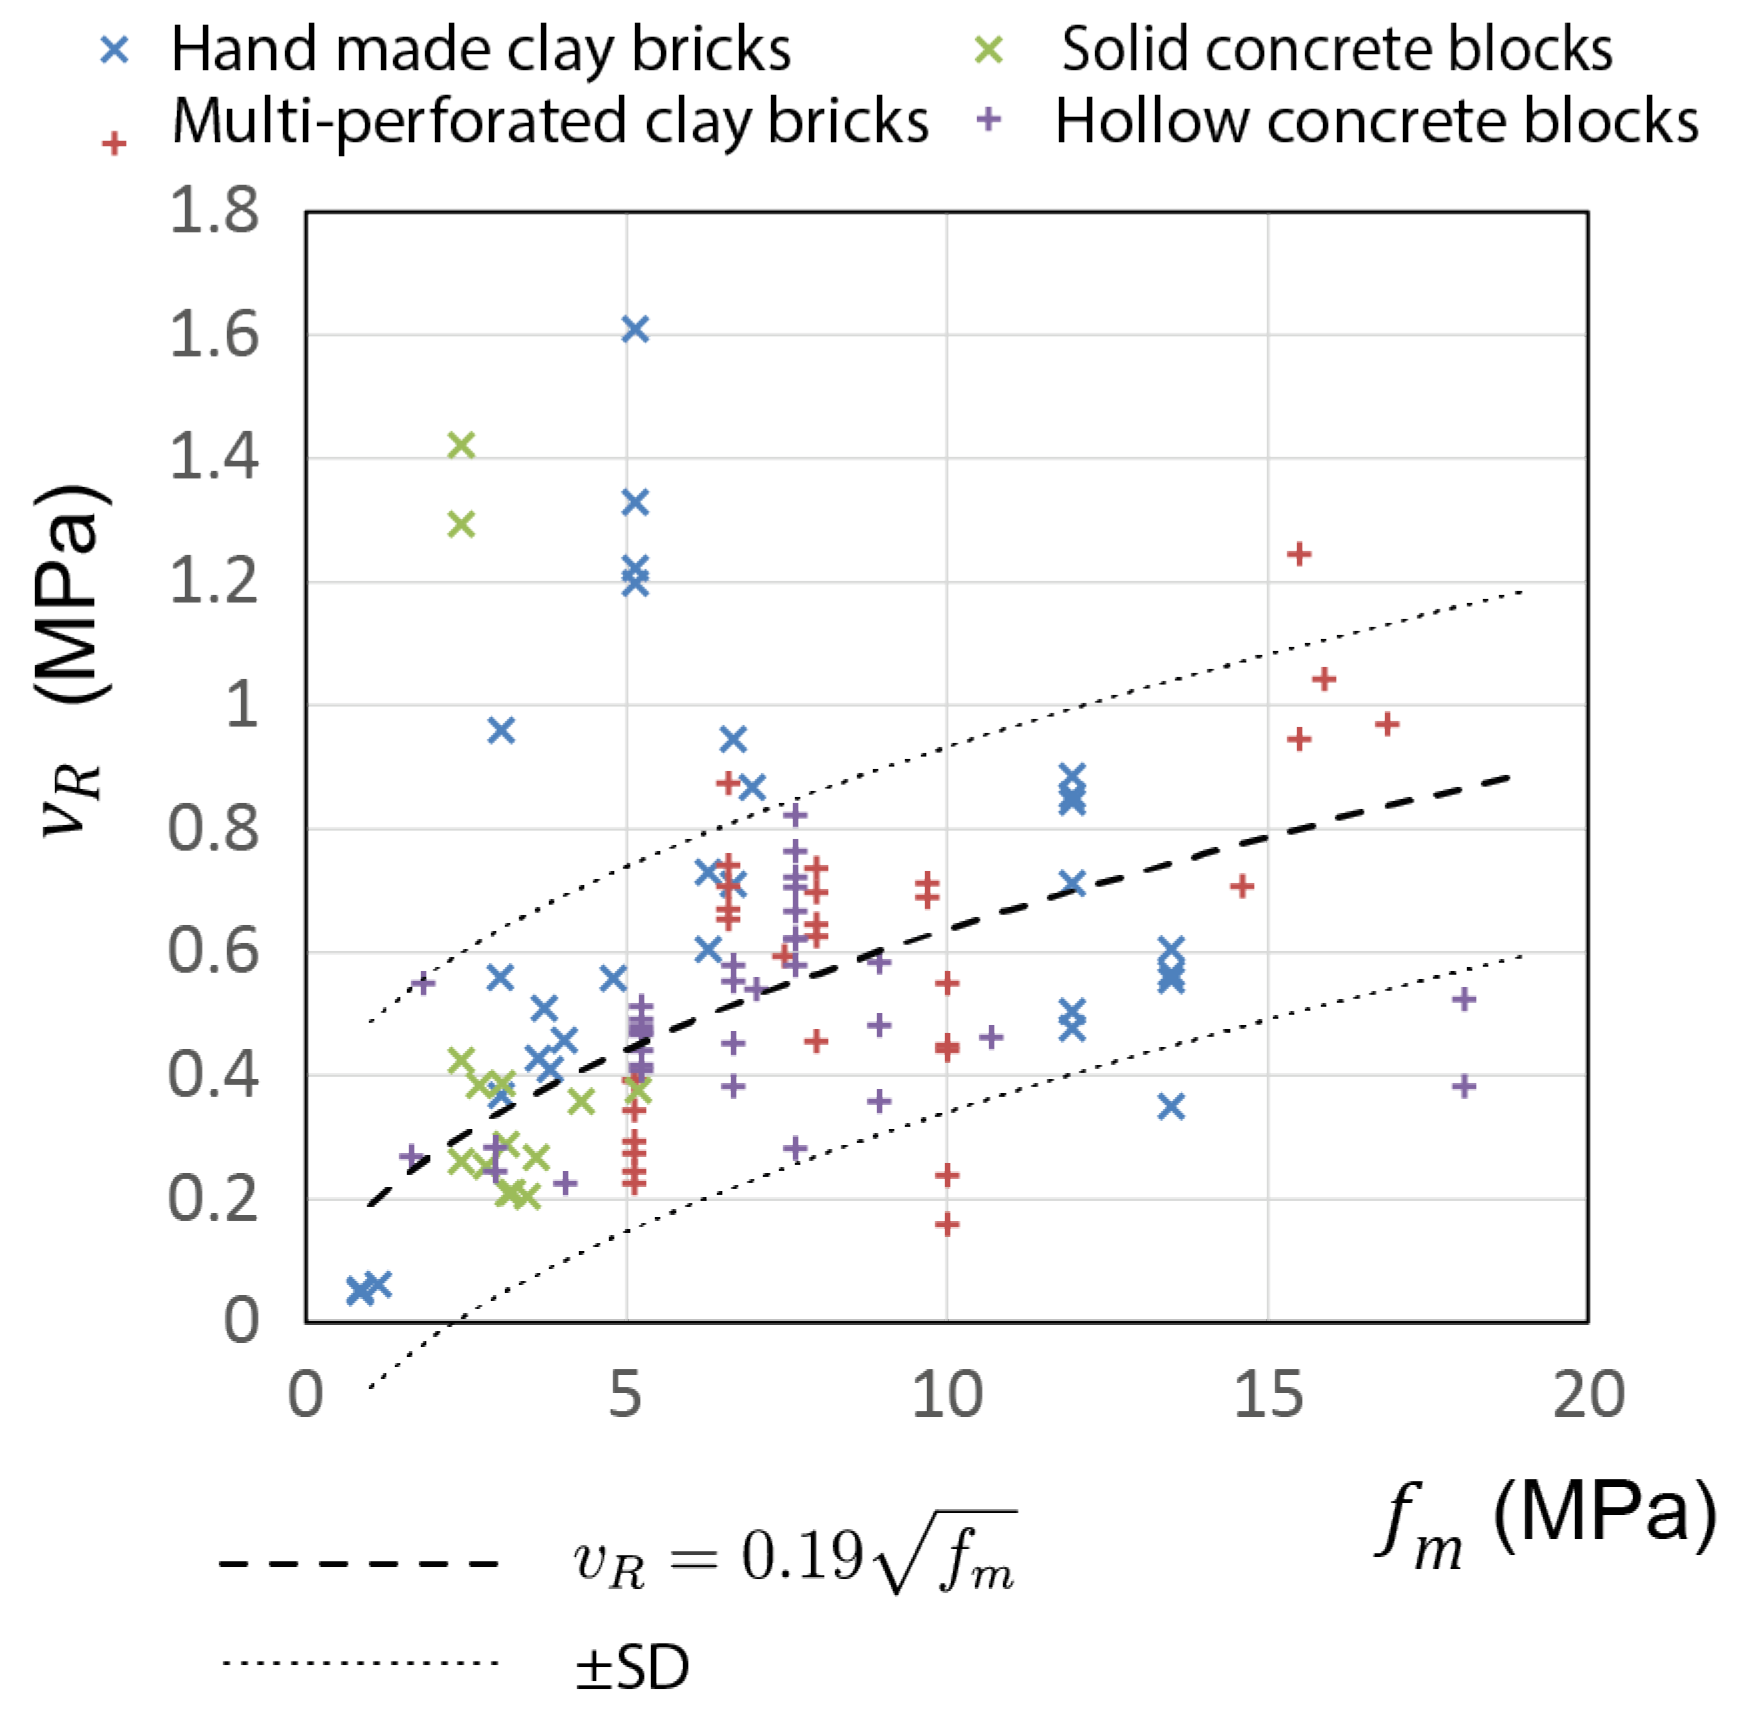
The above-mentioned experimental database [
64] was used to establish a relationship between the CM shear strength
and the masonry compression strength,
, as shown in
Figure 3. It was shown that the following power function
offered the best fit for the input data, with
and
. Note that the exponent
shows that the masonry shear strength is directly proportional to the square root of the masonry compressive strength,
; this is similar to the findings of previous studies on RM walls [
66].
For design purposes the above equation could be written as follows
2.1.2. The Effect of Wall Aspect Ratio
An equation for the
factor, can be presented in the following form
Where
and
are empirical constants determined through experimental studies. For example, D'Amore and Decanini [
67] analysed the results of past experimental studies on 58 CM wall specimens with aspect ratios ranging from 0.62 to 2.95; out of these, 39 specimens were subjected to cyclic loads and 19 were subjected to monotonic loads. The results indicated that shear resistance of CM walls should be reduced for slender walls (
), in order to take into account shear-moment interaction. They proposed a factor similar to the one defined in eq. (3), where
and
. Alvarez [
68], analysed the experimental results from 17 walls tested with cyclic lateral loads. His sample included walls from Mexico, Peru and Chile. He argued that aspect ratio changes the stress distribution in the walls, and consequently, the shear strength of walls with different aspect ratios should also change. He also pointed out that flexural deformation is more important in slender walls and even when the type of failure do not change, the shear strength is expected to decrease with aspect ratio. He found an increase in strength for decreasing aspect ratios. Based on his findings he proposed
factor, similar to that in eq. (5), however he used aspect ratio
, instead of the shear span ratio
. The coefficients were
and
.
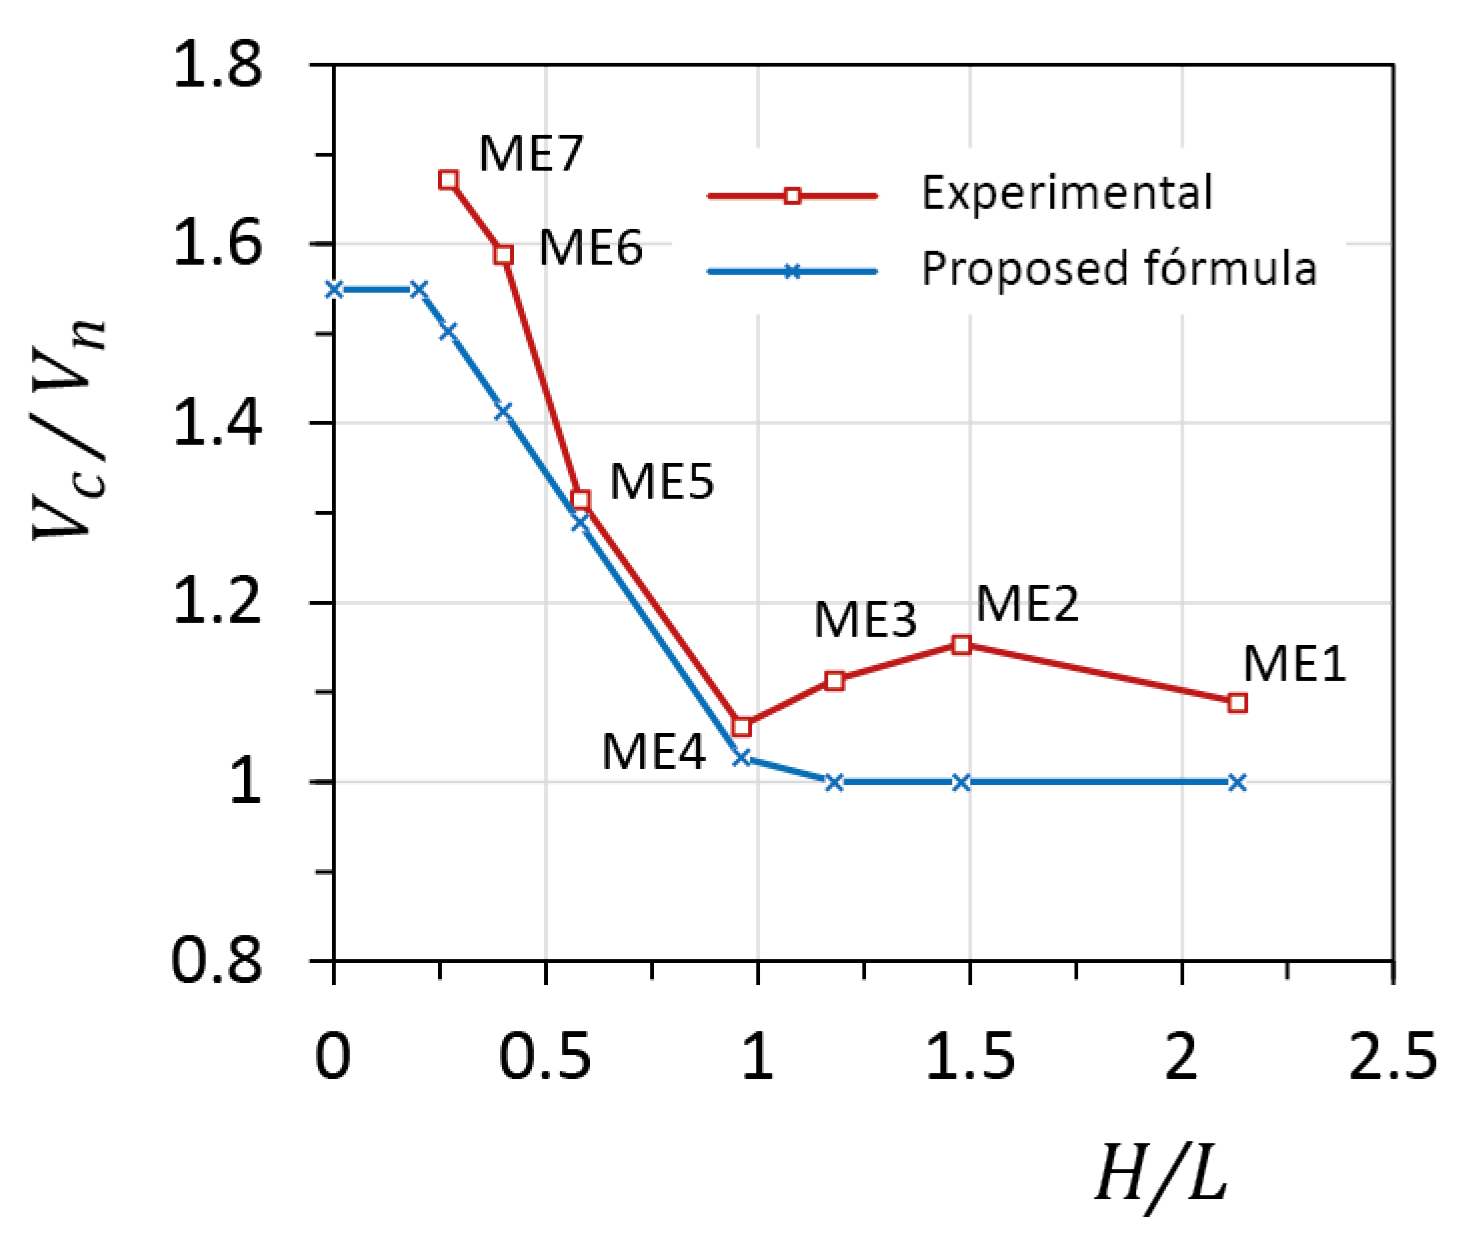
The following equations were proposed based on the results of experimental research program on CM walls [
35]
It can be seen that, according to the proposed equation, the values
and
would be used in eq. (5). The 𝑓 factor, as presented above, has been incorporated in the latest Mexican masonry design code [
33], as a multiplier in the shear resistance equation for CM walls. However, in the Mexican formula, the
factor is also applied to the axial stress component, that is (
, where
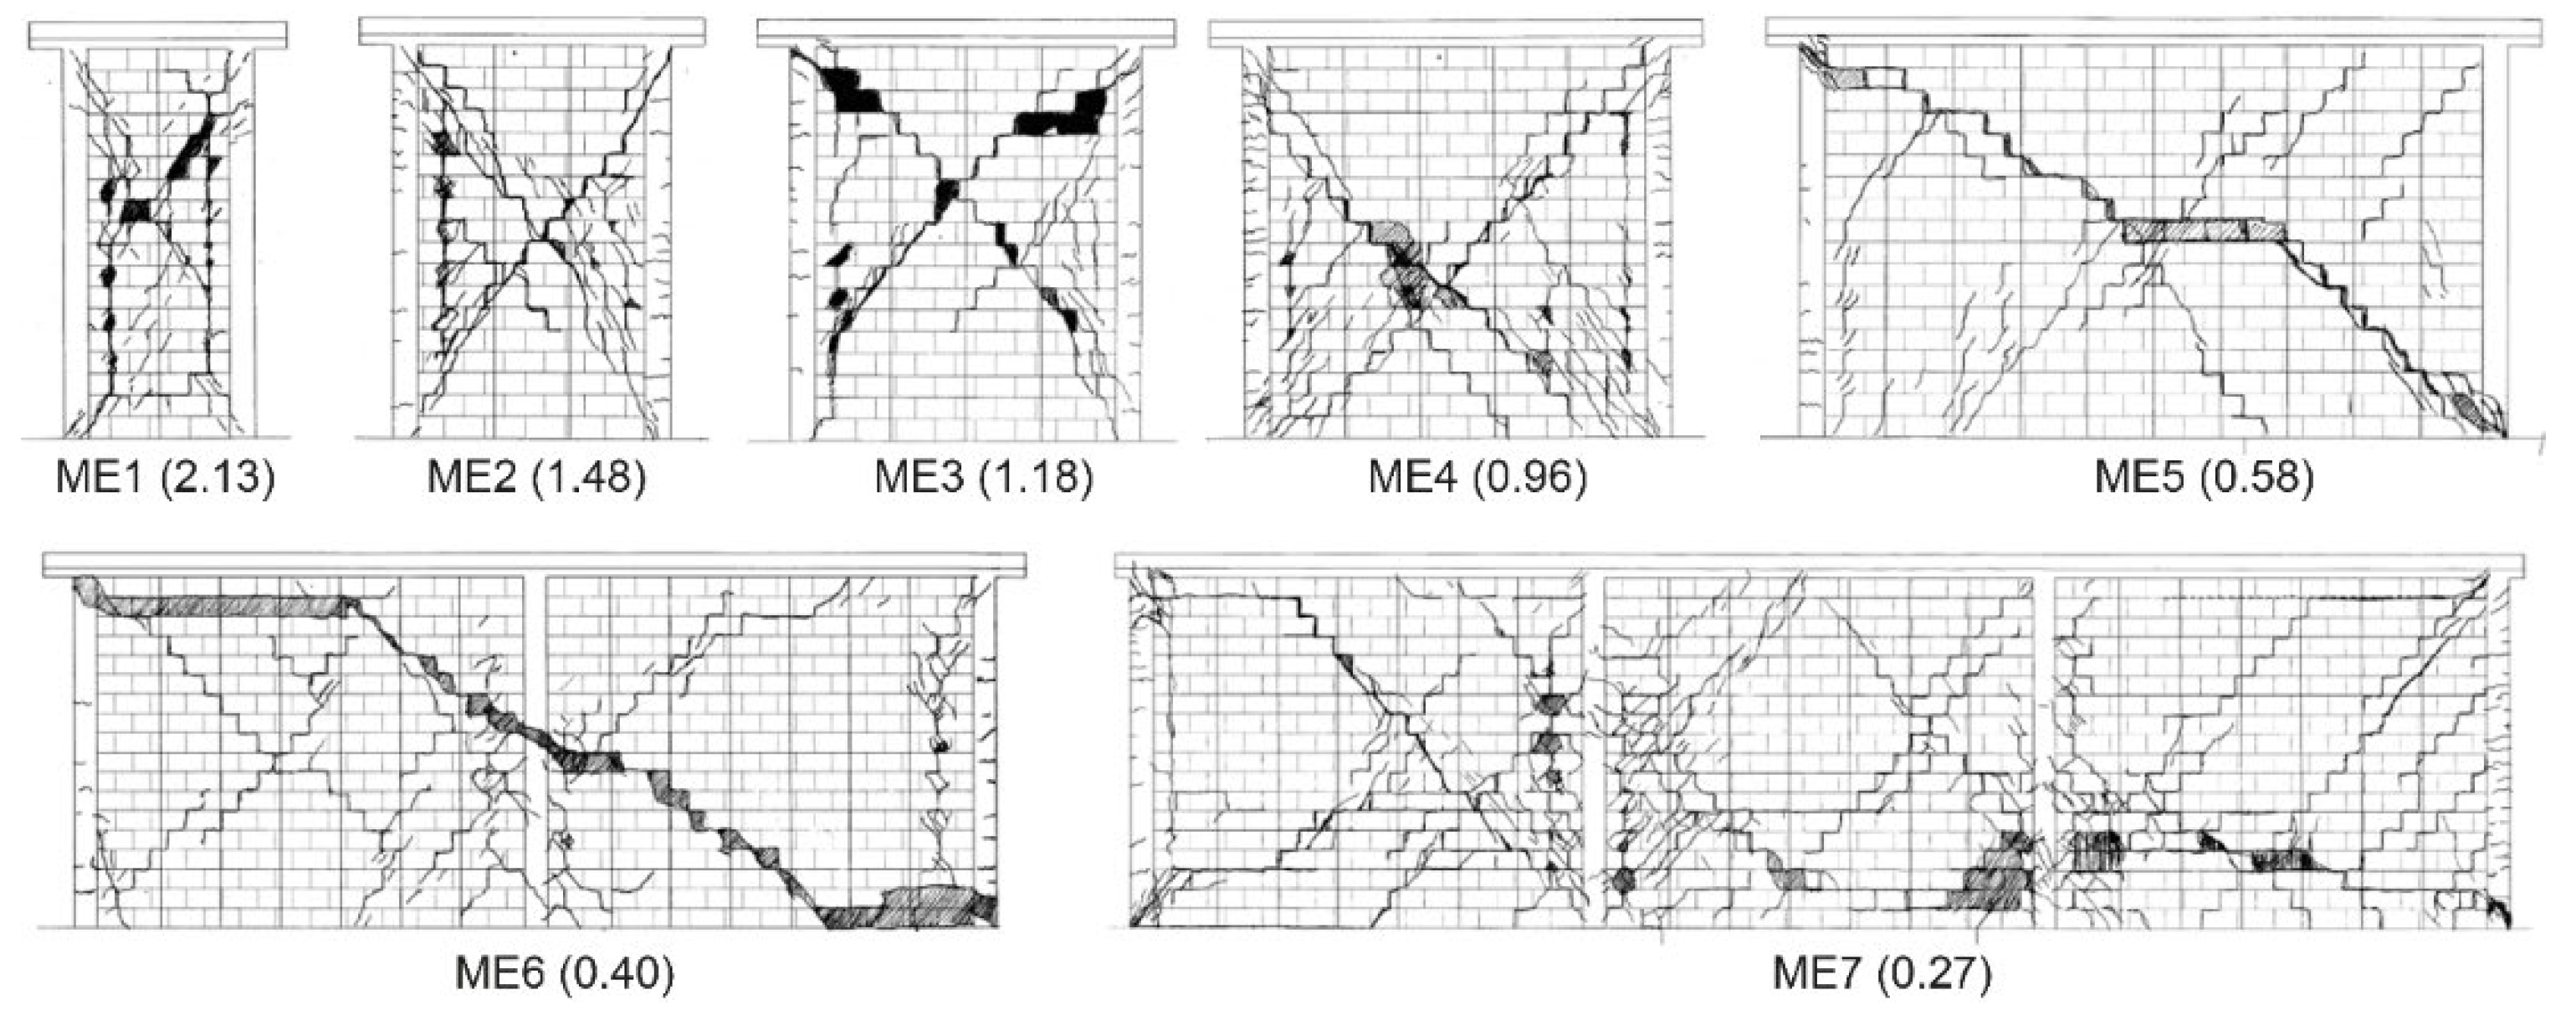
is the axial component discussed later. The experimental results and the proposed formula are plotted in
Figure 4. The CM specimens at the ultimate stage of testing are shown in
Figure 5.
Marquez & Lourenço [
9] also reviewed test data from past research studies and confirmed the effect of aspect ratio on the masonry shear strength, however the effect of wall aspect ratio was considered as an independent term, as opposed to a multiplier to the overall shear strength as proposed for the Mexican code [
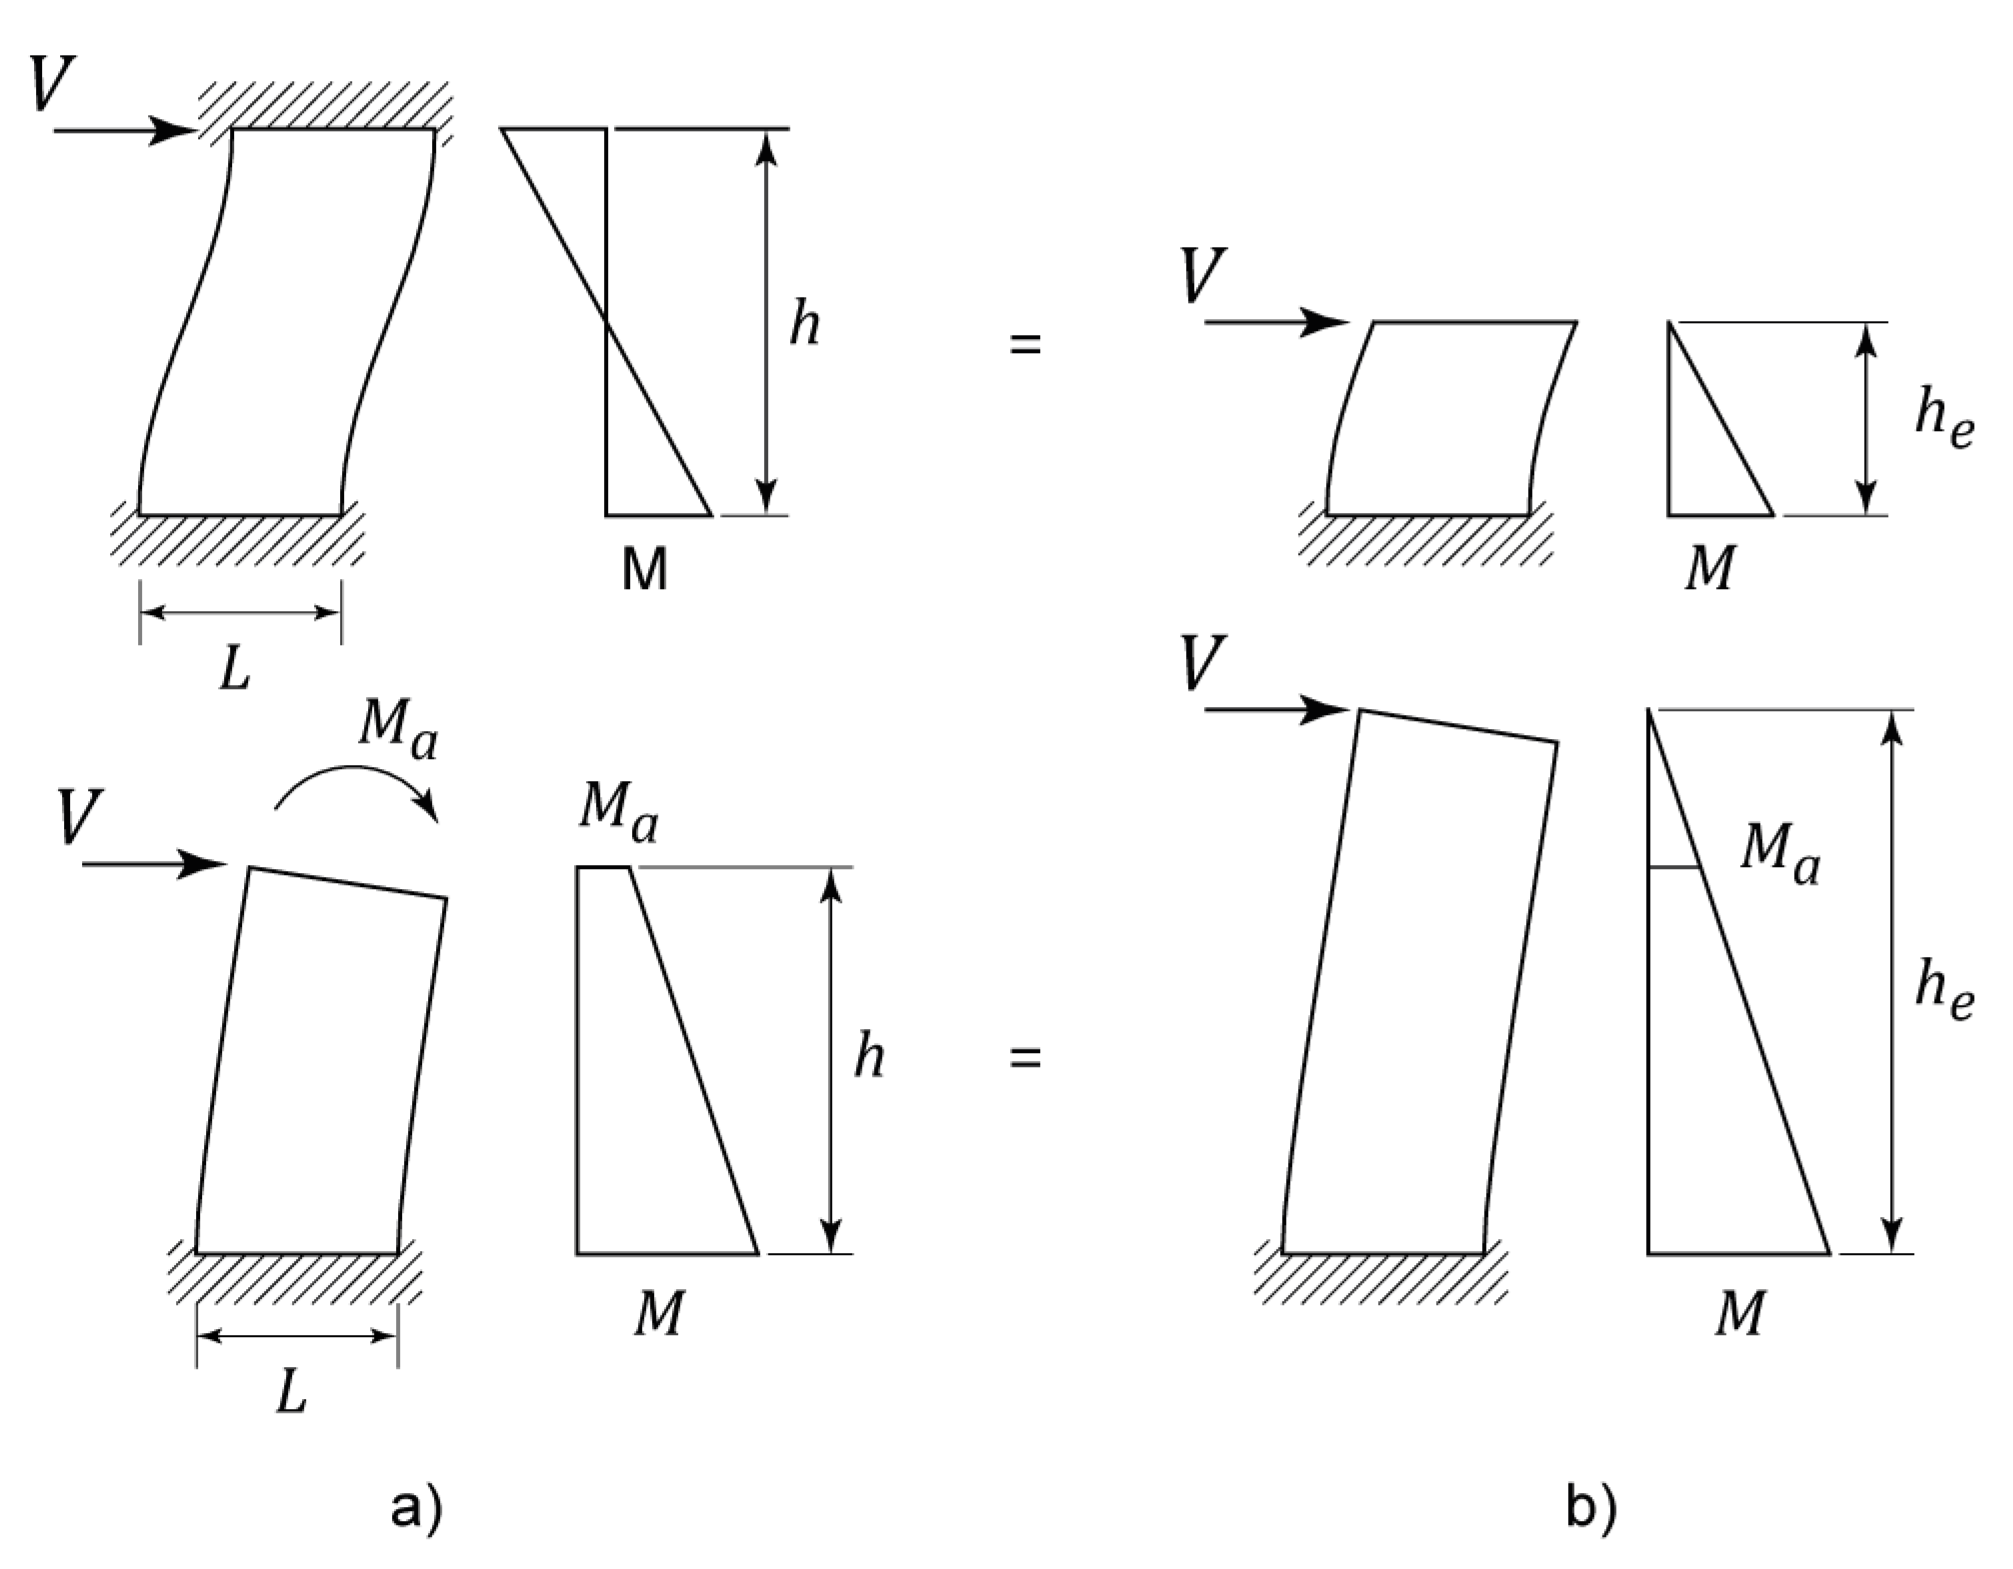
33] and used in reinforced masonry codes. Past research studies have shown that shear span ratio (
) is more useful parameter than the aspect ratio (
), because it is able to account for different boundary conditions when
is considered as the effective wall height, see
Figure 6 [
35]. Note that 𝑉 is the applied shear force, 𝑀 is the bending moment acting at the wall section under consideration (usually located at the base of the wall), and
denotes the wall length.
2.1.3. Shear-Moment Interaction
Boundary (end support) conditions in masonry shear walls may range from a cantilever condition (fixed base and free top), which corresponds to single curvature bending, to fixed-fixed condition (both ends fixed), which corresponds to double curvature bending (see
Figure 6). It appears that the presence of a bending moment at the top causes a decrease in the shear resistance of the masonry wall. Unfortunately, experimental research evidence related to this topic is very limited, at least in the context of CM walls. The Peruvian masonry design code [
69] included a reduction in the shear strength for slender walls (
) due to the moment at the top of the wall, based on the results of a numerical study [
70].
Based on the review of experimental data on 58 CM walls, D'Amore & Decanini [
67] proposed a factor to account for shear-moment interaction as a part of the masonry component for walls with aspect ratio (
). The proposed factor resulted in a decrease in the shear strength due to an increase in the bending moment at the top.
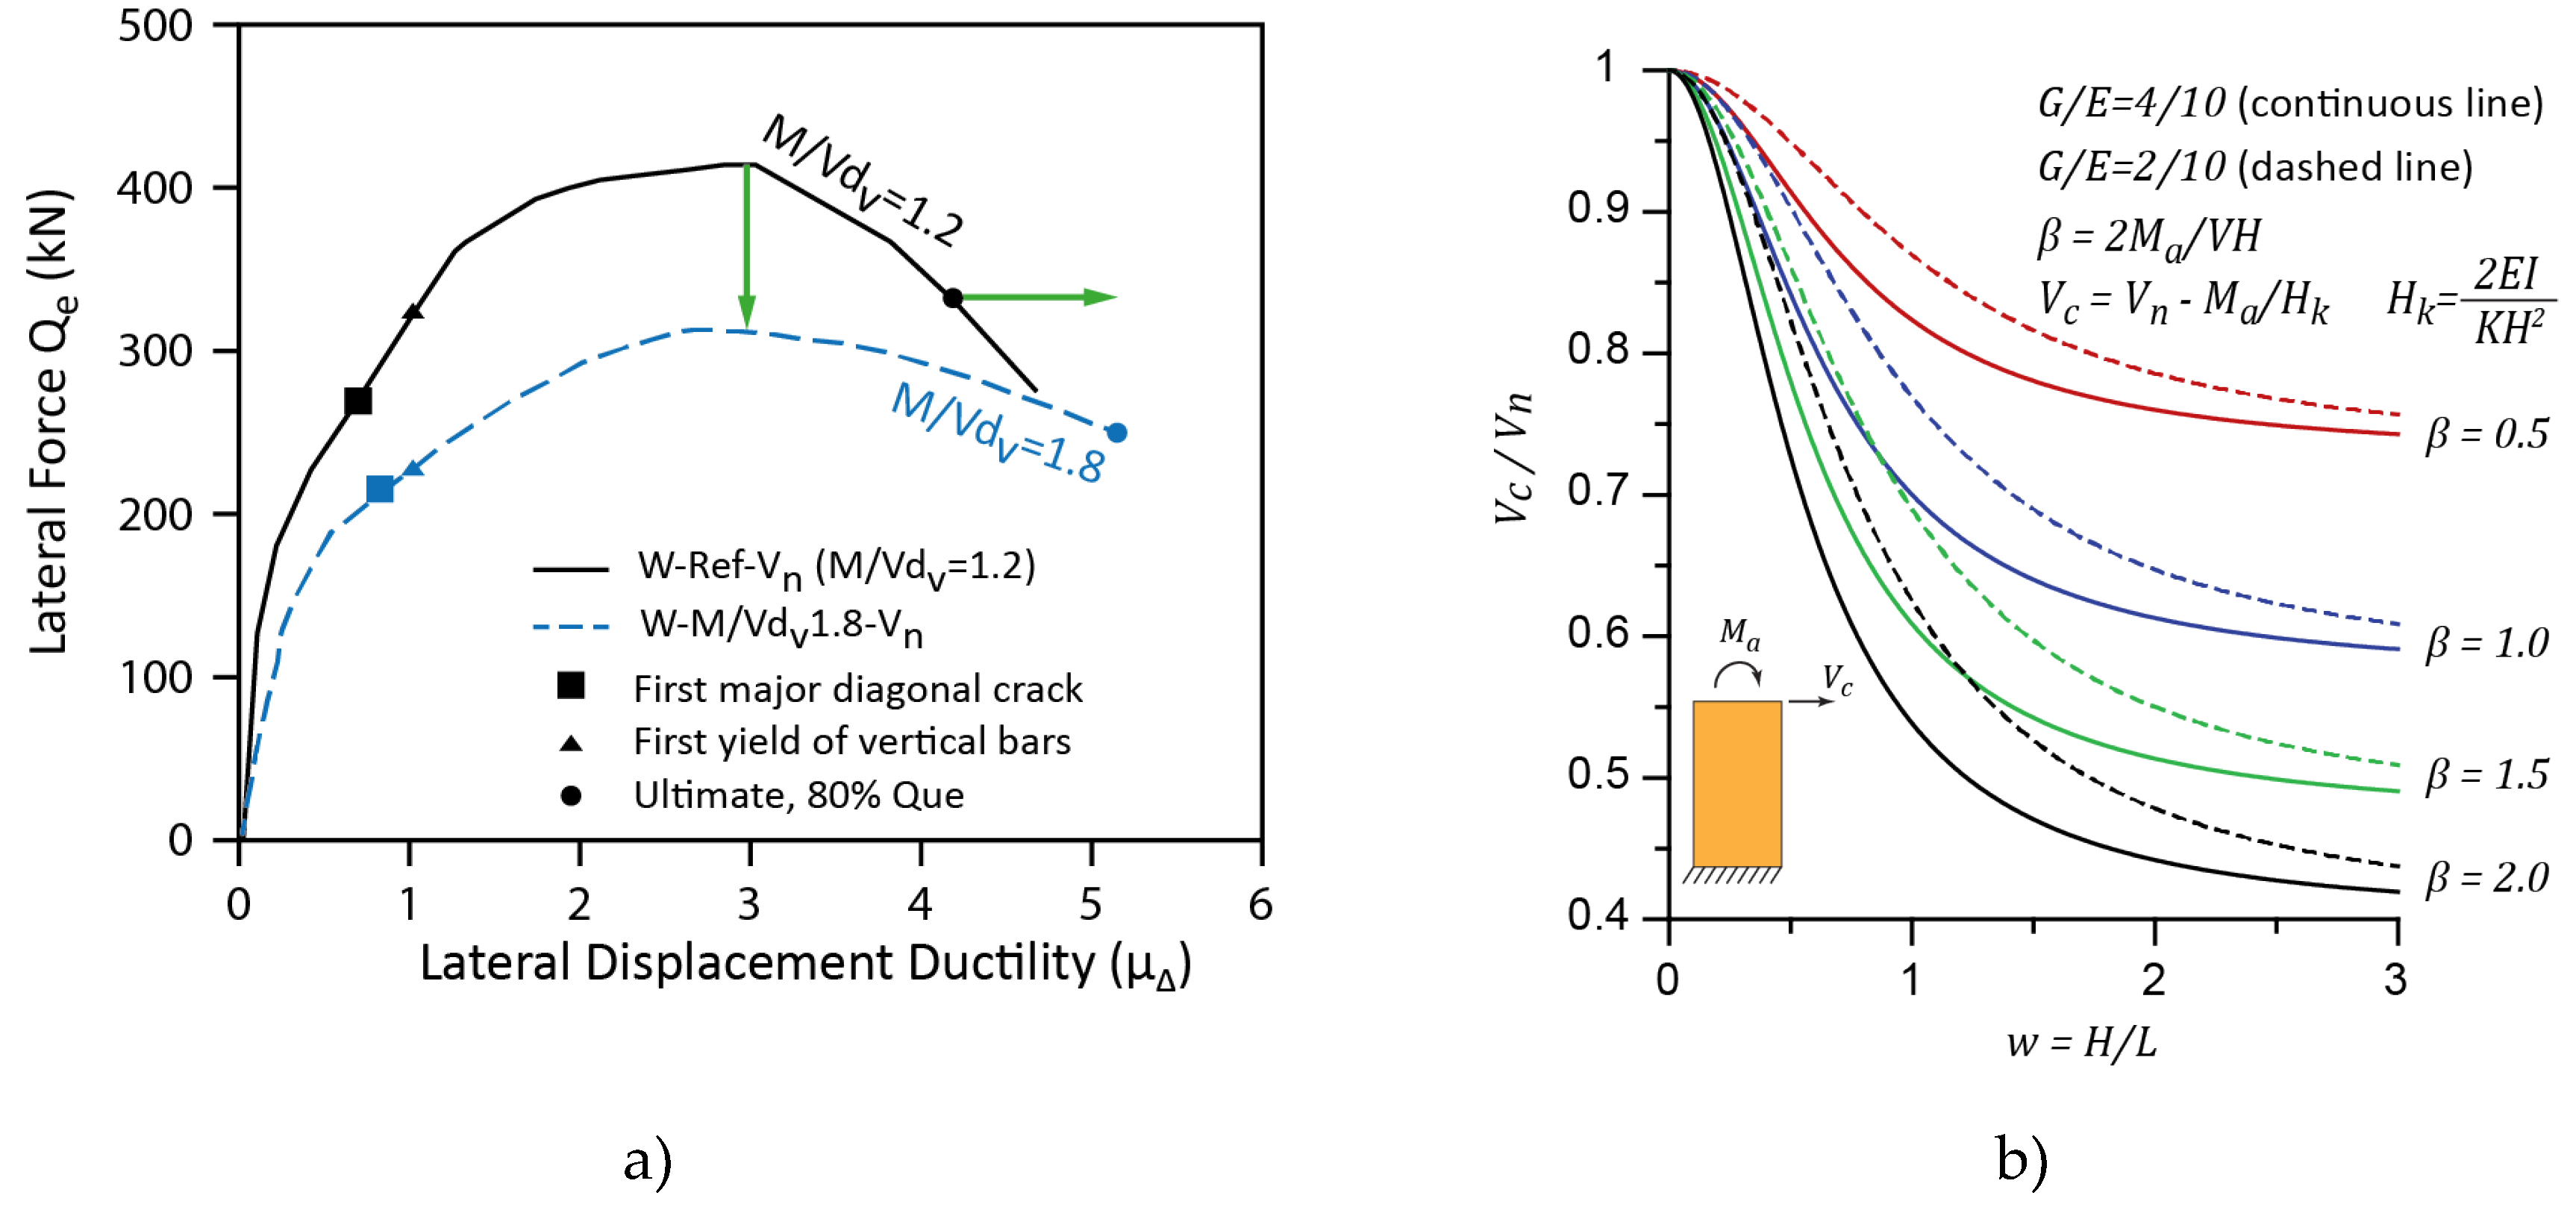
The effect of shear-moment interaction was examined in an experimental study on 5 fully grouted RM walls with (
) [
71]. The results pointed out the effect of
ratio on the shear resistance and ductility of test specimens (
Figure 7a). The specimen with
(corresponding to
, solid line) attained shear capacity which was approximately 25.0% higher than an otherwise identical specimen with
. It was also observed that the specimen with a lower shear capacity demonstrated a somewhat higher ductility.
Pérez Gavilán [
39] proposed an approach for reducing shear strength of CM walls, based on the hypothesis that diagonal cracking occurs when a threshold lateral displacement is attained, regardless of whether lateral displacement is due to lateral force, bending moment, or both. An experimental study on 6 CM wall specimens subjected to reversed horizontal cyclic loading and bending moment at the top was performed to verify the proposed expression. The ratio of the shear resistance with a moment on top of the wall,
, and the shear resistance without moment at the top (cantilever condition),
, is shown on the vertical axis in
Figure 7b, while the wall aspect ratio (
) is shown on the horizontal axis. The key parameter affecting the extent of reduction in shear strength is a normalized moment
(ratio of bending moment at the top of the wall and the moment corresponding to the fixed-fixed condition). Note that
corresponds to the fixed-fixed condition (double curvature bending), while
corresponds to cantilever condition.
Figure 7b shows the results for single curvature bending. The results also somewhat depend on the ratio of moduli of rigidity and elasticity for masonry
, which ranged from 0.2 to 0.4 (see dashed and solid lines on
Figure 7b). It can be seen from the diagram that
ratio rapidly increases when aspect ratio (w) is less than 1.0 (squat walls), hence the effect of shear-moment interaction is insignificant for squat walls. However, a significant decrease in the
values can be observed when w increases from 1.0 to 3.0; this effect is particularly pronounced for higher
values (1.0 to 2.0), which may correspond to walls in multi-storey buildings. The results of another research study [
72] pointed out that shear-moment interaction term may be important for squat walls with aspect ratios in the range from 0.5 to 1.0, based on the analyses of several real-life structures. Slender walls usually are not affected because they typically bend with double curvature.
2.2. The Axial Stress Component
An interaction between compression and shear stresses in masonry walls has been well established [
73]. Low to moderate axial compression enhances shear strength of masonry walls by delaying the onset of cracking in the wall, because axial compression causes a decrease in the magnitude of principal tensile stress. An experimental study on RM wall specimens [
74], showed that only a relatively moderate increase in axial compression stress from 0 to 2.5% of the masonry compression strength
resulted in an increase in the wall shear resistance of more than 20%. It was also observed that RM walls subjected to higher axial compression had a reduced post-cracking deformation capacity, resulting in a more brittle failure mechanism. Based on the statistical analysis of test data on RM shear walls, Anderson and Priestley [
75] recommended the axial stress component of the masonry shear strength to be taken as 25% of the applied axial stress due to self-weight of wall and tributary load from floors and roof; this was incorporated in the Canadian masonry design code CSA S304-14 [
76]. Several research studies on RM shear walls have confirmed a positive effect of axial compression on the masonry shear resistance. In post-cracking stage, axial compression in the wall causes a delay in the initiation of diagonal cracks, controls the crack width, and improves force transfer by means of aggregate interlock mechanism [
74,
77].
According to the New Zealand masonry code (NZS 4230 2004) [
78], which is mostly focused on the design of RM walls, axial compression is transmitted from the top to the base of a RM wall by means of a compression strut inclined under an angle 𝛼 with regards to the wall axis, which depends on the boundary conditions (cantilever/fixed). The horizontal component of the strut force (
) is taken as axial stress component of the wall’s shear resistance.
The axial stress component of the shear strength of a CM wall has been found to have a significant effect on the shear strength of CM walls [
9,
13,
79] and can be presented as follows
Where is an empirical constant, usually in the range from 0.2 to 0.4, but may be taken equal to 0.4, while denotes applied axial stress on the wall.
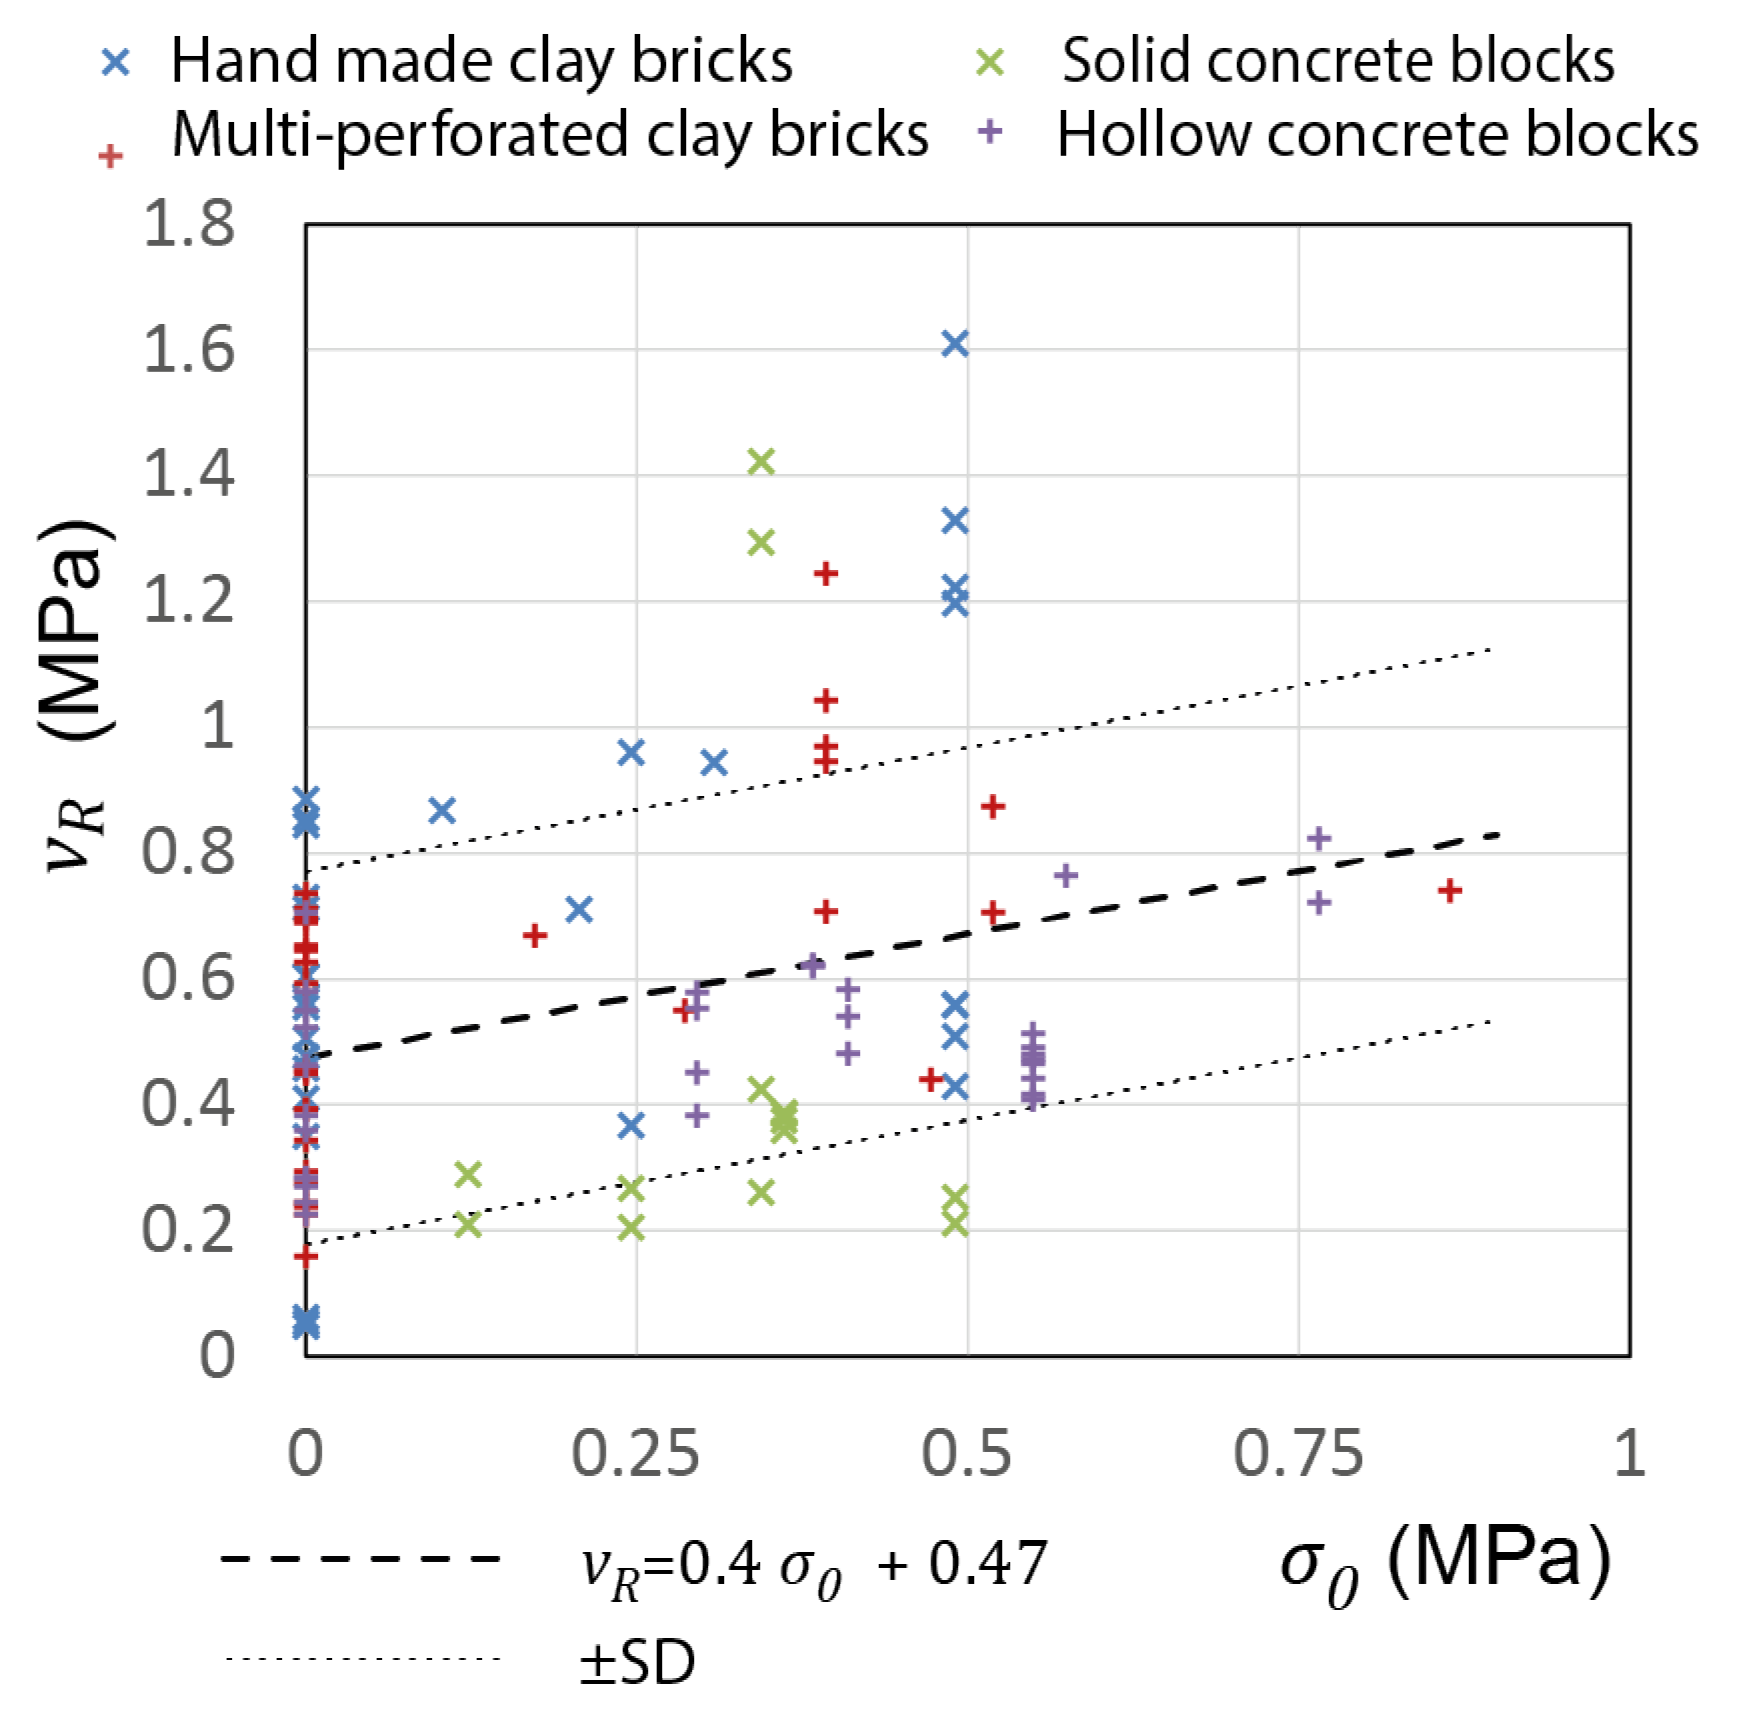
The experimental database [
64] was used to establish a relationship between the CM shear strength
and compressive stress
, as shown in
Figure 8. It should be noted that 105 points were considered; out of these, 48 points corresponded to specimens which were not subjected to axial compression. It was shown that the following linear function
offers the best fit for the given data when
(rounded to 0.40) and
(rounded to 0.47). Note that the independent term
denotes average shear stress resistance of the wall without axial stress.
2.3. Contribution of Horizontal Reinforcement
CM walls may contain horizontal reinforcement, usually in the form of ladder-type wire, known as joint reinforcement (JR), which is anchored into the RC tie-columns. The reinforcement contribution to the shear strength of a CM wall, 𝑣
R, can be presented as follows
Where
is an empirical constant,
is the horizontal reinforcement ratio, and
is the steel yield strength for JR. For RM walls,
value is typically in the range from 0.4 to 0.8 [
76,
78,
80]. It should be noted that in RM walls the main horizontal reinforcement contributing to the shear resistance is in the form of reinforcing bars (similar to those used in reinforced concrete structures), although JR is also provided. In Mexico, ladder-type JR is no longer used, due to evidence showing welding of the cross wires tend to fail. Small diameter high strength bars (
MPa) are used instead.
A few researchers have proposed a mechanical model for predicting the contribution of horizontal reinforcement to CM shear strength [
81,
82]; however, the accepted model is still mostly empirical, that is, based on the experimental evidence [
16,
25,
26,
66,
83,
84,
85].
Contribution of horizontal reinforcement to shear strength of RM and CM walls is determined based on the assumption of a single diagonal crack inclined to a 45° angle with regards to the horizontal axis [
75]. It is considered that horizontal reinforcement is engaged in resisting internal tensile stresses in the wall only after the first crack extends inclined relative to the reinforcement [
84]; this was verified by measuring tensile strains in the JR in an experimental study [
40]. When a CM wall experiences a sliding failure mode, JR is not effective in resisting shear stresses but could enhance its lateral displacement capacity [
49]. A review of the results of past experimental studies on CM walls showed that JR does not seem to increase their ductility [
86].
Matsumura [
66] suggested, for RM, that the contribution of horizontal reinforcement depends on the masonry compression strength
. This was confirmed later for CM in a study in which it was observed that there is an upper limit for the amount of JR —expressed as function of the
— beyond which it is not possible to attain a further strength increase [
40]. A consequence of this result is that walls with a weak masonry (low
) may only have a marginal increase in shear strength due to the use of JR. However, its use may significantly increase their displacement capacity.
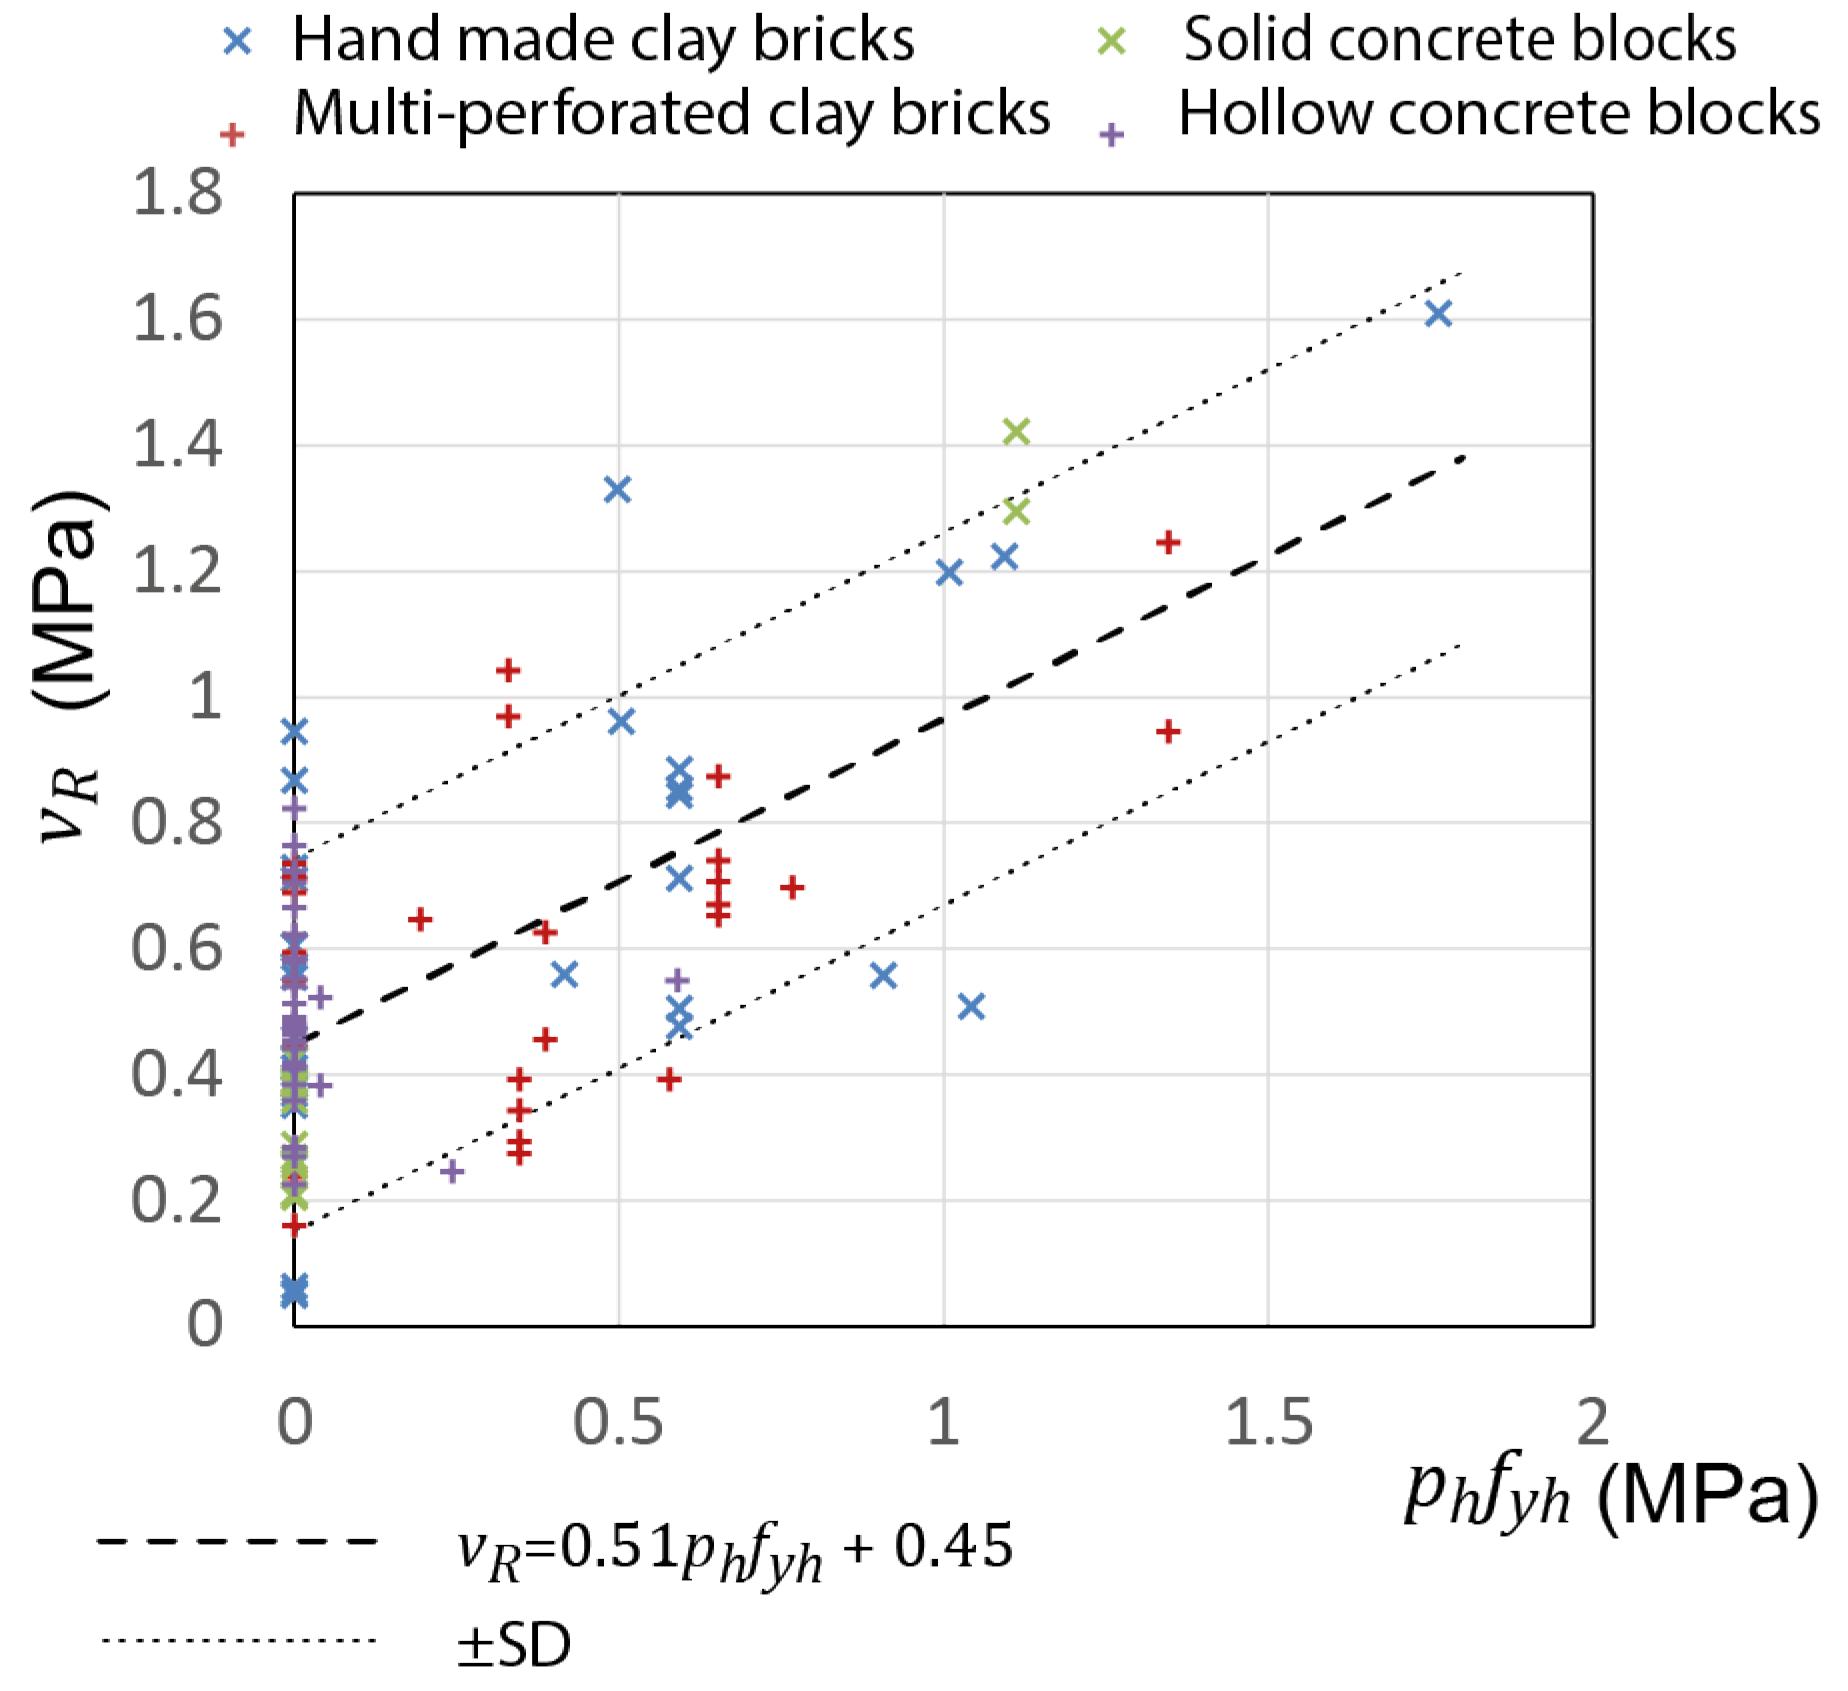
The experimental database [
64] was used to estimate contribution of JR to the steel component of CM shear strength, as shown in
Figure 9. It should be noted that 105 points in total were considered in the statistical analysis; out of these, 69 points correspond to specimens without JR.
It was shown that the following linear function.
provided the best fit, with
(rounded to 0.51) and
(rounded to 0.45), so that a reasonable value for 𝑒 in eq. (10) could be 0.5.
2.4. The Effect of RC Tie-Columns
RC tie-columns are important components of CM walls, which influence their in-plane shear strength and displacement capacity. Research studies have shown that the tie-columns prevent wall disintegration and provide additional shear capacity in the post-cracking stage. Based on statistical analysis of experimental test data, several researchers concluded that longitudinal reinforcement in tie-columns has a significant effect on the CM shear resistance [
24,
79,
87,
88]. Marques & Lourenço [
9] also analysed significant number of test data and did not establish a significant relation between the tie-column longitudinal reinforcement and the shear resistance of CM walls.
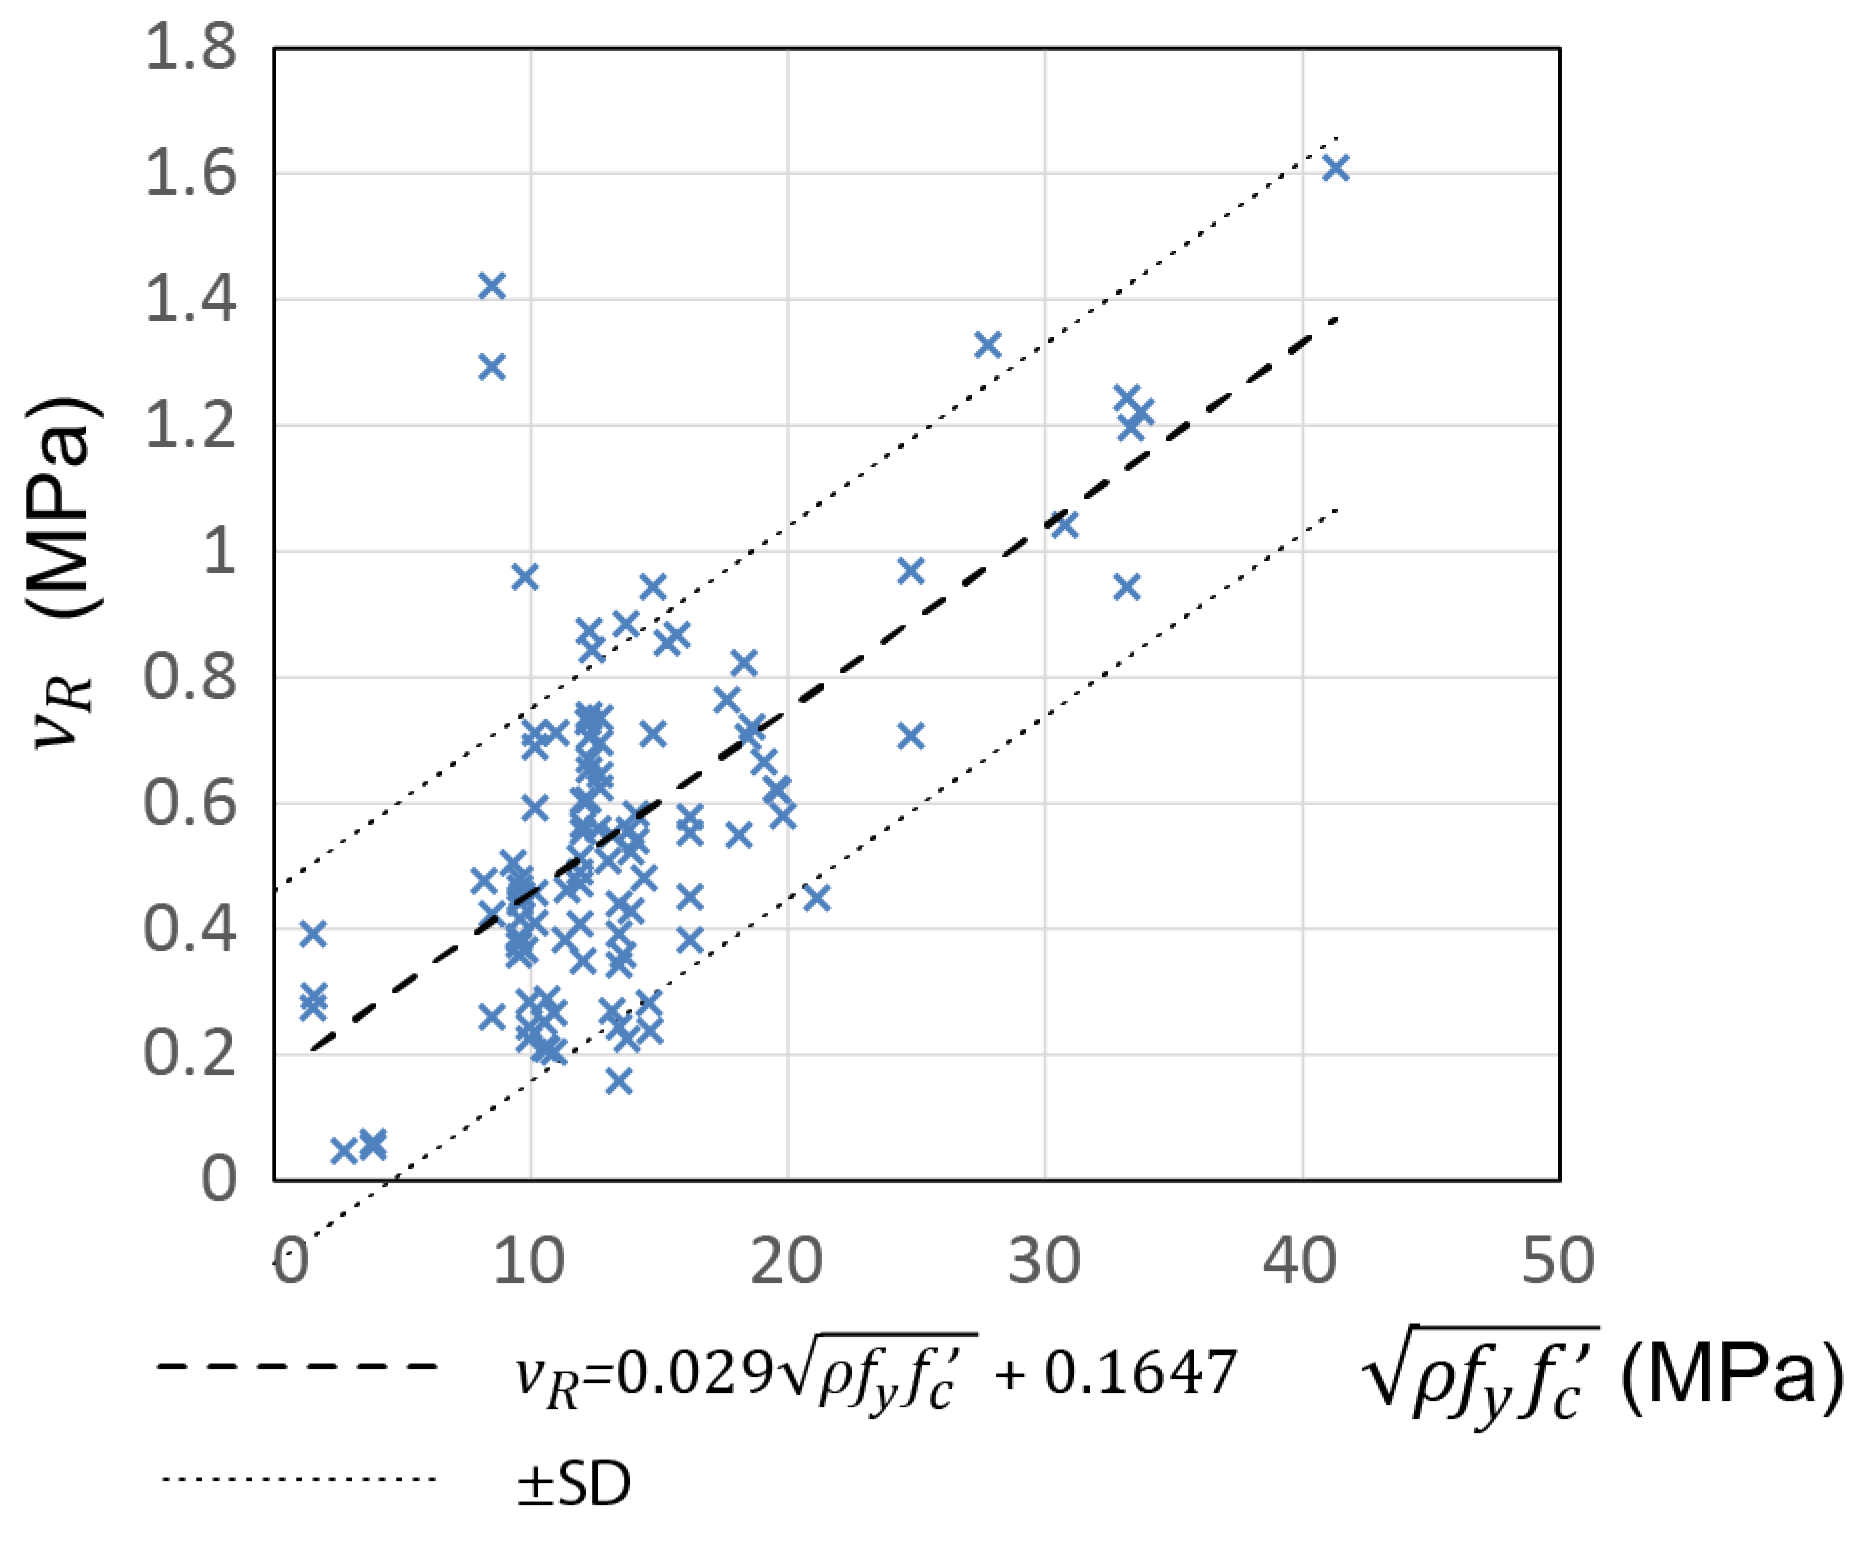
The main design parameters for RC tie-columns are longitudinal reinforcement ratio
, steel yield strength
, and concrete compressive strength
. Using the same parameter (
) as Riahi, Elwood & Alcocer [
79], the following linear model was fitted to predict the shear strength of CM walls based on the available data:
The regression analysis shows that
and
offer the best fit. A chart presenting the test data and the fitted model is shown in
Figure 10. The diagram shows a significant contribution of the longitudinal reinforcement in RC tie-columns to the shear strength of CM walls.
2.5. Multivariate Model
A multivariate linear model was created to identify the statistical significance of the key variables, and their corresponding coefficients, including
,
,
,
and
. The products
and
were initially also considered, because the factor
depends on the
ratio and is usually applied when the masonry strength,
, and axial stress,
, components are considered together; however, those variables were omitted because their influence was very small. The multivariate analysis, carried out using the STATA statistical analysis program, resulted in the following model:
The results are presented in
Table 1, showing the coefficients for each variable, the Pearson significance 𝑃 which indicates that the variable is statistically significant when 𝑃 < 0.05, and 95% Confidence Interval.
It can be seen from the table that the correlation coefficient is , which indicates a satisfactory prediction, and that all variables are statistically significant. A negative 𝑐 value indicates that the shear strength decreases with aspect ratio. The same model, as described in eq. (12), was developed using instead of , which resulted in a coefficient and the . It can be concluded that is a better predictor of shear strength, , than .
2.6. Lateral Displacement/Drift Capacity
CM walls, when subjected to in-plane lateral loads, usually demonstrate a shear-dominant behaviour; this can be attributed to relatively low aspect ratio, absence of horizontal reinforcement, and design approach which does not require the development of a flexural failure mechanism. It is well established that a shear-dominant failure mechanism is force-controlled and is characterized by a limited lateral displacement/drift capacity. However, RM shear walls with shear-dominant behaviour have demonstrated a significant displacement/drift capacity beyond the cracking stage, as shown by past experimental studies [
74,
84,
89]; this can be partially attributed to the presence of horizontal reinforcement in these walls.
Perez Gavilan [
86] reviewed the results of 5 experimental studies from Mexico on 26 full-size CM wall specimens subjected to reversed cyclic loading [
26,
35,
40,
41,
90]. The specimens were constructed using different types of masonry units, including solid clay bricks, multi-perforated clay blocks, and hollow concrete blocks. Majority of specimens were reinforced with horizontal joint reinforcement according to the Mexican masonry code requirements [
32]. Lateral drift ratios were determined for each specimen at the following critical stages (see
Figure 1): the onset of cracking, peak shear capacity (
), and the ultimate drift capacity (
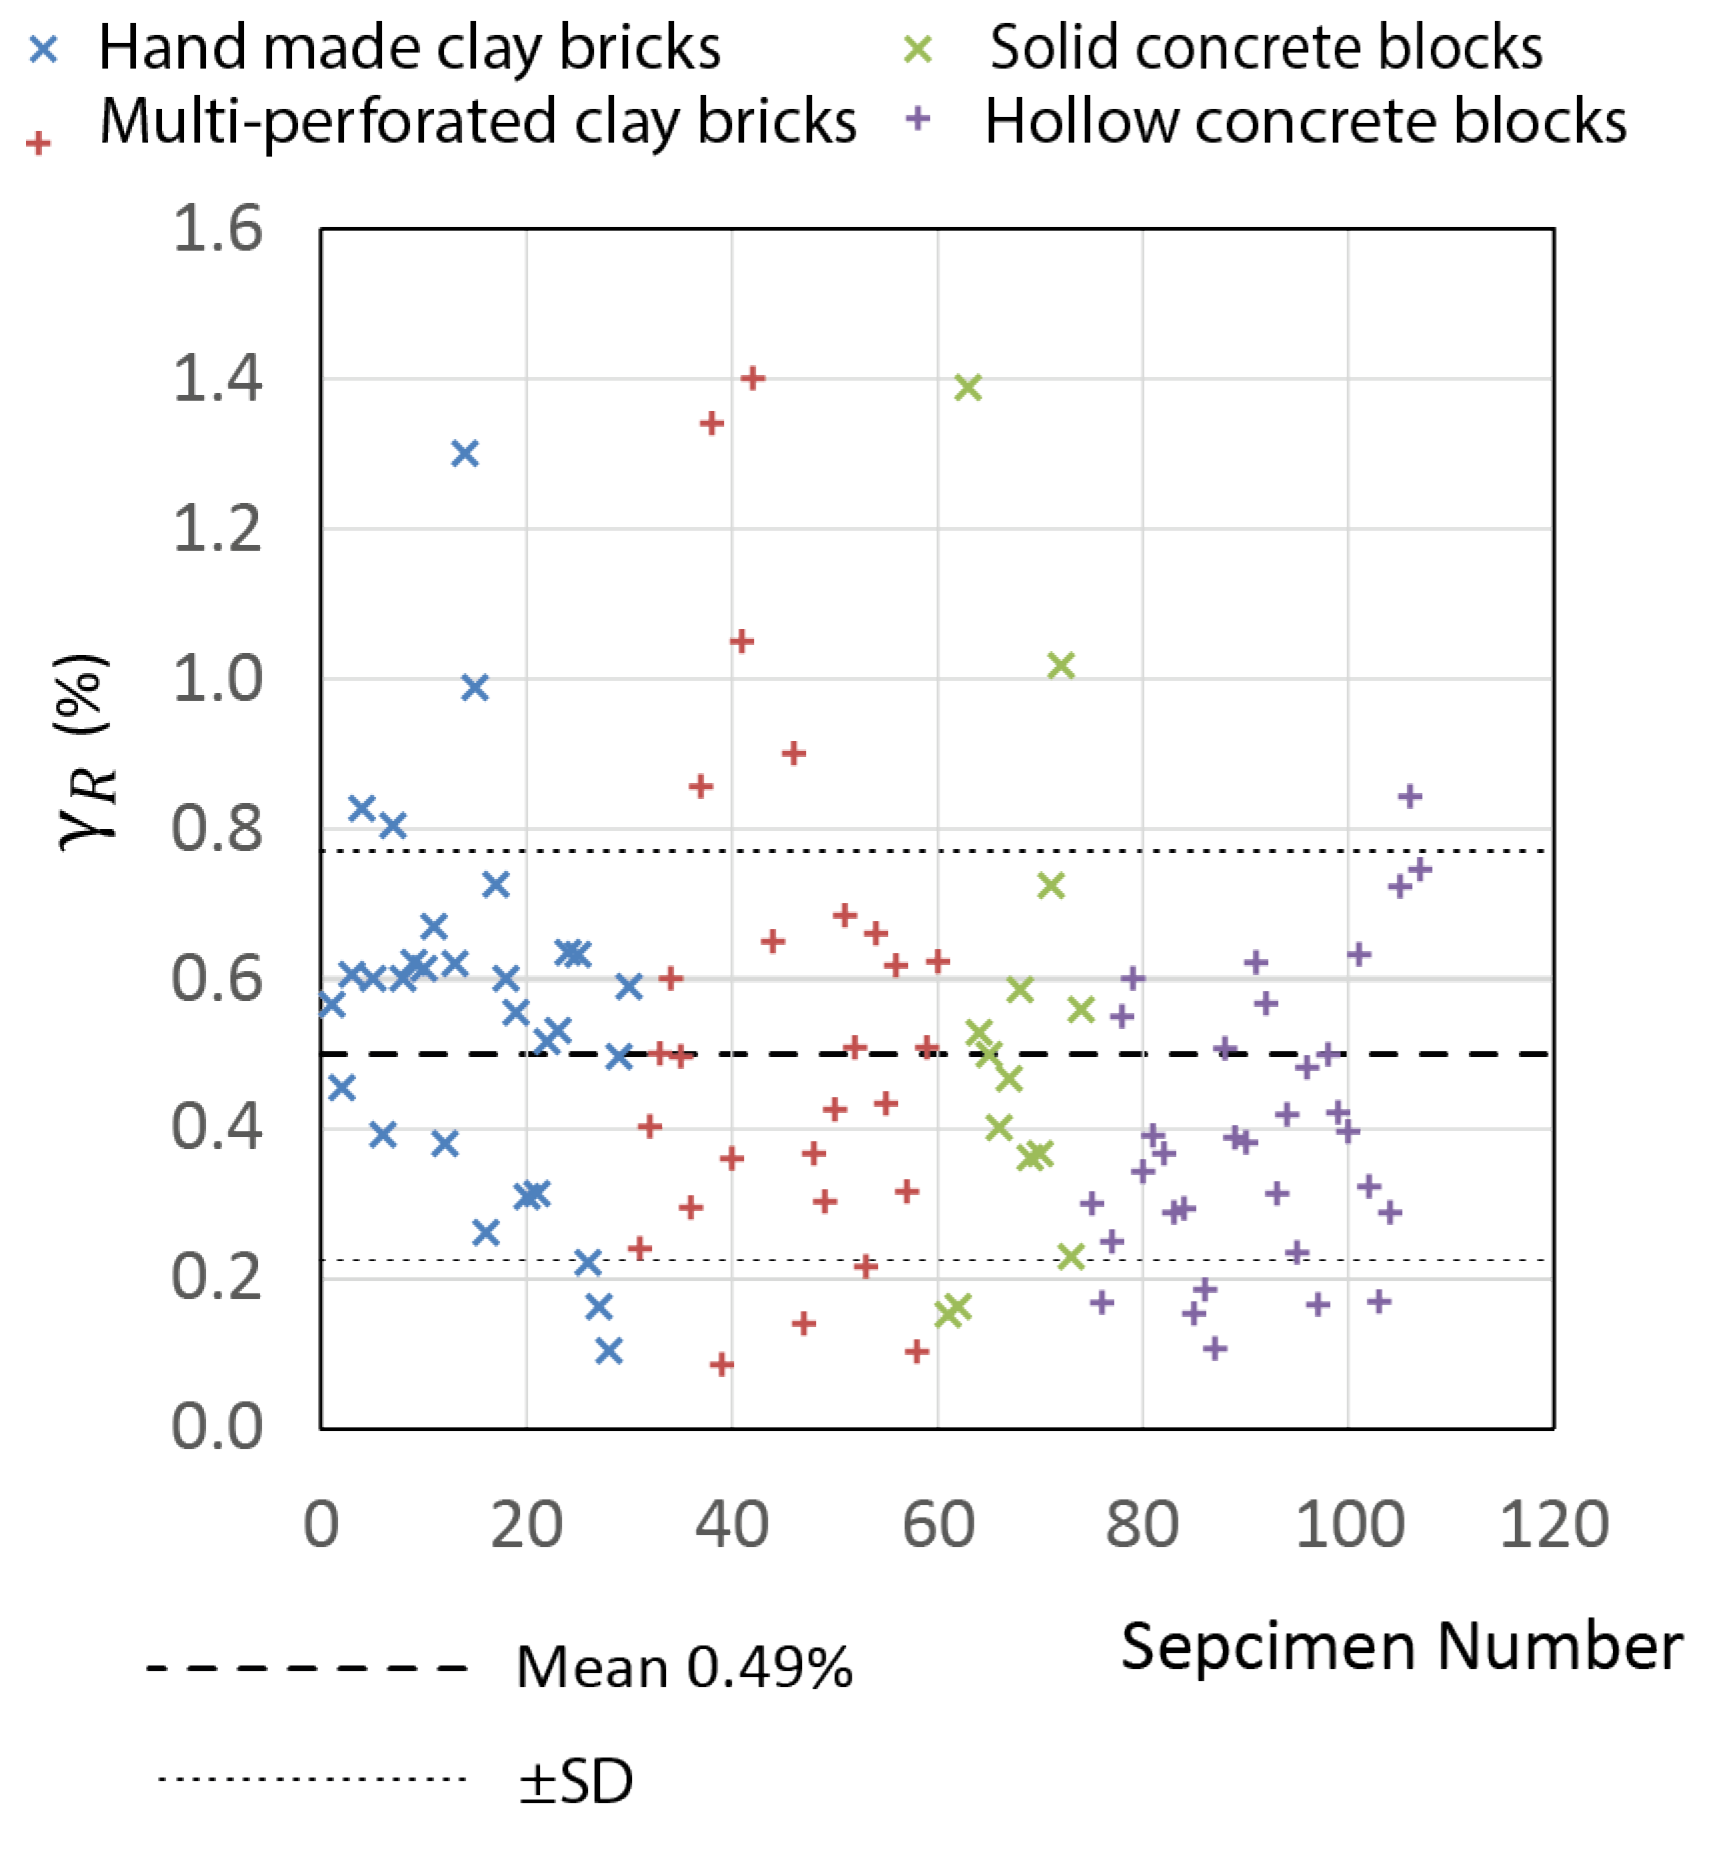
) at failure, which corresponds to the force at 80% of the peak capacity. The drift ratios at the peak shear capacity (
) varied from 0.24 to 1.0%, while the maximum drift capacity (
) ranged from 0.40 to 2.06%. The study showed that the drift capacity was significantly influenced by the presence of horizontal reinforcement, and the type of masonry unit - specimens constructed using hollow masonry units demonstrated lower displacement capacity compared to other specimens.
Figure 11 shows the drift ratios at peak strength (
) for the specimens from the experimental database [
64], with the mean drift capacity of 0.49%.
Several authors proposed a reduction in the masonry shear strength based on the ductility demand for RM shear walls [
75,
91]. Note that RM shear walls are usually designed to achieve a flexural failure mechanism, in which a plastic hinge develops at the base of the wall. In that scenario, widening of the flexural-shear cracks occurs after a few loading cycles that reduce the shear resistance due to aggregate interlocking, and consequently decrease the wall’s shear strength. This phenomenon was reflected in the conceptual model for concrete shear strength proposed by the Applied Technology Council [
92]. This mechanism, however, is not representative of CM walls. Although the CM walls may attain high ductility [
86], these walls still experience a shear failure. Riahi, Elwood & Alcocer [
79] observed an inverse relationship between the ductility and peak shear strength in CM walls, however it depends mainly on the material type.
3. Behaviour of CM Walls Subjected to Combined Axial Compression and in-Plane Flexure
CM walls subjected to combined axial and in-plane lateral loading usually do not develop a flexural failure mechanism, because diagonal tension shear mechanism described in the previous section is most prevalent. Design of CM walls for flexure under seismic conditions is different from that applied to reinforced masonry shear walls, which are explicitly designed to experience flexural failure according to the Capacity Design approach, e.g. in the USA, Canada, and New Zealand [
78], while flexural behaviour of these walls has been extensively investigated in these countries through research studies [
75,
93,
94]. Flexural strength of CM shear walls can be estimated based on the flexure theory assumptions related to plane deformation of a wall horizontal section, and an equivalent rectangular stress block simulating distribution of compression stresses. This section discusses behaviour of CM walls subjected to the combined axial load and flexure, based on the evidence from experimental studies and the approaches for estimating their strength for design purposes.
3.1. Experimental Research Studies
Yielding of longitudinal reinforcement and concrete crushing at the base of the tie-columns are characteristic for flexure-dominant behaviour of CM walls. In slender walls (with aspect ratio of 1.0 or higher) vertical cracks developed close to the interface between the masonry panel and adjacent RC tie-columns (
Figure 12a) [
95]. The cracks were due to the bond pattern used and non-uniform vertical deformation of the wall. Vertical cracks in slender walls were also reported in [
35] (see damage patterns for specimens ME1 and ME 2, Fig 5). The specimens attained high displacement ductility levels, ranging from 5.65 to 10.45 (ductility was determined according to [
96]). It was observed that the flexural strength increased with an increase in the axial stress level, as expected.
Yoshimura et al. [
97] identified the separation of RC tie-columns from the masonry panel as the cause of early failure of CM walls subjected to intense earthquakes (
Figure 12b). They conducted an experimental program to investigate the performance of walls with two types of reinforcement aimed at preventing the separation of tie-columns from masonry panels. The program included 28 full-size wall specimens; out of these, eight specimens had U-shaped steel reinforcing bars (dowels) extending from the wall into the tie-columns, another eight had straight horizontal dowels, while the remaining specimens did not have any reinforcement. The boundary conditions were fixed-fixed (causing bending in double-curvature) and cantilever (single-curvature bending). In addition, the specimens were subjected to two different axial load levels.
The researchers classified failure modes into flexural failure, diagonal tension shear failure, and combined shear and flexural failure. Out of 28 specimens, 13 specimens were designed to experience a flexural failure, however only five test specimens failed in pure flexure, one experienced a combined shear and flexural failure, two experienced a flexure-sliding failure, while four specimens failed in shear. They expected the flexure-shear mode of failure for two specimens but these walls experienced a shear failure. In contrast, the researchers predicted that 13 specimens should experience a shear failure, but 10 specimens experienced shear failure, while the remaining specimens experienced a flexure-sliding failure. It should be noted that the design was performed according to the Japanese masonry code.
All the walls with cantilever boundary conditions initially showed flexural behaviour, but ultimately experienced either a sliding or a shear failure. Unreinforced CM walls with fixed-fixed boundary conditions and without dowels at the tie-column to masonry panel interface did not experience separation of RC tie-columns from the masonry panel, but the specimens with cantilever boundary conditions and without dowels showed the signs of separation. The study showed that the dowels (U-shaped or straight bars) were effective in preventing separation of tie-columns from the masonry panels.
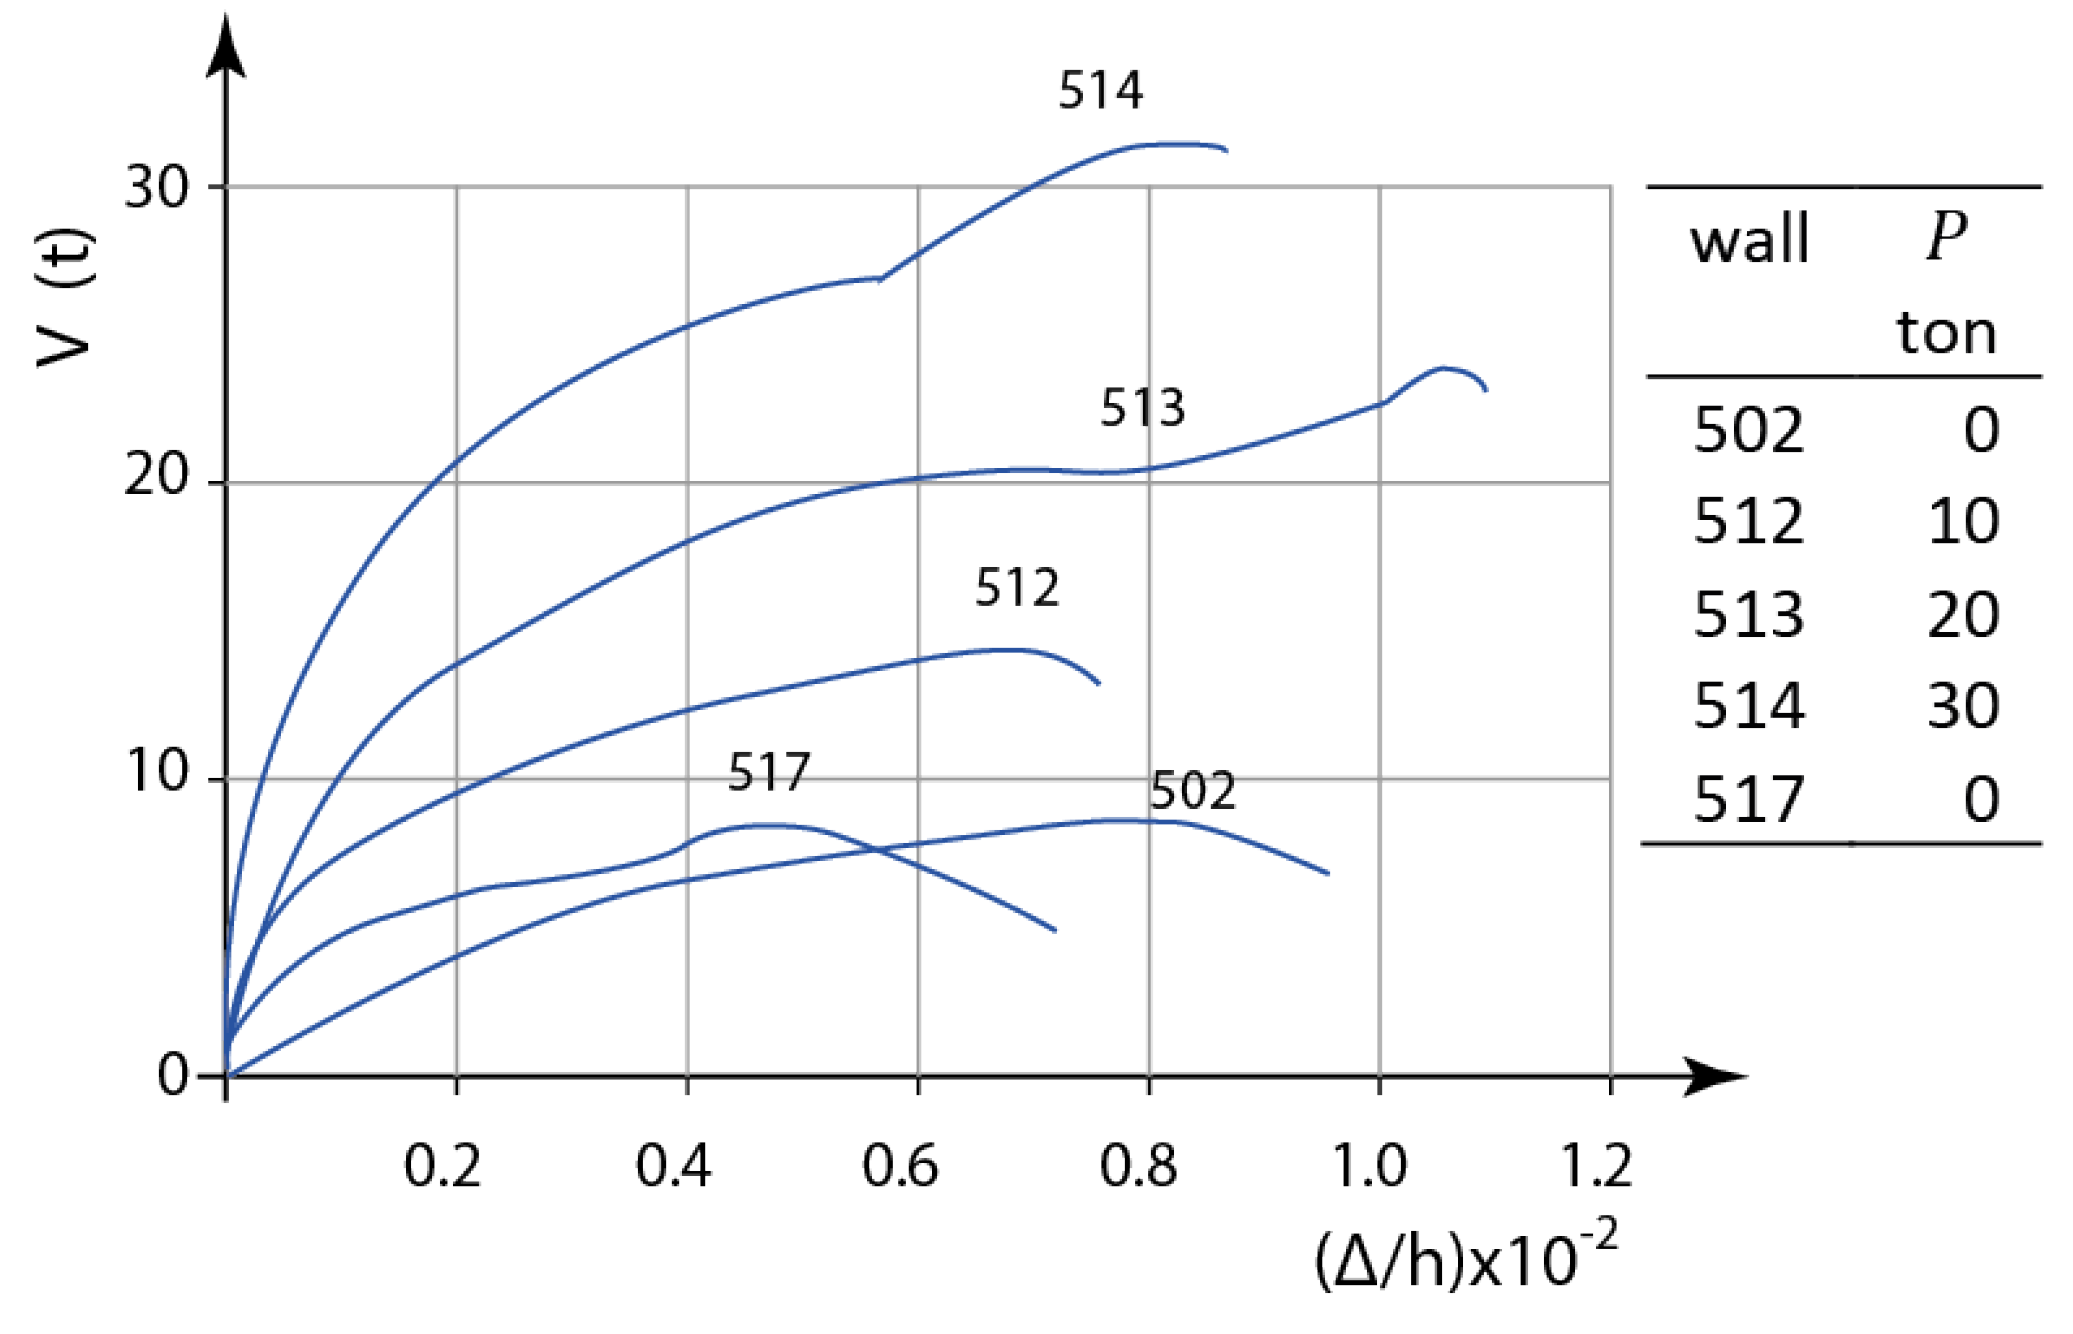
Meli and Salgado [
13] carried out one of the first experimental studies on the behaviour of CM walls subjected to lateral loading. The study included 46 CM specimens subjected to monotonic static loading; out of these, 5 specimens experienced a flexural failure (#502, #512, #513, #514, and #517). All walls had a cantilever boundary condition, but were subjected to different applied axial compression levels. The specimen dimensions (length x width) were 2 x 2 m and hollow concrete blocks were used for the construction. RC tie-columns were in the form of two
9.5 mm longitudinal reinforcement bars, made of steel with 420 MPa nominal yield strength. Relatively low reinforcement ratio for longitudinal reinforcement in tie-columns is most likely responsible for the flexure-dominant behaviour and failure in these walls. Experimental results, in the form of lateral force versus drift ratio, are presented in
Figure 13. It can be seen from the chart that the specimens subjected to higher axial load (e.g., #513 and #514) demonstrated higher shear capacity compared to the specimens with lower axial stress levels (e.g. specimens #502 and #517).
Two research studies involved shaking table tests on CM building models with the walls designed to experience flexural failure [
54,
98]. San Bartolome
et al. [
54] tested a three-storey, half-scale CM building model which experienced flexural cracking at the base of the walls, due to yielding of vertical reinforcement in tie-columns, until ultimately the walls experienced a shear failure. Bustos et al [
98] tested a two-storey, half-scale CM building model. The response was initially characterized by flexural cracking at the base of tie-columns, followed by sliding cracks in the lower portion of the walls at the first storey level, but the model ultimately experienced a flexural failure mechanism.
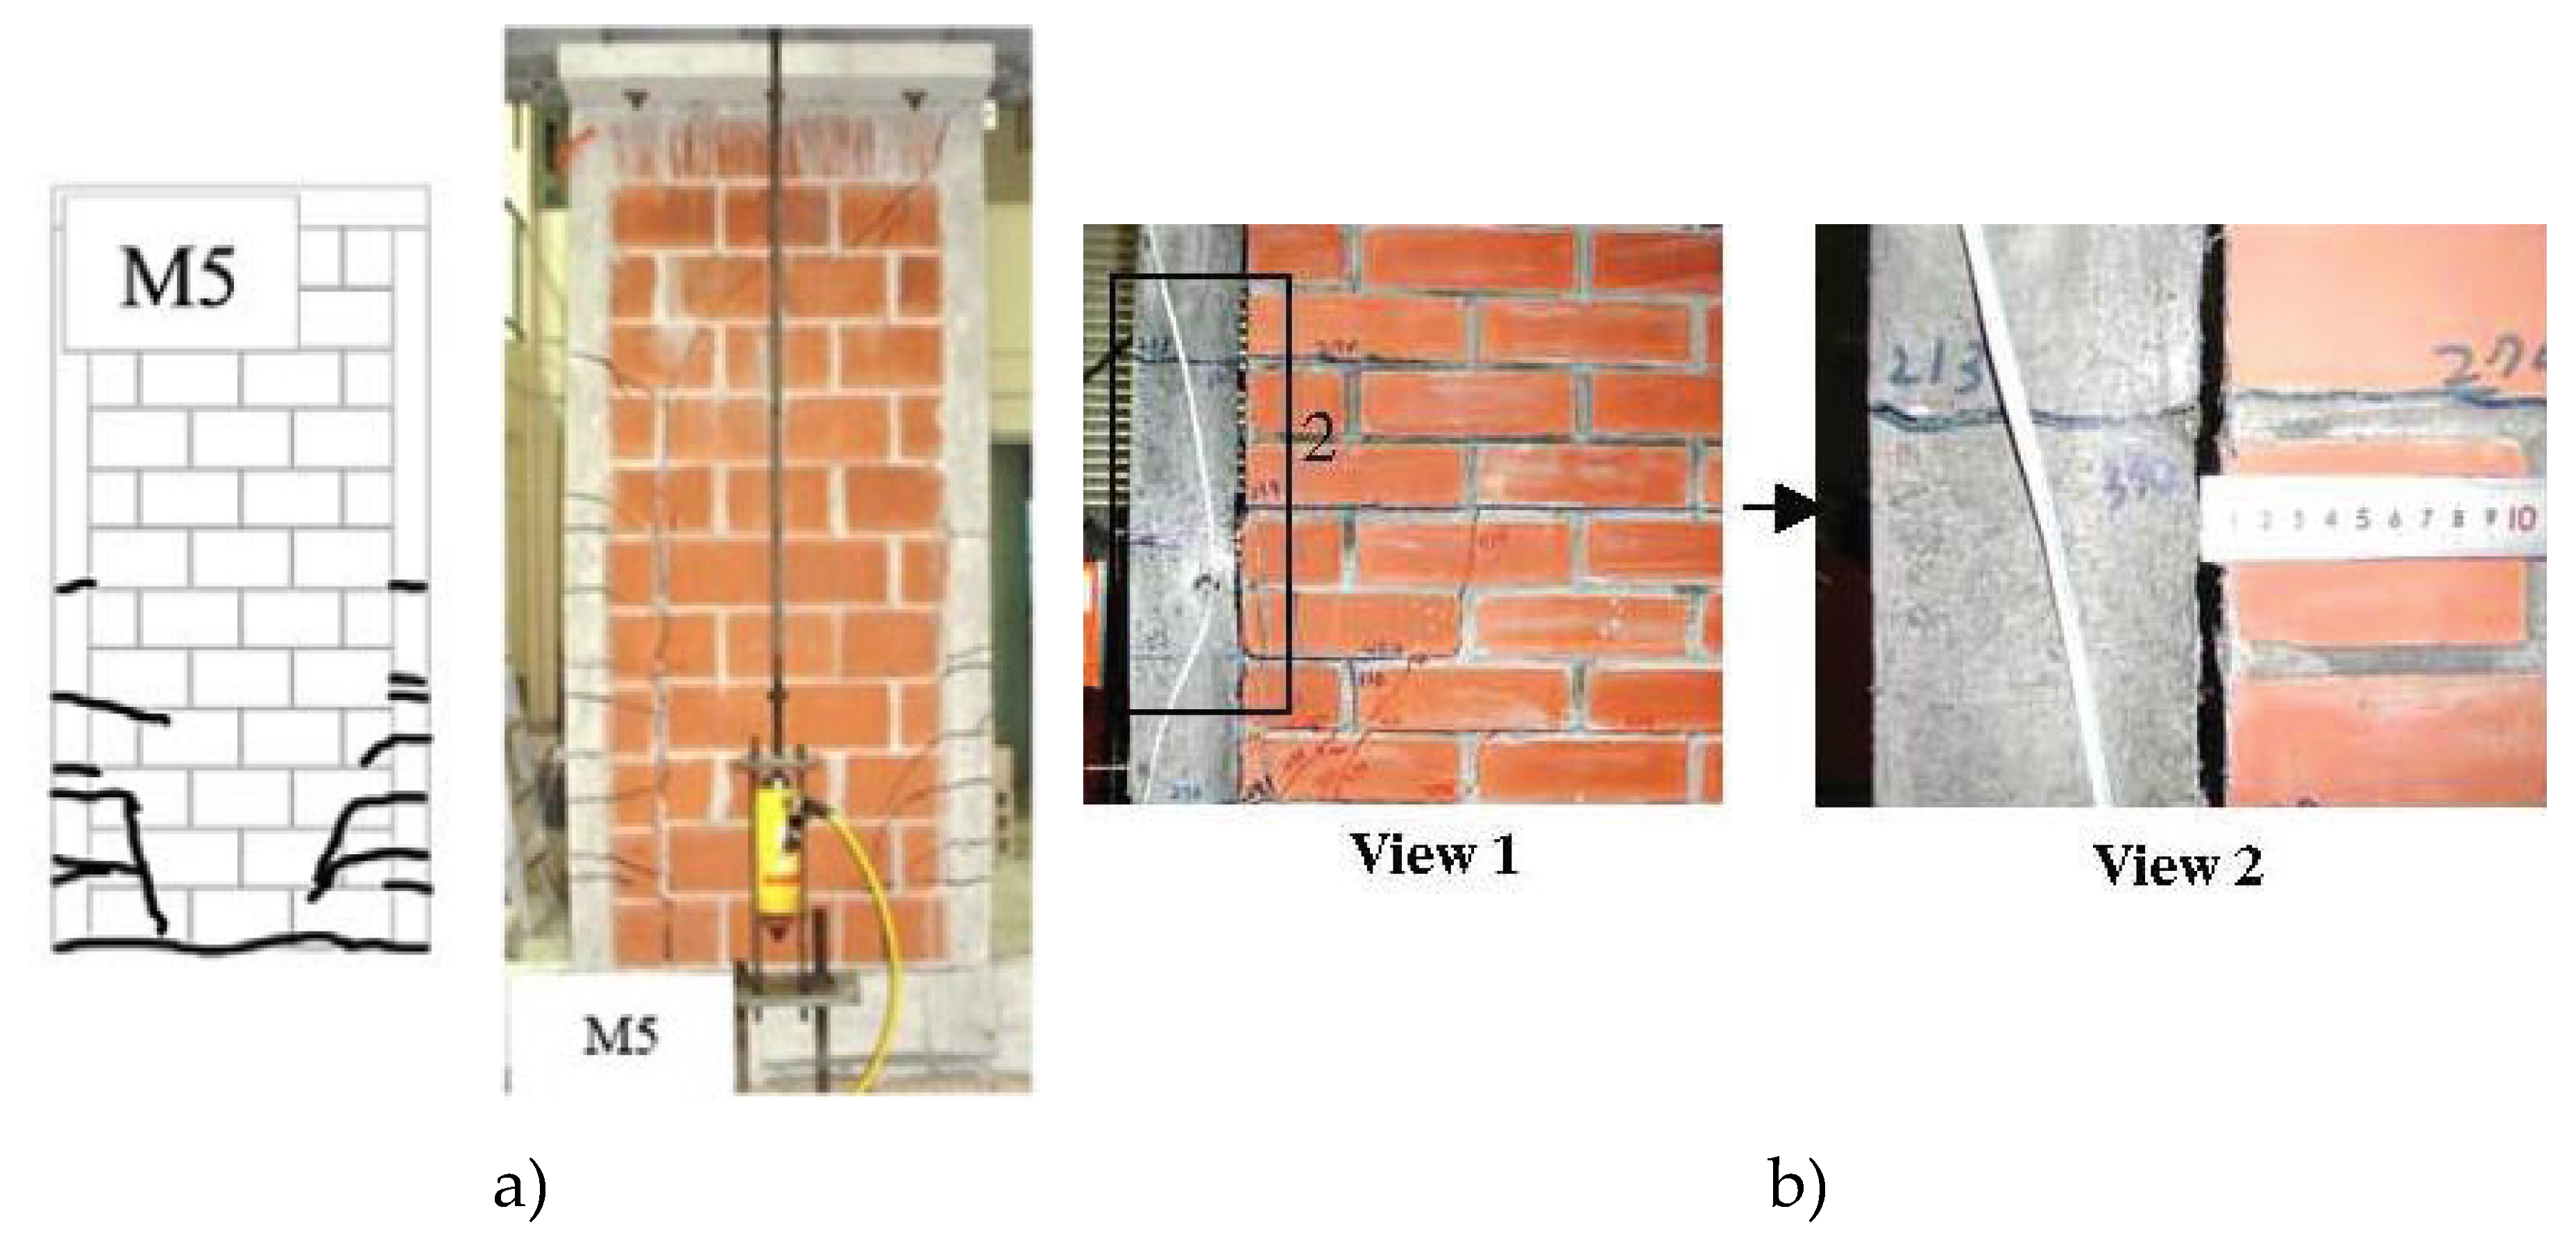
Varela-Rivera et al. [
99] tested seven CM walls made of autoclaved aerated concrete (AAC) units. Three specimens (M5 to M7) were designed to experience flexural behaviour. The walls had an aspect ratio of 2.26 and different axial stresses: 0.24, 0.47 and 0.71 MPa, used as the main variable. The performance of these walls was characterized by yielding of the longitudinal reinforcement, appearance of horizontal cracks near the base, and inclined shear cracks that eventually propagated through the tie-columns before the failure took place. As expected, flexural strength of the walls increased with an increase in axial stress level. Flexural strength predictions based on the rectangular stress showed excellent agreement with the experimental results. It was also observed that the ductility increased with a decrease in the axial compression.
In another experimental study specifically focused on the flexural behaviour of CM walls [
95], six CM wall specimens were constructed using multi-perforated clay blocks, with different aspect ratios (1.1, 1.5 and 2.4) and axial stress levels (0.24, 0.47, and 0.71 MPa). Longitudinal reinforcement in the tie-columns was in the form of a single
9.5 mm bar with 412 MPa nominal yield strength, but no transverse reinforcement was provided. The flexural strength predictions were made based on the flexural theory with a rectangular stress block for the compression zone and considering the effect of strain hardening in tension steel, and were in excellent agreement with the experimental results. Neutral axis depth was small in all cases (located within the tie-column).
3.2. Estimating Moment Resistance of CM Walls Subjected to Combined Axial Load and Flexure
Based on the results of their experimental study, Meli and Salgado [
13] proposed eq. (13) for predicting moment resistance
of CM walls subjected to axial load
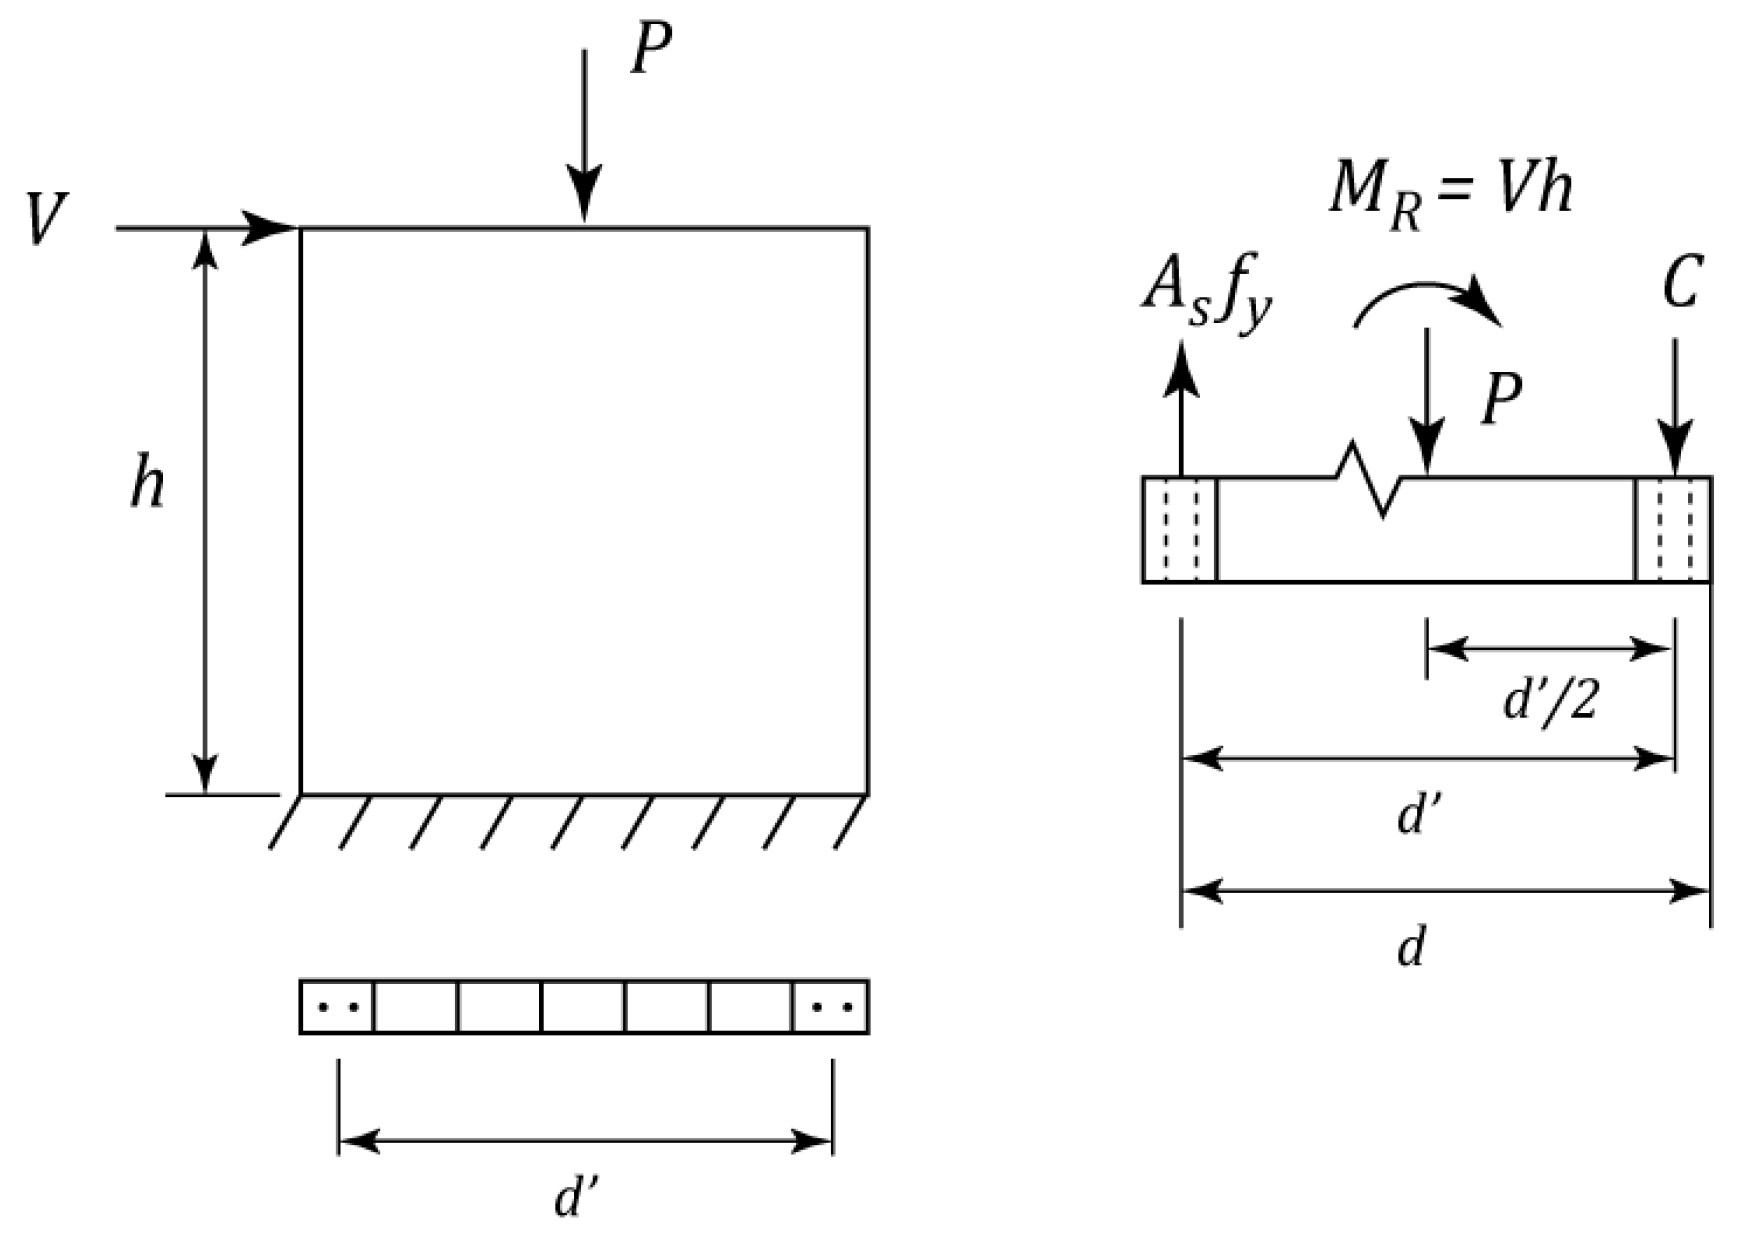
using a few simplifying assumptions. For example, it was assumed that longitudinal reinforcement in tie-columns yields both in tension and compression (
Figure 14)
Where is the area of longitudinal reinforcement in RC tie-columns, is steel yield strength, is the distance between the longitudinal reinforcement centroids of the tie-columns, and is the axial force.
Subsequently, the same researchers [
15] proposed a set of equations (15) for moment resistance of CM walls subjected to axial load and flexure.
Where
is the effective length of the wall section (distance from the centroid of tension steel to the extreme compression fibre),
the distance between the longitudinal reinforcement centroids of the tie-columns. Note that
is the applied axial force, while
is the axial load resistance.
The above equations were later incorporated in the Mexican masonry code, with a few changes in the coefficient values, e.g. the value 0.28 in the eq. (14a) was changed to 0.30, while the value 0.14 in the eq. (14b) was changed to 0.15 [
32,
33].
Marques and Lourenço [
9] performed a review of the moment resistance equations included in the Mexican masonry design code. They concluded that the equations provide a good estimate for
when the wall aspect ratio is equal to 1.0, but the estimates are less accurate for other aspect ratio values. They proposed an alternative eq. (15a), based on the flexure theory which was adapted from Tomaževič [
100] and is applicable to the CM walls subjected to low axial stress levels. A uniform compression stress distribution based on the equivalent compression stress block was assumed for the compression zone of CM wall, and stress intensity is determined based on the lesser of design compressive strength for masonry or concrete.
Neutral axis depth,
, is determined from eq. (15b) assuming that longitudinal steel in tie-columns
yields in tension (yield strength
), but contribution of the longitudinal reinforcement under compression has been ignored, as follows
where
and
denote wall length and thickness, respectively, and
is the multiplier for the equivalent rectangular stress block, taken equal to 0.85. The proposed equation was verified for 13 CM wall specimens from 3 experimental studies
3.3. The effect of Axial Stress and Wall Aspect Ratio
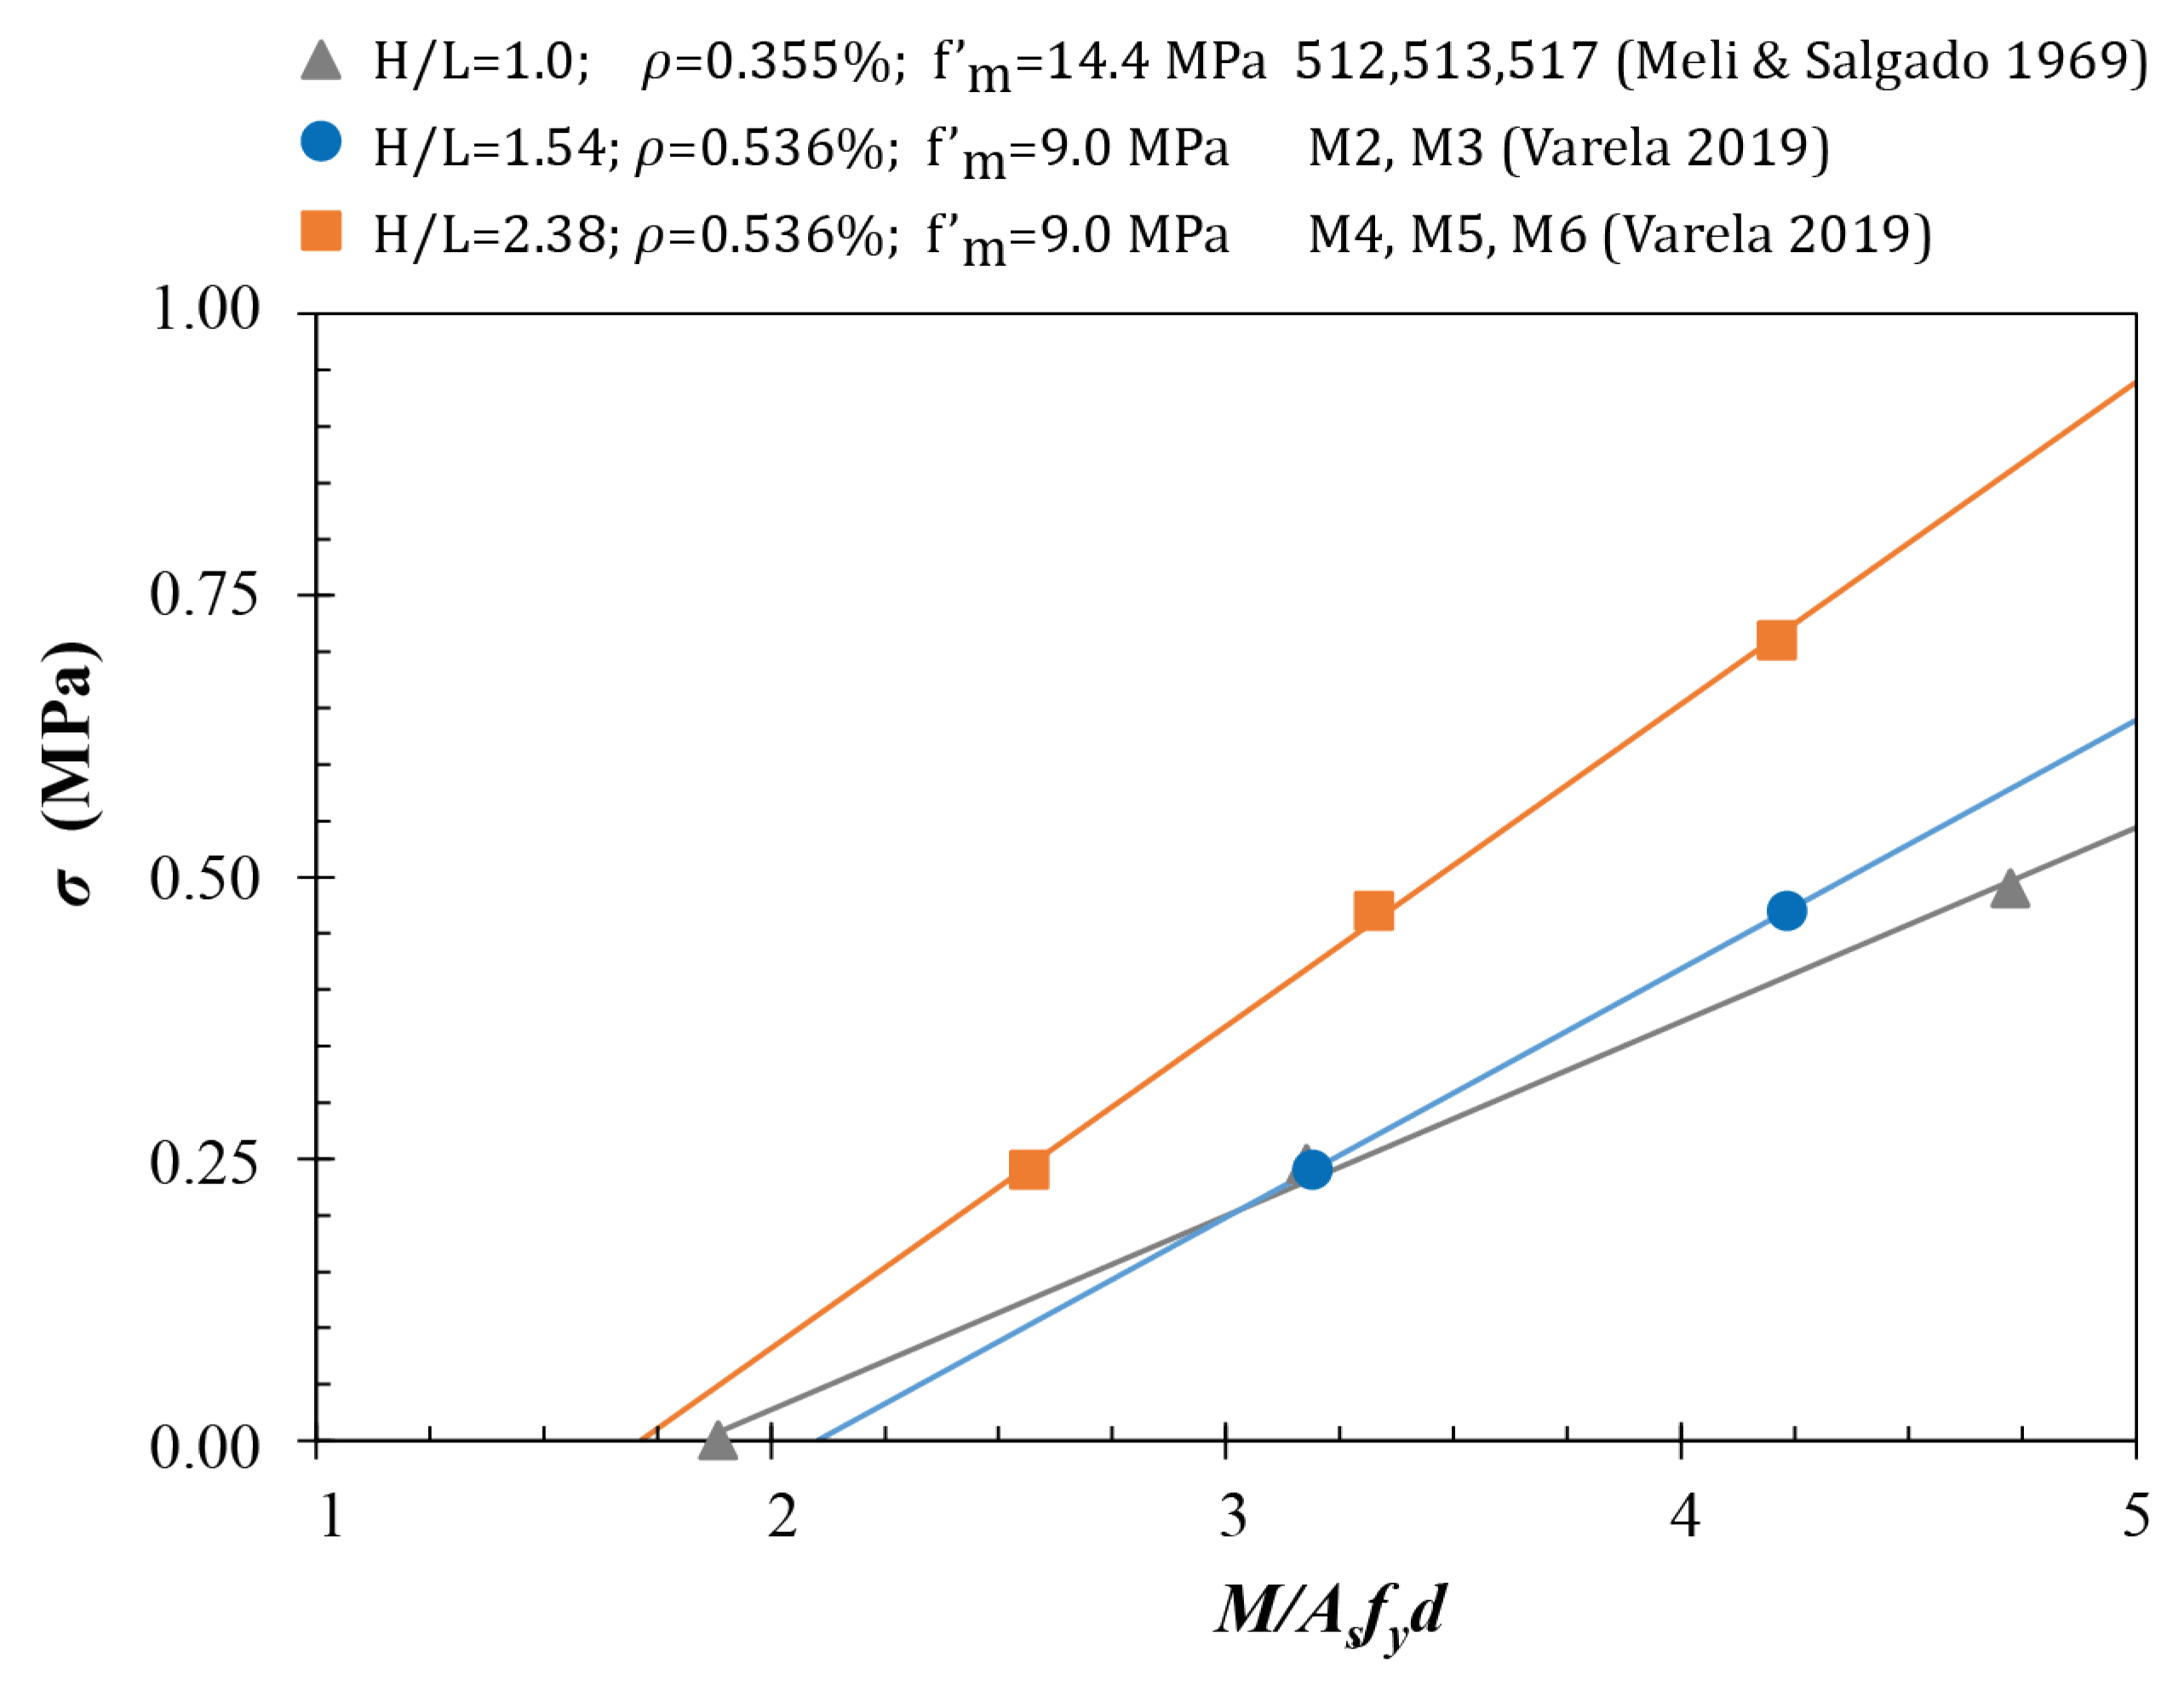
The effect of axial stress and wall aspect ratio on the flexural strength was studied by analysing results for 8 CM specimens from two experimental research studies performed in Mexico, as shown in
Figure 15 [
13,
96]. It can be seen from the chart that normalized moment resistance increases with an increase in the axial stress level, which is in line with design equations for walls subjected to relatively low axial stresses; however, it appears that the effect of higher axial stress level is more significant in slender walls, e.g. for
value of 2.38.
3.4. Key Factors Influencing the Occurrence of Shear- and Flexure-Dominant Failure in CM Walls
A discussion related to the shear and flexural behaviour of CM walls due to in-plane seismic actions has been presented in previous sections. The criteria for occurrence of failure mechanism (flexural or shear) in CM walls are important both for researchers and design engineers. Formally, flexural failure is achieved when the following condition is met
where
is the moment resistance of the wall and
is the overturning moment due to the wall’s shear resistance,
. Observations from the past experimental studies indicate that the walls subjected to lateral loading may simultaneously experience damage patterns characteristic for both flexure- and shear-dominant behaviour. Predominant damage pattern may be either diagonal tension cracking (shear-related) or a flexure-related damage pattern such as horizontal cracking and toe-crushing. The predominant damage pattern and failure mechanism depend on the ratio of flexural and shear resistance shown in eq. (16), and a mix of damage patterns characteristic for both mechanisms will occur when the ratio is close to 1.0.
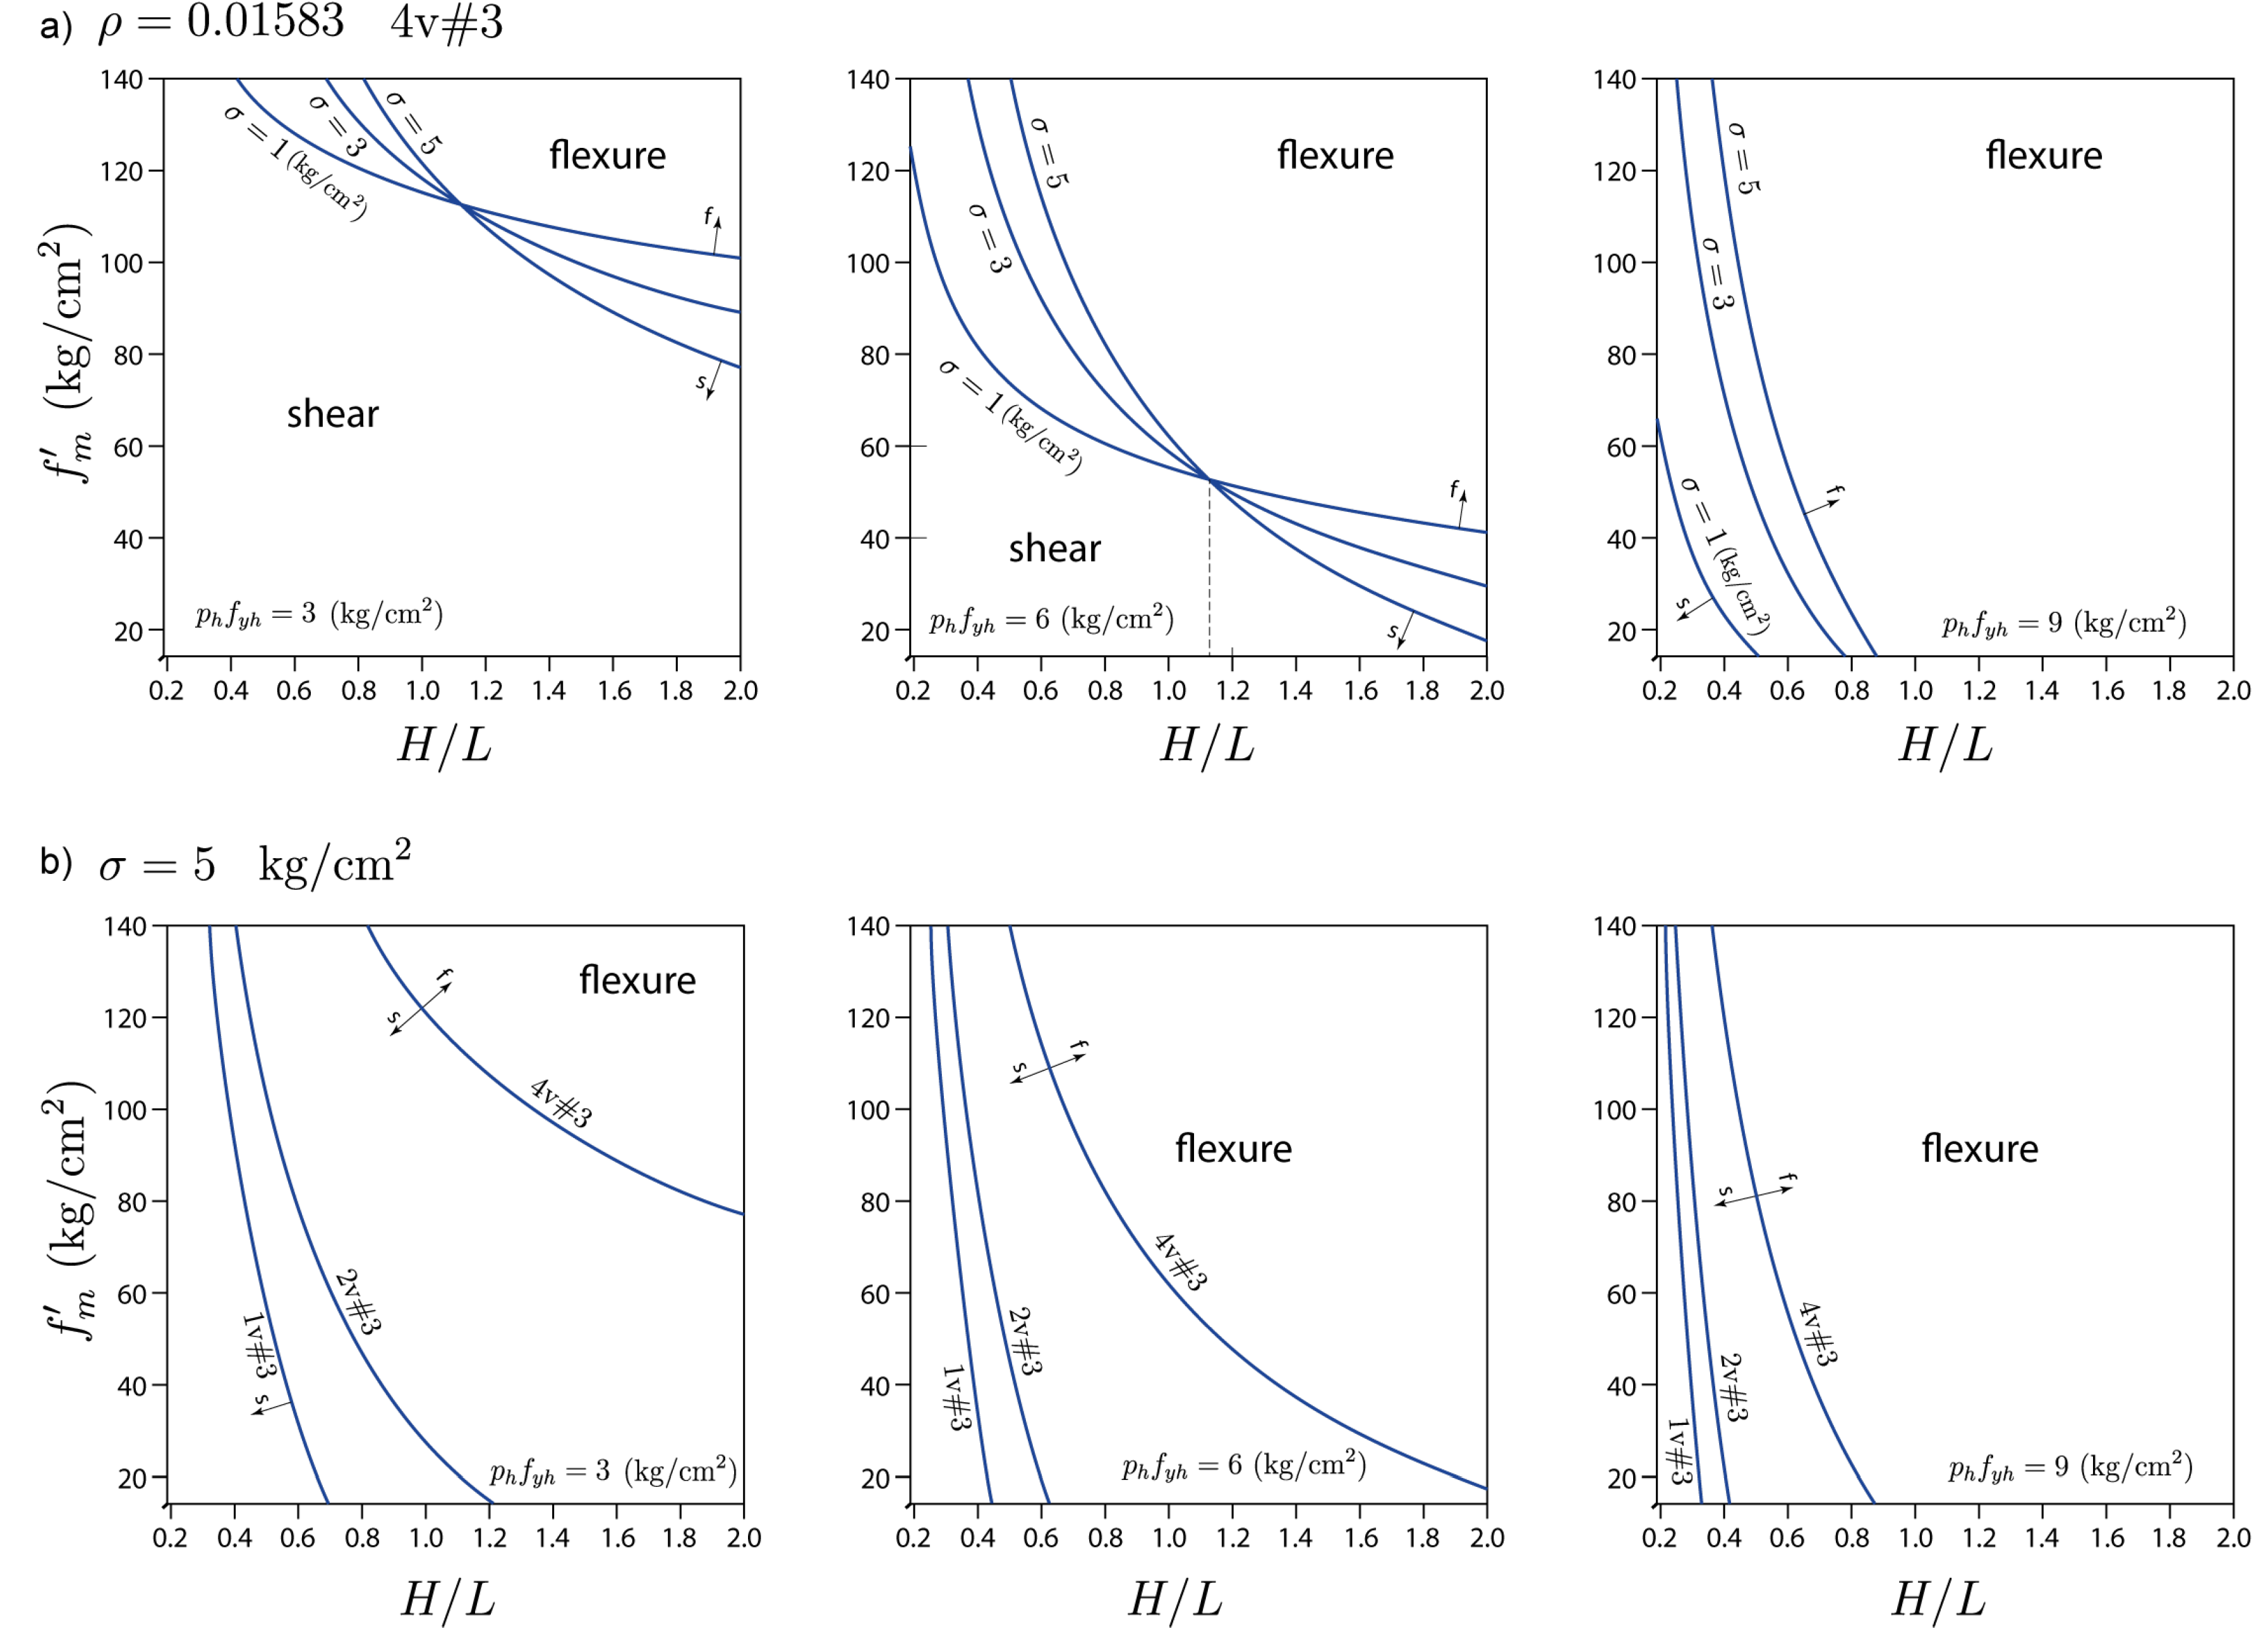
A parametric study was performed to identify the key parameters and quantify the effect of different combinations of parameters on the occurrence of a shear- or flexure-dominant failure mode, and the results are presented on
Figure 16. Shear and flexural resistance values were determined from the following equations
where
was obtained by applying the regression model discussed in Section 2.5. Flexural resistance
was calculated based on the Mexican code discussed earlier in this section (for
, where
,
,
is the tie-column length parallel to the wall length, and
.
Six charts presented in
Figure 16 were organized into parts (a) and (b). For analyses performed in part (a) longitudinal reinforcement ratio in tie-columns was constant:
0.01583 (4 #3 bars), while for the charts shown in part (b) axial stress value is constant:
kg/cm
2. Charts were developed for 3 different horizontal reinforcement ratios:
3,6,9 kg/cm
2.
Each chart shows a relationship between the masonry compression strength and the ratio, depending on other relevant parameters. It can be seen that the curves (characterized by ) divide each chart into two regions, namely i) associated with a flexural failure and ii) associated with a shear failure. Three curves in are shown on each chart. For the charts shown in part (a), each curve corresponds to a different axial stress kg/cm2, while for the charts shown in part (b) the curves correspond to different longitudinal reinforcement ratios in tie-columns: = 0.00396 (one #3 bar), 0.00792 (two #3 bars), and 0.01583 (four #3 bars). Note that the analyses were performed assuming cm tie-column size. The diagonal compression stress was approximated using linear interpolation for the corresponding values. For example, for kg/cm2 the corresponding 3 kg/cm2, while for kg/cm2 the corresponding kg/cm2. This substitution has allowed the use of a single material strength parameter, , in the analyses. Since the ratio depends on and (or and ) independently, the charts were developed for cm (storey height).
The study has shown that the following five parameters govern the occurrence of flexural and shear failure mechanism: axial stress,, masonry shear and compression strength, expressed in terms of the , the amount of horizontal reinforcement, , wall aspect ratio, , and tie-column longitudinal reinforcement ratio,. Probably the most influential parameter related to the flexural failure appears to be the amount of horizontal reinforcement, followed by the material strength and the wall aspect ratio. As expected, slender walls tend to experience flexural failure, and higher masonry strength also promotes flexural failure.
It can be seen from the charts that axial stress has a smaller impact on the failure mechanism (shear- or flexure-dominant), i.e., the regions do not vary much for different axial stresses. This may be expected, since an increase axial stress increases both shear and flexural wall strengths, although, at different rates. It can be seen from
Figure 16a that on each chart there is a “critical”
ratio value, close to 1.0, which varies with the amount of horizontal reinforcement and determines whether changes of axial stress will cause a flexural or a shear failure. For the example, when
kg/cm
2, the critical aspect ratio is
. Consider the curve corresponding to
kg/cm
2 as a reference. It can be observed that when the axial stress increases from 3 to 5 kg/cm
2, flexural failure can be expected for walls with
1.12 because the shear resistance increases more rapidly than the flexural resistance, but the opposite is true for walls with
1.12. Furthermore, walls with the critical aspect ratio value do not change the failure mechanism depending on axial stress level.
Longitudinal reinforcement ratio causes an increase in both the flexural and shear resistance of CM walls, however in this case it is evident that the rate at which the flexural resistance increases is much higher than that of the shear resistance. This implies that an increase in the longitudinal reinforcement ratio promotes a shear failure. The effect of longitudinal reinforcement ratio,, is less important when the horizontal reinforcement ratio, , increases.
As previously described, under certain circumstances it is possible to modify the behaviour of CM walls for a flexural failure instead of a shear failure. Is well known that a flexural failure mechanism is more desirable in terms of ductility and deformation capacity compared to a shear failure.
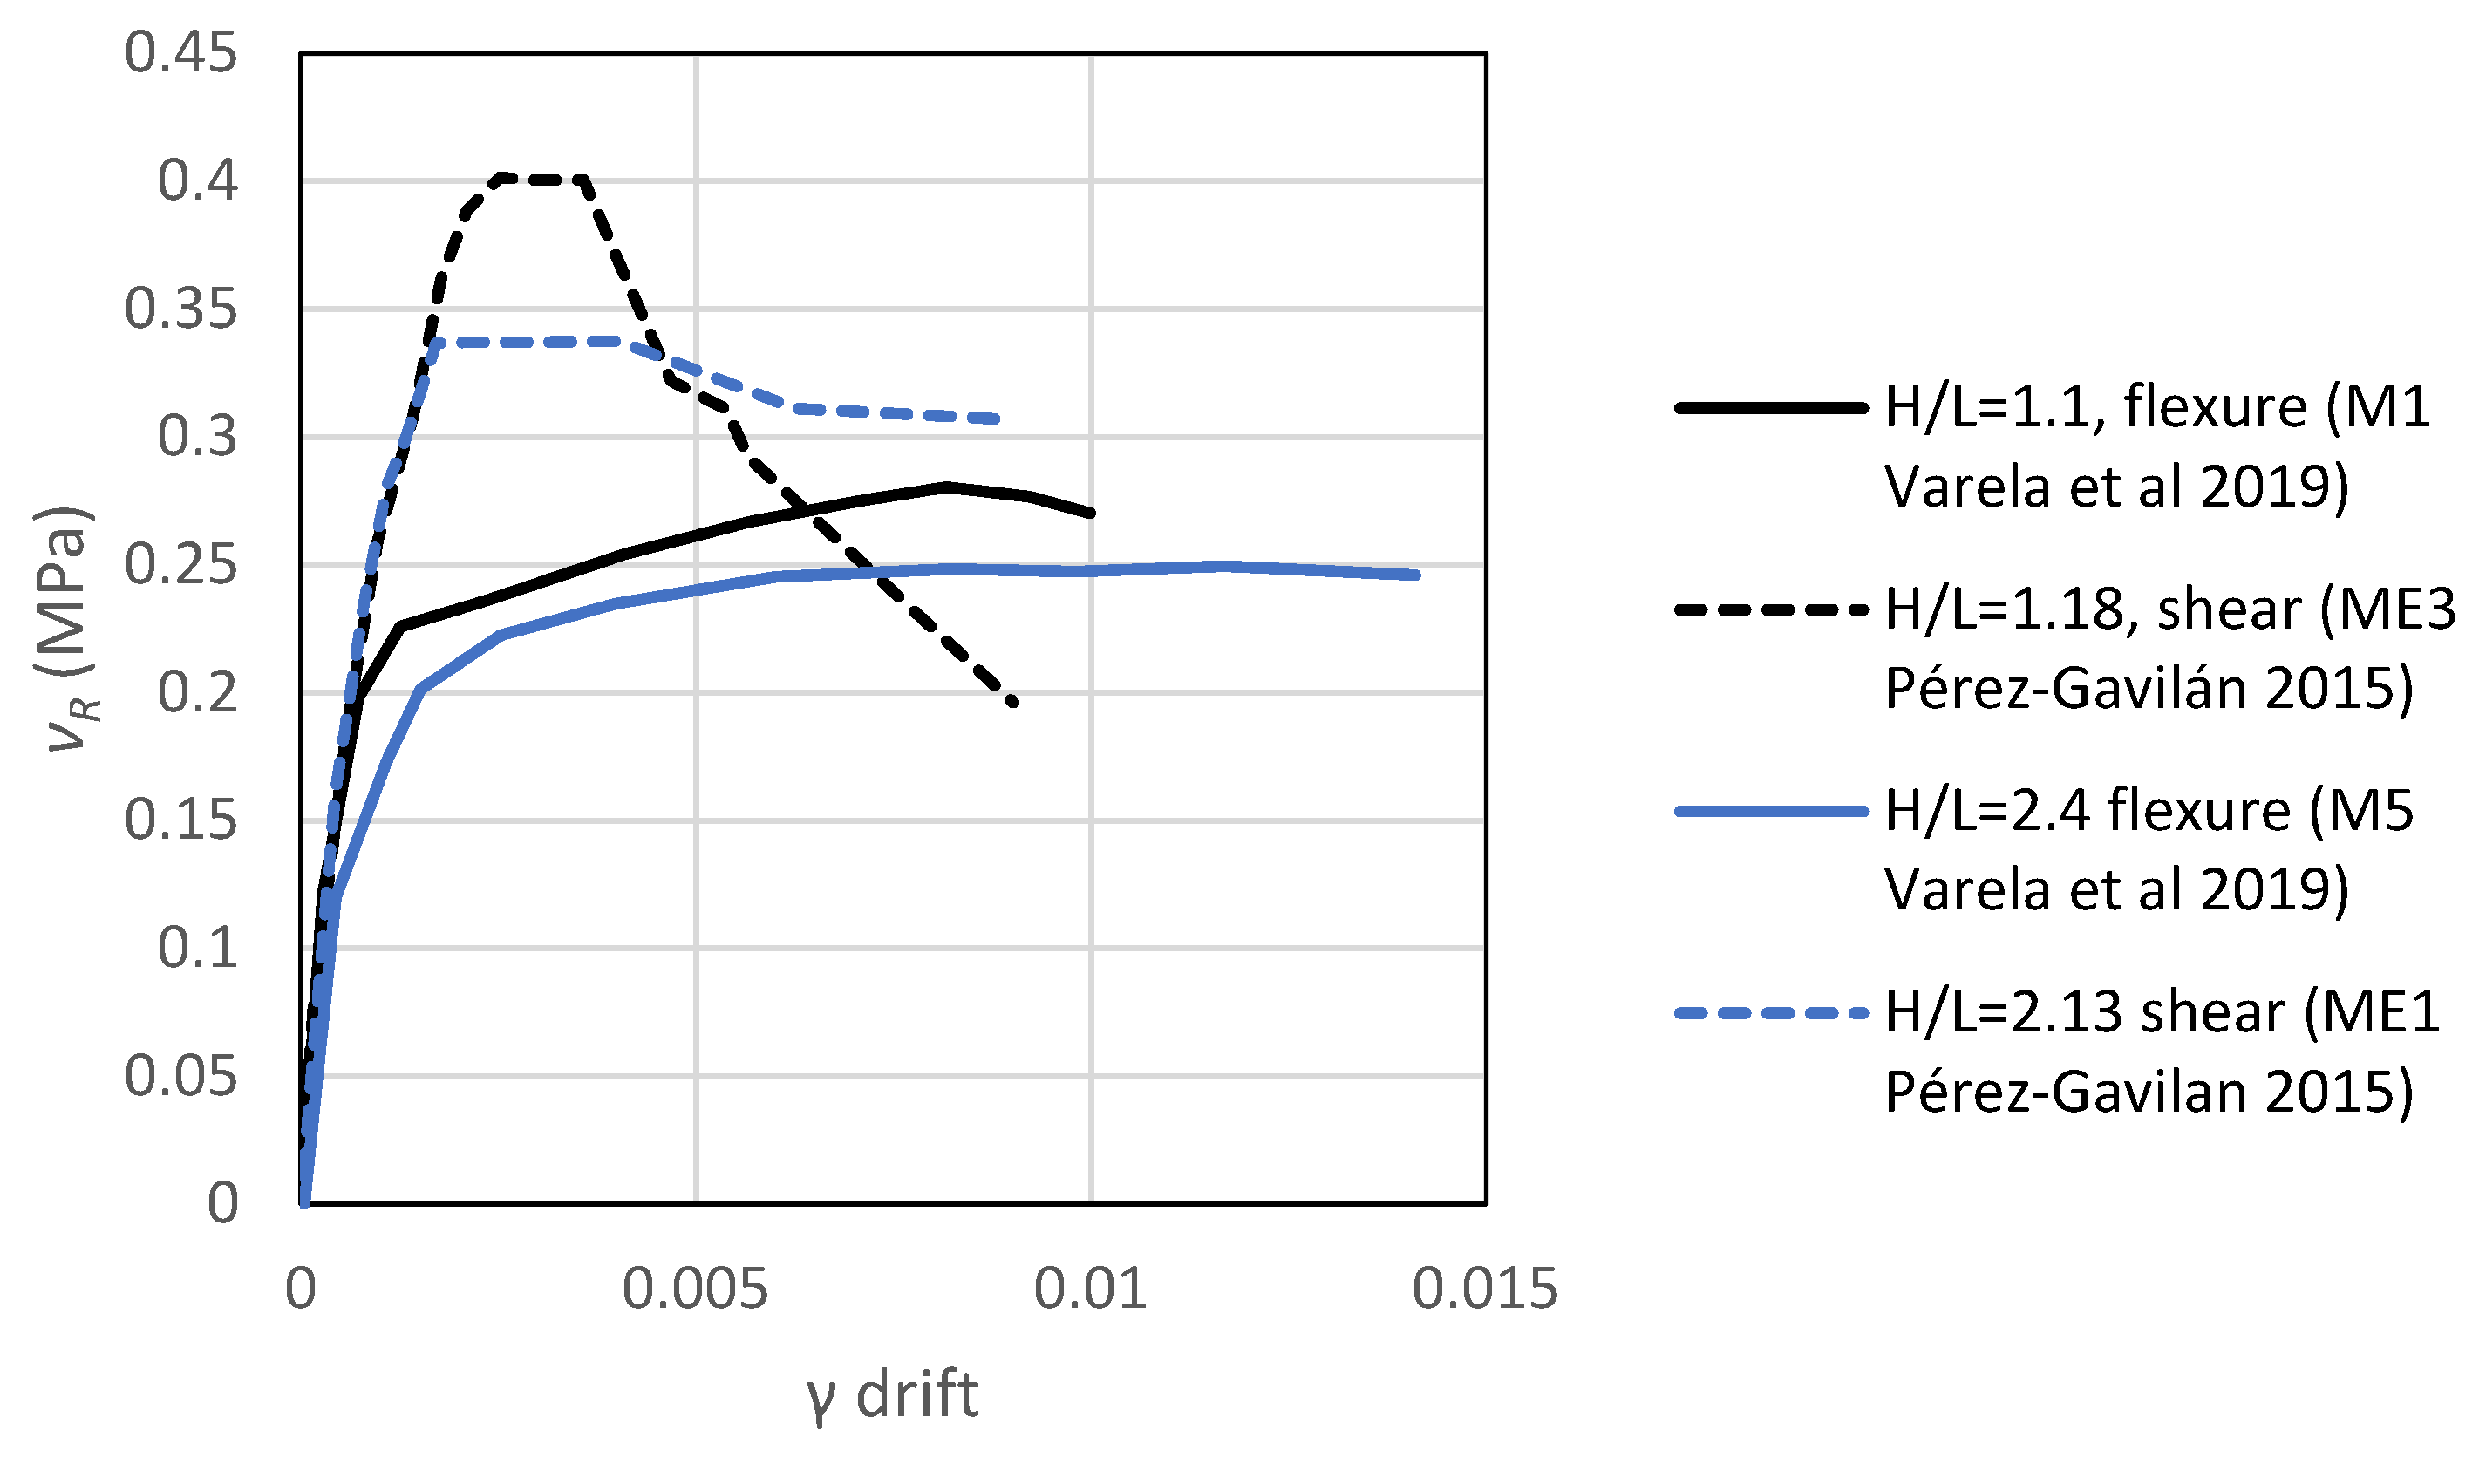
Figure 17 shows envelopes of the hysteresis curves from reversed cyclic testing of 4 CM walls; out of these, two specimens demonstrated a shear-dominant behaviour [
35], while the remaining specimens demonstrated a flexure-dominant behaviour [
95]. Envelopes shown in black represent the specimens with an
value close to 1.0, while envelopes shown in red represent walls with an the
value close to 2.0. It can be observed that the specimens which demonstrated shear behaviour had significantly lower deformation capacity compared to the walls which experienced flexure-dominant behaviour. CM walls in taller buildings need to be designed to achieve flexure-dominant behaviour, which is in line with the new design trends focused on resilience.
4. Behaviour of CM walls subjected to combined axial load and OOP lateral loading
There is limited evidence from past earthquakes related to the performance of CM walls subjected to OOP ground shaking. CM walls were exposed to the effects of damaging earthquakes in Indonesia and did not experience significant OOP damage, although typical storey height is close to 3 m and wall thickness is only 110 to 120 mm, corresponding to a relatively high
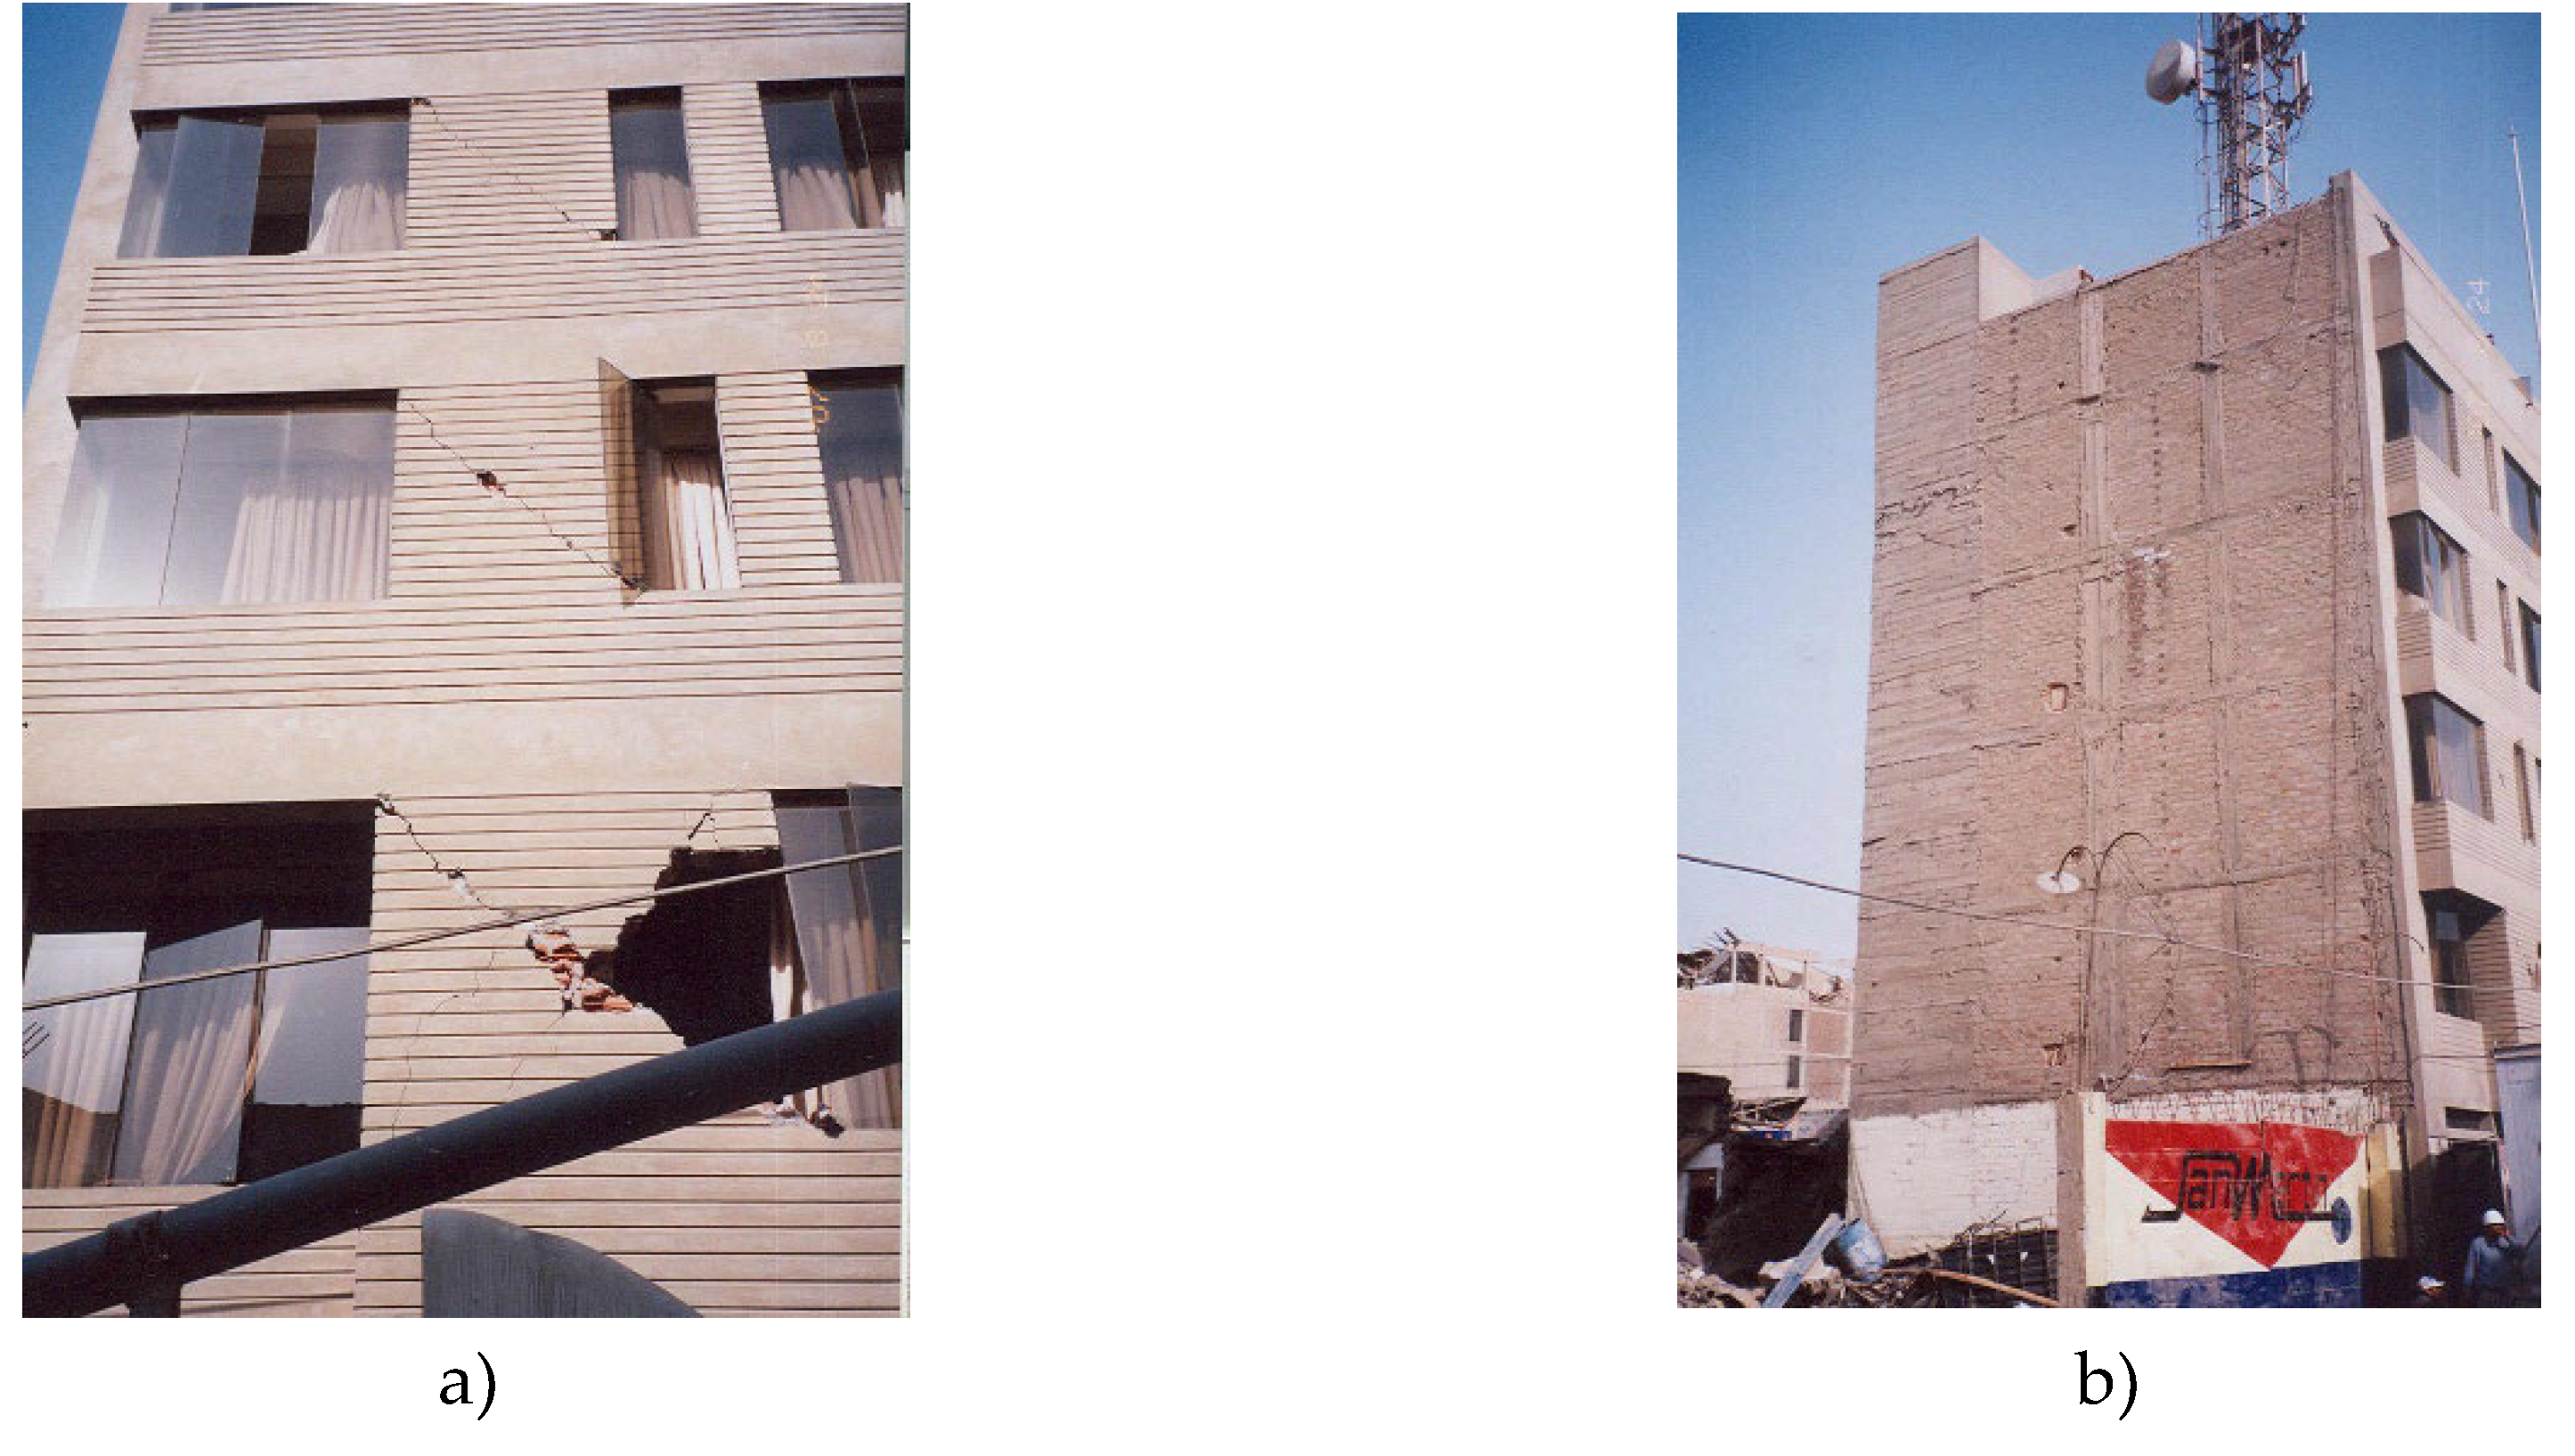
ratio (25 to 30). A few CM walls experienced OOP damage due to the 2010 Maule, Chile earthquake (M8.8) [
101] (see
Figure 18). The failure was most pronounced on upper floors, such as the top floor of a building with a wooden roof structure in Cauquenes. The same building also experienced significant in-plane damage in CM walls in the longitudinal direction and had to be demolished.
This section discusses the behaviour of CM walls subjected to OOP loading, which depends on several factors, including the boundary conditions, wall aspect () ratio, slenderness ratio, t, axial compression level, stiffness of RC confining elements, and the type of loading (static/dynamic).
4.1. Approaches for Estimating the OOP Capacity of CM Walls
Existing approaches for estimating the capacity of masonry walls subjected to gravity and OOP lateral loads are based on different assumptions and result in significantly different predictions, as discussed in this section.
4.1.1. Elastic Flexural Theory
The simplest approach, adopted by several masonry design codes (e.g. [
95]), is based on the elastic flexural theory, and the OOP wall capacity depends on the masonry tensile or compressive strength (refer to [
73]).
Flexural tensile strength approach considers an elastic uncracked wall section and assumes that the cracking moment corresponding to the flexural tensile strength in the tension zone of the wall has been reached. The flexural capacity is the product of normal stress due to gravity load and the section modulus of the net cross-sectional area for OOP flexure. Masonry flexural tensile strength normal to bed joints, which may be considered as a stress component, results in increased flexural capacity.
Another approach is based on the flexural compression capacity and assumes that the flexural tensile strength has been attained, and that the cracking in the wall has taken place. The flexural capacity depends on the masonry stress resultant for the compression zone and the eccentricity of axial load.
These approaches are based on the following assumptions: i) the wall spans vertically, ii) there is no gap between the top of the wall and the floor, and iii) axial load, which contributes to an increased flexural capacity, is present. These approaches result in conservative estimates of the OOP capacity, which is significantly lower than the corresponding predictions based on the arching mechanism concept.
4.1.2. Arching Mechanism
An arching mechanism may develop in masonry walls with rigid supports, in which translation and rotation at the supports are fully restrained. The concept of arching mechanism was originally developed for unreinforced masonry walls [
102], but it has been extended to masonry infills in RC frame structures ([
103,
104]), and also CM walls [
103].
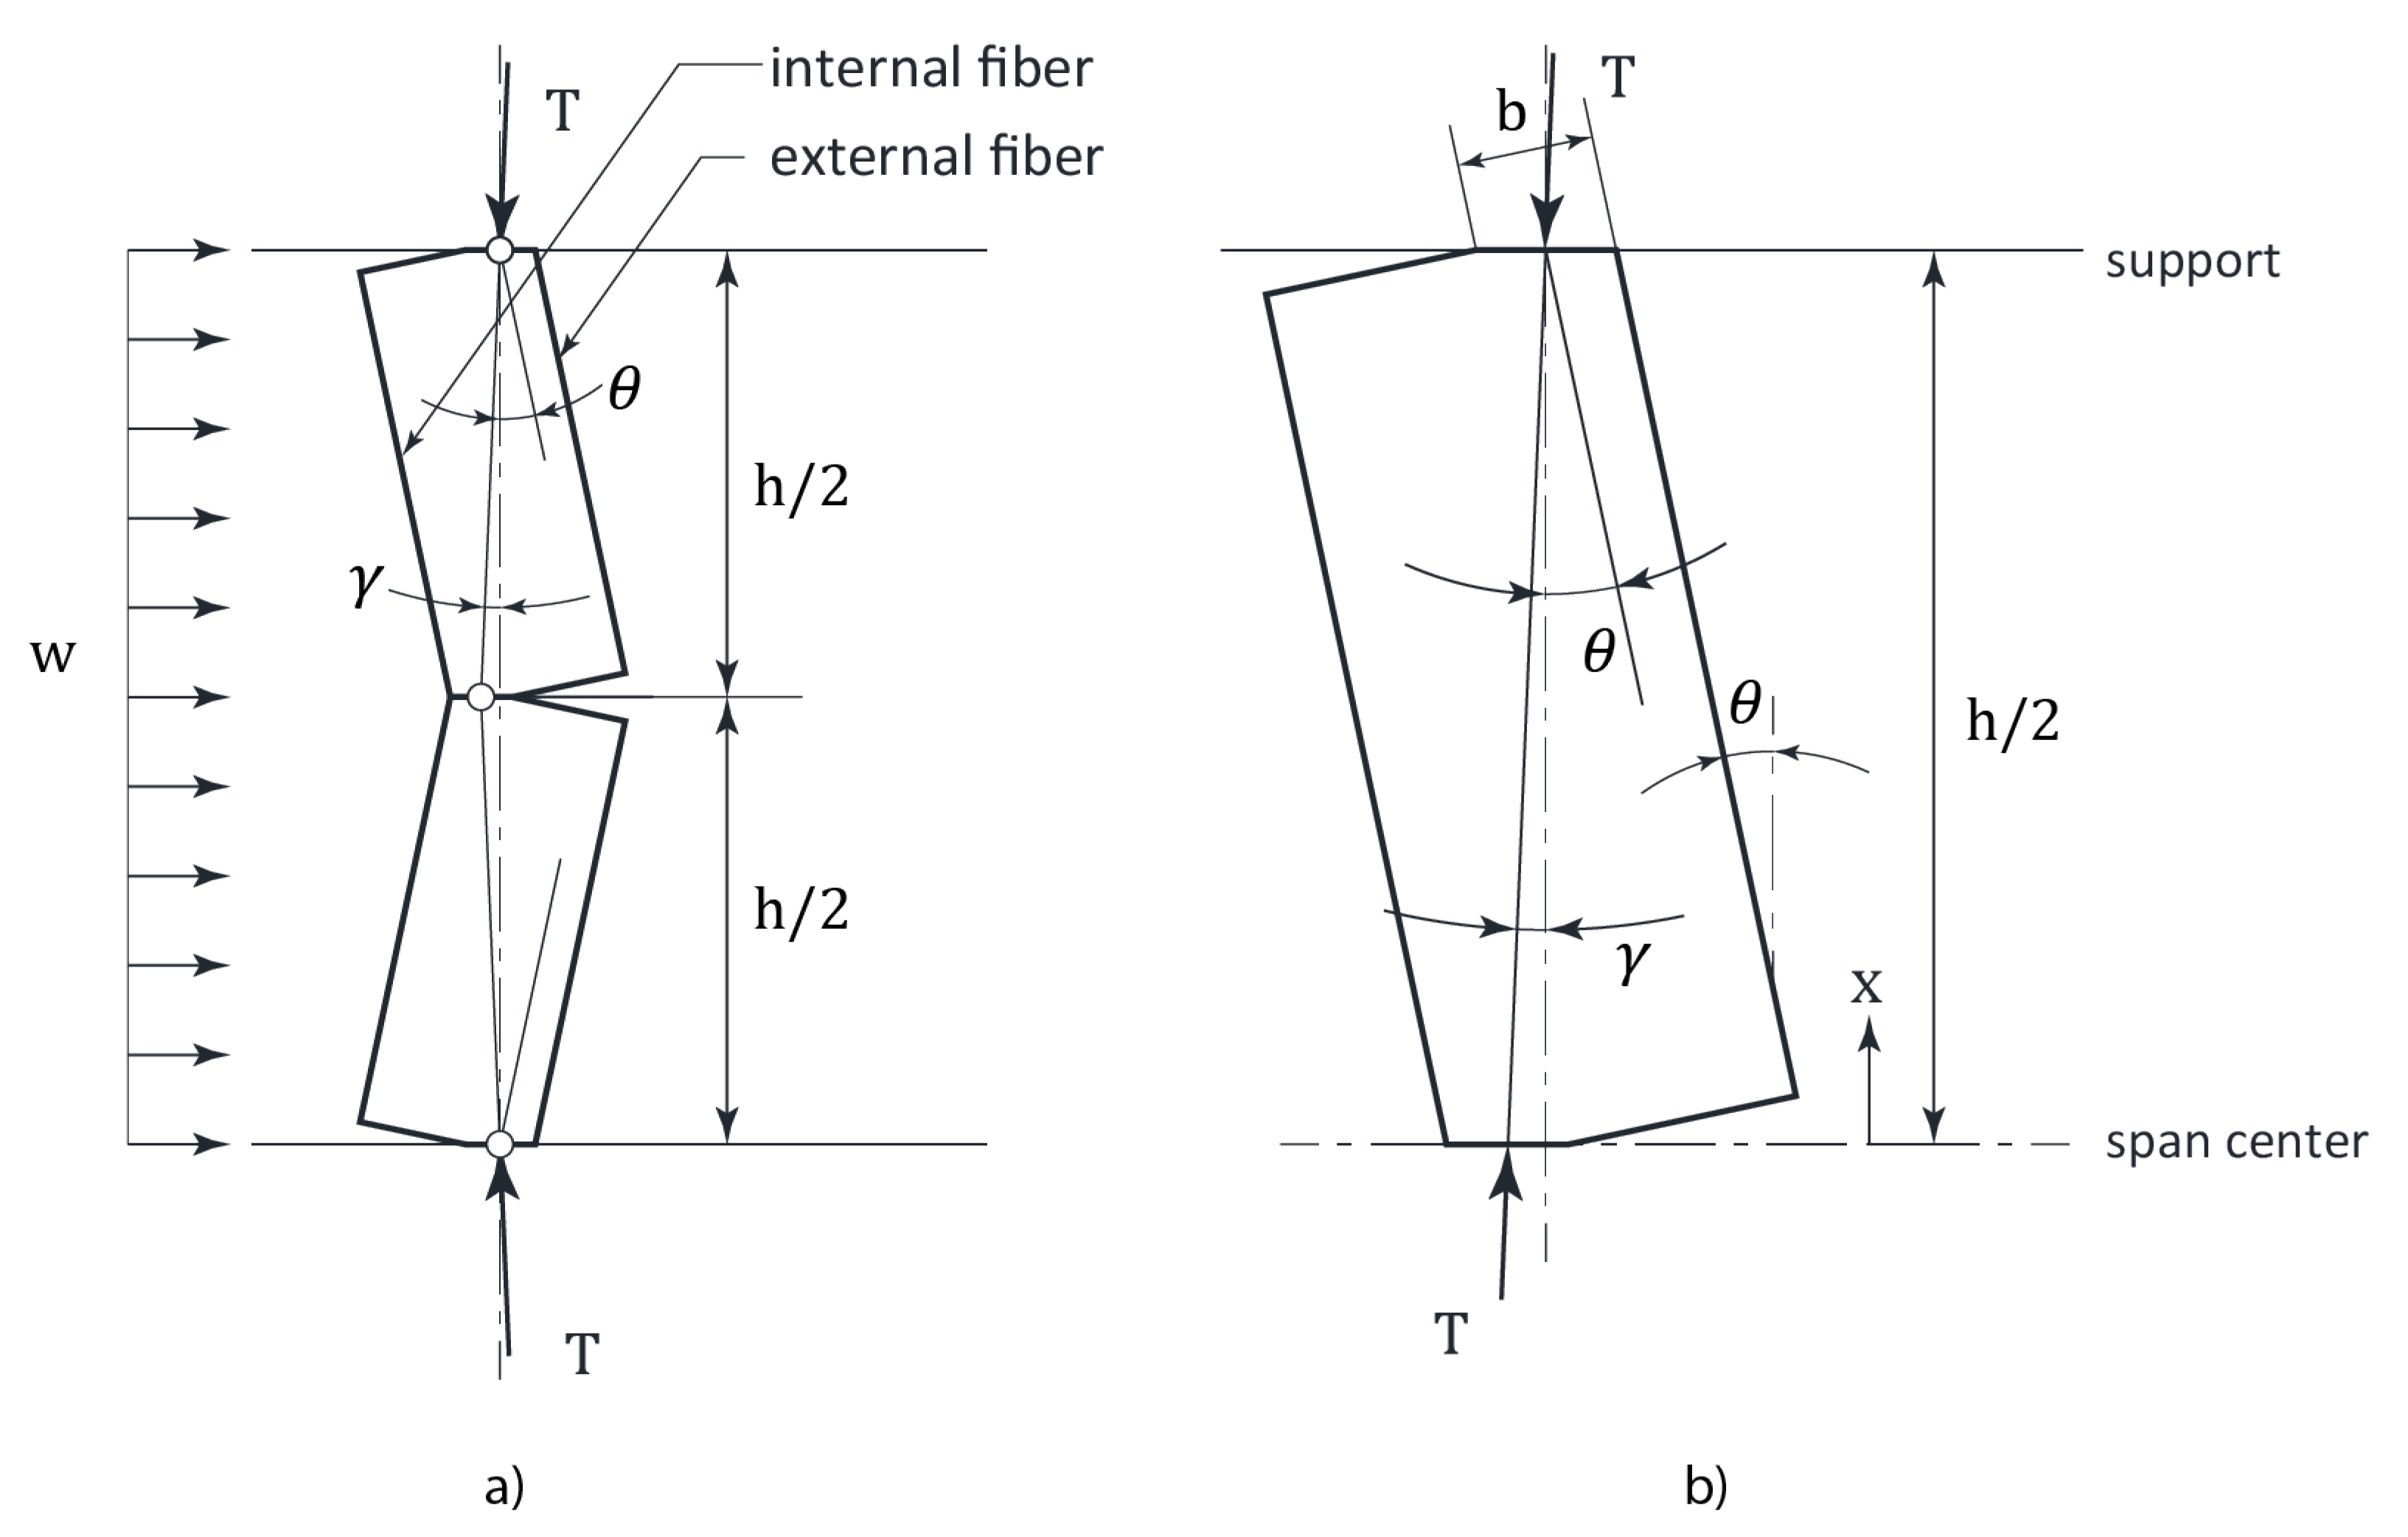
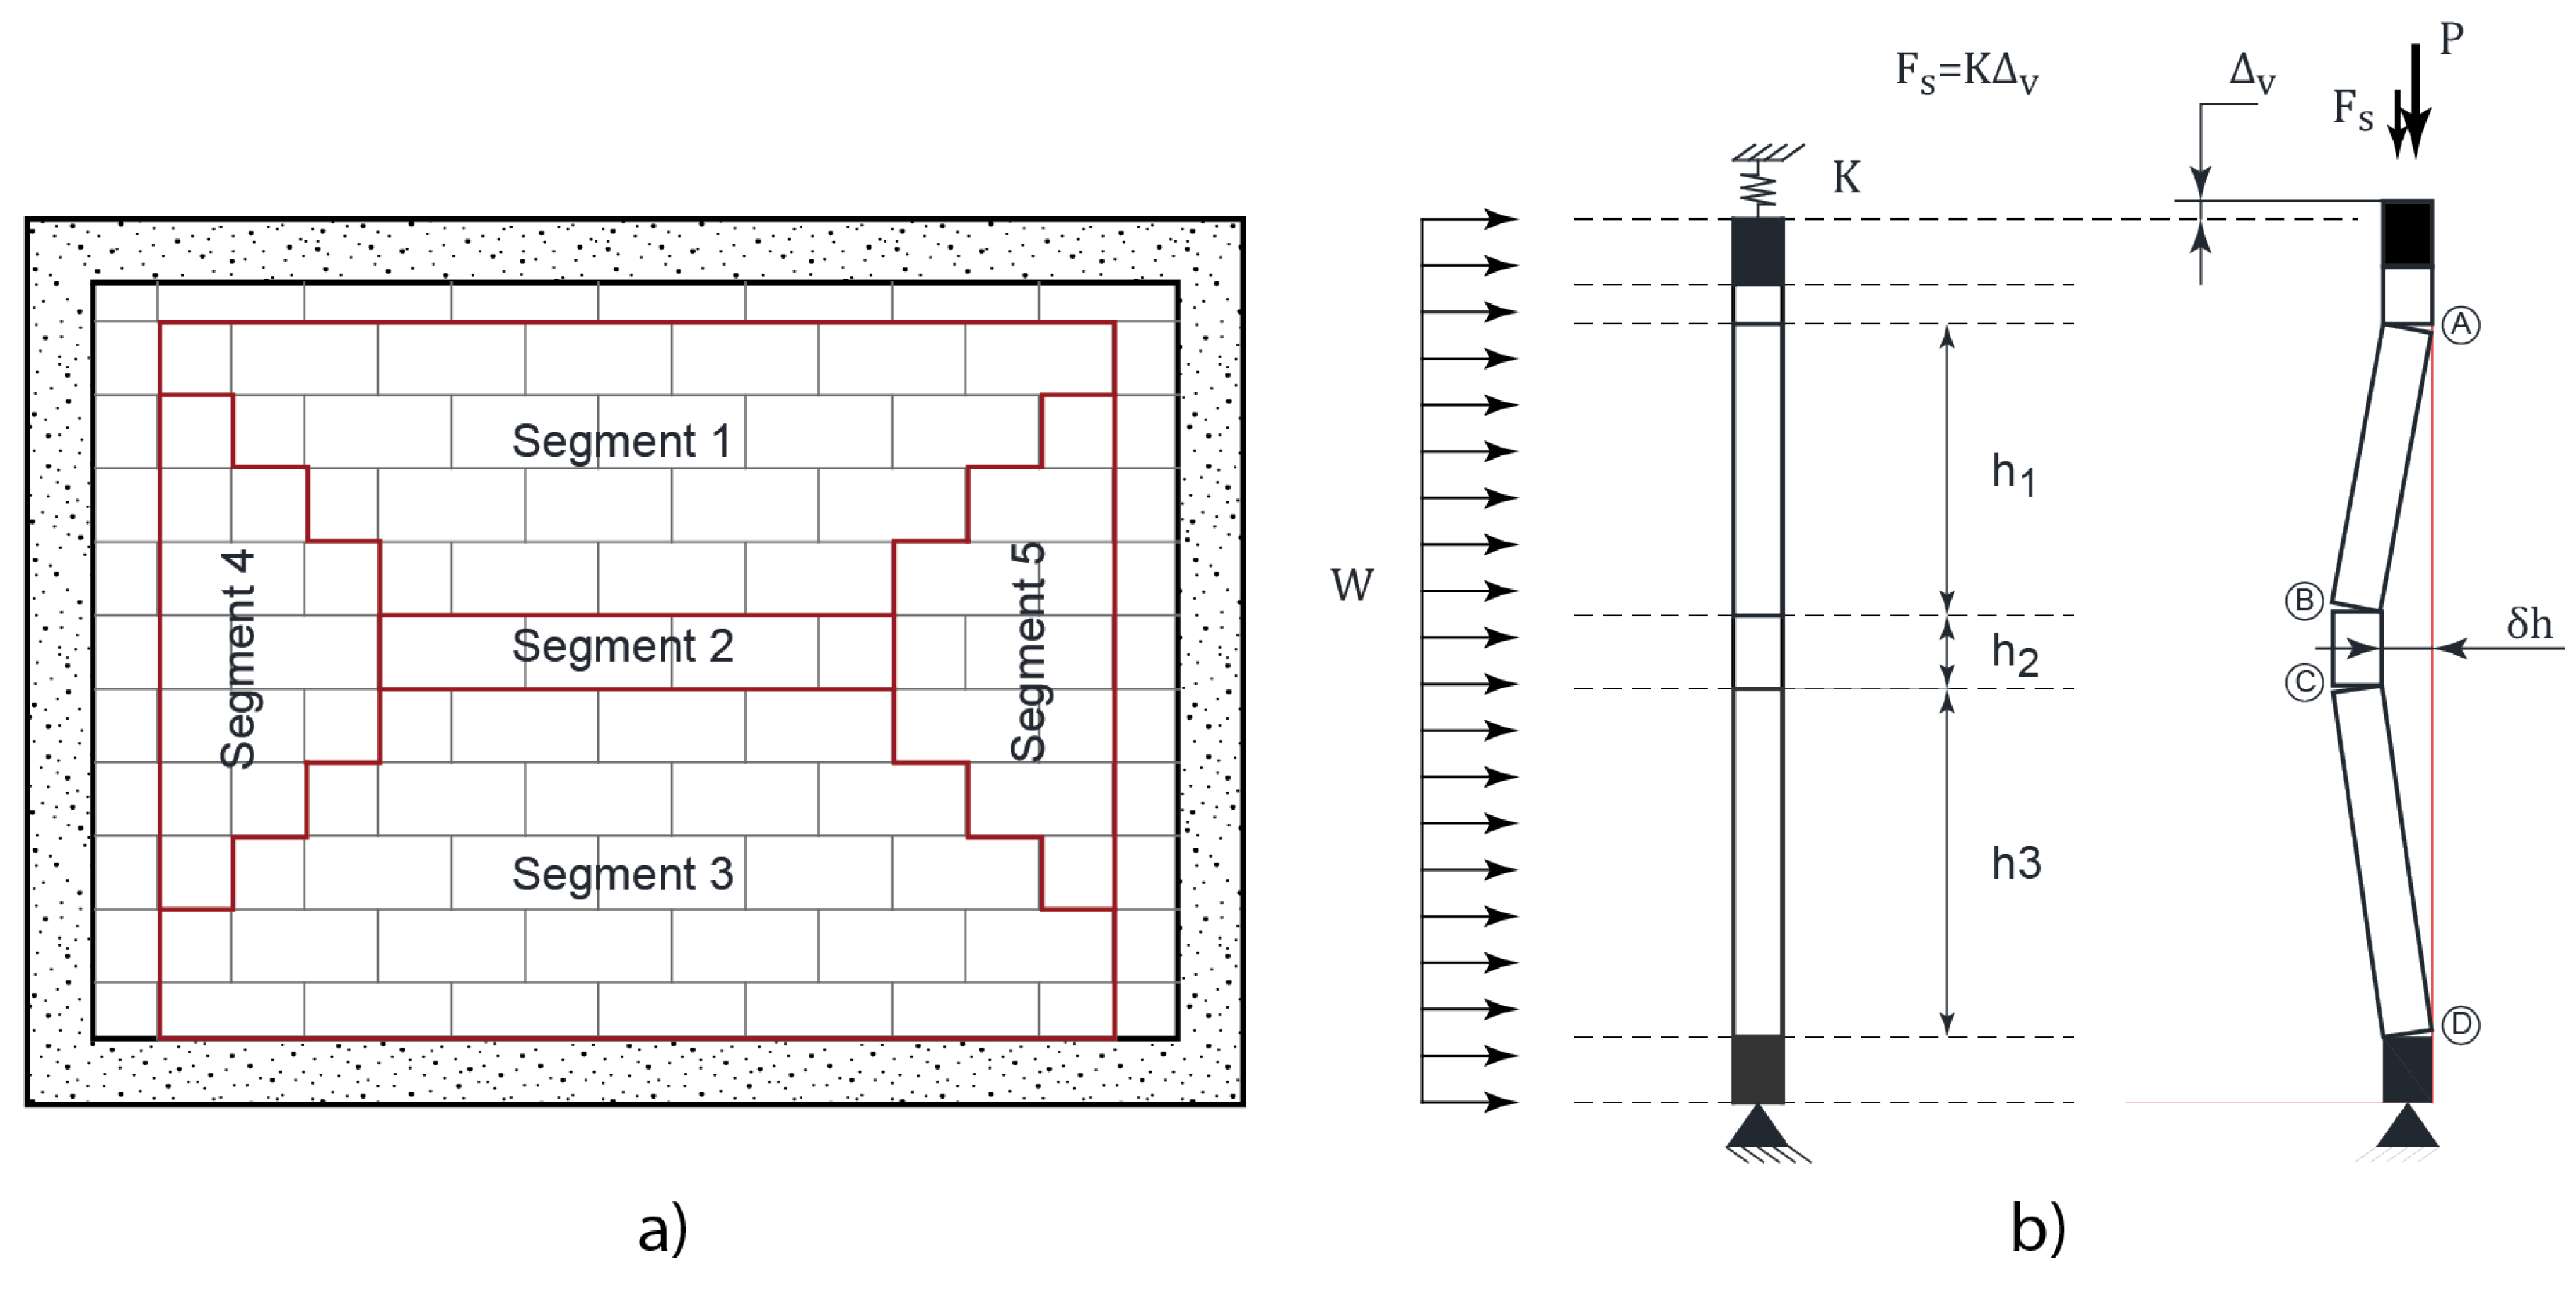
According to the concept of arching mechanism, two or more rigid segments form in a cracked masonry wall with storey height (
) and length (
) which is subjected to combined gravity loading and OOP lateral pressure. It is expected that horizontal cracks develop both at the wall mid-height (interface cracks) and at the top/bottom supports (boundary cracks). Increasing lateral loading at the post-cracking stage causes rotation of rigid segments and lateral displacements at the wall mid-height. As a result, the wall acts as a three-hinged arch (see
Figure 19a). The thrust forces (
) (also known as strut forces), induce high compression stresses at the hinges (clamping points). The following two failure mechanisms are associated with the arching mechanism: i) crushing and ii) lateral instability (“snap through” mechanism). Crushing may take place at the cracks, once compressive stress at the clamping points reaches the masonry compressive strength,
. The ultimate lateral pressure
, can be determined from equilibrium of the horizontal component of the thrust force and the lateral pressure as follows (
Figure 19b):
4.1.3. Experimental Research Studies
Previous experimental research studies showed that an arching mechanism characterized by crushing occurs in walls with relatively low slenderness (
) ratios. For masonry infills and CM walls additional factors that determine the chances for crushing at the wall boundaries include the stiffness of vertical RC elements and the masonry compressive strength. Experimental studies have shown that infill walls with rigid boundary frame elements fail due to crushing mechanism [
105]. An alternative failure mechanism is lateral instability due to excessive horizontal displacements, which may be expected in slender walls and/or walls with flexible supports. The wall segments eventually reach an unstable position that culminates in a “snap through” failure.
Experimental and analytical research evidence related to the behaviour of CM walls subjected to OOP loading is limited. The majority of experimental studies were performed by the same research group in Mexico, by subjecting CM wall specimens to monotonically increasing uniform pressure [
50,
106,
107,
108,
109,
110] and in one case cyclic OOP load was applied on top of the wall [
111]. Based on the results of their own experimental studies, the researchers developed a one-way spring strut arching method to estimate the OOP strength of CM walls, that included the flexibility of the confining elements [
100,
101] and the axial load on the wall (
Figure 20). They later generalized it into a bi-directional compression strut mechanism, that also included the torsional stiffness of the RM elements [
109].
The proposed method builds on the arching mechanism concept which was previously applied to masonry infills in RC frames [
104], but there is a difference is in the assumptions related to the boundary conditions. The method applied to RC frames with infills assumed rigid boundary conditions (frames), while bi-directional compression strut mechanism considers flexible supports.
Based on the review of past experimental studies, the authors of this paper have compiled a database of 32 CM wall specimens from 6 experimental studies. In five studies, specimens were subjected to monotonic static loading, which was applied via air bags. In one case, a cyclic OOP lateral load was applied on top the walls. Key design parameters for these specimens are summarized in
Table 2, while more detailed information on each specimen is presented in Appendix (Table A.3). It can be seen from the table that the specimens were characterized by
ratios ranging from 0.5 to 2.5, and
ratio ranging from 12.0 to 25.0.
4.2. Effect of Wall Slenderness (H/t) Ratio
Restrictions on wall slenderness expressed in terms of the height-to-thickness,
, ratio are prescribed by design codes to prevent damage and/or instability due to OOP seismic actions [
8]. It appears that the majority of tested CM specimens were characterized by lower slenderness ratios compared to the limits set by international codes.
Based on the analysis of the experimental database, 26 out of 32 specimens were characterized by
ratio ranging from 18 to 25. The analysis of test results for specimens with
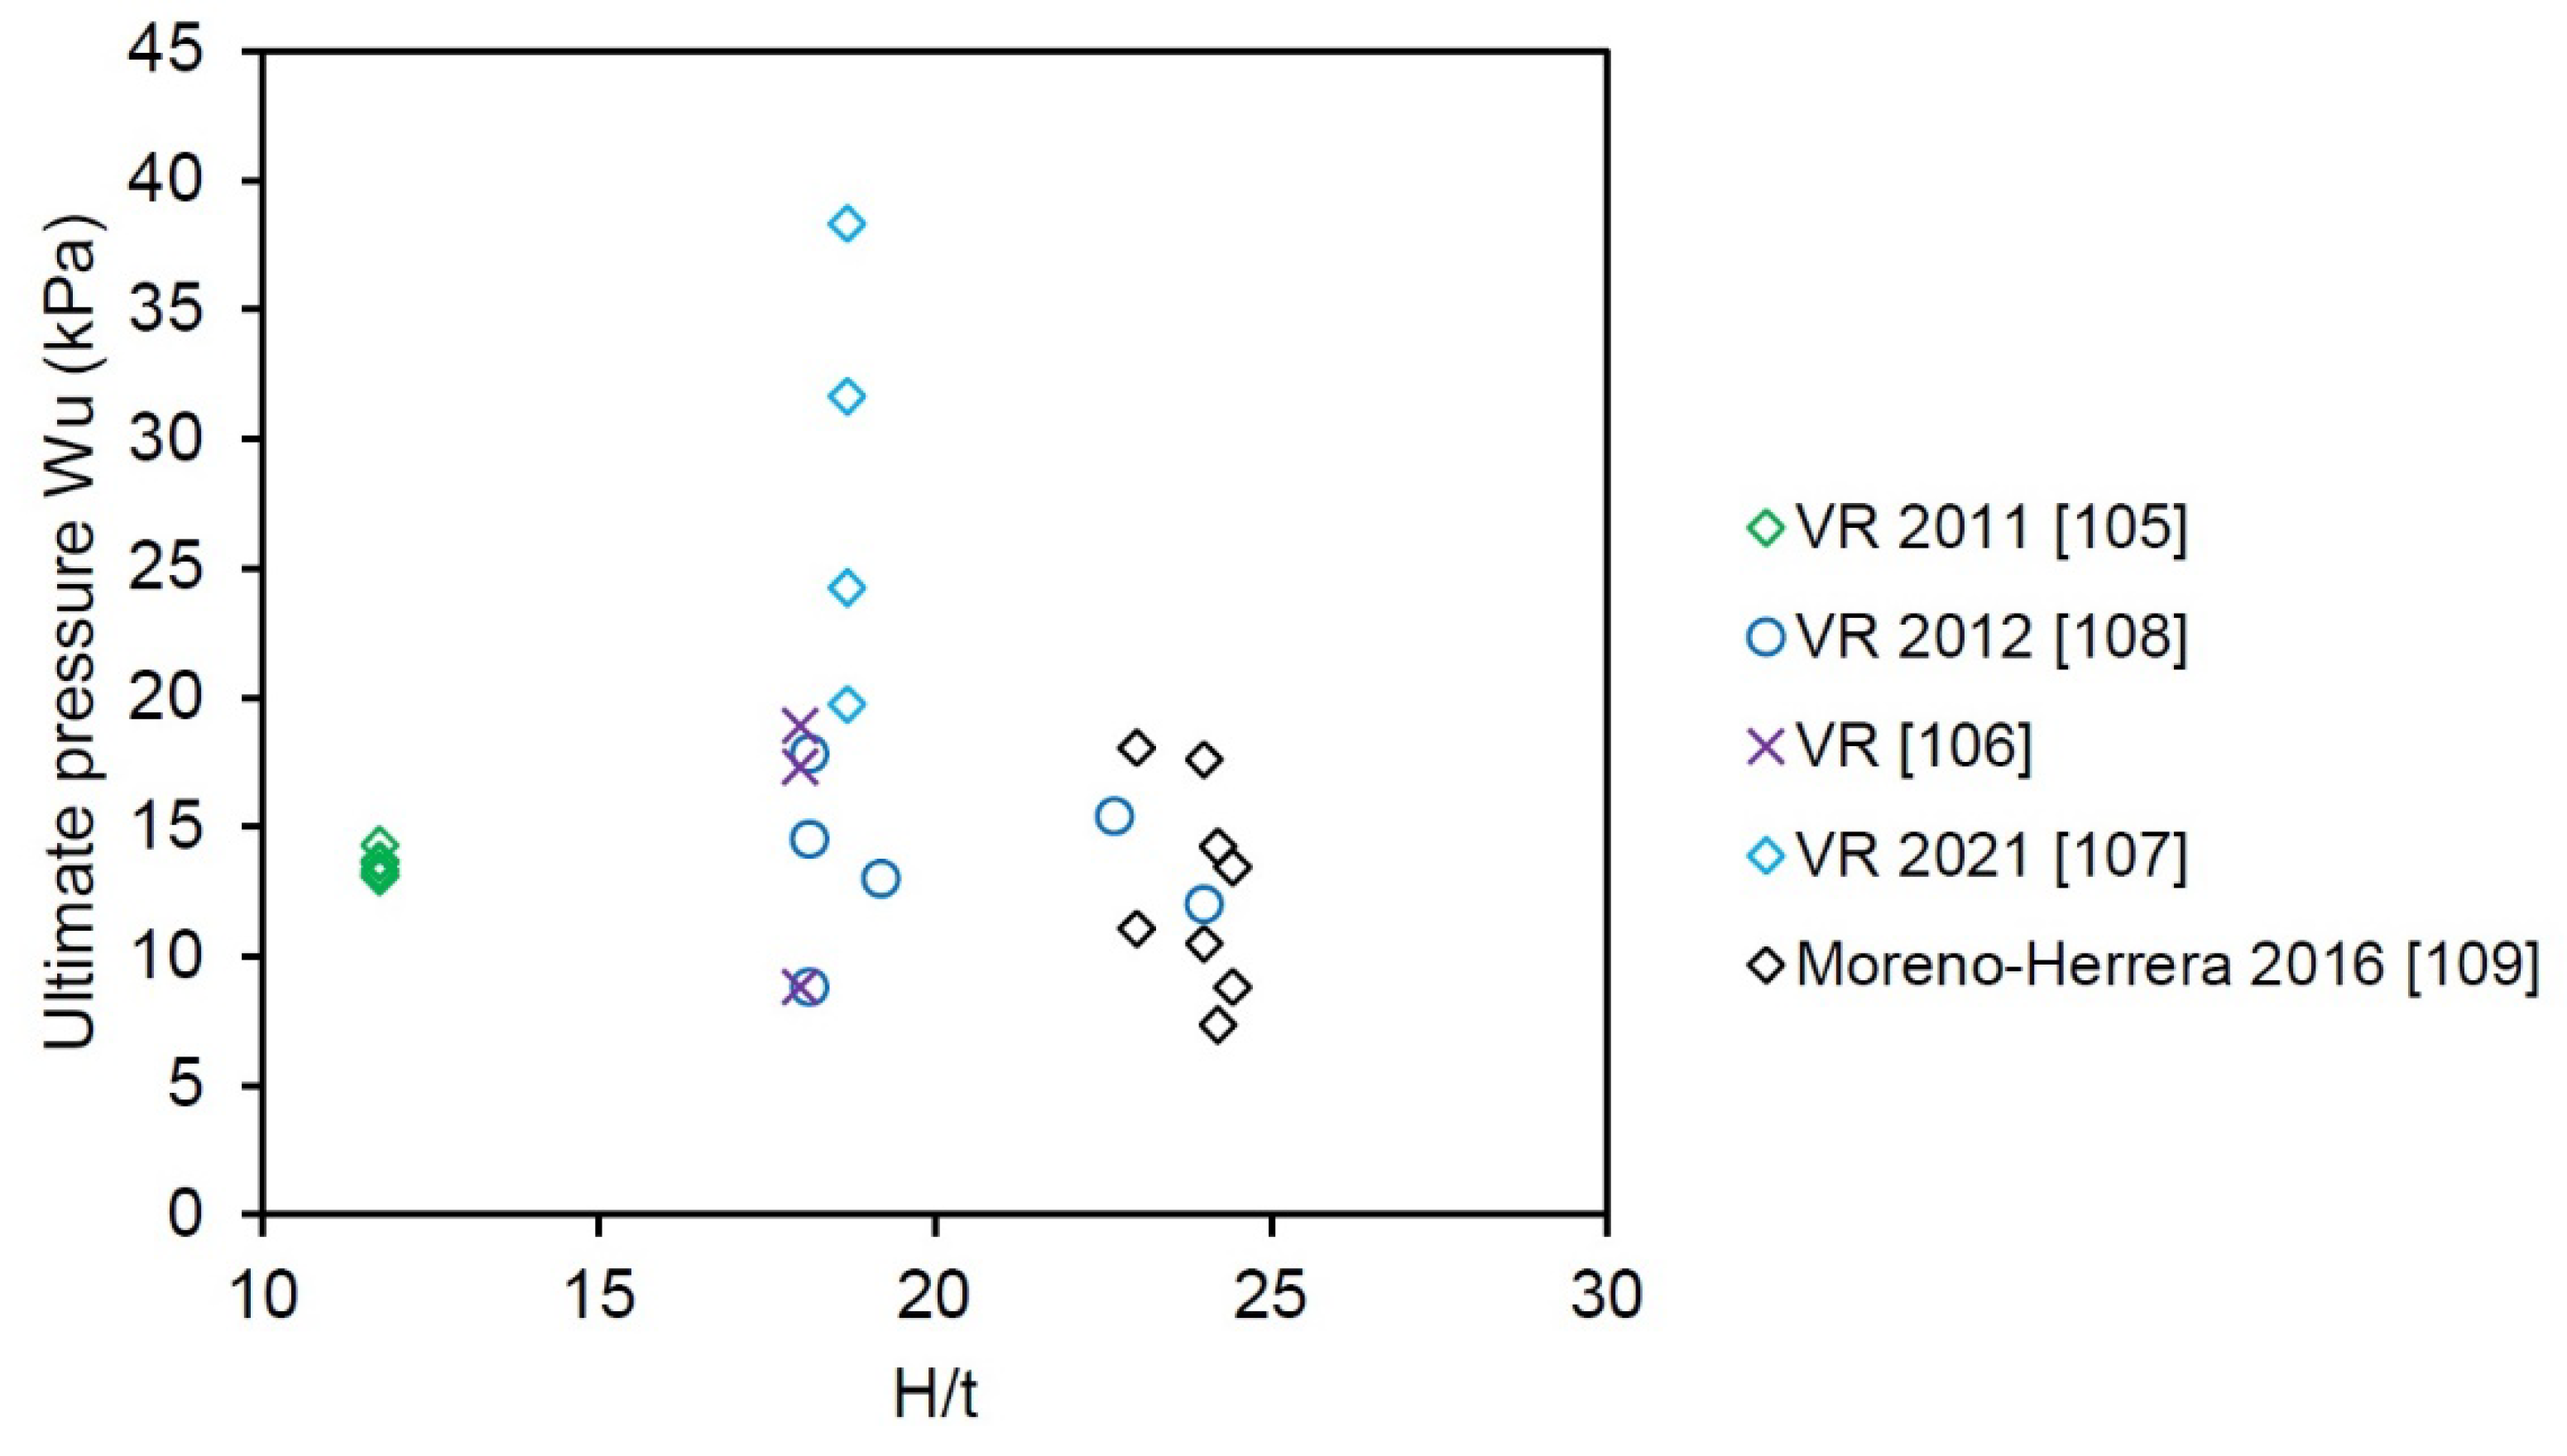
values in the range from 12.0 to 25.0 showed a significant scatter in the ultimate pressures. There is no clear trend for a relationship between ultimate pressure and
value, as shown in
Figure 21.
However, some analytical models [
50,
104] considered slenderness ratio (
) as the main parameter for predicting the OOP strength of masonry walls.
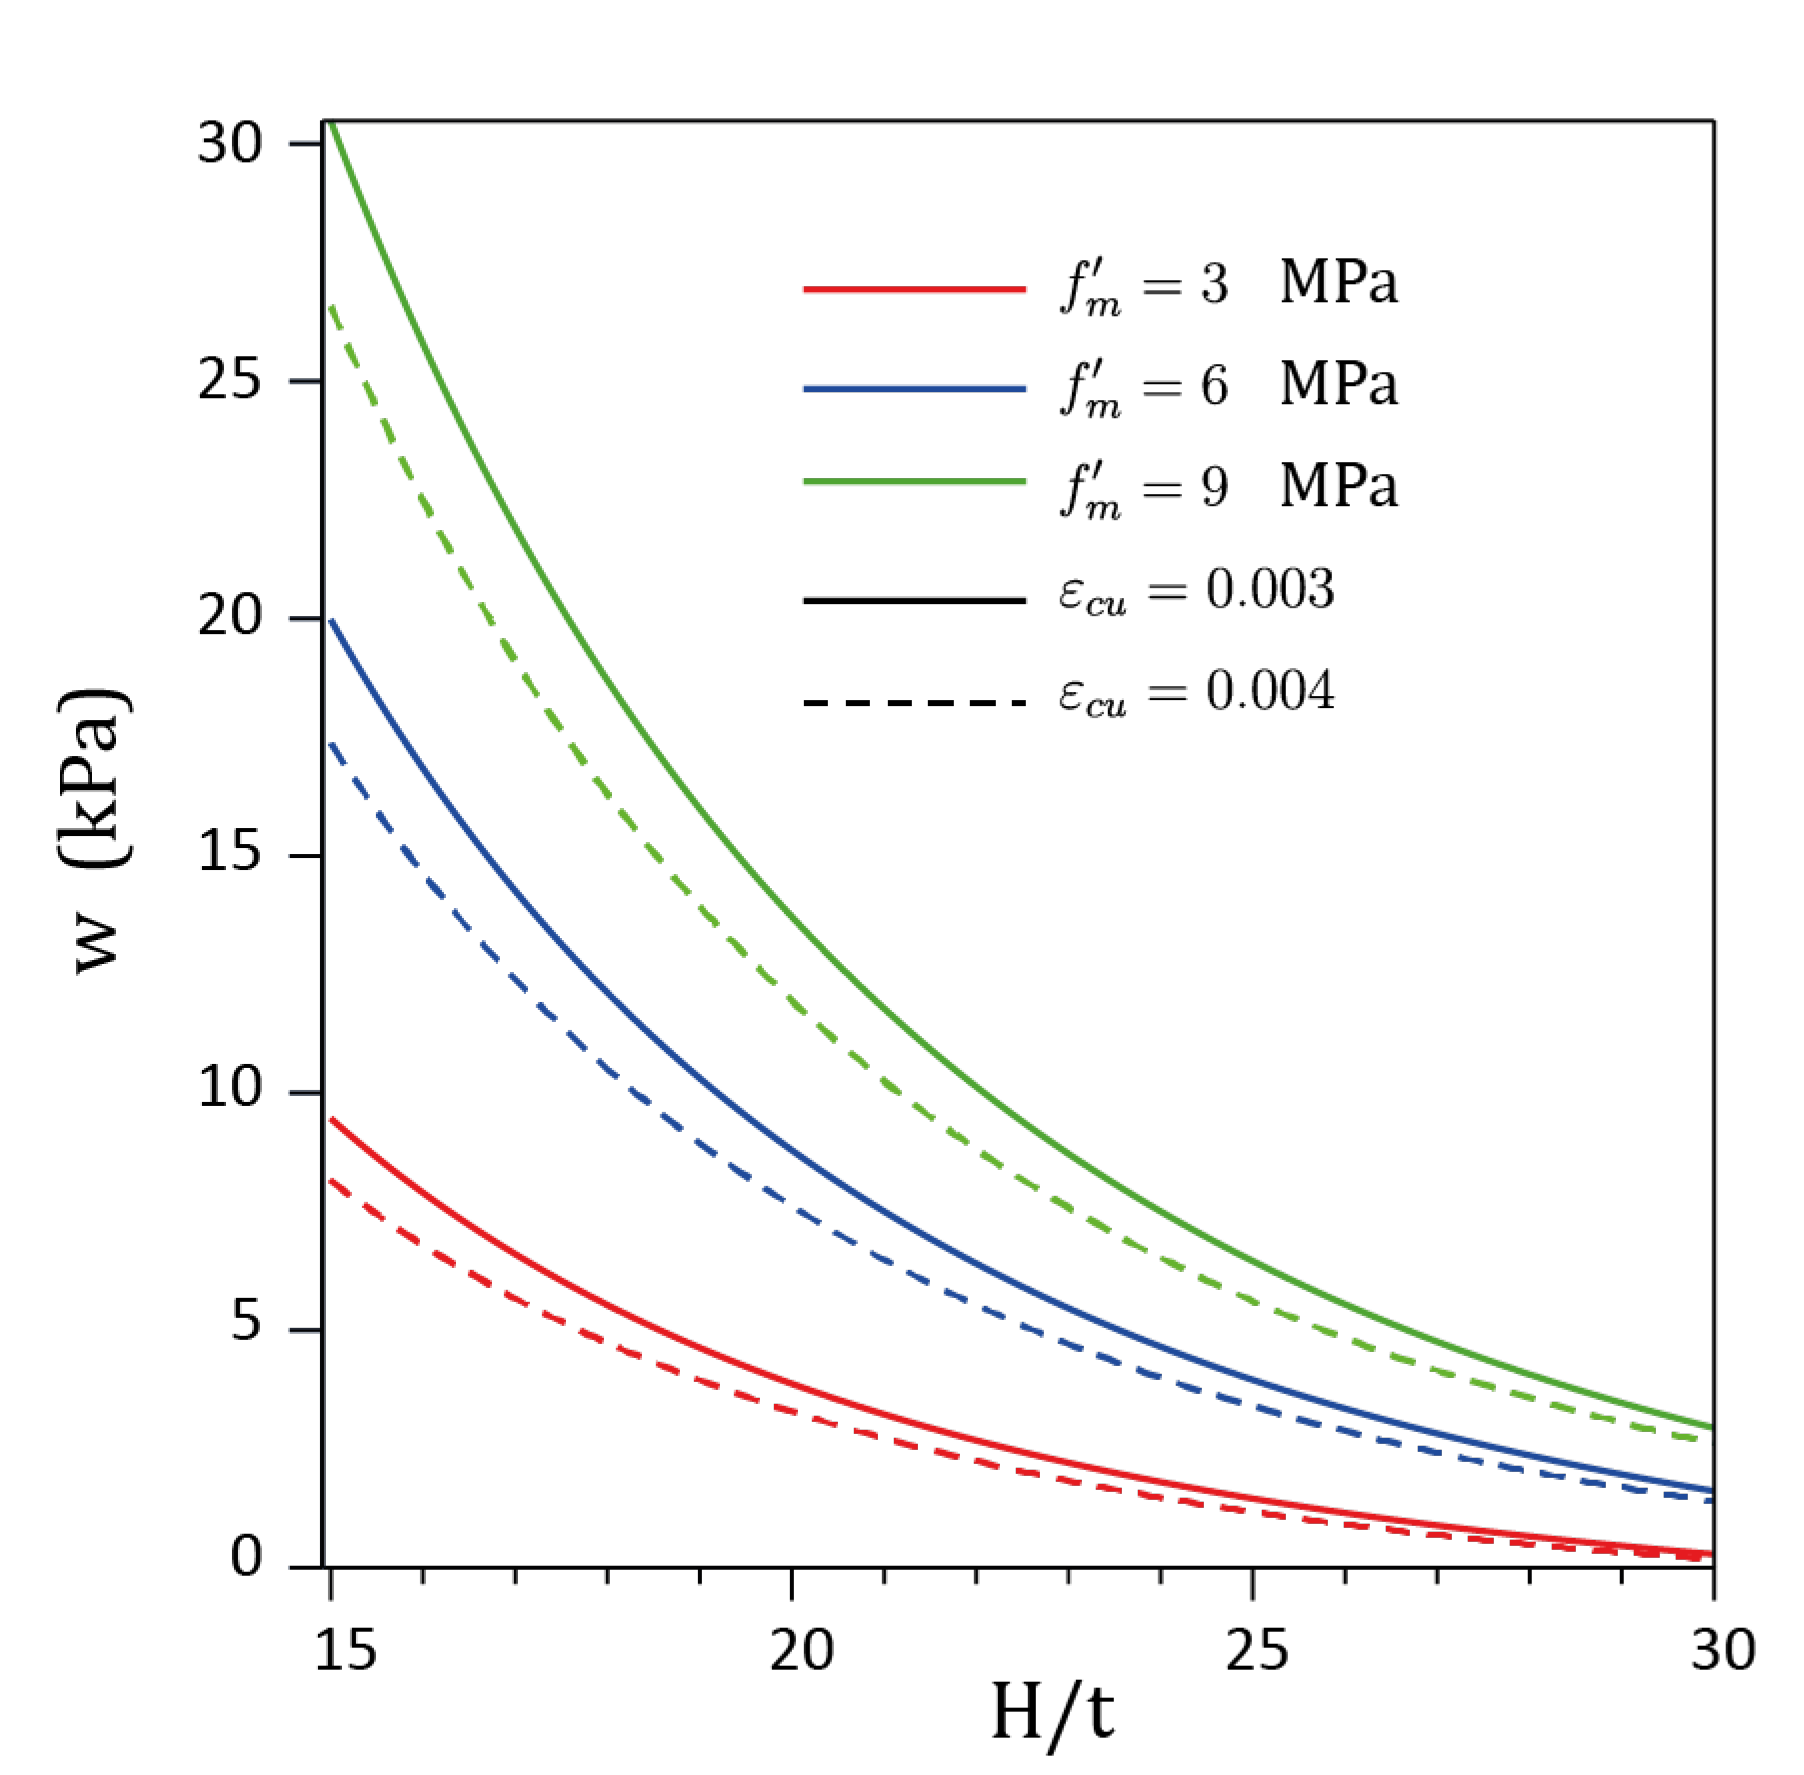
Charts presented in
Figure 22, developed based on the analytical model proposed by Angel et al. [
104] show a variation in the OOP ultimate pressure depending on the slenderness ratio (
), the masonry compressive strength
, and the ultimate masonry compression strain,
. The predictions appear to be reasonable (on the conservative side) in comparison to the reported experimental data [
101,
102,
103,
104,
105] for
values less than or equal to 25.
Tu
et al. [
112] performed an experimental study that involved shaking table testing of two single-storey CM structures subjected to OOP excitation. The results showed that the OOP lateral resultant force for a less slender specimen B2 (
) was six times higher than that for a more slender specimen B1 (
); this is in agreement with analytical results shown in
Figure 22. For example, the curve corresponding to
MPa and
shows that ultimate pressure increases from 5.0 to 30.0 while the corresponding slenderness ratio increases from 15 to 30.
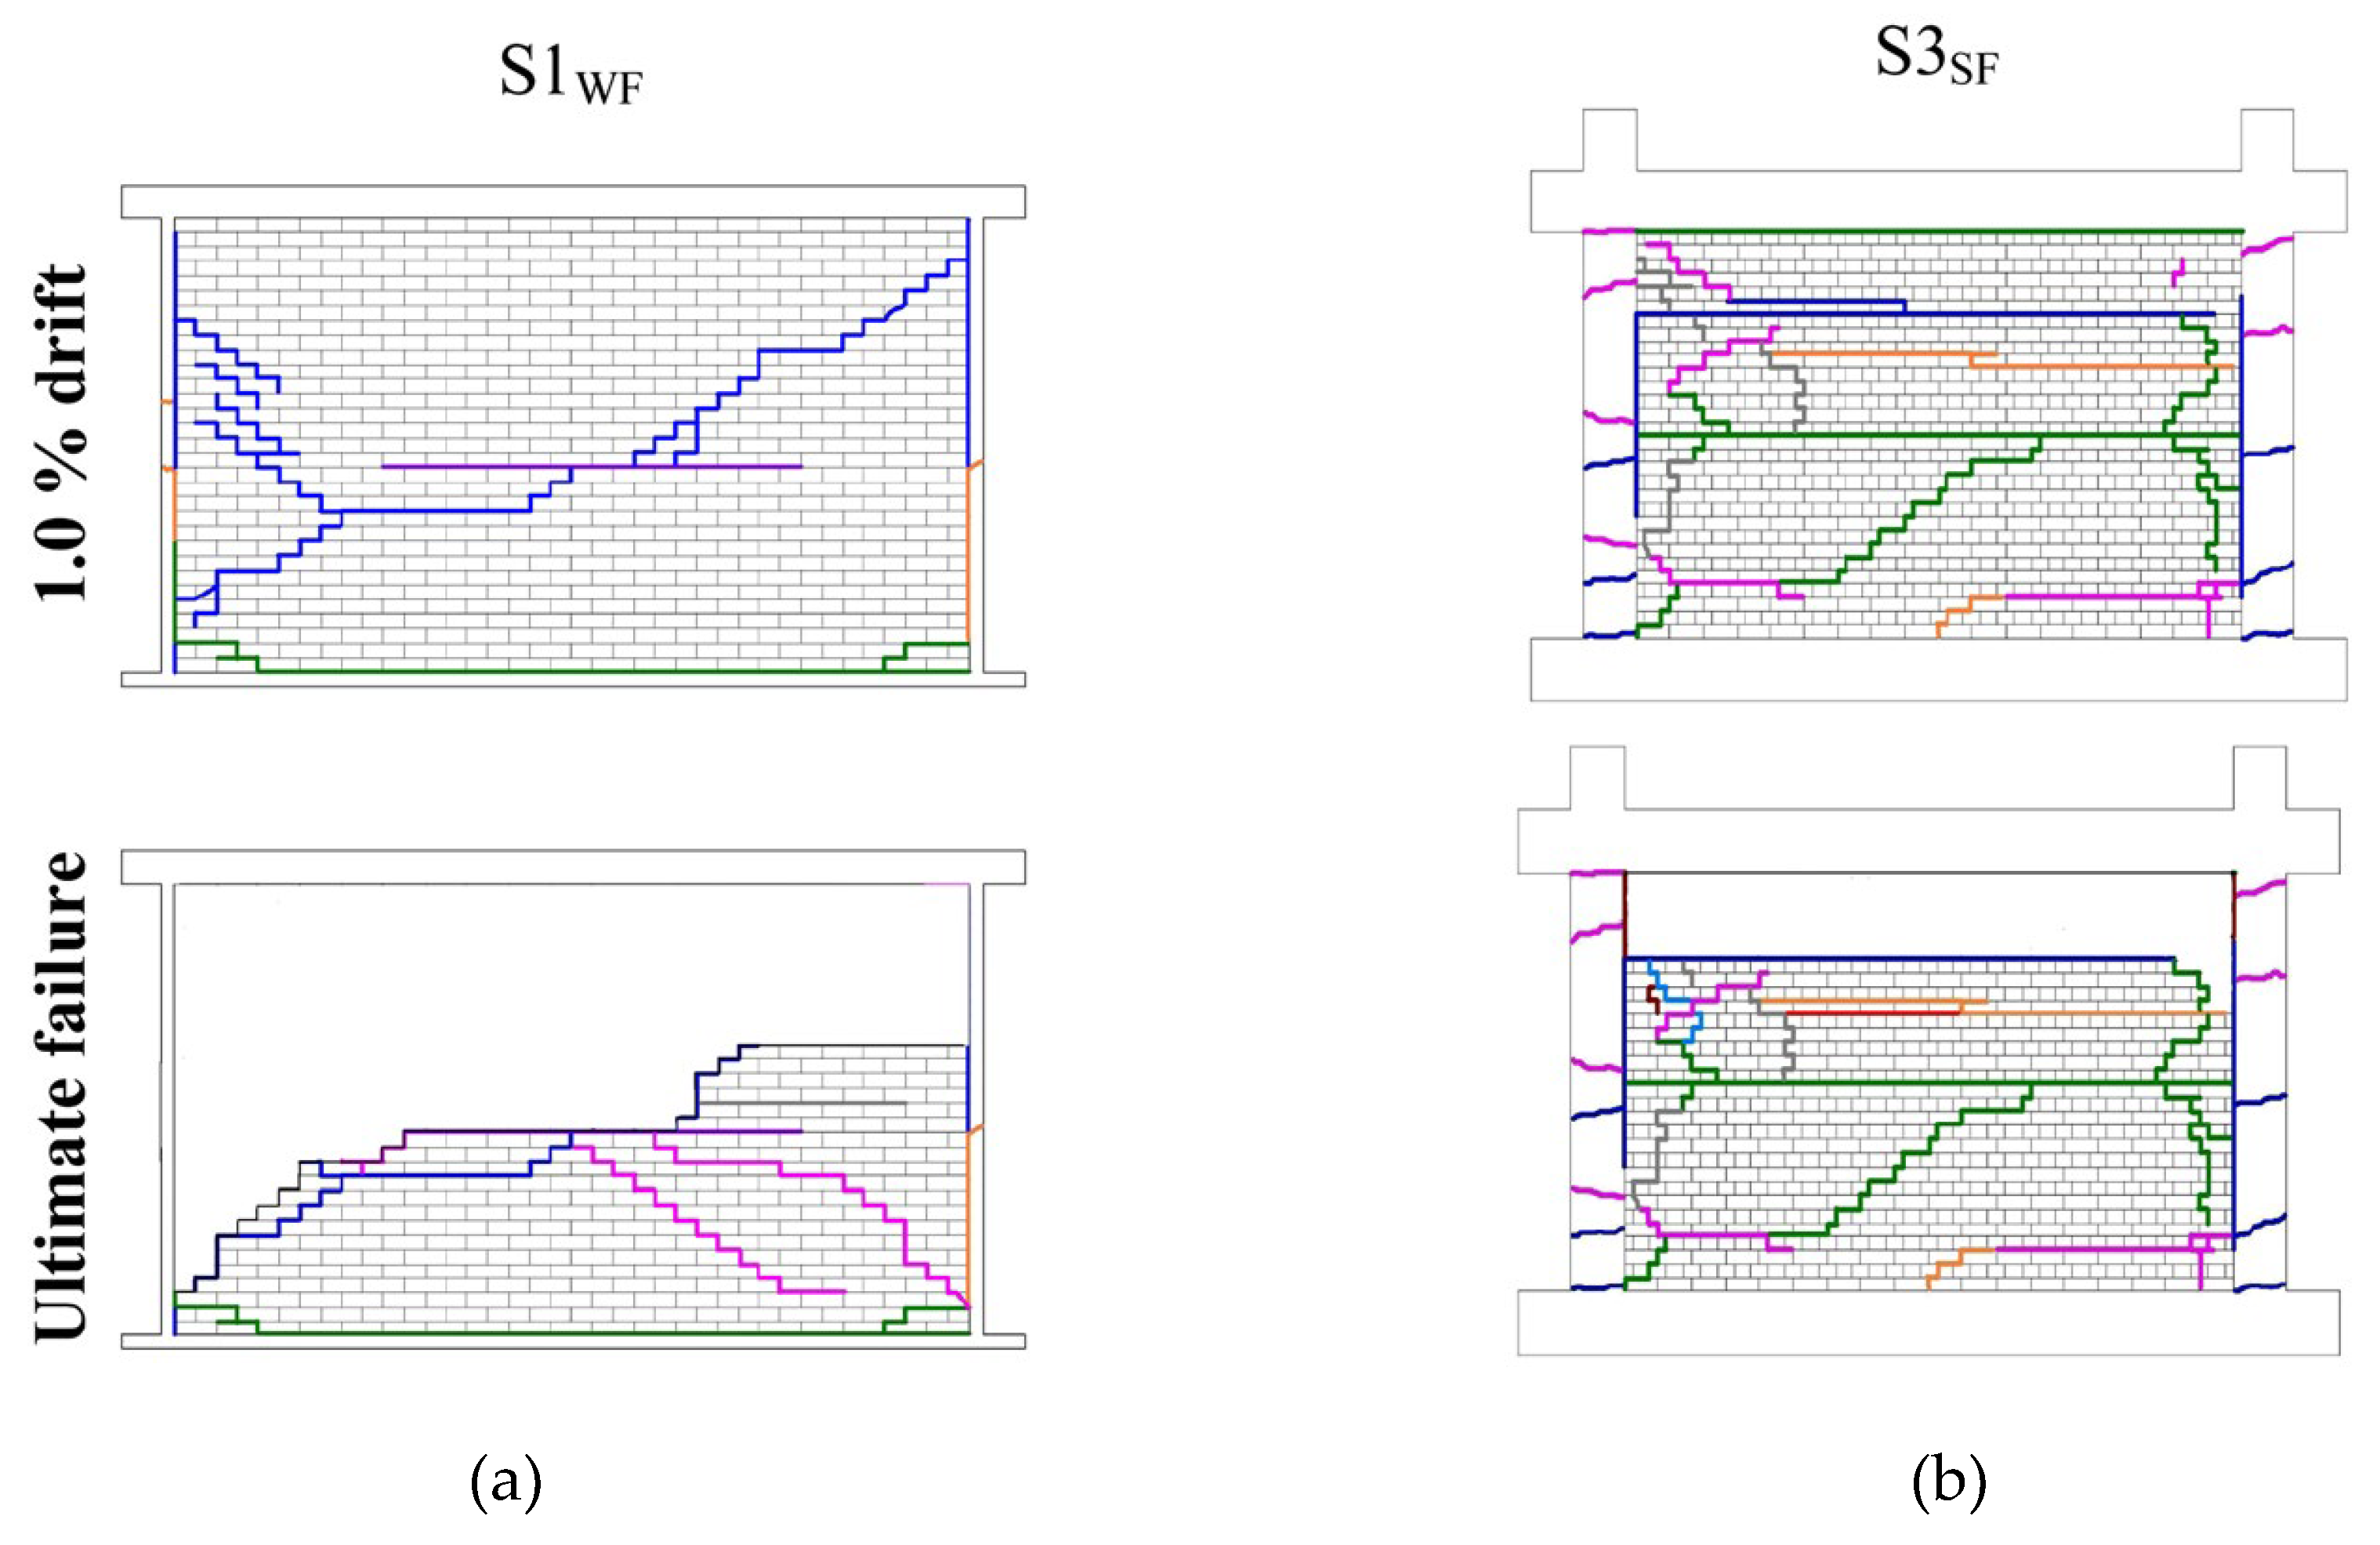
The effect of slenderness on the OOP behaviour of CM walls and RC frames with infills was studied on 3 half-scaled CM wall models that were subjected to in-plane reversed cyclic loading and subsequent OOP vibrations induced via shaking table [
113]. A more slender specimen, S1
WF (
) with a weak RC frame (similar to a CM wall without toothing) demonstrated bed-joint sliding masonry failure which ultimately led to the formation of plastic hinges at the ends of tie-columns and a shear failure at the wall mid-height. A less slender specimen with a more robust RC frame, S3
SF (
) experienced uniformly distributed cracking over the masonry panel and sliding over two distinct horizontal planes. It was observed that a less slender specimen showed better behaviour and experienced less damage than an otherwise similar slender specimen. Damage patterns for these specimens are presented in
Figure 23.
4.3. Effect of Wall Aspect Ratio (H/L)
Majority (23 out of 32) of past experimental studies on CM walls subjected to OOP uniform pressure were focused on squat wall specimens with an aspect ratio (
) less than 1.0 (see
Table 2). The results showed that the ultimate pressure values ranged from 8.79 to 18.91 kPa, with an average value of 13.42 kPa and standard deviation of 3.15 kPa (
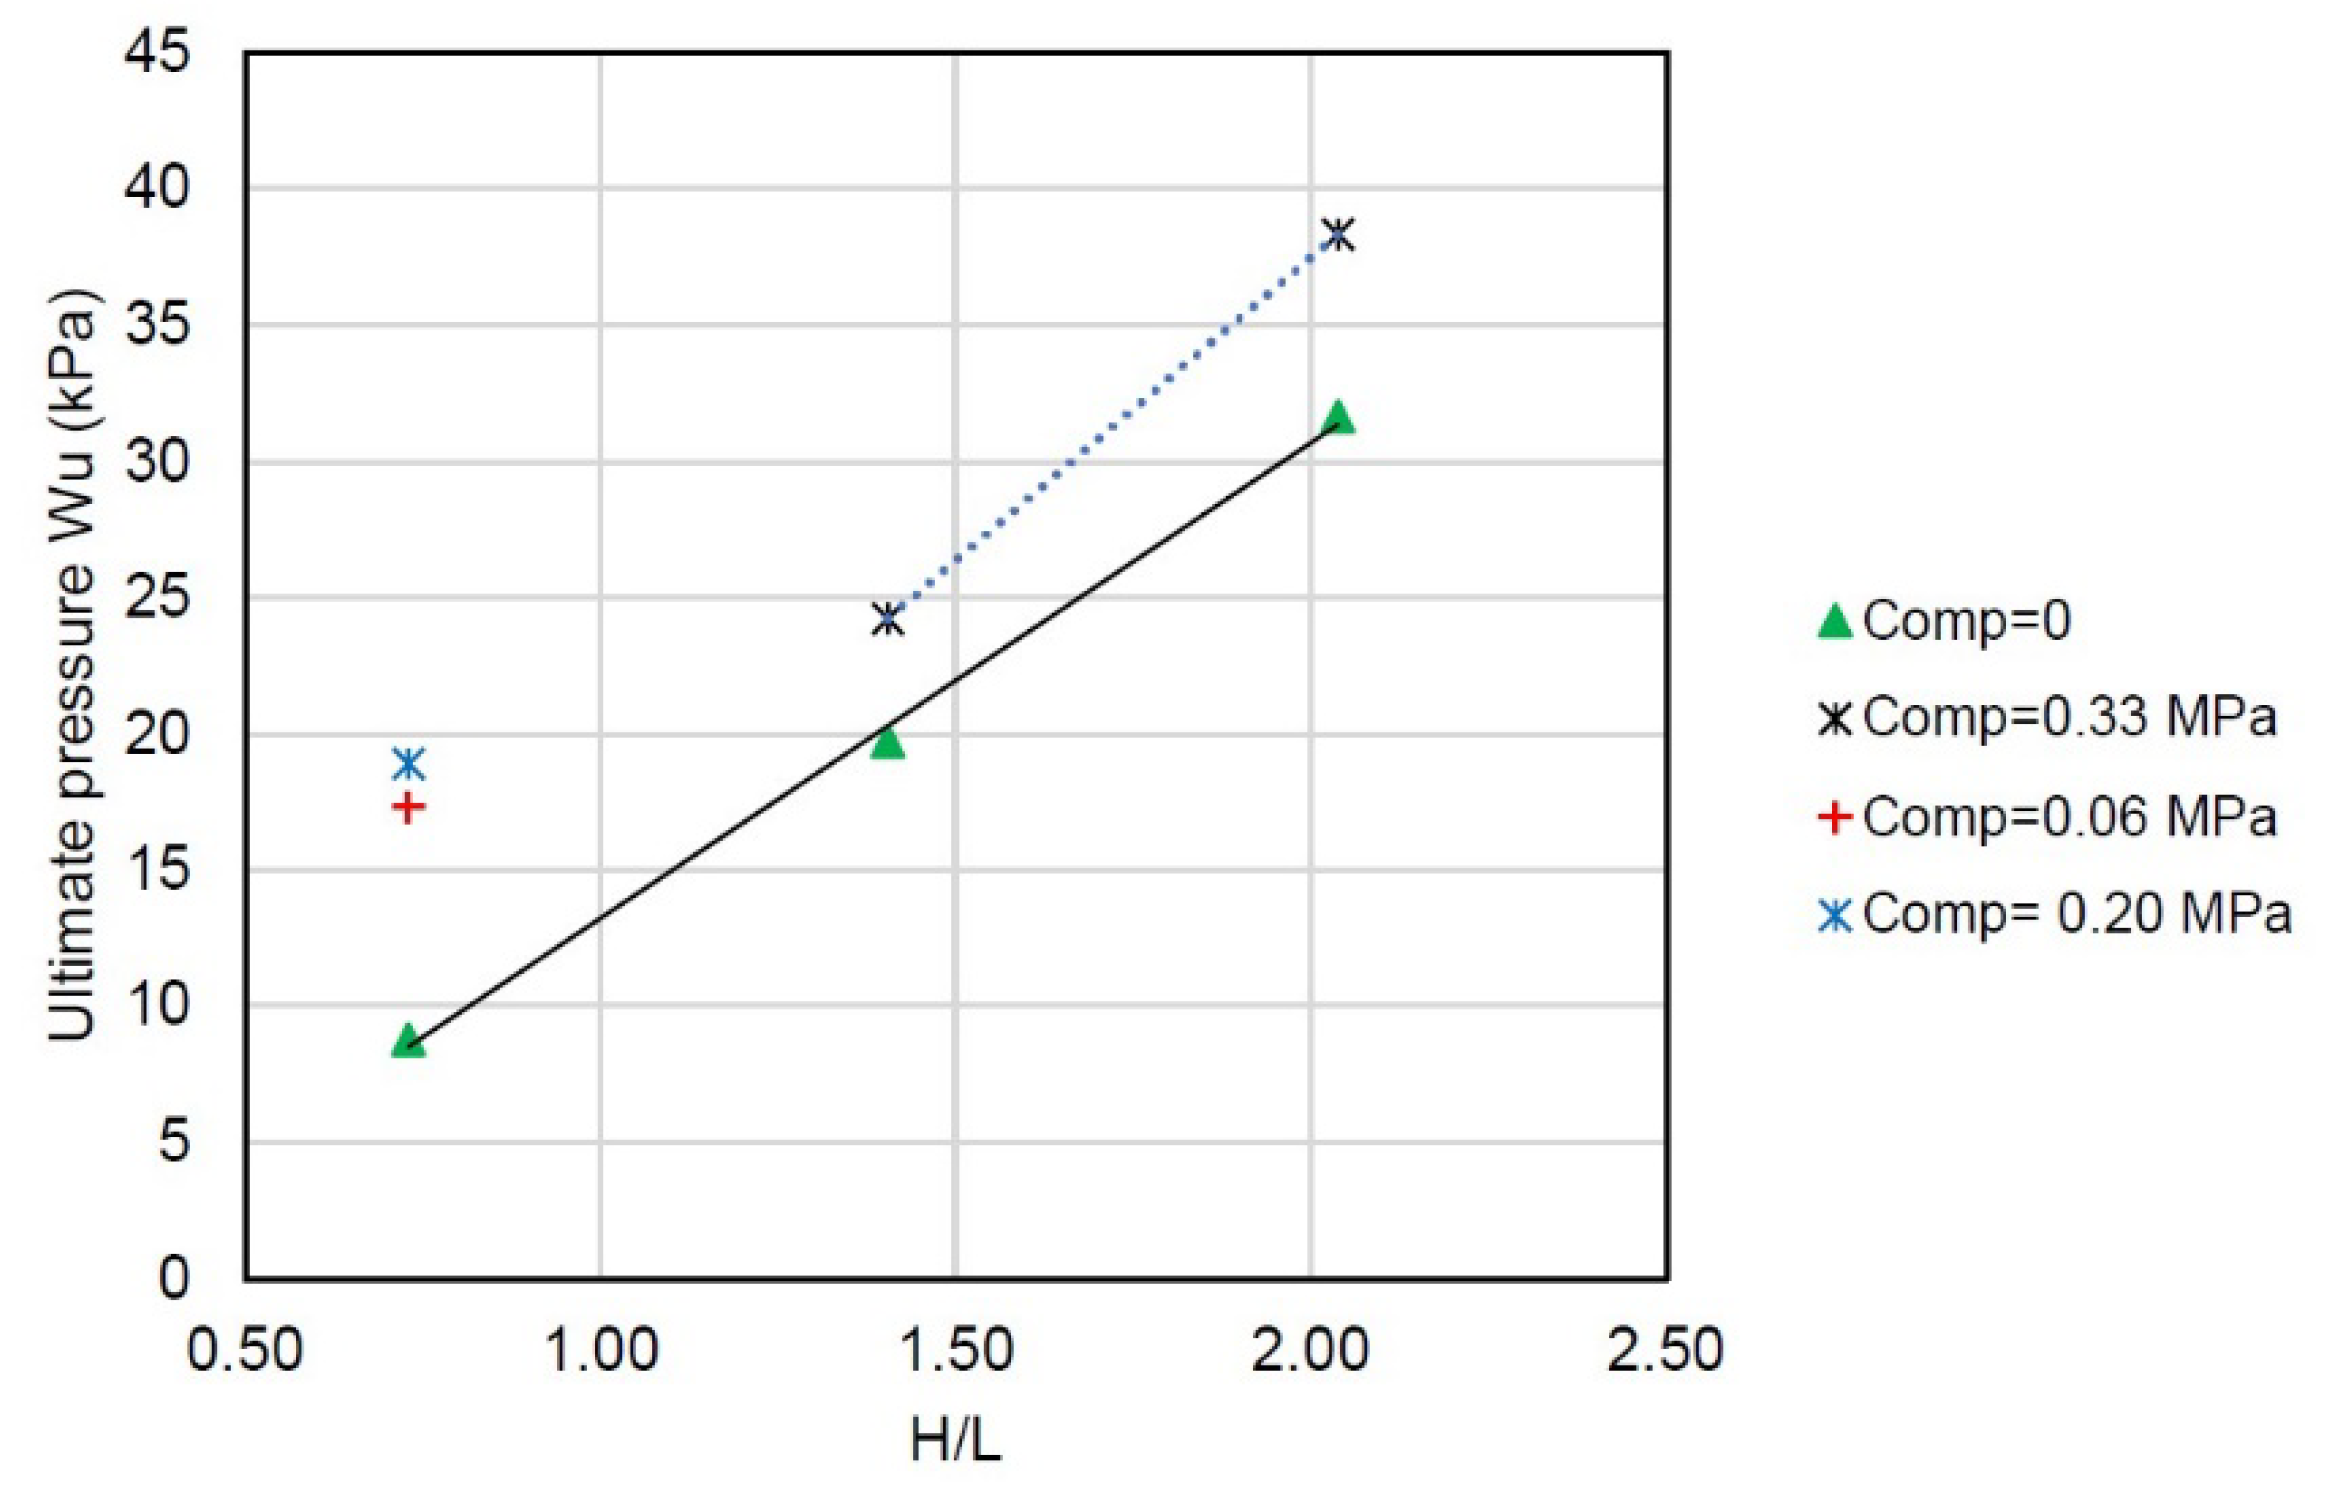
Figure 24). Varela-Rivera et al. [
108] also performed a study on non-squat CM walls (aspect ratios of 1.4 and 2.0) subjected to different axial compression levels. It was observed that the ultimate pressure increased with an increase in the aspect ratio (
Figure 25).
4.4. Effect of Axial Compression
Varela-Rivera et al. [
107] studied the effect of axial compression on the behaviour of CM walls subjected to OOP uniform pressure. Three full-scale squat CM wall specimens with
H/L ratio of 0.73 were subjected to different axial compression levels, ranging from 0 (specimen S-1) to 0.2 MPa (specimen S-3), corresponding to 8% of the masonry compression strength
. The results showed that the specimens with applied axial compression attained approximately twice the pressure of specimen S-1 without axial compression. Varela-Rivera et al. [
108] also studied the effect of axial compression on the behaviour of CM walls by testing 4 non-squat wall specimens (aspect ratios of 1.4 and 2.0). All specimens were supported on 4 sides. Two specimens were subjected to a low axial compression of 0.33 MPa (less than 10% of the masonry compression strength
), while the remaining two specimens were not subjected to axial compression. For the specimens with the same
ratio (1.4 or 2.0), it was observed that the ultimate pressure increased by 15-20% with an increase in the axial compression level. The results for selected specimens discussed in this section are presented in
Figure 25.
4.5. Effect of the Stiffness of RC Confining Elements
Stiffness of CM confining elements is an important parameter that influences seismic response of CM walls subjected to OOP seismic effects, but its effect has not been extensively studied. It is well established that CM walls subjected to monotonic OOP loading behave similarly to two-way slabs subjected to uniform gravity loading. A common design approach for URM walls subjected to OOP uniform pressure is similar to the design of two-way slabs subjected to uniform gravity load [
73]. Experimental studies (e.g. [
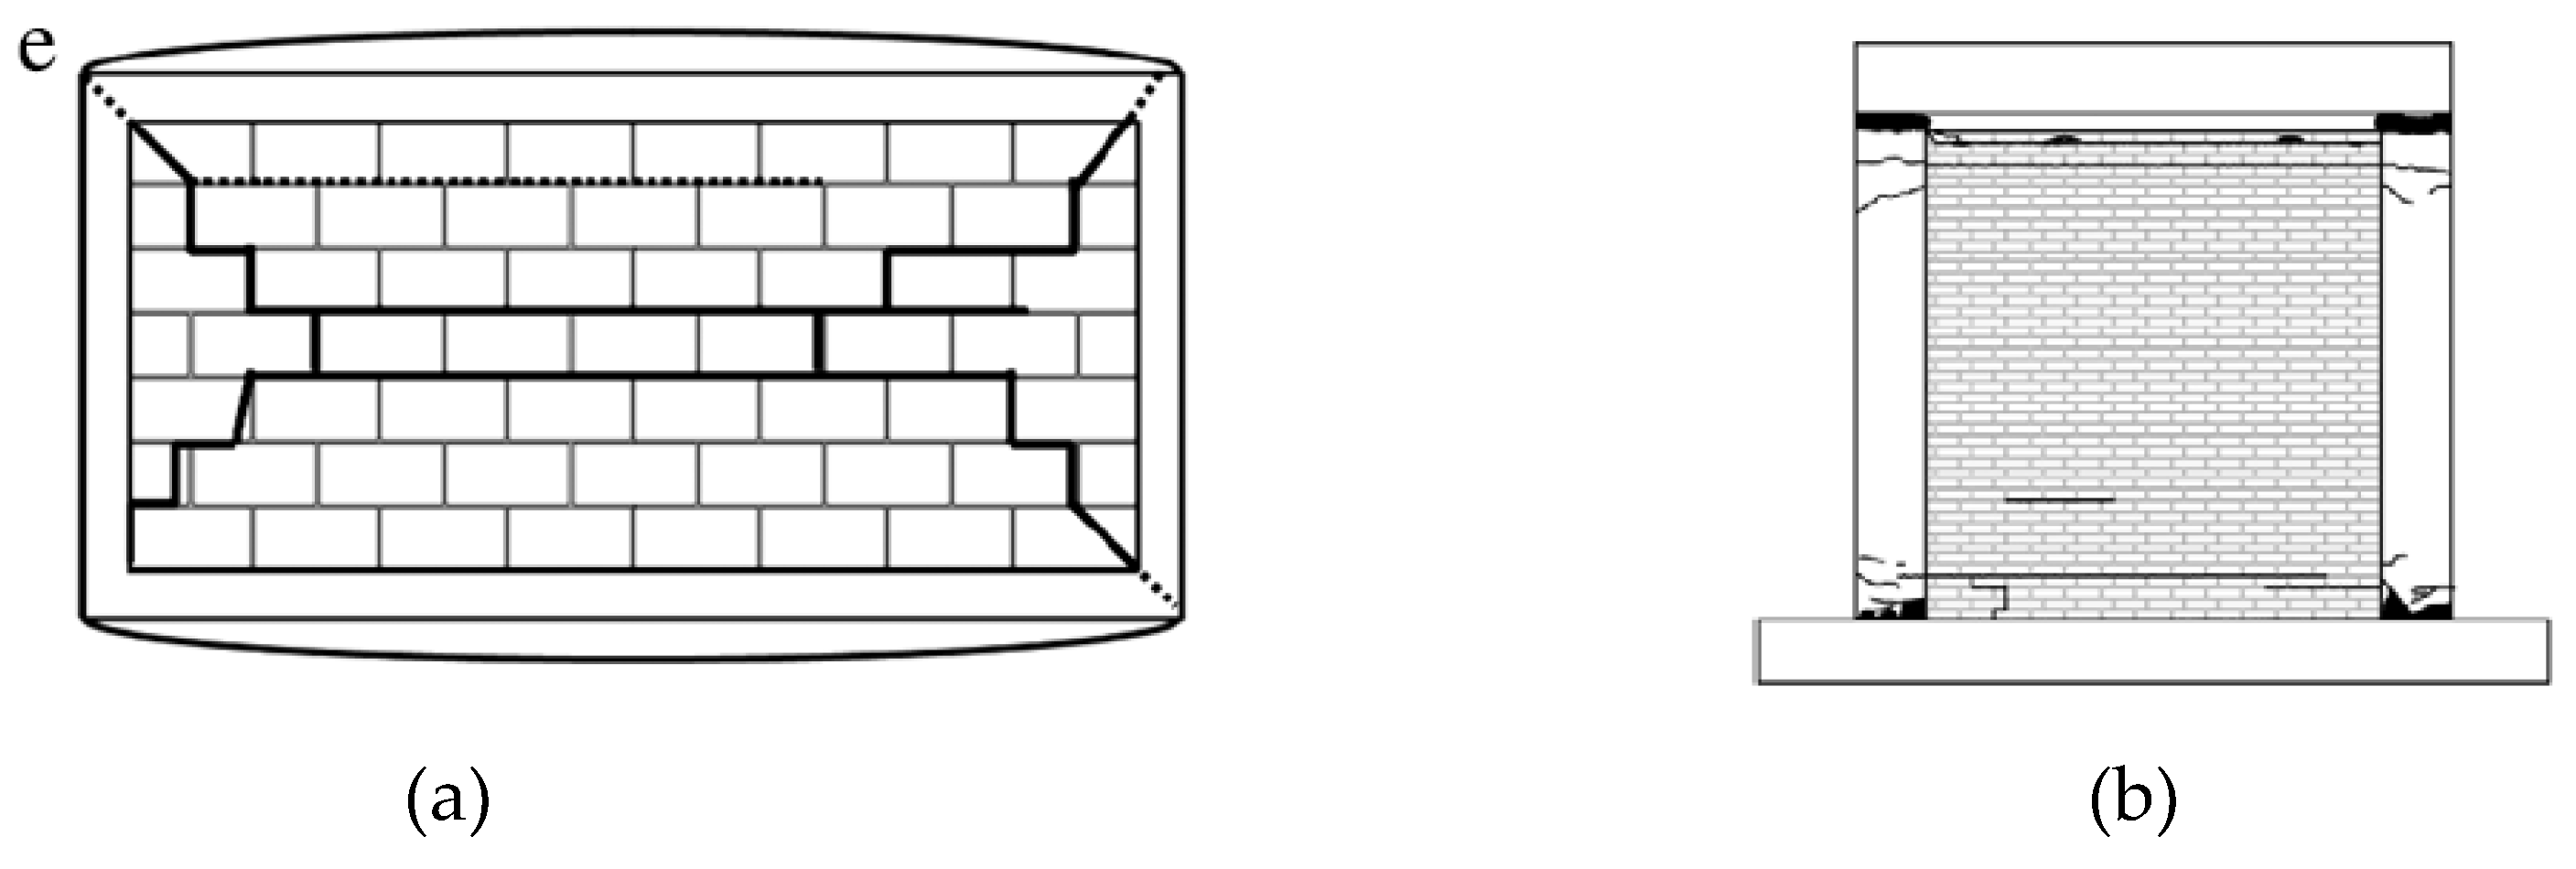
50]) have shown that OOP failure mechanism for CM walls also depends on the stiffness of RC confining elements. Failure of CM walls with stiff RC confining elements is characterized by masonry crushing (e.g. specimen E-4 shown in
Figure 26a). Alternatively, a “snap through” failure mechanism characterized by large OOP displacements may be expected in CM walls with flexible RC confining elements, e.g. specimen E-1 shown on
Figure 26b).
Figure 26c) illustrates a difference in the ultimate pressure and OOP displacements for the two specimens. It can be seen from the chart that specimen E-4 (crushing failure) has attained higher ultimate pressure and smaller lateral displacements compared to specimen E-1 which experienced a “snap through” failure. It can be observed from the chart that an approximate difference in the ultimate displacements was on the order of 40%.
In CM walls supported on all four sides RC tie-beams are cast integrally with RC floor slabs. In an alternative design scenario, a CM wall is supported on three sides, while its top edge is supported by an RC tie-beam; this is characteristic for flexible (e.g. wooden) floor or roof diaphragms (see
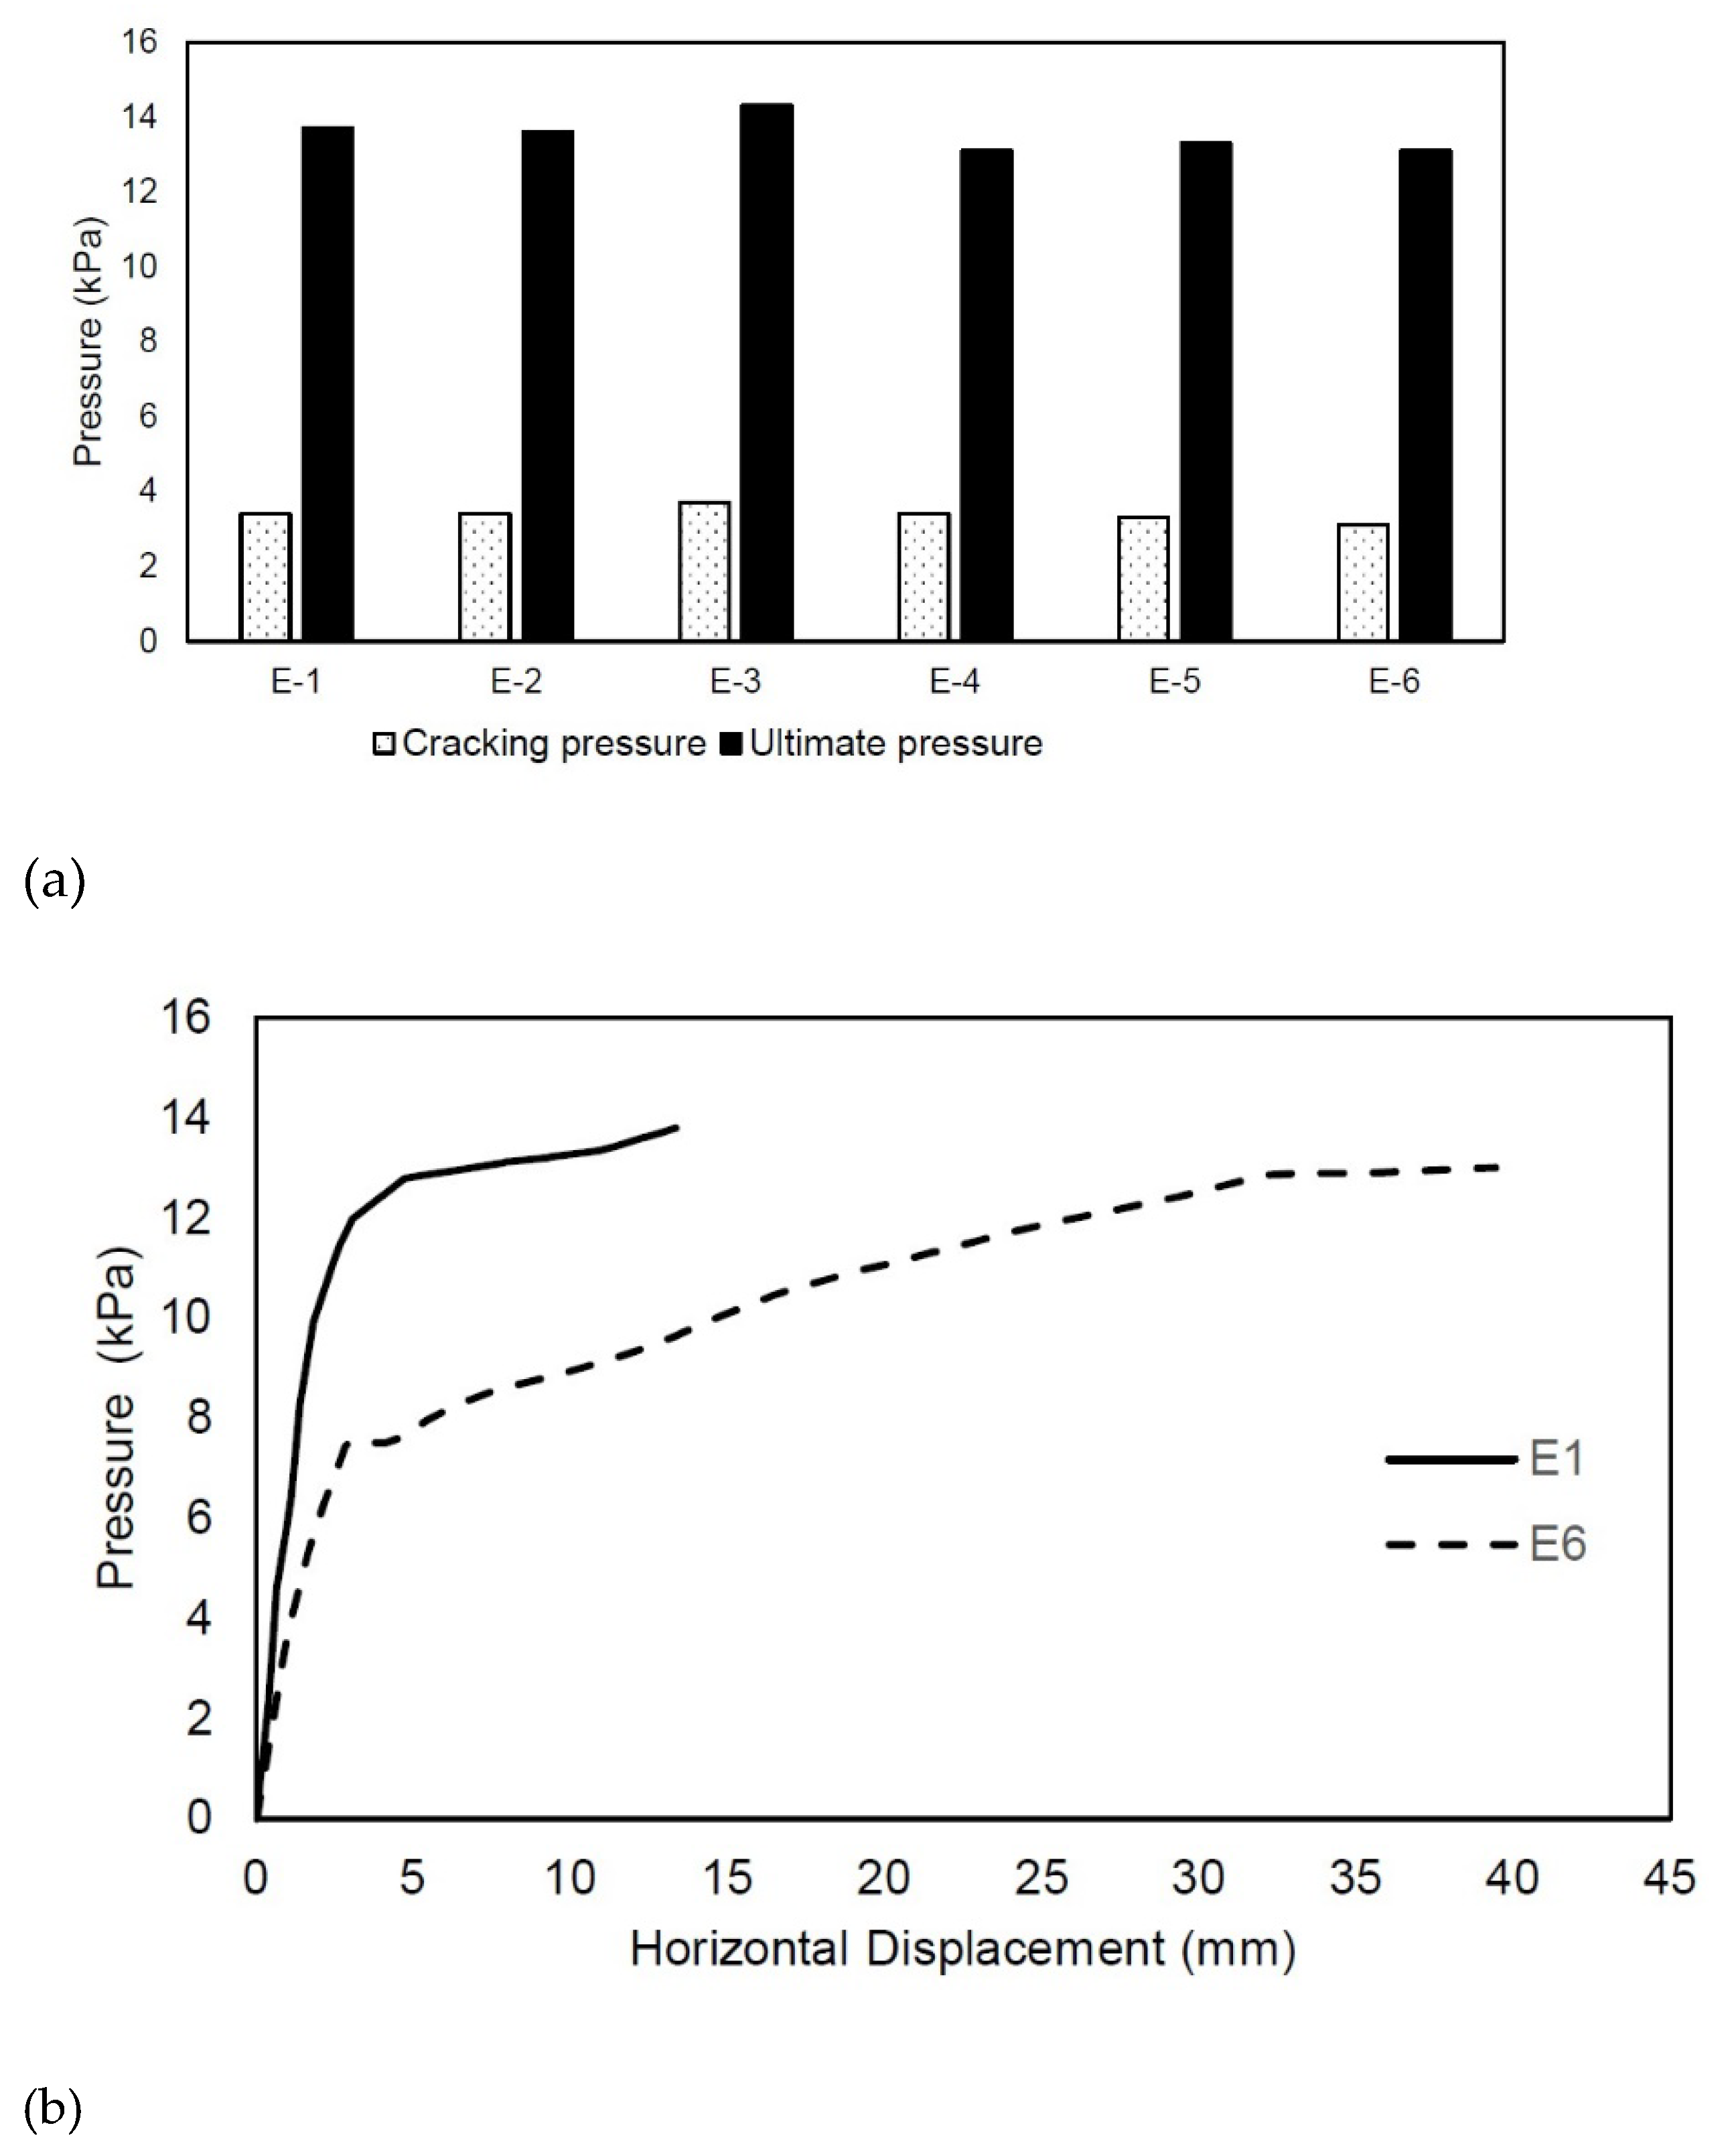
Figure 18a). The effect of the stiffness of confining elements was investigated through an experimental study on 6 full-size CM wall specimens subjected to increasing monotonic uniform lateral pressure applied via air bags [
106]. The specimens were supported either on 3 or 4 sides.
Figure 27a) shows that the magnitude of ultimate pressure was very similar for all specimens (difference within 10%). Although the magnitude of ultimate pressure was similar for specimens supported on 3 and 4 sides, a somewhat different behaviour was observed in the post-cracking stage for specimen E-1 (supported on 4 sides) compared to specimen E-6 (supported on 3 sides) (see
Figure 27b). In all cases, the ultimate pressure was approximately four times higher than the cracking pressure, which indicates a significant strength reserve in the post-cracking stage.
Although the results of experimental studies mentioned in this section are valuable, it is important to note that the studies were performed on single wall panels, which is an idealised scenario. In a real building several adjacent wall panels exist at the same floor level and also at different floors. Therefore, it is important to take into account the effect of stiffness of RC confining elements on the OOP capacity of CM walls.
4.6. Difference between Monotonic Static Loading versus Dynamic/Seismic Loading
In majority of past experimental studies on CM walls subjected to OOP loading the specimens were subjected to increasing monotonic pressure applied by means of air bags [
50,
106,
107,
108,
110]. The reported failure mechanism for CM wall specimens supported on 4 sides was similar to that found in two-way slabs subjected to gravity loading, as shown in
Figure 28a [
106].
However, a shaking table testing study on single-storey CM buildings [
112] showed that CM wall specimens subjected to OOP dynamic excitation via shaking-table developed horizontal cracks close to the wall-to-tie-beam interface at the top of the wall, and also at the base of the wall (
Figure 28b). These cracks extended into RC tie-columns at higher shaking intensities.
Air bags produce a nearly uniform pressure, which may be appropriate for simulating the effect of wind loading on wall specimens; however, seismic inertial forces cannot be adequately simulated by means of uniform pressure. A simple explanation can be provided by considering the dynamics of a single-degree-of-freedom (SDOF) system [
114] When a structure is idealized as a SDOF system, the equivalent static force F may be expressed as follows
where 𝐾 and 𝑀 represent stiffness and mass, respectively, and 𝐴 is ground pseudo-acceleration. Note that the displacement 𝑥 is equal to the product of a shape function, 𝜓, which is independent of time but depends on the boundary conditions, and 𝑧, a time-dependent scalar which corresponds to the displacement of a SDOF model, as follows
For a simply supported wall spanning in vertical direction, 𝜓 could be a parabolic or a sinusoidal function with zero displacement at the base and the top, but it cannot be a constant. The difference in shape for the load distribution over the wall height should be incorporated in the results of experimental and analytical studies in which the OOP wall capacity was determined based on the uniform load distribution. A significant capacity reduction (more than 20%) was obtained for the model subjected to a non-uniform pressure distribution.
6. Conclusions and research gaps
Past experimental research studies reviewed in this paper contain substantial evidence related to the seismic behaviour of CM walls. Based on the available experimental studies relevant conclusions and future research needs (shown in italics) have been summarised for each major topic.
In-plane shear
In most cases, CM shear walls subjected to in-plane seismic effects demonstrate a shear-dominant behaviour. An experimental database from several past research studies on CM wall specimens subjected to either monotonic or reversed cyclic lateral loading was used to establish critical parameters that influence the in-plane shear strength of CM walls. A statistical analysis of more than 100 experimental data points has confirmed that the masonry shear strength, , is proportional to the square root of masonry compression strength, , however the diagonal compression strength is a better indicator of the shear strength. Another influencing factor is the wall aspect ratio, , which has been accounted for by the factor which was proposed as a result of experimental research study. It was observed that shear-moment interaction due to applied bending moment at the top of the wall causes a decrease in the masonry shear strength, particularly for walls characterized by a higher aspect ratio. The results of experimental studies have confirmed that masonry shear resistance is also proportional to the level of applied axial compression. The contribution of horizontal joint reinforcement to shear resistance of CM walls was shown to be proportional to the reinforcement ratio and steel yield strength. The results of experimental studies pointed out that the effectiveness of horizontal reinforcement in CM walls may be limited, that is, there exists maximum limit for the amount of such reinforcement in the wall beyond which its effectiveness cannot be increased. The effect of RC tie-columns on masonry shear strength has been studied by several researchers, but the conclusions in terms of the effect of longitudinal reinforcement differ. A statistical analysis of experimental data performed by the authors has indicated that the masonry shear strength is proportional to square root of the product of longitudinal reinforcement ratio, steel yield strength, and concrete compressive strength, and the results show that the amount of longitudinal reinforcement in RC tie-columns has a significant influence on the masonry shear strength.
Further experimental research studies are needed on the following topics:
shear strength of walls in tension;
the effect of geometry of masonry units on the masonry shear strength (bricks vs blocks, perforated units);
a rational mechanical model to understand the shear contribution of horizontal reinforcement, and
an interaction of in-plane shear and flexure.
In-plane flexure
Flexural failure of CM shear walls subjected to combined axial load and in-plane lateral loading is less common than the shear failure, hence the experimental research evidence related to in-plane flexural behaviour of CM walls is limited. In general, flexure-dominant behaviour is characterized by yielding of longitudinal reinforcement and crushing of concrete at the base of RC tie-columns. Vertical cracks develop along the masonry to tie-column interface in slender CM specimens with higher aspect ratios. A comprehensive experimental study on 28 CM walls performed in Japan [
97] showed that the specimens with cantilevered boundary conditions experienced either a shear-dominant or sliding failure mechanism while the specimens with fixed ends experienced a flexural failure. The study showed that horizontal dowels provided at the masonry to tie-column interface are effective in preventing the separation of RC tie-columns from masonry panels. Recent experimental research studies performed in Mexico on CM walls subjected to reversed cyclic loading showed that the specimens with predominant flexural behaviour attained higher displacement ductility at the ultimate stage than the CM walls with predominant shear behaviour; this is a very important consideration for the performance-based seismic design. The results of previous experimental studies performed in Mexico [
13,
96] have indicated that the normalized moment resistance of CM walls increases with an increase in the axial stress level, however it appears that the effect of higher axial stress level is more important for CM walls with an aspect ratio of 2.0 or higher.
The results of a parametric numerical study performed by the authors indicate that the key parameters influencing the type of failure mechanism (flexure or shear) in CM walls are: axial stress level, masonry shear strength, horizontal reinforcement ratio, wall aspect ratio, and tie-column longitudinal reinforcement ratio. The study showed that the walls with aspect ratio higher than 1.0 and/or with higher masonry shear and compression strength are expected to experience a flexural failure. The amount (ratio) of horizontal reinforcement in the masonry panel is probably the most important parameter: the higher the horizontal reinforcement ratio the higher is the chance of flexural failure. An increased amount of horizontal reinforcement leads to an increased shear capacity of CM walls.
Further experimental research studies are needed on the flexure-dominant behaviour of CM walls of all types, including different types of masonry units, wall aspect ratios, and axial load levels.
Out-of-plane (OOP) behaviour
OOP failure mechanism in CM walls subjected to seismic effects is complex, and depends on the type of loading, as shown by experimental studies. Arching mechanism can be used to estimate the OOP resistance (ultimate pressure) for loadbearing masonry walls, including CM walls. According to the concept of arching mechanism, two or more rigid segments form in a cracked masonry wall subjected to combined gravity loading and lateral pressure. The mechanism can culminate in masonry crushing, which is characteristic for the walls with low slenderness (H/t) ratios, but additional factors are masonry compressive strength and the stiffness of adjacent RC confining elements. An alternative failure mechanism is lateral instability due to excessive horizontal displacements, referred to as “snap-through” failure; this mechanism may be expected in slender CM walls and walls with flexible RC confining elements. Mechanical models based on a bi-directional arching mechanism are more accurate than one- directional models, which tend to be conservative (predict lower resistance). It is important to note that bi-directional models consider the wall aspect ratio as an indicator of OOP resistance. Past studies indicated that the OOP resistance of CM walls depends on a few parameters, including the wall geometry (height, length, thickness), stiffness of adjacent RC confining elements, and masonry compression strength. A review of past experimental studies on CM walls subjected to monotonic OOP pressure [
105,
106,
107,
108,
109] has shown a significant scatter of ultimate pressure for specimens with different slenderness ratio, however the results of a shaking table study [
111] showed that less slender walls have higher OOP resistance, which is in line with the predictions obtained from analytical models [
50,
103]. The wall aspect ratio and axial stress level also influence the OOP behaviour of CM walls - experimental studies have shown that the ultimate pressure for CM walls increases with an increase in the aspect ratio and axial stress level. Stiffness of RC confining elements is a very important parameter that influences seismic response of CM walls. Experimental studies on CM walls showed that walls with stiff RC confining elements experience masonry crushing failure, while walls with flexible RC confining elements experience a “snap-through” failure.
Further experimental research studies are needed on the following topics:
the OOP response of CM walls constructed using clay bricks and multi-perforated clay blocks;
the effect of stiffness of RC confining elements on the OOP behaviour of CM walls;
a comparison of OOP behaviour of masonry infills in RC frames and CM walls under reversed cyclic loading;
the OOP response of CM walls subjected to reversed cyclic loading, and also dynamic loading (e.g. shaking table tests), and
the effect of combined in-plane and OOP loading.
Openings in CM walls
Openings in CM walls subjected to seismic effects cause a decrease in the peak strength and stiffness, as evidenced by several experimental studies and also reports from past earthquakes. The extent of strength decrease depends on the size of an opening relative to the size of a wall panel and the position of opening within the panel. A ratio of the area of an opening relative to the CM panel area, , can be used to predict strength decrease in CM walls with openings. Experimental studies have confirmed a beneficial effect of vertical and horizontal RC confining elements around the openings, which are effective in reducing the extent of damage and maintaining the wall’s strength, stiffness, and displacement/drift potential.
Further experimental research studies are needed on the following topics:
the in-plane and OOP behaviour of walls with openings, considering different size and location of openings;
the effect of size and location of confining elements in walls with openings, and
behaviour of CM walls with openings in buildings with flexible floor/roof diaphragms.
Toothing
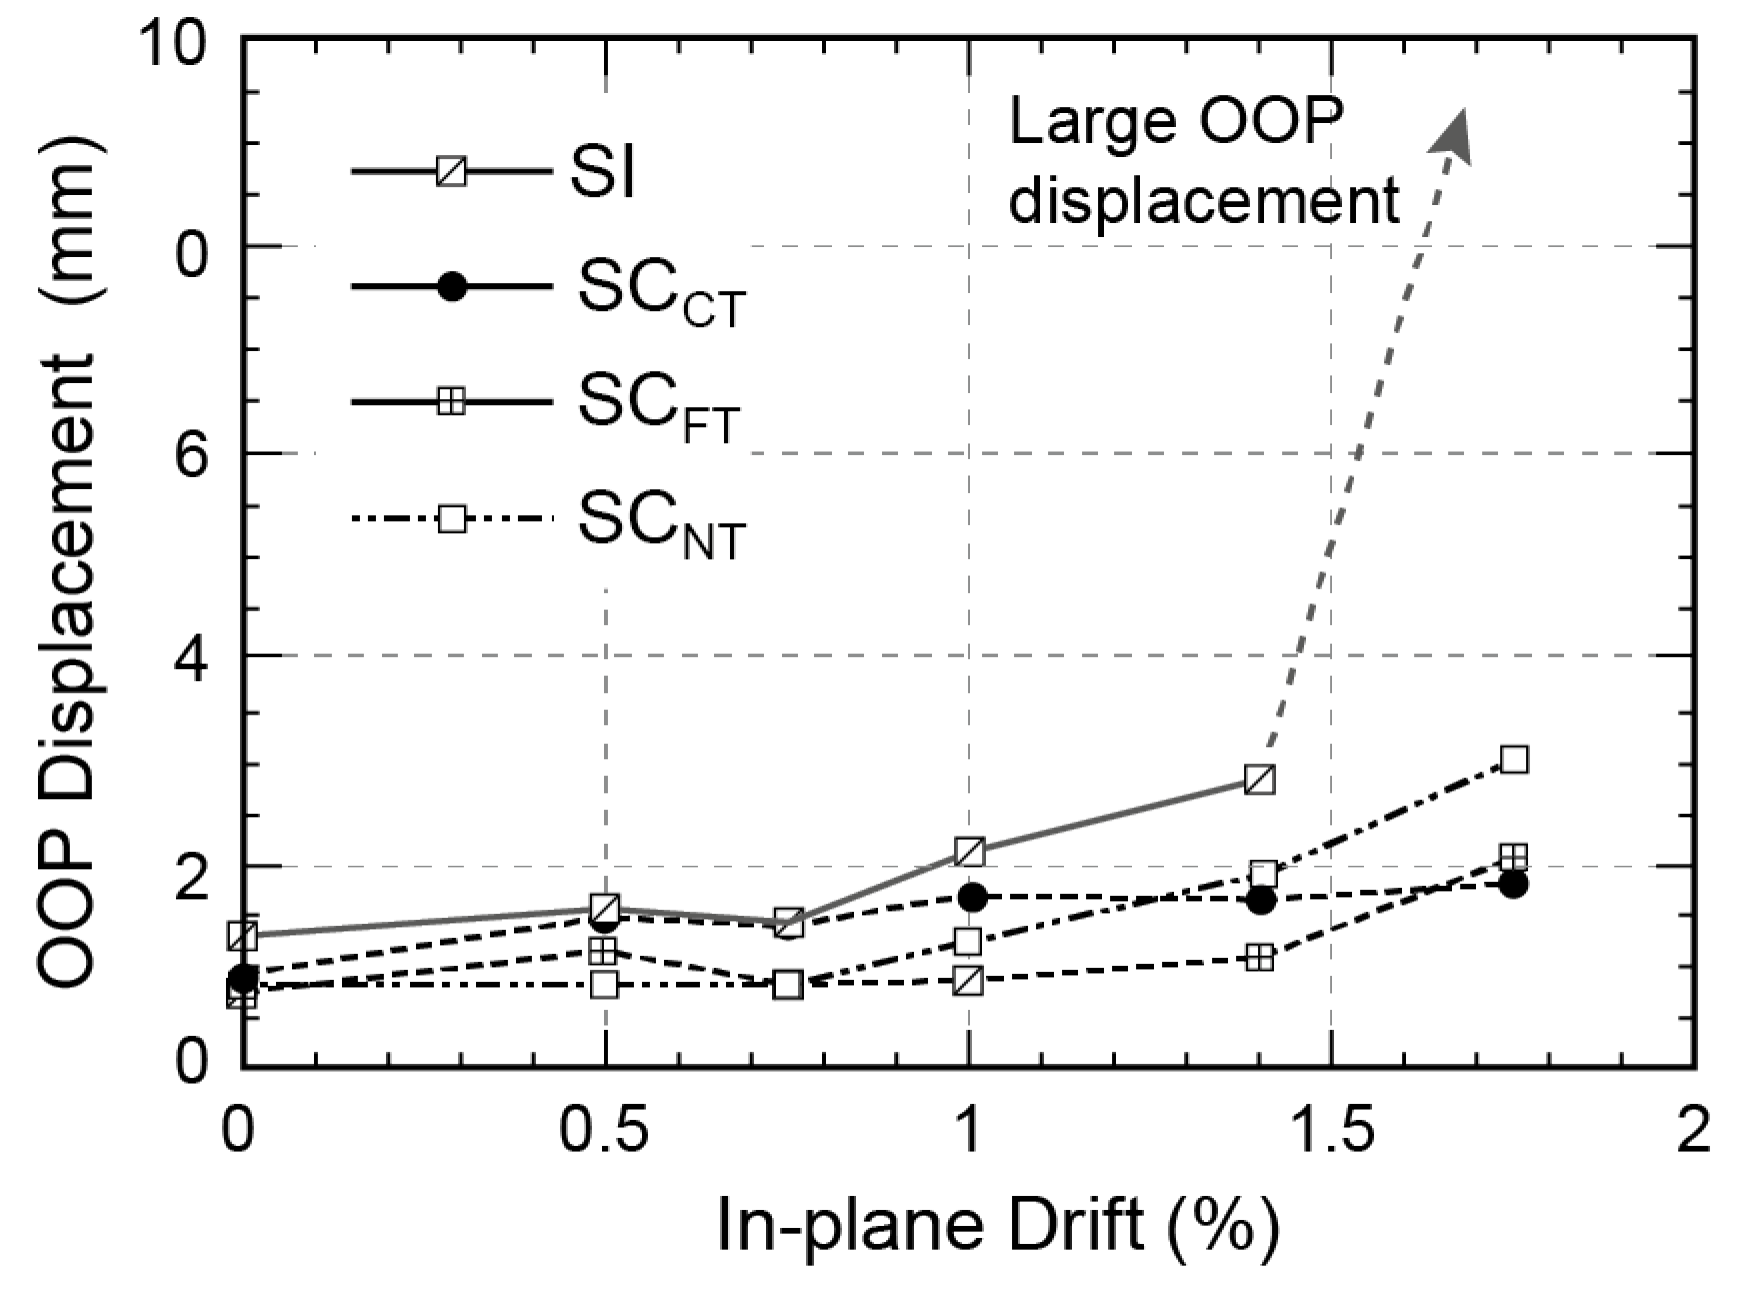
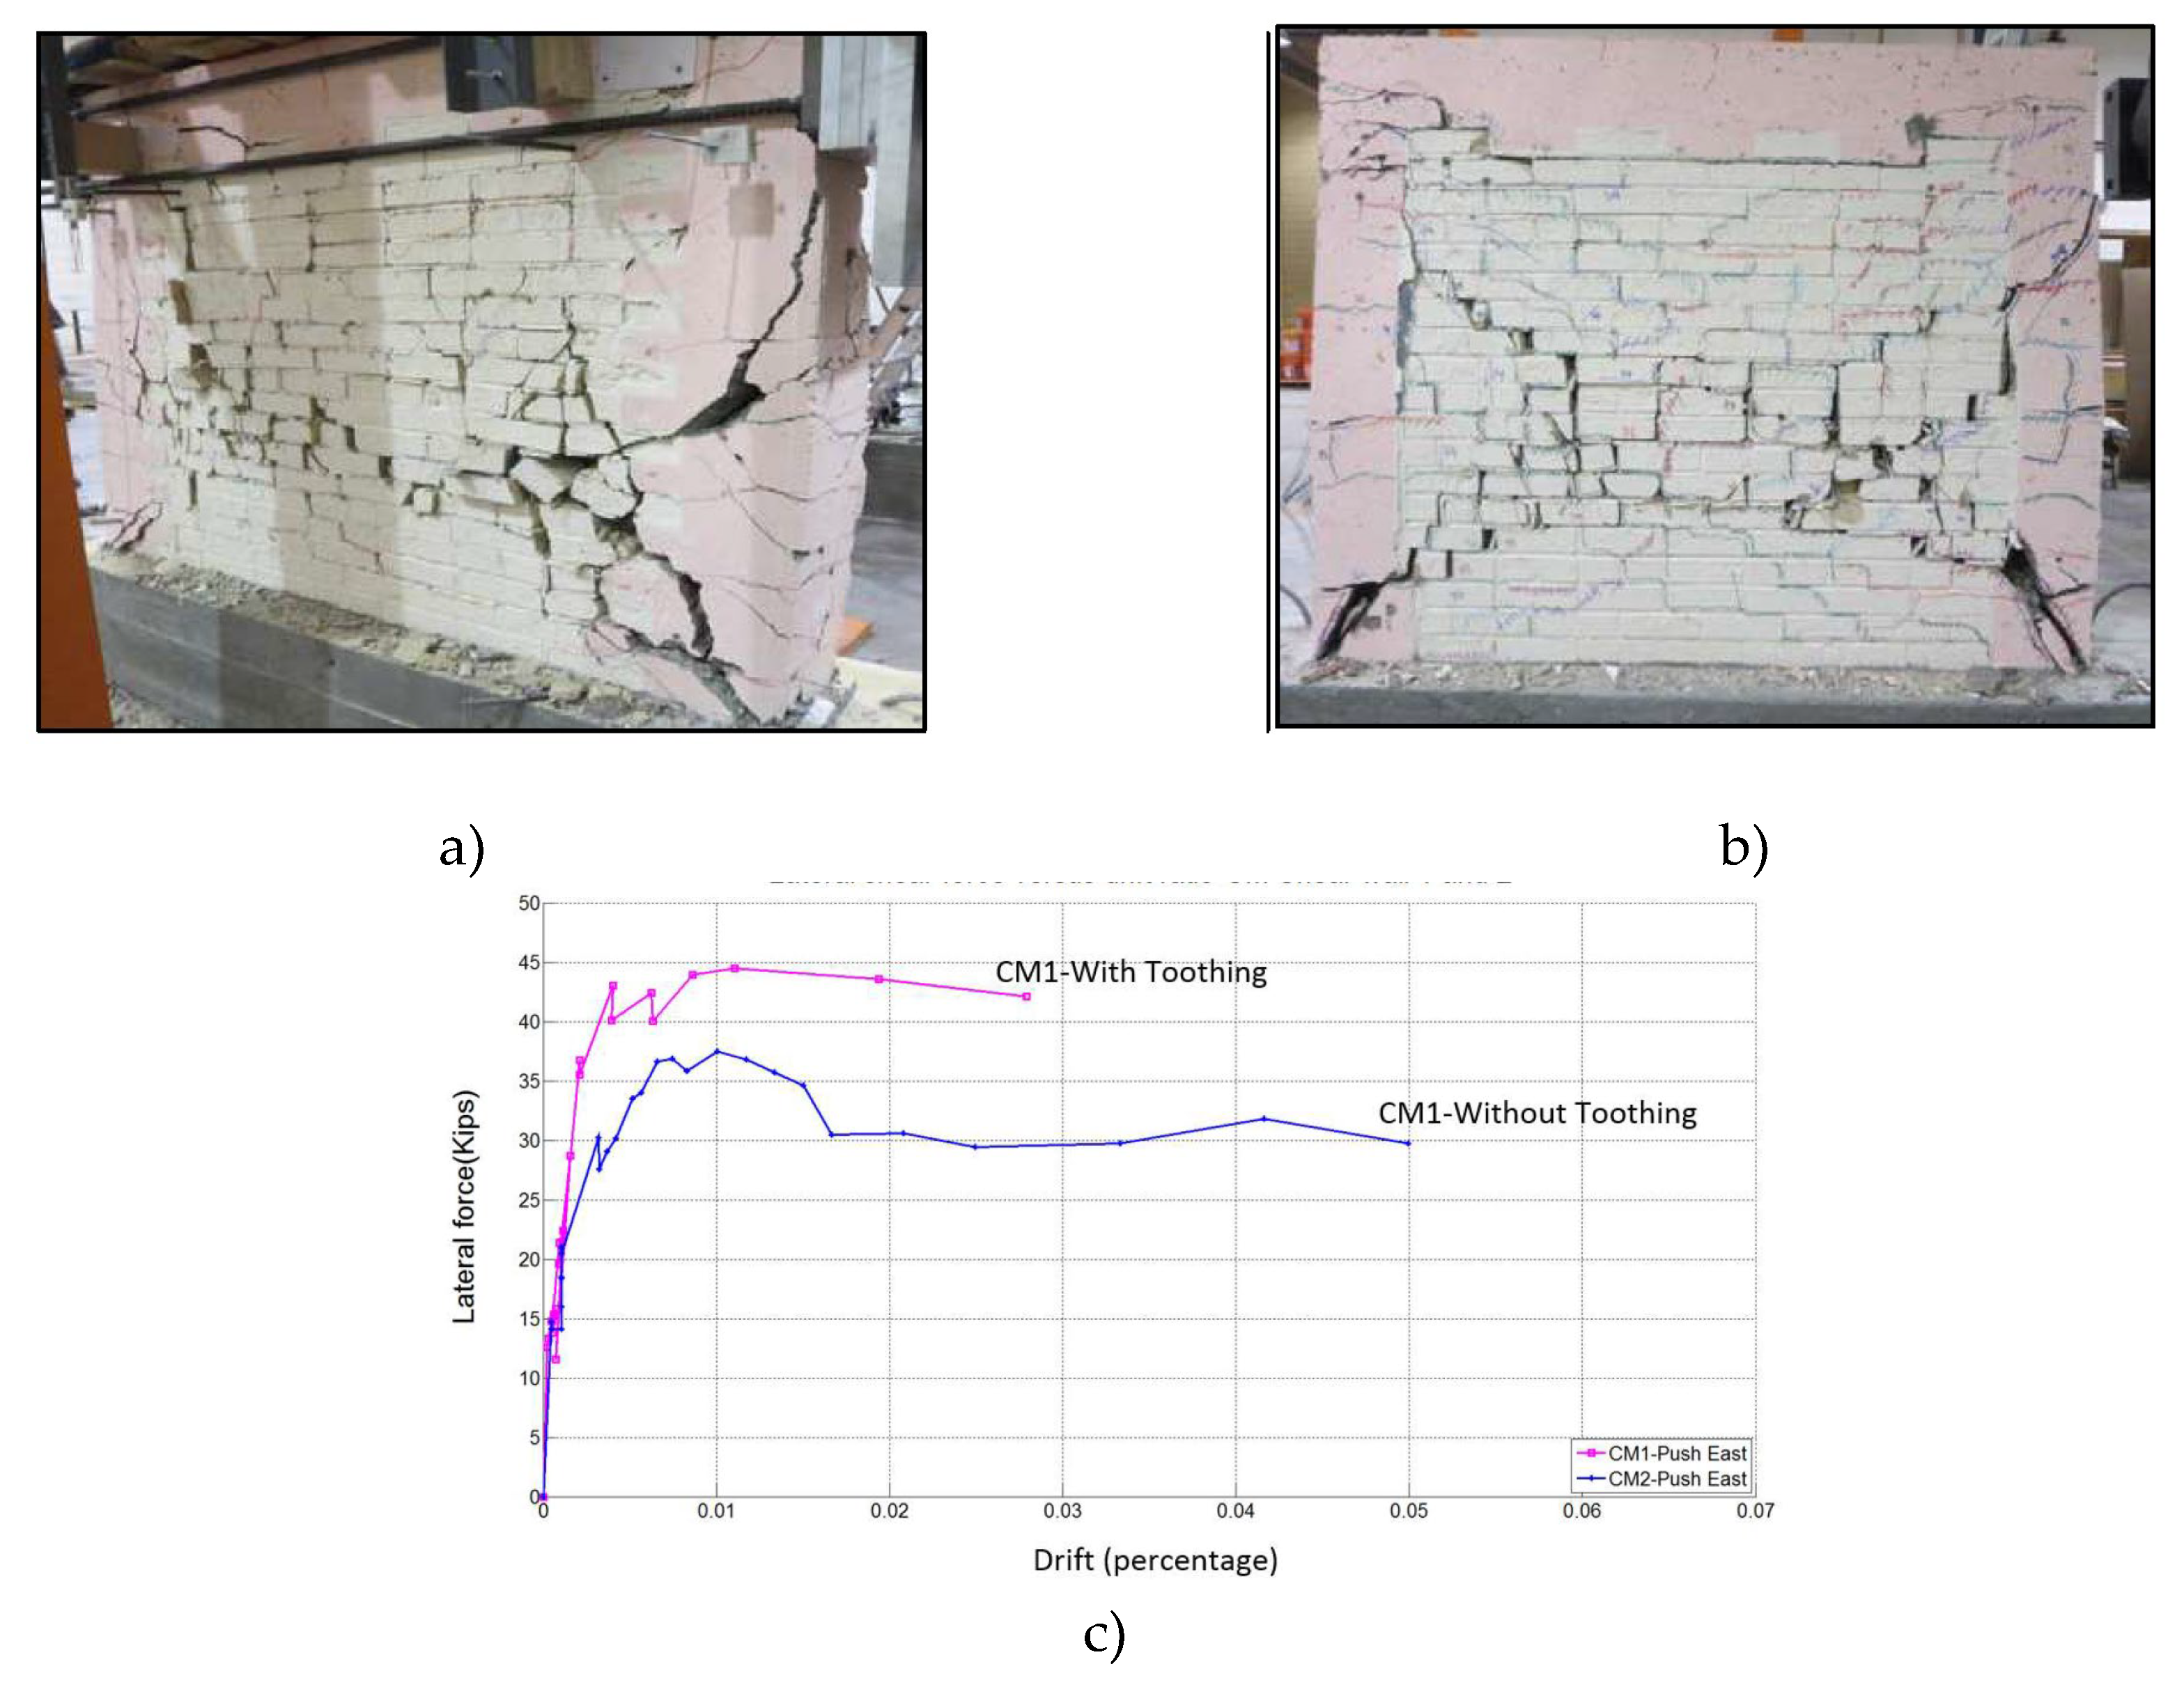
One of the key features of CM construction is connection between the masonry panels and adjacent RC confining elements. It is believed that such a connection is beneficial for enhancing the performance of CM walls subjected to in-plane and out-of-plane seismic effects. The most common connection is in the form of toothing, and consists of a “zig-zag” edge created by masonry units along the masonry-to-tie-column interface. Subsequently, concrete is poured into RC tie-columns, hence shear keys are formed along the interface. Alternatively, horizontal steel bars (dowels) may be embedded in mortar joints and extended on each side of a RC tie-column by a minimum length required for effective anchorage. The choice of connection depends on the type of masonry units: toothing may be feasible when the bricks are used, while dowelled connection is suitable for CM walls constructed using block units. In some countries, e.g. Argentina, CM walls are traditionally constructed without any connection (vertical edge). Although experimental research studies were focused on studying performance of CM walls with different masonry-to-tie-column connections, the evidence is limited. Experimental studies were performed to determine the effectiveness of the presence of toothed connection in CM walls. Singhal and Rai [
118] tested CM walls under in-plane and OOP loading and concluded that toothing is particularly effective in controlling the damage due to OOP seismic effects, and that fine toothing (with smaller tooth size) is more effective compared to coarse toothing arrangement. Other research studies [
123,
124,
127,
128], showed that CM specimens with a toothed connection did not show superior performance compared to otherwise similar specimens without a toothed connection. A few researchers performed a comparison between CM walls with toothed and dowelled connections [
125,
126], and concluded that both connection types (toothing and dowels) are similar in terms of the effectiveness.
Further experimental research studies are needed on the following topics:
the toothing length and teeth spacing requirements for CM walls with different types of masonry units (bricks, blocks);
a comparison of toothing effectiveness for CM walls constructed using brick and block masonry;
the amount (size and spacing) of steel dowels for CM walls without toothing (a common situation in CM with block units), and
response of CM walls with/without toothing under reversed cyclic loading.
Materials
Mechanical characteristics of masonry materials influence seismic behaviour of CM walls. Masonry materials, particularly masonry units, vary between countries and also between different regions within the same country. In the past, solid clay bricks were used for CM wall construction, however in the last few decades multi-perforated clay blocks have been widely used, particularly in the Latin American and European countries. Masonry mortar, in terms of the mix proportion and constituent materials (cement, lime, sand), also has a significant effect on the masonry compressive and shear strength. An experimental study on 16 CM walls performed in Mexico [
25,
27,
40] showed that the specimens constructed using traditional hand-made solid clay bricks had relatively low shear resistance but at the same time higher displacement capacity (ductility) than the specimens constructed using other types of masonry units. The results of another study on CM wall specimens constructed using machine-made clay bricks characterized by significantly higher compressive strength showed higher shear strength of CM walls, but a rapid post-peak strength degradation and notably lower displacement ductility. Finally, the specimens constructed using multi-perforated concrete blocks demonstrated the highest strength and a gradual post-peak strength degradation, combined with a reasonably high ductility.
Further experimental research studies should be directed to the masonry assemblage testing more than material testing. From a look at the available studies, the use of materials, clay or concrete, hollow or solid, is dependent on the in-situ availability of products. In addition, it would be interesting to establish how accurately results for the tested masonry assemblages compare to the as-built condition.
Figure 1.
Mechanism of shear resistance for a CM wall panel: 1) the onset of diagonal cracking; 2) maximum shear strength, and 3) failure [
3] (note that the dashed line represents the strength of an URM wall).
Figure 1.
Mechanism of shear resistance for a CM wall panel: 1) the onset of diagonal cracking; 2) maximum shear strength, and 3) failure [
3] (note that the dashed line represents the strength of an URM wall).
Figure 2.
Masonry shear strength as a function of the axial stress – diagonal tension shear mechanism
Figure 2.
Masonry shear strength as a function of the axial stress – diagonal tension shear mechanism
Figure 3.
A relation between the CM shear strength,
, and the masonry compressive strength,
(data from [
64])
Figure 3.
A relation between the CM shear strength,
, and the masonry compressive strength,
(data from [
64])
Figure 4.
Experimental versus predicted shear resistance at the onset of cracking (adapted from[
35].)
Figure 4.
Experimental versus predicted shear resistance at the onset of cracking (adapted from[
35].)
Figure 5.
Damage patterns for various test specimens at the end of the test (aspect ratio values shown in the brackets) [35.]
Figure 5.
Damage patterns for various test specimens at the end of the test (aspect ratio values shown in the brackets) [35.]
Figure 6.
Effective height for different boundary conditions: a) actual boundary conditions and b) the corresponding effective heights
[
35].
Figure 6.
Effective height for different boundary conditions: a) actual boundary conditions and b) the corresponding effective heights
[
35].
Figure 7.
Moment-shear interaction: a) the effect of shear span ratio on the shear resistance of RM walls [
71] and b) the effect of moment at the top on the normalized shear resistance of CM walls with different aspect ratios [
39].
Figure 7.
Moment-shear interaction: a) the effect of shear span ratio on the shear resistance of RM walls [
71] and b) the effect of moment at the top on the normalized shear resistance of CM walls with different aspect ratios [
39].
Figure 8.
The effect of axial stress on the masonry shear strength in CM walls based on statistical analysis of experimental data [
64].
Figure 8.
The effect of axial stress on the masonry shear strength in CM walls based on statistical analysis of experimental data [
64].
Figure 9.
The effect of horizontal joint reinforcement on the CM shear strength (based on the experimental database [
64]).
Figure 9.
The effect of horizontal joint reinforcement on the CM shear strength (based on the experimental database [
64]).
Figure 10.
The effect of RC tie-columns on the shear strength of CM walls (experimental data [
64].)
Figure 10.
The effect of RC tie-columns on the shear strength of CM walls (experimental data [
64].)
Figure 11.
Drift ratios at the peak strength (
) based on the experimental data [
64]
Figure 11.
Drift ratios at the peak strength (
) based on the experimental data [
64]
Figure 12.
Flexural behaviour of CM shear walls observed in experimental studies: a) damage pattern in specimen M5, at displacement ductility of 6.0 [
95], and b) separation of RC tie-columns from the masonry panel and horizontal cracks [.97]
Figure 12.
Flexural behaviour of CM shear walls observed in experimental studies: a) damage pattern in specimen M5, at displacement ductility of 6.0 [
95], and b) separation of RC tie-columns from the masonry panel and horizontal cracks [.97]
Figure 13.
Shear force versus drift ratio for the CM wall specimens with flexure-dominant behaviour (adapted from [
13].)
Figure 13.
Shear force versus drift ratio for the CM wall specimens with flexure-dominant behaviour (adapted from [
13].)
Figure 14.
Moment resistance for CM walls subjected to combined axial load and flexure (adapted from [
13].)
Figure 14.
Moment resistance for CM walls subjected to combined axial load and flexure (adapted from [
13].)
Figure 15.
A relation between the normalized moment resistance and axial stress for 8 CM test specimens [13,95.]
Figure 15.
A relation between the normalized moment resistance and axial stress for 8 CM test specimens [13,95.]
Figure 16.
Key parameters that influence the occurrence of flexural or shear failure with variable amount of horizontal reinforcement : (a) constant ratio of longitudinal reinforcement in tie-columns (0.01583), and (b) constant axial stress ( kg/cm2).
Figure 16.
Key parameters that influence the occurrence of flexural or shear failure with variable amount of horizontal reinforcement : (a) constant ratio of longitudinal reinforcement in tie-columns (0.01583), and (b) constant axial stress ( kg/cm2).
Figure 17.
Comparison of the wall envelope with flexural [
95] and shear [
35] behav.iour
Figure 17.
Comparison of the wall envelope with flexural [
95] and shear [
35] behav.iour
Figure 18.
Damaged CM walls due to OOP seismic effects of the 2010 Maule, Chile earthquake: a) damage pattern at the top floor level of a building with a flexible timber roof and b) damaged walls at the second-floor level in the same building (Credit: S. Brzev).
Figure 18.
Damaged CM walls due to OOP seismic effects of the 2010 Maule, Chile earthquake: a) damage pattern at the top floor level of a building with a flexible timber roof and b) damaged walls at the second-floor level in the same building (Credit: S. Brzev).
Figure 19.
Arching mechanism in masonry walls: a) three-hinged arch and b) a rigid segment subjected to thrust forces (adapted from [
104].)
Figure 19.
Arching mechanism in masonry walls: a) three-hinged arch and b) a rigid segment subjected to thrust forces (adapted from [
104].)
Figure 20.
Failure mechanism for CM walls subjected to monotonic OOP pressure: a) cracking pattern and b) one-way strut analytical model considering the flexibility of the supports (adapted from [
50].)
Figure 20.
Failure mechanism for CM walls subjected to monotonic OOP pressure: a) cracking pattern and b) one-way strut analytical model considering the flexibility of the supports (adapted from [
50].)
Figure 21.
Ultimate pressure versus H/t ratio for 32 CM wall specimens included in the experimental database.
Figure 21.
Ultimate pressure versus H/t ratio for 32 CM wall specimens included in the experimental database.
Figure 22.
Prediction of the ultimate pressure depending on the wall slenderness ratio
, masonry compression strength
, and the ultimate masonry strain
, based on the model by Angel [
104]
Figure 22.
Prediction of the ultimate pressure depending on the wall slenderness ratio
, masonry compression strength
, and the ultimate masonry strain
, based on the model by Angel [
104]
Figure 23.
Damage patterns and failure mechanisms for CM specimens subjected to combined in-plane and OOP simulated seismic loading [
113]: a) S1WF (
) and b) S3SF (
Figure 23.
Damage patterns and failure mechanisms for CM specimens subjected to combined in-plane and OOP simulated seismic loading [
113]: a) S1WF (
) and b) S3SF (
Figure 24.
Effect of wall aspect ratio (H/L) on the OOP behaviour of CM walls: ultimate pressure values for squat CM wall specimens (experimental database).
Figure 24.
Effect of wall aspect ratio (H/L) on the OOP behaviour of CM walls: ultimate pressure values for squat CM wall specimens (experimental database).
Figure 25.
The effect of
H/L ratio and axial compression on ultimate pressure for non-squat CM wall specimens [
108].
Figure 25.
The effect of
H/L ratio and axial compression on ultimate pressure for non-squat CM wall specimens [
108].
Figure 26.
Effect of in-plane stiffness of RC confining elements on the OOP behaviour of CM walls [
50]: a) specimen E-4 experienced masonry crushing failure; b) specimen E-1 experienced a “snap through” failure mechanism, and c) lateral pressure versus horizontal OOP displacements for specimens E-1 and E-4.
Figure 27.
The OOP behaviour of CM wall specimens with different support conditions [
106]: a) a histogram showing the ultimate and cracking pressures for all specimens and b) OOP pressure vs horizontal displacement curves for specimen E-1 supported on 4 sides and specimen E-6 supported on 3 sides.
Figure 27.
The OOP behaviour of CM wall specimens with different support conditions [
106]: a) a histogram showing the ultimate and cracking pressures for all specimens and b) OOP pressure vs horizontal displacement curves for specimen E-1 supported on 4 sides and specimen E-6 supported on 3 sides.
Figure 28.
Failure mechanisms for CM walls subjected to OOP loading: a) monotonic static testing via air bags [
105] and b) dynamic testing via shaking table [
112].
Figure 28.
Failure mechanisms for CM walls subjected to OOP loading: a) monotonic static testing via air bags [
105] and b) dynamic testing via shaking table [
112].
Figure 29.
Damage of the Candelabro Hotel building in the 2007 Pisco, Peru earthquake (M 8.0): a) damage of masonry piers, showing absence of vertical RC confining elements in longitudinal wall and b) undamaged solid CM walls in transverse wall (Photos: D. Quiun).
Figure 29.
Damage of the Candelabro Hotel building in the 2007 Pisco, Peru earthquake (M 8.0): a) damage of masonry piers, showing absence of vertical RC confining elements in longitudinal wall and b) undamaged solid CM walls in transverse wall (Photos: D. Quiun).
Figure 30.
Failure mechanisms of CM walls with openings: a) door openings and b) window openings [
115].
Figure 30.
Failure mechanisms of CM walls with openings: a) door openings and b) window openings [
115].
Figure 31.
Damage of CM wall specimens with openings [
118]: (a) continuous horizontal RC sill and lintel band and discontinuous vertical confining elements and (b) continuous tie-columns and discontinuous horizontal confining elements.
Figure 31.
Damage of CM wall specimens with openings [
118]: (a) continuous horizontal RC sill and lintel band and discontinuous vertical confining elements and (b) continuous tie-columns and discontinuous horizontal confining elements.
Figure 32.
Comparison of force versus drift envelope for CM specimens with and without openings [
118].
Figure 32.
Comparison of force versus drift envelope for CM specimens with and without openings [
118].
Figure 33.
Effect of openings on the peak strength of CM walls (based on the database of 38 experimental specimens): a) a ratio of the opening area relative to the CM panel area and b) a ratio of the net wall cross-sectional area and the total wall area. .
Figure 33.
Effect of openings on the peak strength of CM walls (based on the database of 38 experimental specimens): a) a ratio of the opening area relative to the CM panel area and b) a ratio of the net wall cross-sectional area and the total wall area. .
Figure 34.
Toothed connection at the wall-to-tie-column interface: a) recommended practice [
3] and b) a field application [53.]
Figure 34.
Toothed connection at the wall-to-tie-column interface: a) recommended practice [
3] and b) a field application [53.]
Figure 35.
Connections at the wall-to-tie-column interface through dowels: a) recommended practice and b) a field application.
Figure 35.
Connections at the wall-to-tie-column interface through dowels: a) recommended practice and b) a field application.
Figure 36.
Walls with different interface arrangements: a) Wall 1 (toothed connection); b) Wall 2 (no toothing or dowels) and c) Wall 3 (doweled connection) [
122].
Figure 36.
Walls with different interface arrangements: a) Wall 1 (toothed connection); b) Wall 2 (no toothing or dowels) and c) Wall 3 (doweled connection) [
122].
Figure 37.
Comparison of cracking patterns for all specimens after 1.75% in-plane drift cycle: a) SI (RC frame with infill), b) SCCT (with coarse toothing), c) SCFT (with fine toothing), and d) SCNT (without toothing) Singhal and Rai [118.]
Figure 37.
Comparison of cracking patterns for all specimens after 1.75% in-plane drift cycle: a) SI (RC frame with infill), b) SCCT (with coarse toothing), c) SCFT (with fine toothing), and d) SCNT (without toothing) Singhal and Rai [118.]
Figure 38.
Variation of OOP displacements due to increasing in-plane drift demand (Singhal and Rai [
118].)
Figure 38.
Variation of OOP displacements due to increasing in-plane drift demand (Singhal and Rai [
118].)
Figure 39.
CM walls with different wall-to-tie-column interfaces [
125]: a) failure of Wall 1 (toothed connection) at approx. 3.0% drift; b) failure of Wall 2 (connection through dowels) at approx. 5.0% drift, and c) lateral force versus drift ratio.
Figure 39.
CM walls with different wall-to-tie-column interfaces [
125]: a) failure of Wall 1 (toothed connection) at approx. 3.0% drift; b) failure of Wall 2 (connection through dowels) at approx. 5.0% drift, and c) lateral force versus drift ratio.
Figure 40.
Various types of masonry units used in Mexico.
Figure 40.
Various types of masonry units used in Mexico.
Figure 41.
Shear strength envelopes for CM walls with different masonry units and amounts of joint reinforcement (Adapted from [
130]).
Figure 41.
Shear strength envelopes for CM walls with different masonry units and amounts of joint reinforcement (Adapted from [
130]).
Figure 42.
Masonry mechanical properties: a) diagonal compression strength and b) masonry compression strength, data from [64.]
Figure 42.
Masonry mechanical properties: a) diagonal compression strength and b) masonry compression strength, data from [64.]
Figure 43.
Relationship between the masonry compression strength and modulus of elasticity: a) experimental 𝑓
m and 𝐸
m values for clay bricks and masonry blocks, and b) 𝐸
m/𝑓
m ratio [
132,133]
Figure 43.
Relationship between the masonry compression strength and modulus of elasticity: a) experimental 𝑓
m and 𝐸
m values for clay bricks and masonry blocks, and b) 𝐸
m/𝑓
m ratio [
132,133]
Table 1.
Multivariate analysis of shear strength,
Table 1.
Multivariate analysis of shear strength,
| Variable |
Coef. |
P |
95% Confidence Interval |
|
|
0.31 |
<0.001 |
0.19 |
0.43 |
|
0.26 |
0.001 |
0.12 |
0.41 |
|
-0.11 |
0.002 |
-0.18 |
-0.04 |
|
0.39 |
<0.001 |
0.30 |
0.48 |
|
0.001 |
0.001 |
0.0004 |
0.0016 |
Table 2.
Summary of experimental studies on OOP behaviour of CM walls
Table 2.
Summary of experimental studies on OOP behaviour of CM walls
| Study |
# of specimens |
Masonry unit type |
H/L |
H/t |
t (mm) |
f’m (MPa) |
(kPa) |
Key
Parameters |
| Varela-Rivera et al. [105] |
6 |
HCB |
0.49 |
11.7 |
150 |
3.07 |
[13.1, 14.3] |
Boundary conditions (supported on 3 or 4 sides) |
| Varela-Rivera et al. [108] |
6 |
HCB |
[0.74,0.95] |
[18.1,24] |
120 & 150 |
[2.84,2.85] |
[8.79, 17.83] |
Variable , , and in-plane stiffness of confining elements |
| Varela-Rivera et al. [106] |
3 |
HCB |
0.73 |
18 |
150 |
[2.64,2.84] |
[8.79, 18.91] |
Variable axial compression level |
| Moreno-Herrera et al. [109] |
8 |
HCB2
MPB
SB |
[0.73,0.94] |
23-24.4 |
113-120 |
[3.72,6.48] |
[7.33, 18.06] |
Variable axial compression; different masonry units |
| Navarrete-Macias et al. [110] |
5 |
HCB |
0.73-1.8 |
21.3 |
120 |
Average
6.48 |
[8.43-14.07] |
Variables axial stress and H/L
Cyclic lateral load on top |
| Varela-Rivera et al. [107] |
4 |
HCB |
1.40&2.04 |
18.7 |
145 |
3.3 |
[19.72, 38.32] |
; variable axial compression |
Table 4.
CM wall specimens: horizontal reinforcement parameters.
Table 4.
CM wall specimens: horizontal reinforcement parameters.
| Aguilar et al. [25] |
Alcocer et al. [27] |
Cruz et al. [40] |
|
SpecimenID
|
|
SpecimenID
|
|
SpecimenID
|
|
| M1 |
0.89 |
N1 |
0 |
MB-0 |
0 |
| M2 |
0 |
N2 |
0.30 |
MB-1 |
0.23 |
| M3 |
0.43 |
N3 |
0.30 |
MB-2 |
0.62 |
| M4 |
1.14 |
N4 |
1.14 |
MB-3 |
0.92 |
| |
|
|
|
MB-4 |
1.21 |
| |
|
|
|
MB-5 |
1.58 |
