Preprint
Article

Effect of Carbon Nanoparticles on the Porous Texture of I-Carrageenan Based N Doped Nanostructured Porous Carbons and Implications for Gas Separation

Altmetrics

Downloads

168

Views

33

Comments

0

A peer-reviewed article of this preprint also exists.

Submitted:

01 June 2023

Posted:

02 June 2023

You are already at the latest version

Alerts
Abstract
Tackling global warming and the consequent climate change in our planet is of urgent importance to our society. Renewable biomass derived carbons have been studied as promising adsorbents, but marine biomass derived carbons have not been explored extensively. S and N double-doped porous carbons were obtained from a marine biomass related precursor. Adding carbon nanoparticles (CNP) graphene oxide (GO), or carbon nanotubes (CNTs), in an early stage of the synthesis leads to a modified porous texture and surface chemistry. The carbons retained 2-4.5 at% nitrogen and 1.1 at% sulfur. The best GO and CNT added carbons had an apparent surface area 1780 m2/g and 1170 m2/g, respectively, compared to 1070 m2/g of the CNP-free matrix. The Dubinin-Radushkevich (DR) and Henry models were used to assess the strength of the interactions between various gases and the surface. The N2/H2 and CO2/CH4 selectivities were estimated with ideal adsorbed solution theory (IAST). While the CNPs, particularly GO, had a remarkable effect both on the porous texture and the surface chemistry, their influence on selectivity is more modest.
Keywords: 
Subject: Chemistry and Materials Science  -   Materials Science and Technology

1. Introduction

Permanently expanding environmental concerns as well as expanding demand for energy storage/conversion devices call for new carbon precursors [1,2]. High surface area porous carbon materials have proved to be excellent media for gas separation and storage. Carbon materials from renewable biomass provide a sustainable solution for the ever increasing need for novel porous carbon precursors. While lignocellulosic biomass has long been used as a carbon precursor [3,4,6,58], crustacean waste, e.g., crab shells rich in chitosan [7], or plants of marine origin, e.g., seaweed [8] still represent an under-exploited area.
The fight against global climate change is closely related to the increasing atmospheric CO2 concentration. Porous carbon materials are competitive adsorbents for the capture of low concentration (~ 400 ppm) CO2 from air [9] as well as from flue gas or biogas [10,11] where the CO2 concentration can be as high as 10-15 % and 35-45%, respectively. In the latter case biomethane (55-65%) is the main target of the separation.
Considering porous adsorbents for gas storage and separation pores, those having dimensions similar to the gas molecules of interest are the most efficient. The diameters of H2, CO2, O2, N2, CH4 are 0.289, 0.33, 0.346, 0.362, and 0.38 nm, respectively [12]. The optimum ratio of pore size to adsorbate molecule size should be in the rage 1.7-3.0 [13]. Carbon molecular sieves having ultramicropores thus have enhanced selectivity [14]. Although high micropore volume assures greater gas uptake [15,16], wider pores are not negligible either, as they enhance the dynamics of the transport processes. Physical or chemical activation methods are used to optimize the porous structure [3,17].
In addition to the physical interactions operating in the confinement by the pores, the surface chemistry of the carbon also plays a substantial role in the selectivity. Heteroatoms, e.g., oxygen, nitrogen or sulfur that decorate the entrance and/or the pore walls, tune the hydrophobic/hydrophilic nature of the surface [18], modify the charge distribution of the neighboring carbon atoms [19,20,21] and thus provide a means to tune the selectivity of the porous carbon. As an example, Lewis basic functionalities (nitrogen and oxygen) present on the carbon surface may attract acidic CO2 molecules, enhancing their uptake [22,23]. Sevilla et al. reported the synthesis of N-doping activated carbons with high surface area and large CO2 capture capacity (7.4 mmol/g at 0 °C and 1 bar) [24]. Dual S and N doping results in a large number of carbon atom active sites through the redistribution of spin and charge densities as revealed by DFT calculations [25].
Carbon nanoparticles (CNPs), like graphene derivatives or carbon nanotubes (CNTs) incorporated into the matrix of carbon matrices may tune the porous texture and create further defects that affect the selective interactions between the gas molecules and the surface. Alhwaige et al. reported that in chitosan - graphene oxide (GO) hybrid aerogels, GO affects the apparent surface area and pore size distribution of those materials depending on the amount of GO added. An important result was an enhancement of the CO2 capture capacity of the material with the addition of 20 wt% GO, due to increased surface area and pore volume. In addition, the chitosan - GO hybrid carbon showed enhanced attraction towards CO2 molecules: -COOH, -OH, -NH2, -NO2, -CH3 groups decorating the surface enhance the CO2 adsorption by binding to CO2 due to its quadrupole moment [7]. The computational studies of Bucior et al. found that the high selectivity and permeance of carbon nanotubes (CNTs) in separation in the case of H2/CH4, CO2/CH4 mixtures can be attributed to CH4 size exclusion [26]. CNP incorporation may also enhance the heat conductivity of the carbon matrix, thus contributing to faster removal of the heat escorting the adsorption process. Earlier we studied synthesis of a red algae-based highly porous carbon. Following the method of Li et al [27], a highly porous carbon with apparent surface area close to 1100 m2/g was obtained. Due to the intrinsic S content of the marine biomass based carrageenan and the nitrogen added with urea during the synthesis, a carbon with 5 at% O, 4.6 at% N and at 1% S was obtained. The potential of this carbon in gas storage and energy storage applications was also promising [28]. Here we report how graphene oxide (GO) and multiwalled carbon nanotubes (MWCNT) affect the porous texture and surface chemistry of the carrageenan – urea based carbon matrix. The CNPs were added in the early stage, prior to gelation, and are thus expected to tune both the porous texture and the chemistry of the carbons obtained. After characterizing the morphology and surface chemistry, the N2/H2, and CO2/CH4 selectivity was estimated using ideal adsorbed solution theory (IAST) [29].

2. Materials and Methods

ι-carrageenan powder and urea pearls (98%) were purchased from Sigma Aldrich (Hungary). The aqueous GO suspension (0.96 wt%) was prepared from natural graphite (Graphite Týn, Týn nad Vltavou, Czech Republic) following an improved Hummers’ method [30,31]. The MWCNT was obtained from Chengdu Organic Chemicals Co. Ltd. (China). The as received CNTs were oxidized, washed and re-protonated before use [32]. Hydrogels were obtained by mixing 2 g urea and 2 g ι-carrageenan with a 100 mL aqueous CNP suspension (containing 50, 100 and 200 mg of the corresponding nanoparticles, respectively) at 80 °C. The freeze-dried polymer gels were pyrolyzed in a rotary quartz reactor at 700 °C (20 °C/min) in dry N2 flow (25 L/h) for 1 h. The inorganic impurities were removed by 1.0 M HCl washing prior to annealing in Ar flow for 1 h at 1000 ˚C. The dry polymer and carbon cryogels were labelled PA and CA, respectively. The sample labels also refer to the incorporated CNP (as GO or CNT) and their incorporated mass (50, 100 or 200), respectively. CNP-free polymer and carbon gels were prepared for comparison [28].

2.1. Characterization methods

Thermogravimetric analysis was performed on 2-10 mg polymer samples using a TGA 6 (Perkin Elmer, Waltham, MA, USA) thermogravimetric analyzer following a heating rate of 1.5 ˚C/min up to 300 ˚C, and then 10 ˚C/min from 300 ˚C to 900 ˚C in nitrogen (20 mL/min).
Scanning electron micrographs were taken by a Zeiss Sigma 300 FESEM field emission scanning electron microscope (Carl Zeiss QEC GmbH, Germany). Low temperature (-196.15 ˚C) nitrogen adsorption measurements were performed after 24 h degassing at 110 ˚C on a NOVA 2000e (Quantachrome, USA) instrument. The apparent surface area SBET was determined using the Brunauer-Emmett-Teller (BET) model [33]. The pore volume V0.98 was estimated from the amount of vapor adsorbed at p/p0 = 0.98, assuming that the adsorbed gas fills the corresponding pores as liquid. The Dubinin-Radushkevich (DR) model [34] was used to calculate the micropore volume Vmicro. The slope of the DR plots (slope DR) was also used to characterize the interaction between the carbon surface and the adsorbate. The pore size distributions were computed by the Quenched Solid Density Functional Theory (QSDFT) for slit/cylindrical pore geometry [35]. Carbon dioxide adsorption was measured at 0 °C up to atmospheric pressure with an AUTOSORB-1 (Quantachrome, USA) analyzer. The pore size distribution in the ultra-micropore range was derived by nonlinear density functional theory (NLDFT). Evaluation of the primary adsorption data was performed with the Quantachrome ASiQwin software (version 3.0). Raman spectra were obtained using a LabRAM (Horiba Jobin Yvon) instrument. The laser source was a λ = 532 nm Nd-YAG (laser power at the focal point is 15 mW). A 0.6 OD filter was used to reduce the power of the beam. Parameter optimization and data analysis were performed by LabSpec 5 software.
X-ray photoelectron spectra were recorded on a Kratos XSAM 800 spectrometer operating in fixed analyzer transmission mode, using Mg Kα1,2 (1253.6 eV) excitation. The analysis chamber pressure was below 1⋅10-7 Pa. Survey spectra were recorded in the range 150–1300 eV in 0.5 eV steps. The photoelectron lines of C1s, O1s, N1s and S2p were measured in 0.1 eV steps with 1 s dwell time. The spectra were referenced to the energy of the C1s line of sp2 type graphitic carbon, set at 284.3 ± 0.1 eV binding energy (BE). Peak decomposition was performed after Shirley-type background removal using a Gaussian–Lorentzian peak shape with 70:30 ratio as reported elsewhere [36]. Quantitative analysis, based on integrated peak intensity, was performed by the XPS MultiQuant program [37], applying the conventional infinitely thick layer model using the experimentally determined photoionization cross-section data of Evans et al. [38] and the asymmetry parameters of Reilman et al. [39]. Attenuated total reflectance Fourier transform infrared (FTIR-ATR) spectra were recorded on powdered carbons in the range 4000 – 400 cm−1 at a resolution of 4 cm-1 by 64 scans using a Tensor 27 (Bruker Optik GmbH, Leipzig, Germany) spectrophotometer equipped with a Platinum ATR unit A225. For the background signal, the measured medium was air. Since the absorption of the powders was very strong, a moderate polynomial baseline correction and smoothing were applied.

2.2. Adsorption with probe gases

Nitrogen (-196.15 °C), carbon dioxide and methane (both at 0 °C) isotherms were measured up to atmospheric pressure in a NOVA 2000e (Quantachrome, USA) volumetric instrument. An Autosorb 1C (Quantachrome, Boynton Beach, USA) volumetric instrument was used to perform hydrogen sorption experiments with high purity hydrogen (99.999 %) at -196,15 °C. IAST [29] was used to assess the gas separation selectivity of the carbons studied.

3. Results and Discussion

3.1. Effect of the CNPs on the morphology and chemistry of the samples
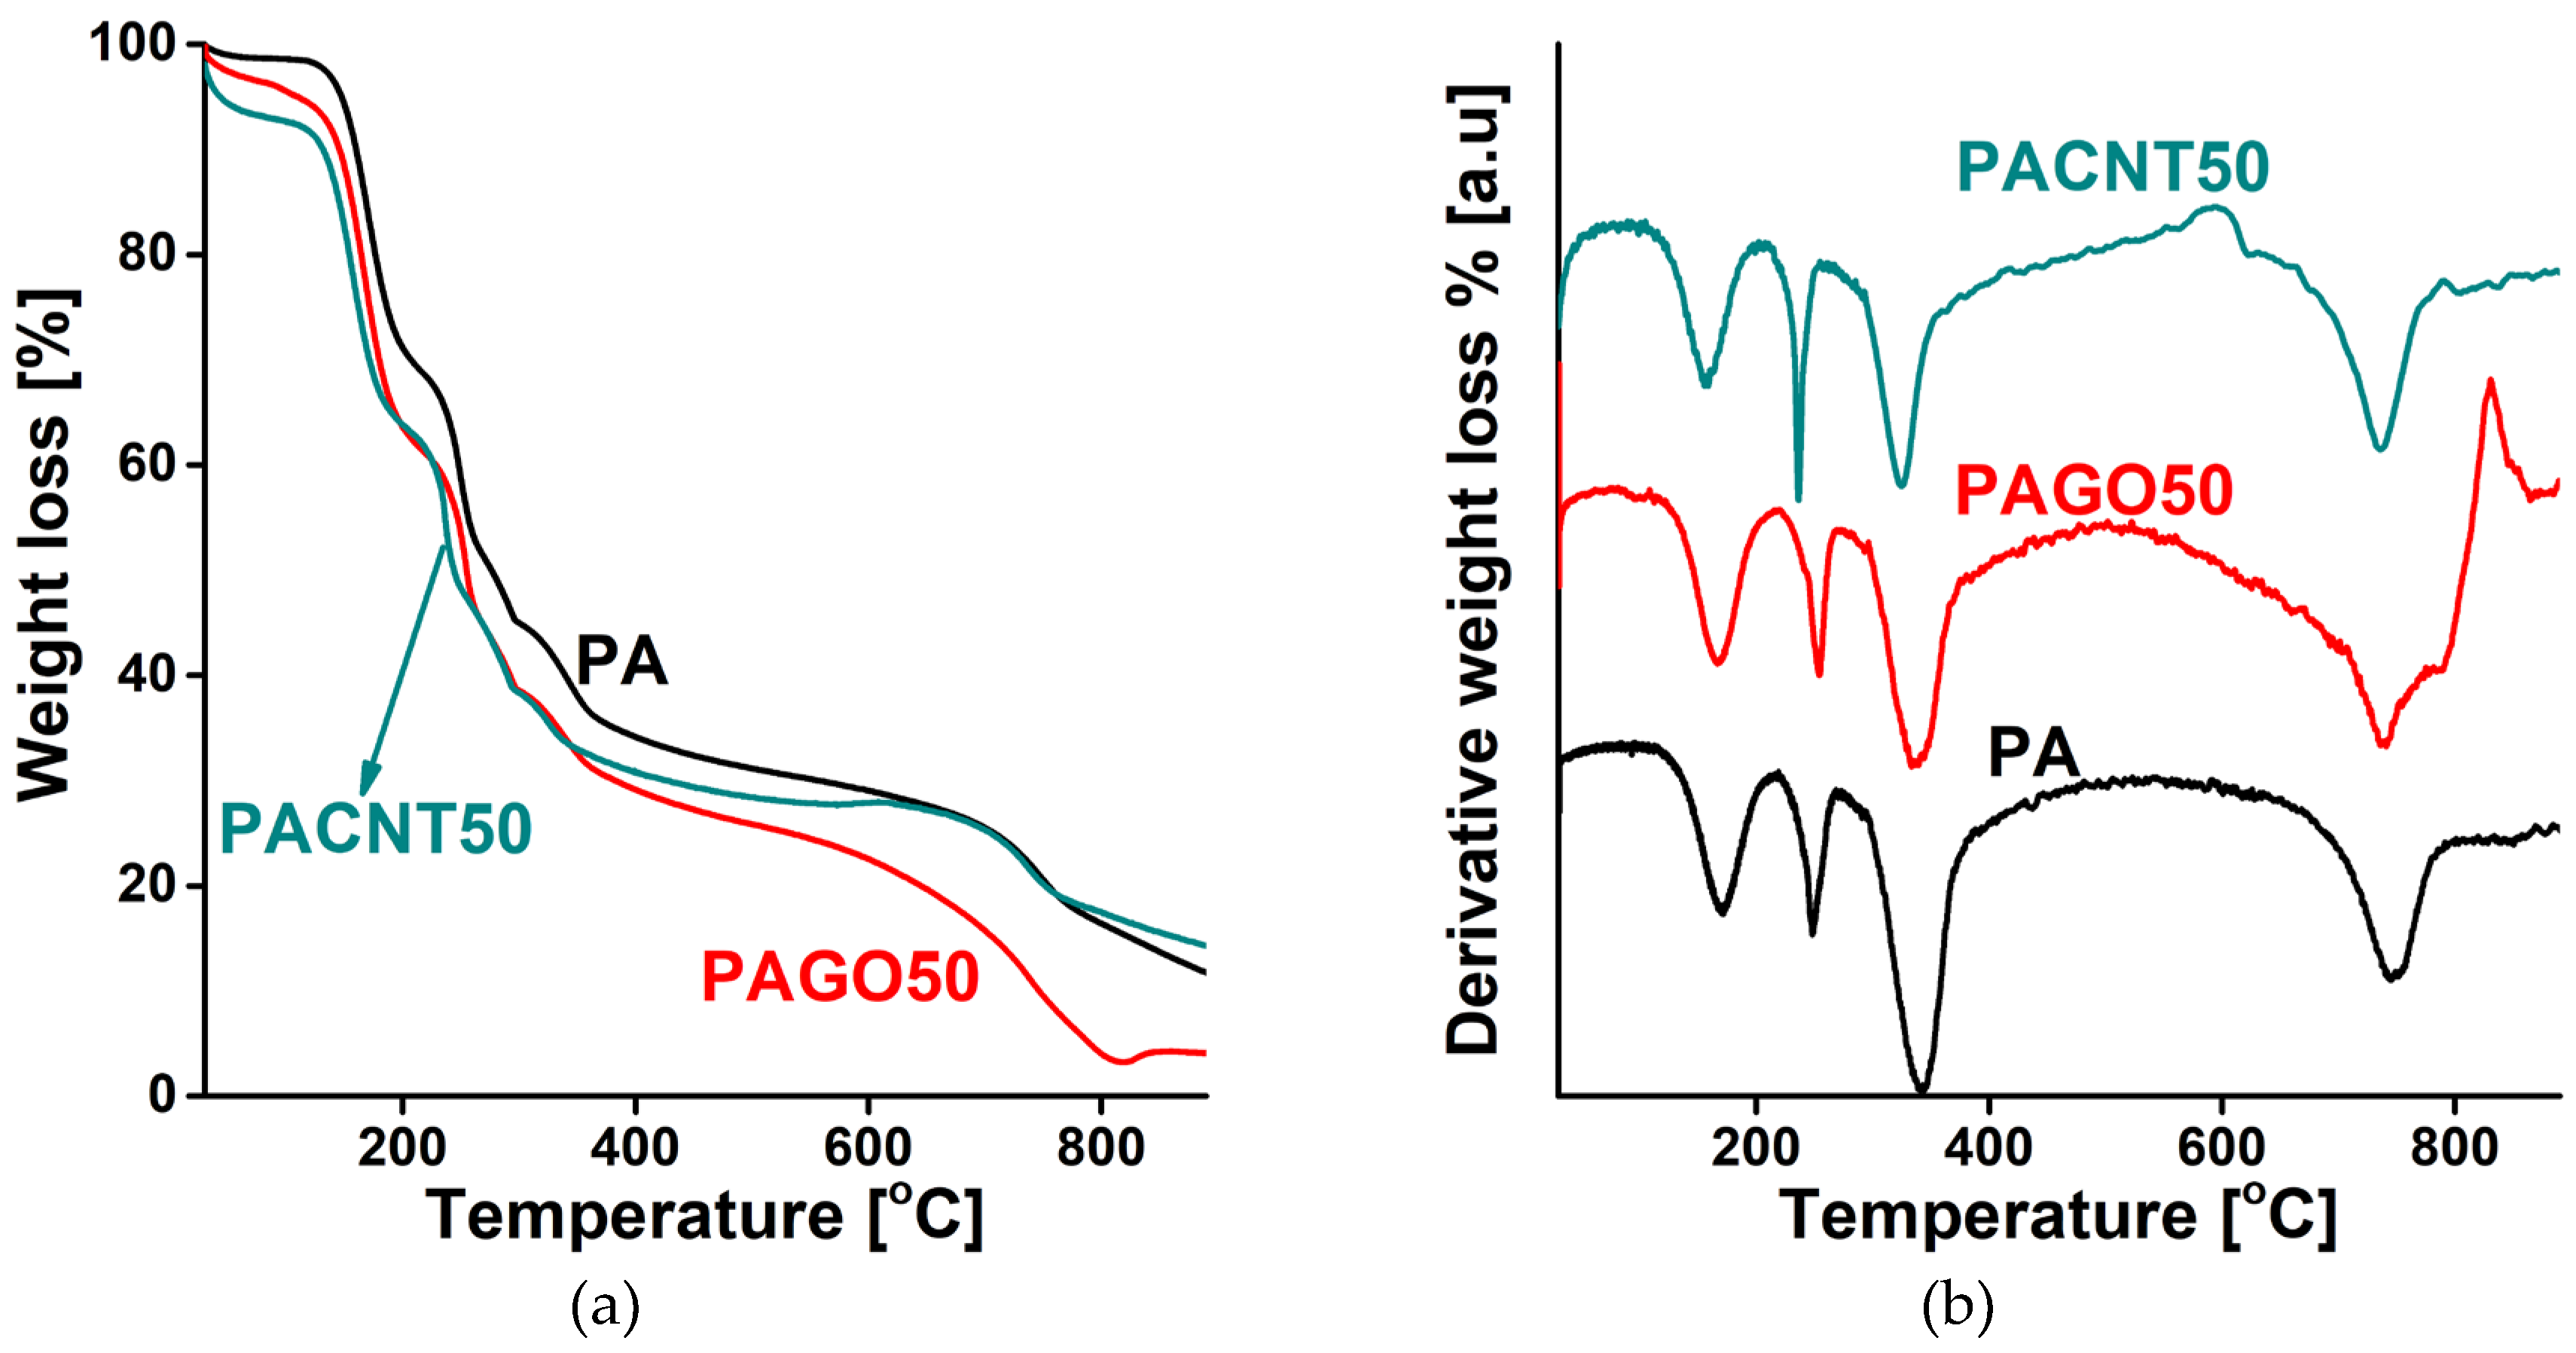
Figure 1 presents the derivatograms of the CNP-free and the 50 mg GO and CNT loaded polymer samples. The TG curves have a multistep behavior with weight losses at similar temperatures, indicating that the thermal decomposition is governed by the pristine polymer. GO and CNT have little influence at these concentrations. The slightly different effect of the CNPs may stem from their dissimilar oxygen content (30 at% and 5 at% for GO and CNT, respectively).
Figure 1. TG (a) and DTG (b) curves of the undoped polymer cryogel (PA), and the 50 mg CNP doped polymer (PAGO50 and PACNT50) samples.
Preprints 75427 g001
Figure 2 reveals the porous morphology of the carbon cryogels. Both CNPs seem well dispersed in the carbon matrix. The thermal treatment certainly reduces the GO that is incorporated into the carbon framework in the typical sheet-like form (Figure 2b). Similarly, CNTs added to the carbon cryogel kept their tubular shape (Figure 2c).
Figure 2. SEM image of the pristine carbon CA (a), GO doped carbon CAGO (b), CNT doped carbon CACNT (c) samples.
Preprints 75427 g002
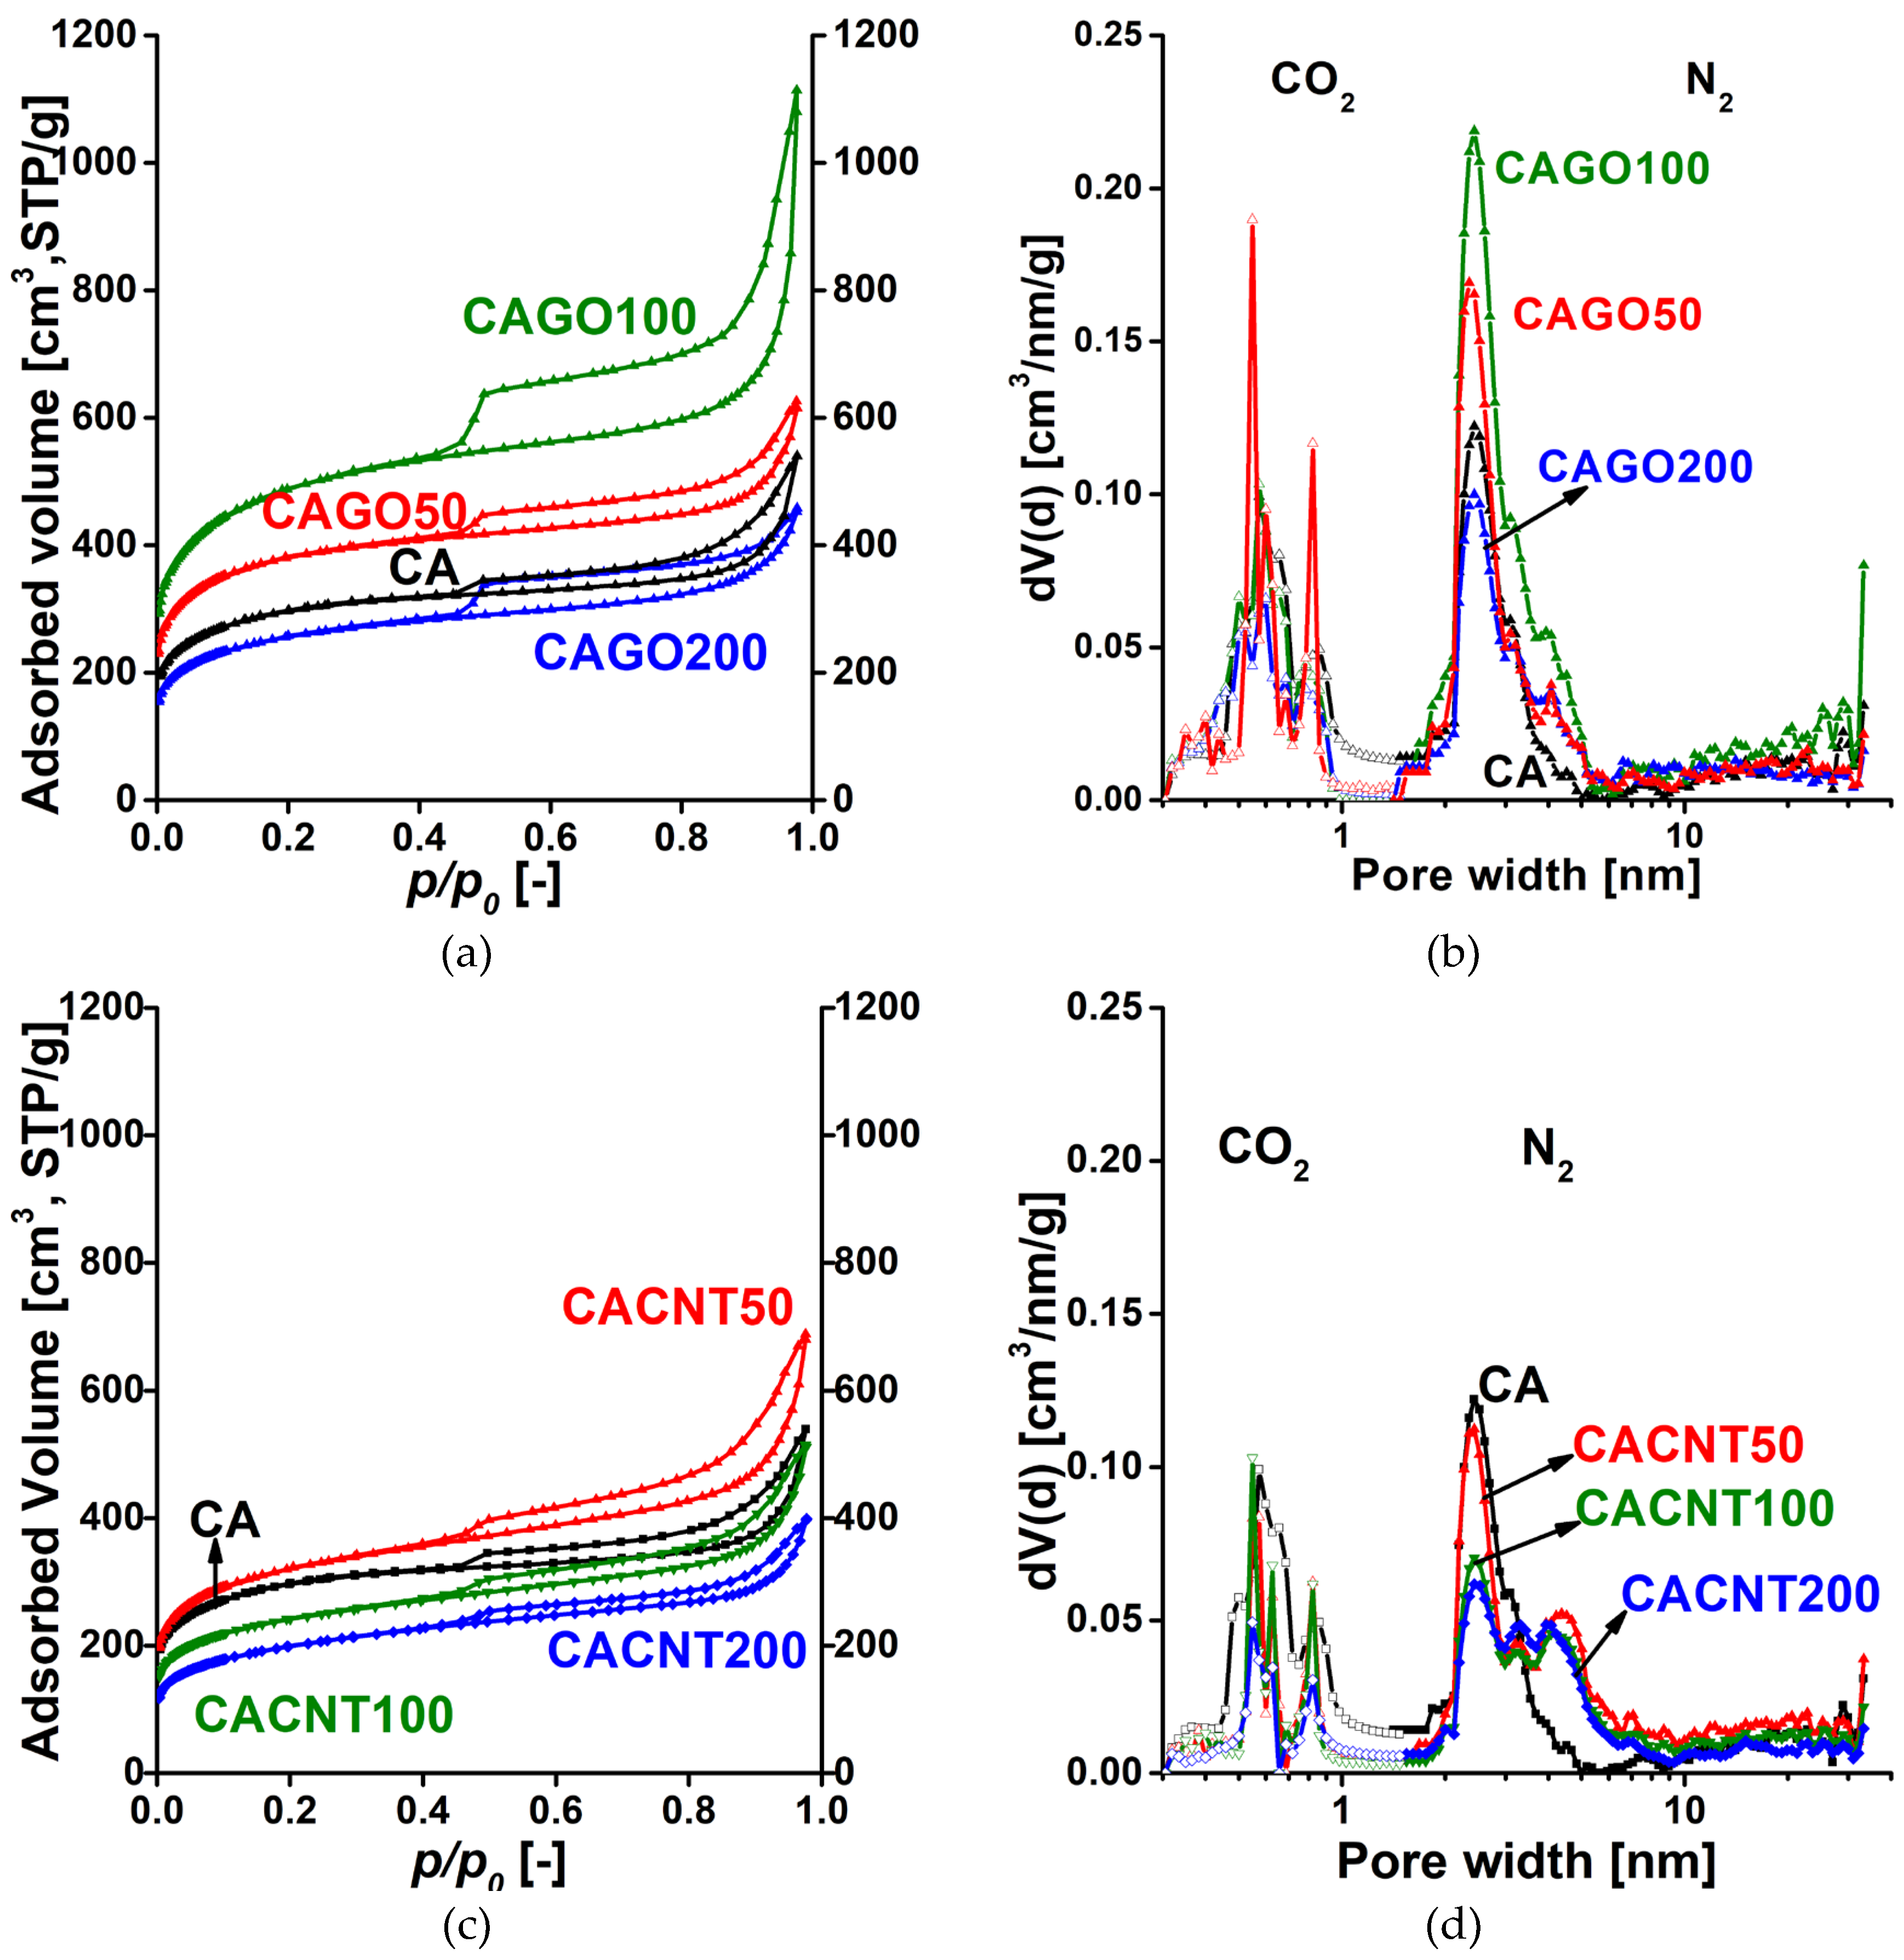
Low temperature N2 adsorption isotherms and the respective pore size distributions for the GO and CNT-doped carbons are shown in Figure 3. Numerical data deduced from these isotherms are presented in Table 1. According to the latest IUPAC classification, all the isotherms are a composite of Type II and IV, indicating the presence of micro-, meso- and macropores [40]. The H4 hysteresis loop having a sharp step-down around p/p0 = 0.45 implies interconnectedness of the pore network. Since the macropores are not totally filled with condensed nitrogen, the liquid equivalent volume V0.98 was determined at p/p0 = 0.98. According to Figure 3a, the surface-related properties of the carbon cryogel in the CAGO100 sample were most affected by addition of GO, both in the micro and macropore regions. 200 mg GO proved to be destructive due to the high amount of oxygen released by the GO during the heat treatment processes. The influence of CNT is more modest and slightly different. Adding only 50 mg CNT had an enhancing effect, but further addition of CNT decreased both the apparent surface area and the pore volume. Figure 3b and Figure 4b combine the pore size distributions in the ultramicropore and the micro-mesopore ranges. While in samples CAGO50 and CAGO100 GO increased the contribution of mesopores in the wider region (>10 nm), CNT had a widening effect in the narrow mesopore range.
Table 1. Data deduced from the low temperature N2 and 0 °C CO2 isotherms*.
from N2 from CO2
Sample SBET V0.98 Vmicro Vmeso Vu micro DR Vu micro DFT
m2/g cm3/g cm3/g % cm3/g cm3/g cm3/g
CA 1070 0.83 0.40 48 0.43 0.057 0.037
CAGO50 1408 0.95 0.56 59 0.39 0.049 0.027
CAGO100 1779 1.72 0.64 37 1.08 0.050 0.027
CAGO200 933 0.71 0.34 48 0.37 0.040 0.022
CACNT50 1169 1.07 0.43 40 0.64 0.032 0.018
CACNT100 880 0.79 0.32 41 0.47 0.028 0.016
CACNT200 727 0.62 0.26 42 0.36 0.020 0.013
* Apparent surface area from BET model; V0.98 is the liquid volume of the gas adsorbed at p/p0 = 0.98; Vmicro micropore volume from DR model; Vmeso=V0.98 – Vmicro mesopore volume; Vu micro DR: ultra-micropore volume (<0.7 nm) from DR model at p/p0 = 0.016-0.023; Vu micro DFT: ultra-micropore volume (<0.7 nm) from quenched solid density functional theory (QSDFT, CO2 adsorbed on carbon at 0 °C).
Figure 3. Low temperature N2 adsorption/desorption isotherms of the GO (a) and CNT (b) doped carbon samples and their pore size distributions from 0 °C CO2 adsorption (nonlinear density functional theory) and -196 °C N2 adsorption data (quenched solid density functional theory, slit/cylindrical pores) (c, d).
Preprints 75427 g003
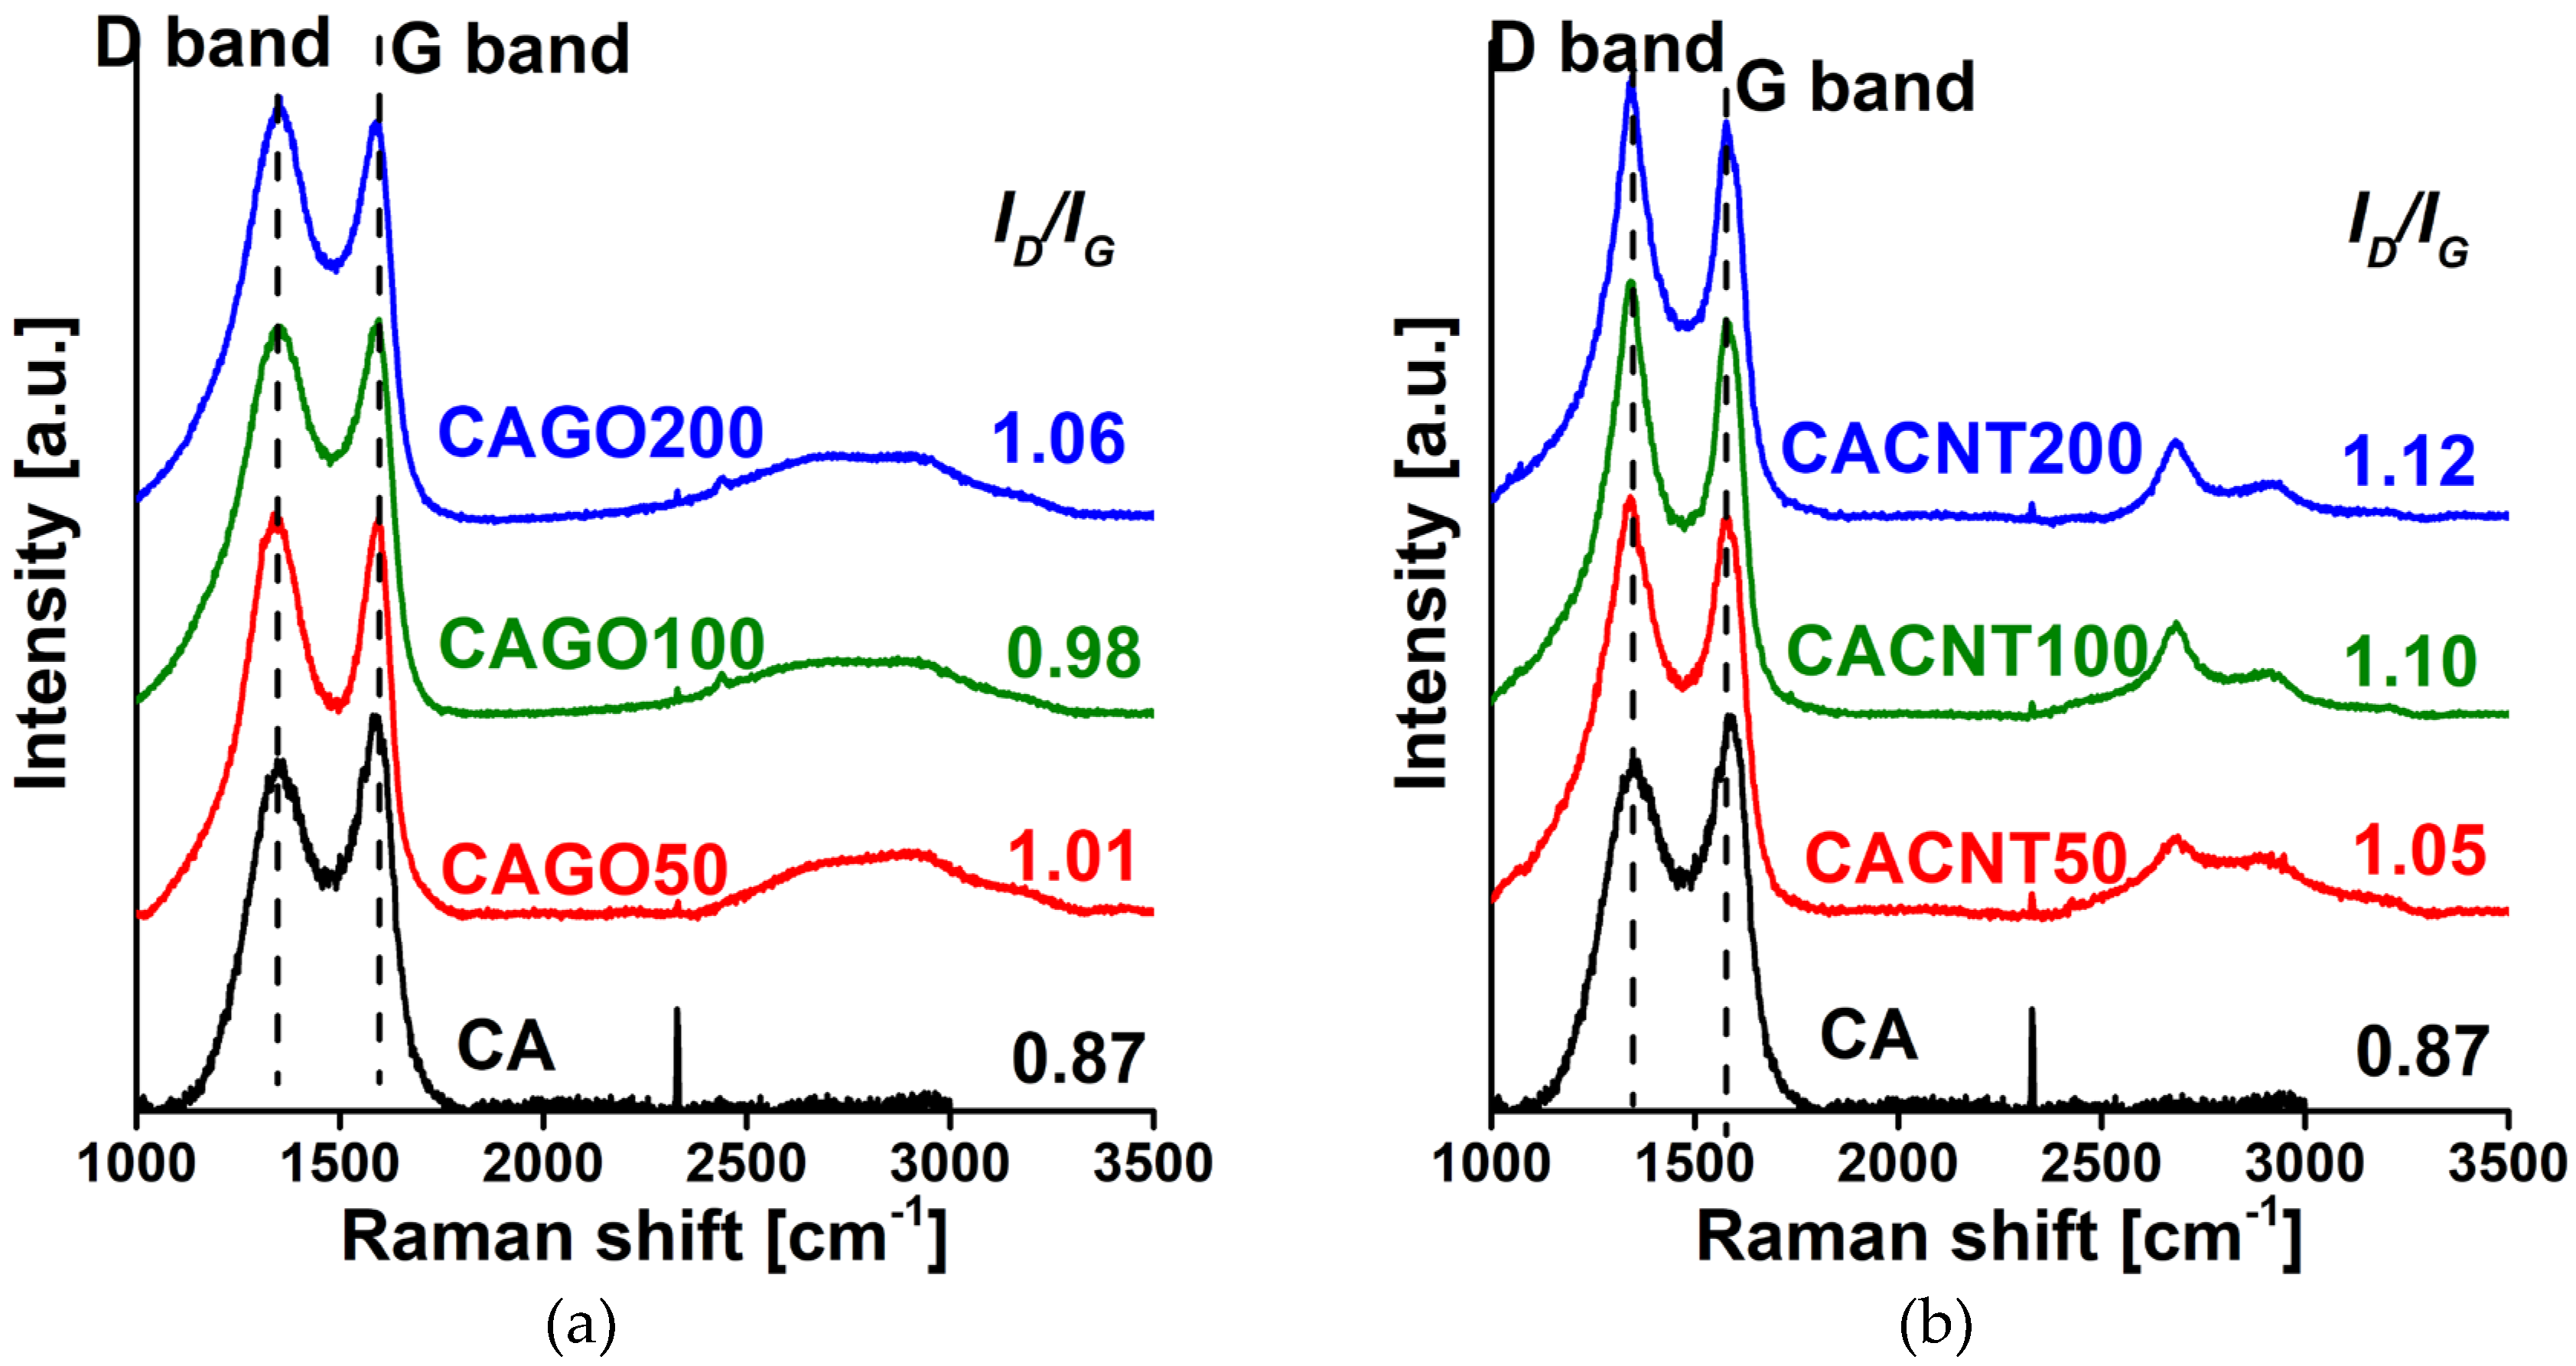
Figure 4. Raman spectra of the GO (a) and the CNT (b) doped carbons.
Preprints 75427 g004
The Raman spectra in Figure 4 show the iconic D (~1350 cm-1; defects, edges, and disordered carbon sites) and G (~1580 cm-1; E2g vibration of sp2-hybridized graphitic carbon) band regions typical of carbon materials [41]. Addition of either CNP enhanced the formation of defects, as demonstrated by the increasing ID/IG ratio with increasing amounts of additive. The effect is more pronounced in the CNT series.
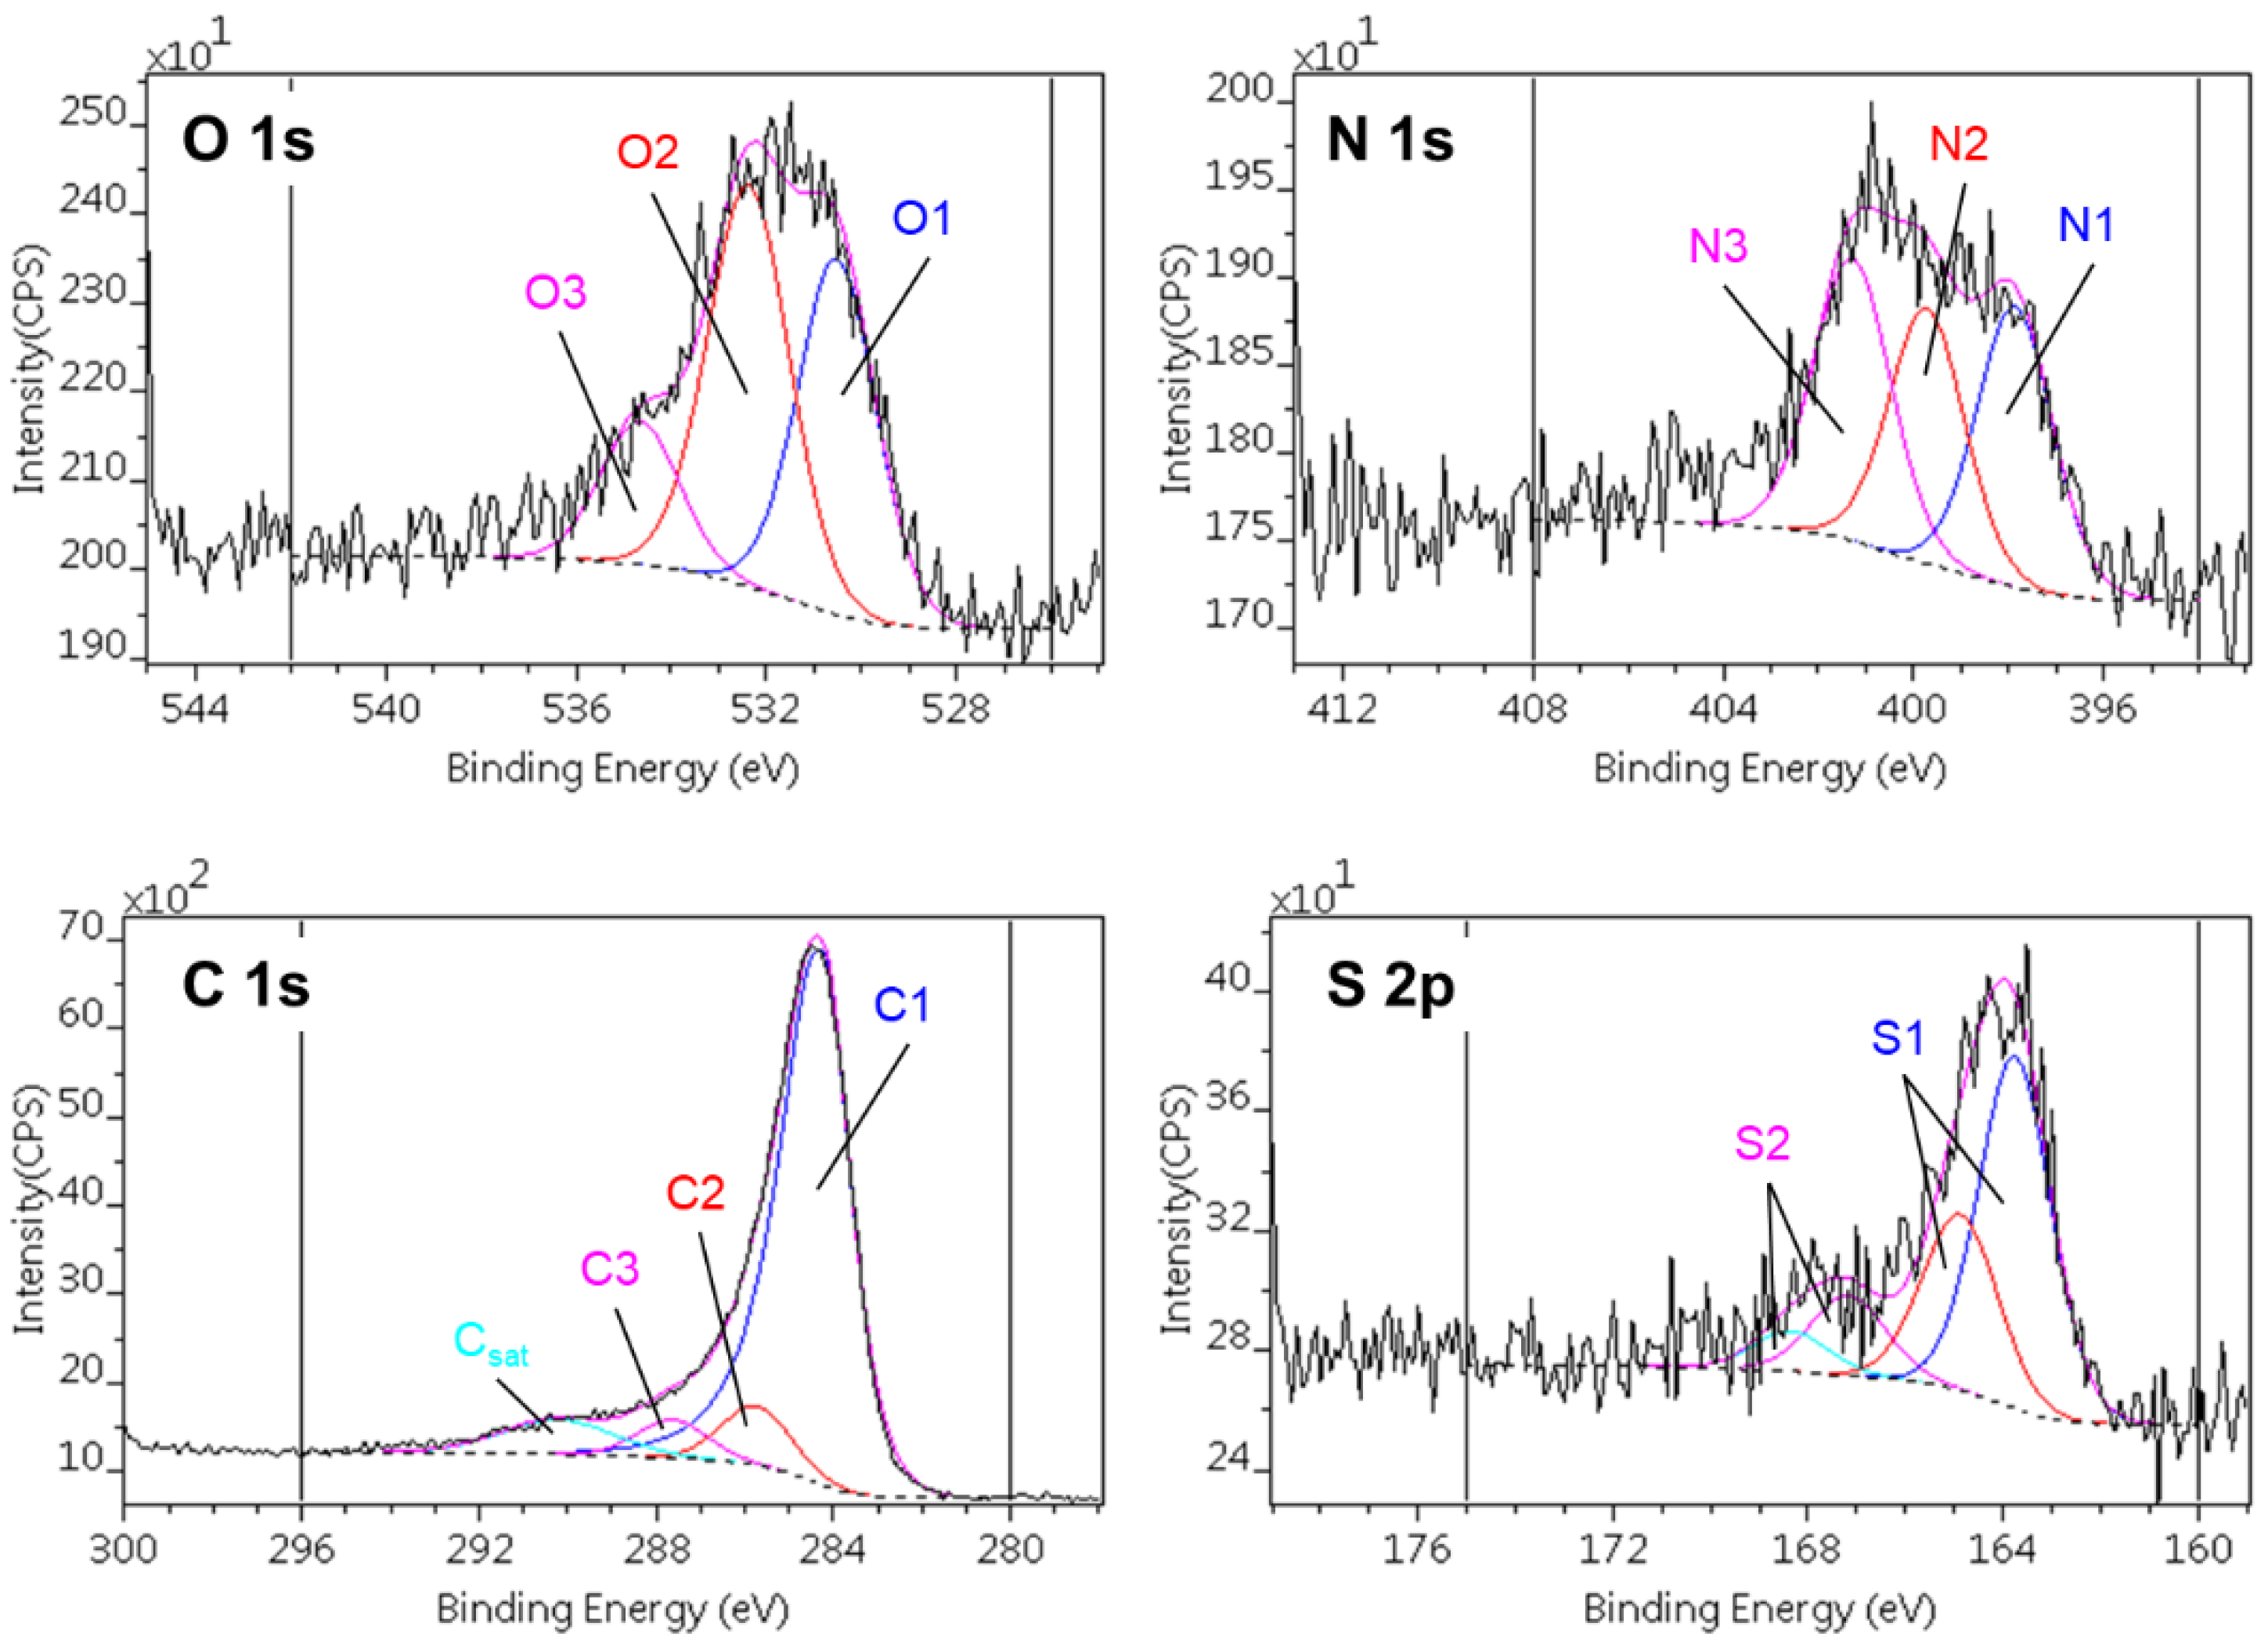
The effect of the incorporated CNPs on the surface composition was studied by XPS (Table 2). In the CAGO samples, the C content increases in CAGO50 and then decreases for the two other GO concentrations, while for the CACNT samples the C content increases slightly but systematically. Regarding the nitrogen content, its concentration decreases in both sets of samples but most notably for the CACNT samples. In contrast, the S content does not significantly change among the samples. Figure 5 shows an example of the composite photoelectron lines (C1s, O1s, N1s and S2p) and their decomposition into the different chemical states. The binding energy ranges of the various states and their concentration are listed in Table 3 and Table 4. Three different states of carbon, oxygen and nitrogen and two states of sulfur were distinguished in all the samples.
Table 2. Surface composition (atomic %) measured by XPS.
Sample C O N S O/C N/C S/C O+N+S
C
S/N
CA 90.6 3.3 5.1 1.0 0.036 0.056 0.011 0.104 0.196
CAGO50 92.0 3.1 3.7 1.3 0.034 0.039 0.014 0.087 0.361
CAGO100 90.7 4.1 4.1 1.2 0.045 0.045 0.013 0.104 0.293
CAGO200 90.4 3.7 4.4 1.4 0.041 0.049 0.015 0.105 0.318
GO 67.4 32.1 - 0.5 0.476 - 0.007 0.484 -
CACNT50 91.6 4.0 3.1 1.2 0.044 0.034 0.013 0.091 0.387
CACNT100 91.8 3.7 3.4 1.1 0.040 0.037 0.012 0.089 0.323
CACNT200 92.2 4.6 1.9 1.2 0.050 0.021 0.013 0.084 0.632
CNTs 94.9 5.1 - - 0.054 - - 0.054 -
Figure 5. Decomposition of C1s, O1s, N1s and S2p regions of photoelectron spectra of the CACNT50 sample.
Preprints 75427 g005
Table 3. Decomposition of C1s and O1s regions of photoelectron spectra: binding energy ranges, chemical state assignations and surface compositions (atomic %) [36].
C1s O1s
C1 C2 C3 O1 O2 O3
Chemical state sp2 C=C C–O
C–N
C–S
C=O
O–C–O
N–C–O
S–O C–O–C
C–OH
C=O
OC–O–CO
(H2O)
Binding energy [eV] 284.3 –
284.4
285.7 –
285.8
287.5 –
287.9
530.2 – 530.6 532.1 – 532.5 533.9 – 534.3
CA 74.0 10.9 5.4 1.5 1.7 n.d.
CAGO50 78.8 7.4 5.5 1.9 1.3 n.d.
CAGO100 74.7 11.0 4.8 1.8 1.7 0.7
CAGO200 75.9 9.4 4.8 1.8 1.6 0.5
CACNT50 78.6 7.8 5.1 1.6 1.9 0.7
CACNT100 80.5 7.4 4.5 1.3 2.0 0.7
CACNT200 75.7 10.8 5.5 1.7 2.3 0.9
Table 4. Decomposition of N1s and S2p regions of photoelectron spectra: binding energy ranges, chemical state assignations and surface compositions (atomic %) [36].
N1s S2p
N1 N2 N3 S1 S2
Chemical state C–N OO–C–N C–N+ C–S C–SO3
Binding energy [eV] 397.8 –
398.0
400.4 – 400.5 402.4 – 402.7 164.9 – 165.0 168.3 – 168.6
CA 2.3 2.3 0.8 0.9 0.2
CAGO50 1.6 1.7 0.6 1.2 n.d.
CAGO100 1.9 1.9 0.4 1.0 0.2
CAGO200 2.0 2.0 0.7 1.1 0.3
CACNT50 1.1 1.0 1.1 1.0 0.2
CACNT100 0.9 0.7 0.9 1.0 0.2
CACNT200 0.6 0.5 0.8 0.9 0.4
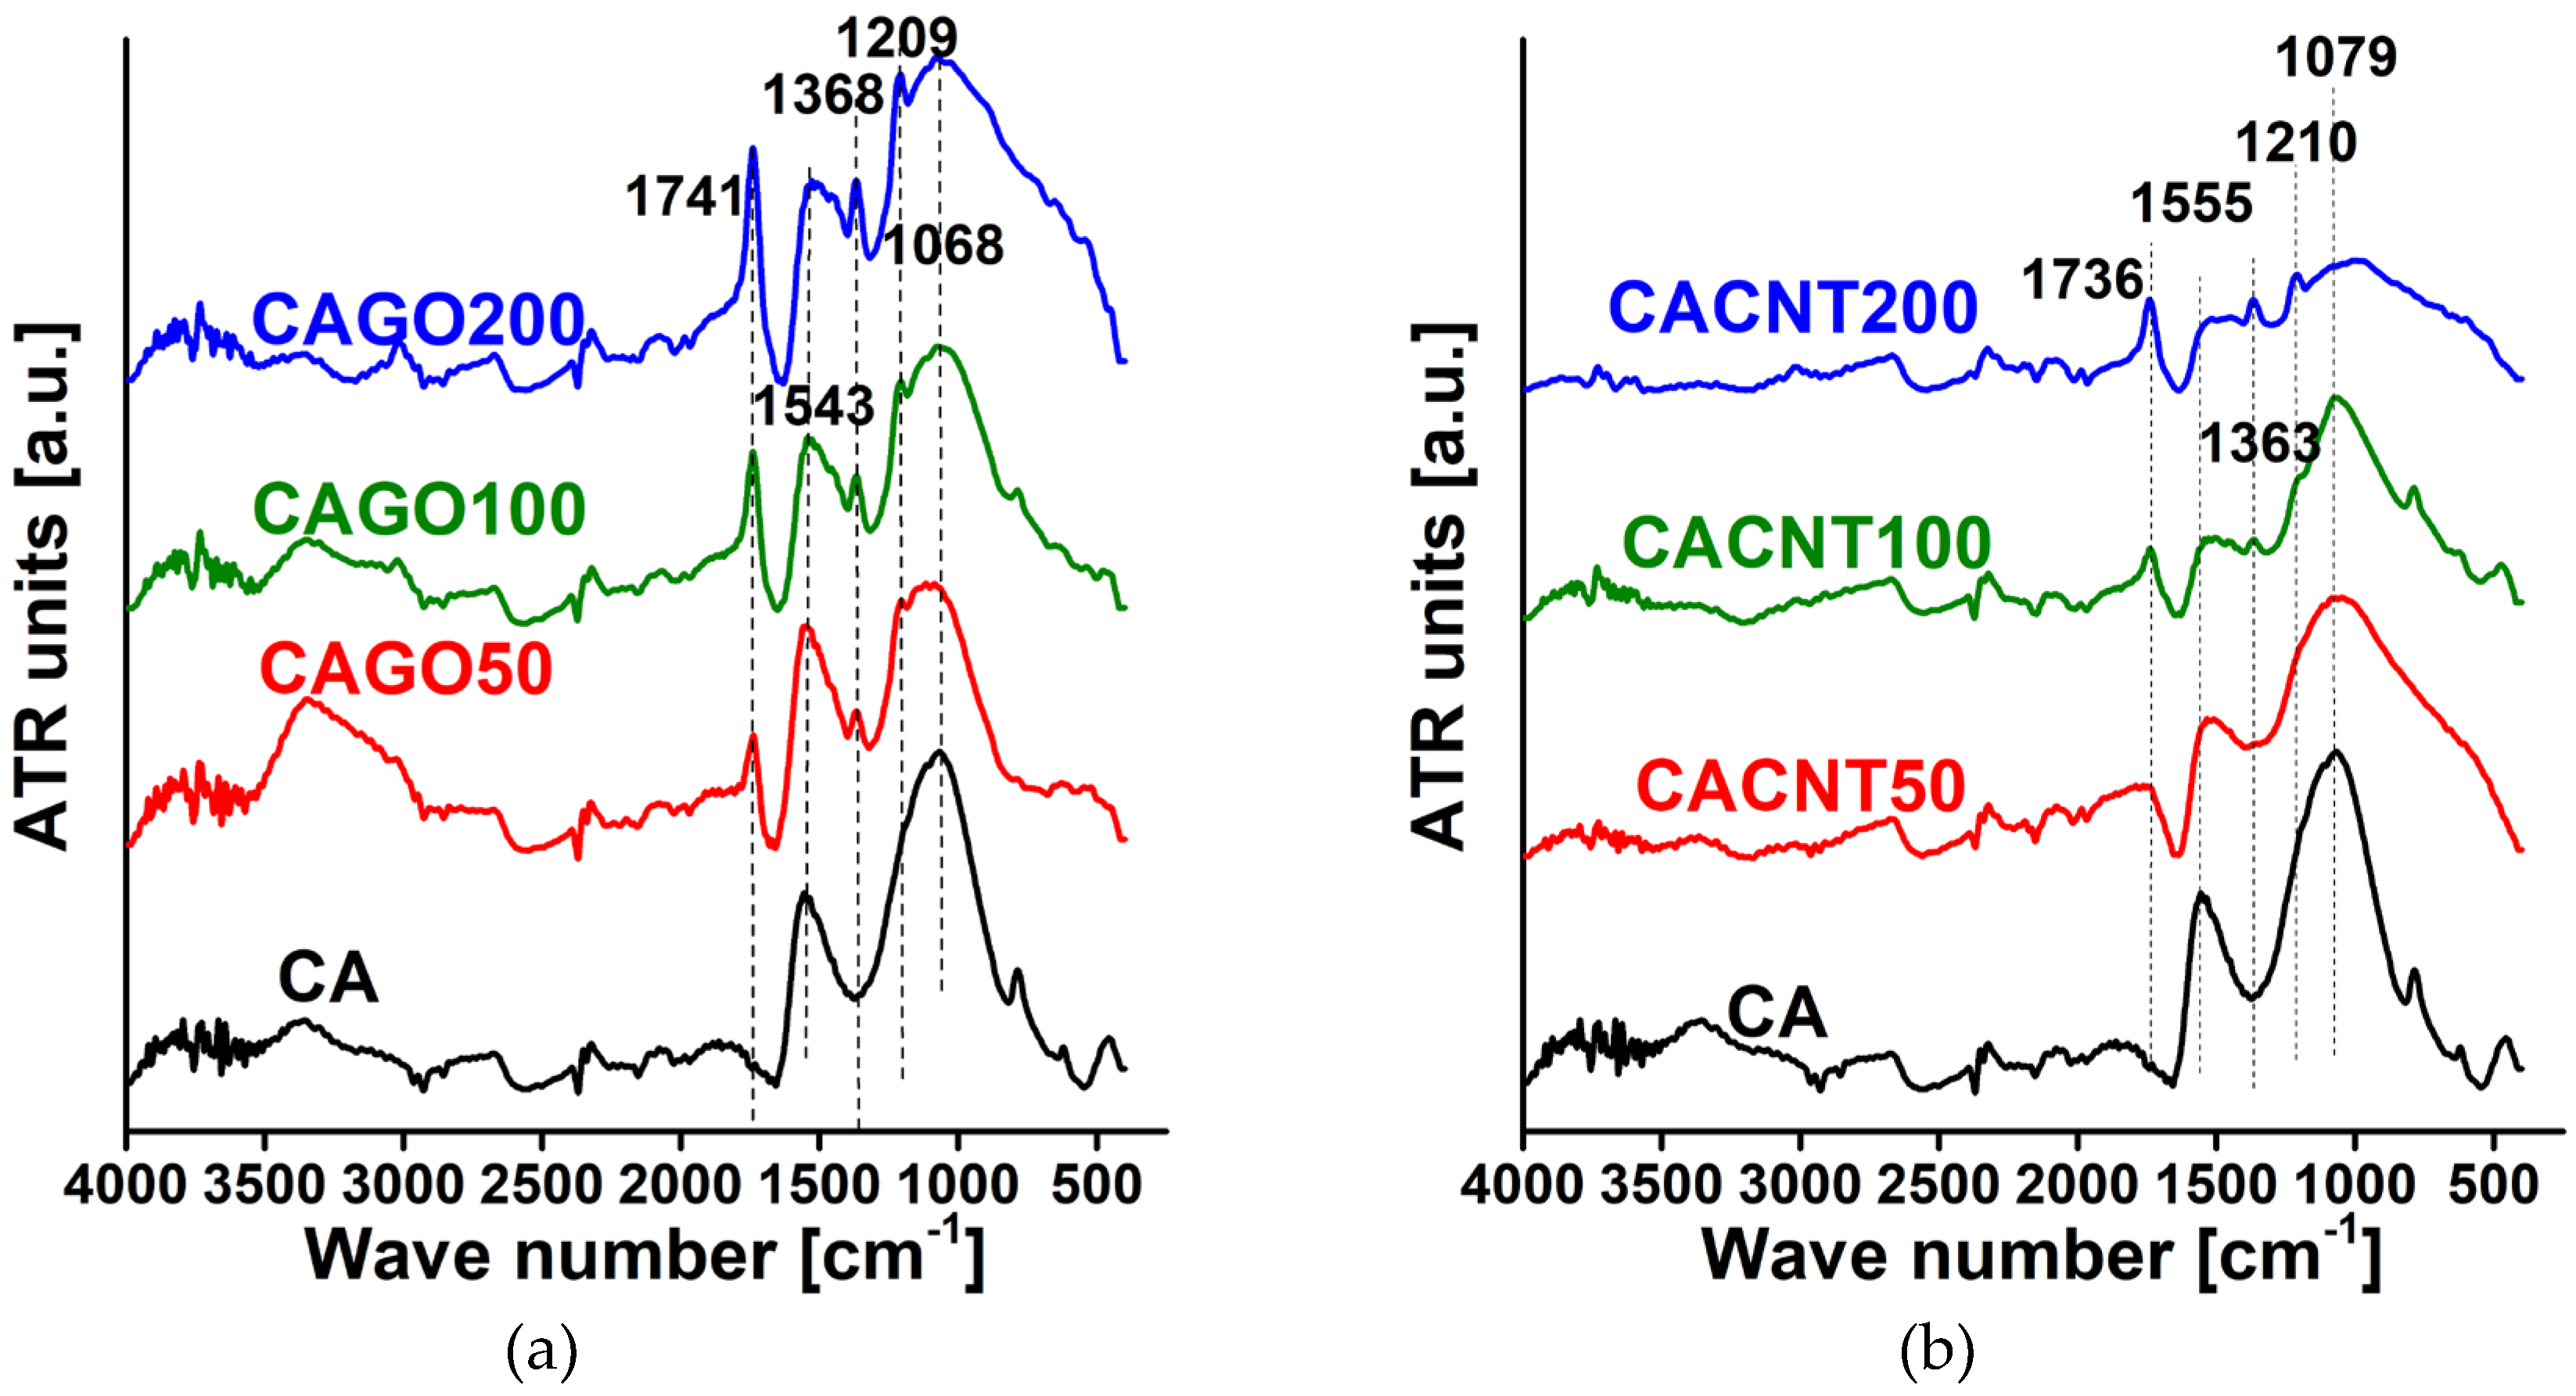
As XPS characterizes only the upper few nm of the samples, FTIR was also performed to reveal the composition also in the deeper regions. The spectra for both sets of carbons are shown in Figure 6. The lines used for assignment are shown in Table 5 and the relative intensity ratios compared to the C=C signal are listed in Table 6. A systematic increase in the C=O/C=C and OH/C=C ratios was observed for both sets of samples, which may suggest that the thermal decomposition of both GO and the CNTs caused a relative increase in the oxygen functionalities C=O and OH with increasing CNP content. This agrees well with the chemical composition obtained from XPS.
Figure 6. FTIR spectra of GO doped carbons (a), and CNT doped carbons (b).
Preprints 75427 g006
Table 5. Assignation of the FTIR peaks [42].
Wavenumber [cm-1] Assignation
1750–1705 aromatic (1730–1705) and aliphatic (1750–1730) C=O stretching
1600–1400 stretching and contracting of the C=C bonds in the aromatic ring
1350 ± 50 OH in plane bending of phenol and alcohol groups
1260–1200 C–O stretching in phenols
1060–1035 C-O stretching in noncyclic acid anhydrides
Table 6. Intensity ratios of FTIR signal.
Sample C=O/C=C OH/C=C C-O(H)/C=C C-O-C/C=C
CA 0.19 0.50 1.33 1.69
CAGO50 0.53 0.62 1.10 1.17
CAGO100 0.93 0.78 1.31 1.51
CAGO200 1.17 1.02 1.55 1.60
CACNT50 0.53 0.81 1.50 1.86
CACNT100 0.91 1.00 1.73 2.68
CACNT200 1.33 1.33 1.72 1.89

3.2. Gas storage and separation results
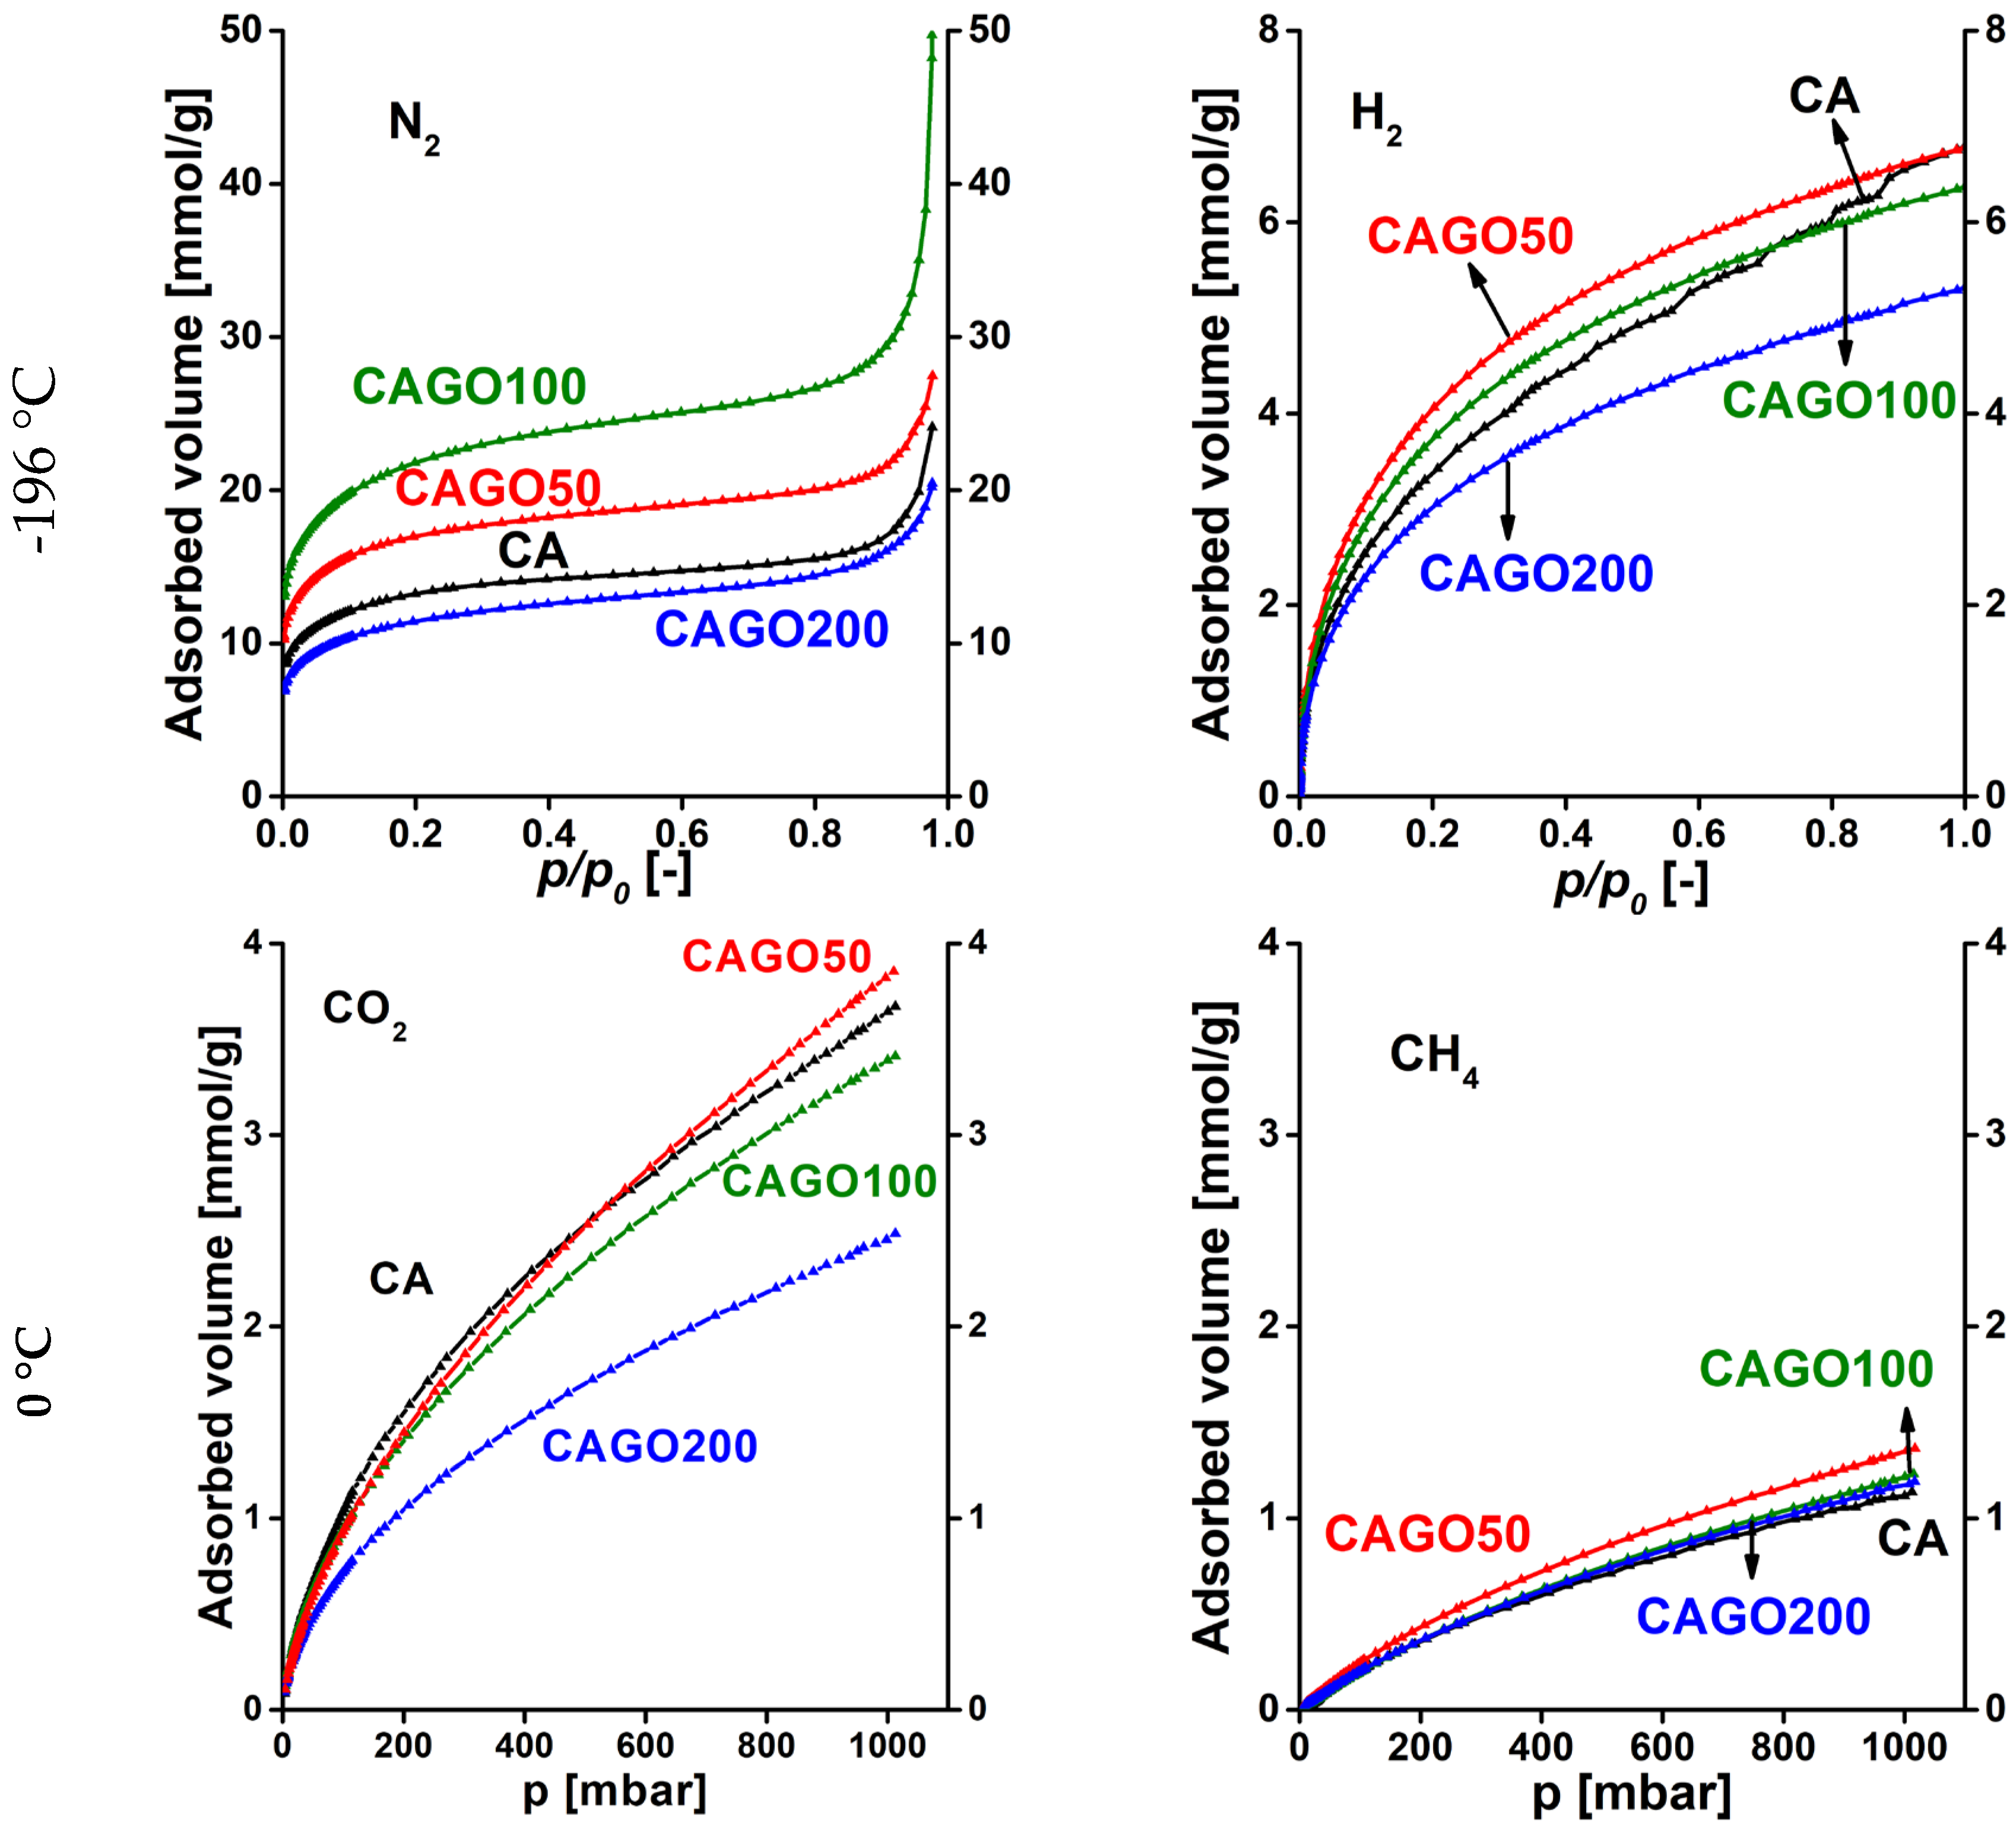
The potential of these carbons in gas separation was based on single gas adsorption measurements. IAST was applied to estimate the efficiency of separation for the corresponding gas pairs [29]. The N2, CO2, H2, and CH4 adsorption isotherms of the various GO doped carbon samples are shown in Figure 7. It should be noted that the effect of the incorporated GO varies from adsorbate to adsorbate. Incorporation of GO in the early stage of the synthesis affects not only the gel formation, but even more the porous texture and the surface chemistry in a sophisticated way. On comparing the N2 and H2 uptakes at -196 °C it is clear that all samples adsorb significantly more N2 than H2, as the boiling point of H2 -252.9 °C is much lower than the temperature of the uptake measurements. The almost tenfold difference indicates the potential of these carbon samples for N2/H2 separation. It is known that the combination of high amounts of narrow micropores decorated with oxygen and nitrogen functional groups enhances CO2 uptake [22]. The isotherms of CO2 and CH4 adsorption (0 °C) show that CAGO50 attains the highest uptake for both gases and that all samples adsorb more than twice as much CO2 as CH4. This may indicate the potential of the samples for CO2/CH4 separation.
Figure 7. Adsorption isotherms of GO doped carbon cryogels. N2 and H2 were measured at -196 °C, while CO2 and CH4 isotherms were measured at 0 °C.
Preprints 75427 g007
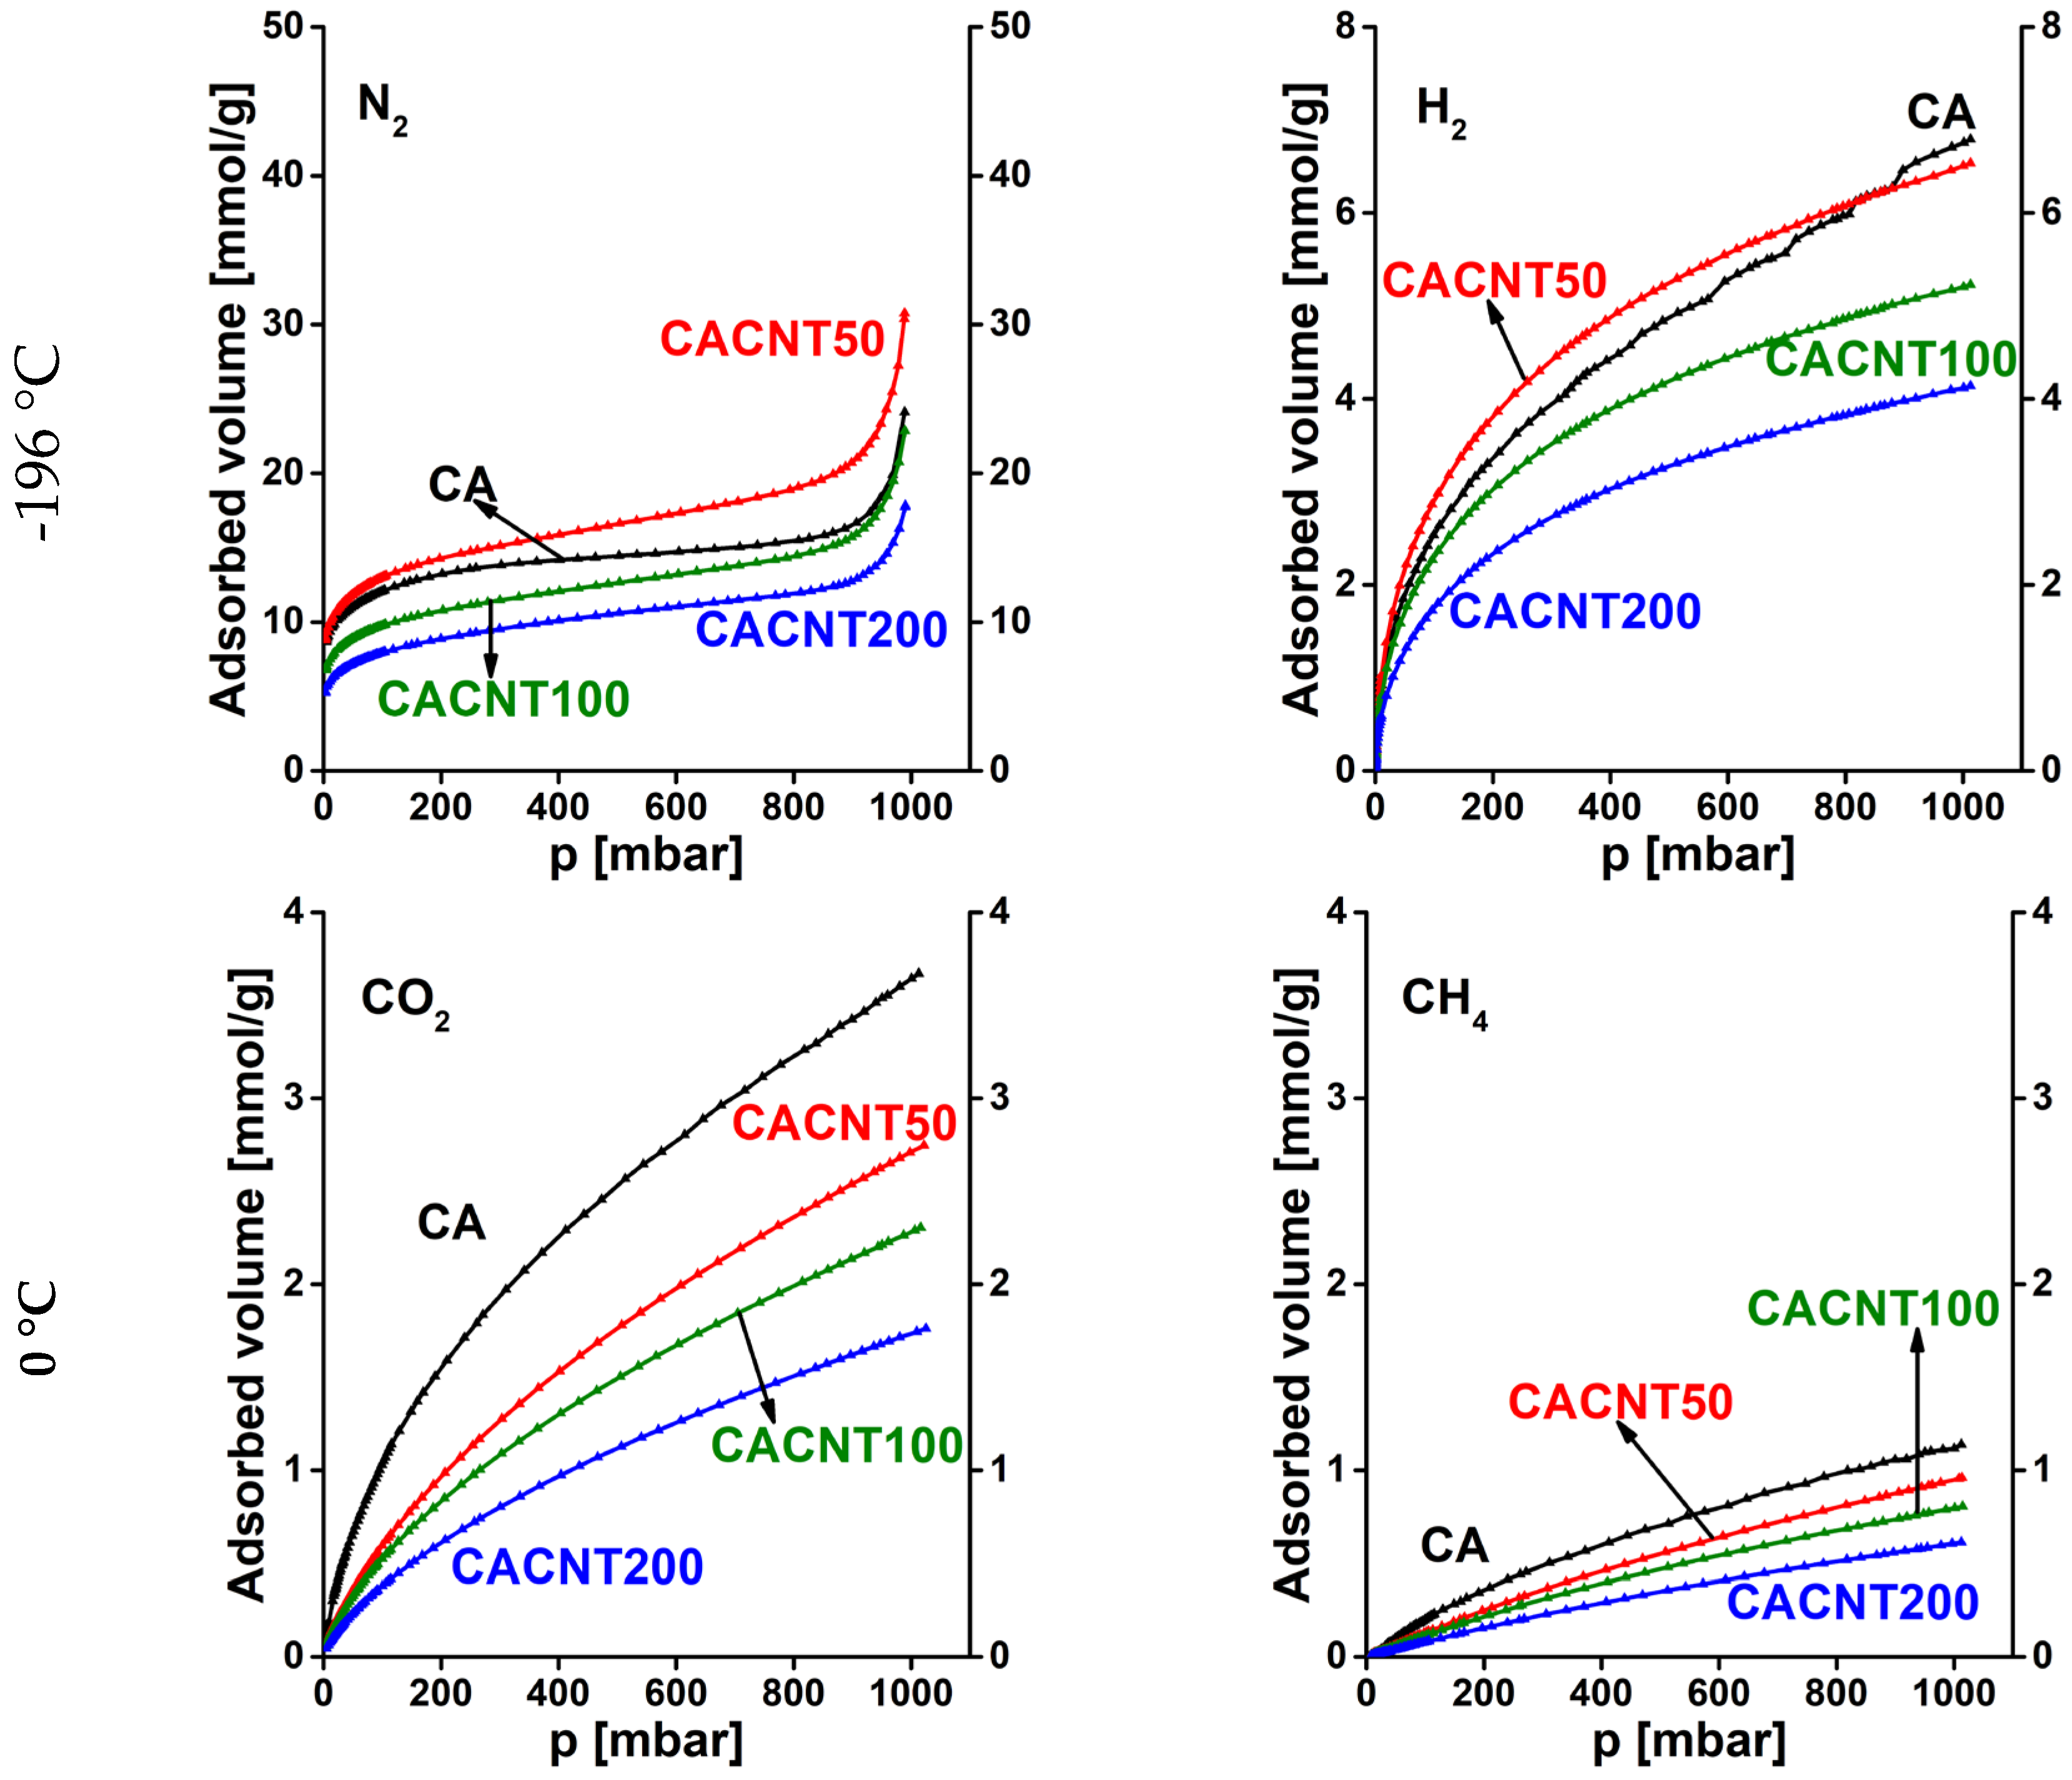
Similarly, Figure 8 presents the N2, H2, CO2, and CH4 adsorption isotherms of the annealed CNT doped carbons. Here the sequence of the overall uptakes is similar at the two temperatures, respectively. Generally, CNT doped samples display a poorer adsorption performance (proportional to the incorporated CNT) than the undoped cryogel. Only sample CACNT50 has somewhat higher uptakes for gases measured at -196 °C.
Figure 8. Adsorption isotherms of CNT doped carbon cryogels. N2 and H2 were measured at -196 °C, while CO2 and CH4 isotherms were measured at 0 °C.
Preprints 75427 g008
These isotherms were evaluated using the DR model
ln W = ln W 0 R T E 2 ln 2 p 0 p
where W is the actual filling of the micropore volume W0, E is the characteristic energy of the given system, p is the equilibrium pressure and p0 is the saturation pressure of the probe gas at the temperature T of the measurement. The initial section was also fitted to the Henry model
n = K H p p 0
where n is the adsorbed gas (mmol/g) at the corresponding pressure and KH is the Henry constant.
The strengths of the interaction were characterized by the DR slopes and the Henry constants (Table 7).
Table 7. Interaction related parameters and their ratios from the probe gas isotherms. in Figure 7 and Figure 8.
CA CAGO50 CAGO100 CAGO200 CACNT50 CACNT100 CACNT200
N2, -196 °C R T E 2 0.0236 0.0254 0.0271 0.0278 0.0297 0.0292 0.0298
R T E 0.154 0.159 0.165 0.167 0.172 0.171 0.173
KH* 0.151 0.284 0.338 0.156 0.213 0.152 0.140
H2, -196 °C R T E 2 0.0978 0.106 0.108 0.0988 0.0842 0.116 0.0870
R T E 0.313 0.325 0.329 0.314 0.290 0.341 0.295
KH 0.543 0.661 0.541 0.437 0.430 0.329 0.241
N2/H2, -196 °C R T E 2
ratio
0.241 0.240 0.251 0.281 0.353 0.252 0.343
R T E
ratio
0.491 0.490 0.501 0.530 0.594 0.502 0.586
KH ratio 0.277 0.430 0.625 0.357 0.495 0.461 0.582
CO2, 0 °C R T E 2 0.212 0.196 0.182 0.163 0.197 0.198 0.201
R T E 0.461 0.442 0.427 0.403 0.444 0.444 0.448
KH 0.0186 0.0166 0.0190 0.0148 0.00950 0.00890 0.00620
CH4, 0 °C R T E 2 0.551 0.239 0.195 0.251 0.236 0.239 0.220
R T E 0.742 0.488 0.442 0.501 0.486 0.488 0.469
KH 0.00210 0.00300 0.00210 0.00240 0.00140 0.00120 0.000900
CO2/CH4, 0 °C R T E 2
ratio
0.385 0.821 0.932 0.649 0.835 0.828 0.913
R T E
ratio
0.620 0.906 0.966 0.805 0.914 0.910 0.956
KH ratio 8.86 5.53 9.048 6.17 6.79 7.42 6.89
* Expressed in mmol/(g⋅mbar).
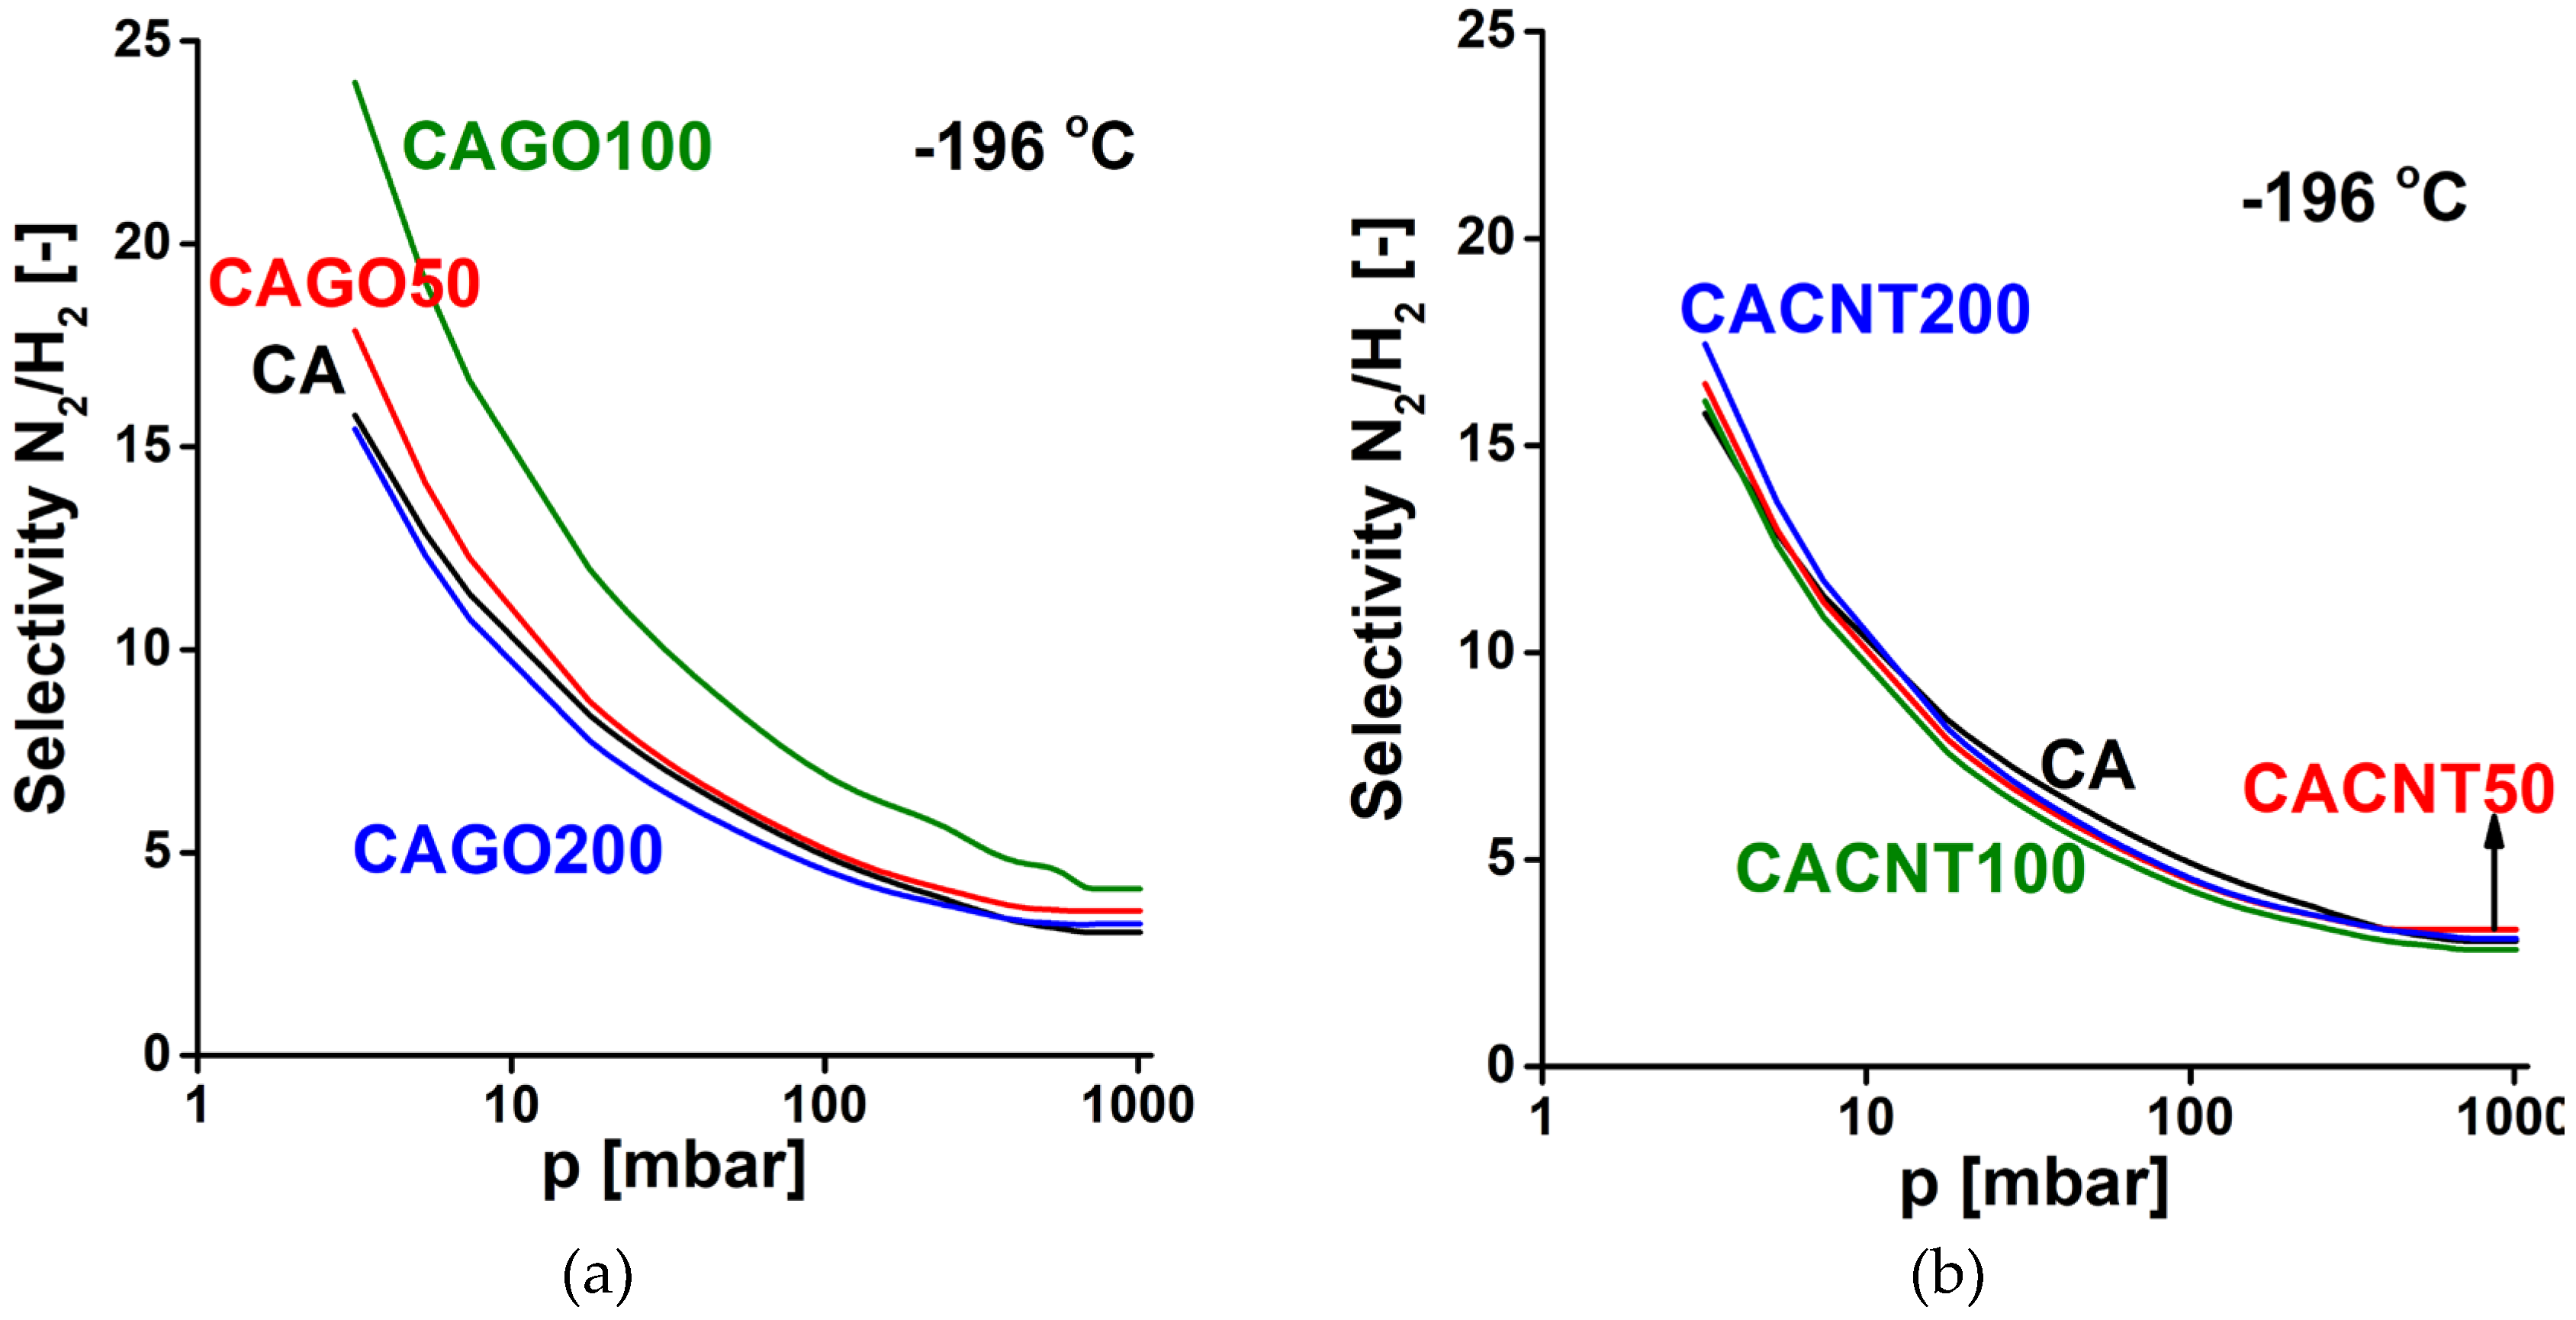
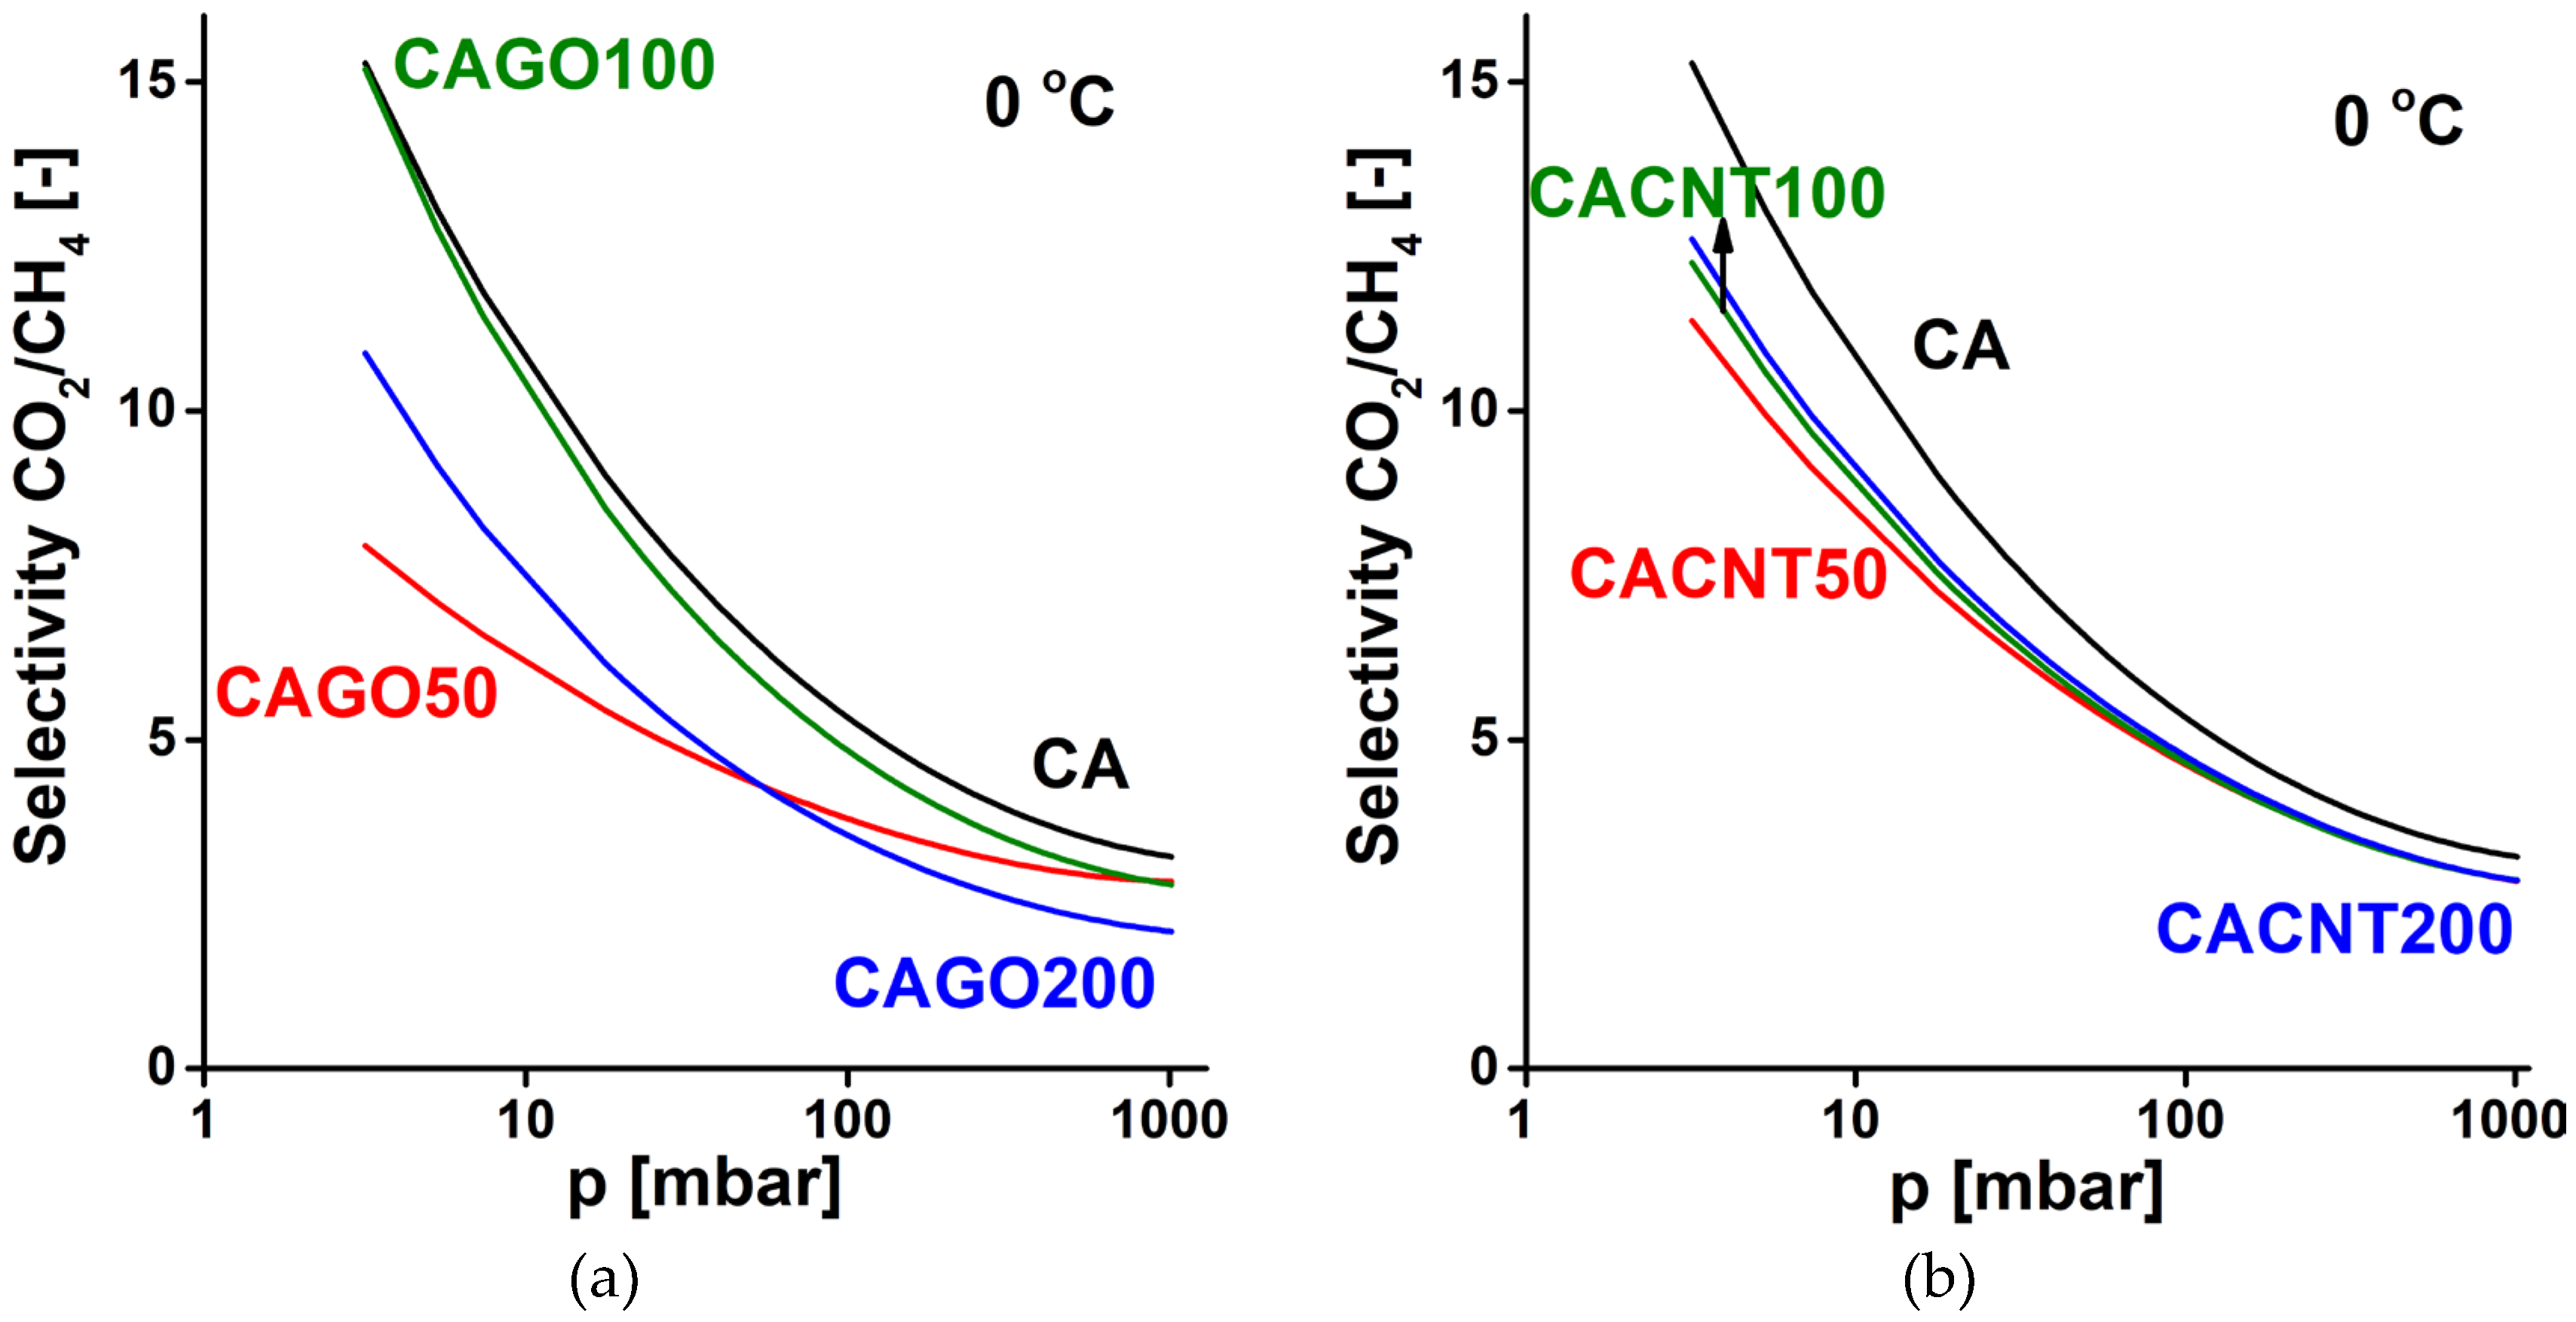
As in the work of Kamran et al [43], IAST [29] was also used with the fitted adsorption data to determine and compare the N2/H2 and CO2/CH4 selectivity of the GO and CNT doped carbon samples. The N2 adsorption isotherms were fitted to polynomial curves, while the CO2, CH4, and H2 adsorption isotherms were fitted to the single-site Langmuir-Freundlich model [44,45]
n = n s a t K p m 1 + K p m
where n is the quantity adsorbed at equilibrium pressure p, nsat is the saturation capacity, K is the equilibrium constant of the Langmuir model and m (>1) is the Freundlich exponent. The selectivity curves for the N2/H2 system are shown in Figure 9, and those corresponding to the CO2/CH4 system are shown in Figure 10. In all the cases studied the selectivity gradually reduces with increasing pressure. As expected, all the carbons preferentially adsorb nitrogen compared to hydrogen at -196 °C. The GO doped carbons display a selectivity that is also influenced by the added GO. The CAGO100 sample is significantly better than the pristine CA carbon over the whole pressure range. For the CNT doped carbons, all the selectivity curves lie close to that of the CA carbon, which indicates that the inclusion of CNTs did not affect the N2/H2 selectivity.
Figure 9. N2/H2 selectivity curves of GO doped carbons (a), CNT doped carbons (b).
Preprints 75427 g009
Figure 10. CO2/CH4 selectivity curves of GO doped carbons (a), CNT doped carbons (b).
Preprints 75427 g010
In CO2/CH4 separation at 0 °C (Figure 10) all the CNP incorporated samples performed more poorly than the undoped CA carbon. Only sample CAGO100 reached a selectivity similar to CA in the lower pressure range. Apart from this case the CNT doped samples exhibited better selectivity than the GO family.
Relative adsorption and thus selectivity are also a trade-off between multiple kinetics and diffusion controlled processes (neither being independent of pore morphology and surface interactions). The selectivity curves shown here are therefore only estimates that ignore any time dependent aspect of the separation.

4. Conclusions

Double-doped N, S porous carbon samples incorporating GO and CNT were successfully obtained from ι-carrageenan by applying urea as nitrogen source during the synthesis. The carbon nanoparticles, distributed homogeneously into the precursor gel, yielded a modified porous texture, particularly with GO with its significantly higher oxygen content. The highest apparent surface and pore volume as found in the case of GO in the sample CAGO100, while for CNT it was CACNT50. The CNPs also introduce further disorder into the matrix and result in a limited drop in the nitrogen content without affecting the surface concentration of sulfur. Nitrogen and hydrogen isotherms measured at -196 °C and CO2 and CH4 isotherms at 0 °C were used to assess the effect of the CNPs on the selectivity of these carbons. Incorporation of CNT reduced selectivity compared to neat CA itself. GO displayed a concentration related effect. CAGO100, the best of the GO samples, revealed enhanced selectivity in N2/H2 separation. The estimations given here are based on the equilibrium isotherms and thus exclude any kinetic or diffusion related mechanisms.

Author Contributions

Conceptualization, K.L.; methodology, M.M., A. K-M.; investigation, SKSA, BN; resources, K.L.; data curation, Sz.K.; writing—original draft preparation, K.L., SKSA; writing—review and editing, K.L All authors have read and agreed to the published version of the manuscript.

Funding

Financial support from the Hungarian Scientific Research Funds OTKA K128410 is acknowledged. The research is part of project no. BME-NVA-02, implemented with the support of the Ministry of Innovation and Technology of Hungary from the National Research, Development and Innovation Fund, and financed under the TKP2021 funding scheme. SKSA is grateful to the Stipendium Hungaricum scholarship program of the Hungarian Government.

Acknowledgments

We extend our warm thanks to A. Farkas for his invaluable assistance in Raman spectroscopy and to G. Bosznai for his technical assistance.

Conflicts of Interest

The authors declare no conflict of interest.

References

  1. M.M. Titirici, R.J. White, C. Falco, M. Sevilla. Black perspectives for a green future: Hydrothermal carbons for environment protection and energy storage. Energy Environ Sci. 2012, 5, 6796-6822. DOI: 10.1039/C2EE21166A. [CrossRef]
  2. E. Azwar, W.A.W. Mahari, J. Huang Chuah, D.V.N. Vo, N.L. Ma, W.H. Lam, S.S. Lam. Transformation of biomass into carbon nanofiber for supercapacitor application—a review. Int J Hydrog Energy. 2018, 43, 20811–20821. DOI: 10.1016/j.ijhydene.2018.09.111. [CrossRef]
  3. D. Praveen Kumar, D. Ramesh, V. Karuppasamy Vikraman, P. Subramanian. Synthesis of carbon molecular sieves from agricultural residues: status, challenges and prospects. Environ. Res., 2022, 214, 114022. DOI: 10.1016/j.envres.2022.114022. [CrossRef]
  4. Rehman, G. Nazir, K.Y. Rhee, S.J. Park. A rational design of cellulose-based heteroatom-doped porous carbons: Promising contenders for CO2 adsorption and separation. J. Chem. Eng., 2021, 420, 130421. DOI: 10.1016/j.cej.2021.130421. [CrossRef]
  5. Y. Tan, X. Wang, S. Song, M. Sun, Y. Xue, G. Yang. Preparation of nitrogen-doped cellulose-based porous carbon and its carbon dioxide adsorption properties. ACS Omega, 2021, 6, 24814-24825. DOI: 10.1021/acsomega.1c03664. [CrossRef]
  6. G. Onyestyák, K. László, L.V.C. Rees. Molecular sieve honeycomb for air separation from Picea abies. Helv. Chim. Acta, 2004, 87 (7), 1888-1893. DOI: 10.1002/hlca.200490167. [CrossRef]
  7. A.A. Alhwaige, T. Agag, H, Ishida, S. Qutubuddin. Biobased chitosan hybrid aerogels with superior adsorption: role of graphene oxide in CO2 capture. RSC Adv., 2013, 3 (36), 16011-16044. DOI: 10.1039/C3RA42022A. [CrossRef]
  8. S. Shi, F.O. Ochedi, S. Cui, Y. Liu. Removal of CO2 from flue gas using seaweed porous carbons prepared by urea doping and KOH activation. Energy Fuels, 2020, 34 (12), 16411–16422. DOI: 10.1021/acs.energyfuels.0c03200. [CrossRef]
  9. M. Yang, C. Ma, M. Xu, S. Wang, L. Xu. Recent advances in CO2 adsorption from air: a review. Current Pollution Reports, 2019, 5, 272–293. DOI: 10.1007/s40726-019-00128-1. [CrossRef]
  10. T.S. Lee, J.H. Cho, S.H. Chi. Carbon dioxide removal using carbon monolith as electric swing adsorption to improve indoor air quality. Build Environ., 2015, 92, 209–21. DOI: 10.1016/j.buildenv.2015.04.028. [CrossRef]
  11. Z. Zhang, J. Zhou, W. Xing, et al. Critical role of small micropores in high CO2 uptake. Phys Chem Chem Phys., 2013, 15 (7), 2523–2529. DOI: 10.1039/c2cp44436d. [CrossRef]
  12. L.F. Villalobos, D.J. Babu, K-J. Hsu, C. Van Goethem, K.V. Agrawal. Gas separation membranes with atom-thick nanopores: The potential of nanoporous single-layer graphene. Acc. Mater. Res., 2022, 3, 1073-1087. DOI: 10.1021/accountsmr.2c00143. [CrossRef]
  13. L. Zhu, D. Shen, K.H. Luo. A critical review on VOCs adsorption by different porous materials: species, mechanisms and modification methods. J. Hazard Mater., 2020, 389, 122102. DOI: 10.1016/j.jhazmat.2020.122102. [CrossRef]
  14. X. Jia, S. Xu, Y. Cong. Kinetics of spontaneous liquid-gas imbibition in carbon molecular sieves used for O2/N2 separation. Microporous Mesoporous Mater., 2017, 241, 185–191. DOI: 10.1016/j.micromeso.2016.12.040. [CrossRef]
  15. A.R. Mohamed, M. Mohammadi, G.N. Darzi. Preparation of carbon molecular sieve from lignocellulosic biomass: a review. Renew. Sustain. Energy Rev., 2010, 14, 1591–1599. DOI: 10.1016/j.rser.2010.01.024. [CrossRef]
  16. S. Villar-Rodil, R. Navarrete, R. Denoyel, A. Albiniak, J.I. Paredes, A. Martínez-Alonso, J.M.D. Tascón. Carbon molecular sieve cloths prepared by chemical vapour deposition of methane for separation of gas mixtures. Microporous Mesoporous Mater., 2005, 77, 109–118. DOI: 10.1016/j.micromeso.2004.08.017. [CrossRef]
  17. H. Marsh, F. Rodríguez Reinoso: Activated Carbon. Elsevier, 2006. DOI: 10.1016/B978-0-08-044463-5.X5013-4. [CrossRef]
  18. R. Muhammad, Y-C. Nah, H. Oh. Spider silk-derived nanoporous activated carbon fiber for CO2 capture and CH4 and H2 storage. J. CO2 Util., 2023, 69, 102401. DOI: 10.1016/j.jcou.2023.102401. [CrossRef]
  19. M. Sevilla, A.S.M. Al-Jumialy, A.B. Fuertes, R. Mokaya. Optimization of the pore structure of biomass-based carbons in relation to their use for CO2 capture under low- and high-pressure regimes. ACS Appl. Mater. Interfaces, 2018, 10, 1623-1633. DOI: 10.1021/acsami.7b10433. [CrossRef]
  20. T.S. Blankenship, N. Balahmar, R. Mokaya. Oxygen-rich microporous carbons with exceptional hydrogen storage capacity. Nat. Commun., 2017, 8, 1545. DOI: 10.1038/s41467-017-01633-x. [CrossRef]
  21. J. Park, N.F. Attia, M. Jung, M. Lee, K. Lee, J. Chung, H. Oh. Sustainable nanoporous carbon for CO2, CH4, N2, H2 adsorption and CO2/CH4 and CO2/N2 separation. Energy, 2018, 158, 9-16. DOI: 10.1016/j.energy.2018.06.010. [CrossRef]
  22. Ashourirad, P. Arab, A. Verlander, H.M. El-Kaderi. From Azo-linked polymers to microporous heteroatom-doped carbons: tailored chemical and textural properties for gas separation. ACS Appl. Mater. Interfaces, 2016, 8, 8491-8501. DOI: 10.1021/acsami.6b00567. [CrossRef]
  23. X. Wang, G. Sun, P. Routh, D-H. Kim, W. Huang, P. Chen. Heteroatom-doped graphene materials: synthesis, properties and applications. Chem. Soc. Rev., 2014, 43, 7067. DOI: 10.1039/c4cs00141a. [CrossRef]
  24. M. Sevilla, C. Falco, M.M. Titirici, A.B. Fuertes. High-performance CO2 sorbents from algae. RSC Adv., 2012, 2 (33), 12792-12797. DOI: 10.1039/C2RA22552B. [CrossRef]
  25. J. Liang, Y. Jiao, M. Jaroniec, S.Z. Qiao. Sulfur and nitrogen dual-doped mesoporous graphene electrocatalyst for oxygen reduction with synergistically enhanced performance. Angew. Chem. Int. Ed., 2012, 51 (46), 11496-11500. DOI: 10.1002/anie.201206720. [CrossRef]
  26. B.J. Bucior, D-L. Chen, J. Liu, J.K. Johnson. Porous carbon nanotube membranes for separation of H2/CH4 and CO2/CH4 mixtures. J. Phys. Chem. C., 2012, 116 (49), 25904-25910. DOI:10.1021/jp3098022. [CrossRef]
  27. Li, Y. Jia, G. Chang, J. Chen, H. Liu, J. Wang, Y. Hu, Y. Xia, D. Yang, X. Yao. A defect-driven metal-free electrocatalyst for oxygen reduction in acidic electrolyte. Chem, 2018, 4, 2345-2356. DOI: 10.1016/j.chempr.2018.07.005. [CrossRef]
  28. S.K. Samaniego Andrade, I. Bakos, G. Dobos, A. Farkas, G. Kiss, S. Klébert, J. Madarász, K. László. Biomass related highly porous metal free carbon for gas storage and electrocatalytic applications. Materials, 2021, 14 (13), 3488. DOI: 10.3390/ma14133488. [CrossRef]
  29. A.L. Myers, J.M. Prausnitz. Thermodynamics of mixed-gas adsorption. AIChE J, 1965, 11, 121-127. DOI: 10.1002/aic.690110125. [CrossRef]
  30. W.S. Hummers, R.E. Offeman. Preparation of graphitic oxide. J. Am. Chem. Soc., 1958, 80, 1339–1339. DOI: 10.1021/ja01539a017. [CrossRef]
  31. D.C. Marcano, D.V. Kosynkin, J.M. Berlin, A. Sinitskii, Z. Sun, A. Slesarev, et al.: Improved synthesis of graphene oxide. ACS Nano 2010, 4, 4806–14. DOI: 10.1021/nn1006368. [CrossRef]
  32. A. Tóth, K. V. Voitko, O. Bakalinska, G. P. Prykhod’ko, I. Bertóti, V. M. Gun’ko, K. László: Morphology and adsorption properties of chemically modified MWCNT probed by nitrogen, n-propane and water vapor. Carbon, 2012, 50 (2), 577-585. DOI: 10.1016/j.carbon.2011.09.016. [CrossRef]
  33. S. Brunauer, P.H. Emmett, E. Teller. Adsorption of gases in multimolecular layers. J. Am. Chem. Soc. 1938, 60, 309–319. DOI: 10.1021/ja01269a023. [CrossRef]
  34. M.M. Dubinin, L.V. Radushkevich. The Equation of the characteristic curve of activated charcoal. Dokl. Akad. Nauk. SSSR., 1947, 55, 327-329.
  35. J. Landers, G.Y. Gor, A.V. Neimark. Density functional theory methods for characterization of porous materials. Colloids Surf. A Physicochem. Eng., 2013, 437, 3-32. DOI: 10.1016/j.colsurfa.2013.01.007. [CrossRef]
  36. Bertóti, M. Mohai, K. László. Surface modification of graphene and graphite by nitrogen plasma: Determination of chemical state alterations and assignments by quantitative X-ray photoelectron spectroscopy. Carbon, 2015, 84, 185-196. DOI: 10.1016/j.carbon.2014.11.056. [CrossRef]
  37. M. Mohai. XPS MultiQuant: multimodel XPS quantification software. Surf. Interface Anal., 2004, 36 (8), 828-832. DOI: 10.1002/sia.1775. [CrossRef]
  38. S. Evans, R.G. Pritchard, J.M. Thomas. Relative differential subshell photoionization cross-sections (MgKα) from lithium to uranium. J. Electron Spectrosc. Relat. Phenom., 1978, 14 (5), 341-358. DOI: 10.1016/0368-2048(78)80008-5. [CrossRef]
  39. R.F. Reilman, A. Msezane, S.T. Manson. Relative intensities in photoelectron spectroscopy of atoms and molecules. J. Electron Spectrosc. Relat. Phenom., 1976, 8 (5), 389-394. DOI: 10.1016/0368-2048(76)80025-4. [CrossRef]
  40. M. Thommes, K. Kaneko, A.V. Neimark, J.P. Oliver, F. Rodriguez-Reinoso, J. Rouquerol, K.S.W. Sing. Physisorption of gases, with special reference to the evaluation of surface area and pore size distribution (IUPAC Technical Report). Pure Appl. Chem., 2015, 87 (9-10), 1051-1069. DOI: 10.1515/pac-2014-1117. [CrossRef]
  41. Y. Wang, D.C. Alsmeyer, R.L. McCreery. Raman spectroscopy of carbon materials: Structural basis of observed spectra. Chem. Mater., 1990, 2 (5), 557-563. DOI: 10.1021/cm00011a018. [CrossRef]
  42. B.C. Smith: Infrared Spectral Interpretation. CRC Press, 2018. DOI: 10.1201/9780203750841. [CrossRef]
  43. U. Kamran, S.J. Park. Acetic acid-mediated cellulose-based carbons: Influence of activation conditions on textural features and carbon dioxide uptakes. J. Colloid Interface Sci., 2021, 594, 745–758. DOI: 10.1016/j.jcis.2021.03.069. [CrossRef]
  44. R. Sips. On the structure of a catalyst surface. J. Chem. Phys., 1948, 16, 490-495. DOI: 10.1063/1.1746922. [CrossRef]
  45. R. Sips. On the structure of a catalyst surface. II. J. Chem. Phys., 1950, 18, 1024-1026. DOI: 10.1063/1.1747848. [CrossRef]
Disclaimer/Publisher’s Note: The statements, opinions and data contained in all publications are solely those of the individual author(s) and contributor(s) and not of MDPI and/or the editor(s). MDPI and/or the editor(s) disclaim responsibility for any injury to people or property resulting from any ideas, methods, instructions or products referred to in the content.
Copyright: This open access article is published under a Creative Commons CC BY 4.0 license, which permit the free download, distribution, and reuse, provided that the author and preprint are cited in any reuse.
Prerpints.org logo

Preprints.org is a free preprint server supported by MDPI in Basel, Switzerland.

Subscribe

© 2024 MDPI (Basel, Switzerland) unless otherwise stated