Submitted:
02 June 2023
Posted:
02 June 2023
You are already at the latest version
Abstract
Keywords:
1. Introduction
2. Materials and Methods
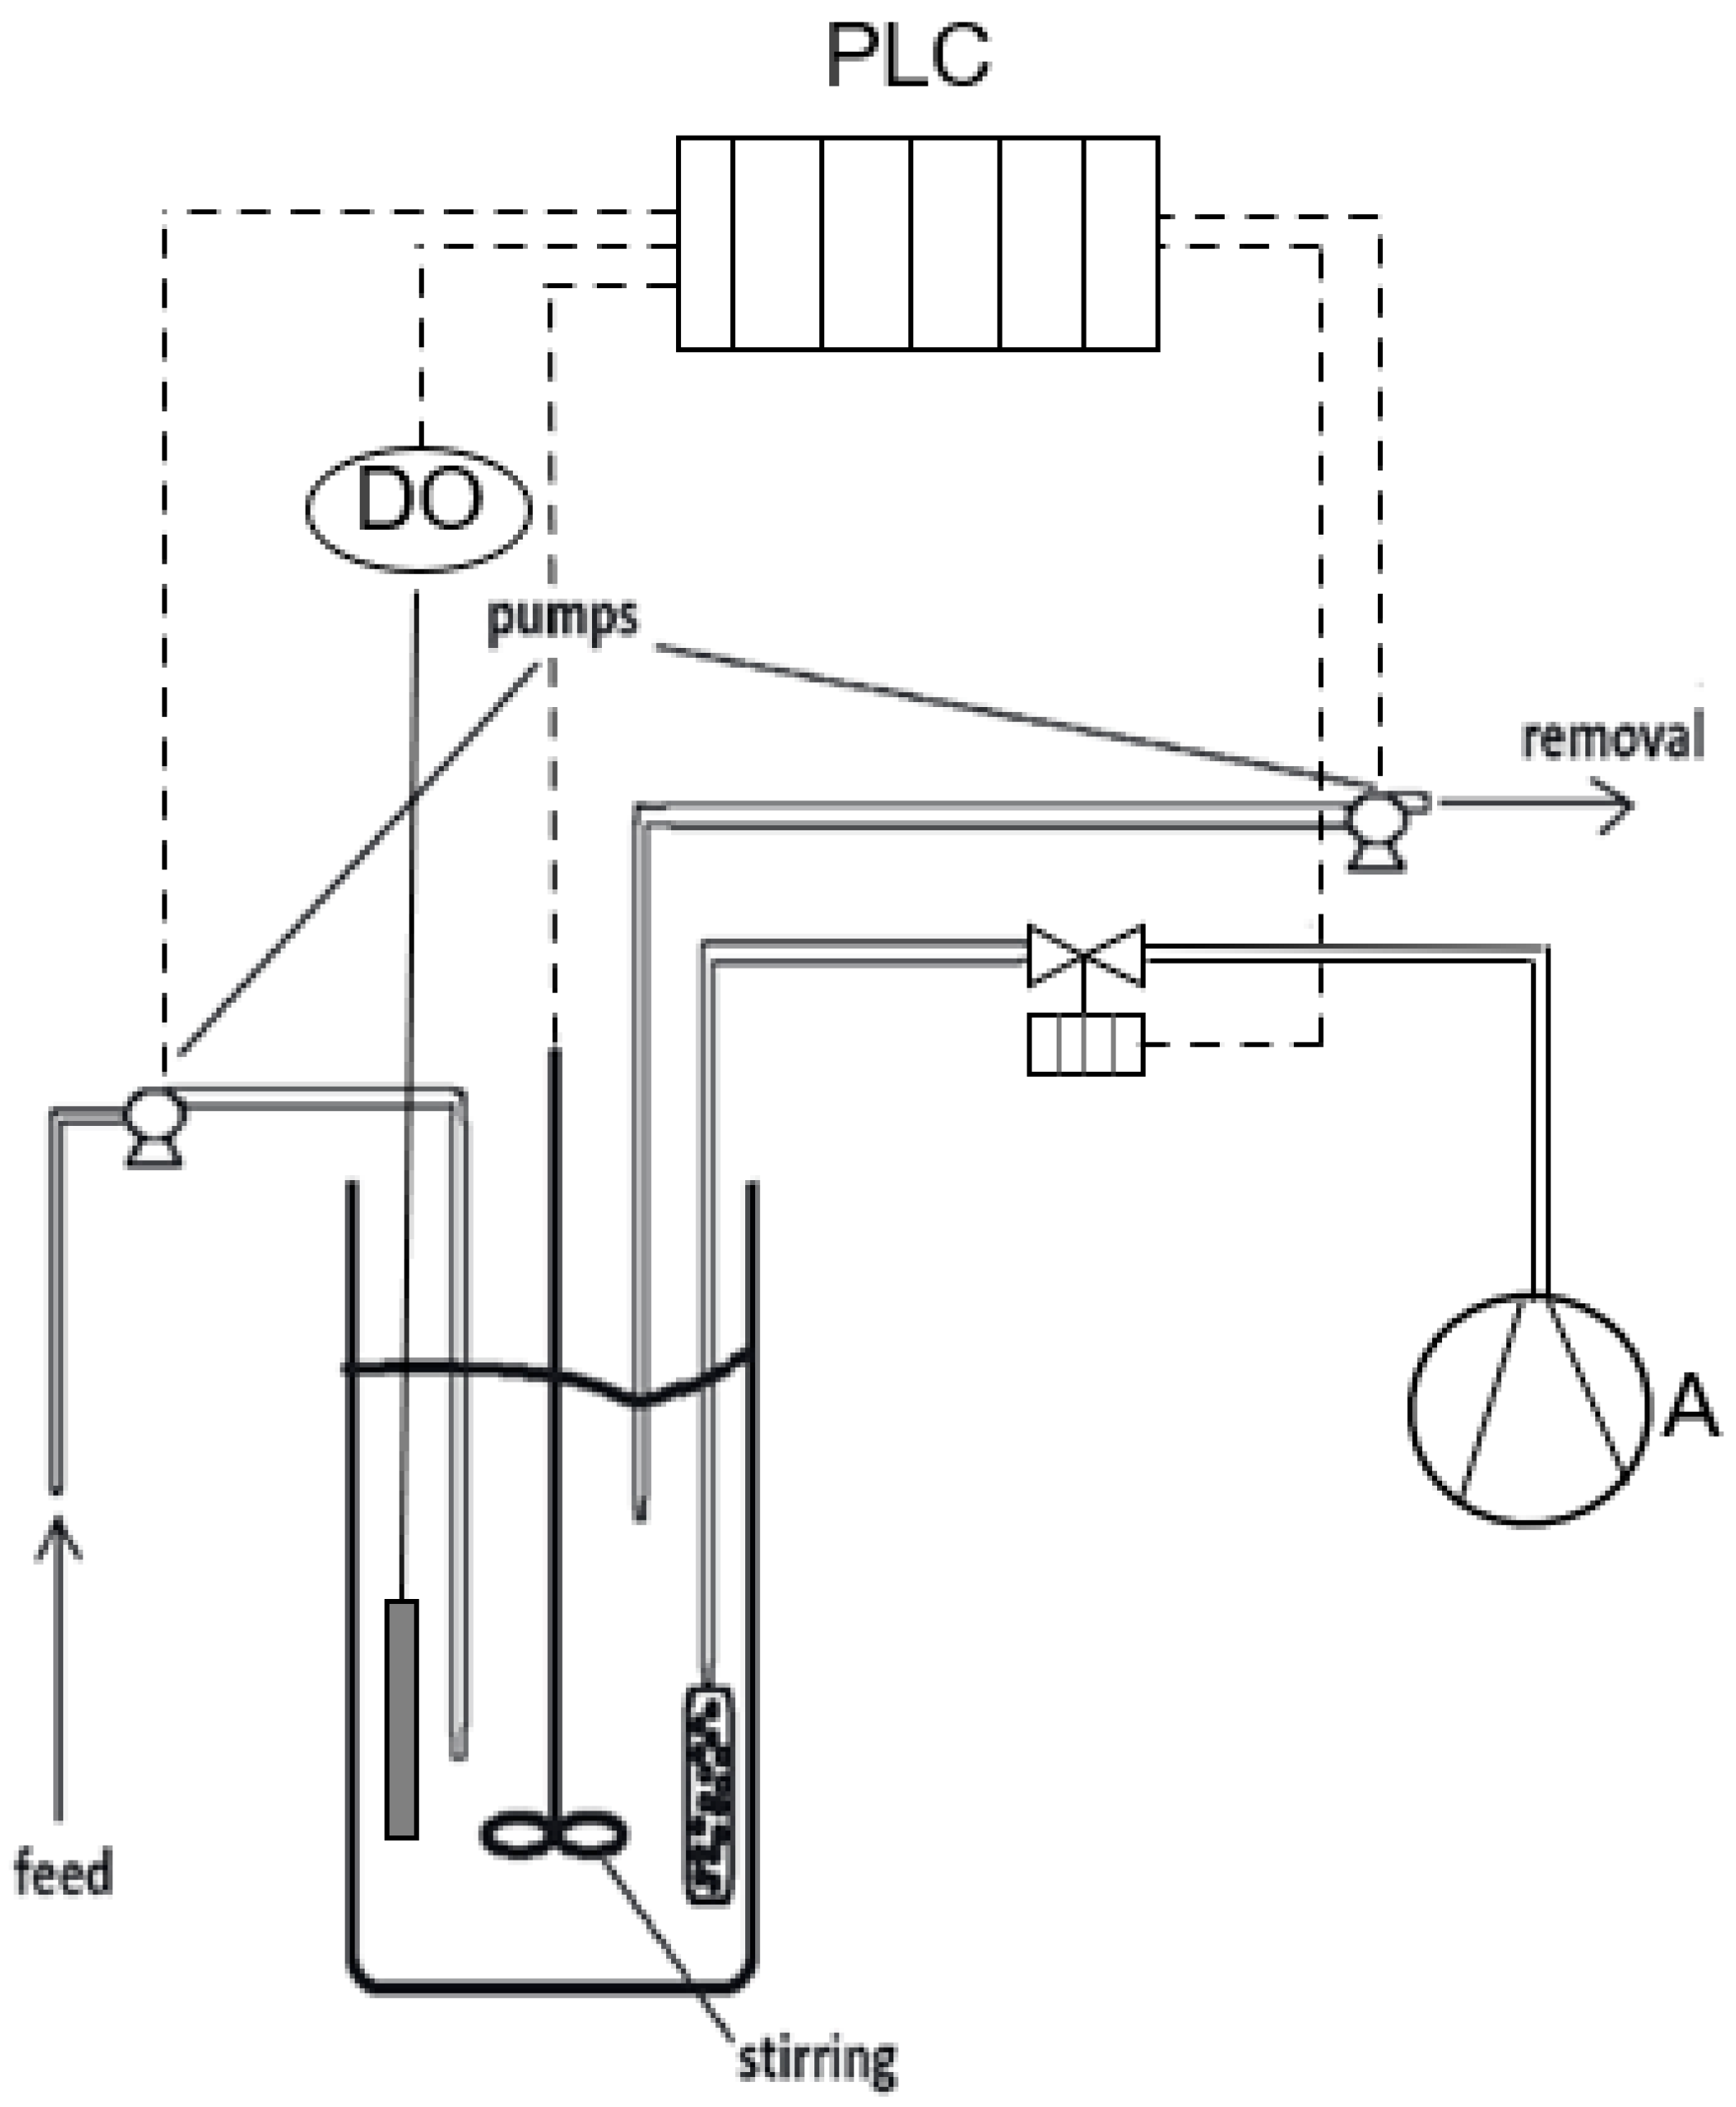
2.1. Moving Bed Biofilm Reactor set-up and operating conditions
2.2. Biofilm extraction method
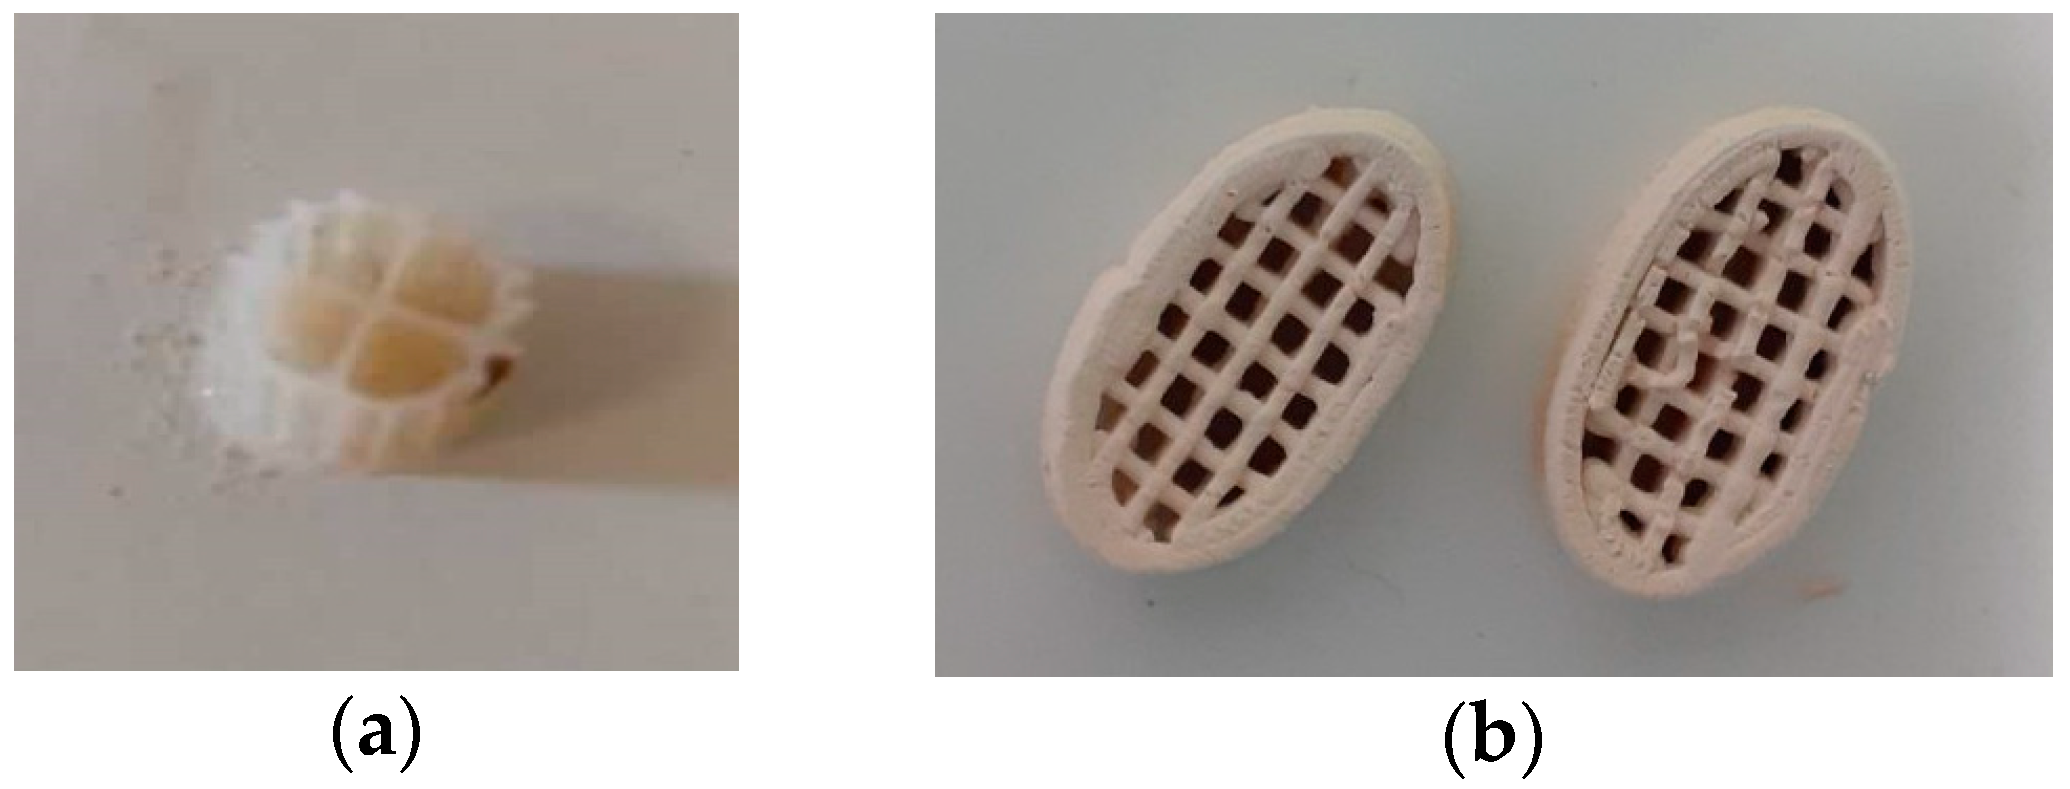
2.3. Printing methodology of the 3D-printed biocarriers with 13X and bentonite
| Material | Paste content | Zeolite/clay percentage | |
|---|---|---|---|
| Zeolite | 13X | 45% | 89% |
| Inorganic binder | Bentonite | 6% | 11% |
| Colloidal silica | Ludox AS-40 | 14% | |
| Water | 34% | ||
| Organic binder | Methyl cellulose | 1% |
2.4. Determination of the physicochemical parameters
2.5. DNA extraction and 16S rRNA gene amplicon sequencing
2.2. Bioinformatics
3. Results
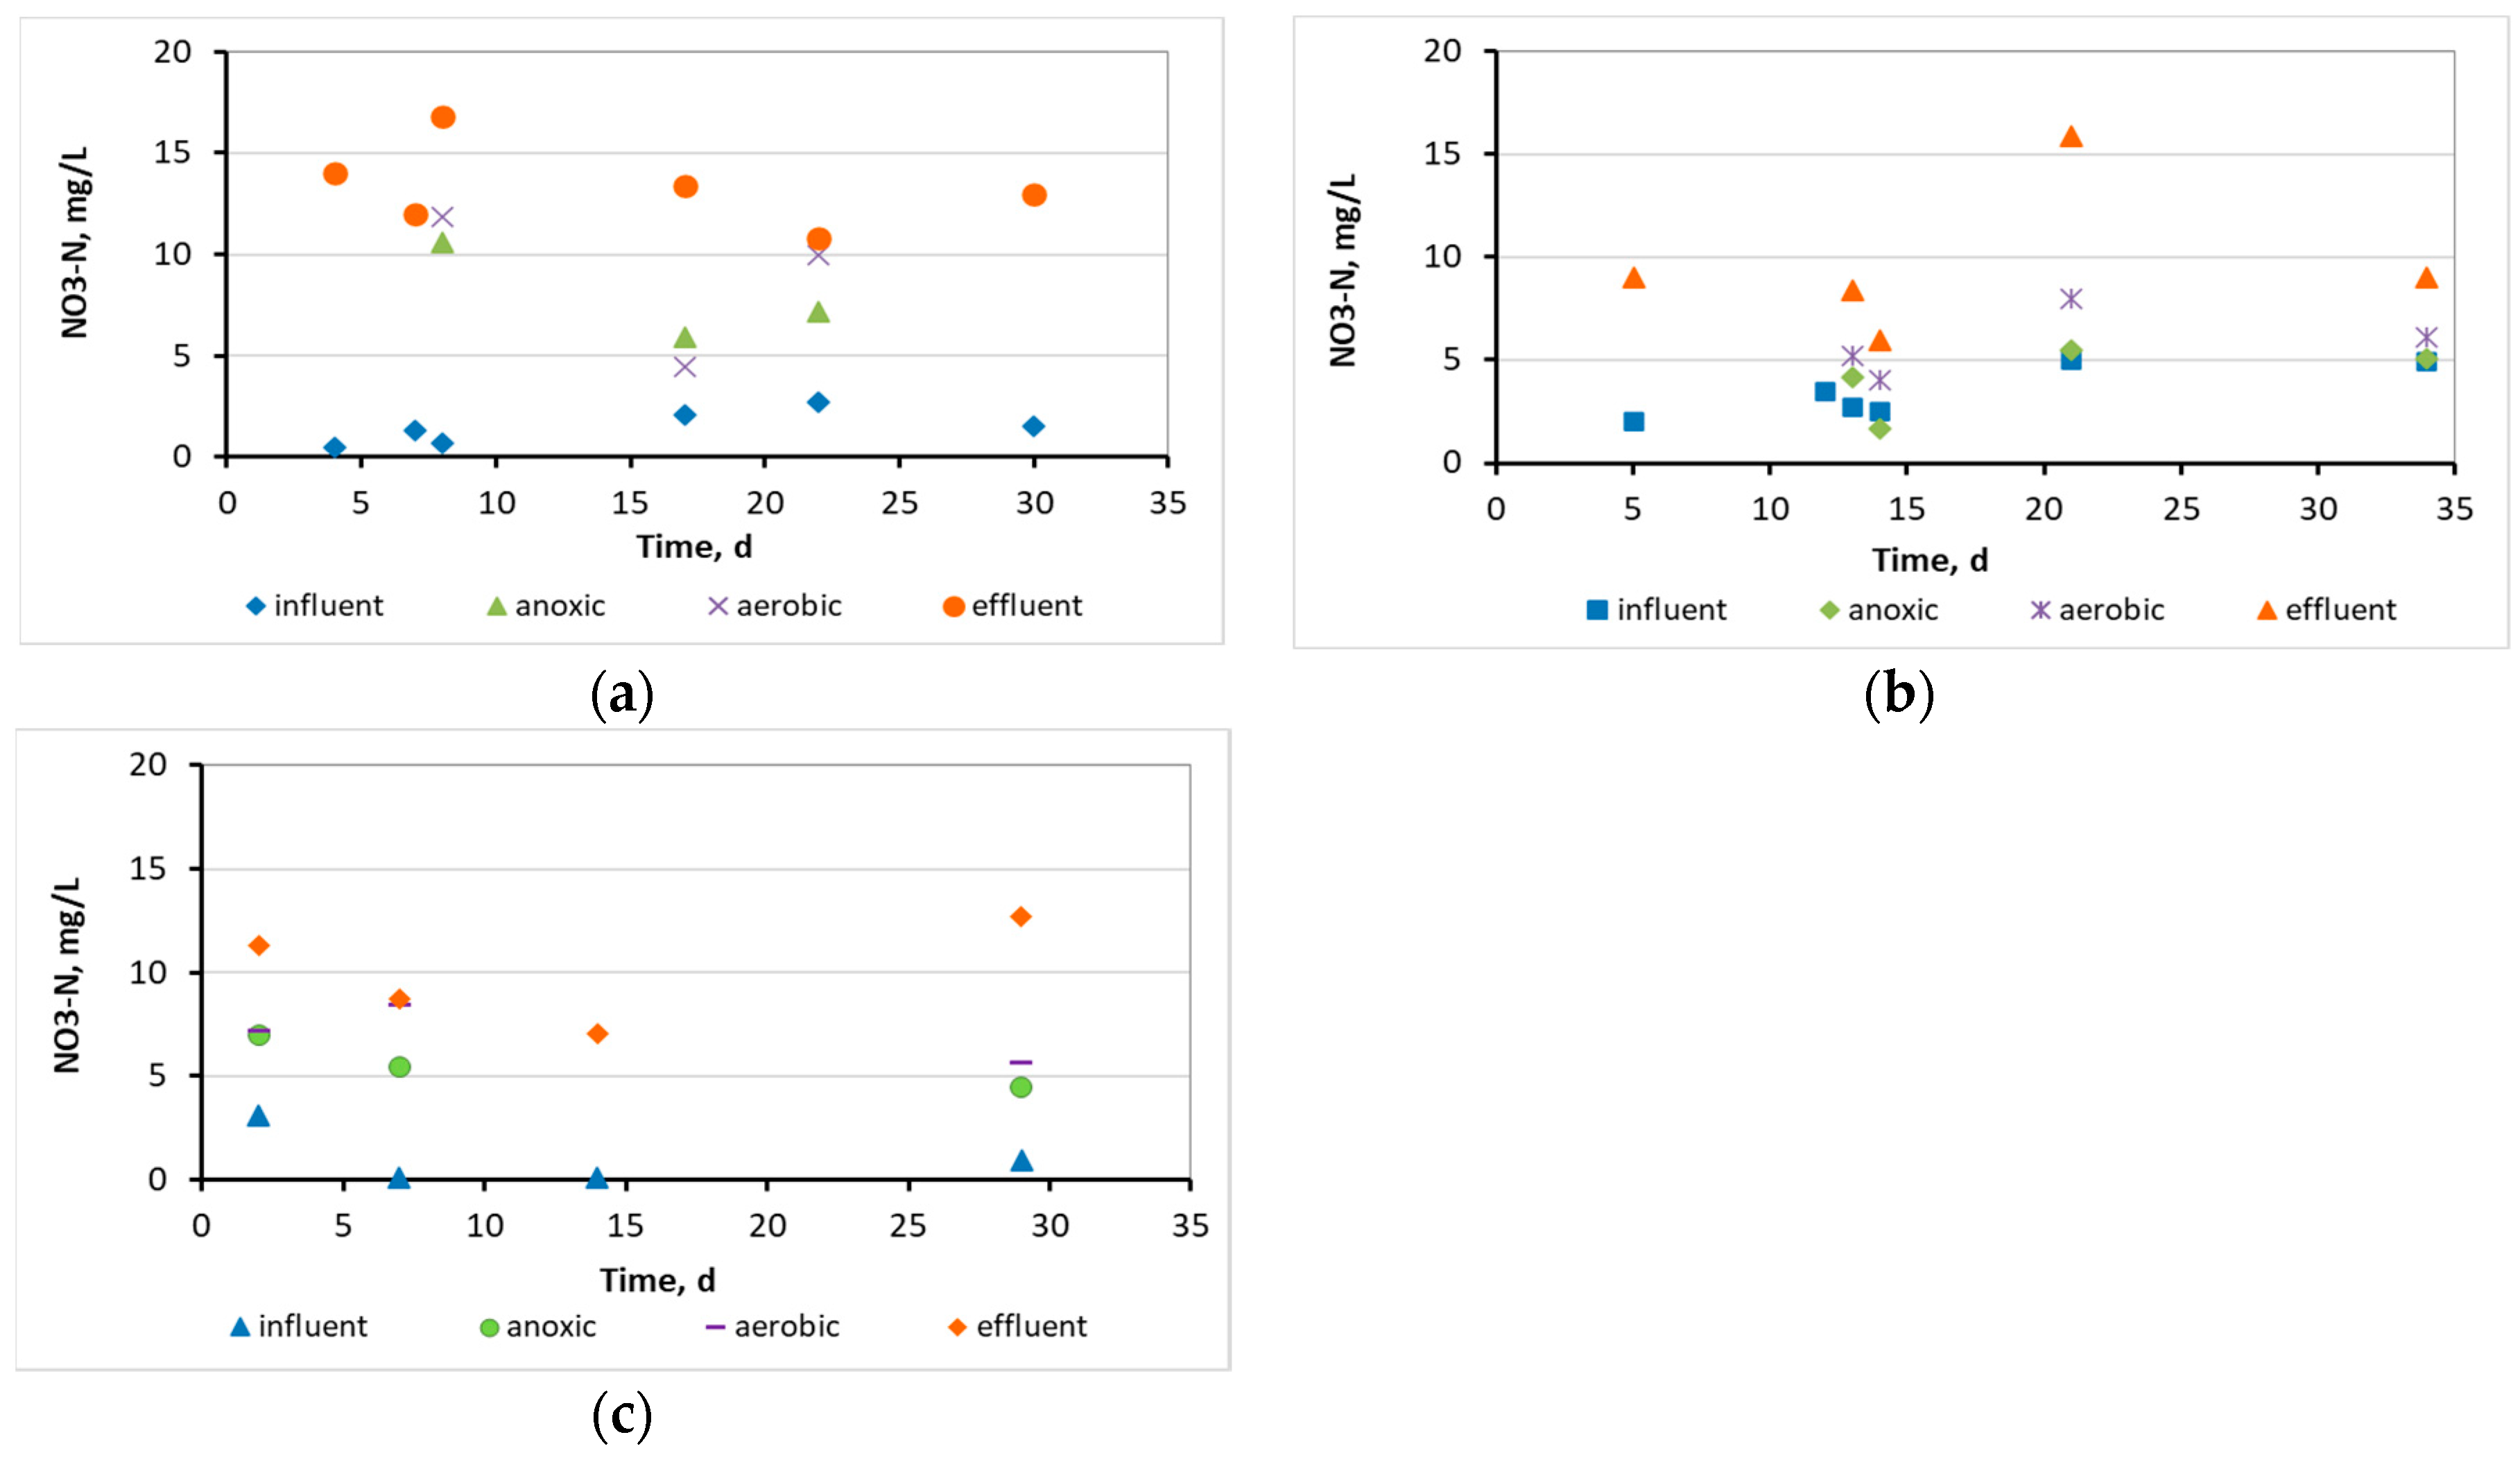
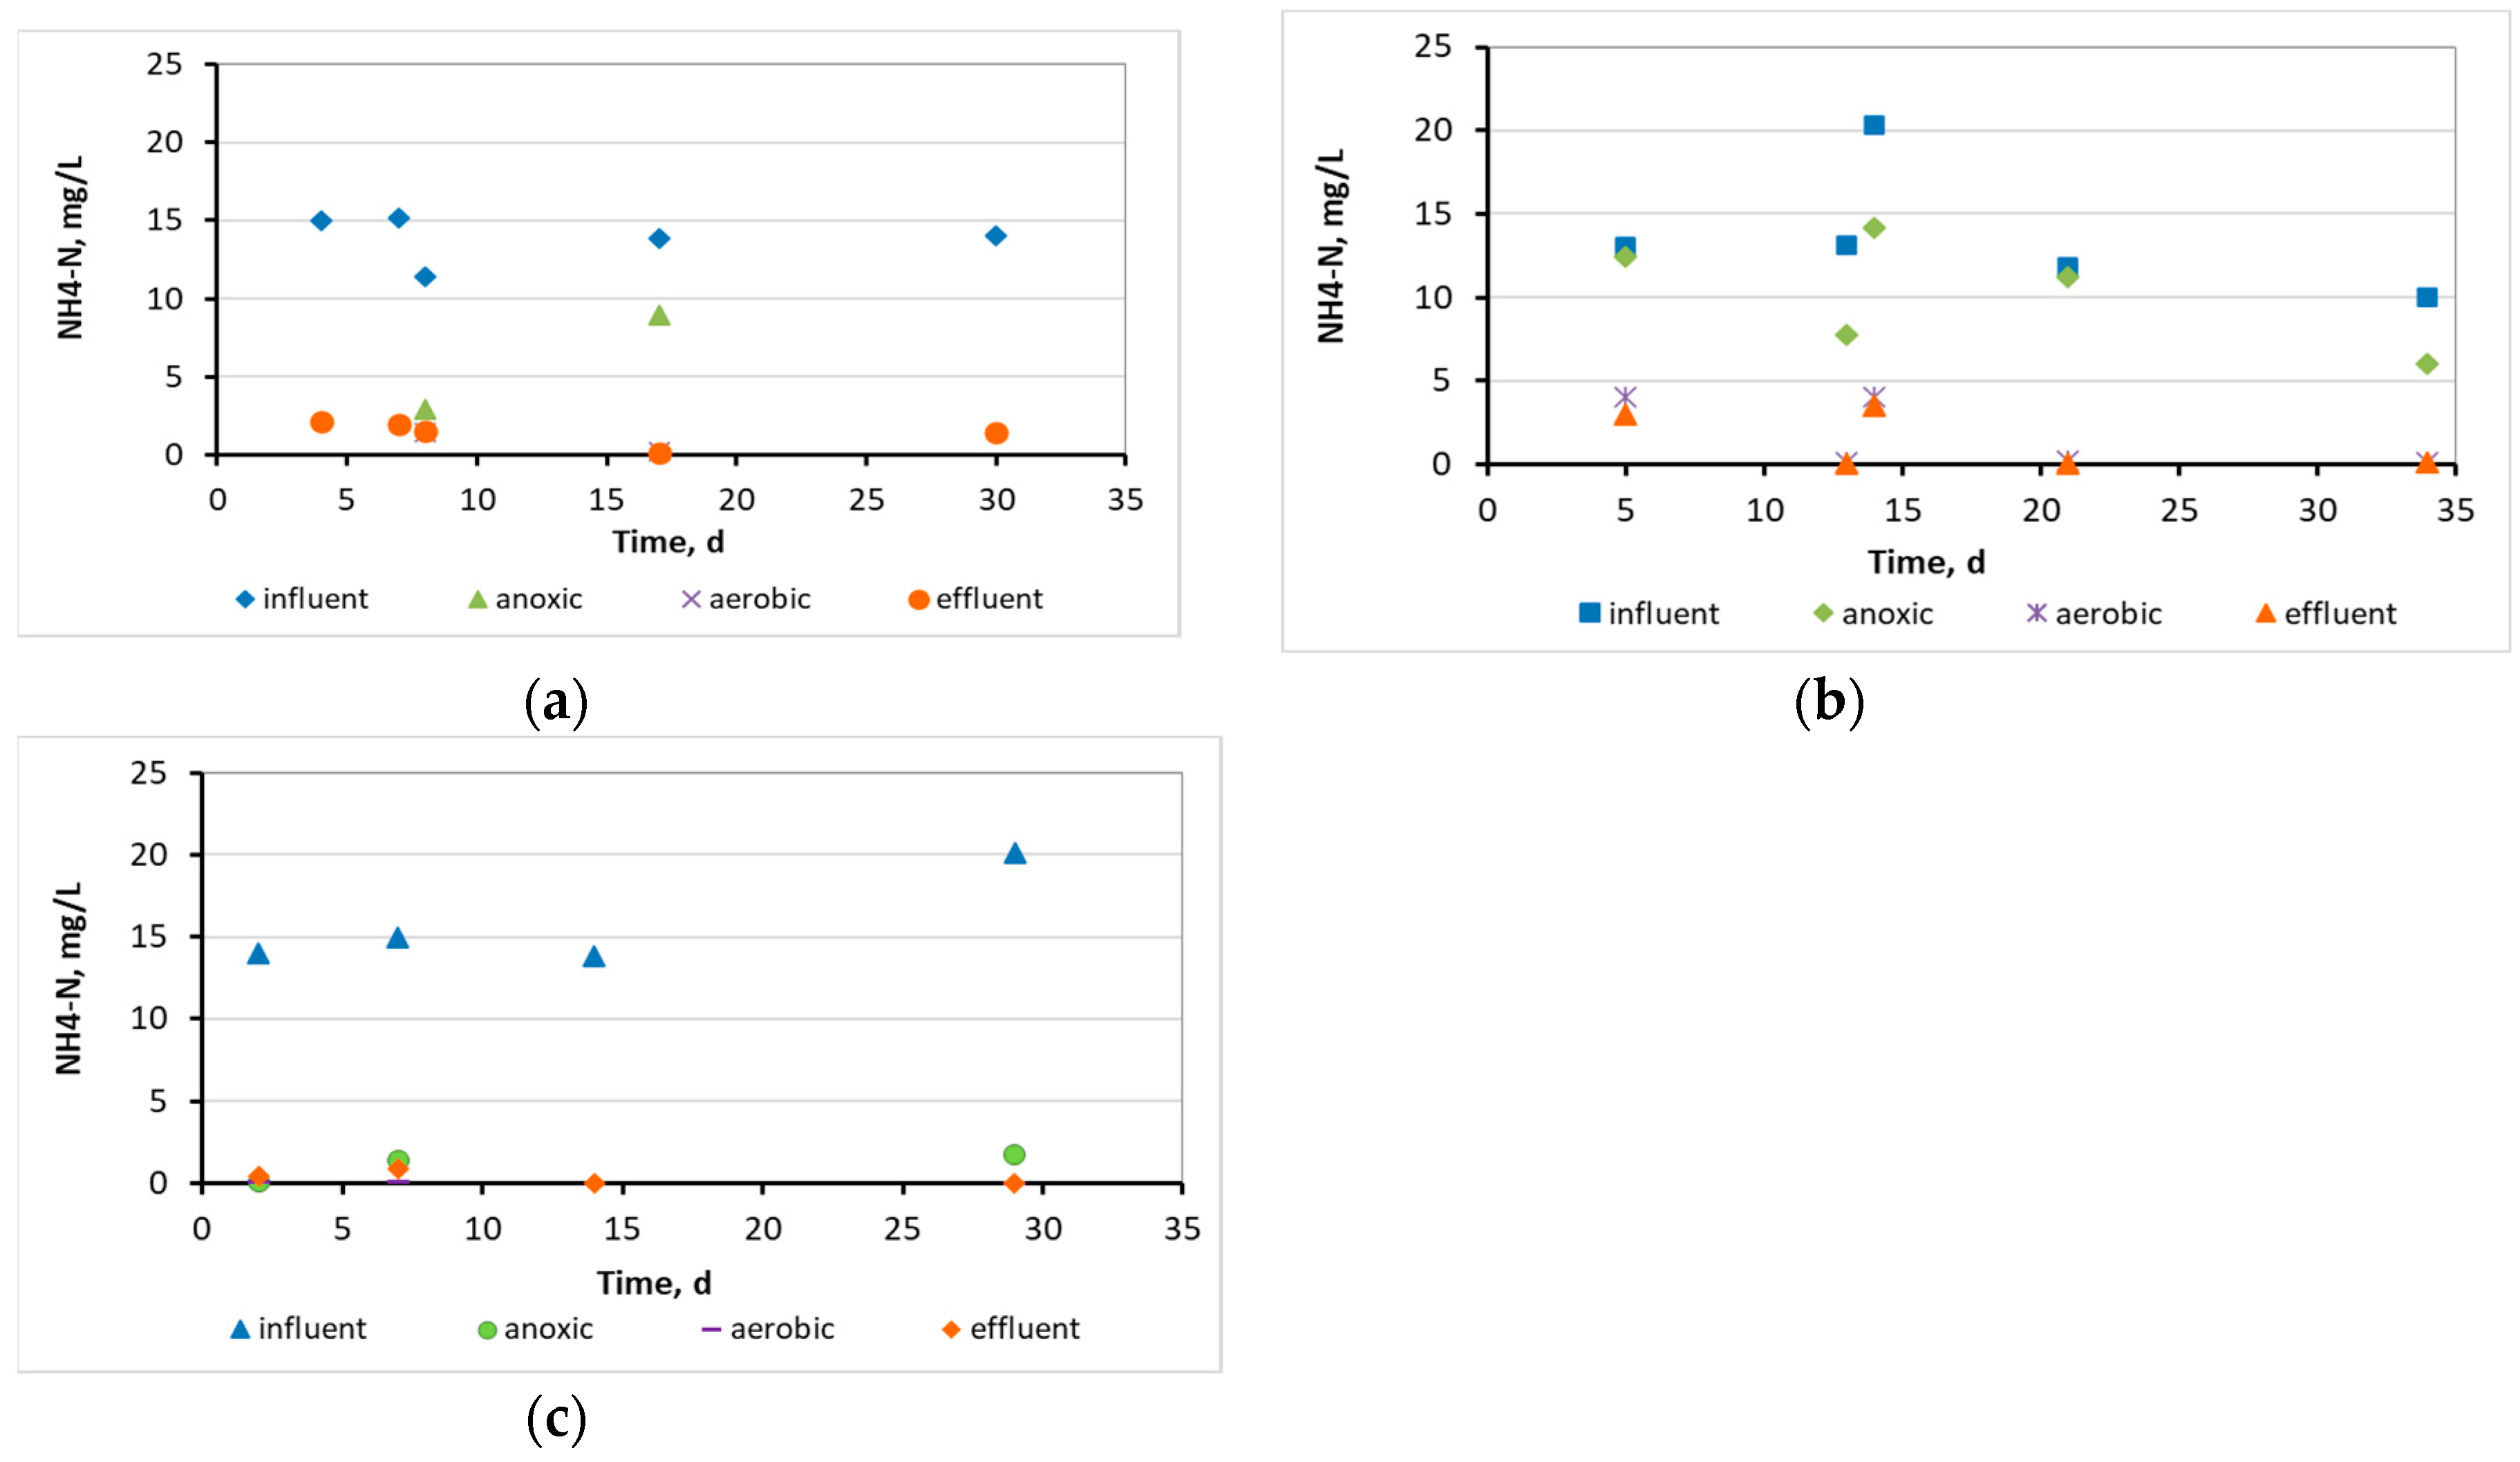
3.1. Wastewater treatment efficiency and physicochemical parameters at the 3 MBBRs

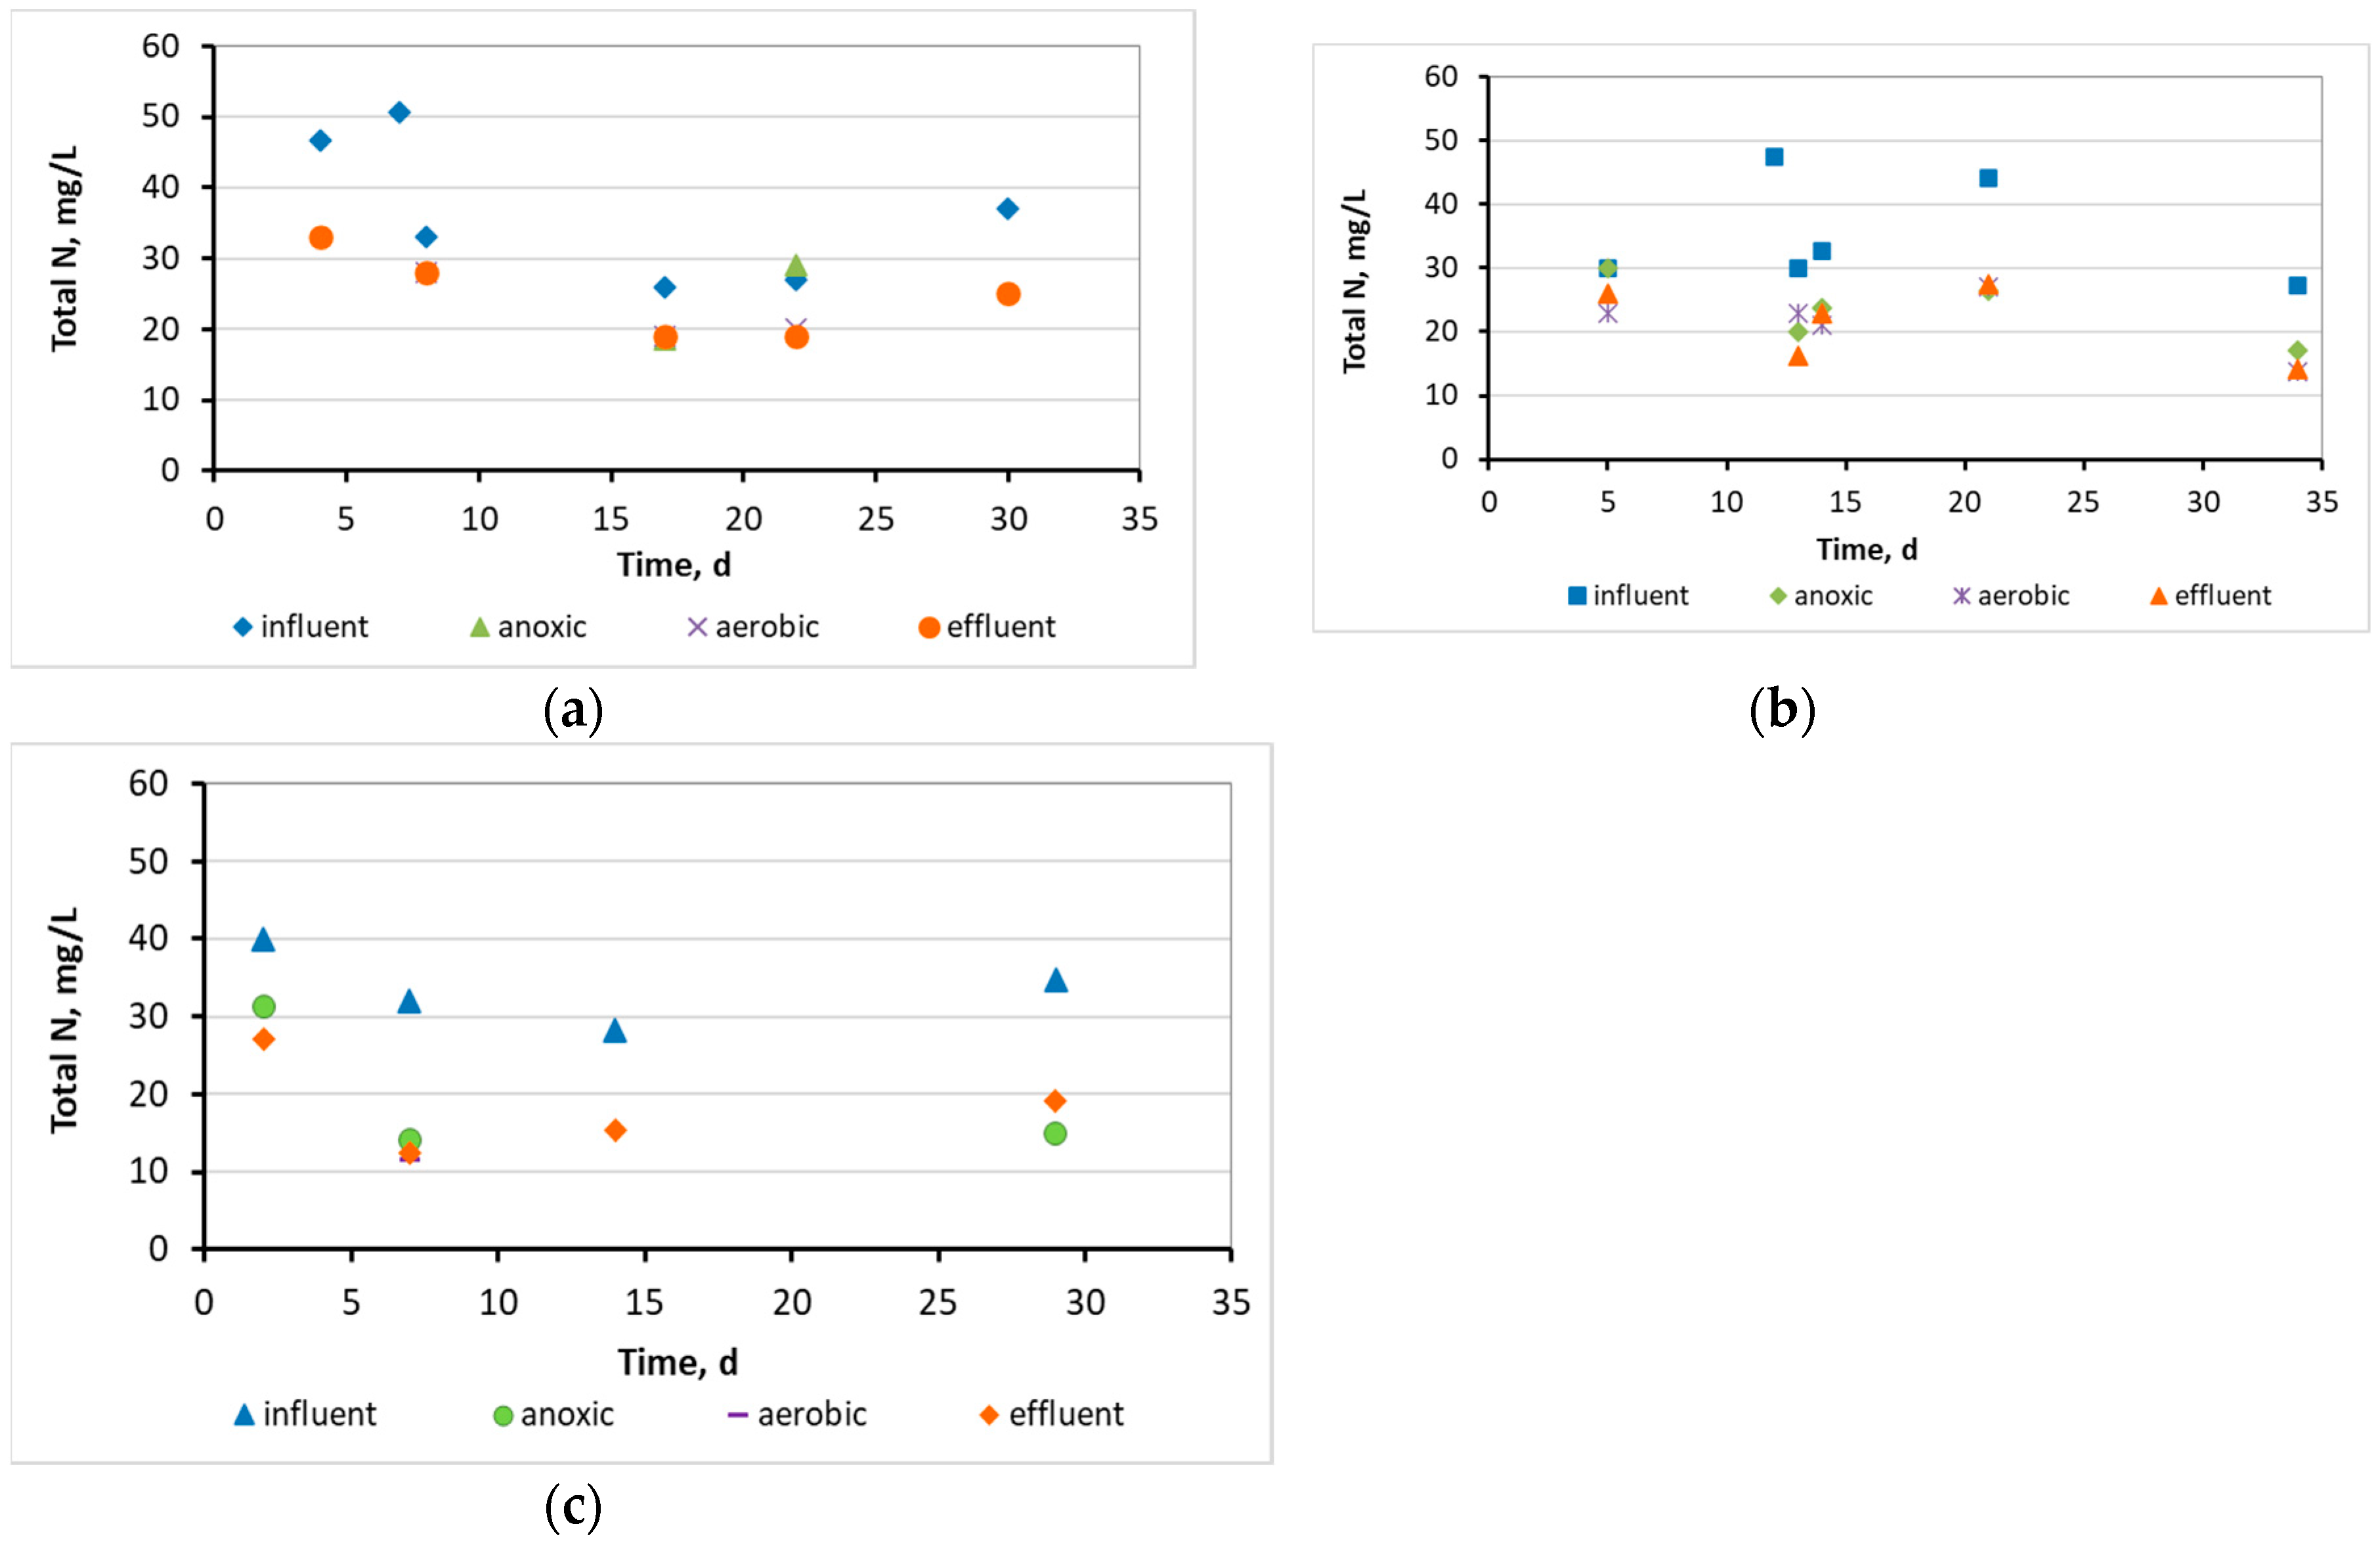
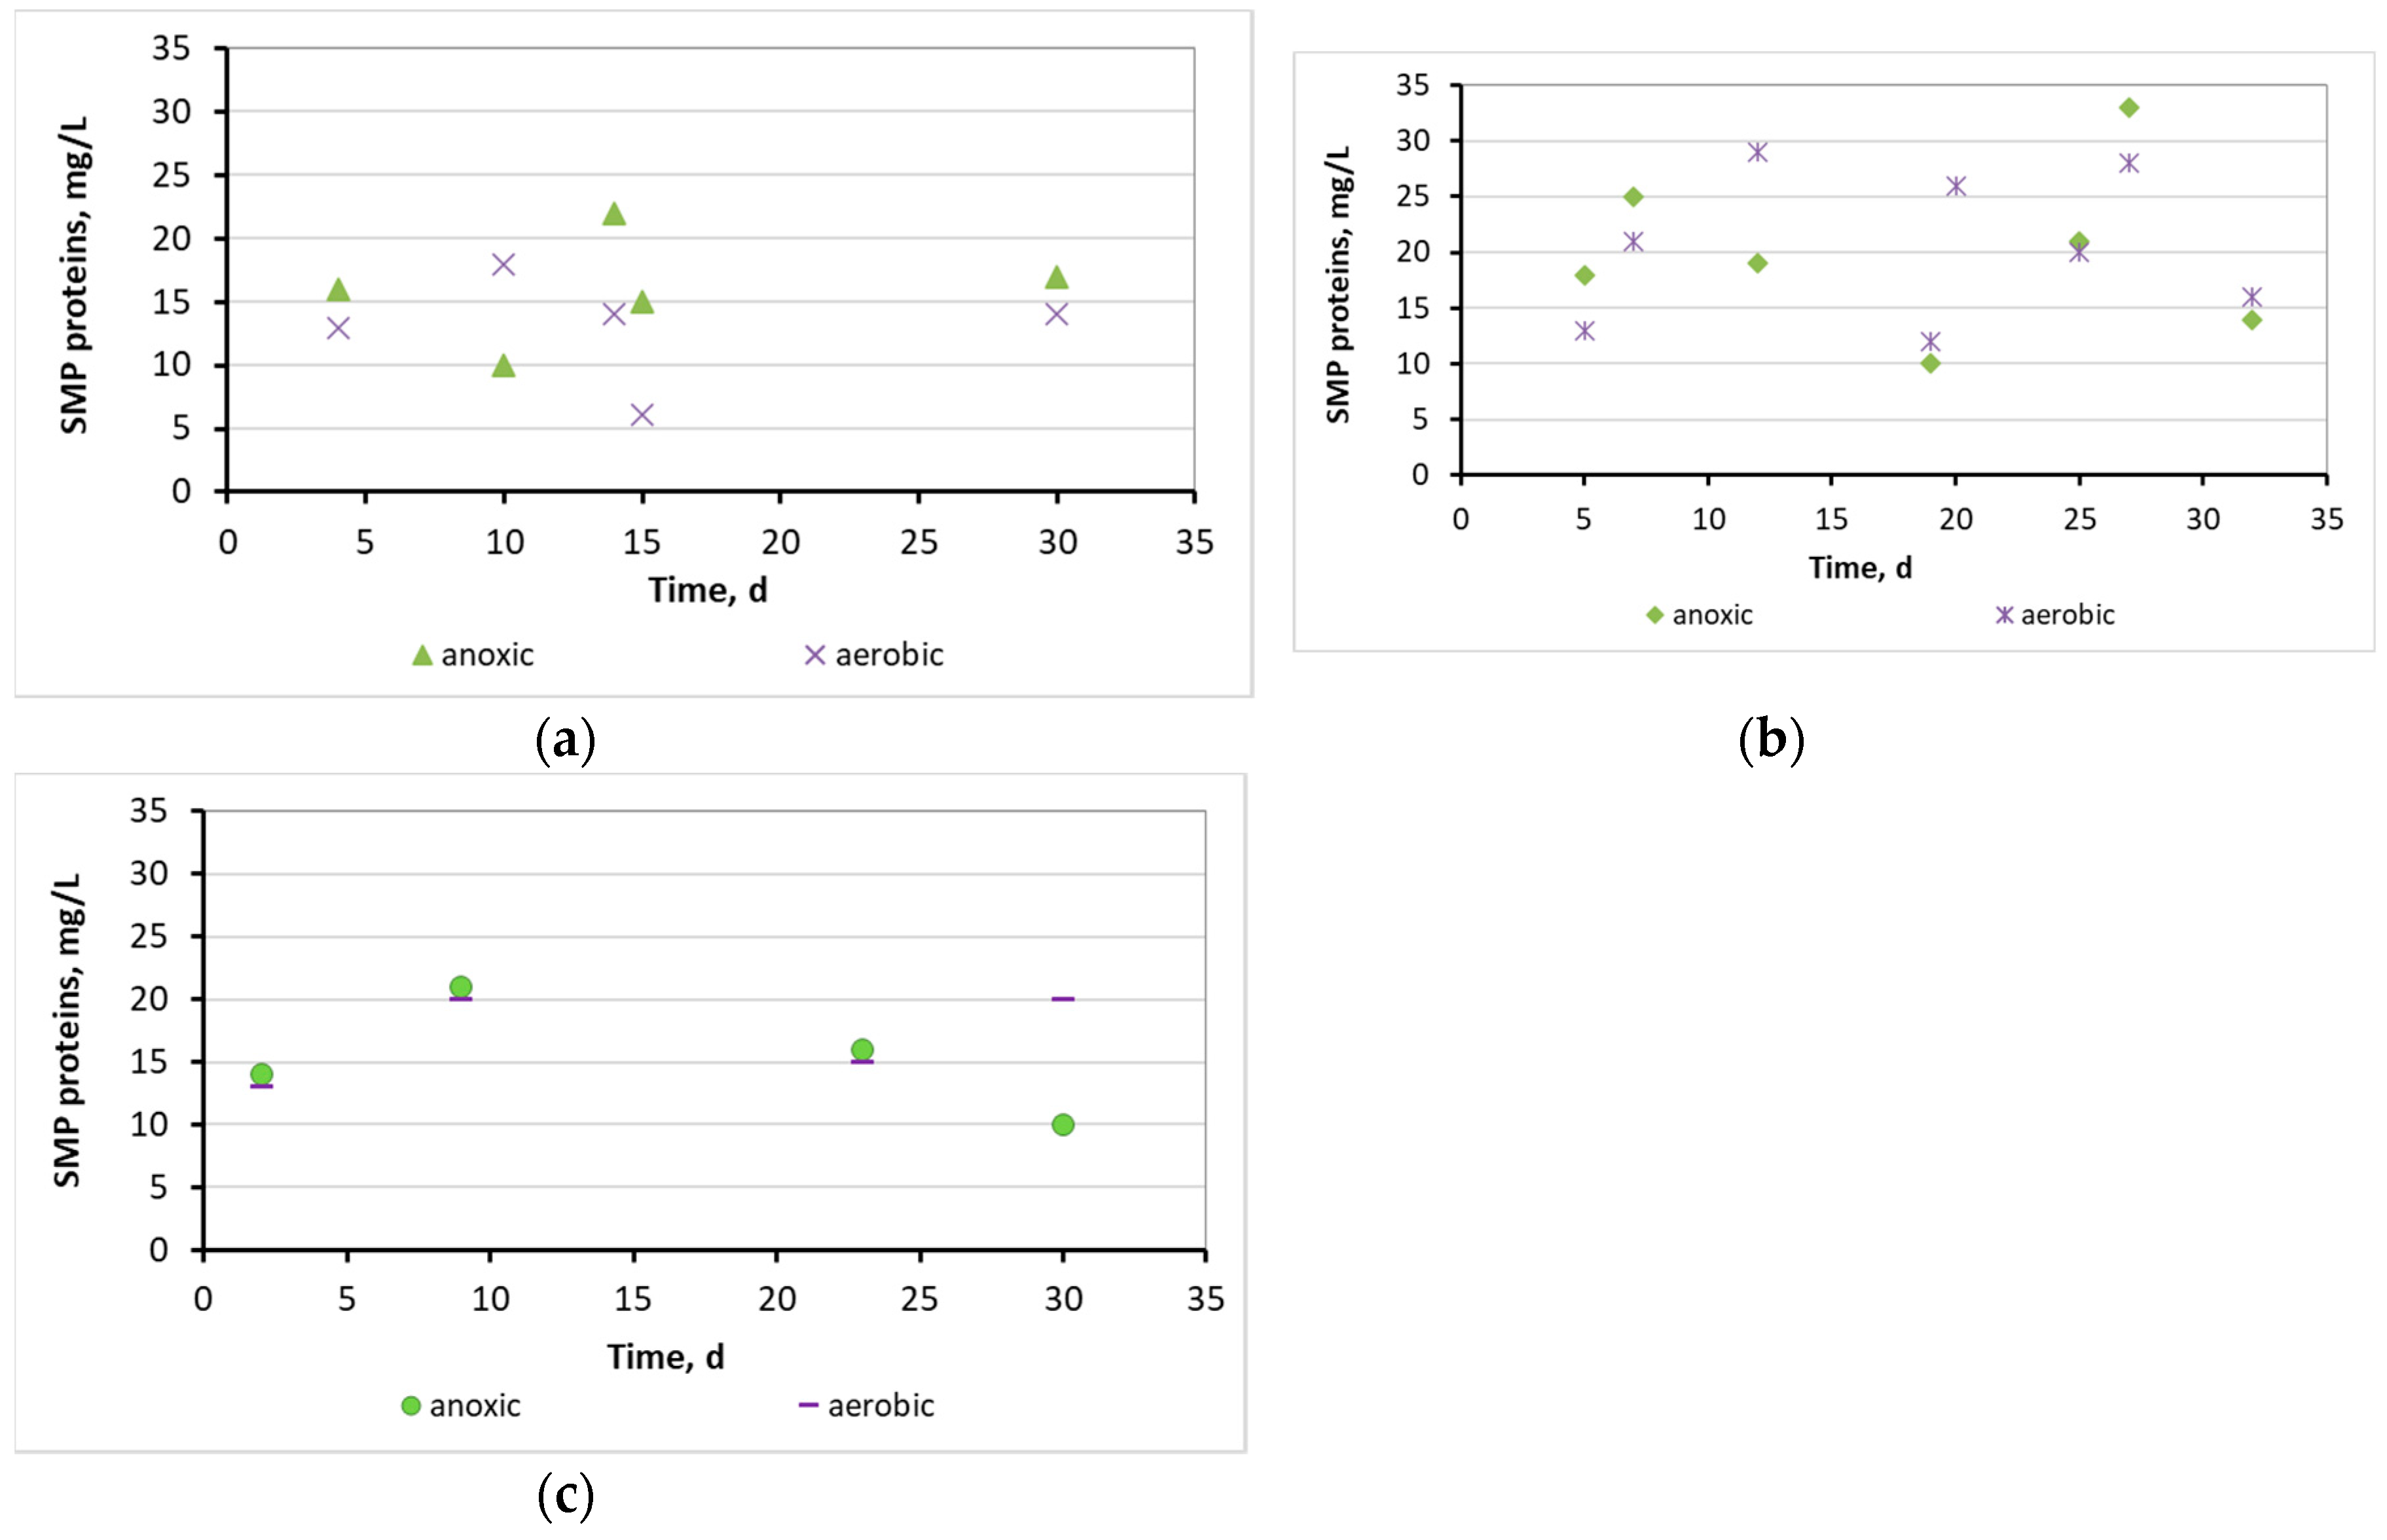
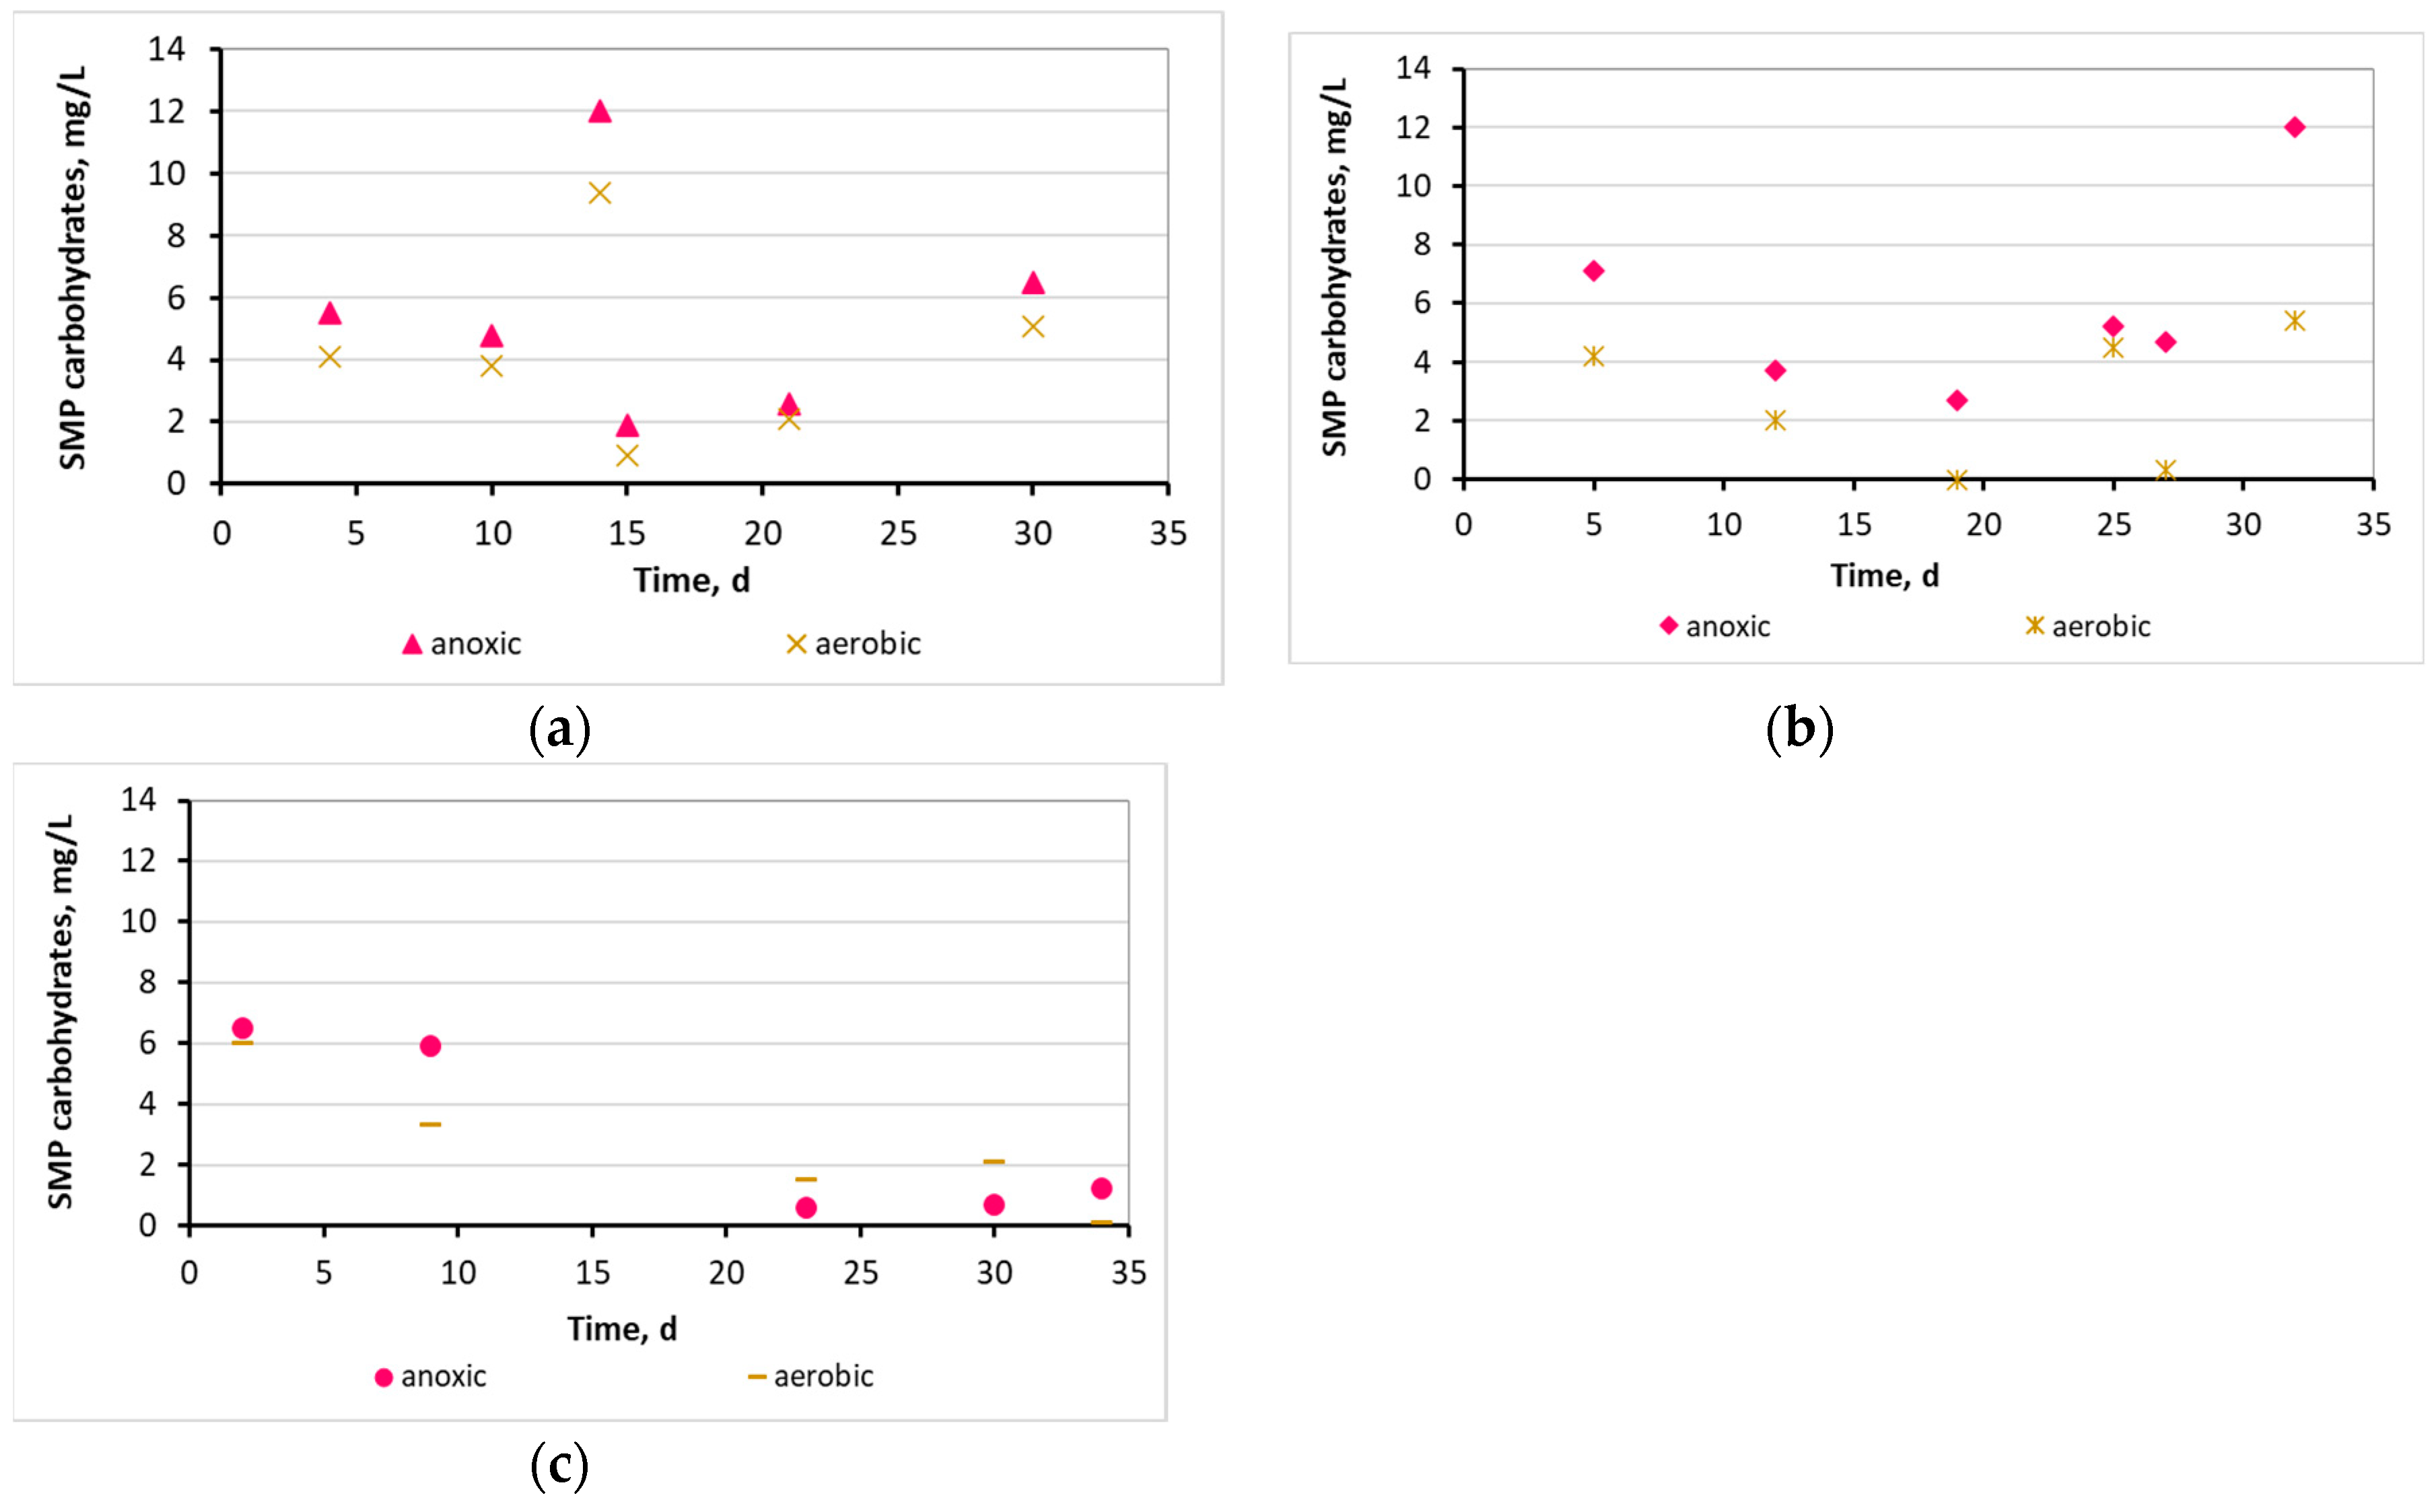
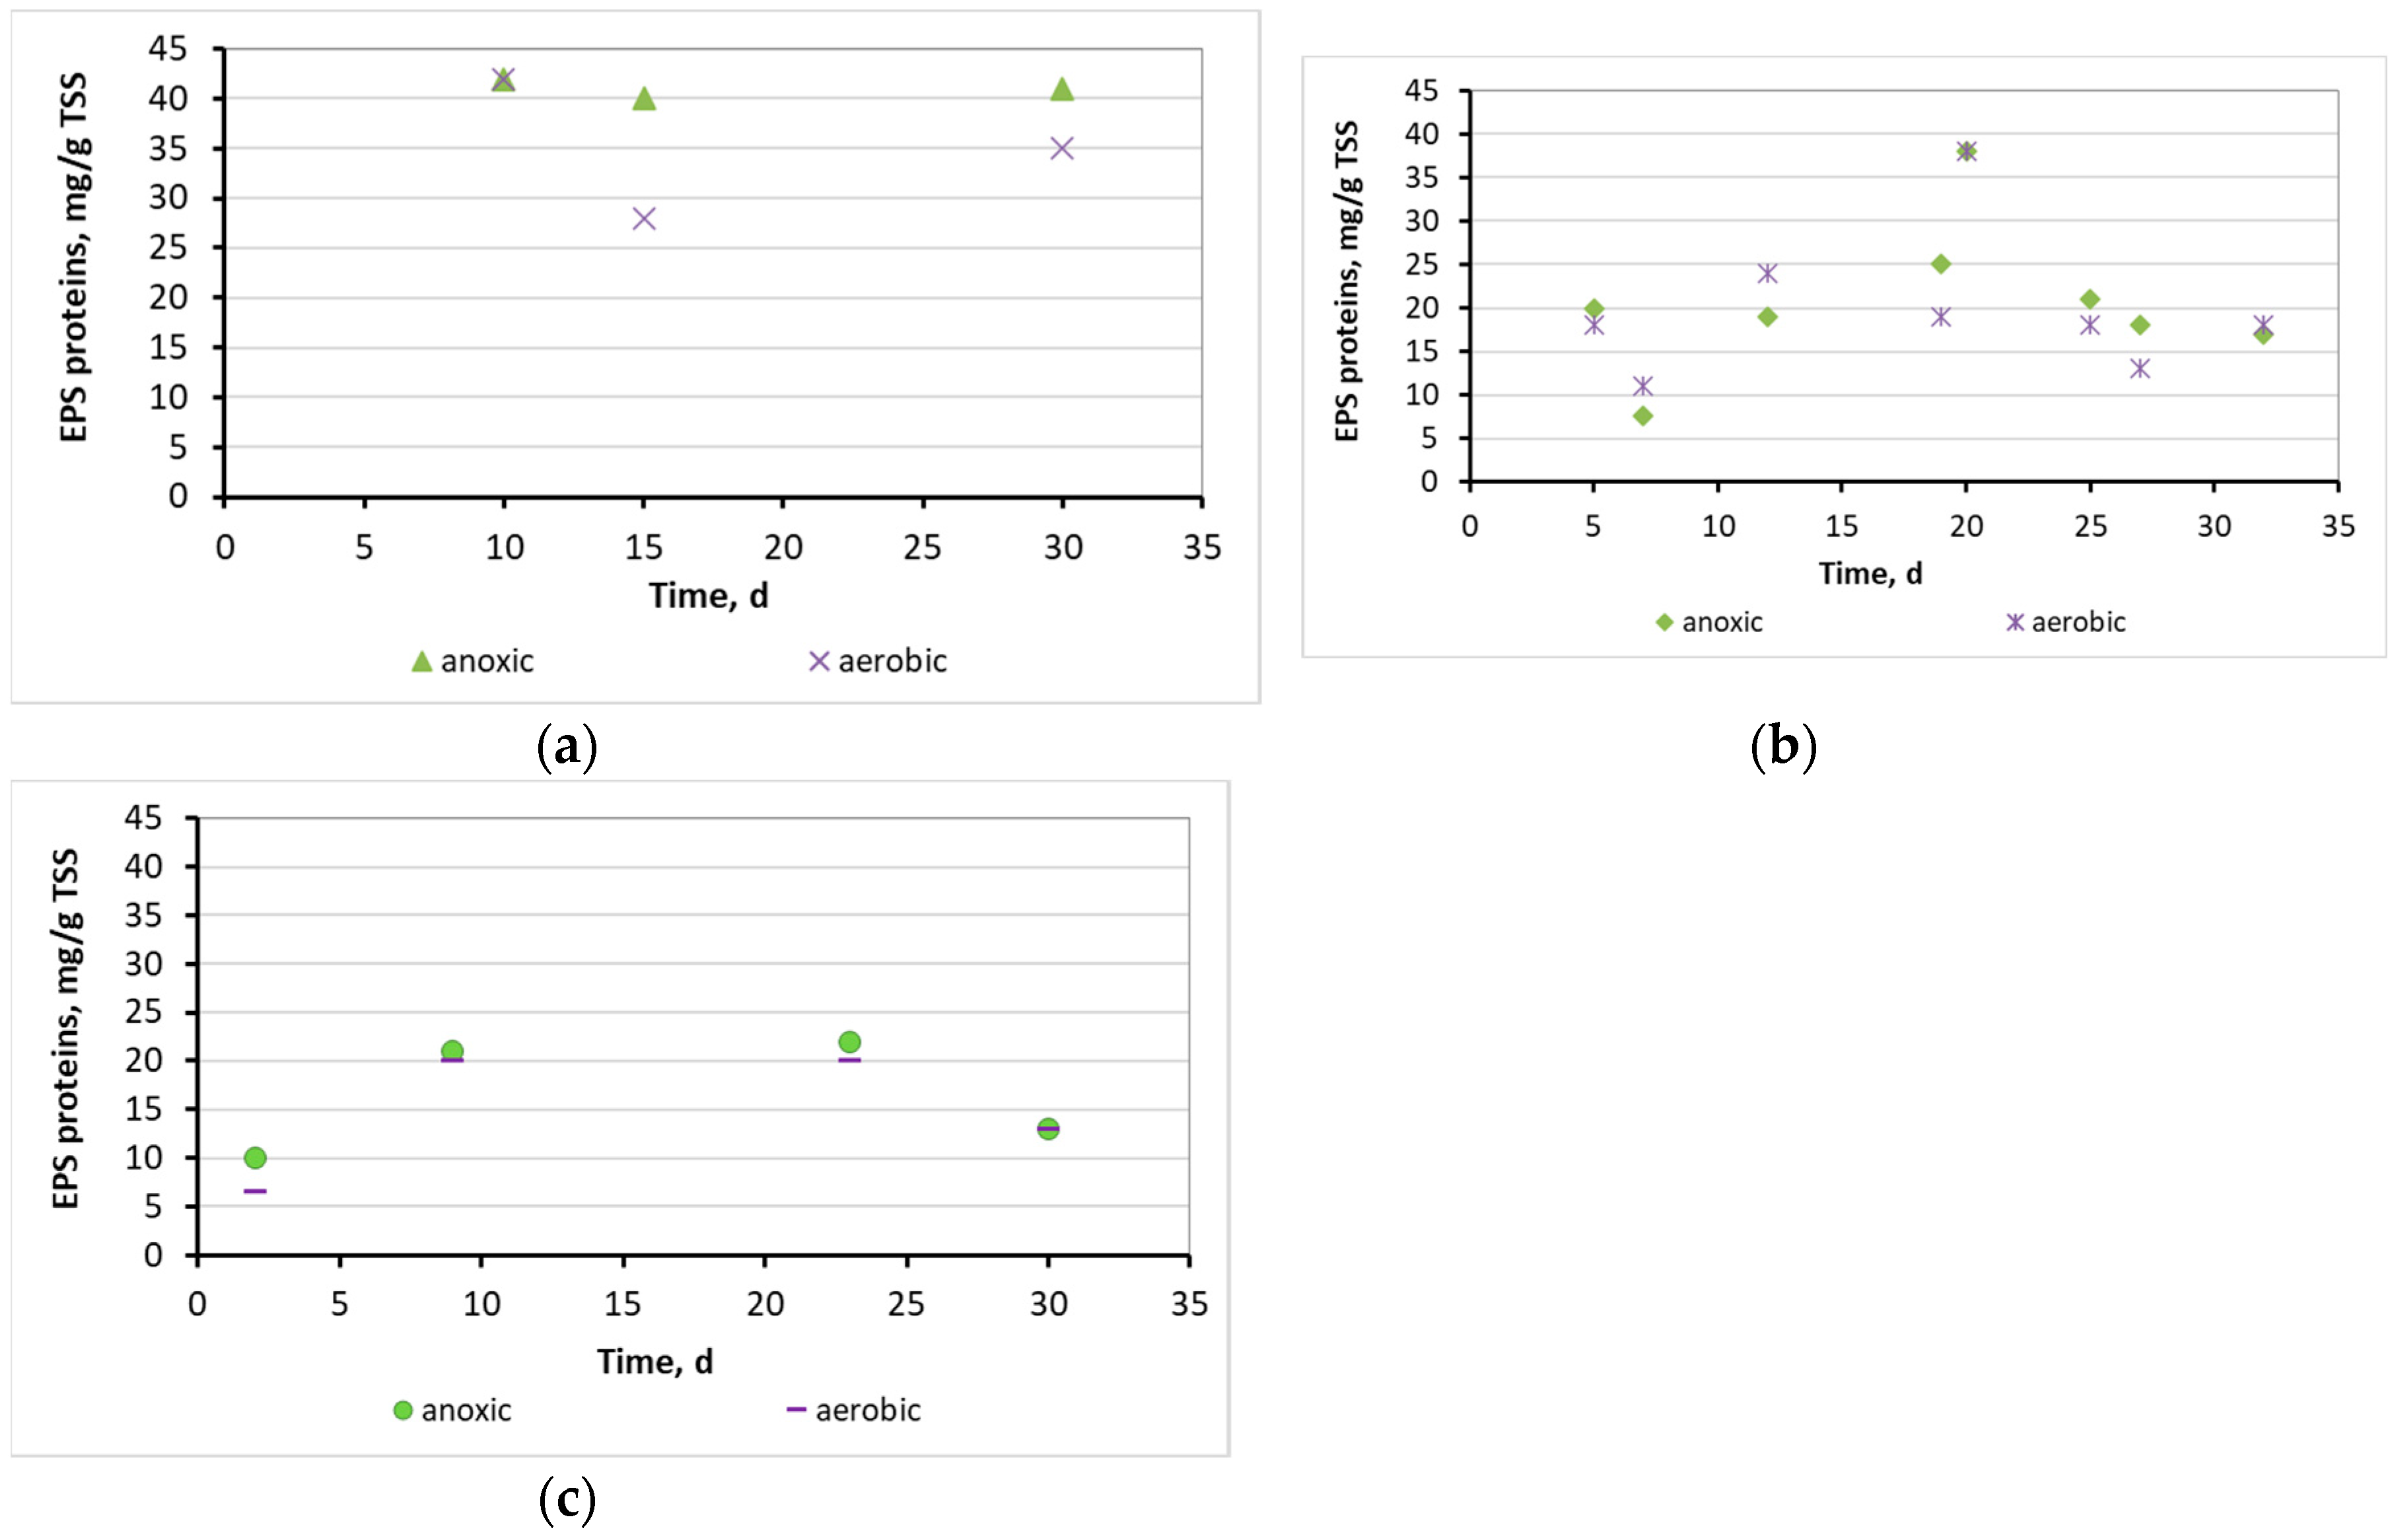
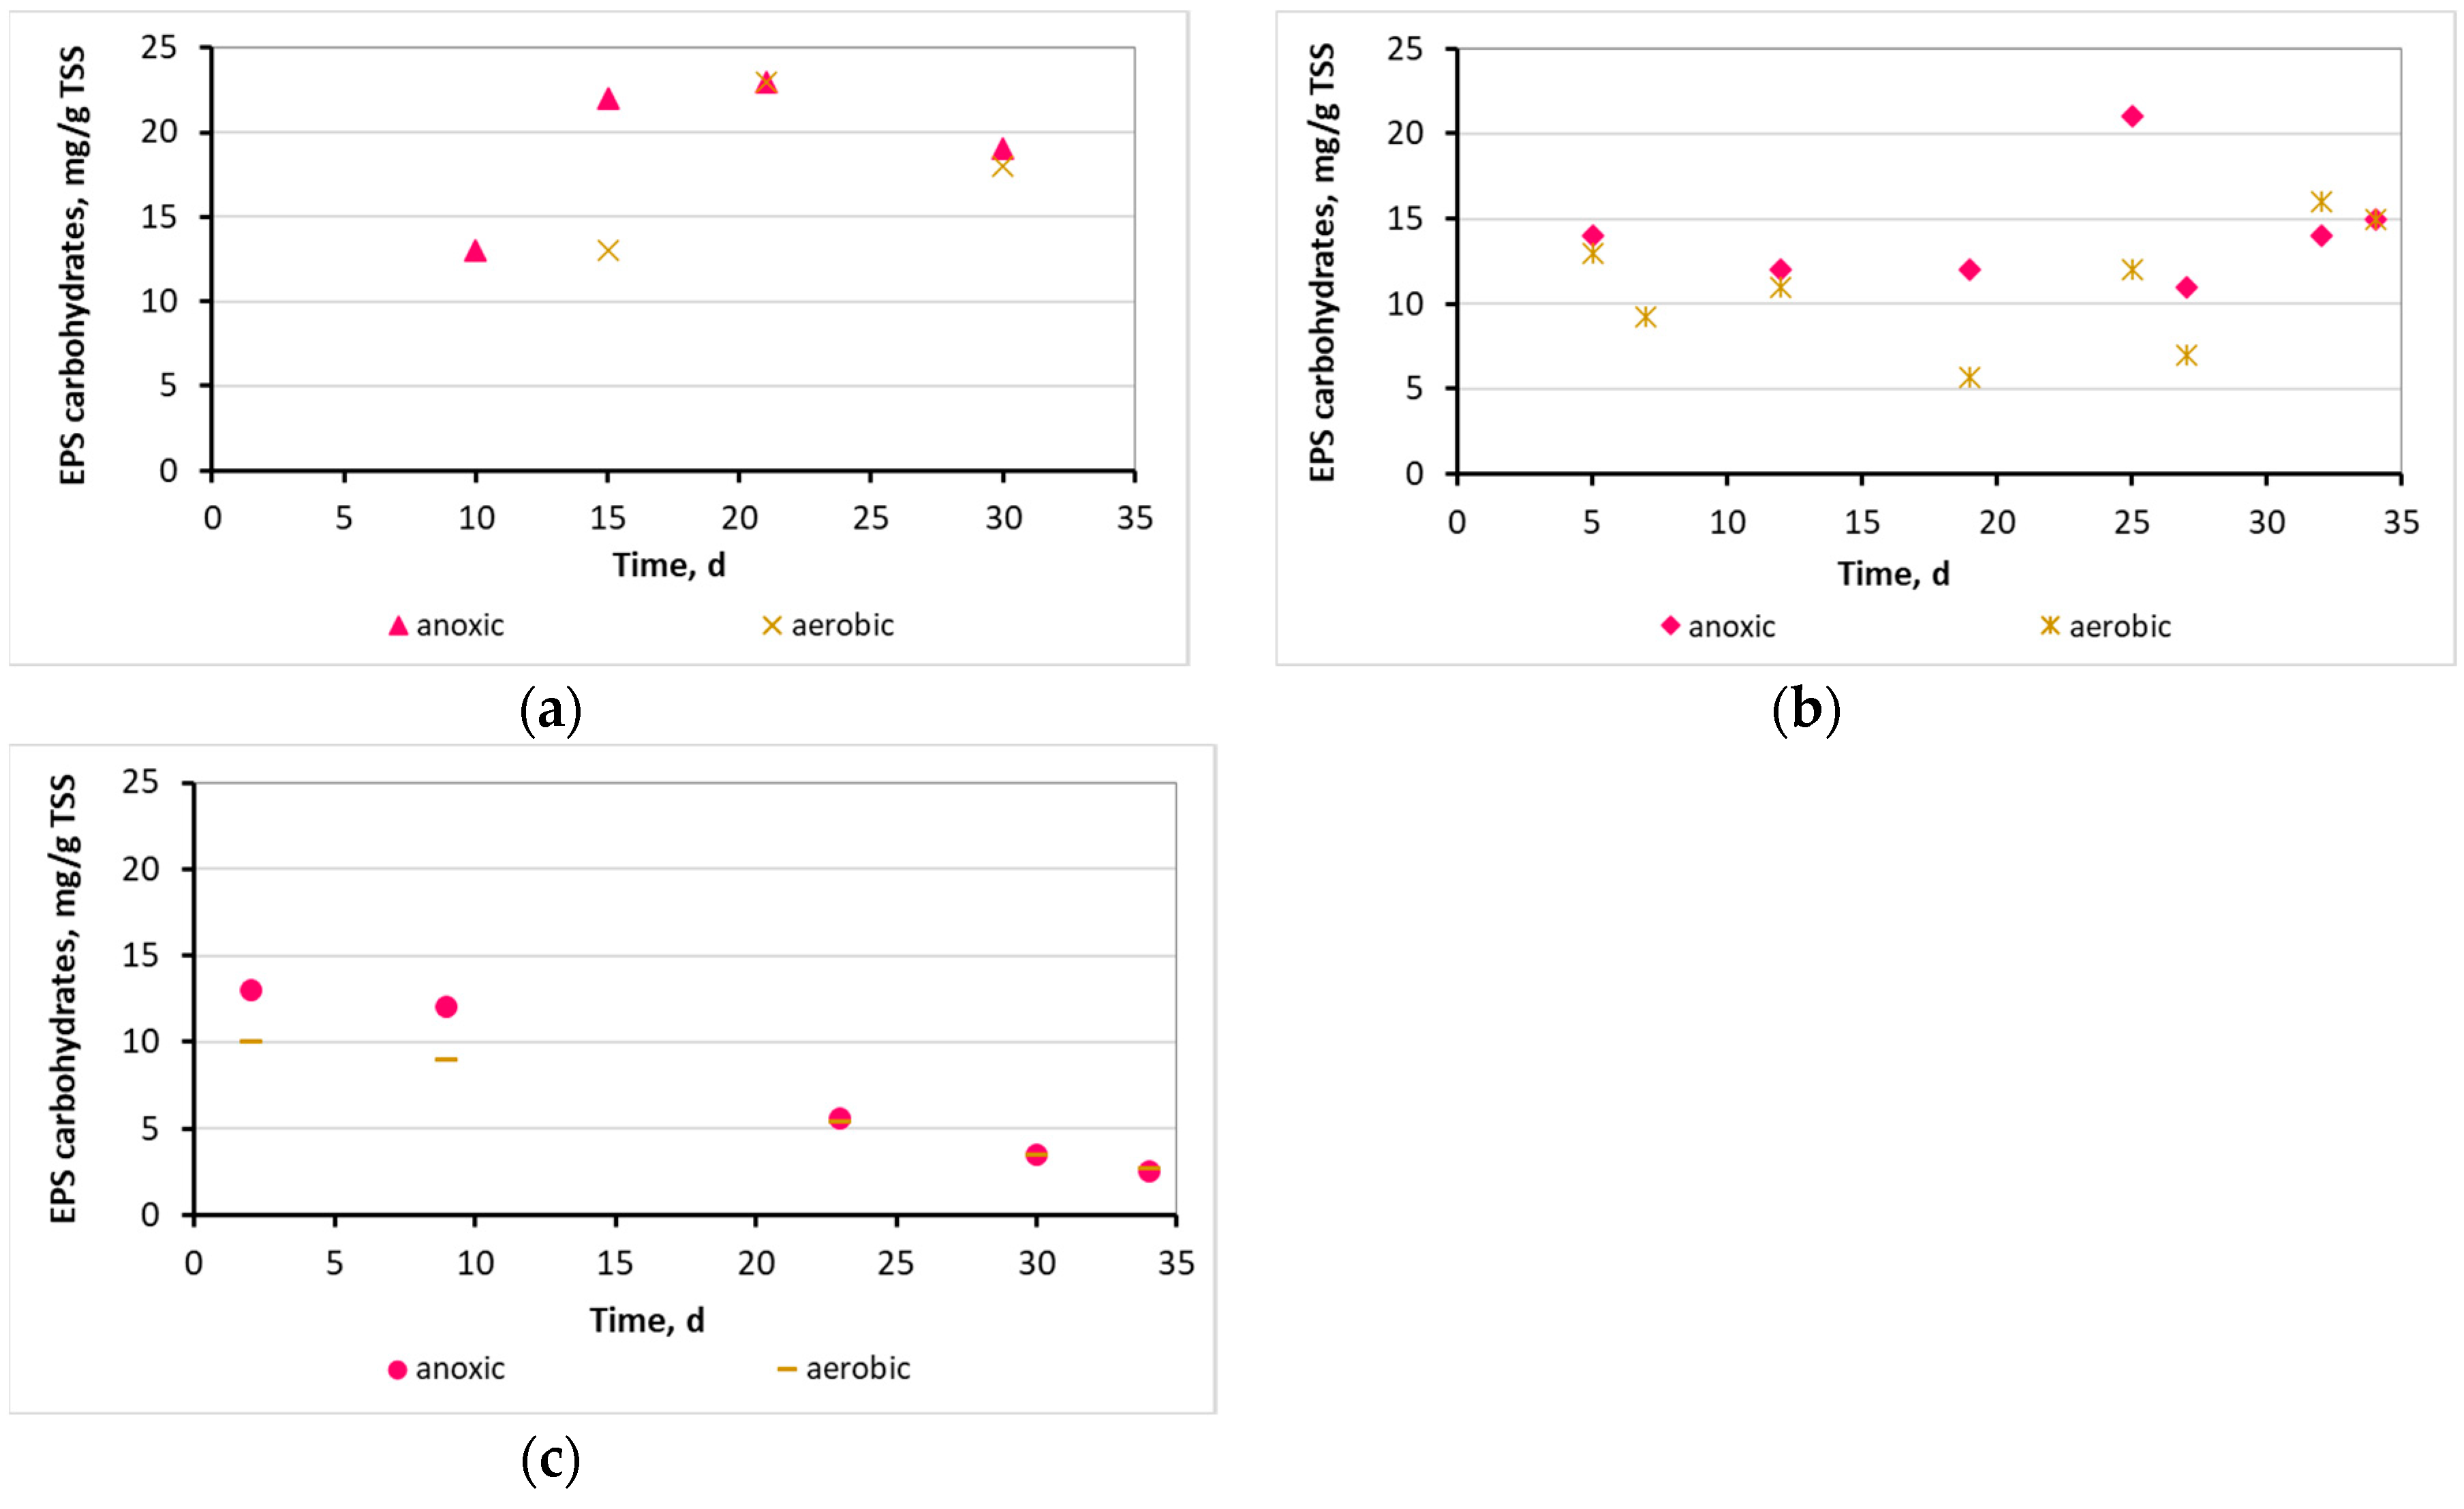
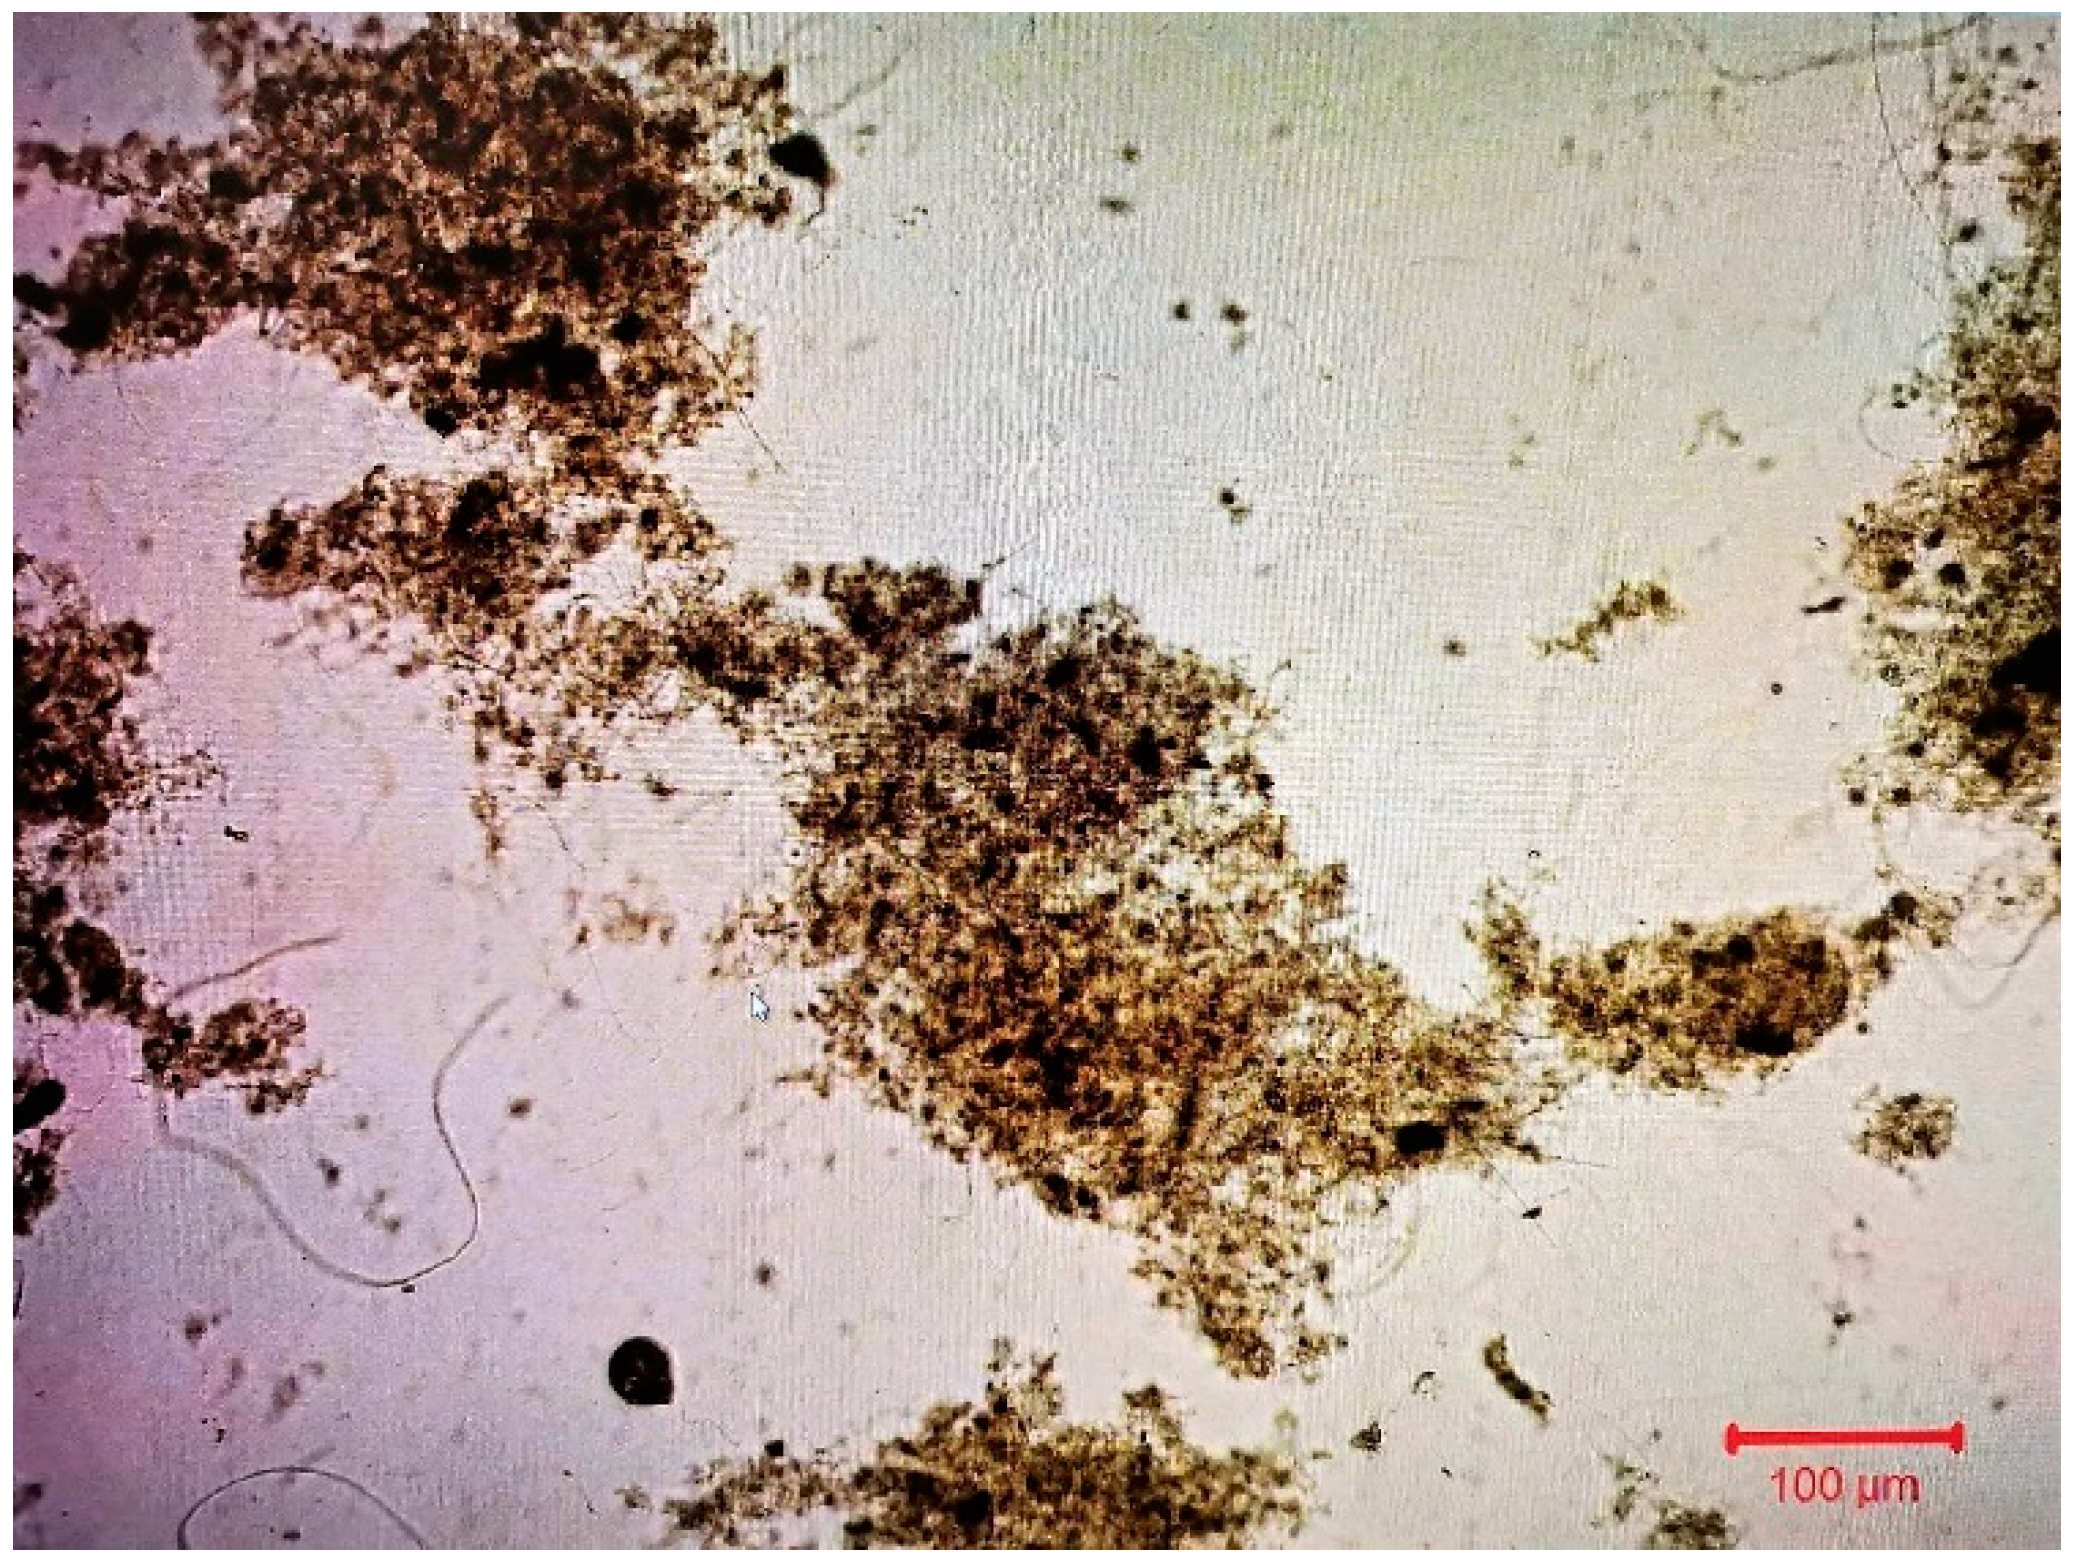

3.2. Evaluation of the biofilm developed on the surfaces of biocarriers
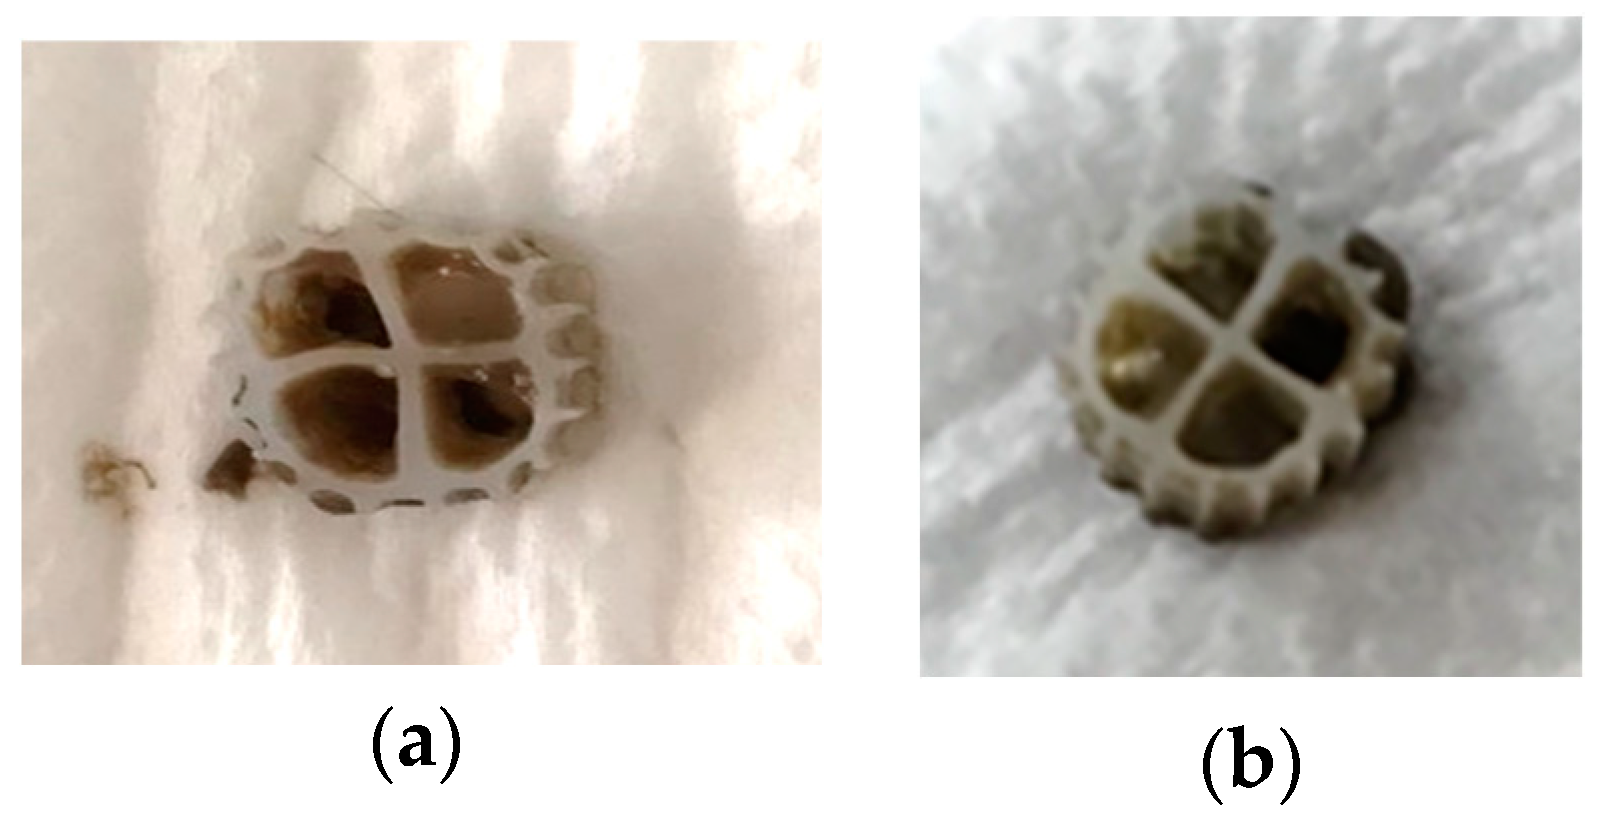
3.2.1. Biofilm developed at the Kaldnes K1 biocarriers
| t, d | Dry mass of biofilm, mg |
|---|---|
| 14 | 3.5±0.003 |
| 21 | 3.2±0.007 |
| 29 | 4.5±0.004 |
| 35 | 3.1±0.004 |
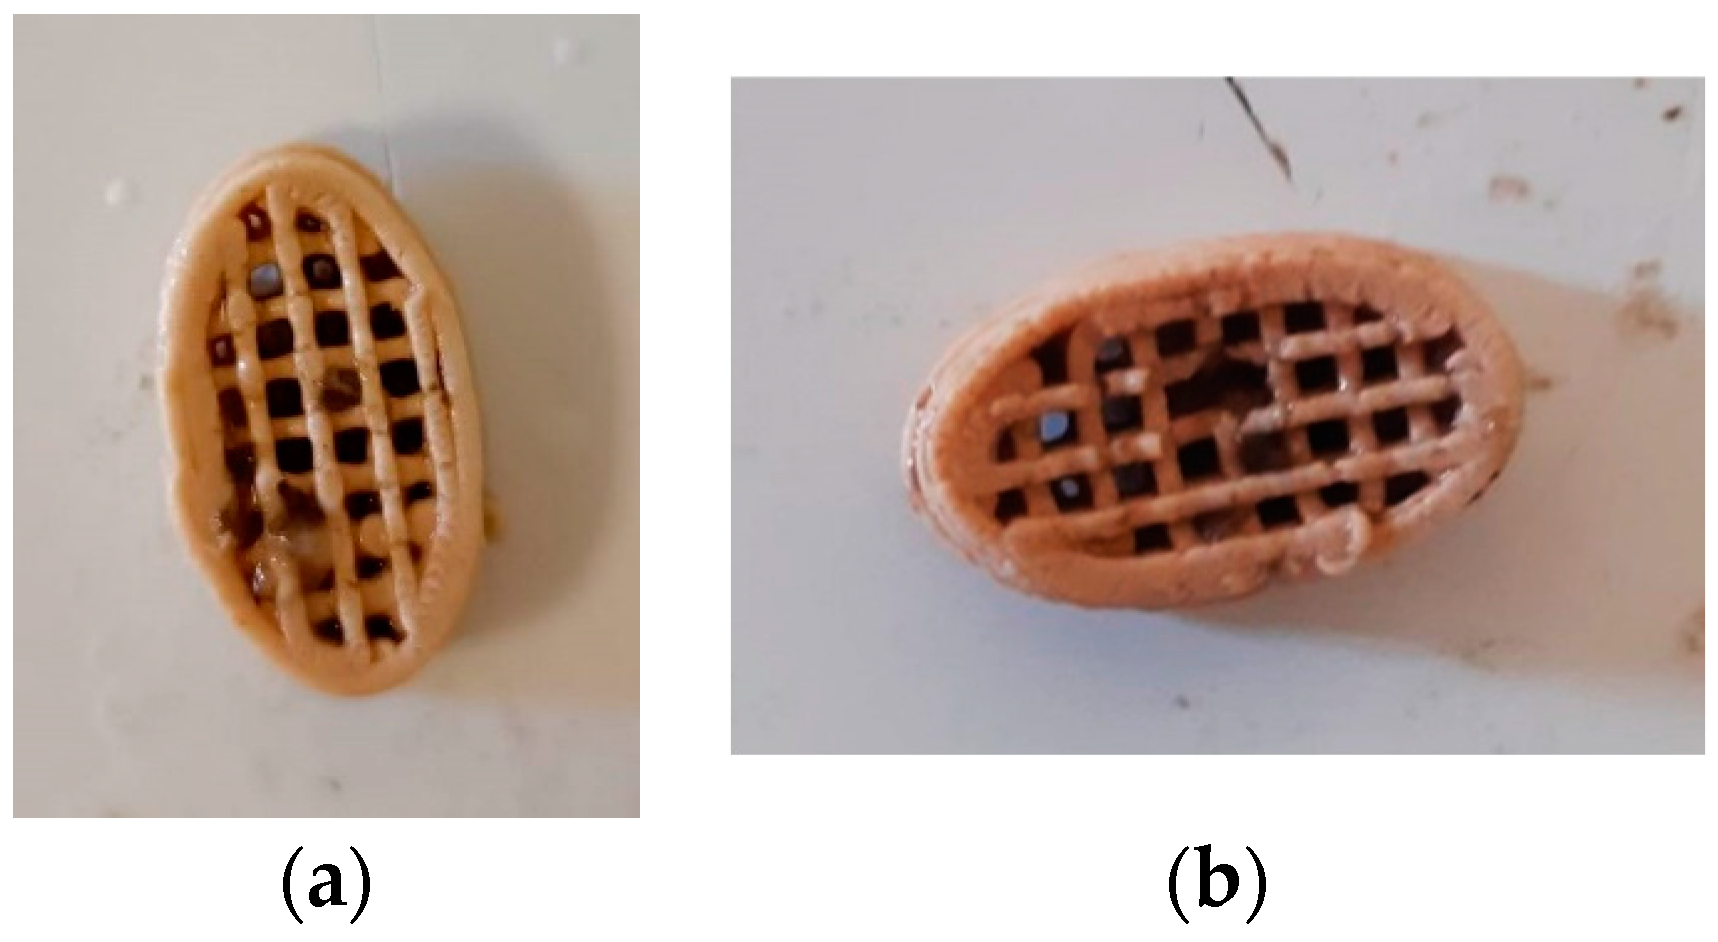
3.2.2. Biofilm at the 3D-printed biocarriers developed with 13X and bentonite
| t, d | Dry mass of biofilm, mg |
|---|---|
| 7 | 772±117 |
| 13 | 831±46 |
| 21 | 700±121 |
| 26 | 641±76 |
| 35 | 867±161 |
3.2.3. Biofilm microbiome analysis on biocarriers through 16S rRNA sequencing
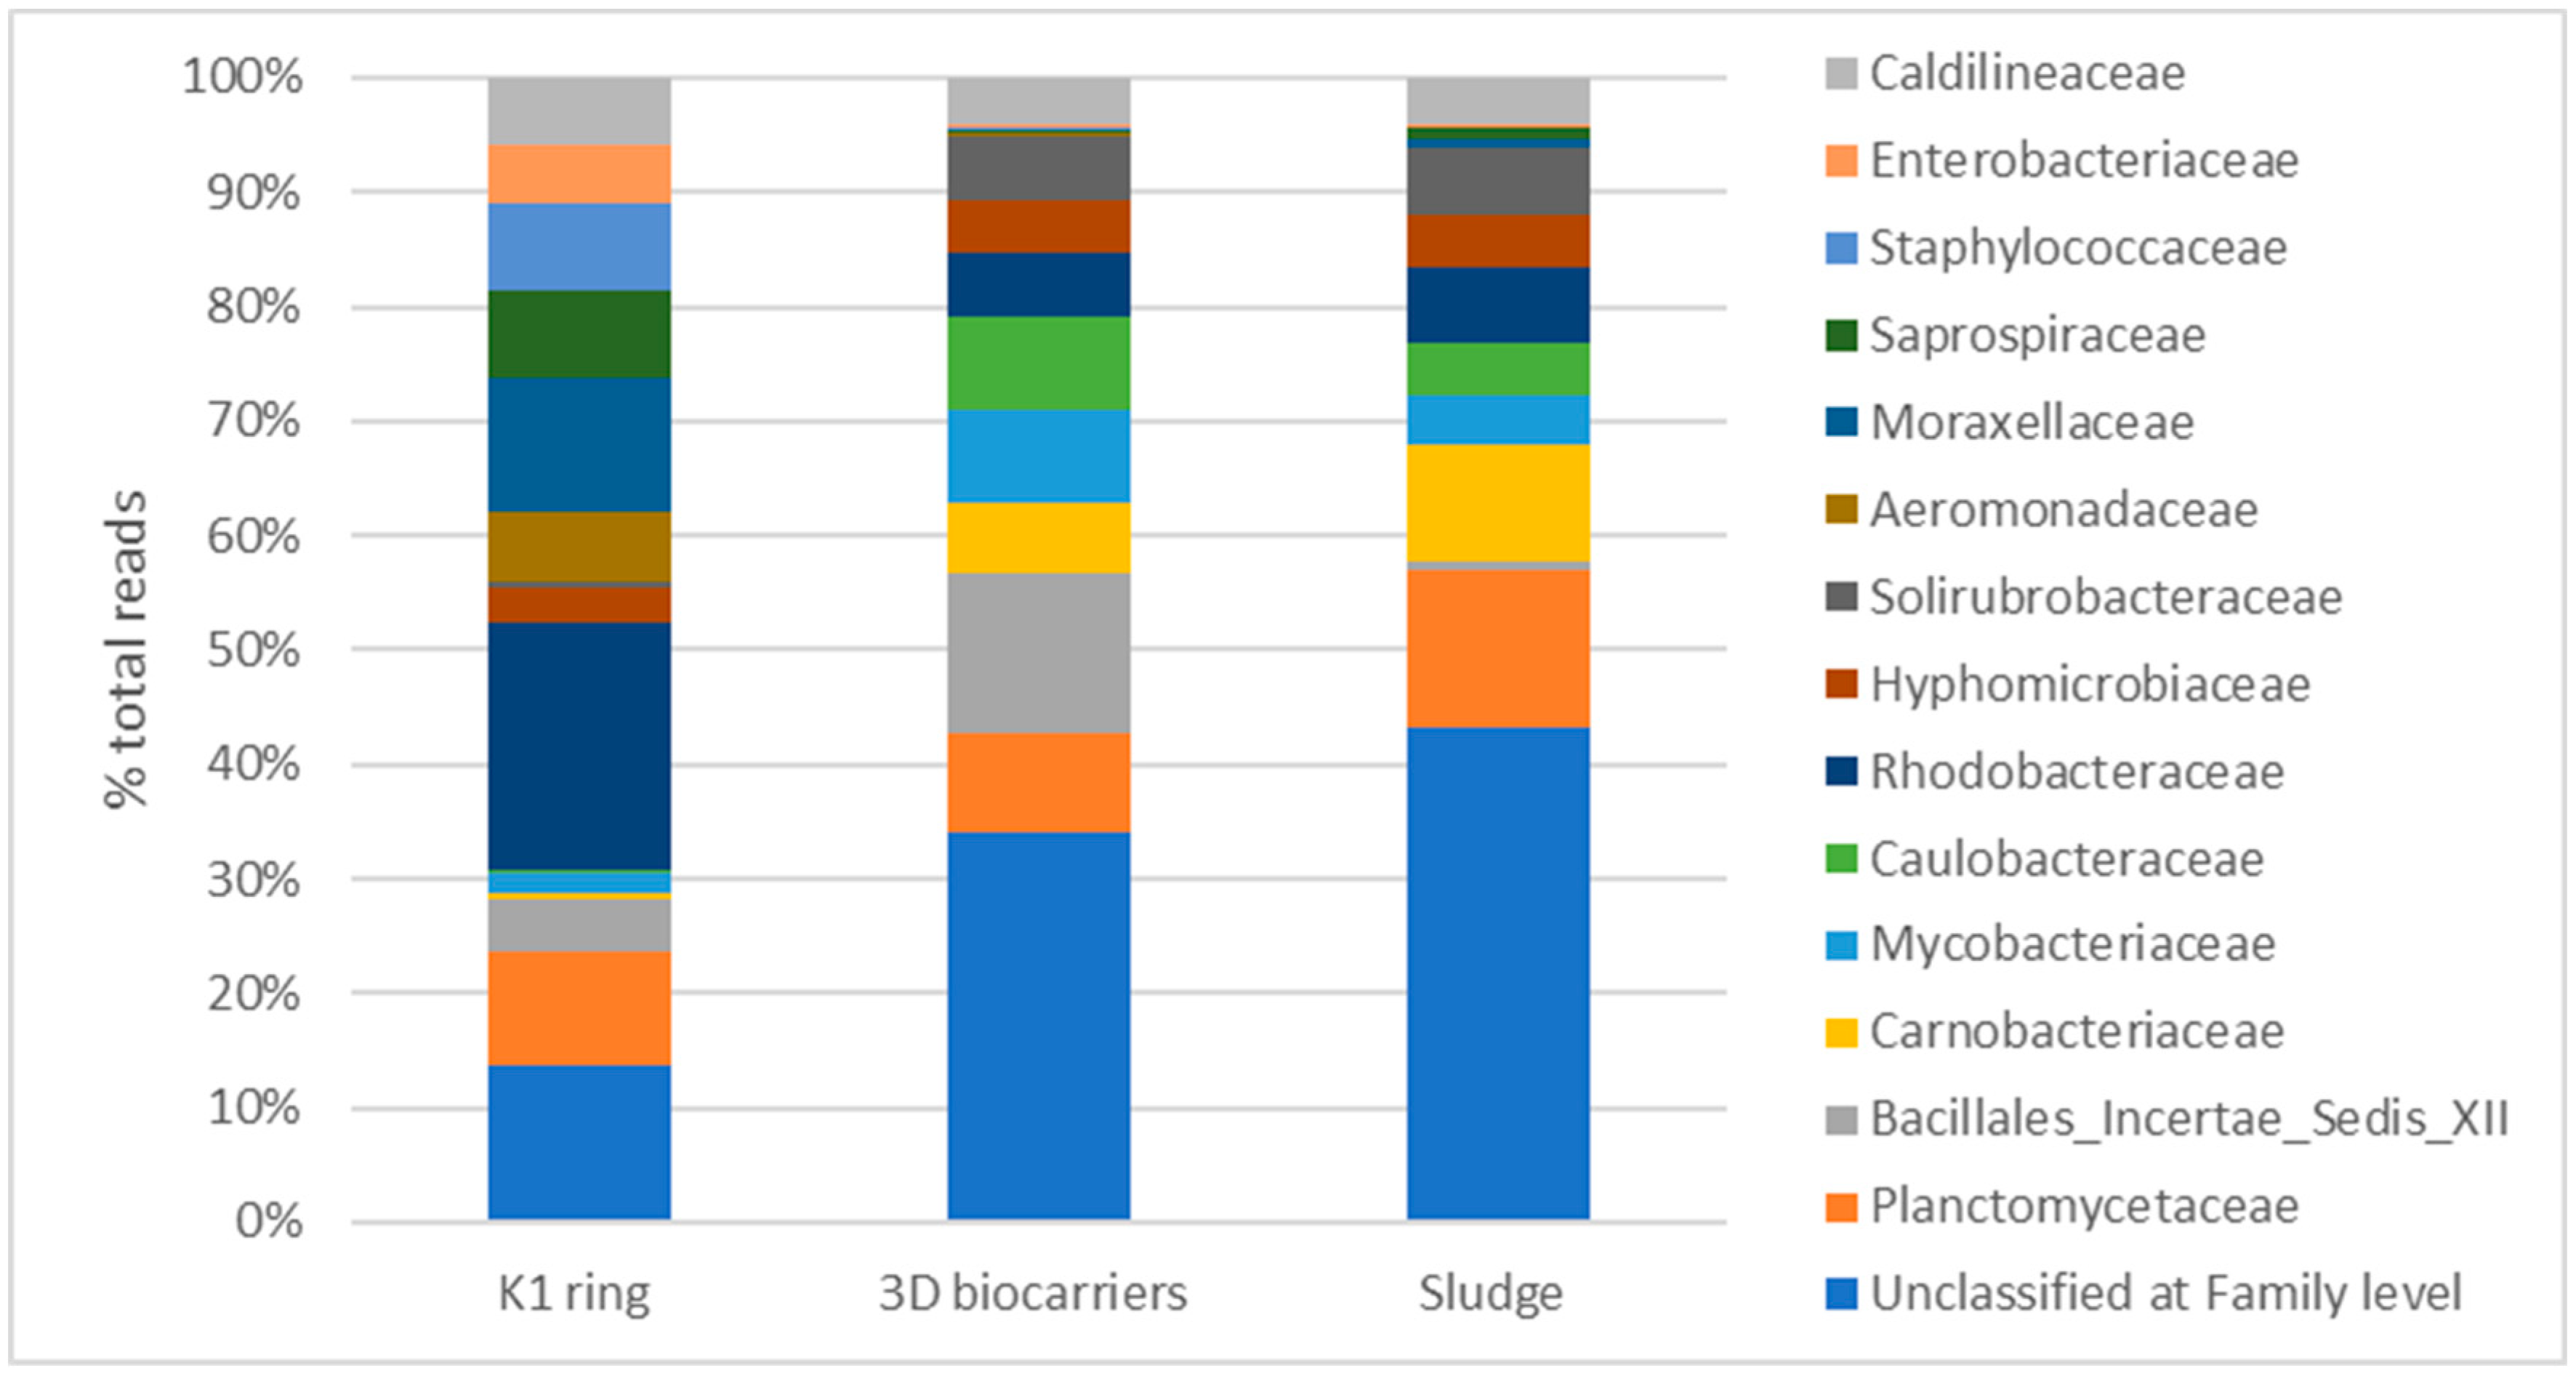
4. Discussion
5. Conclusions
Author Contributions
Funding
Data Availability Statement
Conflicts of Interest
References
- Boltz, J.; Boltz, J.P.; Smets, B.F.; Rittmann, B.E.; Loosdrecht, M.C.M. Van; Morgenroth, E.; Daigger, G.T. From biofilm ecology to reactors : A focused review From bio fi lm ecology to reactors : a focused review. 2017.
- Kawan, J.A.; Abu Hasan, H.; Suja, F.; Jaafar, O.; Abd-Rahman, R. A review on sewage treatment and polishing using moving bed bioreactor (Mbbr). Journal of Engineering Science and Technology 2016, 11, 1098–1120. [Google Scholar]
- Avellán, T.; Hahn, A.; Kirschke, S.; Müller, A.; Benavides, L.; Caucci, S. Co-Generating Knowledge in Nexus Research for Sustainable Wastewater Treatment. Resources 2022, 11. [Google Scholar]
- Banti, D.C.; Tsangas, M.; Samaras, P.; Zorpas, A. LCA of a membrane bioreactor compared to activated sludge system for municipal wastewater treatment. Membranes 2020, 10, 1–15. [Google Scholar] [CrossRef] [PubMed]
- Lemonidis, I.; Banti, D.C.; Tzenos, C.A.; Kalamaras, S.D.; Kotsopoulos, T.A.; Samaras, P. Energy Valorization of Fine Screenings from a Municipal Wastewater Treatment Plant. Energies 2022, 15. [Google Scholar]
- Conserva, S.; Tatti, F.; Torretta, V.; Ferronato, N.; Viotti, P. An integrated approach to the biological reactor-sedimentation tank system. Resources 2019, 8. [Google Scholar] [CrossRef]
- Dong, Y.; Fan, S.Q.; Shen, Y.; Yang, J.X.; Yan, P.; Chen, Y.P.; Li, J.; Guo, J.S.; Duan, X.M.; Fang, F.; et al. A Novel Bio-carrier Fabricated Using 3D Printing Technique for Wastewater Treatment. Scientific Reports 2015, 5. [Google Scholar] [CrossRef]
- Tang, B.; Song, H.; Bin, L.; Huang, S.; Zhang, W.; Fu, F.; Zhao, Y.; Chen, Q. Bioresource Technology Determination of the profile of DO and its mass transferring coefficient in a biofilm reactor packed with semi-suspended bio-carriers. Bioresource Technology 2017, 241, 54–62. [Google Scholar] [CrossRef]
- Gerard, M.H. Troubleshooting the sequencing batch reactor; John Wiley & Sons, Inc., Publication, 2011; ISBN 9781118058220. [Google Scholar]
- Poltak, R.F. Sequencing Batch Reactor Design and Operational Considerations Manual. New England Interstate Water Pollution Control Commission: Massachusetts, USA 2005, 27.
- Barwal, A.; Chaudhary, R. To study the performance of biocarriers in moving bed biofilm reactor ( MBBR ) technology and kinetics of biofilm for retrofitting the existing aerobic treatment systems : a review. 2014, 285–299.
- Felföldi, T.; Jurecska, L.; Vajna, B.; Barkács, K.; Makk, J.; Cebe, G.; Szabó, A.; Záray, G.; Márialigeti, K. Texture and type of polymer fiber carrier determine bacterial colonization and biofilm properties in wastewater treatment. 2015, 264, 824–834. [Google Scholar]
- Elliott, O.; Gray, S.; Mcclay, M.; Nassief, B.; Nunnelley, A.; Ekong, J.; Kardel, K.; Khoshkhoo, A.; Proaño, G.; David, M.; et al. Design and Manufacturing of High Surface Area 3D-Printed Media for Moving Bed Bioreactors for Wastewater Treatment. 2017, 144–156.
- Proano-Pena, G.; Carrano, A.L.; Blersch, D.M. Analysis of very-high surface area 3D-printed media in a moving bed biofilm reactor for wastewater treatment. PLoS ONE 2020, 15, 1–17. [Google Scholar]
- Chioti, A.G.; Tsioni, V.; Patsatzis, S.; Filidou, E.; Banti, D.; Samaras, P.; Economou, E.A.; Kostopoulou, E.; Sfetsas, T. Characterization of Biofilm Microbiome Formation Developed on Novel 3D-Printed Zeolite Biocarriers during Aerobic and Anaerobic Digestion Processes. 2022.
- Al-amshawee, S.K.A.; Bin, Y.; Yunus, M. Experimental investigation of bio fi lm carriers of varying shapes , sizes , and materials for wastewater treatment in fi xed bed bio fi lm reactor : a qualitative study of biocarrier performance. 2022.
- Gkotsis, P.; Banti, D.; Pritsa, A.; Mitrakas, M.; Samaras, P.; Peleka, E.; Zouboulis, A. Effect of operating conditions on membrane fouling in pilot-scale mbrs; filaments growth, diminishing dissolved oxygen and recirculation rate of the activated sludge. Membranes 2021, 11, 1–16. [Google Scholar] [CrossRef]
- Lin, H.; Zhang, M.; Wang, F.; Meng, F.; Liao, B.Q.; Hong, H.; Chen, J.; Gao, W. A critical review of extracellular polymeric substances (EPSs) in membrane bioreactors: Characteristics, roles in membrane fouling and control strategies. Journal of Membrane Science 2014, 460, 110–125. [Google Scholar] [CrossRef]
- Bassin, J.P.; Kleerebezem, R.; Rosado, A.S.; Van Loosdrecht, M.C.M.; Dezotti, M. Effect of different operational conditions on biofilm development, nitrification, and nitrifying microbial population in moving-bed biofilm reactors. Environmental Science and Technology 2012, 46, 1546–1555. [Google Scholar] [CrossRef] [PubMed]
- Gupta, B.; Kumar, A.; Sarathi, P.; Lal, S. Journal of Environmental Chemical Engineering Recent advances in application of moving bed biofilm reactor for wastewater treatment : Insights into critical operational parameters, modifications, field-scale performance, and sustainable aspects. Journal of Environmental Chemical Engineering 2022, 10, 107742. [Google Scholar] [CrossRef]
- Banti, D.C.; Karayannakidis, P.D.; Samaras, P.; Mitrakas, M.G. An innovative bioreactor set-up that reduces membrane fouling by adjusting the filamentous bacterial population. Journal of Membrane Science 2017. [Google Scholar] [CrossRef]
- Banti, D.; Mitrakas, M.; Fytianos, G.; Tsali, A.; Samaras, P. Combined effect of colloids and SMP on membrane fouling in MBRs. Membranes 2020, 10, 1–15. [Google Scholar] [CrossRef]
- Mandakhalikar, K.D.; Rahmat, J.N.; Chiong, E.; Neoh, K.G.; Shen, L.; Tambyah, P.A. Extraction and quantification of biofilm bacteria: Method optimized for urinary catheters. Scientific Reports 2018, 8, 1–9. [Google Scholar] [CrossRef]
- Mohamed, A.; Rajaa, A.M.; Khalid, Z.; Fouad, M.; Naima, R. Comparison of three methods for the detection of biofilm formation by clinical isolates of Staphylococcus aureus isolated in Casablanca. International Journal of Science and Research 2013, 5, 2319–7064. [Google Scholar]
- APHA (American Public Health Association) Standard Methods for the Examination of Water and Wastewater; Washington, DC, 1998.
- Hwang, B.K.; Kim, J.H.; Ahn, C.H.; Lee, C.H.; Song, J.Y.; Ra, Y.H. Effect of disintegrated sludge recycling on membrane permeability in a membrane bioreactor combined with a turbulent jet flow ozone contactor. Water Research 2010, 44, 1833–1840. [Google Scholar]
- Banti, D.C.; Samaras, P.; Tsioptsias, C.; Zouboulis, A.; Mitrakas, M. Mechanism of SMP aggregation within the pores of hydrophilic and hydrophobic MBR membranes and aggregates detachment. Separation and Purification Technology 2018. [Google Scholar]
- Hartree, E.F. Determination of protein: A modification of the Lowry method that gives a lineart photometric response. Analytical Biochemistry 1972, 48. [Google Scholar]
- Dubois, M.; Gilles, K.A.; Hamilton, J.K.; Rebers, P.A.; Smith, F. Colorimetric Method for Determination of Sugars and Related Substances. 1956, 350–356.
- Eikelboom, D.H. Process control of activated sludge plants by microscopic investigation; IWA Publishing: Zutphen, 2000. [Google Scholar]
- Banti, D.C.; Mitrakas, M.; Samaras, P. Membrane fouling controlled by adjustment of biological treatment parameters in step-aerating MBR. Membranes 2021, 11, 1–15. [Google Scholar] [CrossRef]
- Bolyen, E.; Rideout, J.R.; Dillon, M.R.; Bokulich, N.A.; Abnet, C.C.; Al-Ghalith, G.A.; Alexander, H.; Alm, E.J.; Arumugam, M.; Asnicar, F.; et al. Reproducible, interactive, scalable and extensible microbiome data science using QIIME 2. Nature Biotechnology 2019, 37, 852–857. [Google Scholar]
- Benjamin, C.; McMurdie, P.; Rosen, M.; Han, A.; Johnson, A.; Holmes, S. DADA2:High resolution sample inference from Illumina amplicon data. Encyclopedia of Medical Immunology 2020, 13, 1–7. [Google Scholar]
- Quast, C.; Pruesse, E.; Yilmaz, P.; Gerken, J.; Schweer, T.; Yarza, P.; Peplies, J.; Glöckner, F.O. The SILVA ribosomal RNA gene database project: Improved data processing and web-based tools. Nucleic Acids Research 2013, 41, 590–596. [Google Scholar]
- Banti, D.C.; Tsali, A.; Mitrakas, M.; Samaras, P. The Dissolved Oxygen Effect on the Controlled Growth of Filamentous Microorganisms in Membrane Bioreactors. i 2020, i, 39. [Google Scholar]
- Guidelines, G.E.H.S. Environmental , Health , and Safety General Guidelines. 2007.
- Waqas, S.; Harun, N.Y.; Sambudi, N.S.; Abioye, K.J.; Hamad, M. A review on integrated fixed-film activated sludge for the treat- ment of wastewater. 2023, 1–22.
- Waqas, S.; Bilad, M.R.; Man, Z.B. Performance and energy consumption evaluation of rotating biological contactor for domestic wastewater treatment. Indonesian Journal of Science and Technology 2021, 6, 101–112. [Google Scholar] [CrossRef]
- Biswas, K.; Turner, S.J. Microbial community composition and dynamics of moving bed biofilm reactor systems treating municipal sewage. Applied and Environmental Microbiology 2012, 78, 855–864. [Google Scholar]
- Chioti, A.G.; Tsioni, V.; Patsatzis, S.; Filidou, E.; Banti, D.; Samaras, P.; Economou, E.A.; Kostopoulou, E.; Sfetsas, T. Characterization of Biofilm Microbiome Formation Developed on Novel 3D-Printed Zeolite Biocarriers during Aerobic and Anaerobic Digestion Processes. Fermentation 2022, 8. [Google Scholar]
- Sakdapetsiri, C.; Kaokhum, N.; Pinyakong, O. Biodegradation of crude oil by immobilized Exiguobacterium sp. AO-11 and shelf life evaluation. Scientific Reports 2021, 11, 1–13. [Google Scholar]
- Doloman, A.; Boeren, S.; Miller, C.D.; Sousa, D.Z. Stimulating Effect of Trichococcus flocculiformis on a Coculture of Syntrophomonas wolfei and Methanospirillum hungatei. Applied and Environmental Microbiology 2022, 88, 1–14. [Google Scholar] [CrossRef]
- Rodriguez-Sanchez, A.; Muñoz-Palazon, B.; Hurtado-Martinez, M.; Mikola, A.; Gonzalez-Lopez, J.; Vahala, R.; Gonzalez-Martinez, A. Analysis of microbial communities involved in organic matter and nitrogen removal in a full-scale moving bed biofilm reactor located near the Polar Arctic Circle. International Biodeterioration and Biodegradation 2020, 146, 104830. [Google Scholar] [CrossRef]
- Niederdorfer, R.; Besemer, K.; Battin, T.J.; Peter, H. Ecological strategies and metabolic trade-offs of complex environmental biofilms. npj Biofilms and Microbiomes 2017, 3. [Google Scholar]
- Cheng, H.; Cheng, D.; Mao, J.; Lu, T.; Hong, P.Y. Identification and characterization of core sludge and biofilm microbiota in anaerobic membrane bioreactors. Environment International 2019, 133. [Google Scholar] [CrossRef]
- Cinà, P.; Bacci, G.; Arancio, W.; Gallo, G.; Fani, R.; Puglia, A.M.; Di Trapani, D.; Mannina, G. Assessment and characterization of the bacterial community structure in advanced activated sludge systems. Bioresource Technology 2019, 282, 254–261. [Google Scholar] [CrossRef]
Disclaimer/Publisher’s Note: The statements, opinions and data contained in all publications are solely those of the individual author(s) and contributor(s) and not of MDPI and/or the editor(s). MDPI and/or the editor(s) disclaim responsibility for any injury to people or property resulting from any ideas, methods, instructions or products referred to in the content. |
© 2023 by the authors. Licensee MDPI, Basel, Switzerland. This article is an open access article distributed under the terms and conditions of the Creative Commons Attribution (CC BY) license (http://creativecommons.org/licenses/by/4.0/).


