1. Introduction
Traditional Structural Health Monitoring refers to non-destructive testing of the monitored object, including the collection and analysis of various internal structural state data to detect and identify structural damage states[
1]. The process of health monitoring includes obtaining measured values of dynamic response information from the acquisition system through sensors embedded in the field. Then characteristic factors that are sensitive to damage are extracted from the measured response values and statistically analyzed using second-order thinking to evaluate the current health and service status of the structure.
This paper constructs an airport rigid pavement condition monitoring perception technology based on the existing monitoring system technology originated from structural health monitoring. It mainly utilizes embedded sensors and real-time high-frequency signal acquisition technology to guide the monitoring system. It uses 4G routers for wireless communication technology and the latest server storage technology for monitoring system storage terminal monitoring system. This technology can carry out long-term and stable real-time monitoring of airport pavements and is an automatic monitoring system with minimal manual intervention. The system integrates multiple interdisciplinary comprehensive technical means, including but not limited to structural mechanics, dynamics, signal processing, sensing technology, communication technology, and materials science fields[
6].
Table 1 shows the relevant information.
It is worth noting that the construction of the current airport rigid pavement state monitoring system still has the following difficulties:
- (1)
Common sensors and their cables in the market fail due to disturbance;
- (2)
The applicability of monitoring sensor range and precision to engineering structures;
- (3)
It is difficult to break through the technical barriers between the subsystems of the monitoring system;
- (4)
(he stability and durability of the monitoring system is doubtful;
- (5)
The storage, transmission and display of a large number of real-time monitoring data are difficult to be solved in one stop;
- (6)
How the network becomes the medium of real-time online, remote monitoring and data transmission;
- (7)
Conflict between monitoring system construction and mechanized construction;
- (8)
The reliability and effectiveness of signal acquisition of monitoring system need to be verified;
- (9)
Monitoring system is difficult to use remote client and mobile phone client remote control and monitoring.
How to ensure the smooth design of airport rigid pavement state monitoring and perception system, and can cooperate in the construction of mechanized pouring operation has become an urgent problem to be solved. This paper takes the engineering example as the test platform to carry out the design work.
2. MATERIAL AND METHODS
2.1. Study Condition
The International Airport located in Fujian Province, China, is an essential aviation hub along the southeast coast of China and one of the 12 trunk airports in China. The airport began operations in 1983 with a flight area of 4D. In 1994, the second phase of the reconstruction and expansion project was carried out, adding asphalt concrete to the original 2700m cement concrete runway surface. At the same time, the runway was extended 700m to the northeast and changed to an asphalt concrete surface, upgrading the grade of the airport flight area to 4E. The runway at the airport has been damaged.
The subject of this research, the A1 connection channel, has undergone several decades of aircraft heavy load cycles and has experienced damage such as plate angle fracture, rutting, and broken plates. Such damages directly or indirectly affect the normal operation of flights. This research project is based on the A1 contact road reconstruction project, attempting to conduct intelligent experimental studies on the test plate. The intelligent test plate test site is located in the A1 airport renovation contact road and has a total area of 1088 m². The contact way of the intelligent test plate is transformed by selecting one of the plates on the airplane wheel track as an experimental research object.
2.1.1. Aircraft motion state
According to the technical standards for the flight area of civil airports, the taxiing movement of a fully loaded aircraft is interpreted as follows: the aircraft enters from the vertical contact road at the end of the runway, waits in line at the take-off waiting area, and enters the take-off position guided by the ground signal light.
The A1 contact way is the main entryway for aircraft onto the runway. The pavement covers all the trajectories of the plane’s taxiing, slow stop, and acceleration turning movements. The landing gear is located in the airfield runway waiting position. Before entering the runway, the plane stops with the front brakes on the contact way and waits for ATC clearance instructions or slides and turns before entering the airport runway.
2.1.2. A1 Contact Channel Overview
The size of the contact channel is 16m×68m, east-west, the longitudinal joints between the plates using tongue-and-groove joint, the horizontal joints using false joints, the transverse construction joints using force rod flat joints.
The plate size of A1 connecting passage is 4m×4m, the 28-day bending and tensile strength of modified cement concrete is 5.0mpa, the 7-day compressive strength of lean concrete base is no less than 10Mpa, and the average texture depth of cement concrete surface is no less than 0.8mm (determined by sand filling method). The schematic diagram of plate section structure before and after the modified connecting passage. The transformation project of the contact road will be carried out within the range of 68m along the middle line of the taxiway with two silos on each side. The total thickness of the base and surface layer on the road panel will not change, and the thickness of the surface layer will be increased.
2.2. Design principles of monitoring system
Based on the experimental research and the actual site conditions, an appropriate cement concrete slab was selected on the reconstructed A1 connecting road of The Airport as the construction carrier of the intelligent plate perception system. The monitoring system selects and designs the optimal monitoring system scheme based on the actual situation of road surface control in the domestic airport flight area, taking into account the practical demand, cost efficiency, and universality principles, and combines with The Airport reconstruction project.
2.2.1. Construction and Implementation of Channel Panel State Monitoring and Perception System
The system is based on the pavement in the flight area and obtains the state information of the pavement structure, such as internal temperature, stress and deformation, and the force of soil foundation and base layer, by means of embedded sensors. Real-time online monitoring technology is used for remote transmission and management of data, and collaboration is implemented for system construction.
2.2.2. Monitoring and Analysis of Strain Behavior of Early-Age Road Face Slab in Construction
The transverse strain behavior of the road face slab during the early age of construction and the corresponding relationship between the development of strain and the temperature change of the panel are monitored and analyzed using embedded vibrating string sensors and temperature modules as the main sensing means. This enables monitoring and analysis of early age temperature and strain in the pavement.
2.2.3. Mechanical Behavior Monitoring and Analysis of Underdeck Under Aircraft Taxiing Load
The monitoring system captures the response state of the underdeck panel under the action of aircraft load by using a sensor embedded at a fixed point as the monitoring terminal. This includes monitoring and analysis of the stress and strain behavior of the panel under the load, as well as the stress state data of the soil foundation and base. By doing so, the mechanical behavior of the underdeck under aircraft taxiing load can be monitored and analyzed.
2.2.4. Providing Pre-Research Support for Dynamic Response of Airport Road Structure
The monitoring system provides theoretical guidance for maintenance and diagnosis of pavement structure in service and pre-research support for dynamic response of airport pavement structure. Various monitoring data obtained from the airport pavement state monitoring and perception system are analyzed to evaluate the dynamic response of airport road structure. This provides valuable information for future maintenance and design improvement of airport pavement structure.
2.3. Sensor scheme design
2.3.1. Sensor Layout
The sensor layout should be based on the road surface design, construction process and monitoring needs, and the following principles should be followed: a) The arrangement should be reasonable and the coverage area should be large enough to obtain comprehensive and accurate response state information of the road surface; b) The layout should be uniform and avoid uneven distribution, which may cause certain errors in the analysis of monitoring data; c) The sensor layout should be based on the corresponding measurement point; d) The layout should consider the possibility of future maintenance and replacement of the sensor, and avoid damage to the sensor due to maintenance and replacement difficulties.
2.3.2. Sensor Maintenance
Regular maintenance is necessary to ensure the normal and stable operation of the sensor. The sensor maintenance includes: a) Regular inspection of sensor performance and output, and timely detection and troubleshooting of faults; b) Regular cleaning and dust removal to avoid affecting the measurement accuracy and service life of the sensor; c) Regular calibration of the sensor to ensure the measurement accuracy of the system; d) Regular replacement and upgrade of the sensor to improve the monitoring technology and meet the needs of scientific research work. The sensors used in monitoring test of intelligent test board are shown in
Table 2.
3. RESULTS AND DISCUSSION
3.1. System overview
The track status monitoring and sensing system is designed to enable accurate, reliable, and continuous observation of airport pavement. The system uses vibrating string and resistance strain sensors as sensing means and real-time high-frequency signal acquisition technology as guidance to acquire measurement information of panel mechanical deformation, in-board temperature, earth pressure, dynamic strain, and other parameters during the early stage of construction. The collected data is then transmitted using 4G router wireless communication technology to a server storage terminal for storage and analysis.
The system is designed to achieve long-term stable work, online real-time transmission of data, and remote control. It is highly reliable and has high adaptability to the system environment. The system is designed to provide long-term service and can be used for all-weather monitoring and sensing of the airport pavement, as shown in
Figure 1.
Overall, the monitoring system is based on the Internet of Things technology and is designed to provide accurate and reliable information on the condition of airport pavements. The system provides valuable insights for maintenance and diagnosis of pavement structures in service and provides pre-research support for dynamic response of airport pavement structure.
The track status monitoring and perception system is mainly composed of sensor subsystem, data acquisition subsystem, data storage subsystem, data transmission subsystem and supporting facilities. The sensor subsystem is located in the runway of the flight area, and the data acquisition subsystem, data storage subsystem, data transmission subsystem and supporting facilities are located in the boundary outside the runway of the flight area.
3.2. Subsystem design
3.2.1. Sensor subsystem
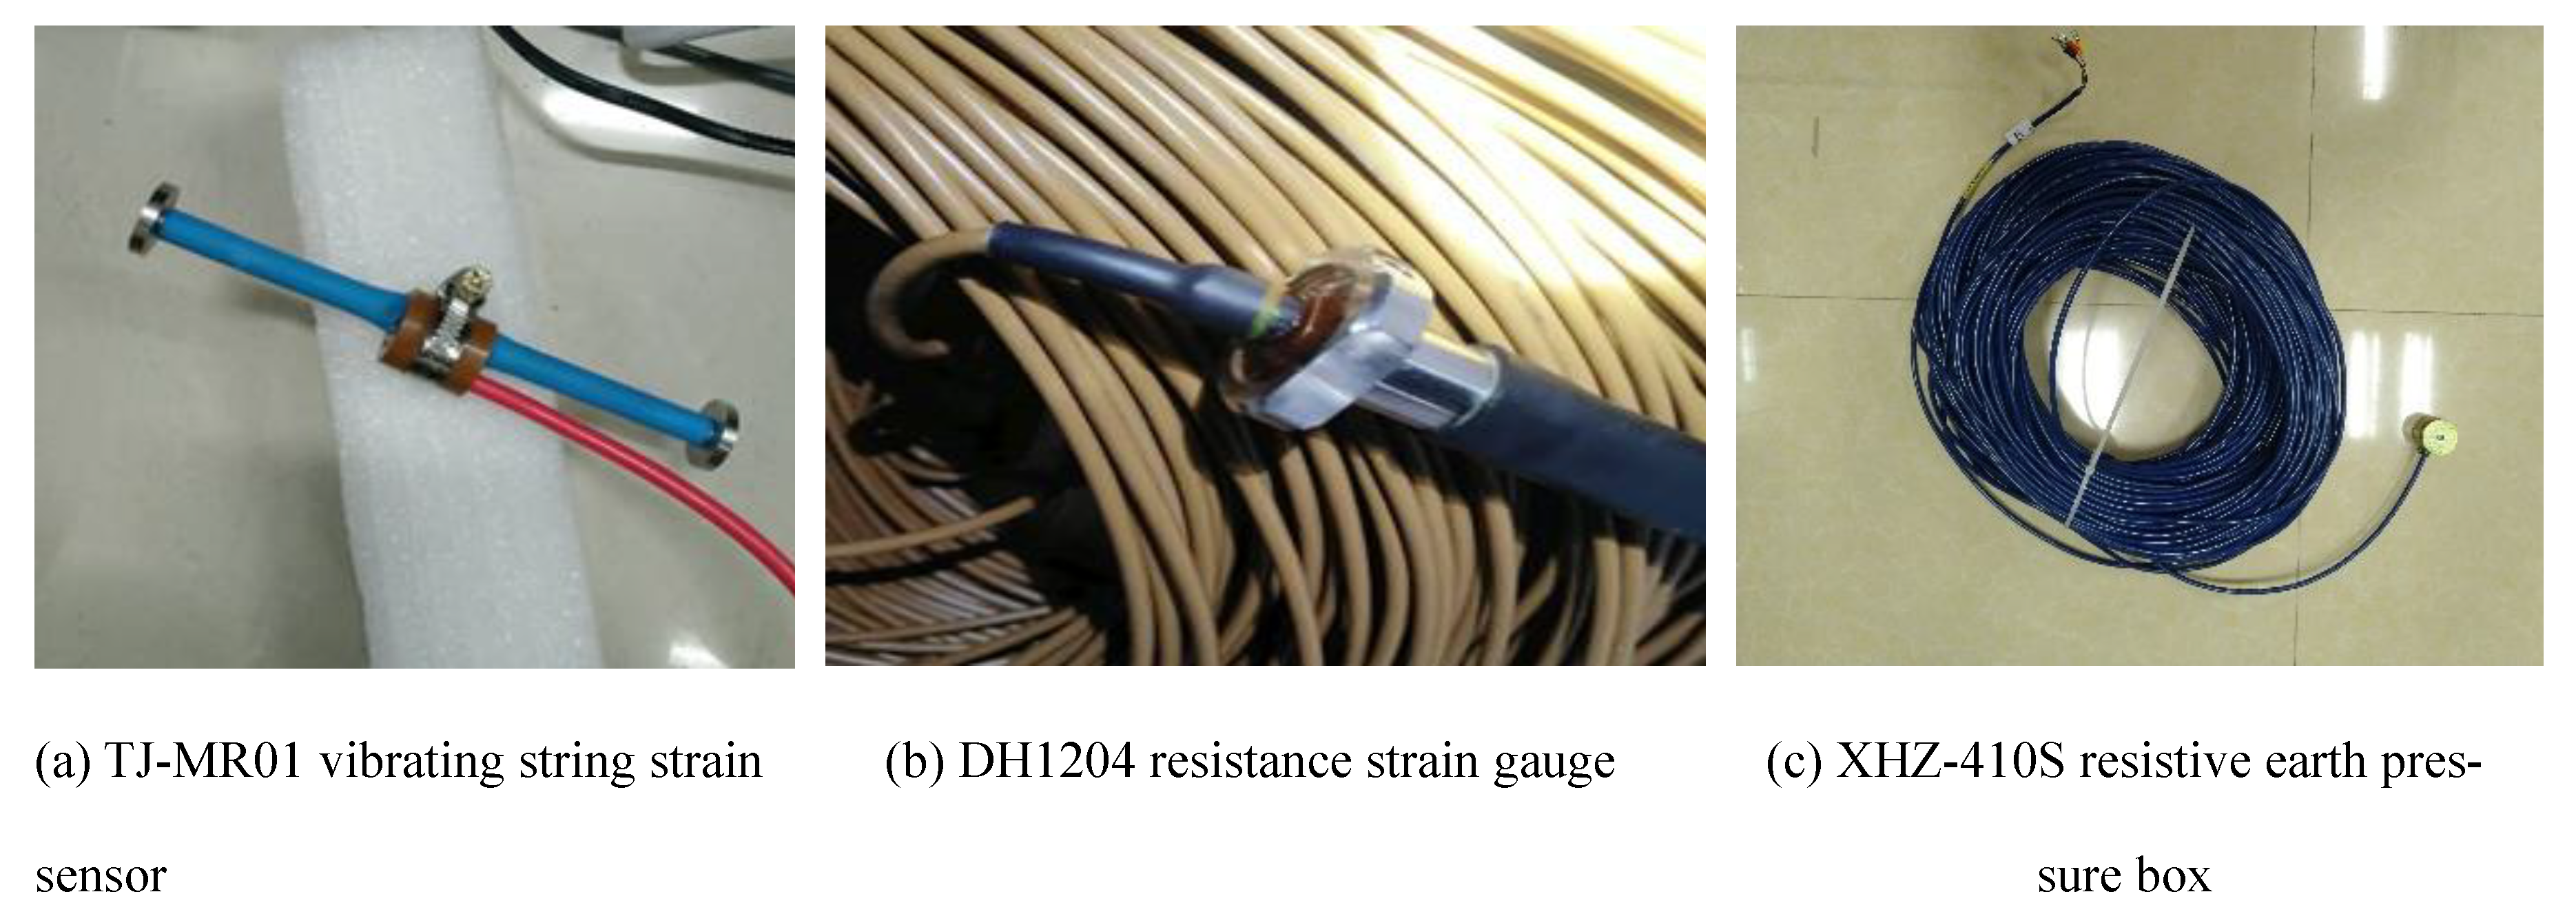
The sensor subsystem is the acquisition terminal of the whole system, which is a key link to restrict the long-term normal and stable service of the monitoring system. It includes the structure of the sensor itself, the package device of moisture-proof and anti-rolling, and the fixed device of stable position. The sensors used in this monitoring include vibrating string strain gauge, resistance strain gauge, and resistance earth pressure box. All of them are embedded sensors, which not only avoid the influence on the normal service of the runway, but also use high-range and high-precision sensors to timely transmit the internal status of the track surface to the acquisition equipment, as shown in
Figure 2.
3.2.2. Data acquisition subsystem
The data of the monitoring system is varied due to the different types of sensors. The monitoring signals returned by the system can be divided into frequency signals and optical signals according to the principles of different sensors.
- (1)
Vibrating string sensor system
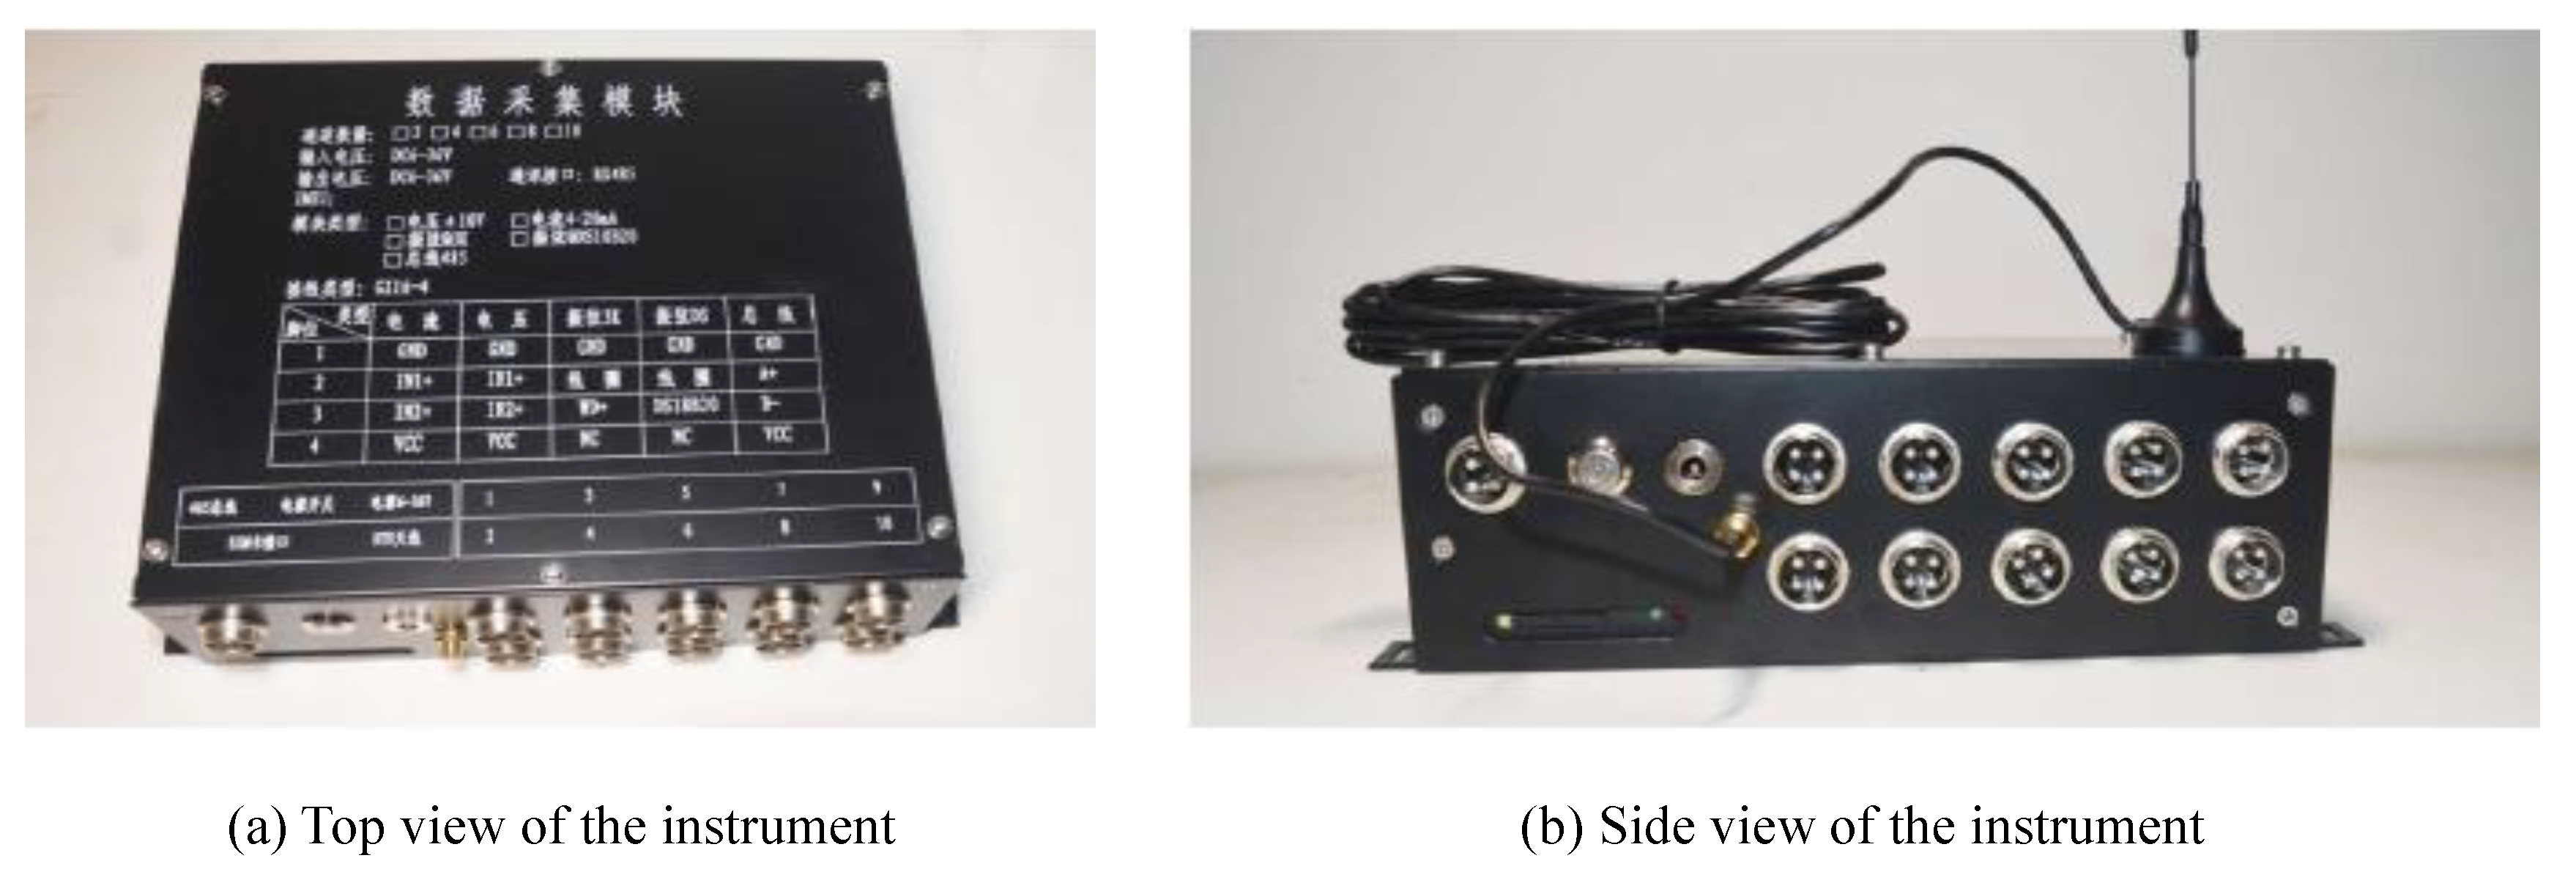
①TJMCU2-36 automatic data acquisition system. The system is produced by Changsha Taijia Electronic Technology Co., LTD. MCU2-36 channel module adopts 2-36 channel distributed design, 2-36 separate frequency and temperature channels are compatible with each other without interference. In order to improve the acquisition accuracy of frequency and temperature, 24-bit ADC is used for ADC conversion. The module system adopts moisture-proof and waterproof measures, and the design protection level reaches IP55. It can be combined with the external power supply sting to realize the power supply stability under special circumstances. The built-in GPRS data transmission module and Bluetooth module can realize the debugging and installation of mobile APP on site, and the collection, management and analysis of data at the back-end WEB and client side. The external 485 and the Internet of Things module can be better matched according to the field situation shown in
Figure 3 and
Figure 4.
- (2)
resistive sensing system
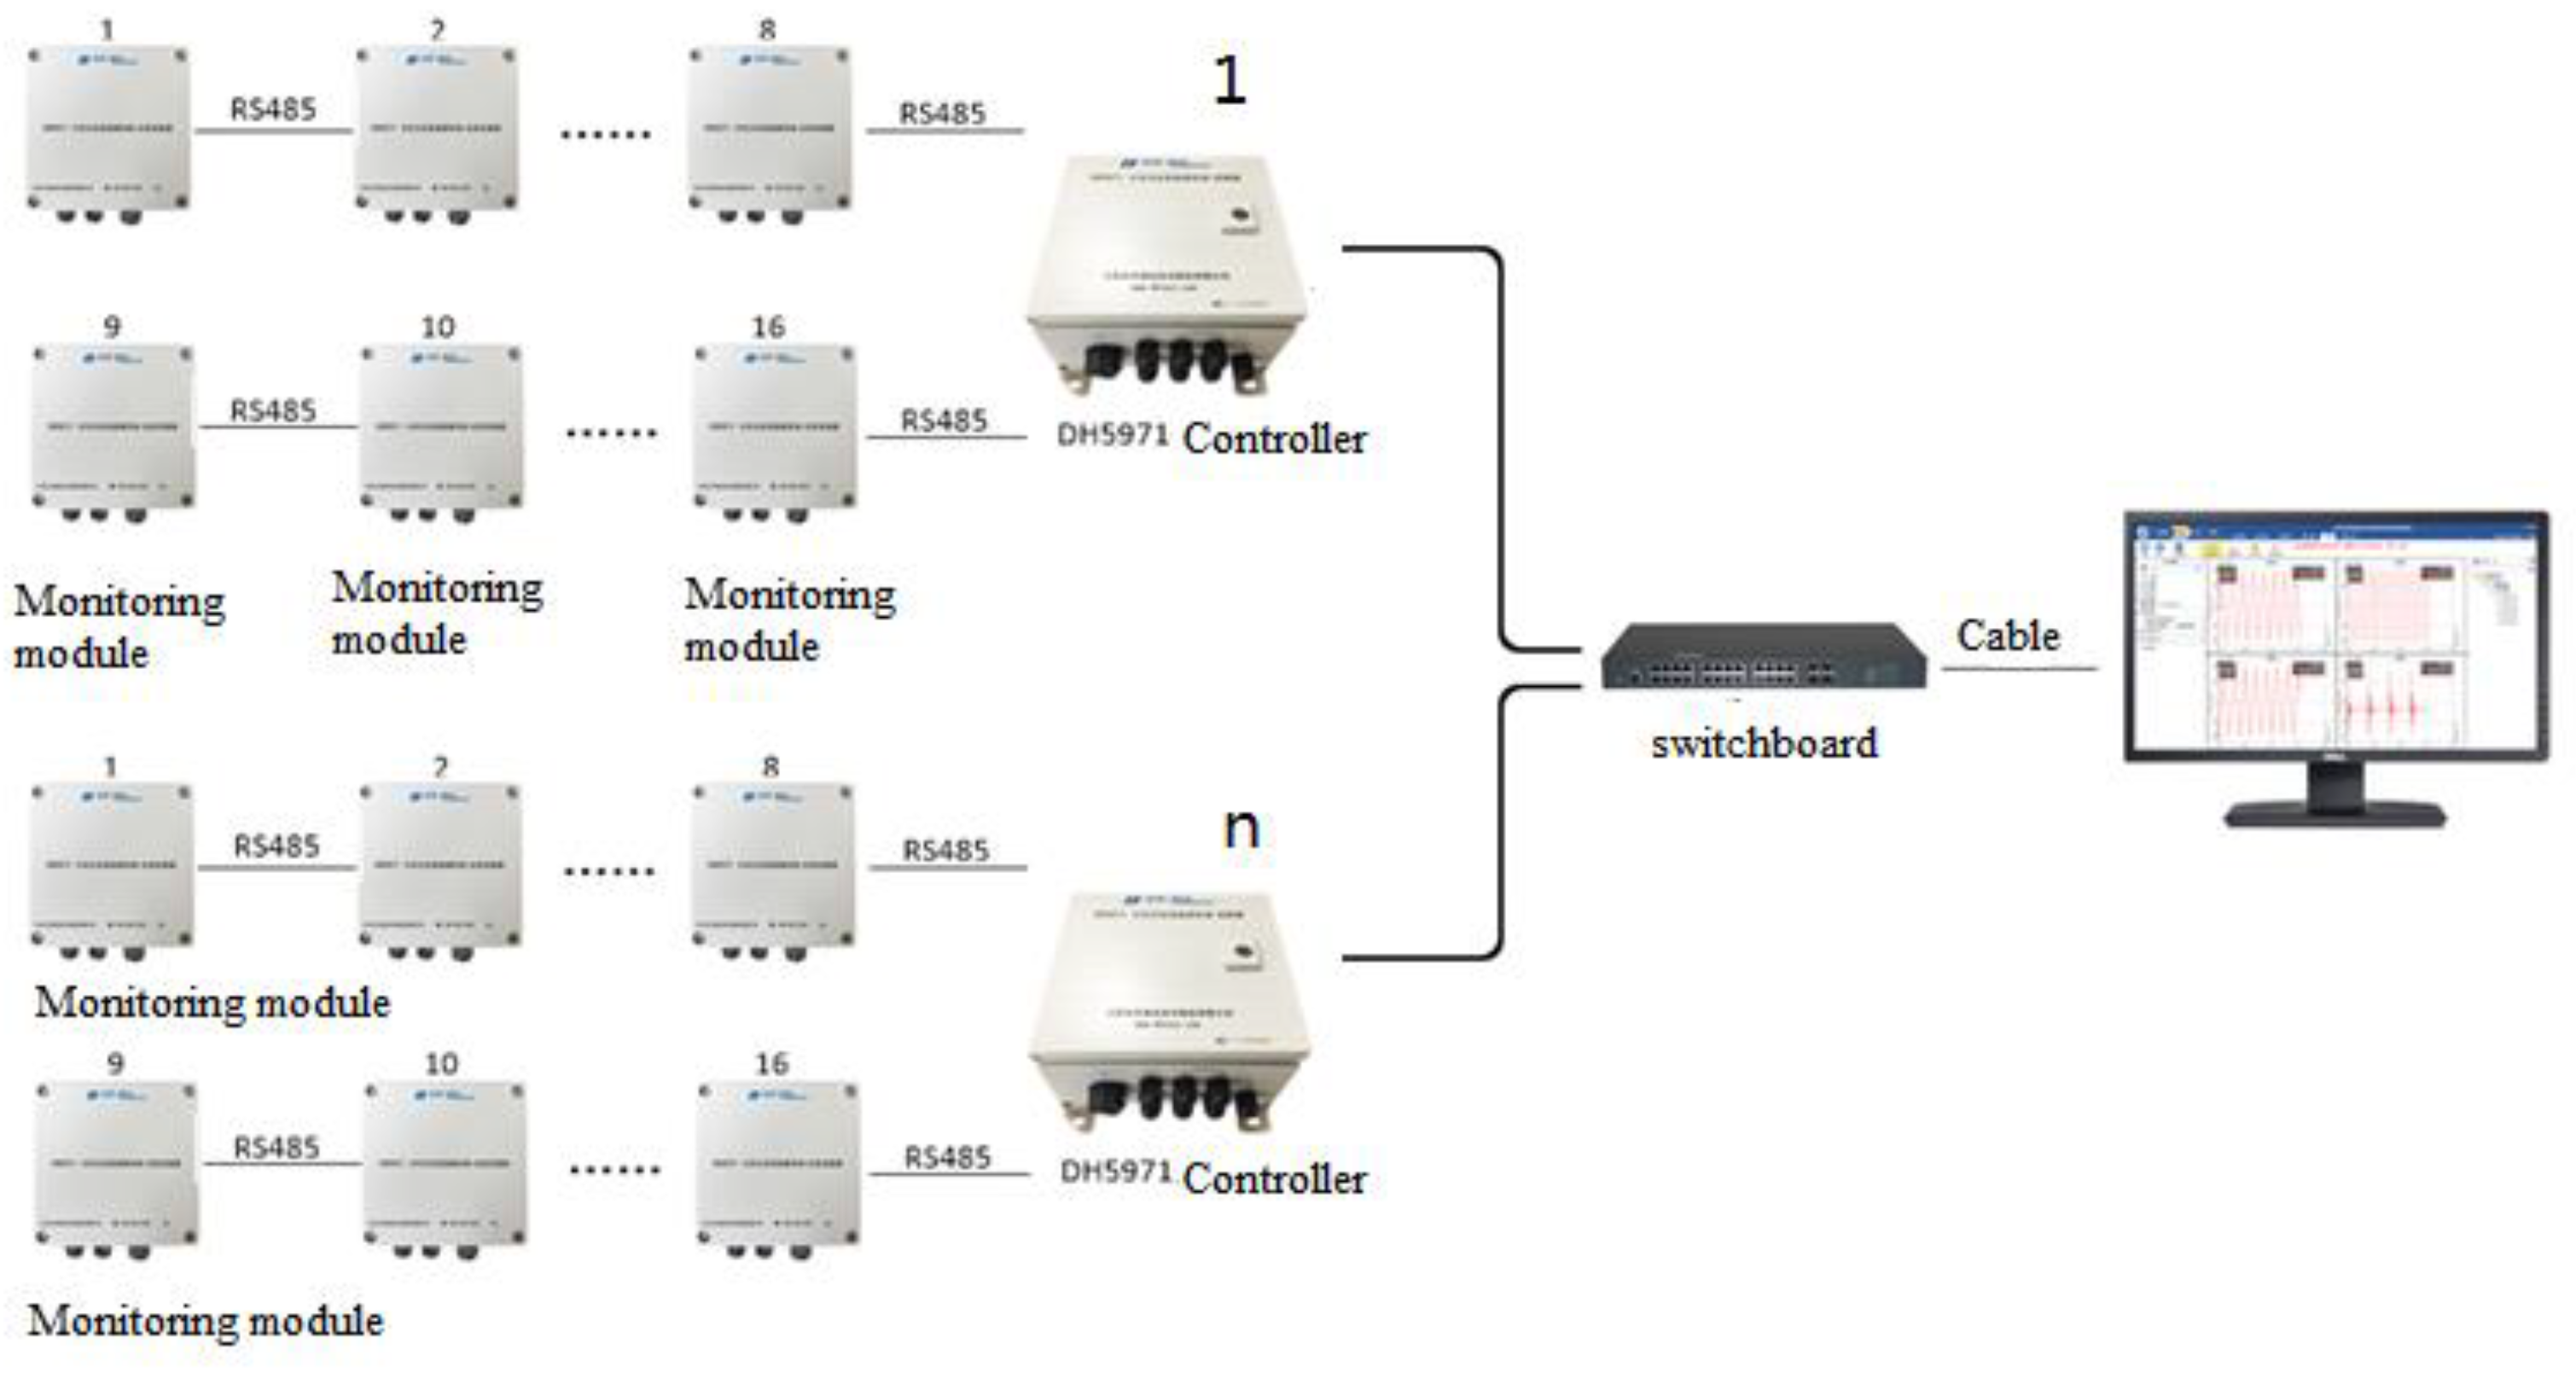
①DH5971 distributed online monitoring and analysis system. The system is produced by Jiangsu Donghua Testing Technology Co., LTD., including DH5971 acquisition controller and DH5971 strain collector. The system can realize all-weather online monitoring, and realize barrier-free connection with various types of collectors, including common strain, vibration, temperature, displacement, etc. It uses 100 Mbit Ethernet communication to connect to the computer, and can record multi-channel signals for a long time without interruption. All channels work in parallel and synchronously, and the maximum continuous sampling rate can reach 200Hz/ channel. Distributed online system mainly consists of hardware and software cooperation, starting sensor, acquisition and controller, as well as computer software, among which the collector and controller are interconnected by RS485. Generally, the controller can receive two channels of signals. Each channel can receive eight collector systems. Each collector has four ports for receiving signal inputs. The maximum synchronous sampling frequency is 200Hz shown in
Figure 5 and 6.
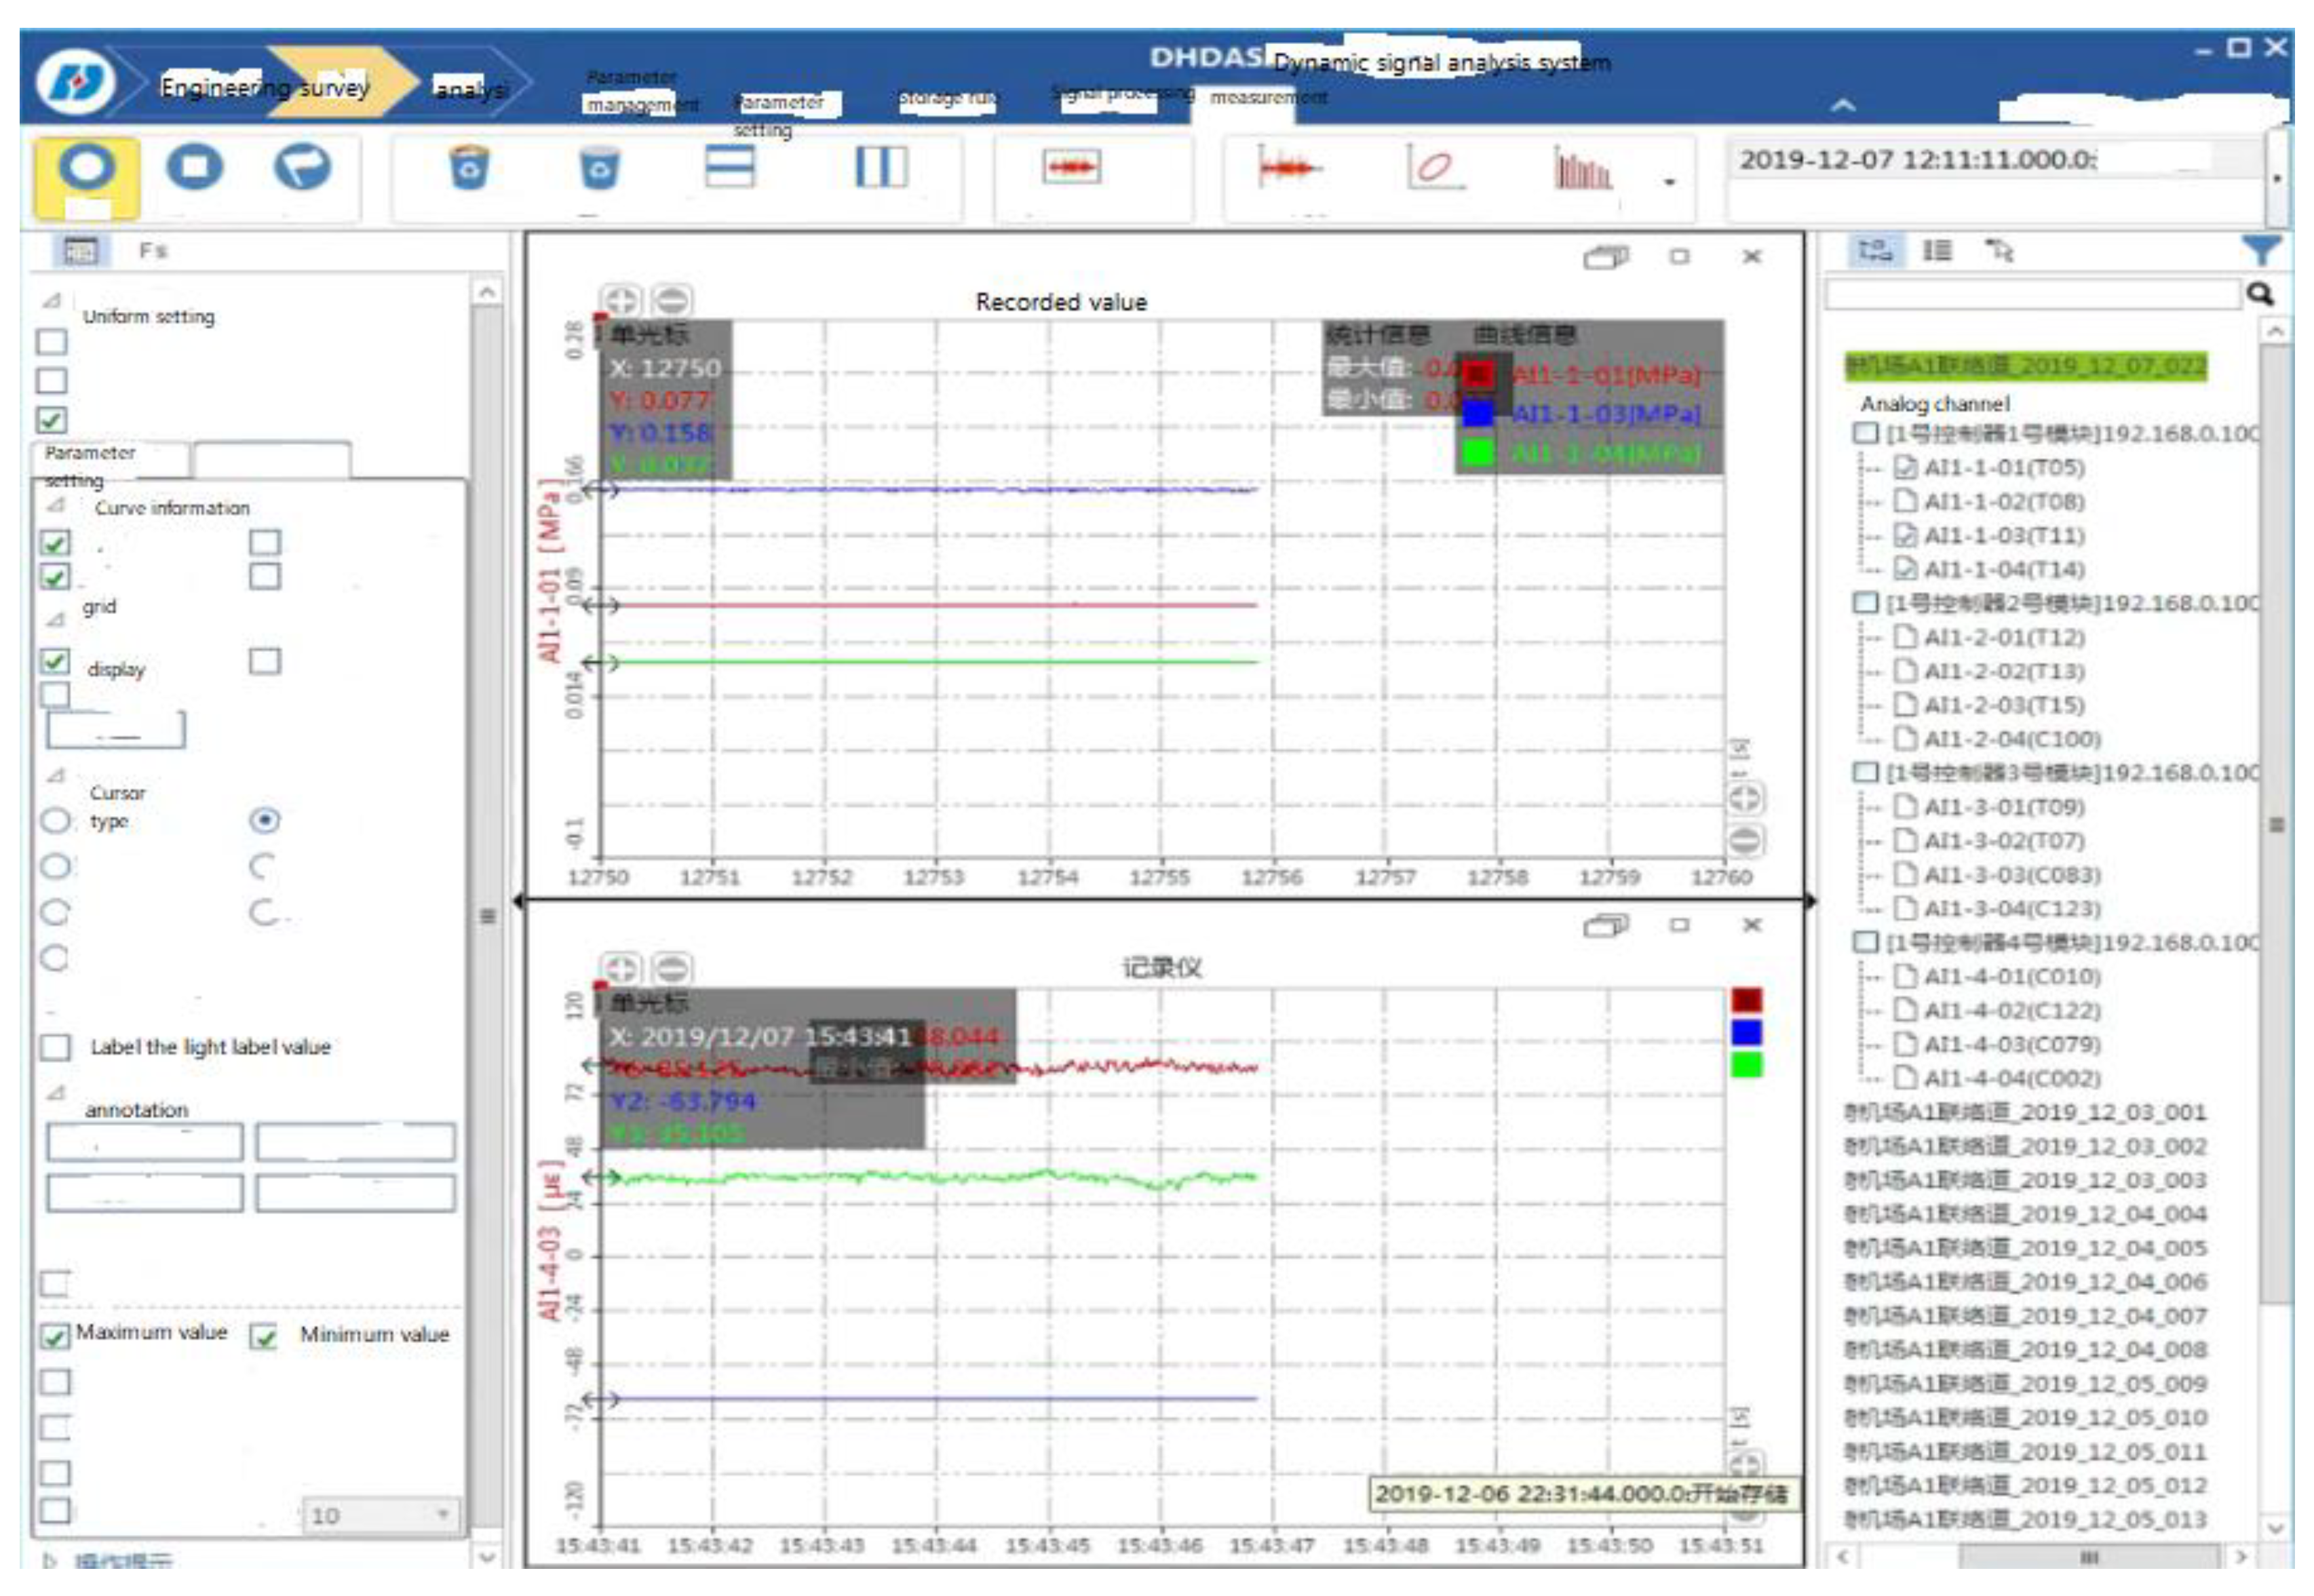
②DHDAS software. The main functions of the software are: parameter setting (setting system parameters, channel parameters, etc.), display module (cursor display, window display, graphic display, etc.), signal analysis module (data preprocessing, spectrum analysis, frequency response analysis, statistical analysis, correlation analysis, etc.), sensor calibration module (static calibration, etc.), which can be real-time online monitoring and display of measurement information. At the same time, the monitoring data can be generated in various formats for secondary analysis and processing.
DHDAS software is the medium and basic software of the data acquisition subsystem. Through searching instruments and connecting instruments, all the collected data can be displayed in real time and saved in the local server. It is a real-time display system for dynamic high-frequency monitoring data acquisition shown in
Figure 7.
3.2.3. Data storage subsystem
- (1)
Vibrating string monitoring data
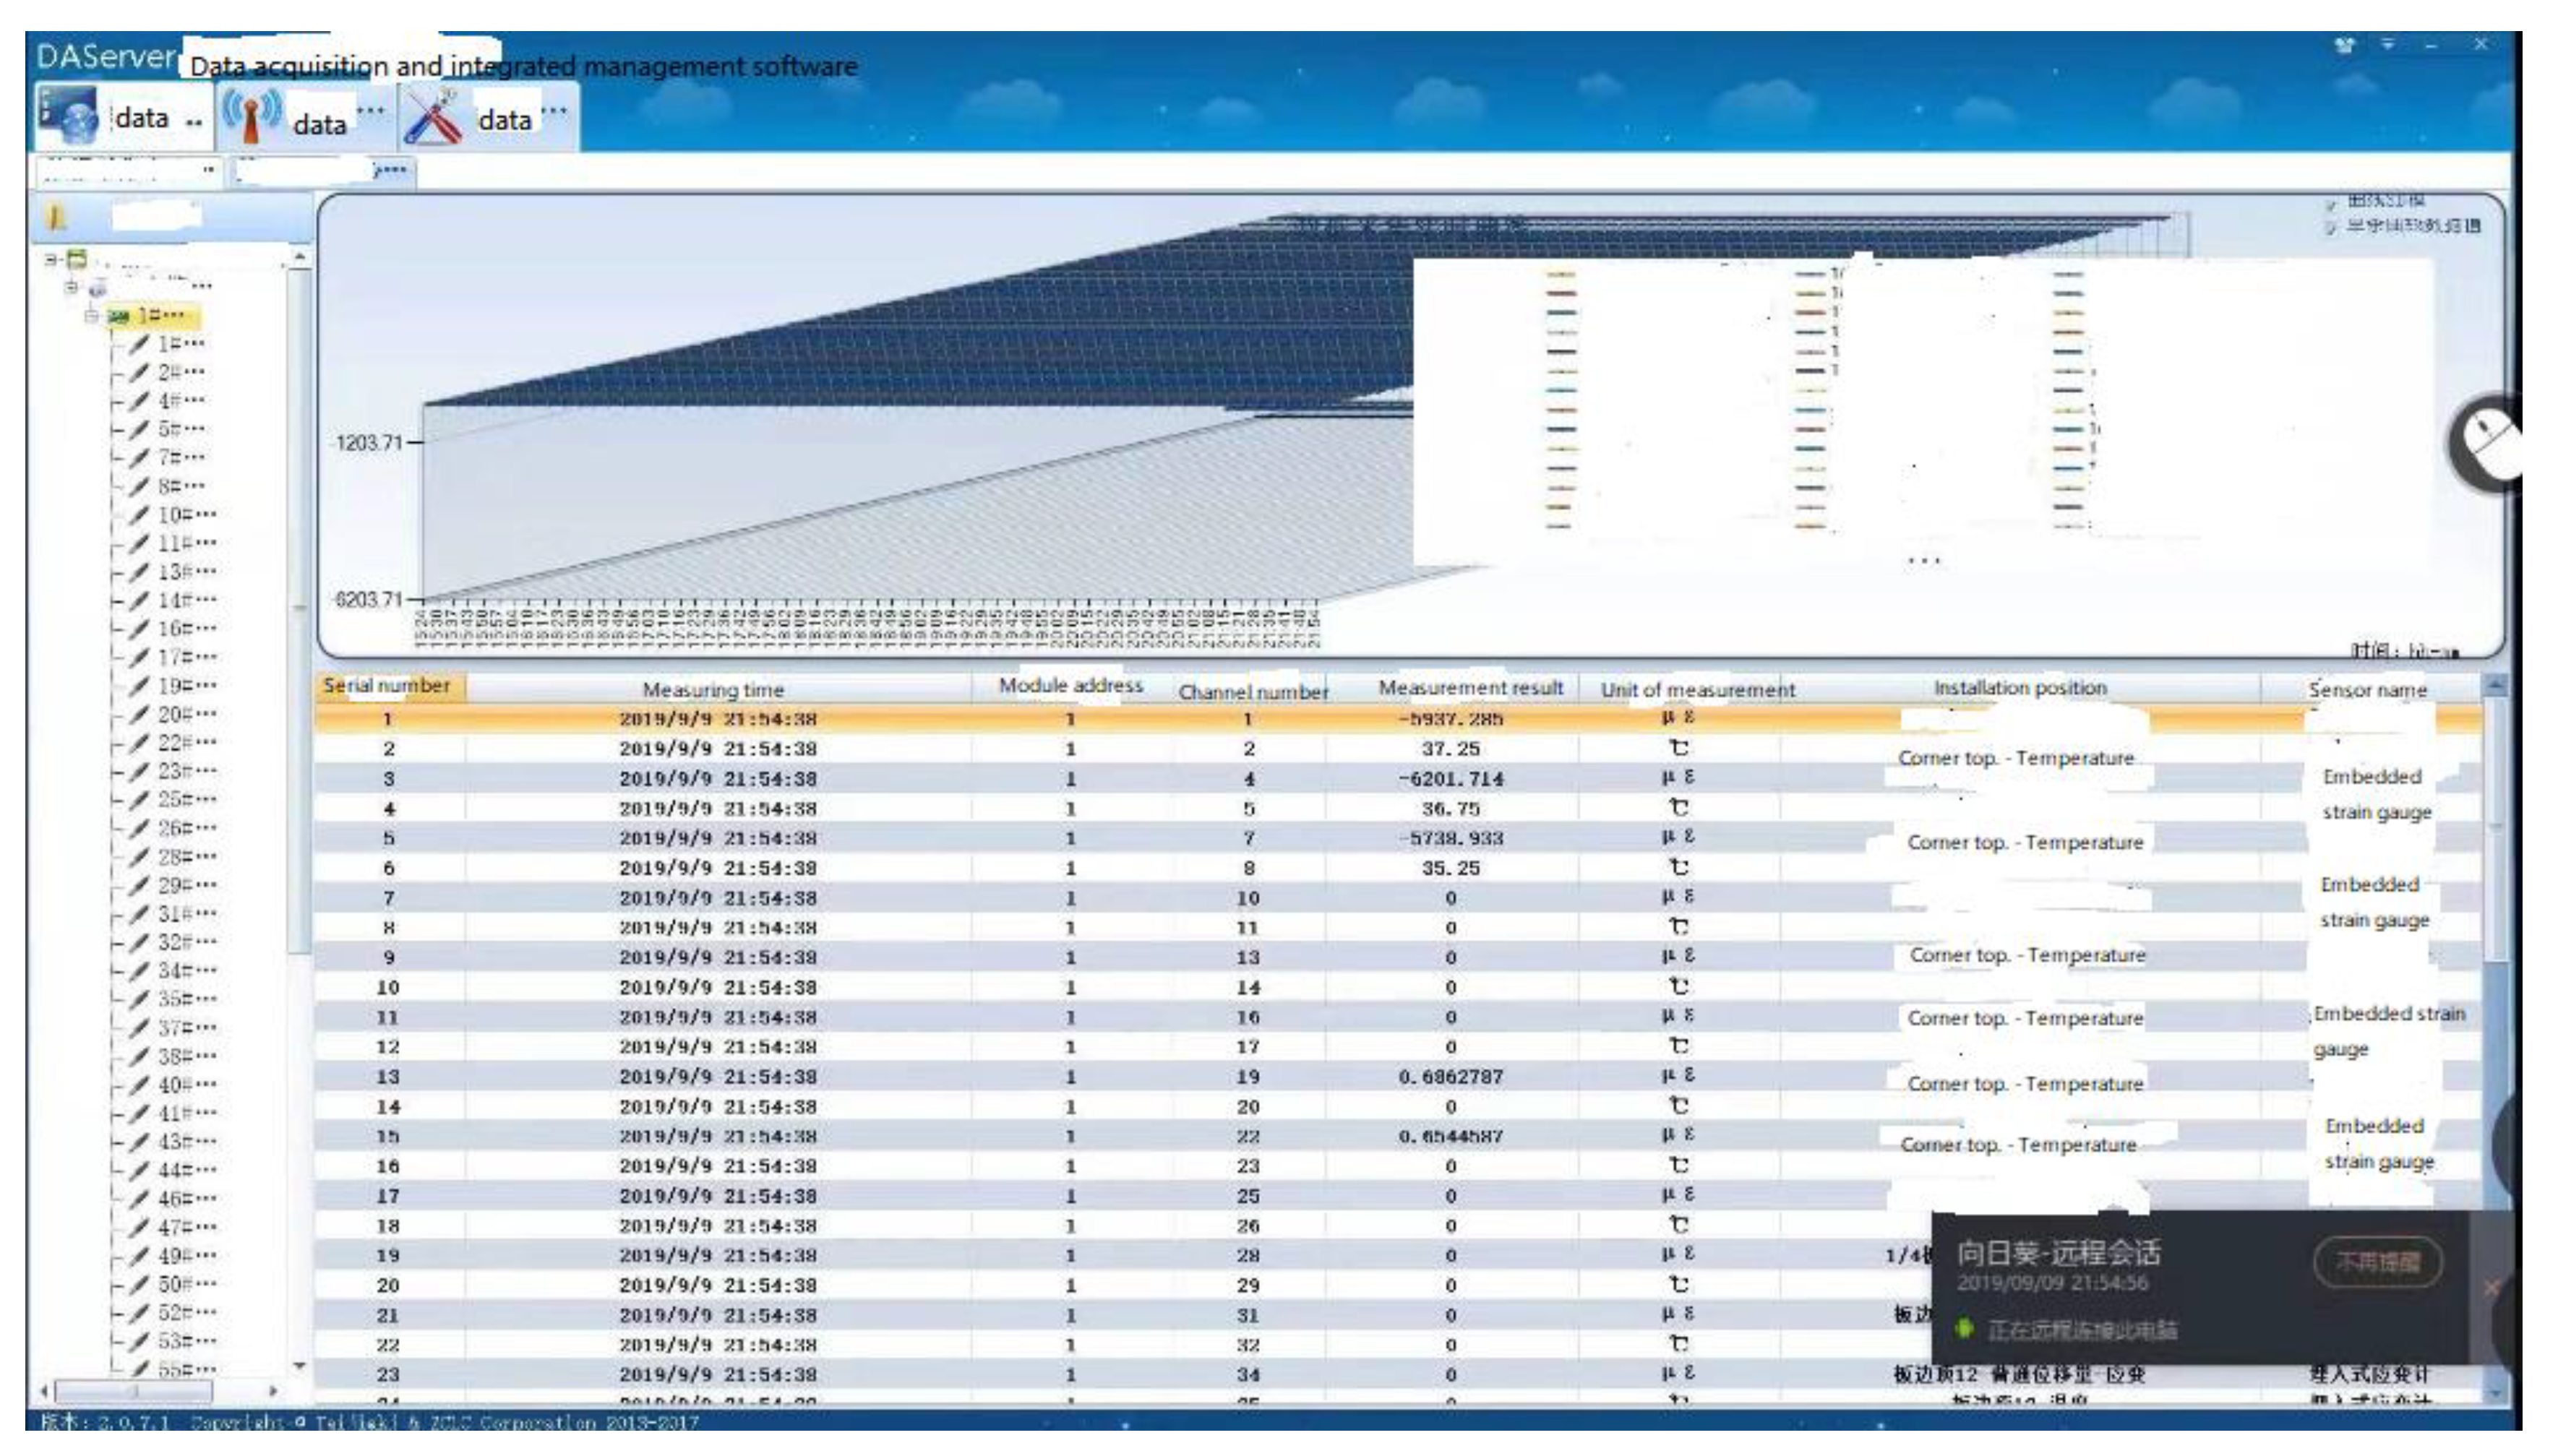
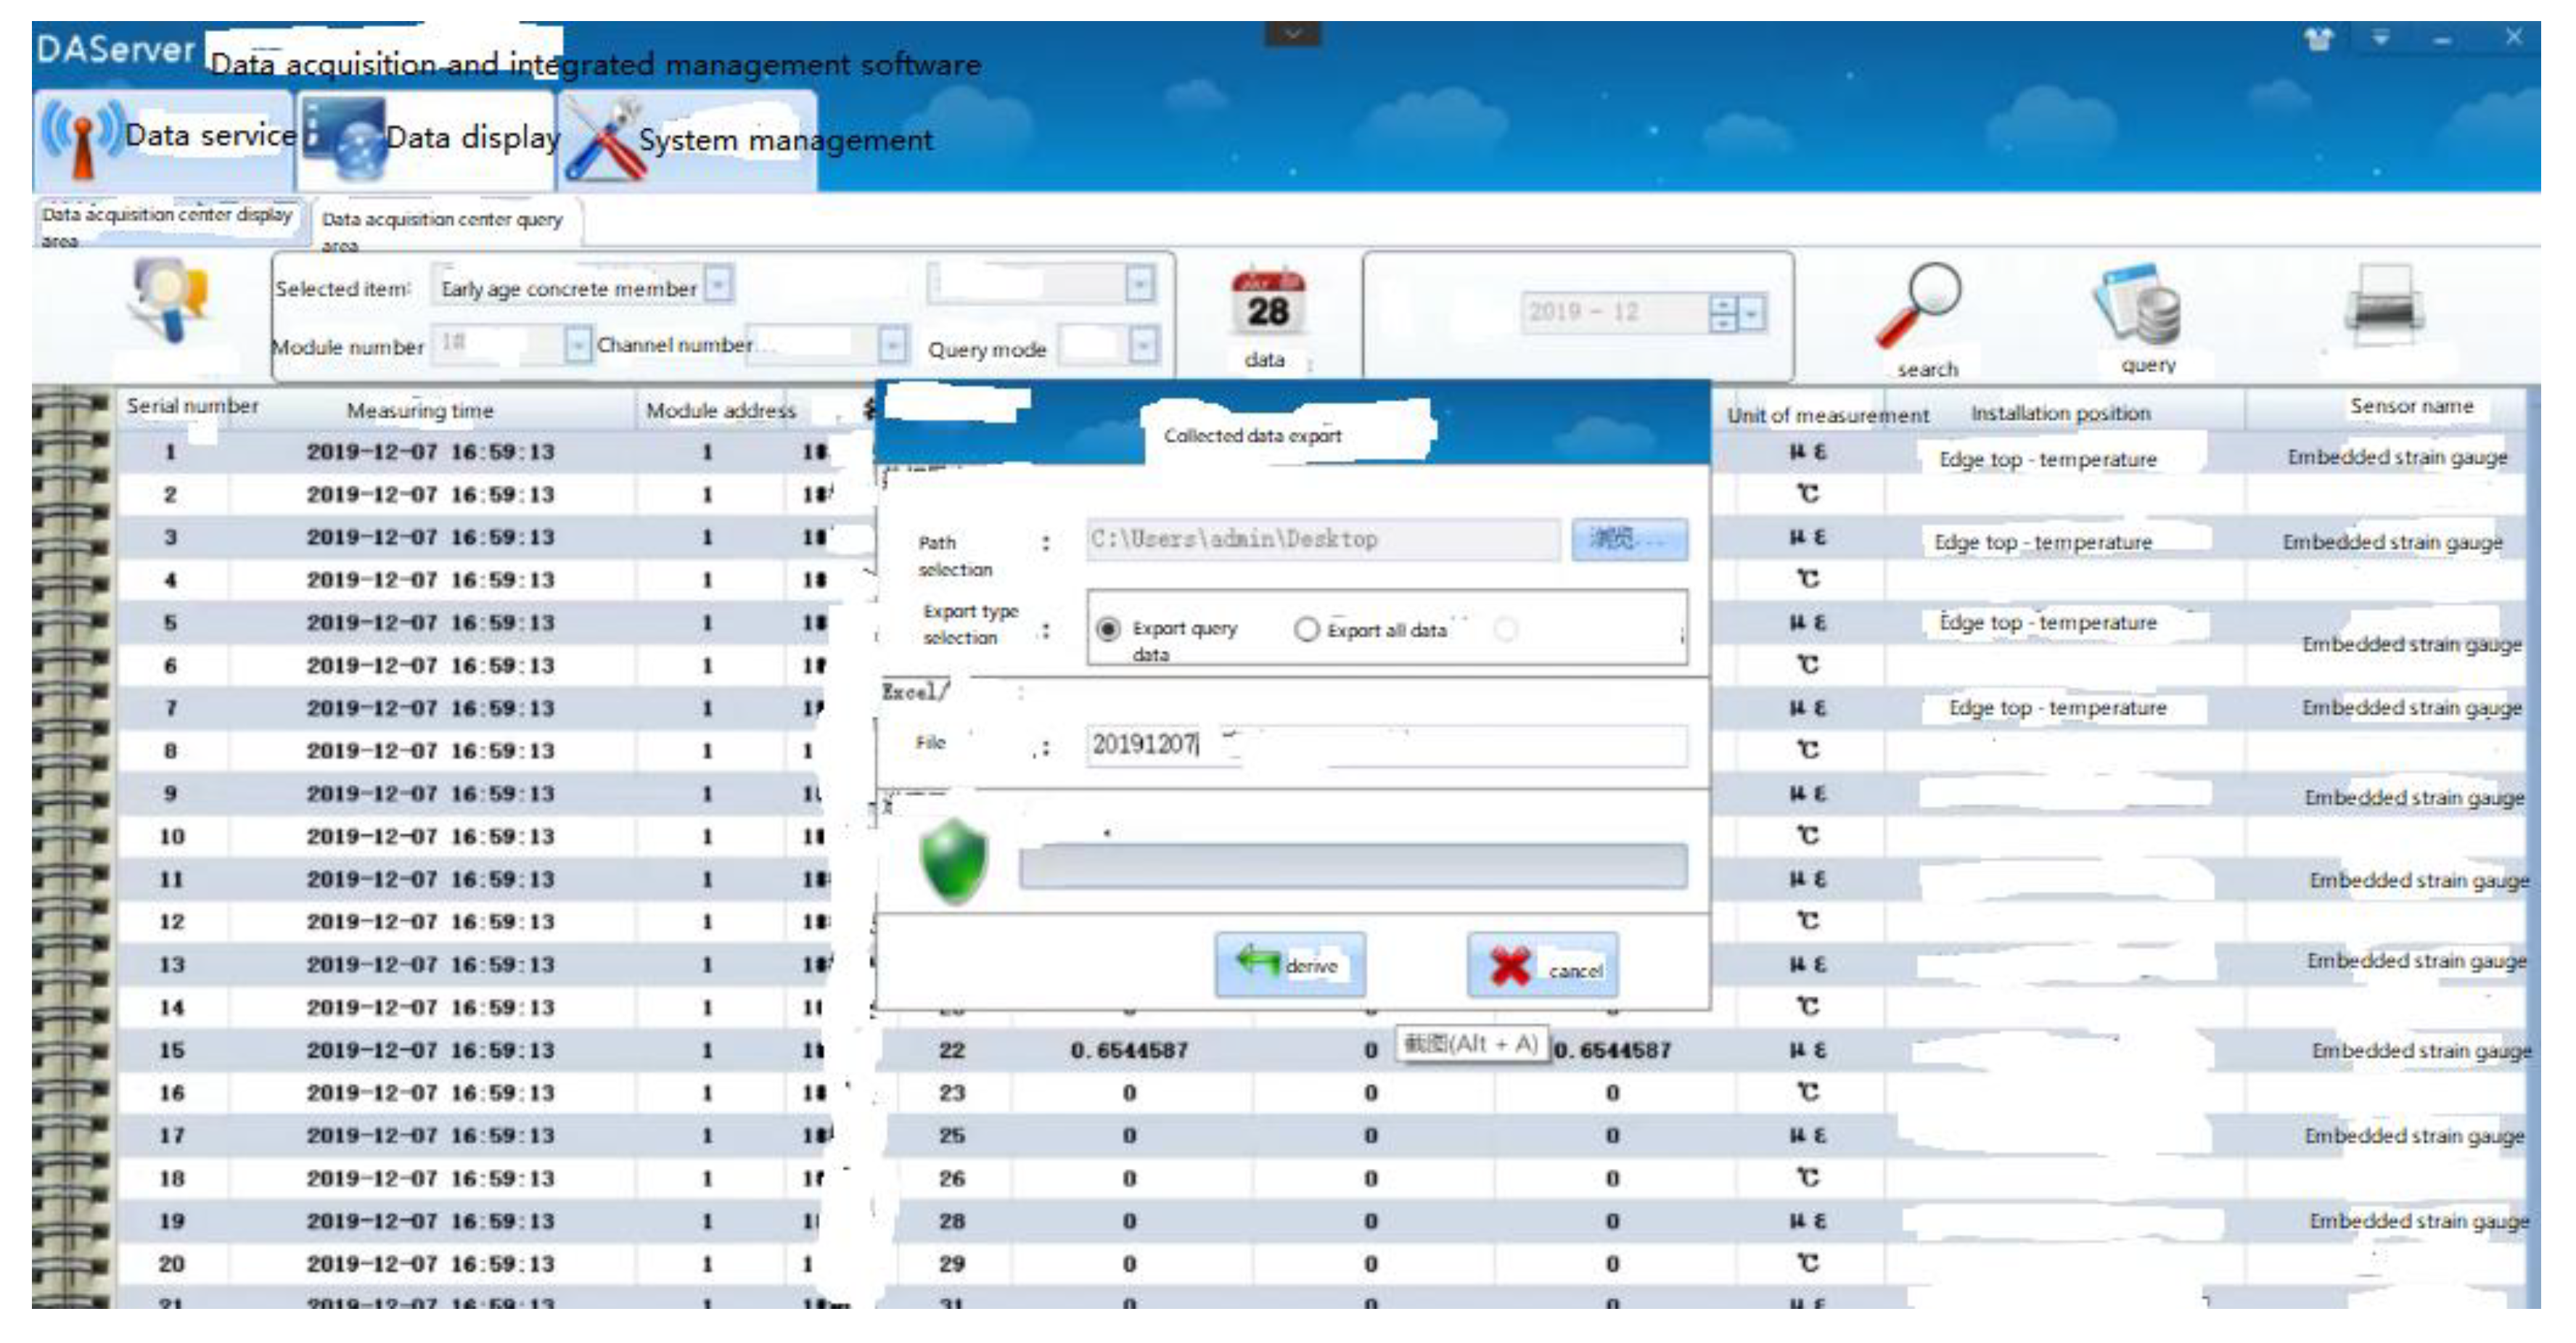
TJMCU2-36 distributed module can realize fully autonomous and automatic collection and storage of monitoring signals of connected sensors. The supporting DAServer data acquisition and integrated management software uses Access2007 database as a data storage tool. Remote display and control can be realized by installing SIM traffic 4G card in TJMCU2-36 automatic data acquisition system. Data can be recorded locally and output in Excel format or picture format shown in
Figure 8.
- (2)
resistive monitoring data
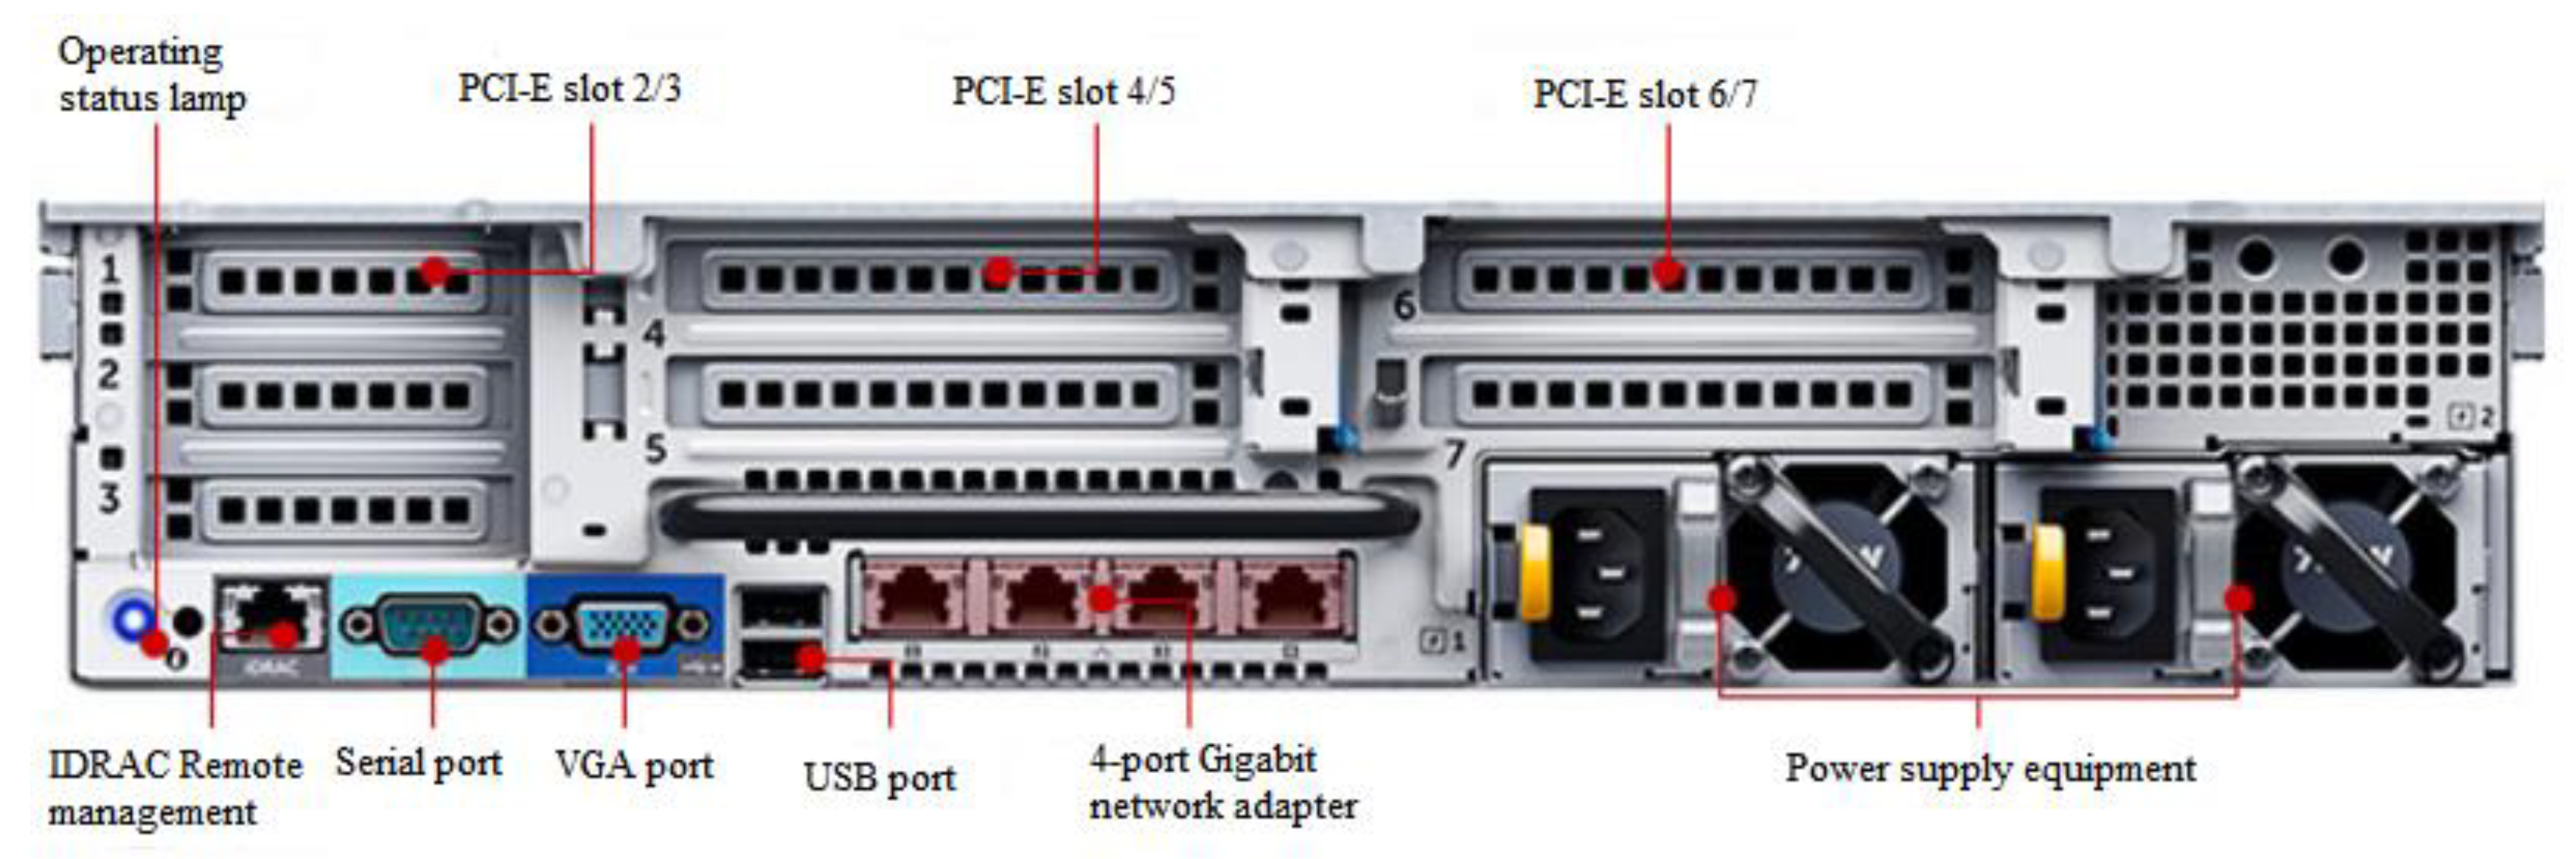
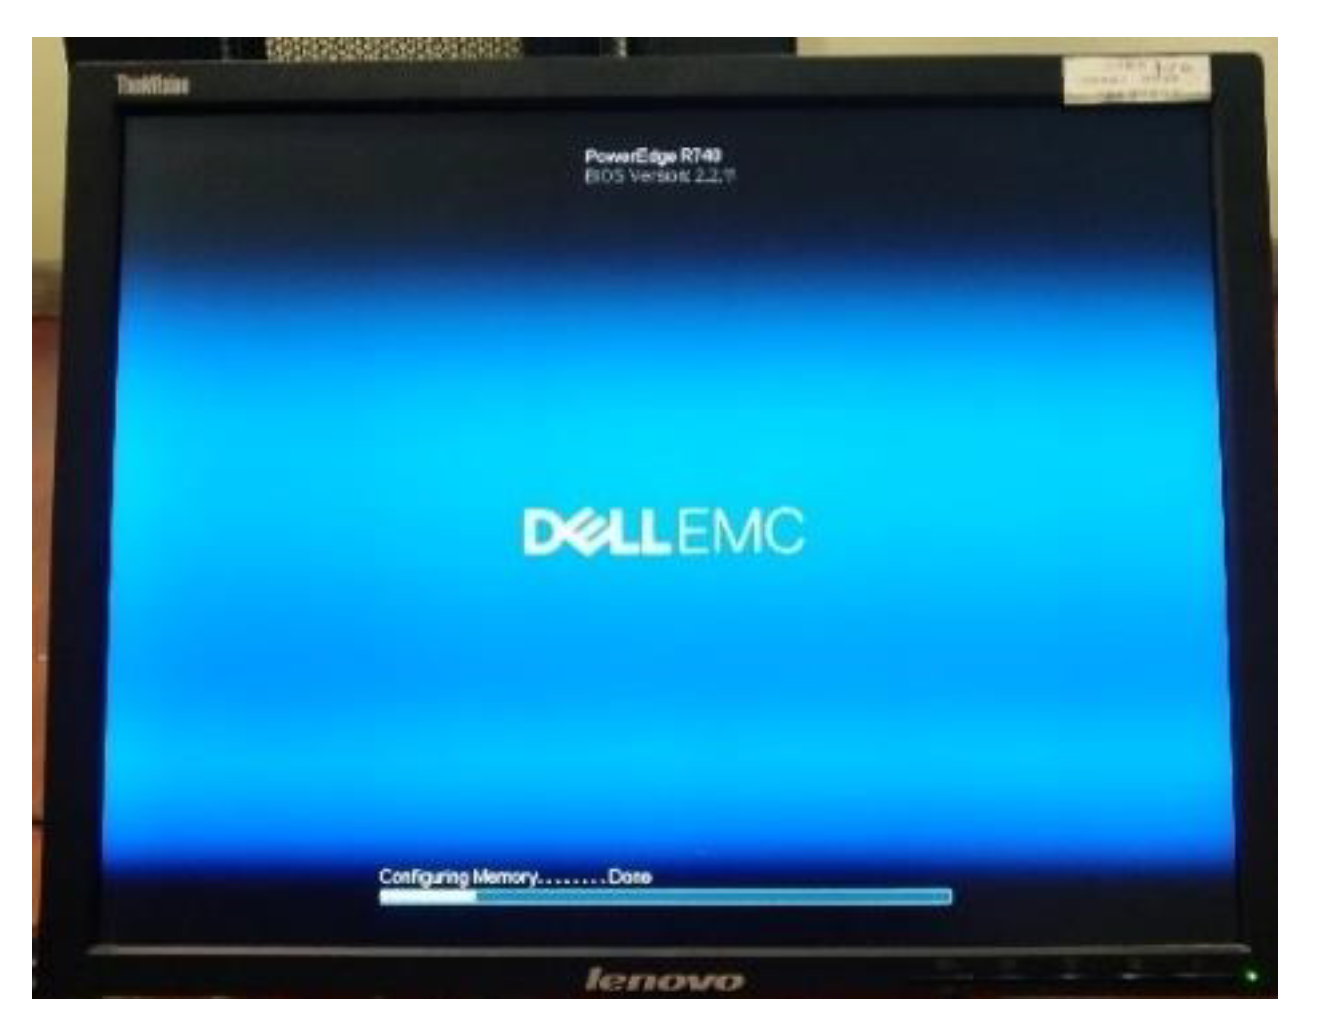
①DELL R740 rack server. In terms of hardware, the storage system uses Dell 2U rack-mounted server to store monitoring data with a sampling frequency of 100Hz. The server has dual E5-2609V4 dedicated processor, 16G running memory, 4T disk capacity, hot-swapable SAS disk type, 750W dual electric guide rail, H3330 disk array card. The drive type is DVDRW. The high-performance CPU and high scalability provide technical support and guarantee for the normal operation of the monitoring system and the storage of massive monitoring data. The monitoring data of the resistive sensor is stored in the hard disk of the server, and the data can be obtained and downloaded through the remote control of a third party shown in
Figure 9, Figure10 and
Figure 11.
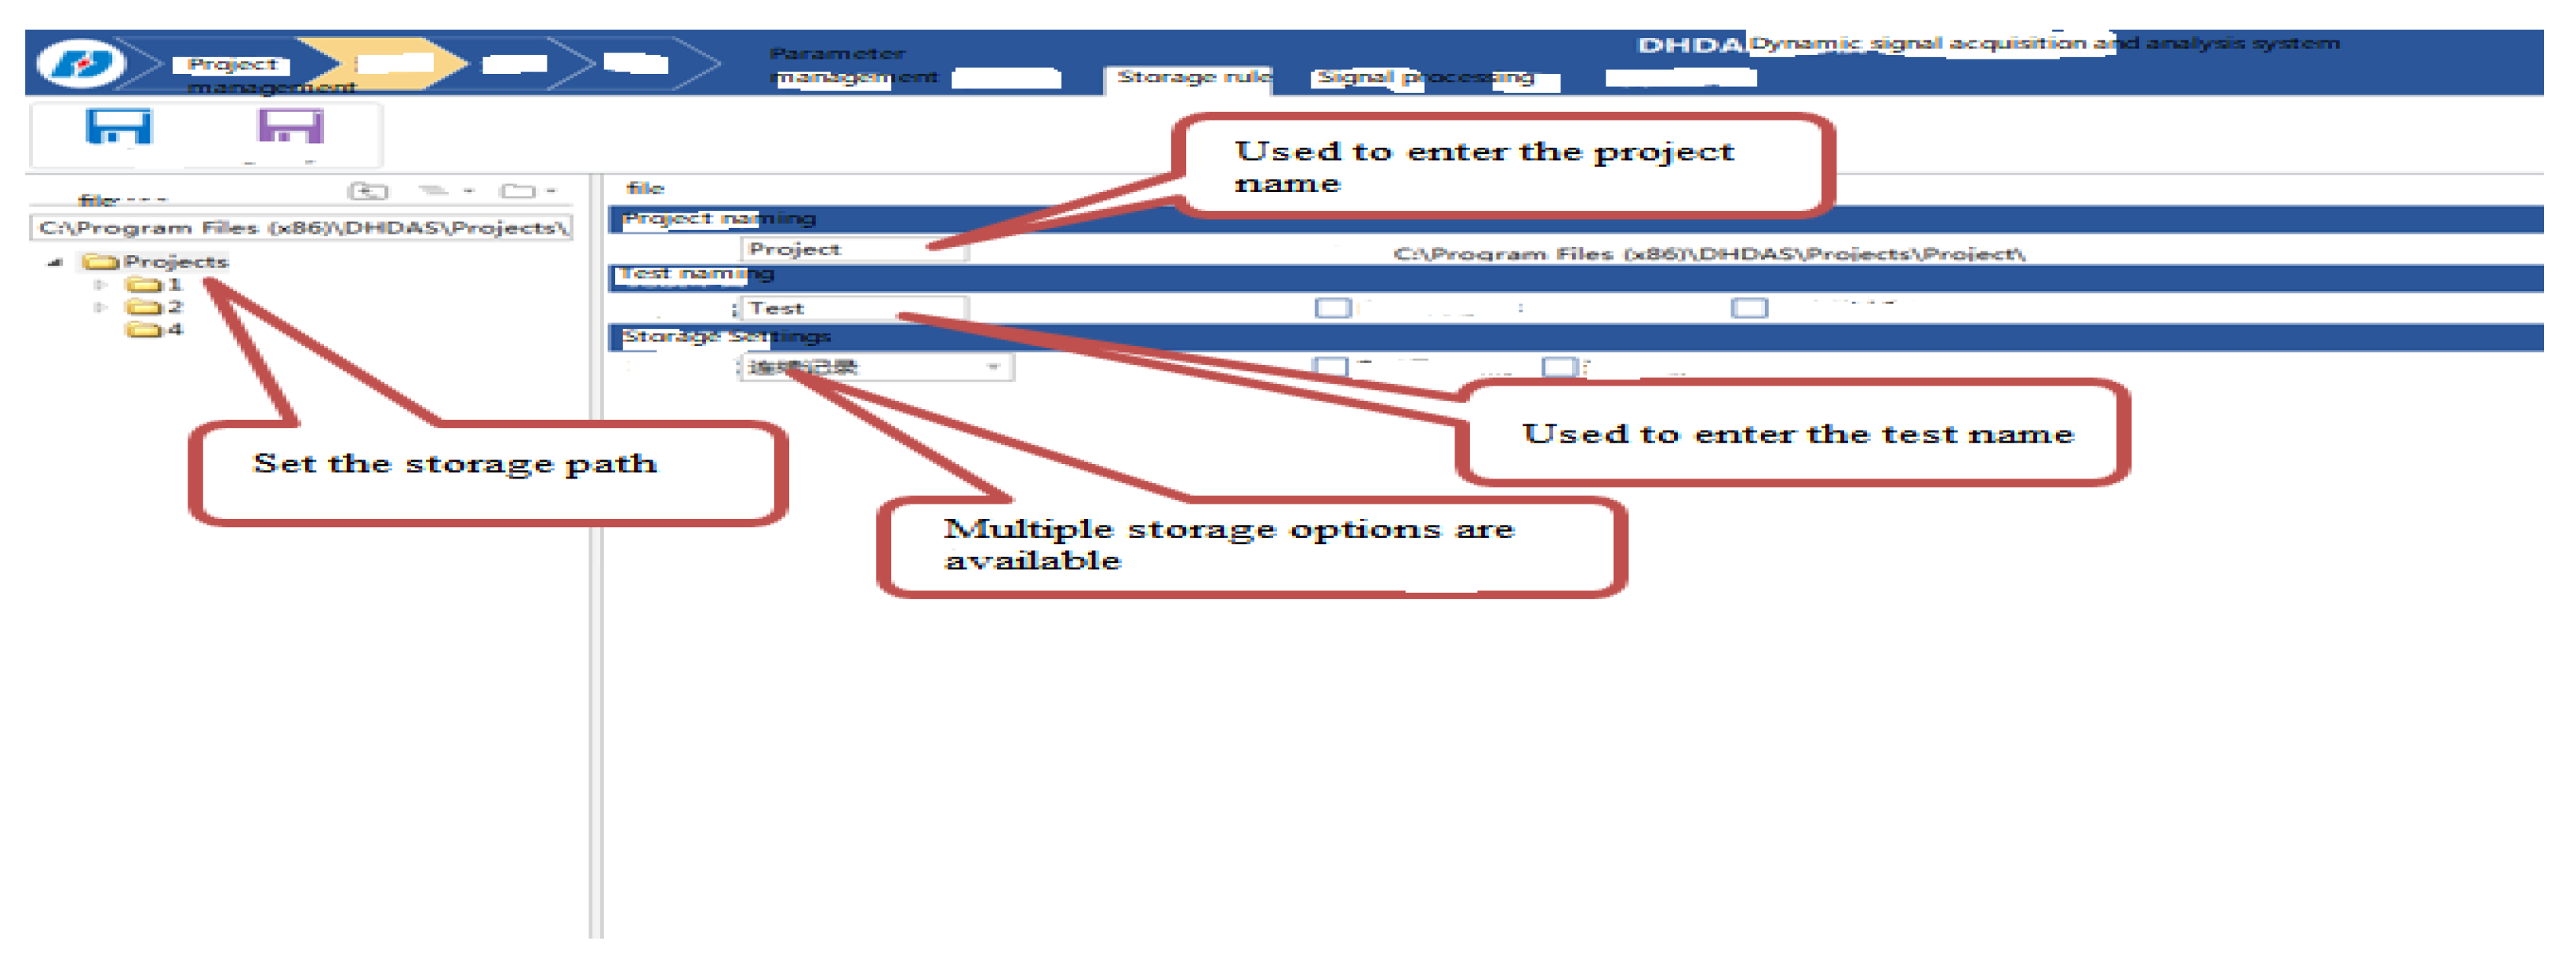
②DHDAS software. In terms of software, storage rules, storage path, storage mode, project name and test name are set on the DHDAS software. Generally, 100M is a project test file, which is saved in the local server in real time. When data, charts and reports need to be retrieved, parameters can be set and output file type can be selected. Support Excel, MATLAB, Word, picture and other formats shown in
Figure 12.
3.2.4. Data transmission subsystem
The data transmission system is mainly based on modern communication technology to realize real-time remote transmission of field monitoring data. Optional data transmission modes include 3G/4G wireless communication, fiber dedicated line communication, Beidou satellite communication, microwave base station communication, etc. Due to the large data volume and high real-time requirements of the project data, strict requirements are put forward for transmission rate, delay and accuracy. Through the comparison of transmission rate, reliability, construction and maintenance cost and other aspects, the focus is on avoiding the interference of wireless network distribution to airport signals. 3G/4G wireless communication technology is intended to be chosen as the data transmission system scheme of this system shown in
Figure 13.
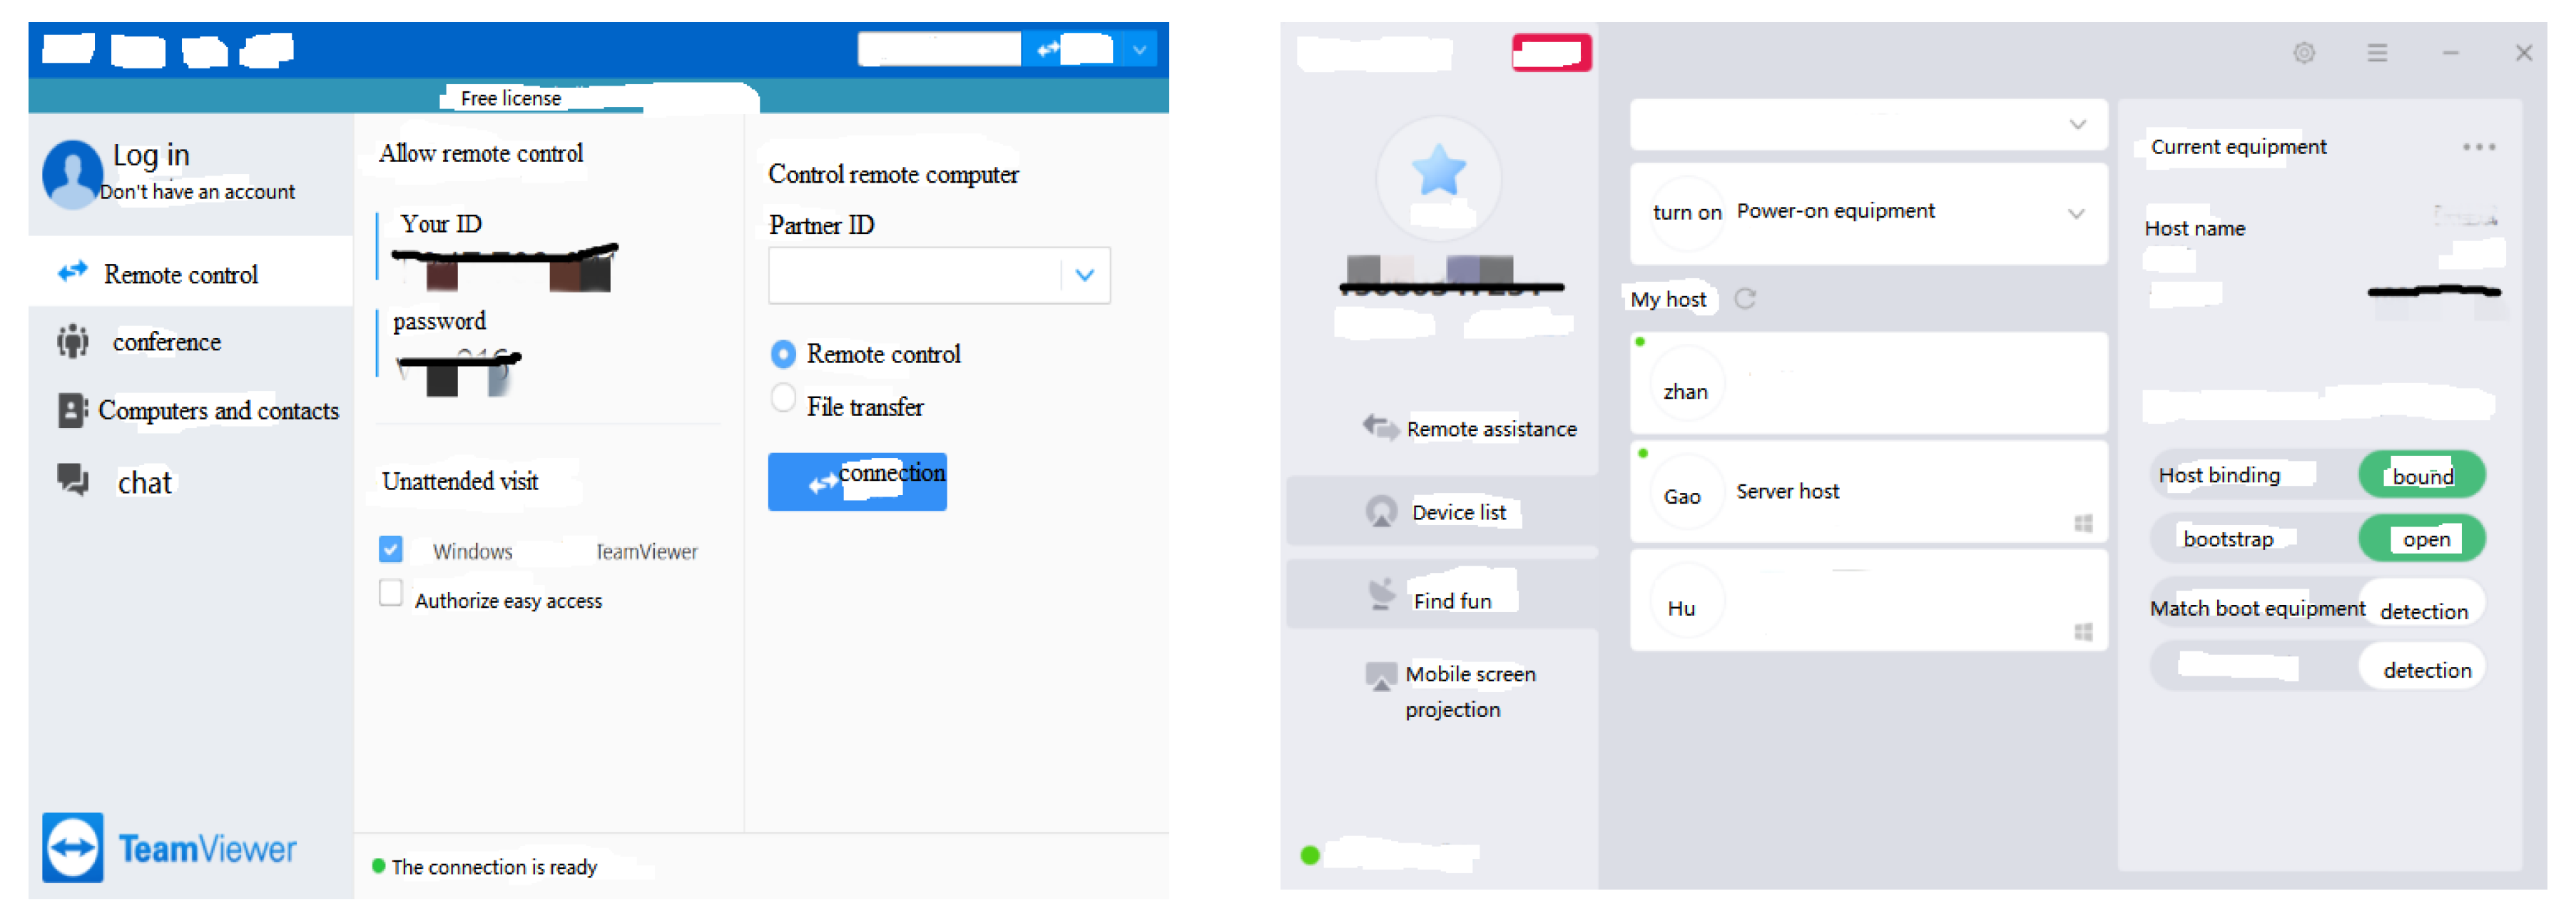
TeamViewer remote control software. The application program that can be used for remote client control can transmit and display pictures and files when the remote connection is shared. When the software is started for the first time, the partner ID can be generated on the two computers to establish the connection. The software supports remote restart, breaking the firewall restrictions. Realize remote control and data transmission download to the local operation (if necessary, through the sunflower auxiliary work) shown in
Figure 14.
3.2.5. Supporting facilities
①ThinkVision Industrial display. Industrial LCD can adapt to extreme environment, stable operation, long service life, dustproof grade of 6, waterproof grade of 8, and has anti-magnetic, shock-proof, anti-ash and other functions, the interface for VGA and AV interface, DVI digital signal interface, provide real-time display terminal for the monitoring system.
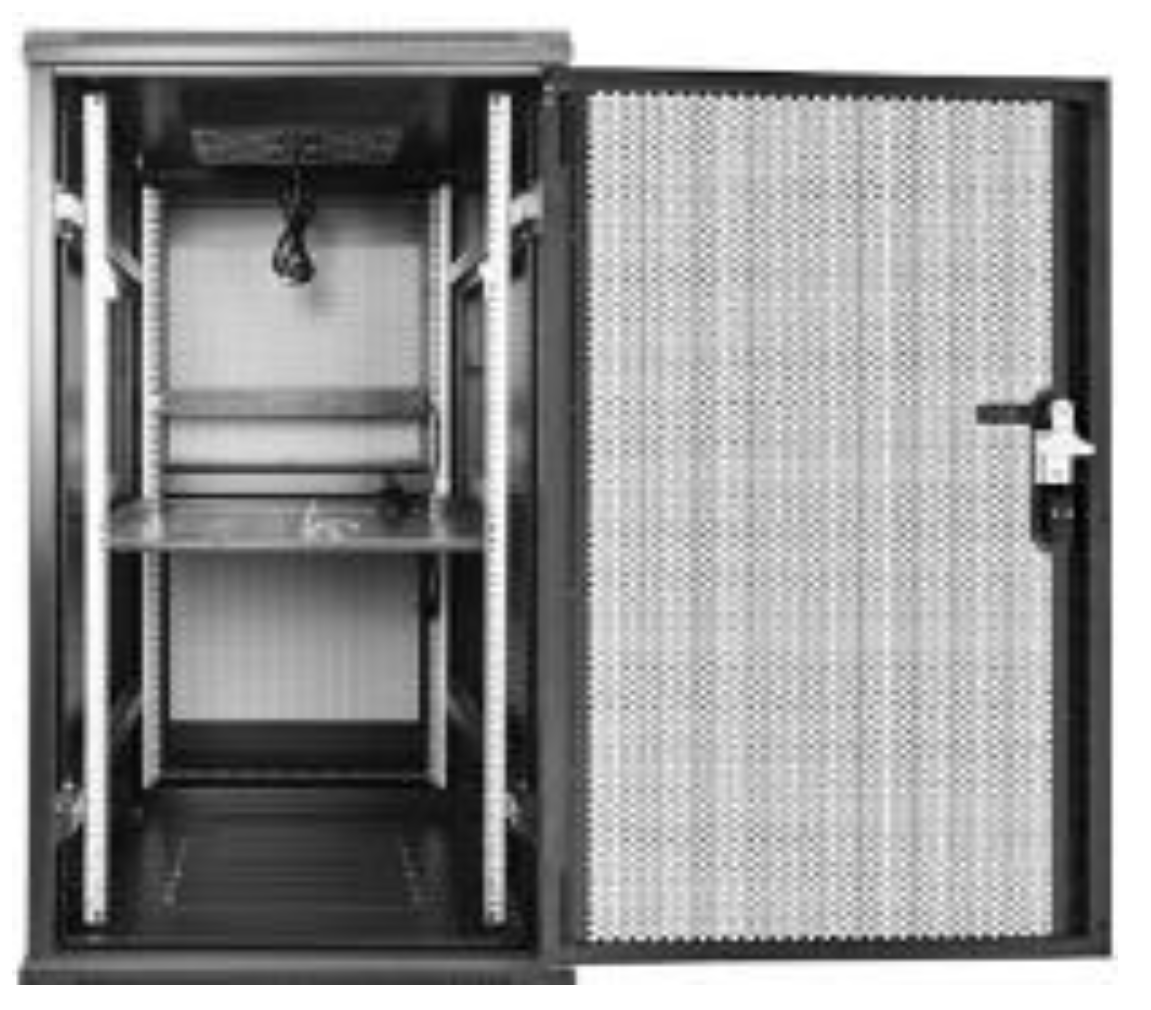
②SD-6822 Shield Guardian Cabinet. To prevent interference from the external environment to the collection devices and prevent the running temperature of the host server from being too high, the cabinet can effectively protect and cool the collection devices and ensure the normal operation of the monitoring system. The cabinet adopts SPCC thickened cold-rolled steel plate technology, equipped with cooling fan at the top, wiring groove at the bottom, convenient line security, easy to disassemble, stable structure, strong corrosion resistance, surface skim electrostatic spray shown in
Figure 15 and
Figure 16.
4. Discussion
The airport pavement condition monitoring and sensing system designed in this chapter is based on 4G wireless communication technology, breaking the technical barriers among network transmission, sensor terminal, collection and demodulation equipment, server storage and remote client display, and forming a replicable, highly stable, highly anti-interference, automatic, intelligent, integrated and networked remote monitoring technical scheme. The high and low frequency monitoring method can capture the mechanical behavior of each stage of the track surface and help the stable operation of airport traffic facilities.
According to a survey conducted by Keithlley Company in 1999, 60% of engineers intend to use remote monitoring technology in future applications. Intelligent monitoring technology is of great value to the development of civil engineering discipline. China has accumulated a lot of monitoring experience after the 21st century, but it is still not mature. In the era of 5G Internet of Things, the status monitoring and perception system will usher in new opportunities:
- (1)
The scale of the current monitoring system varies greatly, and whether the monitoring scale and effect reach the standard is still a mystery. A set of standard standards should be formed for intelligent monitoring of civil engineering industry.
- (2)
Most monitoring systems are still stand-alone versions, and the compatibility and scalability of data interfaces and formats of each system are poor, so computer technology and electronic technology should be developed in tandem.
- (3)
The low latency (millisecond delay) of 5G network enables the monitoring system to have richer development space in data transmission, which can be expanded successively in the aspects of threshold warning and automatic alarm, and can even introduce AR (virtual reality) technology for auxiliary observation.
- (4)
In terms of remote real-time online display, the addition of 5G technology can upgrade "Airport pavement condition monitoring and perception system" into "airport pavement condition monitoring intelligent system". Through the slow live broadcast of 4K video (external visual information), the measured mechanical response state of the track panel (structural microscopic deformation and damage identification), 3D simulation (finite element simulation real-time comparison and verification), to achieve the integration of online and offline.
5. CONCLUSION
The summary is as follows:
The monitoring system is composed of four subsystems, including the sensor subsystem, data acquisition subsystem, data storage subsystem, and data transmission subsystem. The sensor subsystem is responsible for sensing the mechanical deformation and other related parameters of the airport runway. The data acquisition subsystem is responsible for processing and converting the sensor signals. The data storage subsystem is responsible for storing and filtering the measurement data. The data transmission subsystem is responsible for transmitting the data to the remote monitoring center.
The monitoring system adopts a modular design approach to improve the scalability, reliability, and efficiency of the system. The system can be easily expanded or upgraded to meet the changing monitoring requirements of the airport runway.
The monitoring system architecture design includes the selection of vibration and resistance sensors, data acquisition, and transmission modules, as well as server storage and communication protocol design. The entire system architecture design ensures reliable, accurate, and continuous monitoring of the airport runway.
Overall, the track status monitoring and perception system is designed to provide accurate and reliable information about the condition of airport pavements. The system integrates several new technologies such as wireless communication, sensor technology, and server storage to provide real-time and continuous monitoring of the airport runway. The system also includes safety measures to ensure the stability and safety of the monitoring system. The monitoring system is designed to provide valuable information to improve the design and maintenance of airport runways in the future.
Author Contributions
[Yong Luo]; Methodology: [Yong Luo]; Formal analysis and investigation: [Yong Luo]; Writing-original draft preparation: [Yong Luo]; Writing - review and editing: [Yong Luo]; Resources: [Yong Luo]; Supervision: [Mustafasanie M Yussof ]. All authors have read and agreed to the published version of the manuscript.
Funding
This study was funded by 2021LK11 Smart construction Engineering Center project, Analysis and research on Influencing factors of special concrete mix design, Fujian Forestry Vocational & Technical College, Nanping 353000, China.
Conflicts of Interest
The authors declare no conflict of interest.
References
- George Schwandt. Airport Pavement Management System Saves Millions[M]. Public Works, 1996, 127, 53–55.
- Navneet Garg. David Brill. Murphy Flynn. Field Instrumentation and Testing[C].FAA Worldwide Airport Technology Transfer Conference, 2010.
- Navneet Garg. Instrumentation Projects at Airports[C]. FAA Working Group Meeting, 2013.
- Raymond, s. Rollings. Field Instrumentation and Performance Monitoring of Rigid Pavements[J]. Journal of Transportation Engineering, 1992, 118, 361–370. [Google Scholar]
- Mingyao Dong, Gordon G.F. and Yingwu Fang. Runway Instrumentation at Denver International Airport Sensor Data Processing[J]. ASCE Aircraft/Pavement Technology In the Midst of Change, 1997.
- Edward, H. Guo. Critical Gear Configuration and Position for Rigid Airport Pavements Observations and Analysis[J]. Pavement Mechanics and Performance. ASCE 2006.
- Lev Khazanovich. Experimental Design For Large-scale Testing of Unbonded PCC Overlays at NAPTF[C]. FAA Airport Technology Transfer Conference, 2004.
- David, R. Brill. FAA Rigid Pavement Instrumentation at Atlanta Hartsfield-Jackson International Airport[C]. FAA Worldwide Airport Technology Transfer Conference, 2007.
- Steve Pennington. Instrumentation During APM Construction at Dulles International Airport[C]. Seventh International Symposium on Field Measurements in Geomechanics. ASCE2007.
- Statistical Extreme Value ANC Taxiway Centerline Deviations for 747Aircraft[R]. FAA/Boeing Cooperative Research and Development Agreement 01-CRDA-0164.
- Statistical Extreme Value Analysis of JFK Taxiway Centerline Deviations for 747 Aircraft[R]. FAA Boeing Cooperative Research and Development Agreement 01-CRDA-0164.
- Mazzoli, A. Monosi S. Plescia ES. Evaluation of the Early-age-shrinkage of Fiber Reinforced Concrete (frc) Using Image Analysis Methods[J]. Construction & Building Materials 2015, 101, 596–601. [Google Scholar]
- Ruiz, JM. Rasmussen RO. Chang GK. Dick JC. Nelson PK. Ferragut TR. Computer-based Guidelines for Concrete Pavements Volume I-project Summary[R]. [S.l.]: [s.n.], 2005.
- Ruiz, JM. Rasmussen RO. Chang GK. Dick JC. Nelson PK,Schindler AK. Turner DJ. Wilde WJ. Computer-based Guidelines for Concrete Pavements, Volume Iii: Technical Appendices[R]. [S.l.]: [s.n.], 2006.
- Hiller, JE. Roesler JR. Determination of Critical Concrete Pavement Fatigue Damage Locations Using Influence Lines[J]. Journal of Transportation Engineering 2005, 131, 599–607. [Google Scholar] [CrossRef]
- W. Hansen. Y. wei. D. l. smiley. Y. peng. E. a. jensen. Effects of Paving Conditions on Built-in Curling and Pavement Performance[J]. International Journal of Pavement Engineering 2006, 7, 291–296. [Google Scholar] [CrossRef]
- Kim, SK. Ceylan HC. Smoothness Variations in Early-age Jointed Plain Concrete Pavements[J]. Canadian Journal of Civil Engineering 2008, 35, 1388–1398. [Google Scholar] [CrossRef]
- Ceylan, H. Kim S. Gopalakrishnan K. Initial Smoothness of Concrete Pavements Under Environmental Loads[J]. Magazine of Concrete Research 2007, 59, 599–609. [Google Scholar]
- J r roesler. D wang. An analytical approach to computing joint opening in concrete pavements[J]. Pavement cracking : mechanisms, modeling, detection, testing and case histories. 2008, 31-42.
- Andrade, C. Sarra J. Alonso C. Relative humidity in the interior of concrete exposed to natural and artificial weathering [J]. Cement and concrete research, 1999; 29, 1249–1259. [Google Scholar]
- 21. Schindler. A.K. Ruiz. J.M. Rasmussen. R.O. Chang. G.K. Wathne.L.G. Concrete pavement temperature prediction and case studies with the FHWA HIPERPAV models. Cement & Concrete Composites, 2004; 463–471.
- Xu, Yi. Xu, Qing. Chen, Shenghong. Li, Xinxin. Self-restraint thermal stress in early-age concrete samples and its evaluation[J]. Construction and Building Materials, 2017. [Google Scholar]
- American Association of State Highway and Transportation Officials.The AASHO Road Test, Report 7. Summary Report[R]. Highway Research Board, Report 61G, 1962.
- Le Houedec, D. Influence of Road Surface Quality on the Dynamical Displacements and Stresses by a Heavy Moving Vehicle[J]. Transactions of the Canadian Society for Mechanical Engineering 1983, 7, 208–215. [Google Scholar] [CrossRef]
- Darestani, M Y, Thambiratnam D P, Nataatmadja A. Structural response of concrete pavements under moving truck loads[J]. Journal of Transportation Engineering 2007, 133, 670–676. [Google Scholar] [CrossRef]
- Ramaekers, J. Vandewalle, L. Degée, H. Static and dynamic response of rigid concrete pavements: Parametric study[J]. Functional Pavement Design - Proceedings of the 4th Chinese-European Workshop on Functional Pavement Design, 2016; 1499–1512. [Google Scholar]
- 27. Jeong J H, Zollinger D. Development of test methodology and model for evaluation of curing effectiveness in concrete pavement construction[J]. Transportation Research Record, 2003 ; 17–25.
- Nam J, H. Early-age behavior of CRCP and its implications for long-term performance[D]. Austin: The University of Texas at Austin, 2005.
|
Disclaimer/Publisher’s Note: The statements, opinions and data contained in all publications are solely those of the individual author(s) and contributor(s) and not of MDPI and/or the editor(s). MDPI and/or the editor(s) disclaim responsibility for any injury to people or property resulting from any ideas, methods, instructions or products referred to in the content. |
© 2023 by the authors. Licensee MDPI, Basel, Switzerland. This article is an open access article distributed under the terms and conditions of the Creative Commons Attribution (CC BY) license (http://creativecommons.org/licenses/by/4.0/).

