1. Introduction
Rabbit industry is important in China, its breeding volume and export volume are the world's first, meat rabbit export volume accounted for 27% of the world[
1]. China owns abundant genetic resources in rabbit breeds, among which meat rabbit varieties are the most, more than 60[
2].Local rabbit breeds in China have the advantage of good meat quality but also the disadvantage of slow growth of meat tissue[
3]. To improving meat yield while maintaining good meat quality is important for local rabbit breeds in China. Finding out key genes and analyzing their molecular regulatory mechanisms of muscle growth in local rabbit breeds are great significance for breeding and utilization of Chinese local rabbit breeds.
Skeletal muscle accounts for about 50% of the bodyweight and is the largest and an important tissue of an animal’s body [
4]. It plays an important role in body metabolism, movement, and protection. In animal husbandry production, because the level of economic benefits is directly determined by the meat yield, study on the growth and development of skeletal muscle is important [
5].The growth and development of muscle is a complex physiological process in which a series of genes or factors with positive or negative regulation are precisely regulated in a variety of complex ways (spatiotemporal representation, signal cascade, transcriptional regulation and feedback mechanism, etc.), which are essential for muscle growth[
6]. With the development of high-throughput sequencing technology, a number of transcription factors affecting animal muscle growth and gene regulatory networks regulating muscle production have been identified in livestock such as duck [
5], chicken [
7,
8,
9,
10], pigeon [
11], rat [
12], pig [
13], goat [
14,
15], sheep [
16,
17], cattle [
18,
19], horse [
20]. There are only a few reports on the study of rabbit muscle transcriptome. Kuang et al. [
21] identified 5320 differentially expressed genes in the skeletal muscle of embryo 18 day and 26 day, and KEGG functional annotation showed that differential genes were significantly enriched in cancer pathway, cytoskeletal regulatory pathway, PI3K-Akt signaling pathway and RAP1 signaling pathway, Six genes were closely related to muscle growth and development, among which the up-regulated genes were TPM1, CASQ1, MYOZ1, CKM and MYL3 genes, and the down-regulated genes were IGF2BP1 gene. Kuang et al.[
22] found that a total of 833 genes were significantly differentially expressed in the longissimus dorsi muscle of Qika giant white rabbits and Qixing meat rabbits, among which 325 genes were significantly up-regulated and 508 genes were significantly down-regulated in Qika giant white rabbits. KEGG functional annotation showed that differentially expressed genes were significantly enriched in PI3K-Akt pathway, cancer pathway and plaque pathway. Finally, four differentially expressed genes that may be significantly related to growth and development were screened out. Yan identified 338 differentially expressed genes Hvnlus meat rabbit(D line VS E line), found seven candidate genes related to muscle growth and development, including TNNlI, MYH6, MYL2, Myl3.FHLI, IGF2,FRZB[
23].
The mammalian fetal period is the important stage of muscle formation. Skeletal muscle starts from the mesoderm, and myoblasts first migrate from the mesoderm to the trunk and limbs, and proliferate rapidly[
24]. The development of fetal skeletal muscle is a tightly regulated process that is modulated by genes and related signaling pathways [
25]. Myoblasts differentiate into muscle cells and fuse into multinucleated muscle fibers when they reach a certain number [
24,
26]. Mammalian muscle growth depends on an increase in the number of muscle fibers during fetal and early postnatal development[
27]
. Mammalian muscle growth after birth is mainly due to the length and circumference of muscle fibers (also known as muscle hypertrophy), accompanied by the proliferation of satellite cells and then the new myonuclei is incorporated into existing myofibers [
28,
29]. However, the regulation of muscle growth-related genes from embryonic to postnatal period has not been reported in rabbit muscle.
Fujian white rabbits are commonly raised in western Fujian Province, being a native rabbit with high economic value for meat. However, the poor grow performance and low meat production restrict the economic benefits of enterprises relating to Fujian white rabbit. In this study, RNA-seq technology and bioinformatic tools were used to identify the major differentially expressed genes (DEGs) and their expression pathways in different grow stages of Fujian white rabbit. Candidate genes and key pathways involved in the developmental grow process in Fujian white rabbits were identified through comprehensive analysis of DEGs with expression levels which reflected the growth pattern of muscles in Fujian white rabbits. Our findings are useful for understanding the molecular mechanisms regulating the development of skeletal muscle and the pattern of rabbit growth, and provide a basis for subsequent improvement of Chinese native rabbit growth performance.
2. Materials and Methods
2.1. Animal and Muscle Tissue Collection
The experimental rabbits used in this study were Fujian White rabbits (FWR) that were maintained with a unified management system in Wuping County Wudong Chatouling Fujian White rabbit ecological breeding farm (Fujian, China) in Fujian Province. All the rabbits were fed according to the same housing and feeding conditions. Only 1 fetus (each animal represents 1 repetition) was selected for each female rabbit, that is, there were 5 biological repeats in each stage. When sampling, muscle anesthesia was performed with Jingsongling (Shandong Zibo Veterinary Medicine Co., Ltd., Shandong, China) at 2 mg·kg–1 before caesarean section. After complete anesthesia, the arterial blood was exsanguinated for euthanasia (this method complies with the Chinese Society of Laboratory Animals. Caesarean sections were performed on the pregnant FWR s at 20 days (E20), 26 days (E26) to obtain the corresponding fetuses. In addition, rabbits born naturally were obtained at 1 day (B1), and 30 day (B30) and 60 days (B60). This meant that we obtained 5 groups of skeletal muscles. The skeletal muscles of each group were collected from five randomly selected rabbits, and their mothers were different. Samples were obtained from all of these stages in 5 biological replicates for a total of 25 samples. The longissimus dorsi muscles were collected at 5 stages respectively, and were immediately frozen in liquid nitrogen. Then longissimus dorsi muscles of rabbits after birth (1 , 30 and 60 day) were fixed in 4% paraformaldehyde.
2.2. Ethical and Statement
The animal study protocol followed the Chinese Animal Welfare Guidelines, and was approved by the Animal Welfare Committee of Fujian Academy of Agricultural Sciences.
2.3. Paraffin sections, staining, and analysis
The fixed skeletal muscle blocks were embedded in paraffin using a conventional method and these blocks were continuously cut into 5-μm sections. Tunel & immunofluorescence double staining protocol was then used for the sections. Five stained sections were selected for each sample, and tissue structures of these samples were observed under Nikon Eclipse Ci-L(Japan) microscope with a 40× objective lens and a 10× eyepiece. Images were acquired with Image Pro® 6.0 (Image Pro®, Media Cybernetics Inc., USA). Five non-overlapping and non-missing fields of view were selected for each slice, and the acquired images were used to calculate the muscle fiber diameter.
2.4. Total RNA Extraction
Total RNA was extracted from the tissue using TRIzol® Reagent according the manufacturer’s instructions (Invitrogen) and genomic DNA was removed using DNase I (TaKara). Then RNA quality was determined by 2100 Bioanalyser (Agilent) and quantified using the ND-2000 (NanoDrop Technologies). Only high-quality RNA sample (OD260/280=1.8~2.2, OD260/230≥2.0, RIN≥6.5, 28S:18S≥1.0, >1μg) was used to construct sequencing library.
2.5. RNA Sequencing (RNA-seq)
RNA-seq transcriptome library was prepared following TruSeqTM RNA sample preparation Kit from Illumina (San Diego, CA) using 1μg of total RNA. Shortly, messenger RNA was isolated according to polyA selection method by oligo (dT) beads and then fragmented by fragmentation buffer firstly. Secondly double-stranded cDNA was synthesized using a SuperScript double-stranded cDNA synthesis kit (Invitrogen, CA) with random hexamer primers (Illumina). Then the synthesized cDNA was subjected to end-repair, phosphorylation and ‘A’ base addition according to Illumina’s library construction protocol. Libraries were size selected for cDNA target fragments of 300 bp on 2% Low Range Ultra Agarose followed by PCR amplified using Phusion DNA polymerase (NEB) for 15 PCR cycles. After quantified by TBS380, paired-end RNA-seq sequencing library was sequenced with the Illumina HiSeq xten/NovaSeq 6000 sequencer (2 × 150bp read length).
2.7. Differential expression analysis and Functional enrichment
To identify DEGs (differential expression genes) between two different samples, the expression level of each transcript was calculated according to the transcripts per million reads (TPM) method. RSEM (
http://deweylab.biostat.wisc.edu/rsem/) [
31] was used to quantify gene abundances. Essentially, differential expression analysis was performed using the DESeq2[
31]/DEGseq[
31]/EdgeR[
31]with Q value ≤ 0.05, DEGs with fold change > 2 or < -2 and Q value <= 0.05(DESeq2 or EdgeR) /Q value <= 0.001(DEGseq) were considered to be significantly different expressed genes). In addition, functional-enrichment analysis including GO and KEGG were performed to identify which DEGs were significantly enriched in GO terms and metabolic pathways at Bonferroni-corrected P-value ≤0.05 compared with the whole-transcriptome background. GO functional enrichment and KEGG pathway analysis were carried out by Goatools (
https://github.com/tanghaibao/Goatools) and KOBAS (
http://kobas.cbi.pku.edu.cn/home.do)[
32].
2.8. Alternative Splice events Identification
All the alternative splice events that occurred in our sample were identified by using recently releases program rMATS (http://rnaseq-mats.sourceforge.net/index.html) [
33]. Only the isoforms that were similar to the reference or comprised novel splice junctions were considered, and the splicing differences were detected as exon inclusion, exclusion, alternative 5′, 3′, and intron retention events.
2.9. Trend analysis: Short time-series expression miner cluster (STEM)
Short-time-series expressionminer (STEM) analysis was used to analyze the trend of differentially expressed genes. The data filtering criterion was that the expression difference ratio of five time nodes in the comparison group was more than 2 times and P<0.05 Functional enrichment analysis of GO and KEGG.
2.10. Gene Expression Analysis by qPCR
Using total RNA, 1 µg of total RNA was reverse transcribed to cDNA using the Prime Script RT kit (Takara, Hangzhou, China). qPCR was performed using SYBR Green PCR Master Mix (TaKaRa, HangZhou, China) on a StepOnePlus Real-Time PCR System. The 2
−∆∆Ct method was used to calculate the relative expression levels of genes [
23], using β-actin as a control. Three biological replicates were used to analyze all mRNA expression. The primers used in the qPCR were designed using the NCBI website (
Table 1).
2.11. Data statistical Analyses
Data of muscle fiber diameters at different stages and qRT-PCR results of different genes were analyzed using one-way ANOVA in SPSS version 21.0. Duncan’s multiple comparisons were performed for testing significant differences between mean values at different stages. Data values were presented as a mean ± SD and considered statistically significant with a P-value. Each rabbit served as an experimental unit.
3. Results
3.1. Fiber Characteristics of Rabbit Skeletal Muscle at Different Developmental Stages
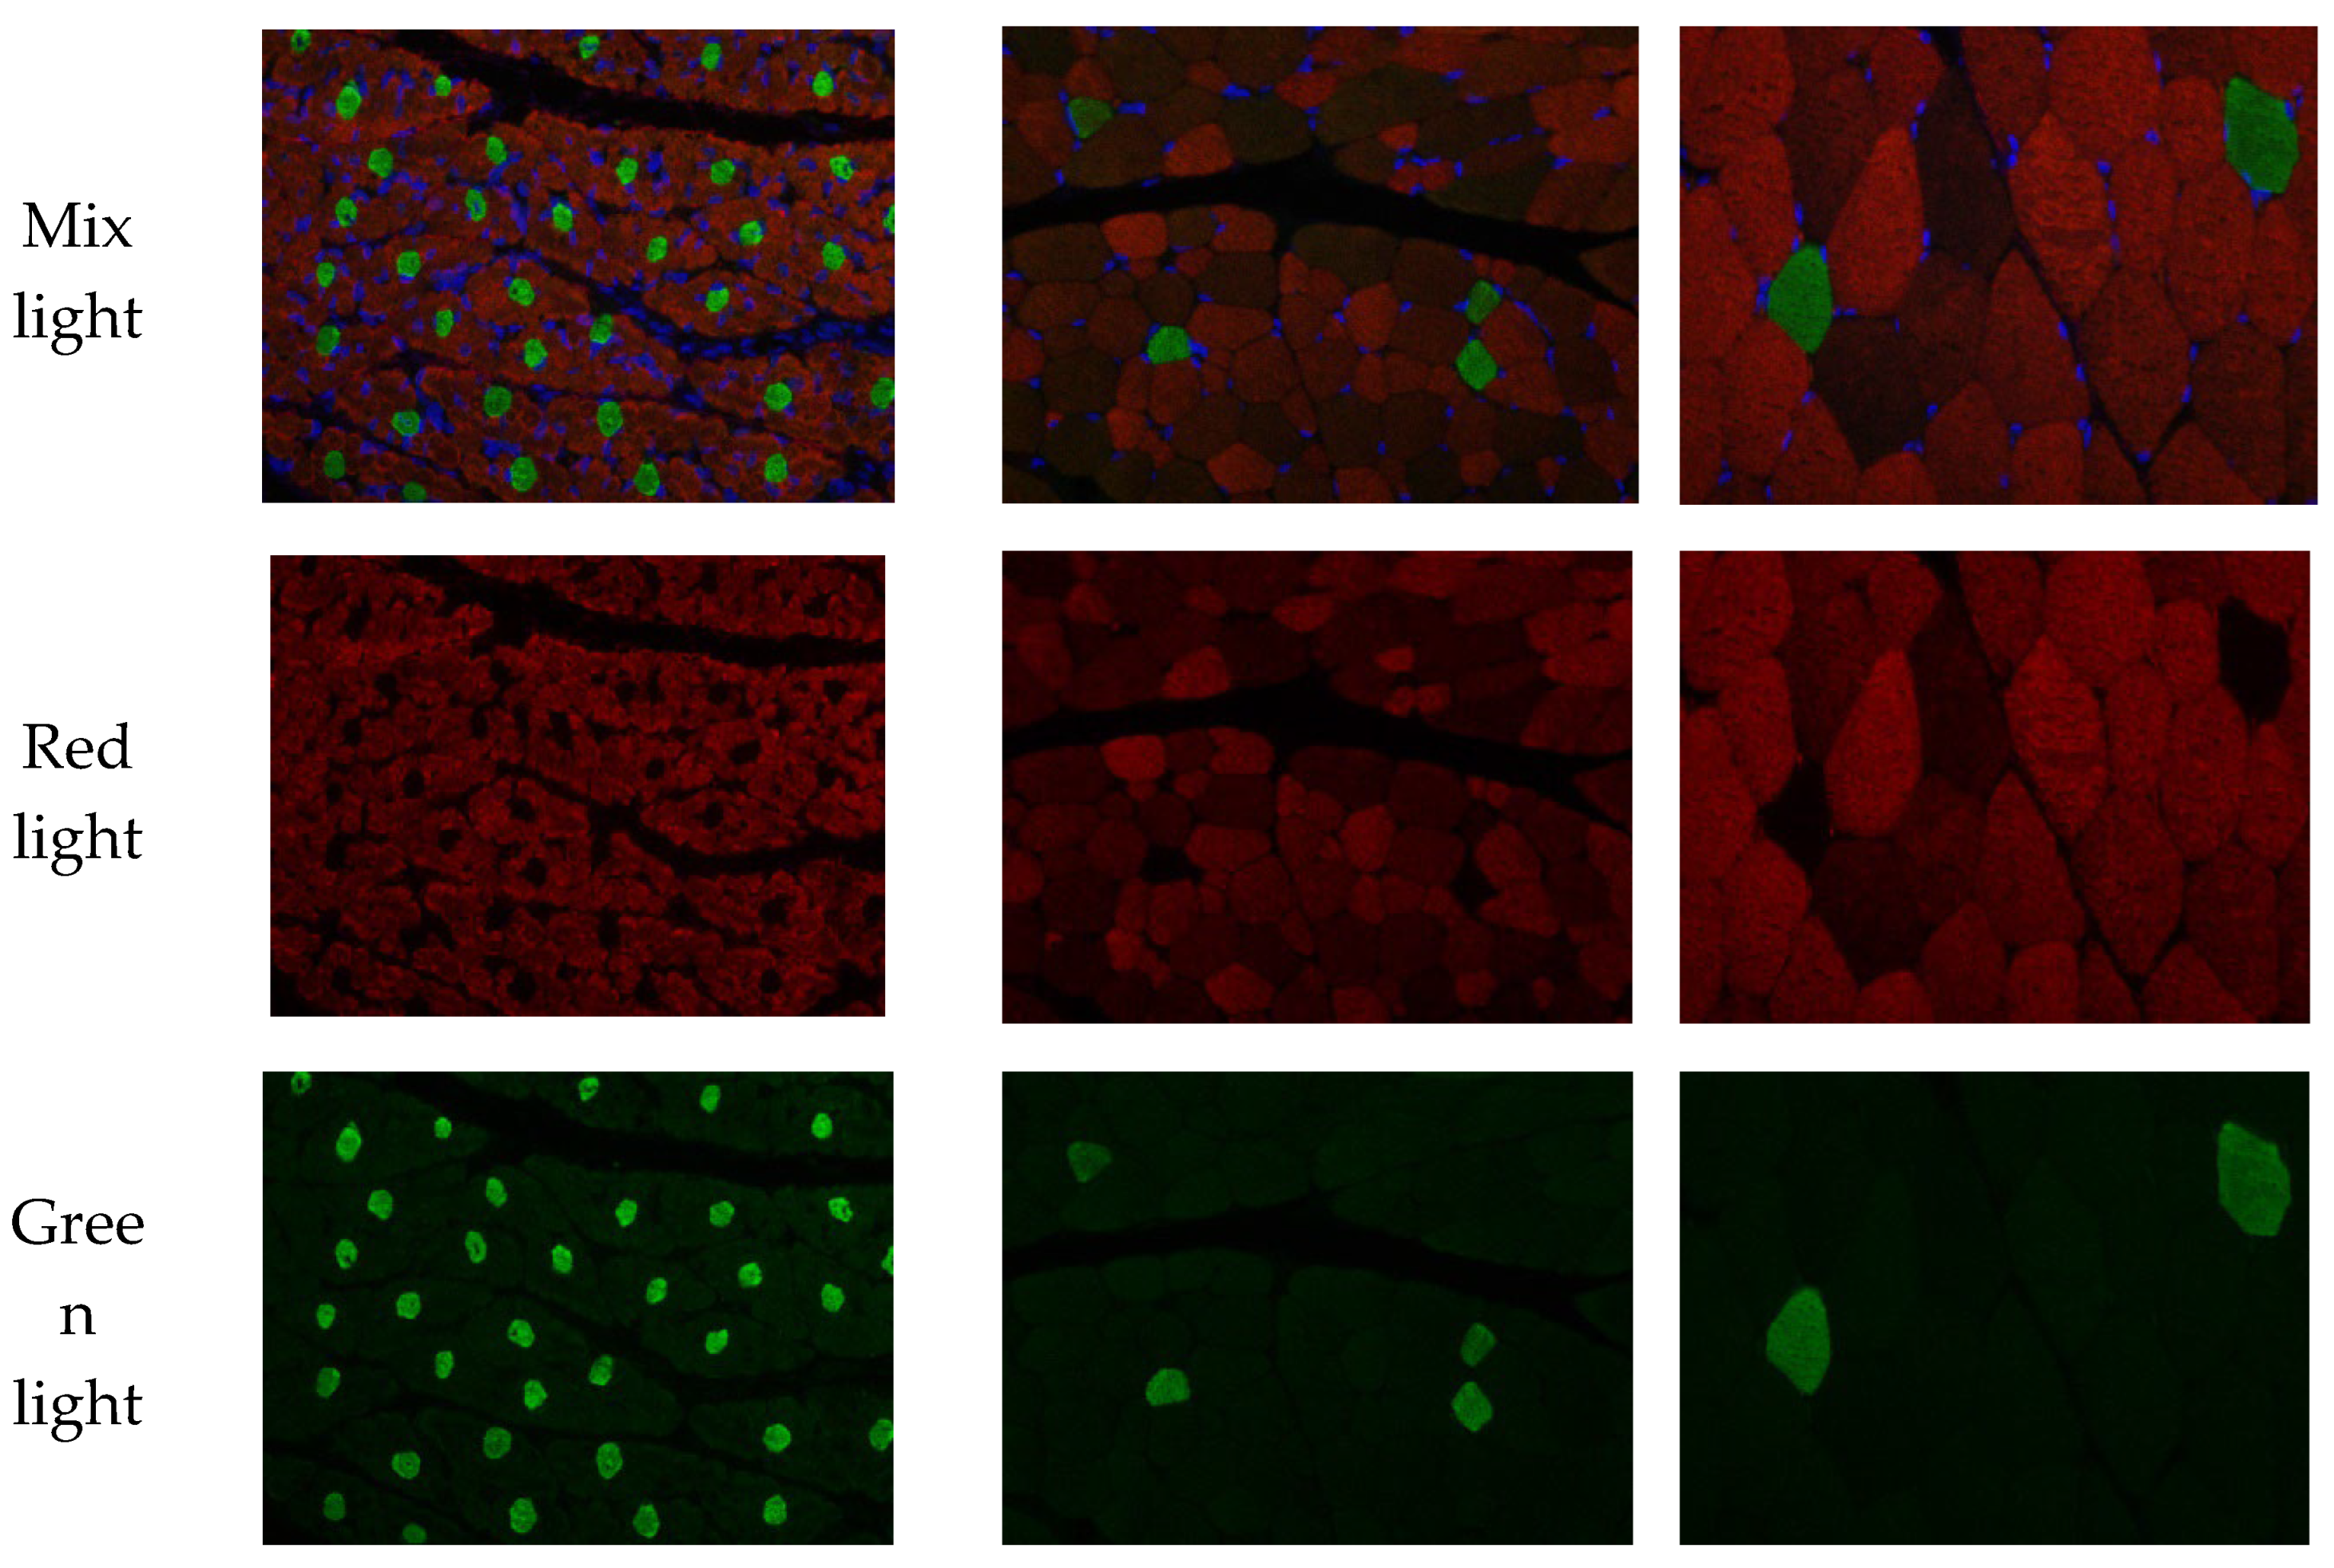
To better understand the changes in skeletal muscle characteristics after birth, we generated double fluorescencestained sections of the longissimus dorsi muscle at three growth stages.
To better understand the changes of skeletal muscle characteristics during the development of rabbits after birth, HE stained sections and double fluorescence sections of Longismost dorsi muscle at three stages were made for muscle classification statistics (
Table 2 and
Figure 1). After birth, there were two types of muscle fibers, mainly type Ⅱ, which accounted for 89.11% at birth, 98.47% at 30 days of age, 95.74% at 60 days of age and slightly decreased. The average proportion of type I at birth was 10.89%, decreased to 1.53% at 30 days of age, and increased slightly to 4.26% at 60 days of age. The density of muscle fiber type I and Ⅱ decreased significantly with the increase of age, and the single area of muscle fiber increased significantly.
Table 2.
Changes of muscle fibers in longissimus dorsi muscle of Fujian white rabbits after birth.
Table 2.
Changes of muscle fibers in longissimus dorsi muscle of Fujian white rabbits after birth.
| Muscle fiber type |
Item |
1day |
30day |
60day |
P-Value |
| I |
Density |
382.4±56.58 |
35.43±4.07 |
26.91±4.20 |
<0.001 |
| |
single area |
0.20±0.02 |
0.49±0.04 |
0.98±0.09 |
<0.001 |
| |
Percentage |
10.89±2.78 |
1.53±0.20 |
4.26±0.43 |
0.002 |
| Ⅱ |
Density |
3915.4±466.64 |
726.69±51.65 |
394.52±49.12 |
<0.001 |
| |
single area |
0.17±0.02 |
1.15±0.07 |
2.06±0.26 |
<0.001 |
| |
Percentage |
89.11±2.78 |
98.47±0.20 |
95.74±0.43 |
0.002 |
3.2. Sequencing Data and Read Mapping
A total of 1,315,508,354 clean reads were obtained from the 25 libraries with an average of 52,620,334 clean reads in each sample (the numbers of reads ranging from 57,143,694 to 43,117,346). The GC content and ≧Q30(%) were 57.60% to 54.61% and 95.55% to 94.44%, respectively. After quality control, the clean reads obtained were 84.77% to 87.32% compared with the reference genome of rabbits (
http://asia.ensembl.org/Oryctolagus_cuniculus/Info/Index) (
Table 2.).
Table 2.
RNA-seq data from longissimus muscle of Fujian white rabbit.
Table 2.
RNA-seq data from longissimus muscle of Fujian white rabbit.
| Samples |
Clean Reads |
Clean Bases |
GC Content |
≥Q20 (%) |
≥Q30 (%) |
Total mapped |
| E20_1 |
55,734,440 |
8,313,085,511 |
55.14 |
98.20 |
94.69 |
47975182(86.08%) |
| E20_2 |
53,058,642 |
7,894,003,588 |
54.61 |
98.28 |
94.92 |
45923886(86.55%) |
| E20_3 |
43,117,346 |
6,426,127,395 |
54.62 |
98.15 |
94.63 |
37240279(86.37%) |
| E20_4 |
49,840,308 |
7,449,982,372 |
54.97 |
98.35 |
95.10 |
42732162(85.74%) |
| E20_5 |
52,265,844 |
7,823,329,439 |
55.00 |
98.19 |
94.71 |
44882726(85.87%) |
| E26_1 |
48,483,382 |
7,260,000,243 |
55.12 |
98.09 |
94.44 |
41473114(85.54%) |
| E26_2 |
49,855,872 |
7,447,695,977 |
55.50 |
98.29 |
94.92 |
42778837(85.81%) |
| E26_3 |
48,447,120 |
7,217,021,129 |
55.15 |
98.24 |
94.86 |
41455767(85.57%) |
| E26_4 |
56,162,336 |
8,346,021,442 |
55.42 |
98.38 |
95.21 |
47606815(84.77%) |
| E26_5 |
54,929,178 |
8,123,757,148 |
54.84 |
98.35 |
95.10 |
46656888(84.94%) |
| D1_1 |
54864198 |
8148852399 |
55.61 |
98.31 |
95.01 |
46703174(85.13%) |
| D1_2 |
54062194 |
8029221216 |
55.07 |
98.29 |
94.96 |
46364983(85.76%) |
| D1_3 |
55538276 |
8259213293 |
55.30 |
98.22 |
94.75 |
47346876(85.25%) |
| D1_4 |
56946594 |
8468764768 |
55.24 |
98.36 |
95.13 |
48479947(85.13%) |
| D1_5 |
49047954 |
7293122433 |
55.19 |
98.33 |
95.05 |
41995340(85.62%) |
| D30_1 |
54073416 |
8055531940 |
57.46 |
98.51 |
95.47 |
46916395(86.76%) |
| D30_2 |
53447052 |
7969699261 |
56.94 |
98.42 |
95.26 |
46373149(86.76%) |
| D30_3 |
51103710 |
7621392259 |
57.11 |
98.40 |
95.17 |
44486619(87.05%) |
| D30_4 |
52197018 |
7770299353 |
57.60 |
98.50 |
95.43 |
45140436(86.48%) |
| D30_5 |
52350632 |
7800651589 |
57.29 |
98.46 |
95.40 |
45351306(86.63%) |
| D60_1 |
52093866 |
7741946849 |
57.29 |
98.40 |
95.21 |
45053306(86.48%) |
| D60_2 |
51649388 |
7669668687 |
57.60 |
98.48 |
95.34 |
44888951(86.91%) |
| D60_3 |
55026236 |
8165970844 |
57.57 |
98.43 |
95.30 |
47820207(86.9%) |
| D60_4 |
54069658 |
8023215943 |
57.32 |
98.53 |
95.55 |
47212842(87.32%) |
| D60_5 |
57143694 |
8506058012 |
57.39 |
98.42 |
95.24 |
49816626(87.18%) |
3.3. Differential Expression Genes (DEGs)
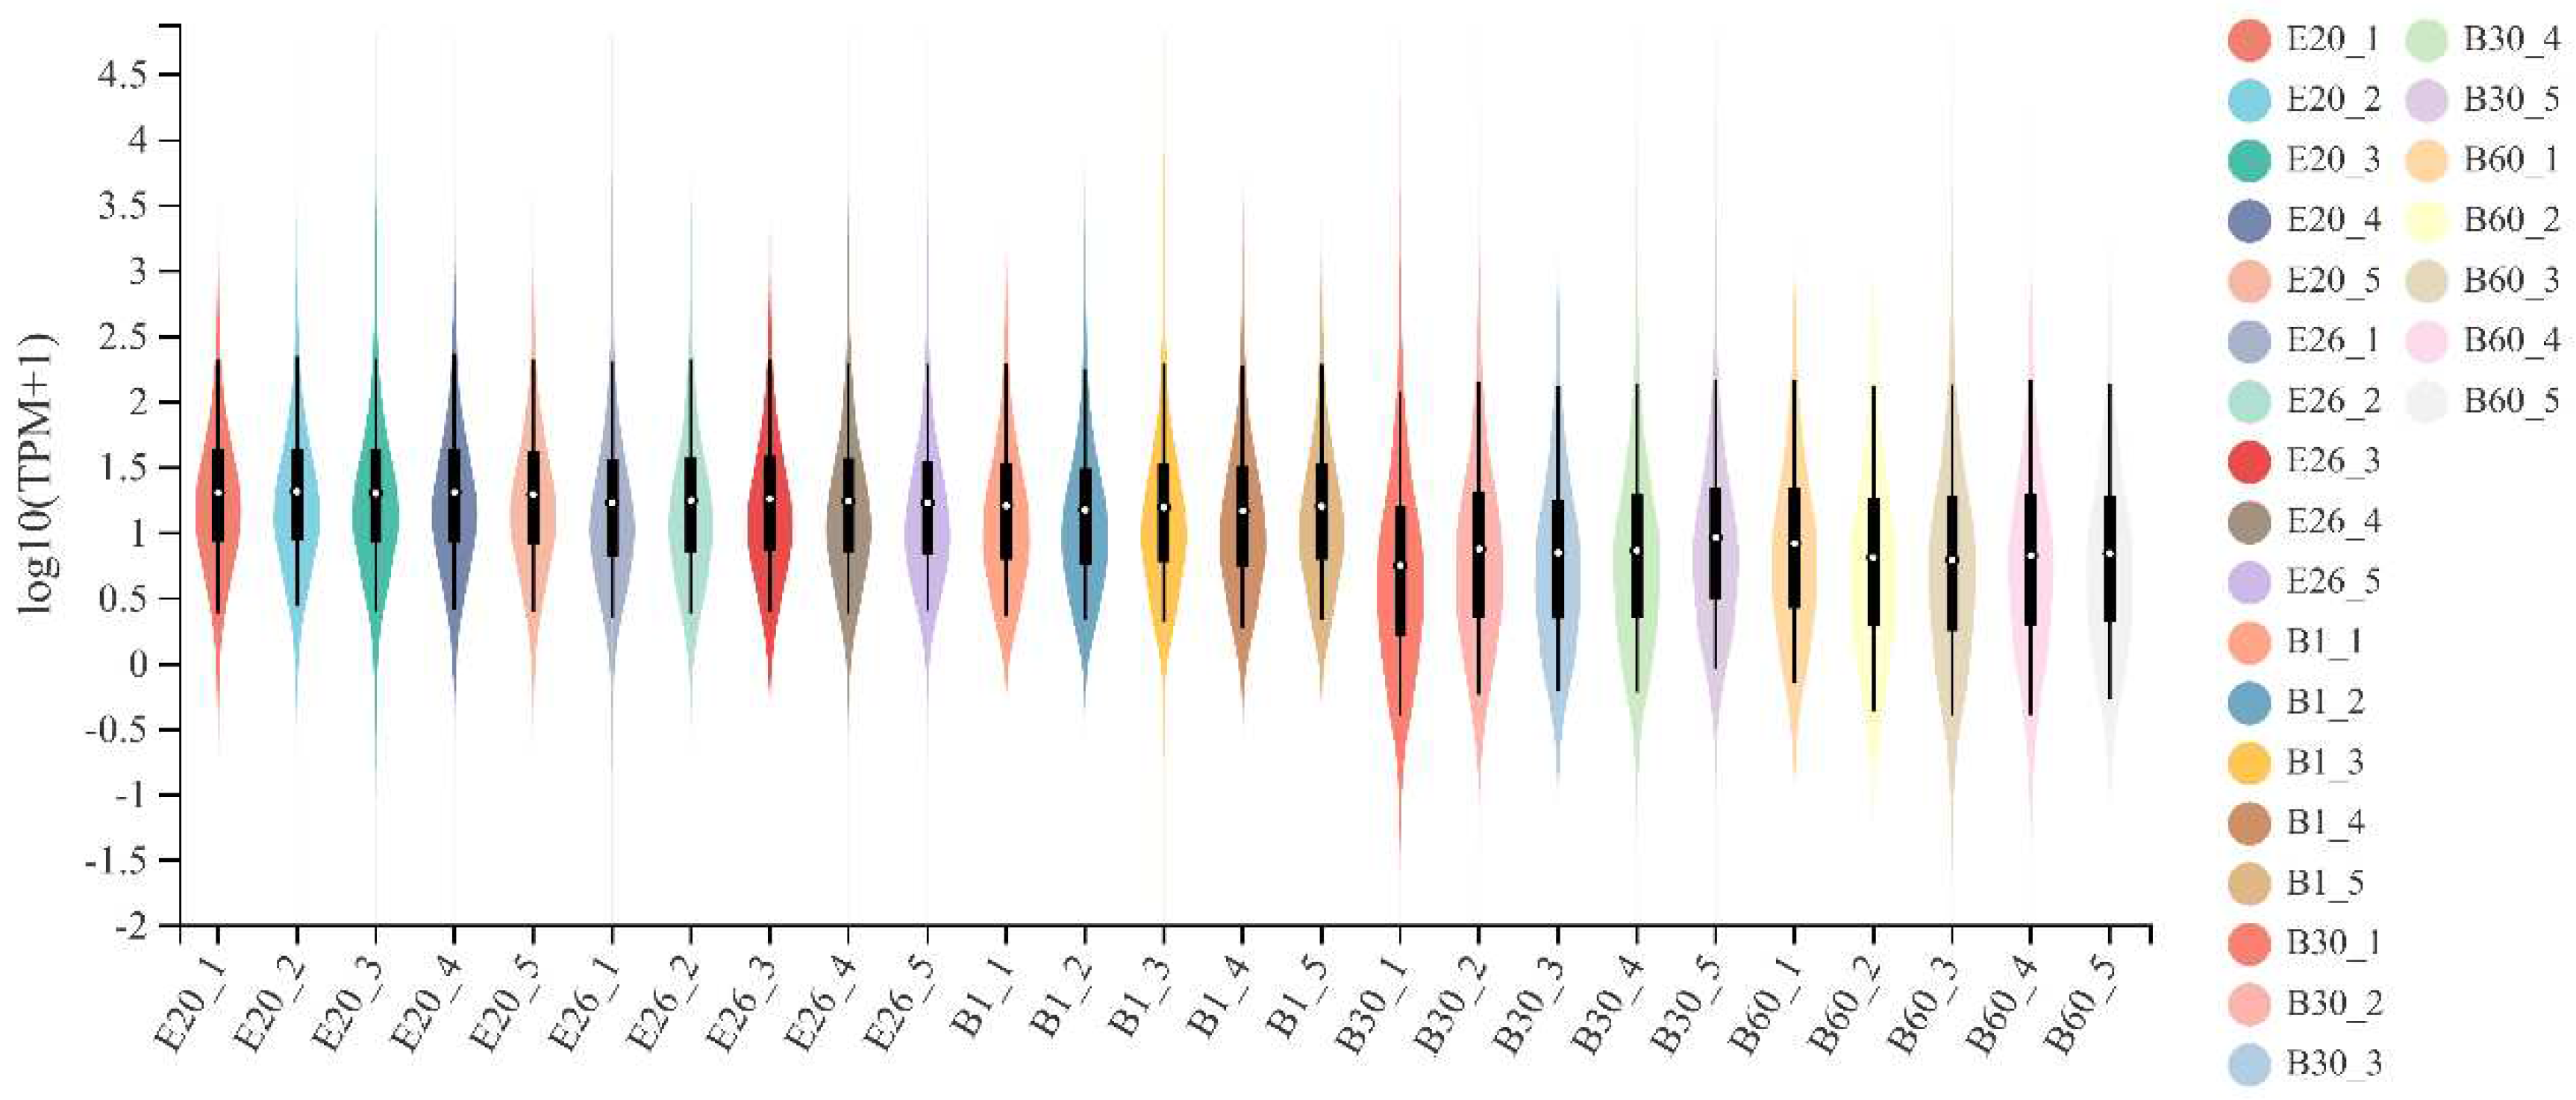
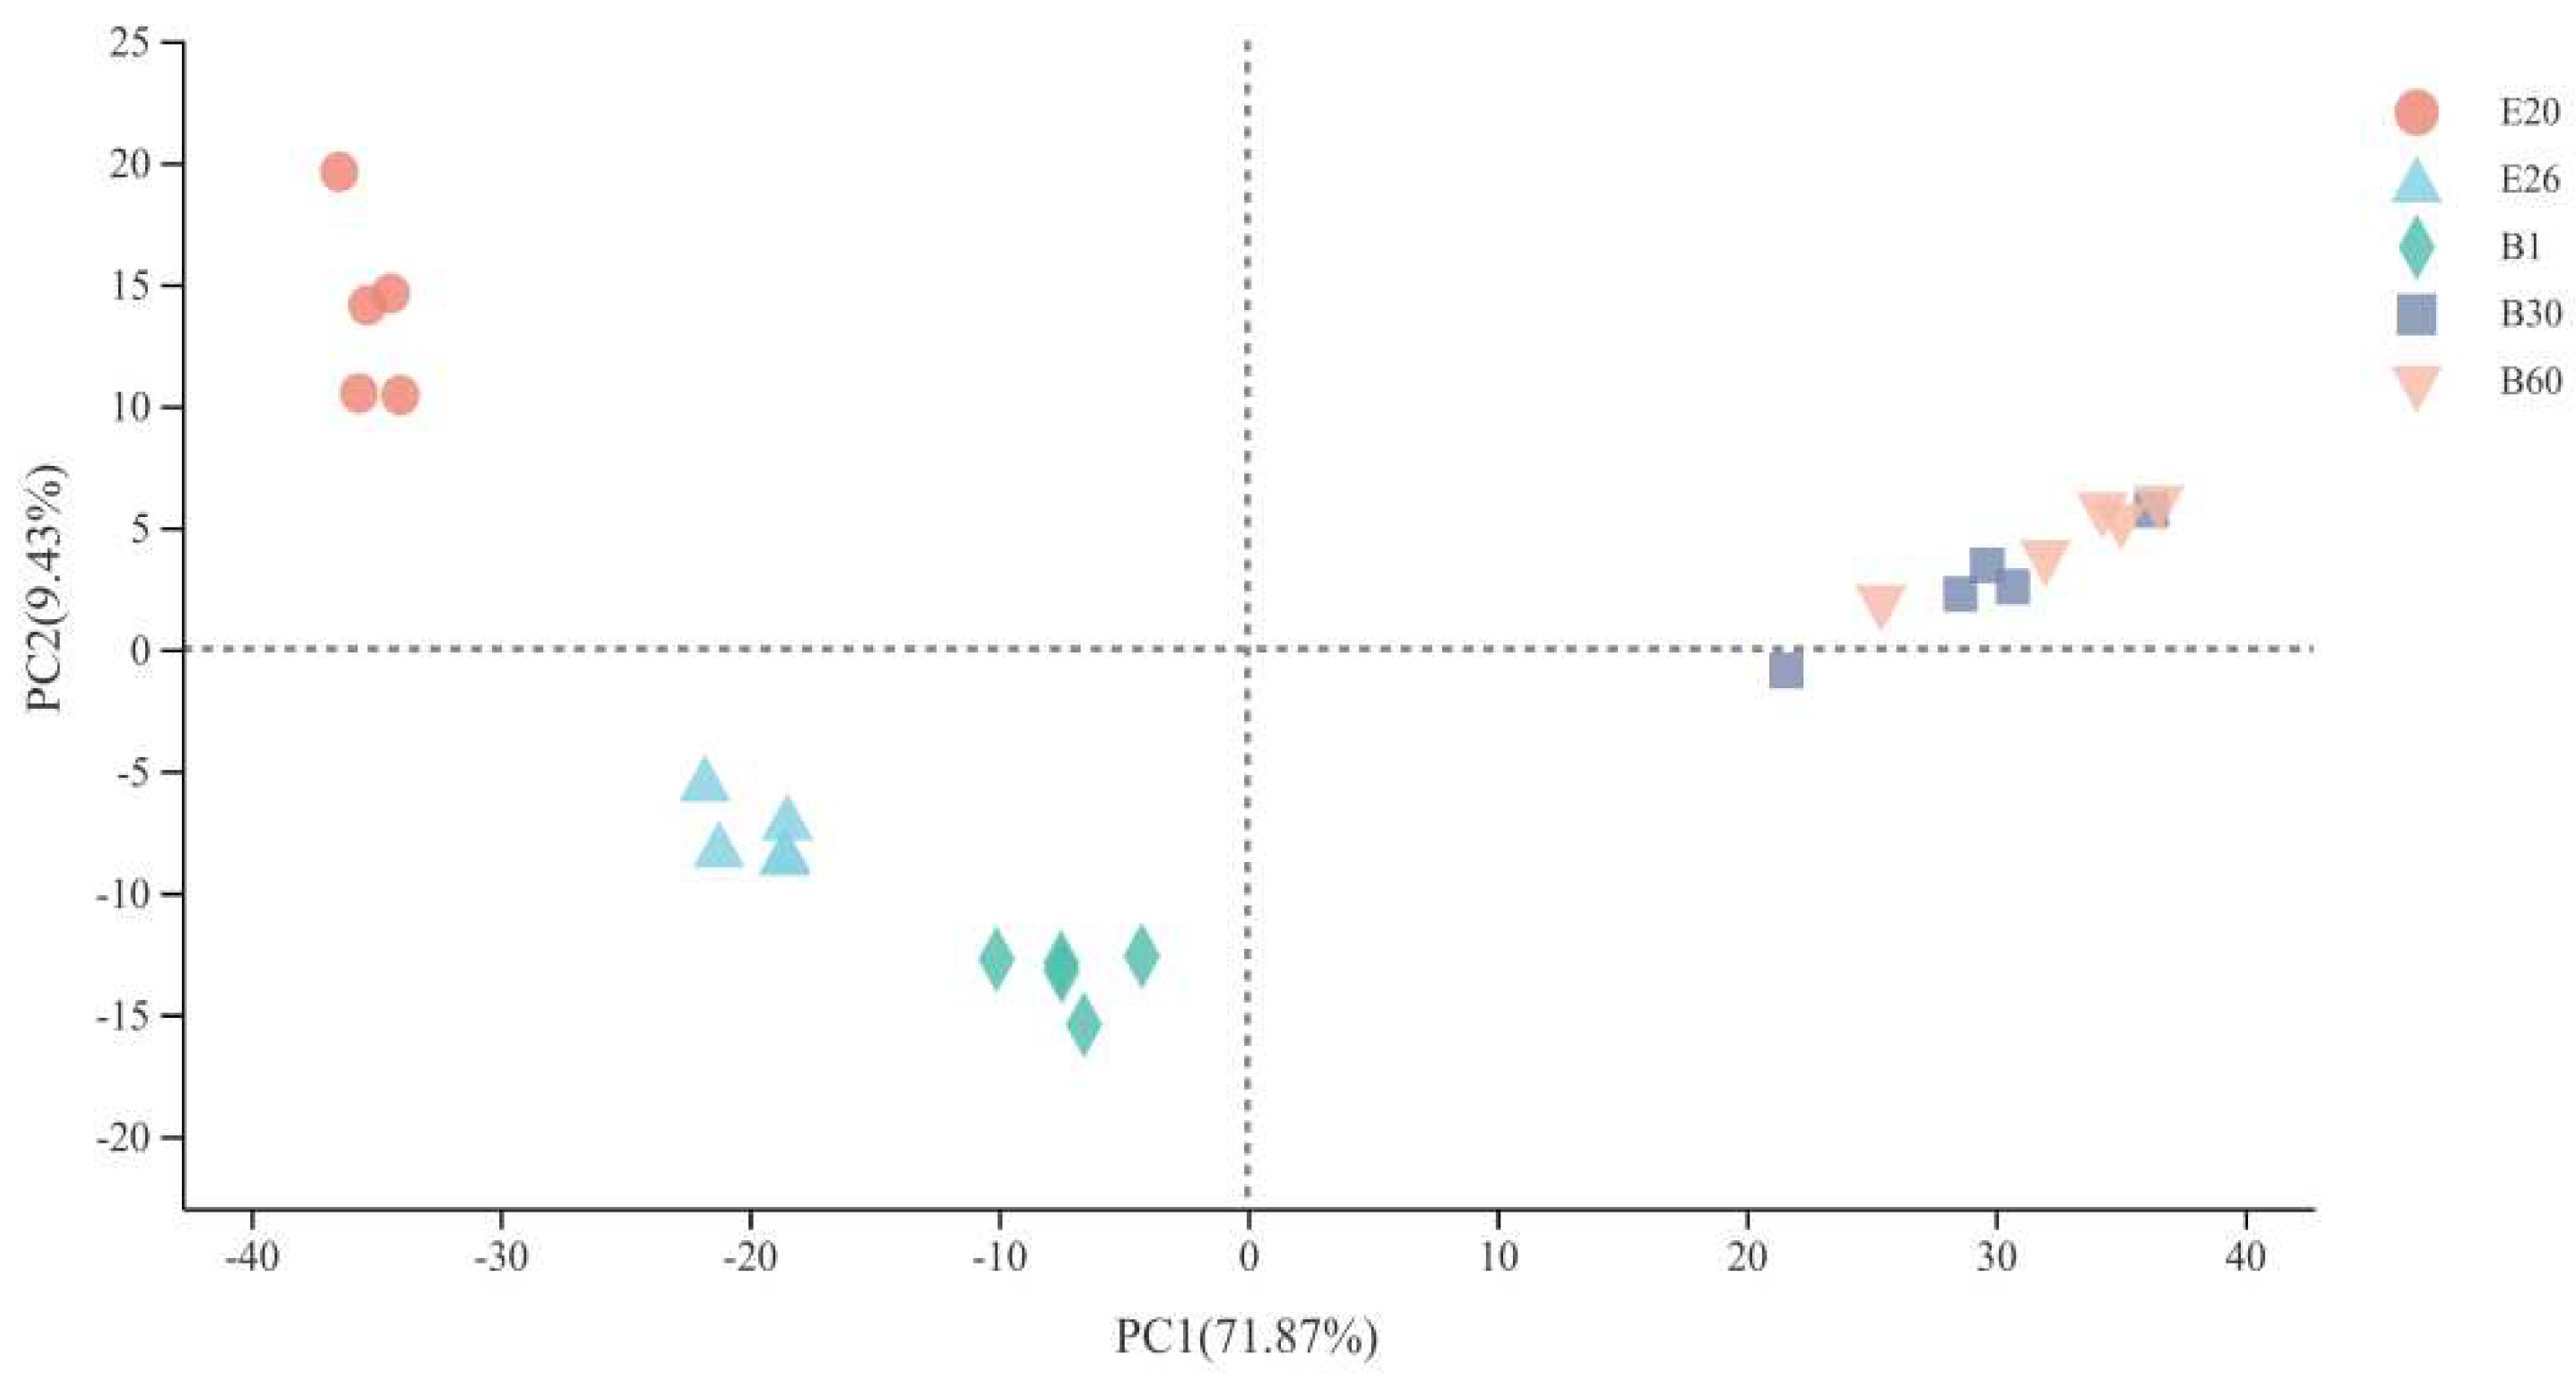
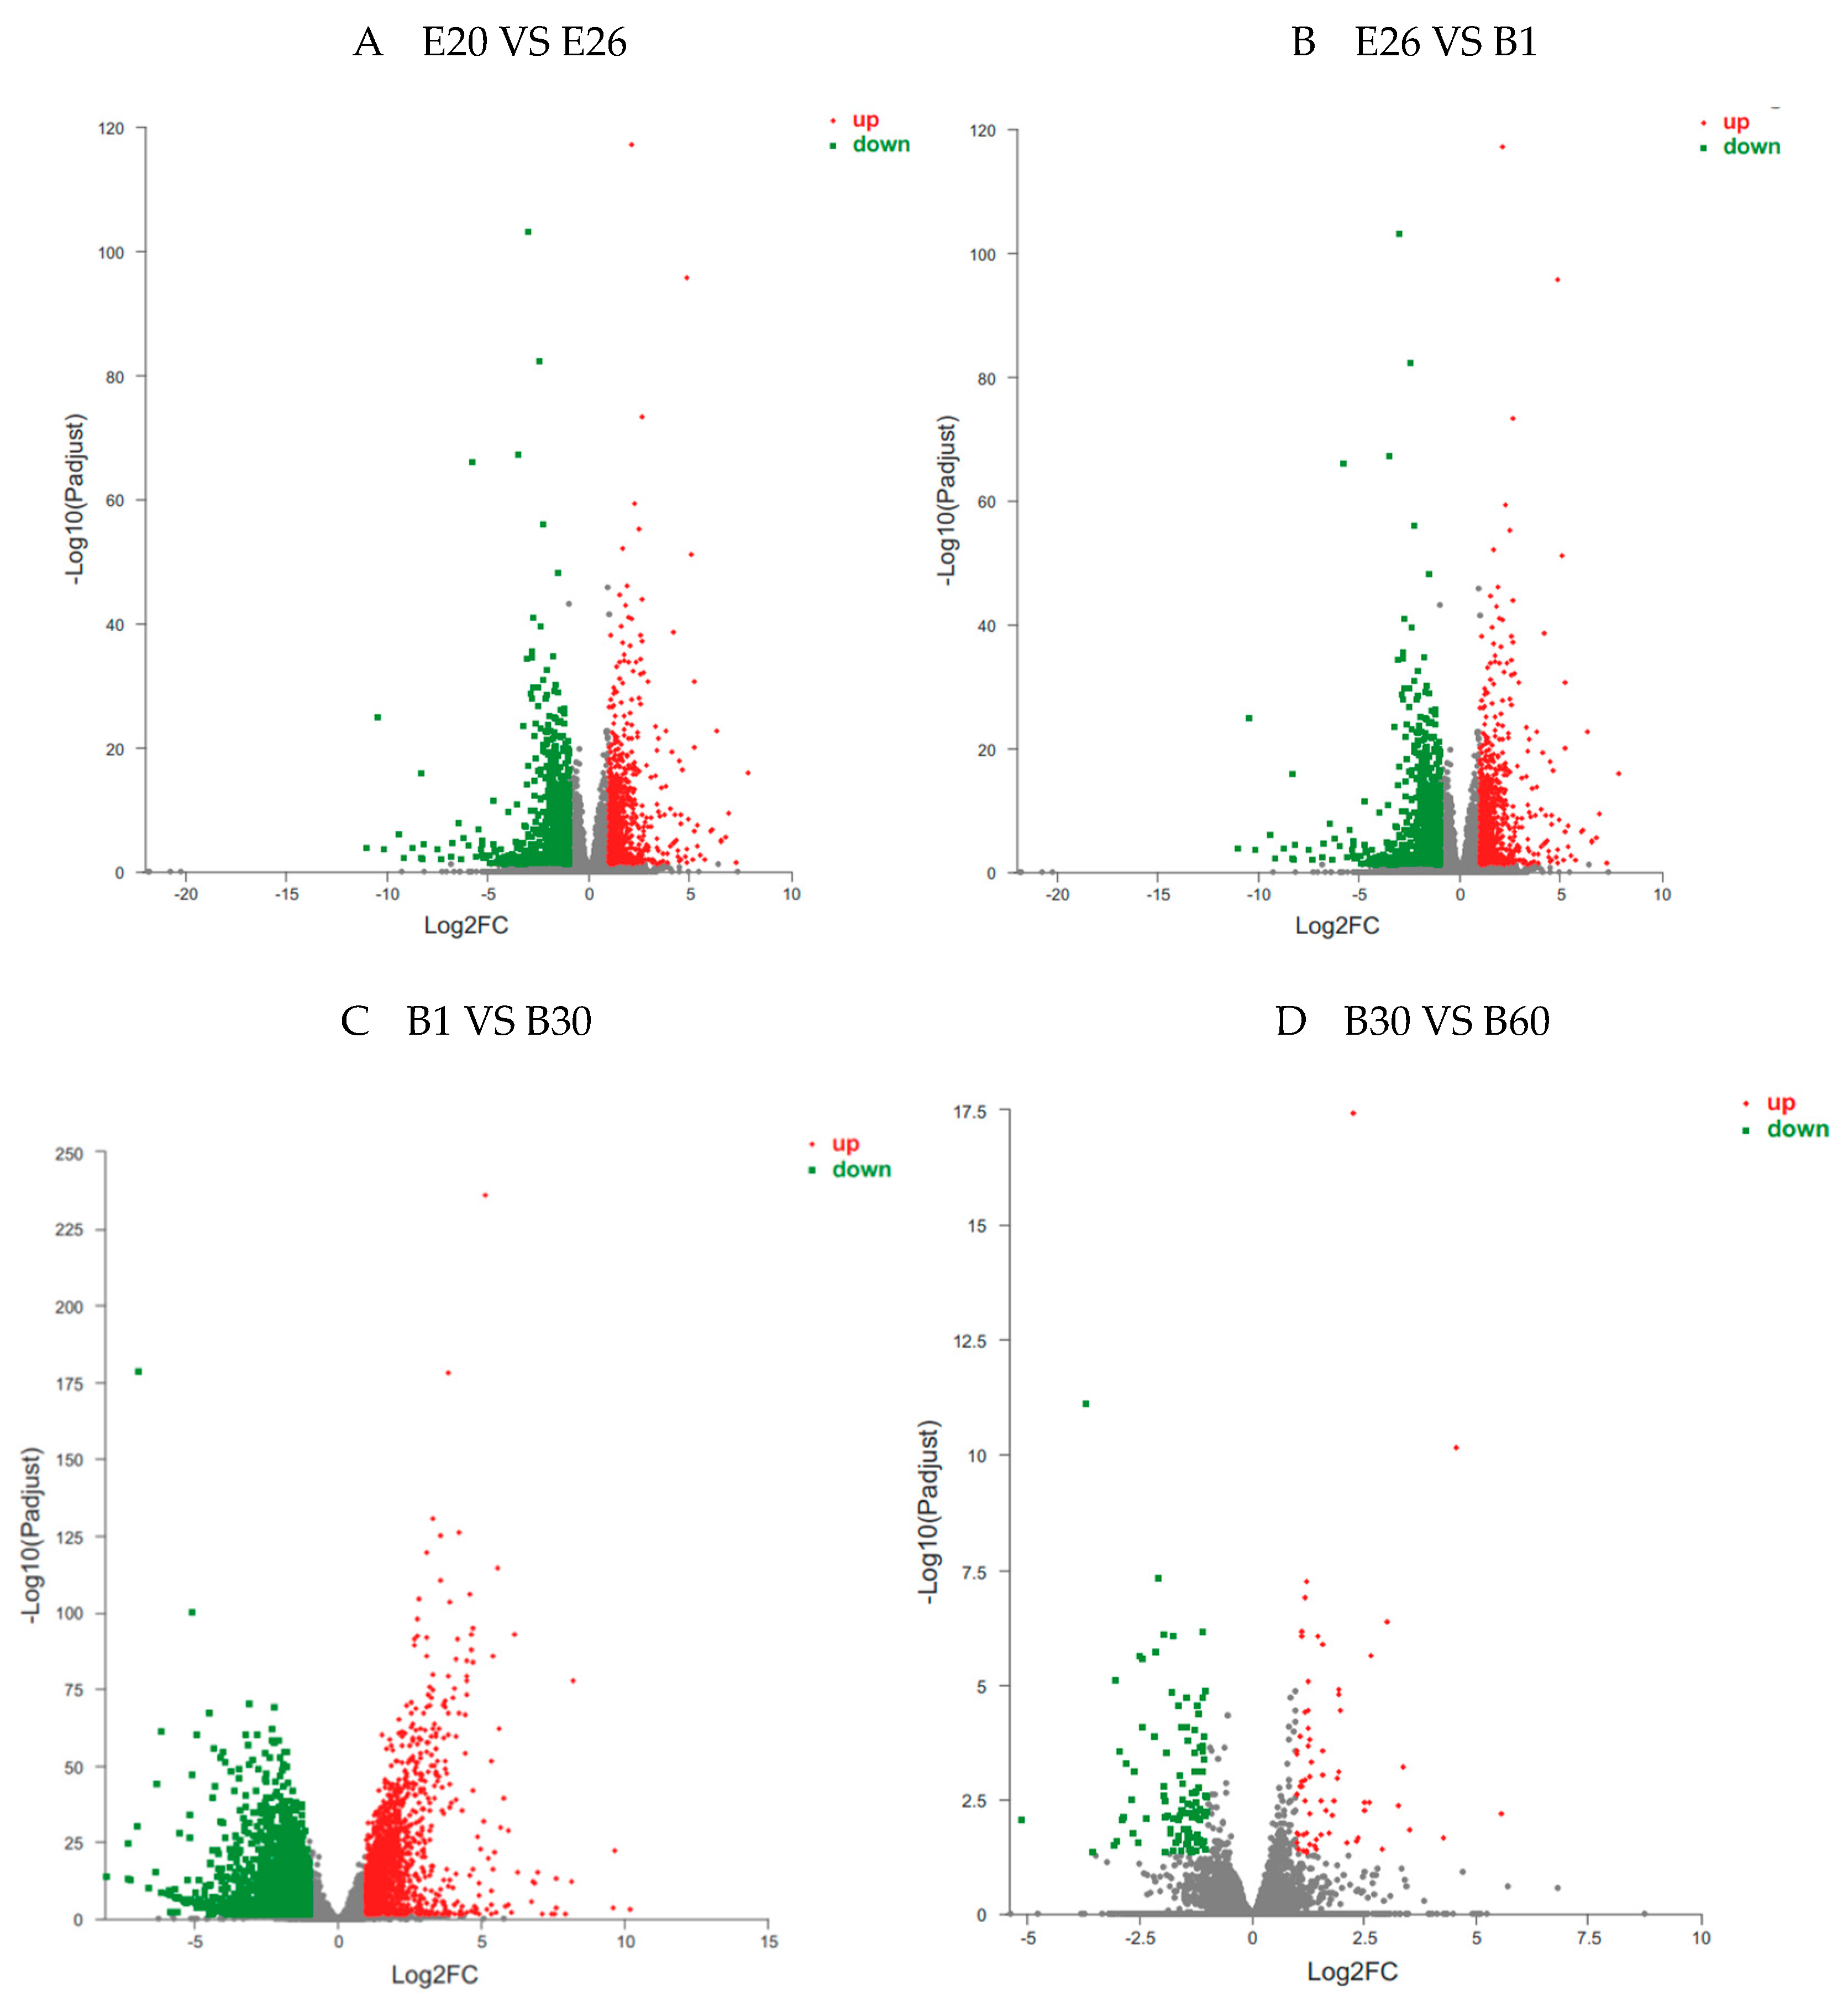
Statistical analysis of DEGs in longissimus dorsi of Fujian white rabbits at four stages were shown in
Table 3 and
Figure 2,
Figure 3 and
Figure 4. Differential gene expression analysis of four stages showed that 9737 genes were significantly differentially expressed (Fold change ≥ 2 and FDR < 0.01 at
P< 0.05, the same below), with 1372 up-regulated genes and 1012 down-regulated in E20 vs. E26, 706 up-regulated genes and 763 down-regulated in E26 vs. B1, 1808 up-regulated genes and 2425 down-regulated in B1 vs. B30, 55 up-regulated genes and 108 down-regulated in B30 vs. B60.
The same color represents the same stage. E20 and E26 represent embryos of 20 and 26; B1, B30 and B60 represent kids of 1, 30 and 60 days after birth, respectively.
The volcano plot of DEGs in (A) E20 VS E26, (B) E26 VS B1, (C) B1 VS B30, (D) B30 VS B60. The X-axis represents the log2 fold change; the Y-axis represents the significance of differential expression P value on the –log10. Red dots: up-regulated DEGs; green dots: down-regulated DEGs; blue dots: non-DEGs.
Table 3.
Statistical results of differentially expressed genes.
Table 3.
Statistical results of differentially expressed genes.
| DEGs |
DEGnumber |
Up-Regulated |
Down-Regulated |
| E20 VS E26 |
2384 |
1372 |
1012 |
| E26 VS B1 |
1469 |
706 |
763 |
| B1 VS B30 |
4233 |
1808 |
2425 |
| B30 VS B60 |
163 |
55 |
108 |
| E20 VS B1 |
4191 |
2118 |
2073 |
| E20 VS B30 |
6948 |
3146 |
3802 |
| E20 VS B60 |
7464 |
3359 |
4105 |
| E26 VS B30 |
5485 |
2443 |
3042 |
| E26 VS B60 |
6050 |
2712 |
3338 |
| B1 VS B60 |
5065 |
2192 |
2873 |
3.4. GO and KEGG Analysis
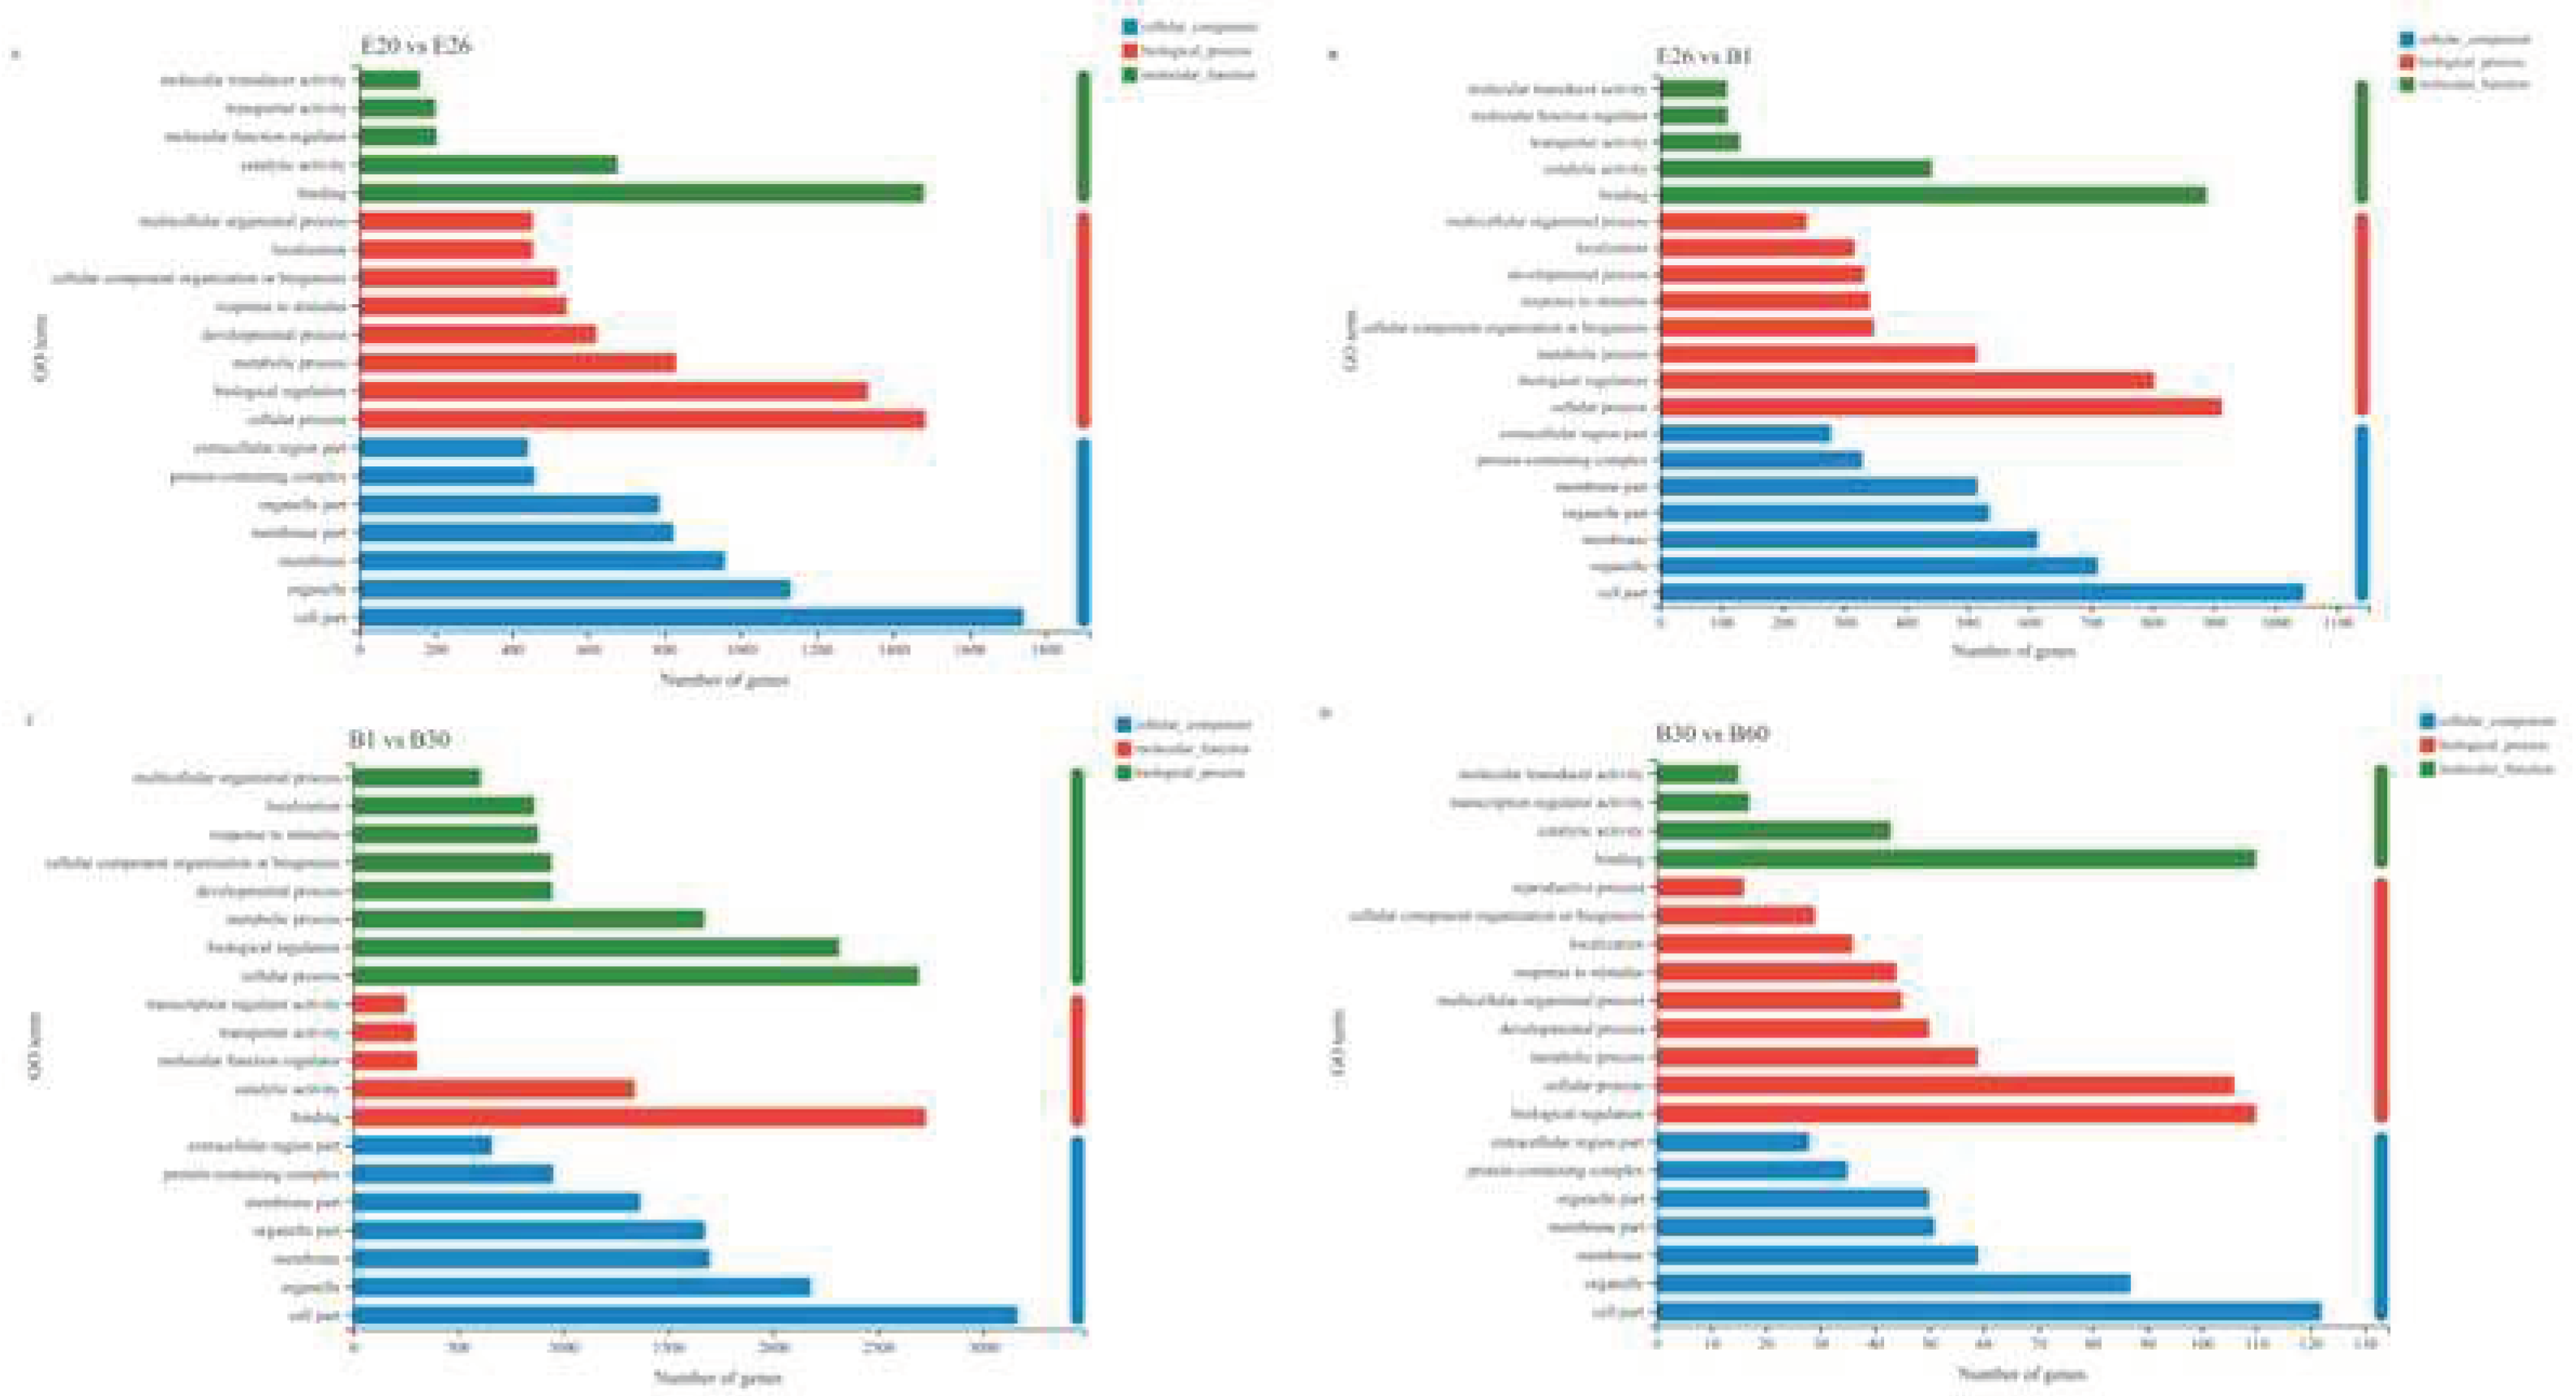
To further elucidate the role of specific signaling pathways in muscle development, we enriched DeGs from four comparative stages for GO and KEGG analysis. In GO analysis, DeGs are annotated into three ontologies in the GO database: biological processes (BP), cellular components (CC), and molecular functions (MF). In E20 vs. E26, 2384 DEGs were annotated to 53 GO terms, covering 24 biological processes (BP), 16 cellular components (CC), and 13 molecular functions (MF). The top 20 items of evident enrichment included skeletal muscle contraction, embryonic forelimb morphogenesis, establishment of skin barrier, sarcomere organization, peptide cross linking, multicellular organismal water homeostasis etc. In E26 vs. B1, 1469 DEGs were assigned to 52 GO terms, including 23 BP, 16 CC, and 13 MF. The top 20 items of significant enrichment included the activity of kinetochore organization, regulation of chromosome separation, sister chromatid cohesion, mitotic cytokinesis and so on. In B1 vs. B30, 4233 DEGs were classified into 56 different GO terms, including 24 BP, 17 CC, and 15 MF. The GO terms of evident enrichment included cardiac muscle contraction, striated muscle contraction, regulation of calcium ion transmembrane transporter activity, secondary metabolic process, regulation of muscle contraction, regulation of muscle system process and so on. In B30 vs. B60, 163 DEGs were classified into 46 different GO terms, including 21 BP, 14 CC, and 11 MF. The items of significant enrichment included striated muscle contraction, muscle contraction, muscle system process and cardiac muscle contraction (
Figure 5).
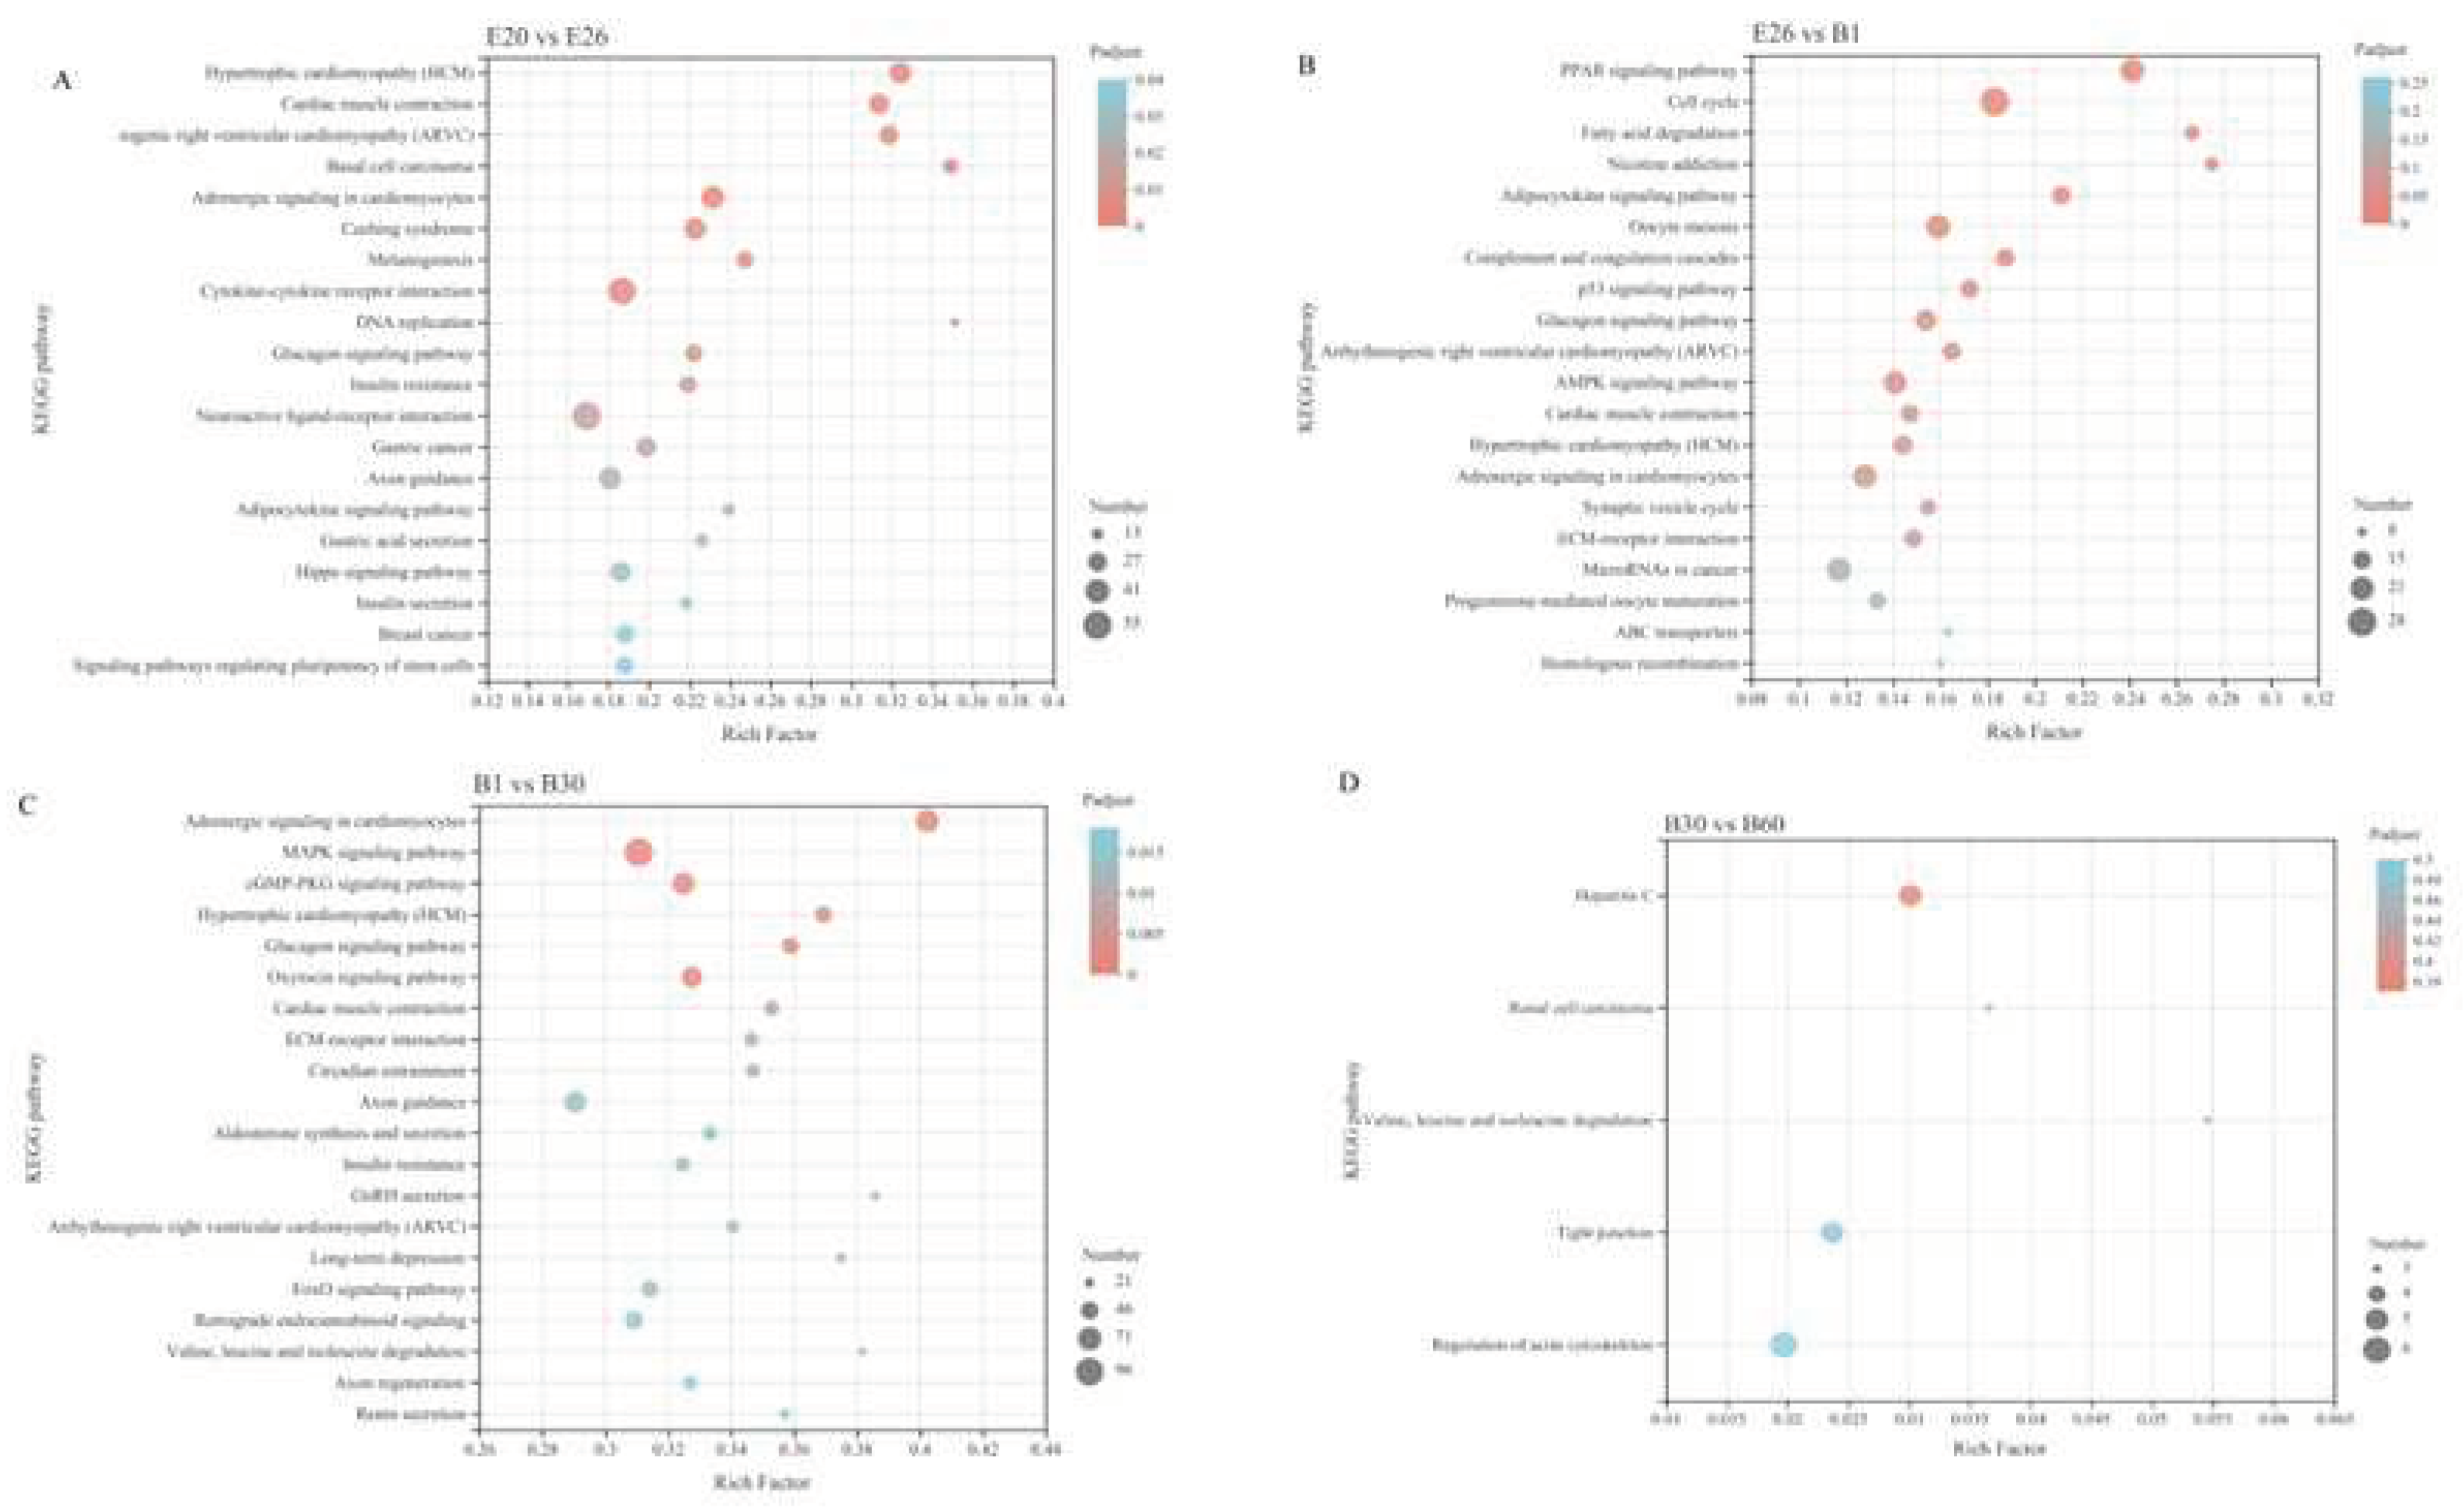
For KEGG analysis, in E20 vs. E26, 2384 DEGs were enriched in 331 pathways, of which 26 pathways were significantly enriched, mainly in Hypertrophic cardiomyopathy (HCM), Cardiac muscle contraction, Arrhythmogenic right ventricular cardiomyopathy (ARVC), Basal cell carcinoma, Adrenergic signaling in cardiomyocytes and Cushing syndrome. In E26 vs. B1, 1469 DEGs were enriched in 310 pathways, of which 11 pathways were significantly enriched, mainly in the PPAR signaling pathway, Cell cycle, Fatty acid degradation, Nicotine addiction, Adipocytokine signaling pathway and Oocyte meiosis. In the stage B1vs. B30, 4233 DEGs were enriched in 342 pathways, of which 30 pathways were significantly enriched, mainly in the Adrenergic signaling in cardiomyocytes, MAPK signaling pathway, cGMP-PKG signaling pathway, Hypertrophic cardiomyopathy (HCM), Glucagon signaling pathway and Oxytocin signaling pathway. In B30 vs. B60, 163 DEGs were enriched in 165 pathways, and there was no significant difference between the two stages.
3.5. Short time series expression analysis of differentially expressed genes in longissimus dorsi muscle of Fujian white rabbits(STEM)
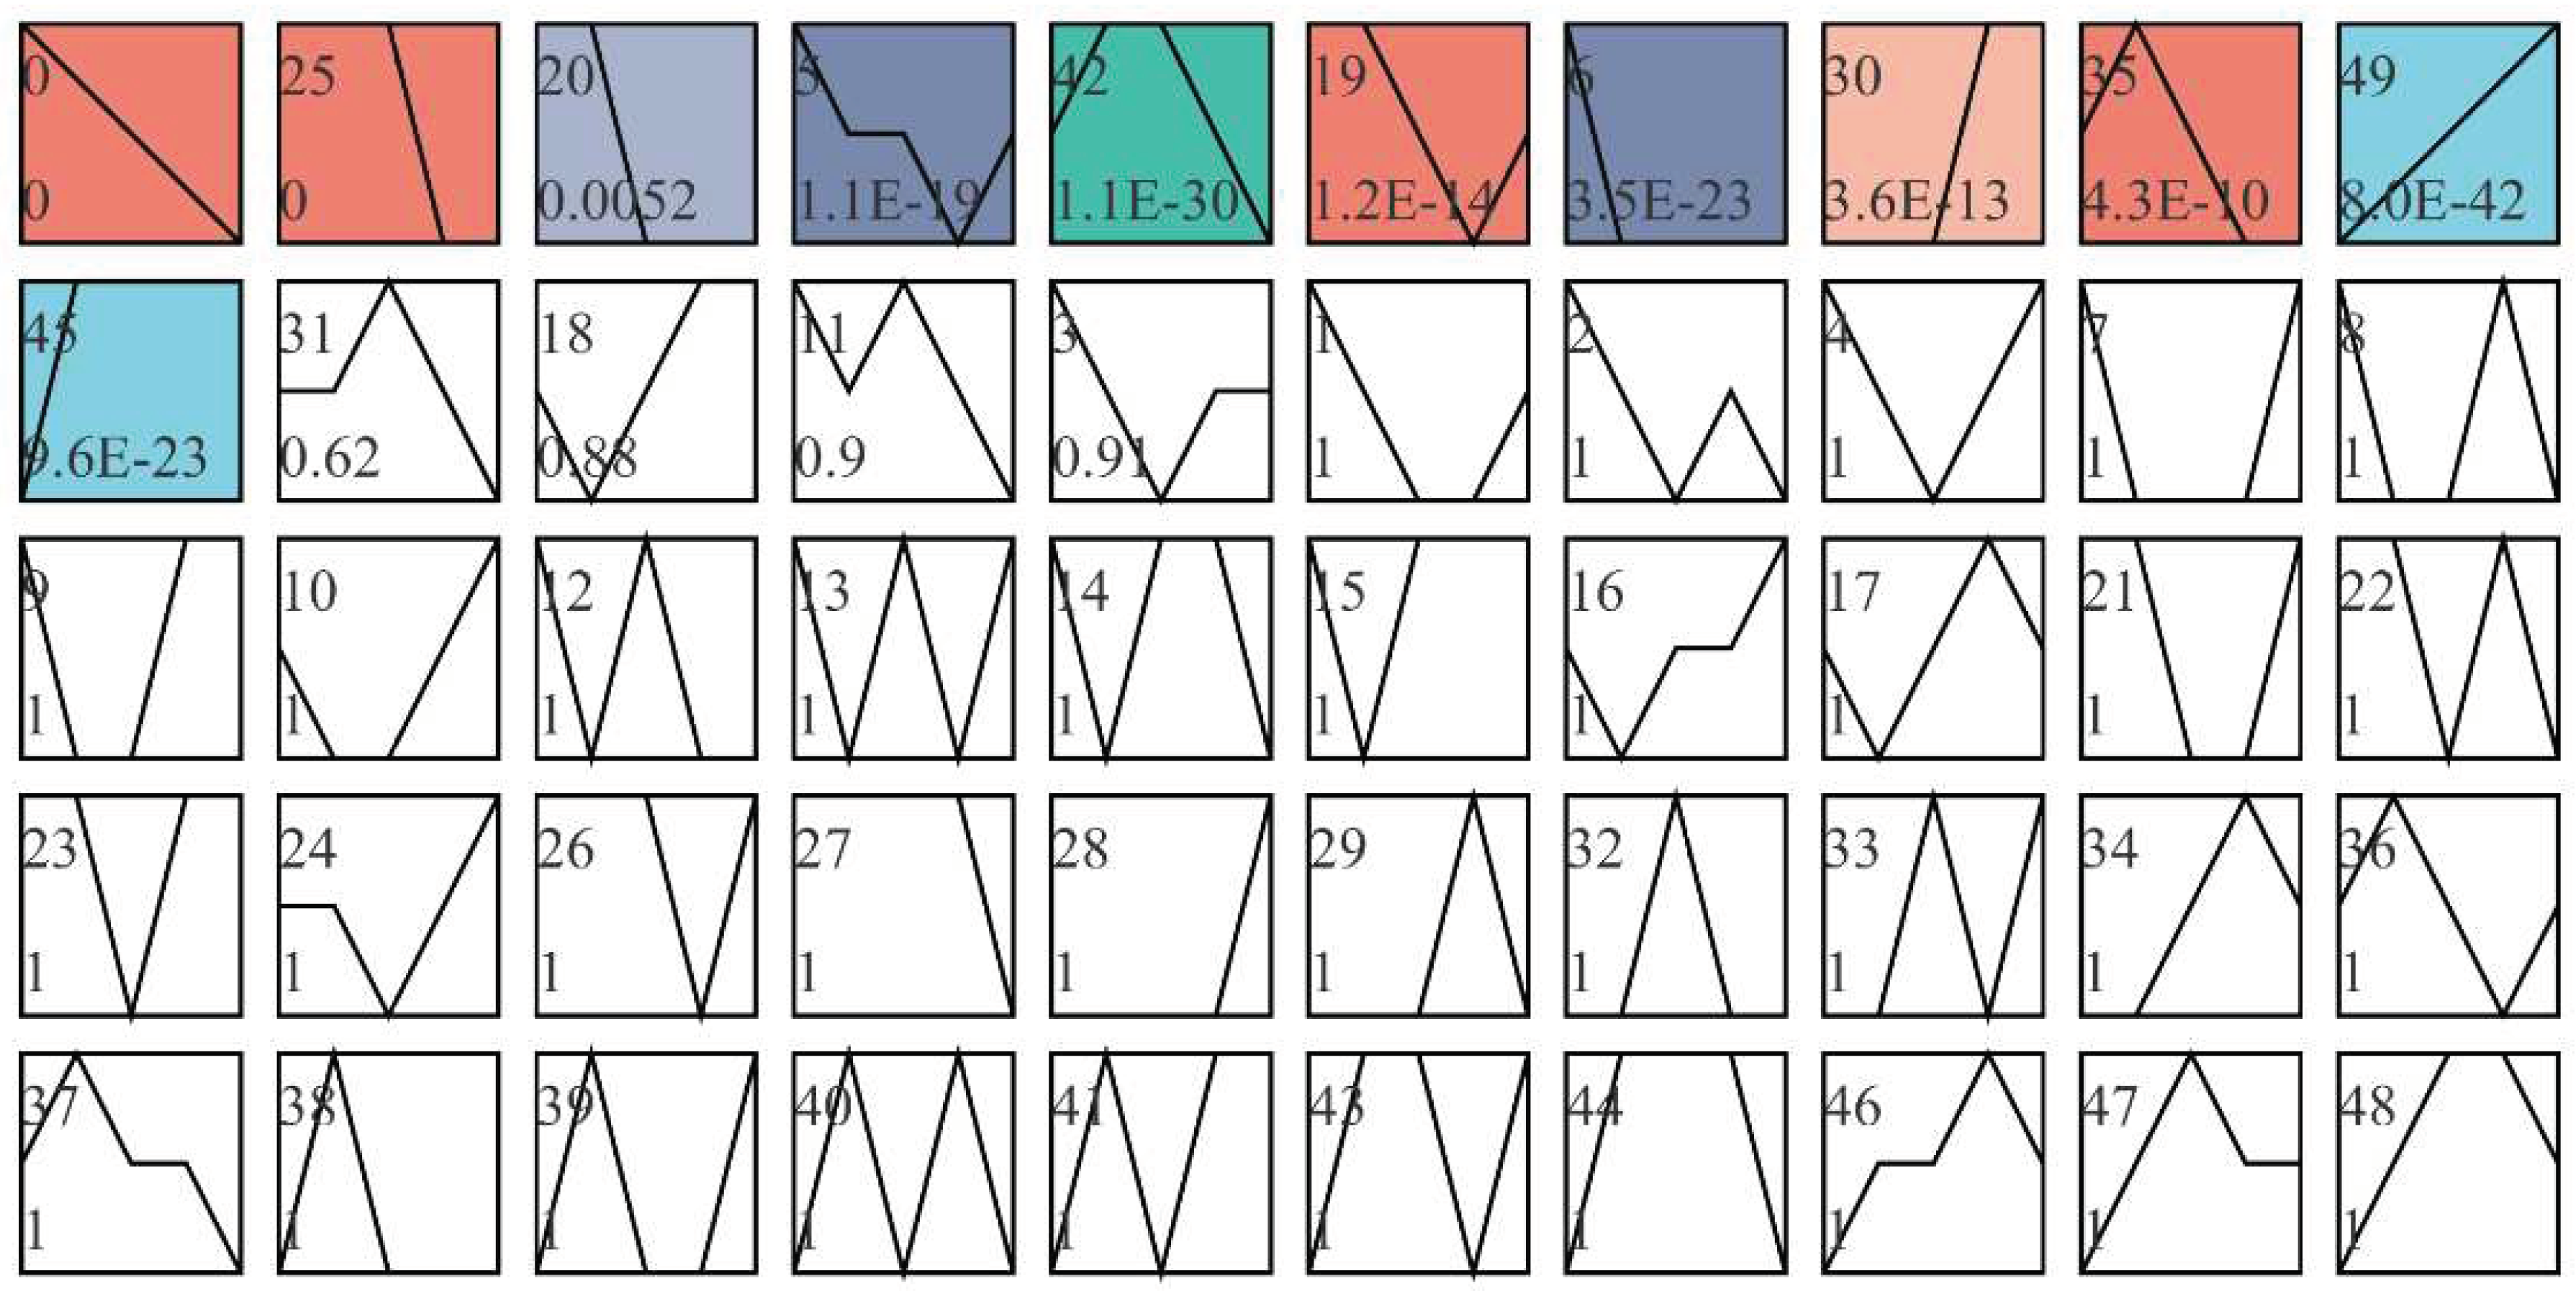
Trend analysis was conducted on the screened significantly different genes. It can be seen from
Figure 7 that there were 11 modules with significant differences, among which the differentially expressed genes in modules 0 and 25 were grouped into a group with downward trend. The differentially expressed genes in modules 30 and 49 were clustered into a group and showed an upward trend. Other modules with color change rules are inconsistent, and the difference between modules without filling color is not significant.
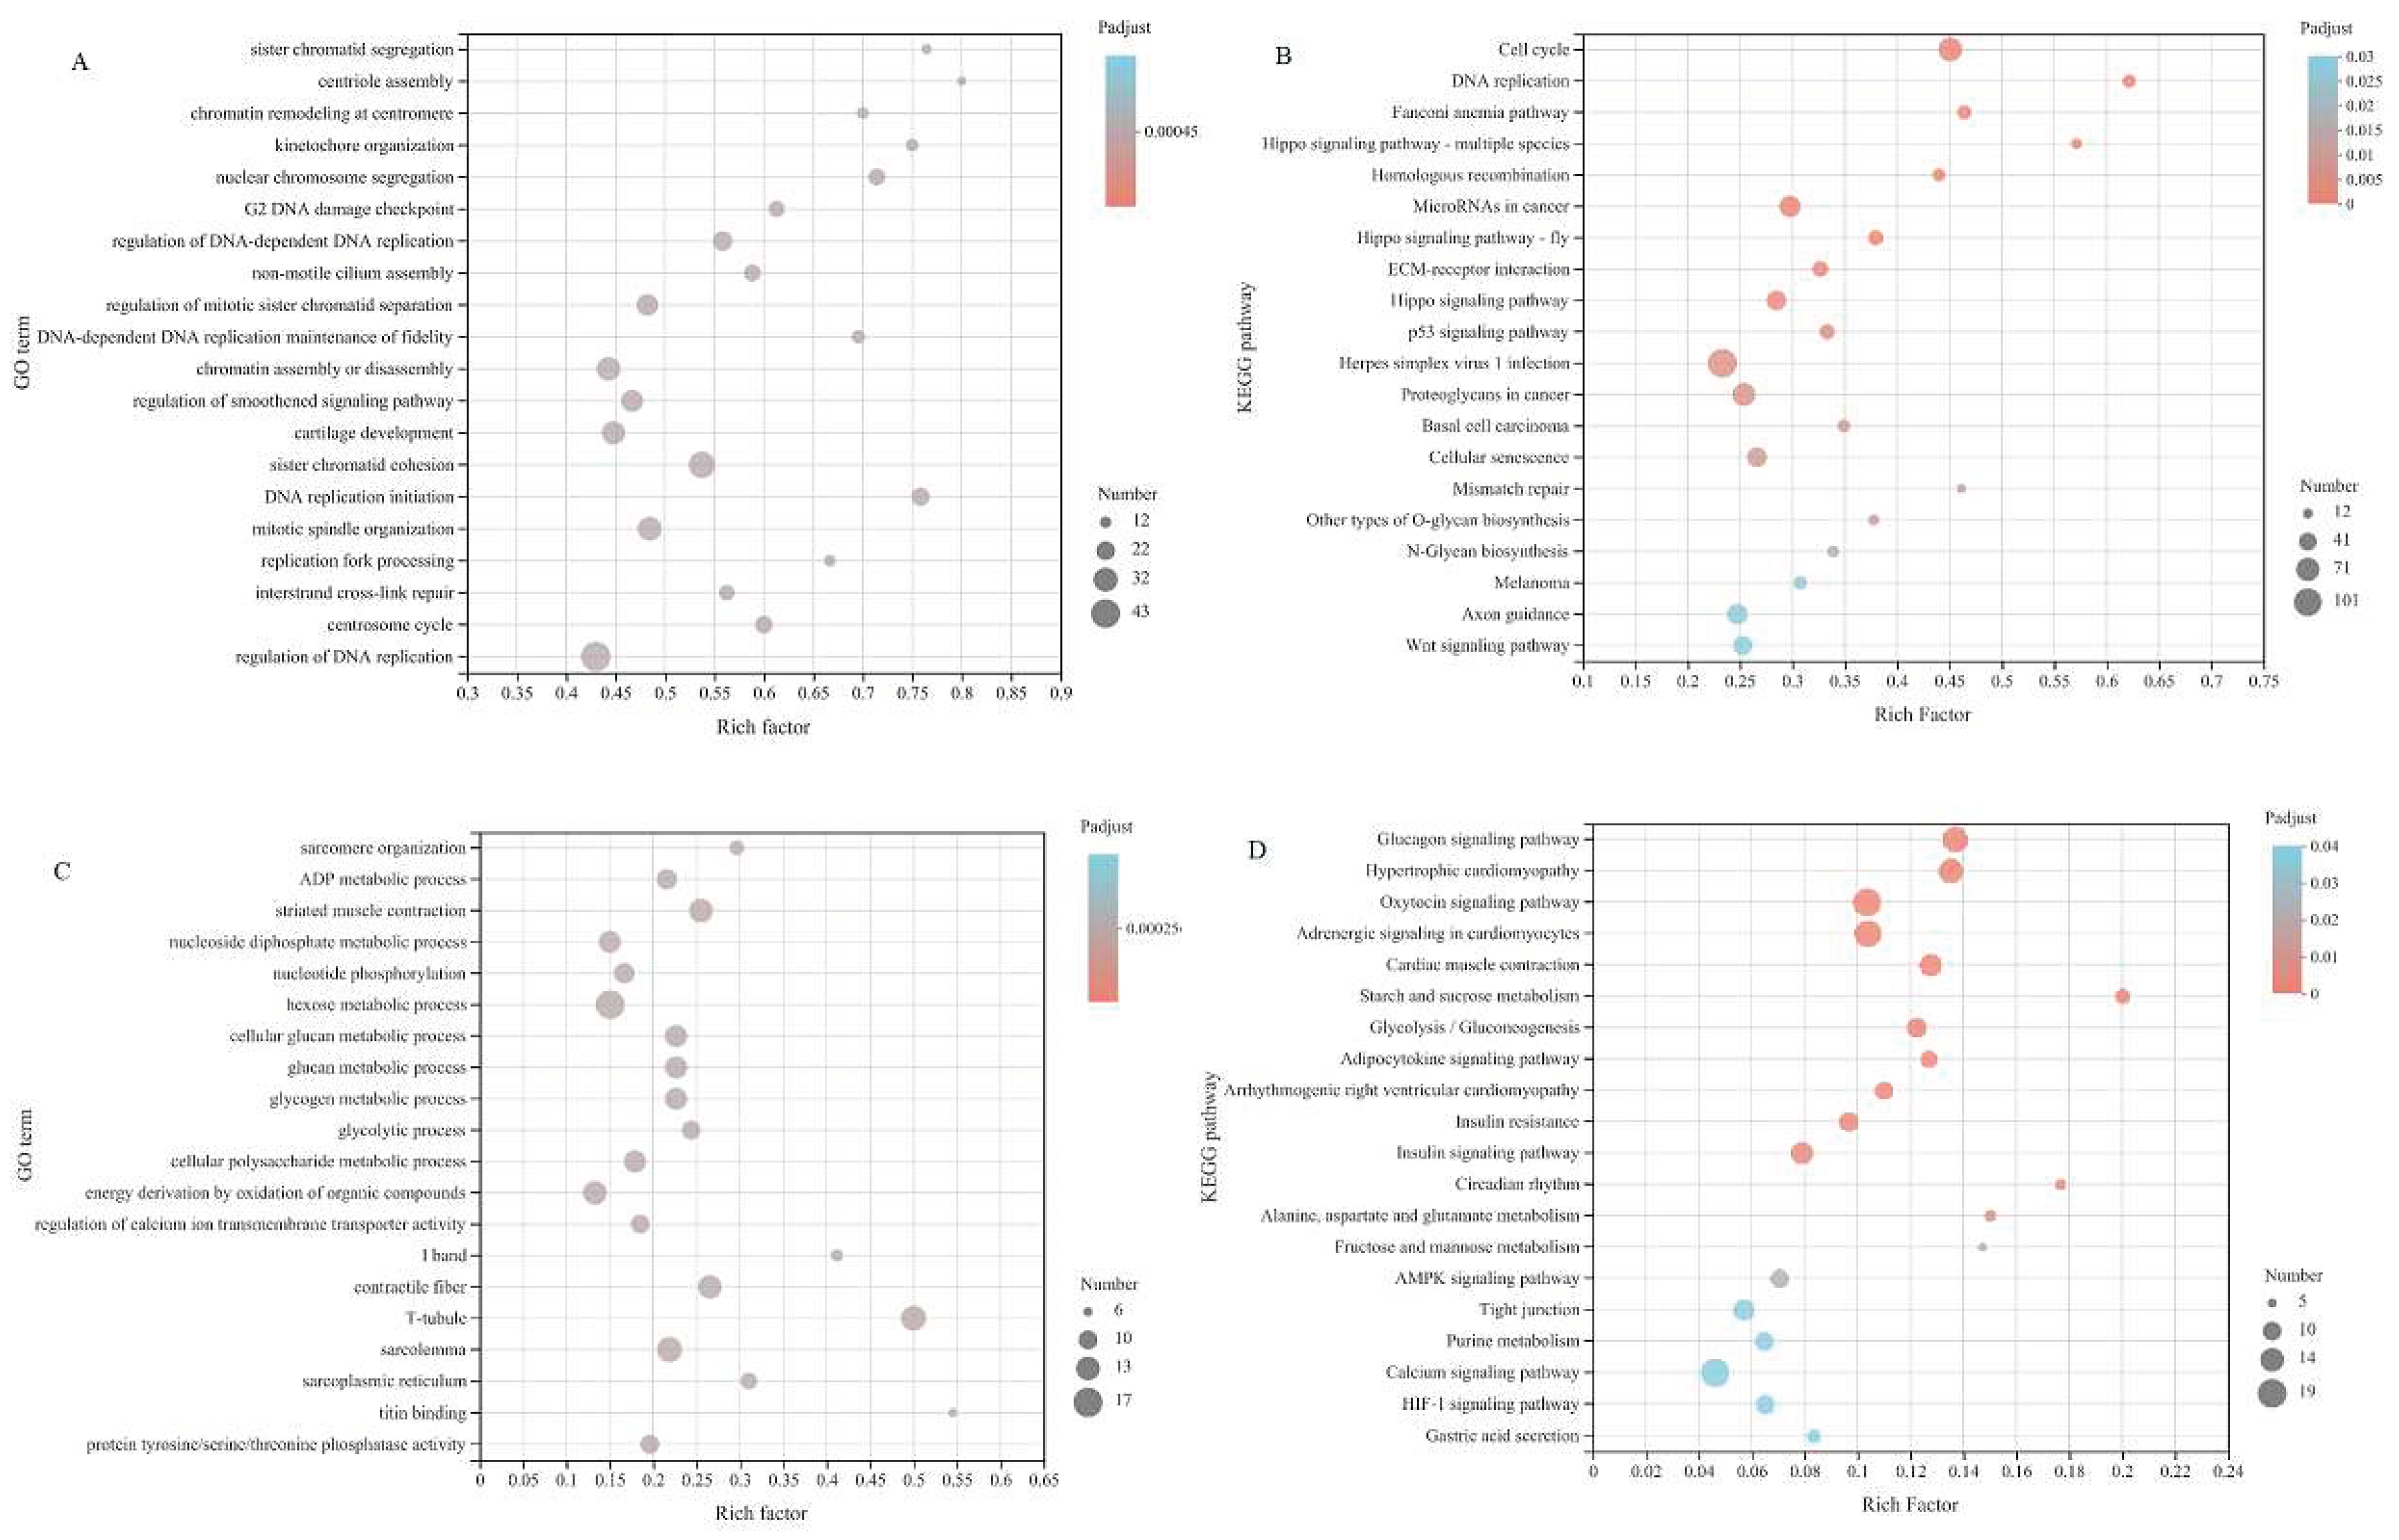
The gene sets of module 0 and 25 were combined, and GO and KEGG enrichment analysis were performed. The GO results (FIG. 8(A)) showed that the differential expression genes were mainly in the regulation of smoothened signaling pathway and skeletal organs system development and other process rich collection; KEGG results showed that differential expression genes were mainly enriched in Hippo signaling pathway, ECM-receptor interaction, Wnt signaling pathway and other processes (
Figure 8(B)). The gene sets of module 45 and 49 were merged and analyzed by GO and KEGG enrichment. The GO results showed (FIG. 8(C)) that the differential expression genes were mainly enriched to sarcomere organization, structural constituent of muscle, muscle cell development. KEGG results showed (
Figure 8(D)) that the differential expression genes were mainly enriched in AMPK signaling pathway and other processes.
3.6. Alternative splice(AS) in Rabbit Skeletal Muscle
The complexity of gene expression and the diversity of eukaryotic transcriptome were revealed by analysis of AS. AS was analyzed in two consecutive groups at the 4 development stages of Fujian white rabbits. Five major different AS types were detected, including skipped exons (SE), retained introns (RI), alternative 5´ splice s ites (A5SS), alternative 3´ splice sites (A3SS) and mutually exclusive exons (MXEs). Among all comparison groups, SE was the most abundant AS event, accounting for 75.48-76.15% of the total (
Table 4). The probability of other events from the lowest to highest was RI (0.60-0.67%), A5SS (2.31-2.32%), A3SS (3.80–3.90%), MXE (17.04-17.72%) (
Table 4). In addition, the most difference of differential expression AS events (Diff. exp events) was SE(539-2178). Other Diff. exp events from the highest to lowest was RI (12-43), A5SS (54-234%), A3SS (55-331), MXE (76-513) (
Table 4). Interestingly, among all comparison stages Diff. exp events was obviously the lowest from the B30 to B60 stage (
Table 4).
3.7. qPCR Analysis
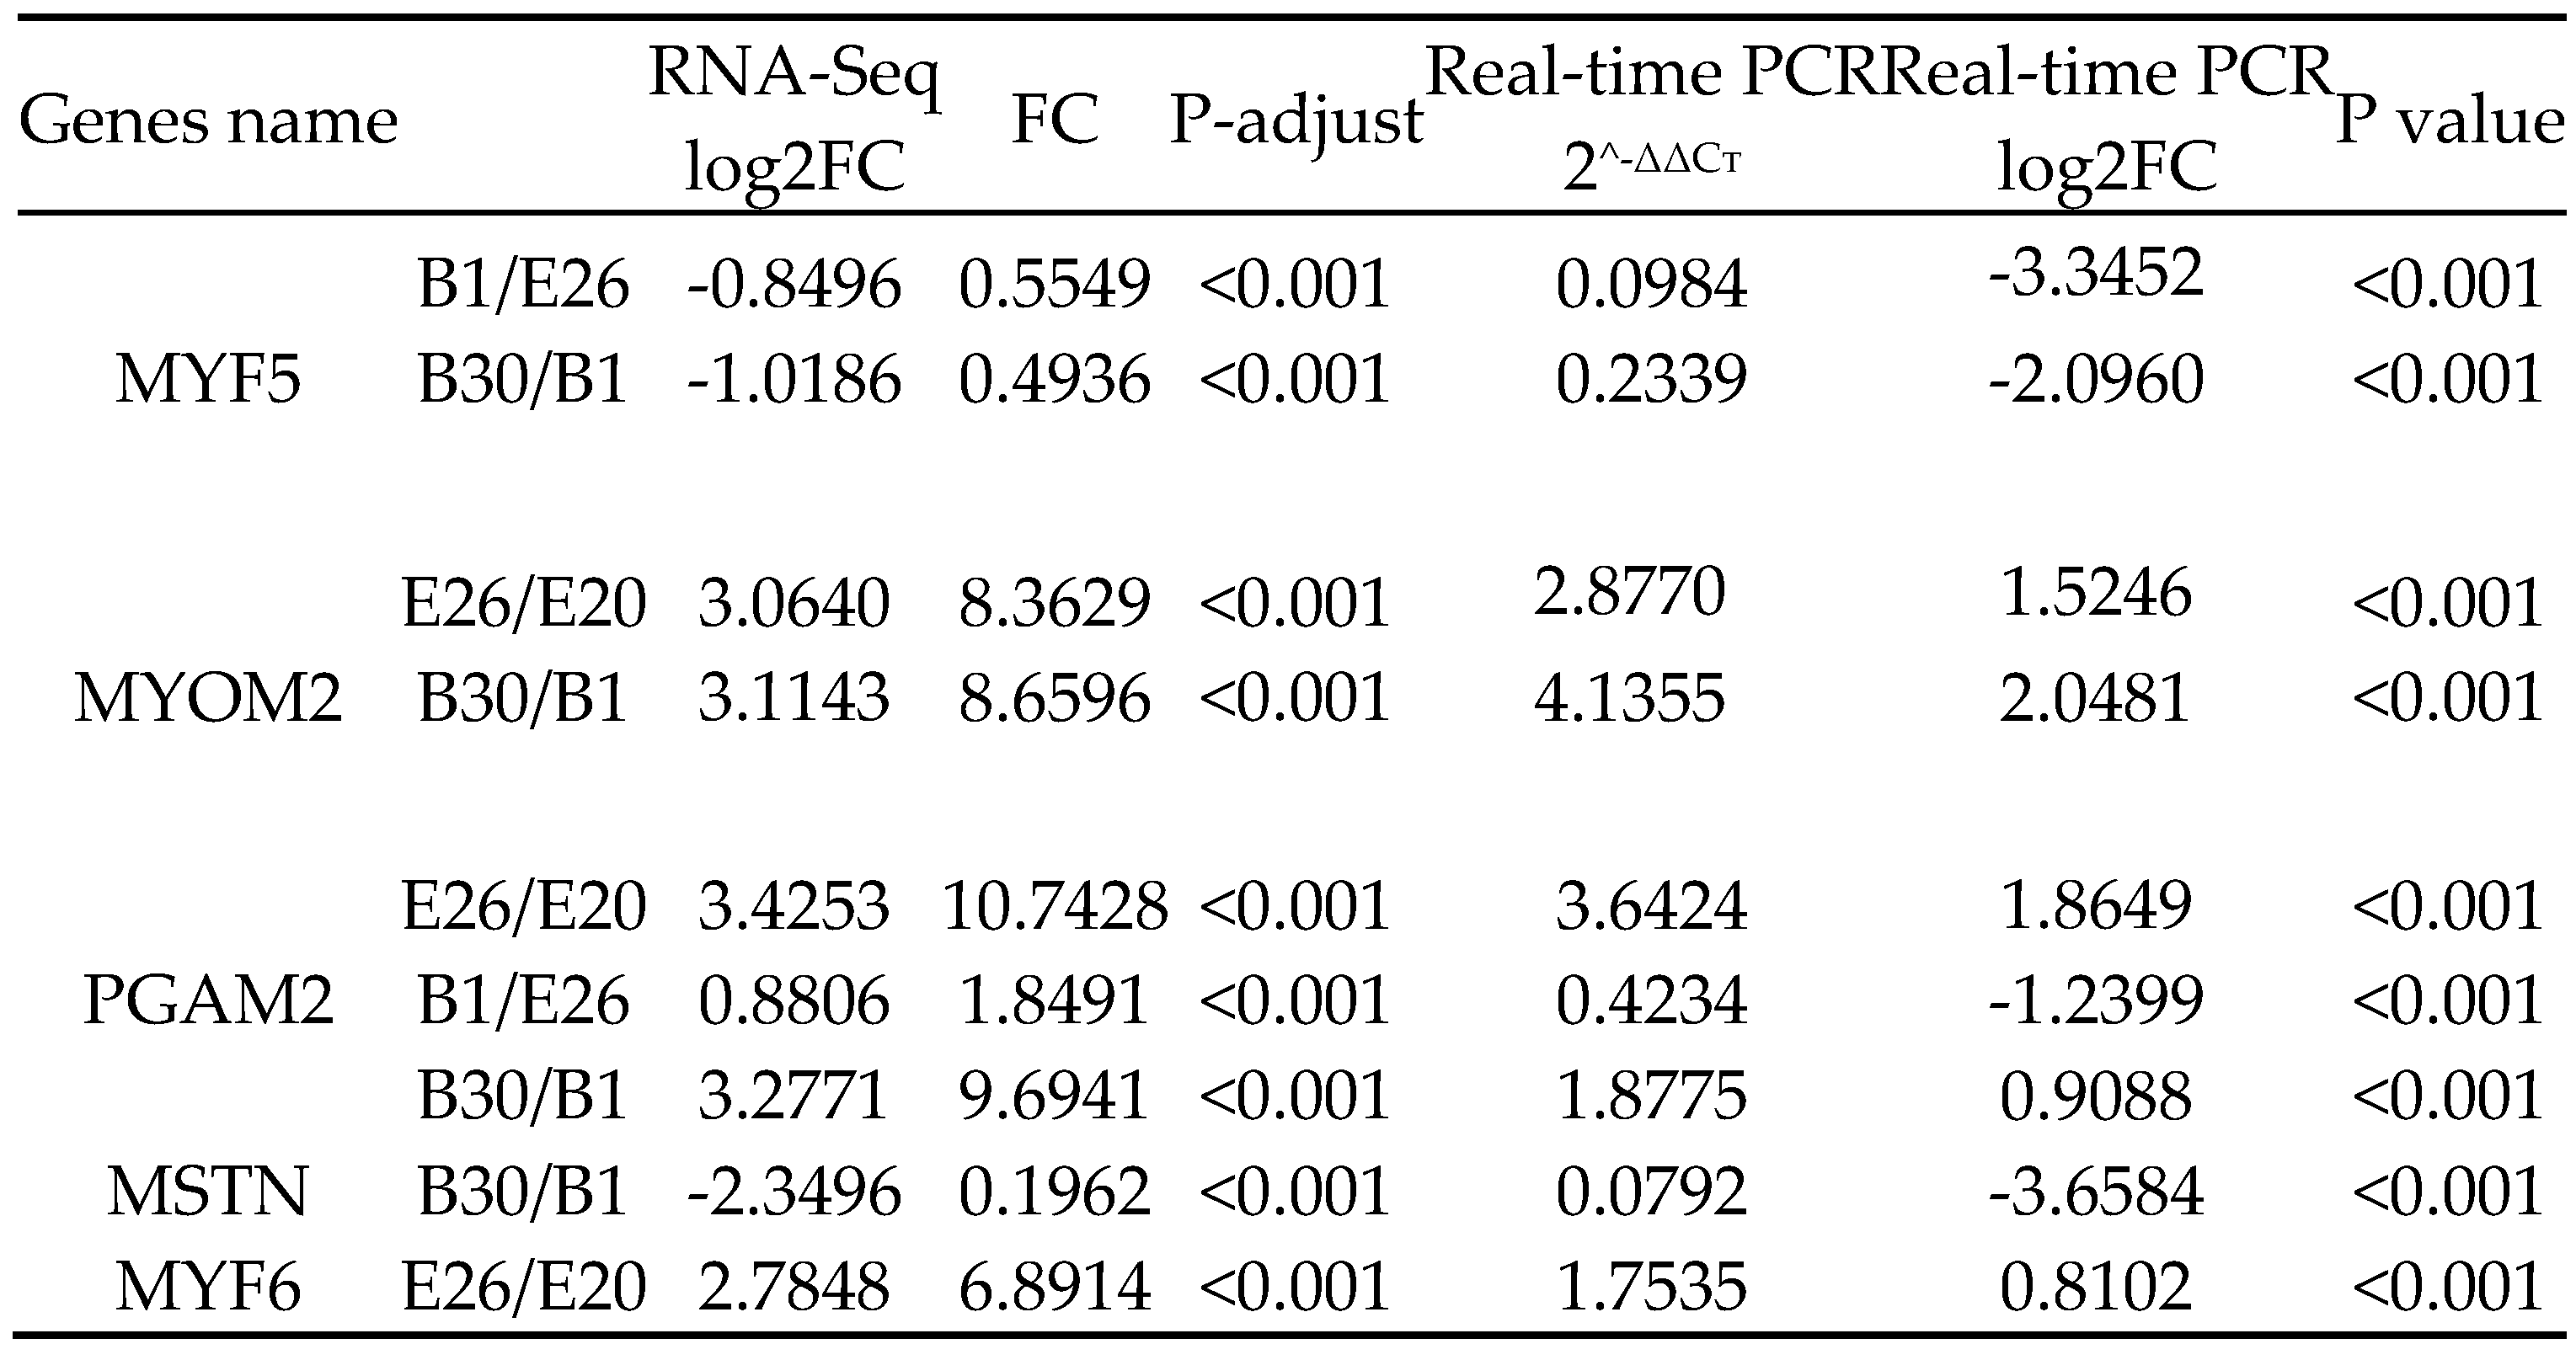
Five differential genes were randomly selected for qPCR verification, and the expression levels of MYF5, MYOM2, PGAM2, MSTN and MYF6 genes in longissimus dorsi muscle were consistent with transcriptome sequencing results (
Table 5).
4. Discussion
Rabbit meat which has high protein, low fat, low cholesterol is more and more favored by people. Therefore, it is particularly important to explore the regulatory mechanism of muscle growth and development in meat rabbits. Muscle growth and development is a complex biological process, which is influenced by genetic, environmental, nutritional and other factors. Most previous studies have looked at the role of genetic factors in muscle growth and development from a single gene, which has some limitations. Since muscle growth and development is regulated by a complex network of multiple genes, exploring the transcriptome regulation of Fujian white rabbits from embryonic stage to postnatal stage is important for the molecular breeding process of meat rabbits. In particular, comparative transcriptome analyses at different growth stages provide meaningful insights into the question of how regulatory gene networks control biological processes [
5,
8,
34,
35]. However, it has not been reported in different developmental stages of rabbit muscle tissue, including embryonic stage and infant stage.
4.1. DEGs Analyzed at FOUR stages
The differential expression of growth and development related genes is considered to be the main cause of genetic variation during animal growth, indicating that the regulatory mechanism of growth and development has changed [
5,
36].In this study, there were the most DEGs in the stage B1 vs. B30, and then in E20 vs. E26,which means muscle in rabbit may grow rapidly in the two stages . The stage B30 vs. B60 has least DEGs, which may indicate muscle growth is regulated by fewer genes, mainly muscle fiber enlargement and thickening. The differential genes were mainly enriched in muscle structure and growth and development related categories, which was consistent with the rapid development stage of B1 vs. B30, E20 vs. E26 and muscle fiber in the periods. Kuang et al.[
21] found that 5 320 differential expression genes were obtained between 26 days and 18 days of the embryonic age in Qixing rabbit, were significantly enriched in cancer pathway, cytoskeleton regulatory pathway, pi3k-akt signaling pathway and RAP1 signaling pathway. In E20 vs. E26, 2384 DEGs of Fujian white rabbit were enriched in 331 pathways, of which 26 pathways were significantly enriched, mainly in Hypertrophic cardiomyopathy (HCM), Cardiac muscle contraction, Arrhythmogenic right ventricular cardiomyopathy (ARVC), Basal cell carcinoma, Adrenergic signaling in cardiomyocytes and Cushing syndrome.
From the point of view of livestock production, skeletal muscle is undoubtedly the most important tissue. Muscle growth and development include two processes, hypertrophy of muscle fibers. Fetal muscle fibers have been established after birth, there is no longer a net increase, muscle development simply because of muscle fiber volume increase. Thus, the fetal period is a critical period for skeletal muscle development[
37].The average gestation period of rabbits is 30 days, and embryo development goes through three stages: embryonic stage (about 12 days), preembryonic stage (about 6 days) and fetal stage (about 12 days). Its growth rate is greatest in the fetal period, which accounts for about 90% of the weight of the whole embryonic period. The embryonic myogenesis process is regulated by a series of transcription factors, including Wnt, paired nuclear genes (Pax) 3 and Pax7, and Myogenic regulatory factors (MRFs).
Muscles of livestock and poultry can be divided into three main groups: skeletal muscle, cardiac muscle, and smooth muscle. Skeletal muscle accounts for about 40% of the body weight of livestock and poultry, and is an important component of meat quality. The growth and development of skeletal muscle is affected by many factors. The difference of species, breed, nutritional status and exercise degree will lead to the difference of skeletal muscle growth and development. Many hormones are also involved in the regulation of skeletal muscle growth and development. The molecular regulation of skeletal myogenesis is a very complex process, including embryonic skeletal muscle genesis and adult skeletal muscle regeneration, which involves the regulation of many molecules, including Pax3/ Pax7[
38,
39], myogenic regulatory factors (MRFs)[
40,
41], Myostatin[
42,
43].
Myogenic regulatory factors (MRFs) is considered an important gene involving in the molecular control during muscle process, which is also a crucial factor in maintain skeletal muscle cell differentiation and growth[
44]. The MRFs include Myogenic differentiation 1 (MyoD1), Myogenic factor 5 (Myf5), MRF4 (also named Myf6) and myogenin (Myog) genes [
45]. In the process of muscle differentiation, the Myf5 gene is the first expression gene in MRFs, which act as a decisive effect[
46]. Myogenic factor 6 (MYF6) is the most abundantly expressed myogenic factor in adult muscle[
47]. Moreover, MYF6 tends to be expressed more highly in muscle tissue of the lean selection line and is supposed to be one promising candidate gene for growth and meat quality related traits in adult pigs[
48].
The M-band mainly myomesin proteins including their embryonic heart (EH) isoform, titin and obscurin is a well-recognized mechanical and signaling hub dealing with active forces during contraction. Myomesin-2 (MYOM2, also known as M-protein) is mainly expressed in the cardiac and fast skeletal muscles[
49]. Phosphoglycerate mutase 2 (PGAM2) is a key enzyme during glycolysis and gluconeogenesis, which plays an important role in regulating energy metabolism and controlling growth rate in livestock. PGAM2 encodes a glycolytic enzyme that catalyzes the conversion of 3-phosphoglycerate into 2-phosphoglycerate. It is expressed mainly in skeletal and cardiac muscles, as well as in kidney[
50]. This gene is located in a region of porcine chromosome 18 [
51], where a quantitative trait locus (QTL) responsible for carcass quality, lean content, and muscle fiber diameter had been identified [
52]. PGAM2 protein influenced the development of skeletal muscle and was associated with feed conversion , growth, and slaughter traits in pigs [
53].In rabbits, PGAM2 is one of the candidate genes affecting body weight at 84 days and average day gain [
54].Myostatin (MSTN) is a negative regulator of skeletal muscle growth and plays an important role in muscle development[
55]. The expression of MSTN can be detected both pre and post-natally. MSTN-null mice showed a dramatic and widespread increase in skeletal muscle mass[
56]. Other studies had showed that MSTN gene has effects on skeletal muscle development in cattles[
57], goats[
58], pigs[
59], and rabbits[
60,
61].
4.2. GO and KEGG Pathway
Predicted differentially expressed genes Myosin heavy chain 13 (MYH13), Troponin I1 (Troponin I1, slow skeletal type, TNNI1), ATPase sarcoplasmic/endoplasmic reticulum Ca2+ transporting 2, Atpase sarcoplasmic/endoplasmic reticulum Ca2+ transporting 2, ATP2A2), Myosin heavy chain 7 (MYH7), Leiomodin 2 (LMOD2), Titin-cap (TCAP), Troponin C (Troponin C, TNNC1) and Myosin light chain 2 (MYL2) may be related to muscle growth and meat quality.
4.3. Prediction of AS
Ubiquitous in most eukaryotic genomes, AS is a mechanism by which organisms enriche their protein pool and regulate physiological and developmental processes[
62,
63]. Precursor mRNA of AS plays an important role in the regulation of gene expression in higher eukaryotes. Multiple mRNAs can be derived from a single pre mRNA to produce proteins with different functions, which indicates that AS is an important mechanism for regulating life [
29]. Due to the lack of detailed full-length cDNA data and high-quality genome annotation, there are few studies about AS in rabbits. In our study, SE was the most abundant AS event, accounting for 75.48–76.15% of the total, which indicated that the AS of rabbit skeletal muscle growth and development mainly existed in skipped exons.
5. Conclusions
In this study, transcriptome data at 5 developmental stages from fetus to kids was profiled by RNA-Seq technology, which will be helpful to further understand the molecular sequences and functions of genes related to skeletal muscle growth in Fujian White rabbits at different stages. There were differences in the expression of genes at different growth stages, including highly expressed genes, pathways and AS. These findings will provide valuable resources for the biological researches of skeletal muscle growth related genes in Fujian white rabbit and may also provide clues for understanding the molecular mechanisms in other rabbit and mammalian species.
Author Contributions
X.P. contributed to the conception of the study; D.J., S.K., Y.F. performed the experiment; D.J., X.P., performed the data analyses and wrote the manuscript; J.X., L., C.F. helped perform the analysis with constructive discussions. All authors read and approved the manuscript.
Funding
This research was funded by China Agriculture Research System (CARS-43-G-5), Public welfare scientific research project of Fujian Province (2021R1026004), Natural Science Foundation of Fujian Province (2022J01465).
Acknowledgments
The authors are thankful to the Fujian White Rabbit Ecological Breeding Farm, Chatouling, Wuping County, Fujian, China for the rabbit support for this experiment. We are particularly grateful to Mr.Wu Xu and Mr. Li Linming for their support and help in the process of analysis.
Conflicts of Interest
The authors declare that they have no conflict of interest.
References
- Cullere, M.; Zotte, A. D. , Rabbit meat production and consumption: State of knowledge and future perspectives. Meat Science 2018, 143, 137–146. [Google Scholar] [CrossRef] [PubMed]
- Liu, H. Z. , A survey report on the present situation of technical system of Chinese rabbit industry. Chinese journal of rabbit farming 2012, (1), 20–23. [Google Scholar]
- Liu H., Z. , Research report of domestic rabbit industry technology system. Chinese journal of rabbit farming 2007, (06), 3–5. [Google Scholar]
- Bi, P.; Ramirez-Martinez, A.; Li, H.; Cannavino, J.; McAnally, J. R.; Shelton, J. M.; Sanchez-Ortiz, E.; Bassel-Duby, R.; Olson, E. N. , Control of muscle formation by the fusogenic micropeptide myomixer. Science 2017, 356(6335), 323–327. [Google Scholar] [CrossRef] [PubMed]
- Hu, Z.; Cao, J.; Liu, G.; Zhang, H.; Liu, X. Comparative Transcriptome Profiling of Skeletal Muscle from Black Muscovy Duck at Different Growth Stages Using RNA-seq. Genes (Basel) 2020, 11(10). [Google Scholar] [CrossRef]
- Hettmer, S.; Wagers, A. J. , Muscling in: Uncovering the origins of rhabdomyosarcoma. Nature Medicine 2010, 16(2), 171–173. [Google Scholar] [CrossRef] [PubMed]
- Chen, F.; Wu, P.; Shen, M.; He, M.; Chen, L.; Qiu, C.; Shi, H.; Zhang, T.; Wang, J.; Xie, K.; Dai, G.; Wang, J.; Zhang, G. Transcriptome Analysis of Differentially Expressed Genes Related to the Growth and Development of the Jinghai Yellow Chicken. Genes (Basel) 2019, 10(7). [Google Scholar] [CrossRef] [PubMed]
- Huang, X.; Zhou, W.; Cao, H.; Zhang, H.; Xiang, X.; Yin, Z. , Ovarian Transcriptomic Analysis of Ninghai Indigenous Chickens at Different Egg-Laying Periods. Genes (Basel) 2022, 13(4). [Google Scholar] [CrossRef]
- <Integration analysis of metabolome and transcriptome profiles revealed the__age-dependent dynamic change in chicken meat.pdf>. [CrossRef]
- Marchesi, J. A. P.; Ibelli, A. M. G.; Peixoto, J. O.; Cantao, M. E.; Pandolfi, J. R. C.; Marciano, C. M. M.; Zanella, R.; Settles, M. L.; Coutinho, L. L.; Ledur, M. C. , Whole transcriptome analysis of the pectoralis major muscle reveals molecular mechanisms involved with white striping in broiler chickens. Poult Sci 2019, 98(2), 590–601. [Google Scholar] [CrossRef]
- Yin, Z.; Zhou, W.; Mao, H.; Dong, X.; Huang, X.; Zhang, H.; Liu, H. , Identification of Genes Related to Squab Muscle Growth and Lipid Metabolism from Transcriptome Profiles of Breast Muscle and Liver in Domestic Pigeon (Columba livia). Animals (Basel) 2022, 12(9). [Google Scholar] [CrossRef]
- Zhou, J.; Liao, Z.; Chen, J.; Zhao, K.; Xiao, Q. , Integrated study on comparative transcriptome and skeletal muscle function in aged rats. Mech Ageing Dev 2018, 169, 32–39. [Google Scholar] [CrossRef]
- Zhang, Y.; Wang, H.; Tu, W.; Abbas Raza, S. H.; Cao, J.; Huang, J.; Wu, H.; Fan, C.; Wang, S.; Zhao, Y.; Tan, Y. , Comparative Transcriptome Analysis Provides Insight into Spatio-Temporal Expression Characteristics and Genetic Regulatory Network in Postnatal Developing Subcutaneous and Visceral Fat of Bama Pig. Front Genet 2022, 13, 844833. [Google Scholar] [CrossRef] [PubMed]
- <Transcriptome changes in newborn goats’ skeletal muscle as a result of maternal feed restriction at different stages of gestation.pdf>. [CrossRef]
- Zhan, S.; Xue, Y.; Yang, L.; Li, D.; Dai, H.; Zhong, T.; Wang, L.; Dai, D.; Li, L.; Zhang, H. , Transcriptome analysis reveals long non-coding natural antisense transcripts involved in muscle development in fetal goat (Capra hircus). Genomics 2022, 114(2), 110284. [Google Scholar] [CrossRef] [PubMed]
- Peng, H.; Hu, M.; Liu, Z.; Lai, W.; Shi, L.; Zhao, Z.; Ma, H.; Li, Y.; Yan, S. , Transcriptome Analysis of the Liver and Muscle Tissues of Dorper and Small-Tailed Han Sheep. Front Genet 2022, 13, 868717. [Google Scholar] [CrossRef] [PubMed]
- <Transcriptome and metabolome analyses reveal muscle changes in Tan sheep (Ovis aries) at different ages.pdf>. [CrossRef]
- <Transcriptome profiling reveals differential expression of genes potentially involved in muscle and adipose tissue development of cattle.pdf>. [CrossRef]
- Santos Silva, D. B. D.; Fonseca, L. F. S.; Magalhaes, A. F. B.; Muniz, M. M. M.; Baldi, F.; Ferro, J. A.; Chardulo, L. A. L.; Pinheiro, D. G.; Albuquerque, L. G. , Transcriptome profiling of muscle in Nelore cattle phenotypically divergent for the ribeye muscle area. Genomics 2020, 112(2), 1257–1263. [Google Scholar] [CrossRef]
- Bao, T.; Han, H.; Li, B.; Zhao, Y.; Bou, G.; Zhang, X.; Du, M.; Zhao, R.; Mongke, T.; Laxima; Ding, W. ; Jia, Z.; Dugarjaviin, M.; Bai, D., The distinct transcriptomes of fast-twitch and slow-twitch muscles in Mongolian horses. Comp Biochem Physiol Part D Genomics Proteomics 2020, 33, 100649. [Google Scholar] [CrossRef] [PubMed]
- Kuang L.; Lei M.; LI C.; ; et al. Transcriptome sequencing in Qixing rabbit and gene screening related to muscle growth and development. Heilongjiang Animal Science and Veterinary medicine. 2019, 14, 148-150,178. [CrossRef]
- Kuang, L.; Lei, M.; Zhang, X.; Li, C.; Zhen, J.; Guo, Z.; Ren, Y.; Zhang, C.; Yao, C.; Tang, L.; Xie, X. . Molecular mechanism analysis of regulation on growth and development in meat rabbits based on rna-seq transcriptome sequencing technology traits. Genomics and Applied Biology 2020, 39(2), 539–546. [Google Scholar] [CrossRef]
- Yan, D. Screening and effect analysis of key genes for growth performance of Hynlus meat rabbit. Master's degree. Henan Agricultural University 2021. [Google Scholar]
- Endo; Takeshi, Molecular mechanisms of skeletal muscle development, regeneration, and osteogenic conversion. Bone 2015, 80, 2–13. [CrossRef]
- Scaal, M.; Marcelle, C. , Chick muscle development. The International Journal of Developmental Biology 2018, 62(1-2-3), 127–136. [Google Scholar] [CrossRef]
- Ganassi, M.; Badodi, S.; Quiroga, H. P. O.; Zammit, P. S.; Hinits, Y.; Hughes, S. M. , Myogenin promotes myocyte fusion to balance fibre number and size. Nature Communications 2018, 9. [Google Scholar] [CrossRef] [PubMed]
- Guo, B.; Greenwood, P. L.; Cafe, L. M.; Zhou, G.; Zhang, W.; Dalrymple, B. P. Transcriptome analysis of cattle muscle identifies potential markers for skeletal muscle growth rate and major cell types. BMC Genomics 2015, 16(1). [Google Scholar] [CrossRef] [PubMed]
- Hutton, K. C.; Vaughn, M. A.; Litta, G.; Turner, B. J.; Starkey, J. D. , Effect of vitamin D status improvement with 25-hydroxycholecalciferol on skeletal muscle growth characteristics and satellite cell activity in broiler chickens1,2. Journal of Animal Science 2014, 92(8), 3291–3299. [Google Scholar] [CrossRef] [PubMed]
- Murach, K. A.; Fry, C. S.; Kirby, T. J.; Jackson, J. R.; Lee, J. D.; White, S. H.; Dupont-Versteegden, E. E.; Mccarthy, J. J.; Peterson, C. A. , Starring or Supporting Role? Satellite Cells and Skeletal Muscle Fiber Size Regulation. Physiology 2018, 33(1), 26–38. [Google Scholar] [CrossRef] [PubMed]
- Langmead, B.; Salzberg, S. L. , Fast gapped-read alignment with Bowtie 2. Nat Methods 2012, 9(4), 357–9. [Google Scholar] [CrossRef]
- Li, B.; Dewey, C. N. , RSEM: accurate transcript quantification from RNA-Seq data with or without a reference genome. BMC Bioinformatics 2011, 12, 323. [Google Scholar] [CrossRef]
- Xie, C.; Mao, X.; Huang, J.; Ding, Y.; Wu, J.; Dong, S.; Kong, L.; Gao, G.; Li, C. Y.; Wei, L. , KOBAS 2.0: a web server for annotation and identification of enriched pathways and diseases. Nucleic Acids Res 2011, 39 (Web Server issue), W316–22. [Google Scholar] [CrossRef]
-
!!! INVALID CITATION !!! [8].
- <Switches in transcriptome functions during seven skeletal muscle development stages from fetus to kid in Capra hircus (1).pdf>. [CrossRef]
- <大型迪庆藏猪不同生长阶段肌...长差异基因及其调控通路分析_聂靖茹.pdf>.
- Xue, Q.; Zhang, G.; Li, T.; Ling, J.; Zhang, X.; Wang, J. , Transcriptomic profile of leg muscle during early growth in chicken. PLoS One 2017, 12(3), e0173824. [Google Scholar] [CrossRef]
- Du, M.; Zhu, M. J., Fetal programming of skeletal muscle development. Applied Muscle Biology and Meat Science: 2009.
- Buckingham, M.; Relaix, F. , The role of Pax genes in the development of tissues and organs: Pax3 and Pax7 regulate muscle progenitor cell functions. Annual Review of Cell and Developmental Biology 2007, 23(1), 645–673. [Google Scholar] [CrossRef]
- Lagha, M.; Sato, T.; Bajard, L.; Daubas, P.; Esner, M.; Montarras, D.; Relaix, F.; Buckingham, M. , Regulation of Skeletal Muscle Stem Cell Behavior by Pax3 and Pax7. Cold Spring Harb Symp Quant Biol 2008, 73, 307–315. [Google Scholar] [CrossRef]
- Bismuth, K.; Relaix, F. , Genetic regulation of skeletal muscle development. Experimental cell research 2010, 316(18), 3081. [Google Scholar] [CrossRef] [PubMed]
- Mok, G. F.; Sweetman, D. , Many routes to the same destination: lessons from skeletal muscle development. Reproduction 2011, 141(3), 301. [Google Scholar] [CrossRef] [PubMed]
- Dominique, J. E.; Gérard, C. , Myostatin regulation of muscle development: Molecular basis, natural mutations, physiopathological aspects. Experimental Cell Research 2006, 312(13), 2401–2414. [Google Scholar] [CrossRef]
- Lutosawska, G.; Tkaczyk, J.; Kska, A. , MYOSTATIN AND ITS ROLE IN THE REGULATION OF MUSCLE MASS AND METABOLISM. Medicina Sportiva 2012, 16(4), 165–174. [Google Scholar] [CrossRef]
- Zammit, P. S. , Function of the myogenic regulatory factors Myf5, MyoD, Myogenin and MRF4 in skeletal muscle, satellite cells and regenerative myogenesis. Seminars in Cell & Developmental Biology 2017, 72, 19–32. [Google Scholar]
- Asfour; Hasan, A.; Allouh; Mohammed, Z.; Said; Raed, S., Myogenic regulatory factors: The orchestrators of myogenesis after 30 years of discovery. Experimental Biology and Medicine: Journal of the Society for Experimental Biology and Medicine 2018.
- b, J. M. H.-H. a.; b, E. G. G.-G. a.; B, C. E. B. A.; B, M. A. R. A., The myogenic regulatory factors, determinants of muscle development, cell identity and regeneration - ScienceDirect. Seminars in Cell & Developmental Biology 2017, 72, 10-18.
- Fan, H.; Cinar, M. U.; Phatsara, C.; Tesfaye, D.; Tholen, E.; Looft, C.; Schellander, K. , Molecular mechanism underlying the differential MYF6 expression in postnatal skeletal muscle of Duroc and Pietrain breeds. Gene 2011, 486(1), 8–14. [Google Scholar] [CrossRef]
- Maak, S.; Neumann, K.; Swalve, H. H. , Identification and analysis of putative regulatory sequences for the MYF5/MYF6 locus in different vertebrate species. Gene 2006, 379, 141–7. [Google Scholar] [CrossRef] [PubMed]
- Lamber, E. P.; Guicheney, P.; Pinotsis, N. , The role of the M-band myomesin proteins in muscle integrity and cardiac disease. Journal of Biomedical Science 2022, 29(1), 1–15. [Google Scholar] [CrossRef]
- Qiu, H.; Zhao, S.; Xu, X.; Yerle, M.; Liu, B. , Assignment and expression patterns of porcine muscle-specific isoform of phosphoglycerate mutase gene. Journal of Genetics and Genomics 2008, 35(5), 257–260. [Google Scholar] [CrossRef]
- Dragos-Wendrich, M.; Stratil, A.; Hojny, J.; Moser, G.; Bartenschlager, H.; Reiner, G.; Geldermann, H. , Linkage and QTL mapping for Sus scrofa chromosome 18. Journal of Animal Breeding and Genetics 2003, 120, 138–143. [Google Scholar] [CrossRef]
- van Wijk, H. J.; Dibbits, B.; Baron, E. E.; Brings, A. D.; Harlizius, B.; Groenen, M. A. M.; Knol, E. F.; Bovenhuis, H. , Identification of quantitative trait loci for carcass composition and pork quality traits in a commercial finishing cross. Journal of Animal Science 2006, 84(4), 789–799. [Google Scholar] [CrossRef] [PubMed]
- Fontanesi, L.; Davoli, R.; Nanni Costa, L.; Beretti, F.; Scotti, E.; Tazzoli, M.; Tassone, F.; Colombo, M.; Buttazzoni, L.; Russo, V. , Investigation of candidate genes for glycolytic potential of porcine skeletal muscle: Association with meat quality and production traits in Italian Large White pigs. Meat Sci 2008, 80(3), 780–7. [Google Scholar] [CrossRef] [PubMed]
- Wu, Z. L.; Chen, S. Y.; Jia, X. B.; Lai, S. J. , Association of a synonymous mutation of the PGAM2 gene and growth traits in rabbits. Czech Journal of Animal Science 2016, 60 (No. 3), 139–144. [Google Scholar] [CrossRef]
- Liu, H. H.; Mao, H. G.; Dong, X. Y.; Cao, H. Y.; Liu, K.; Yin, Z. Z. , Expression of MSTN gene and its correlation with pectoralis muscle fiber traits in the domestic pigeons (Columba livia). Poult Sci 2019, 98(11), 5265–5271. [Google Scholar] [CrossRef] [PubMed]
- Mcpherron, A. C.; Lawler, A. M.; Lee, S. J. , Regulation of skeletal muscle mass in mice by a new TGF-psuperfamily member. Nature 1997, 387(6628), 83–90. [Google Scholar] [CrossRef] [PubMed]
- Grobet, L.; Poncelet, D.; Royo, L. J.; Brouwers, B.; Pirottin, D.; Michaux, C.; Ménissier, F.; Zanotti, M.; Georges, D. M. , Molecular definition of an allelic series of mutations disrupting the myostatin function and causing double-muscling in cattle. Mammalian Genome 1998. [Google Scholar] [CrossRef] [PubMed]
- Singh, S. P.; Kumari, P.; Kumar, R.; Negi, M.; Sharma, S. K.; Gangwar, M.; Kumar, S.; Mitra, A. , Molecular characterization and phylogeny based analysis of complete coding sequence of myostatin (MSTN) gene in Indian goat breeds. Small Ruminant Research 2014, 116(2), 100–110. [Google Scholar] [CrossRef]
- Gao, K.; Luo, Z.; Han, S.; Li, Z.; Choe, H. M.; Paek, H. J.; Quan, B.; Kang, J.; Yin, X. , Analysis of meat color, meat tenderness and fatty acid composition of meat in second filial hybrid offspring of MSTN mutant pigs. Meat Sci 2022, 193, 108929. [Google Scholar] [CrossRef]
- Zhang, T.; Lu, Y. Y.; Song, S. Z.; Lu, R.; Zhou, M. Y.; He, Z. Y.; Yuan, T. T.; Yan, K. N.; Cheng, Y. , 'Double-muscling' and pelvic tilt phenomena in rabbits with the cystine-knot motif deficiency of myostatin on exon 3. Bioscience Reports 2019, 39. [Google Scholar] [CrossRef]
- Zheng, Y.; Zhang, Y.; Wu, L.; Riaz, H.; Li, Z.; Shi, D.; Rehman, S. U.; Liu, Q.; Cui, K. , Generation of Heritable Prominent Double Muscle Buttock Rabbits via Novel Site Editing of Myostatin Gene Using CRISPR/Cas9 System. Front Vet Sci 2022, 9, 842074. [Google Scholar] [CrossRef]
- Lisa Traunmüller; Andrea M. Gomez; Thi-Minh Nguyen; Scheiffele, P., <Control of neuronal synapse specification by a highly dedicated alternative splicing program.pdf>. Science 2016, 352,.
- Kornblihtt, A. R.; Schor, I. E.; Allo, M.; Dujardin, G.; Petrillo, E.; Munoz, M. J. , Alternative splicing: a pivotal step between eukaryotic transcription and translation. Nat Rev Mol Cell Biol 2013, 14(3), 153–65. [Google Scholar] [CrossRef] [PubMed]
|
Disclaimer/Publisher’s Note: The statements, opinions and data contained in all publications are solely those of the individual author(s) and contributor(s) and not of MDPI and/or the editor(s). MDPI and/or the editor(s) disclaim responsibility for any injury to people or property resulting from any ideas, methods, instructions or products referred to in the content. |
© 2023 by the authors. Licensee MDPI, Basel, Switzerland. This article is an open access article distributed under the terms and conditions of the Creative Commons Attribution (CC BY) license (http://creativecommons.org/licenses/by/4.0/).
