Submitted:
05 June 2023
Posted:
06 June 2023
You are already at the latest version
Abstract
Keywords:
1. Introduction
2. Experimental Procedures
2.1. Synthesis of LE-MAX Phase
2.2. Preparation of LE-MXene
2.3. Material Characterization and Electrochemical Performance
3. Results and Discussion
4. Conclusions
Acknowledgments
References
- Naguib, M.; Kurtoglu, M.; Presser, V.; Lu, J.; Niu, J.; Heon, M.; Hultman, L.; Gogotsi, Y.; Barsoum, M.W. Two-dimensional nanocrystals produced by exfoliation of Ti3AlC2. Advanced Materials 2011, 23, 4248-4253. [CrossRef]
- Ghidiu, M.; Lukatskaya, M.R.; Zhao, M.-Q.; Gogotsi, Y.; Barsoum, M.W. Conductive two-dimensional titanium carbide 'clay' with high volumetric capacitance. Nature 2014, 516, 78-U171. [CrossRef]
- Naguib, M.; Mashtalir, O.; Carle, J.; Presser, V.; Lu, J.; Hultman, L.; Gogotsi, Y.; Barsoum, M.W. Two-dimensional transition metal carbides. Acs Nano 2012, 6, 1322-1331. [CrossRef]
- Zhang, X.; Zhang, Z.; Zhou, Z. MXene-based materials for electrochemical energy storage. Journal of Energy Chemistry 2018, 27, 73-85. [CrossRef]
- Naguib, M.; Come, J.; Dyatkin, B.; Presser, V.; Taberna, P.-L.; Simon, P.; Barsoum, M.W.; Gogotsi, Y. MXene: A promising transition metal carbide anode for lithium-ion batteries. Electrochemistry Communications 2012, 16, 61-64. [CrossRef]
- Kim, S.J.; Naguib, M.; Zhao, M.; Zhang, C.; Jung, H.-T.; Barsoum, M.W.; Gogotsi, Y. High mass loading, binder-free MXene anodes for high areal capacity Li-ion batteries. Electrochimica Acta 2015, 163, 246-251. [CrossRef]
- Lukatskaya, M.R.; Mashtalir, O.; Ren, C.E.; Dall'Agnese, Y.; Rozier, P.; Taberna, P.L.; Naguib, M.; Simon, P.; Barsoum, M.W.; Gogotsi, Y. Cation intercalation and high volumetric capacitance of two-dimensional titanium carbide. Science 2013, 341, 1502-1505. [CrossRef]
- Li, X.; Fan, G.; Zeng, C. Synthesis of ruthenium nanoparticles deposited on graphene-like transition metal carbide as an effective catalyst for the hydrolysis of sodium borohydride. International Journal of Hydrogen Energy 2014, 39, 14927-14934. [CrossRef]
- Gao, Y.; Wang, L.; Li, Z.; Zhou, A.; Hu, Q.; Cao, X. Preparation of MXene-Cu2O nanocomposite and effect on thermal decomposition of ammonium perchlorate. Solid State Sciences 2014, 35, 62-65. [CrossRef]
- Peng, Q.; Guo, J.; Zhang, Q.; Xiang, J.; Liu, B.; Zhou, A.; Liu, R.; Tian, Y. Unique lead adsorption behavior of activated hydroxyl group in two-dimensional titanium carbide. Journal of the American Chemical Society 2014, 136, 4113-4116. [CrossRef]
- Hu, Q.; Sun, D.; Wu, Q.; Wang, H.; Wang, L.; Liu, B.; Zhou, A.; He, J. MXene: A new family of promising hydrogen storage medium. Journal of Physical Chemistry A 2013, 117, 14253-14260. [CrossRef]
- Lin, H.; Wang, Y.; Gao, S.; Chen, Y.; Shi, J. Theranostic 2D tantalum carbide (MXene). Advanced Materials 2018, 30. [CrossRef]
- Yeh, J.W.; Chen, S.K.; Lin, S.J.; Gan, J.Y.; Chin, T.S.; Shun, T.T.; Tsau, C.H.; Chang, S.Y. Nanostructured high-entropy alloys with multiple principal elements: Novel alloy design concepts and outcomes. Advanced Engineering Materials 2004, 6, 299-303. [CrossRef]
- Cantor, B.; Chang, I.T.H.; Knight, P.; Vincent, A.J.B. Microstructural development in equiatomic multicomponent alloys. Materials Science and Engineering A-Structural Materials Properties Microstructure and Processing 2004, 375, 213-218. [CrossRef]
- Yeh, J.-W. Recent progress in high-entropy alloys. Annales De Chimie-Science Des Materiaux 2006, 31, 633-648. [CrossRef]
- Rost, C.M.; Sachet, E.; Borman, T.; Moballegh, A.; Dickey, E.C.; Hou, D.; Jones, J.L.; Curtarolo, S.; Maria, J.-P. Entropy-stabilized oxides. Nature Communications 2015, 6. [CrossRef]
- Du, Z.; Wu, C.; Chen, Y.; Cao, Z.; Hu, R.; Zhang, Y.; Gu, J.; Cui, Y.; Chen, H.; Shi, Y.; et al. High-entropy atomic layers of transition-metal carbides (MXenes). Advanced Materials 2021, 33. [CrossRef]
- Etman, A.S.; Zhou, J.; Rosen, J. Ti1.1V0.7CrxNb1.0Ta0.6C3Tz high-entropy MXene freestanding films for charge storage applications. Electrochemistry Communications 2022, 137. [CrossRef]
- Du, Z.; Wu, C.; Chen, Y.; Zhu, Q.; Cui, Y.; Wang, H.; Zhang, Y.; Chen, X.; Shang, J.; Li, B.; et al. High-entropy carbonitride MAX phases and their derivative MXenes. Advanced Energy Materials 2022, 12. [CrossRef]
- Ma, W.; Wang, M.; Yi, Q.; Huang, D.; Dang, J.; Lv, Z.; Lv, X.; Zhang, S. A new Ti2V0.9Cr0.1C2Tx MXene with ultrahigh gravimetric capacitance. Nano Energy 2022, 96. [CrossRef]
- Zhou, J.; Tao, Q.; Ahmed, B.; Palisaitis, J.; Persson, I.; Halim, J.; Barsoum, M.W.; Persson, P.O.A.; Rosen, J. High-entropy laminate metal carbide (MAX phase) and its two-dimensional derivative MXene. Chemistry of Materials 2022, 34, 2098-2106. [CrossRef]
- Yang, J.; Naguib, M.; Ghidiu, M.; Pan, L.-M.; Gu, J.; Nanda, J.; Halim, J.; Gogotsi, Y.; Barsoum, M.W. Two-dimensional Nb-based M4C3 solid solutions (MXenes). Journal of the American Ceramic Society 2016, 99, 660-666. [CrossRef]
- Cai, P.; He, Q.; Wang, L.; Liu, X.; Yin, J.; Liu, Y.; Huang, Y.; Huang, Z. Two-dimensional Nb-based M4C3Tx MXenes and their sodium storage performances. Ceramics International 2019, 45, 5761-5767. [CrossRef]
- Naguib, M.; Mochalin, V.N.; Barsoum, M.W.; Gogotsi, Y. 25th anniversary article: MXenes: A new family of two-dimensional materials. Advanced Materials 2014, 26, 992-1005. [CrossRef]
- Mashtalir, O.; Naguib, M.; Dyatkin, B.; Gogotsi, Y.; Barsoum, M.W. Kinetics of aluminum extraction from Ti3AlC2 in hydrofluoric acid. Materials Chemistry and Physics 2013, 139, 147-152. [CrossRef]
- Naguib, M.; Halim, J.; Lu, J.; Cook, K.M.; Hultman, L.; Gogotsi, Y.; Barsoum, M.W. New two-dimensional niobium and vanadium carbides as promising materials for Li-ion batteries. Journal of the American Chemical Society 2013, 135, 15966-15969. [CrossRef]
- Zhao, S.; Meng, X.; Zhu, K.; Du, F.; Chen, G.; Wei, Y.; Gogotsi, Y.; Gao, Y. Li-ion uptake and increase in interlayer spacing of Nb4C3 MXene. Energy Storage Materials 2017, 8, 42-48. [CrossRef]
- Ghidiu, M.; Naguib, M.; Shi, C.; Mashtalir, O.; Pan, L.M.; Zhang, B.; Yang, J.; Gogotsi, Y.; Billinge, S.J.L.; Barsoum, M.W. Synthesis and characterization of two-dimensional Nb4C3 (MXene). Chemical Communications 2014, 50, 9517-9520. [CrossRef]
- Lei, J.-C.; Zhang, X.; Zhou, Z. Recent advances in MXene: Preparation, properties, and applications. Frontiers of Physics 2015, 10, 276-286. [CrossRef]
- Zhan, R.; Zhang, Y.; Chen, H.; Xu, Q.; Ma, Q.; Gao, W.; Yang, T.; Jiang, J.; Bao, S.; Xu, M. High-rate and long-life sodium-ion batteries based on sponge-like three-dimensional porous Na-rich ferric pyrophosphate cathode material. Acs Applied Materials & Interfaces 2019, 11, 5107-5113. [CrossRef]
- Hui, X.; Zhao, R.; Zhang, P.; Li, C.; Wang, C.; Yin, L. Low-temperature reduction strategy synthesized Si/Ti3C2 MXene composite anodes for high-performance Li-ion batteries. Advanced Energy Materials 2019, 9. [CrossRef]
- Tao, M.; Du, G.; Zhang, Y.; Gao, W.; Liu, D.; Luo, Y.; Jiang, J.; Bao, S.; Xu, M. TiOxNy nanoparticles/C composites derived from MXene as anode material for potassium-ion batteries. Chemical Engineering Journal 2019, 369, 828-833. [CrossRef]
- Zou, G.; Zhang, Z.; Guo, J.; Liu, B.; Zhang, Q.; Fernandez, C.; Peng, Q. Synthesis of MXene/Ag composites for extraordinary long cycle lifetime lithium storage at high rates. Acs Applied Materials & Interfaces 2016, 8, 22280-22286. [CrossRef]
- Okubo, M.; Sugahara, A.; Kajiyama, S.; Yamada, A. MXene as a charge storage host. Accounts of Chemical Research 2018, 51, 591-599. [CrossRef]
- Ko, J.S.; Sassin, M.B.; Rolison, D.R.; Long, J.W. Deconvolving double-layer, pseudocapacitance, and battery-like charge-storage mechanisms in nanoscale LiMn2O4 at 3D carbon architectures. Electrochimica Acta 2018, 275, 225-235. [CrossRef]
- Jiang, Y.; Liu, J. Definitions of pseudocapacitive materials: A brief review. Energy & Environmental Materials 2019, 2, 30-37. [CrossRef]
- Xie, Y.; Naguib, M.; Mochalin, V.N.; Barsoum, M.W.; Gogotsi, Y.; Yu, X.; Nam, K.-W.; Yang, X.-Q.; Kolesnikov, A.I.; Kent, P.R.C. Role of surface structure on Li-ion energy storage capacity of two-dimensional transition-metal carbides. Journal of the American Chemical Society 2014, 136, 6385-6394. [CrossRef]
- Xia, Z.; Chen, X.; Ci, H.; Fan, Z.; Yi, Y.; Yin, W.; Wei, N.; Cai, J.; Zhang, Y.; Sun, J. Designing N-doped graphene/ReSe2/Ti3C2 MXene heterostructure frameworks as promising anodes for high-rate potassium-ion batteries. Journal of Energy Chemistry 2021, 53, 155-162. [CrossRef]
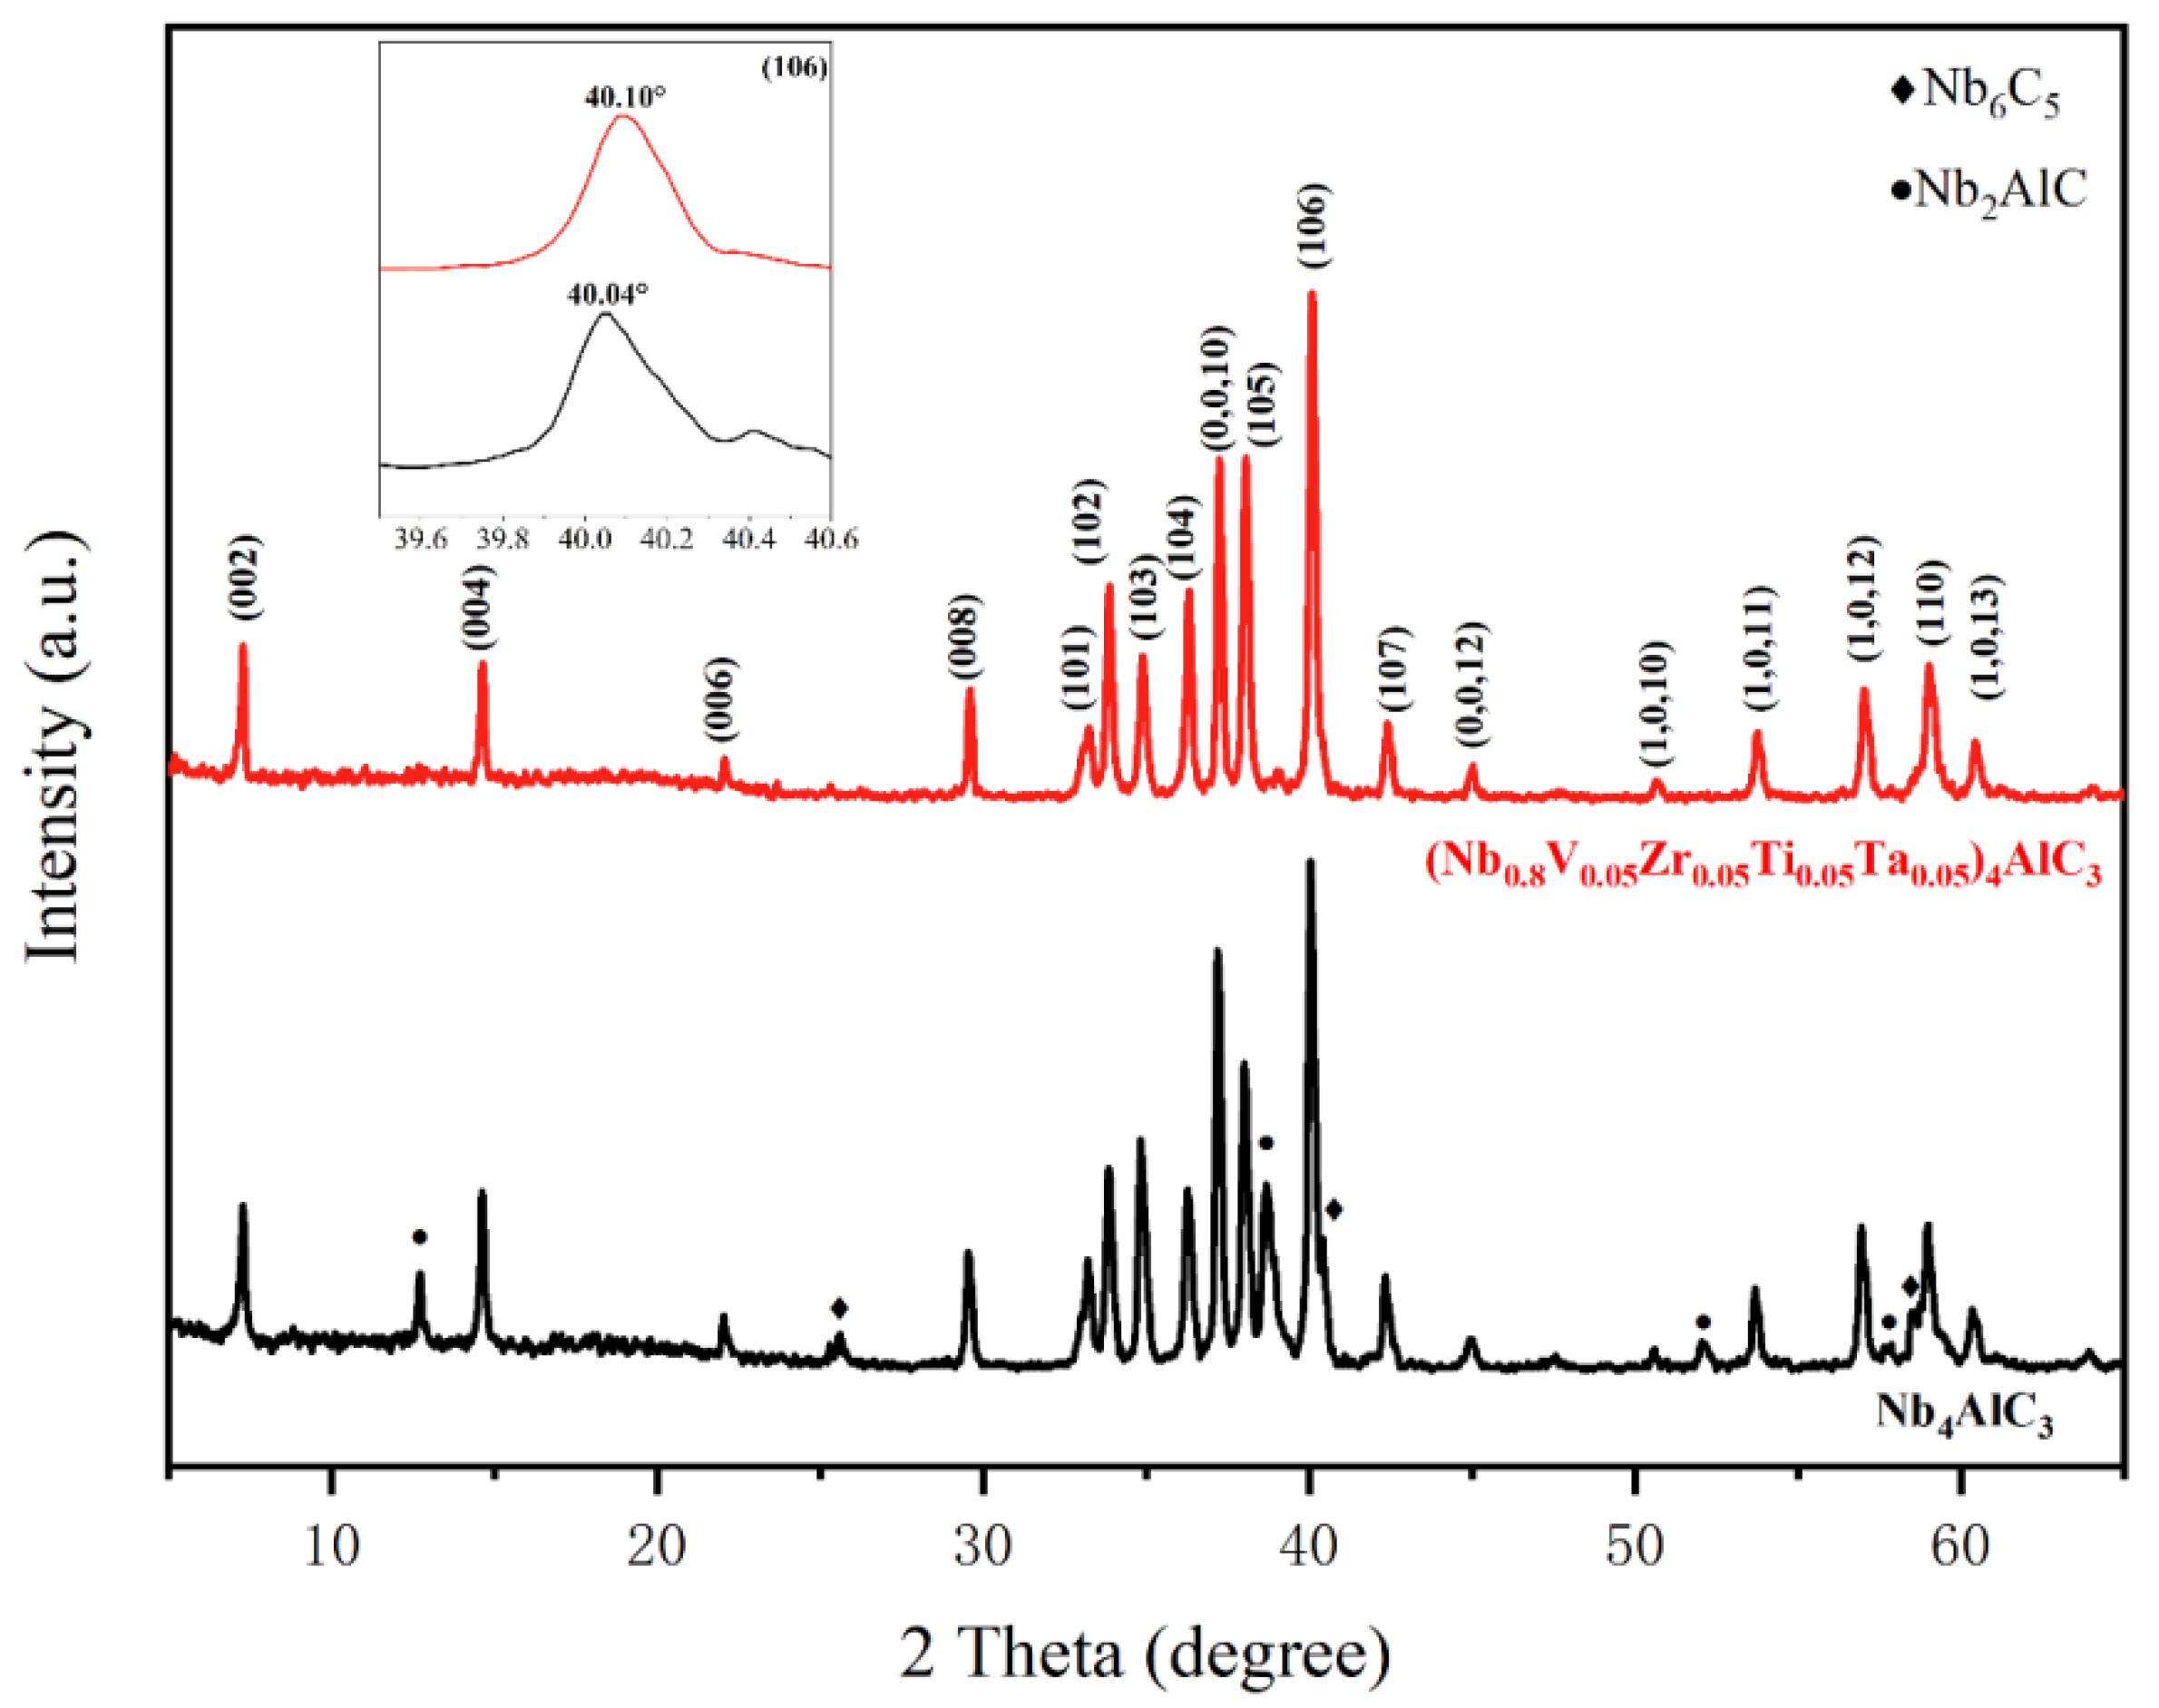
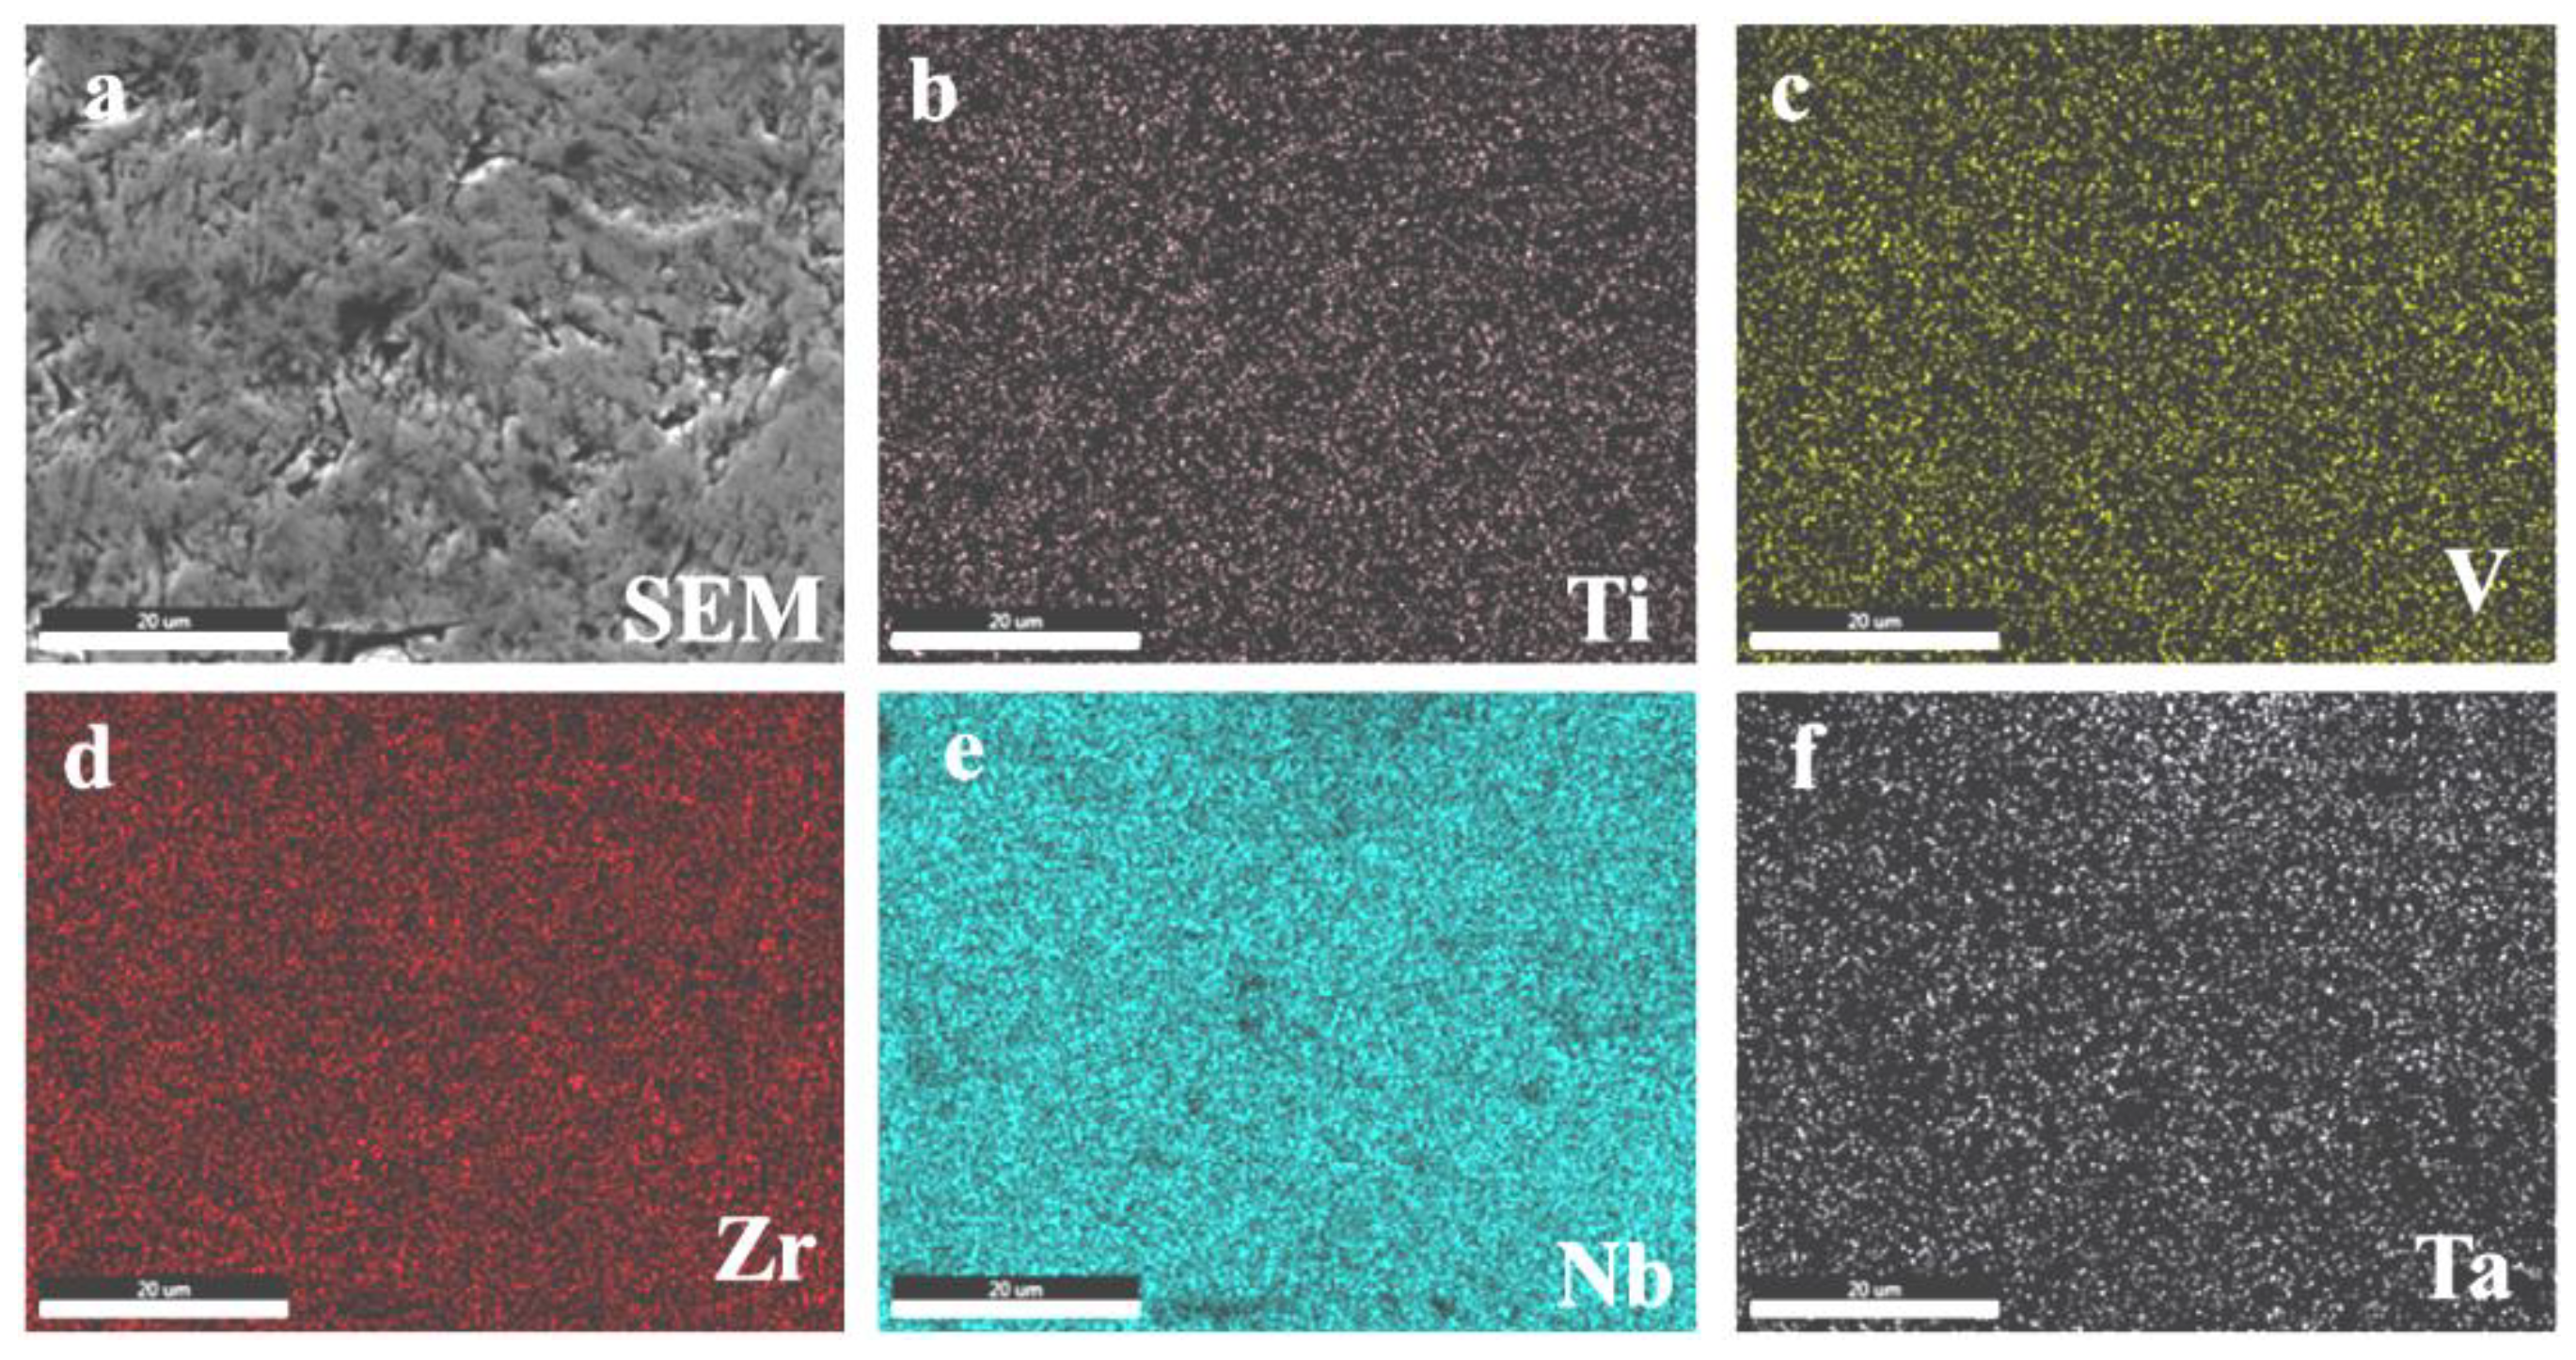
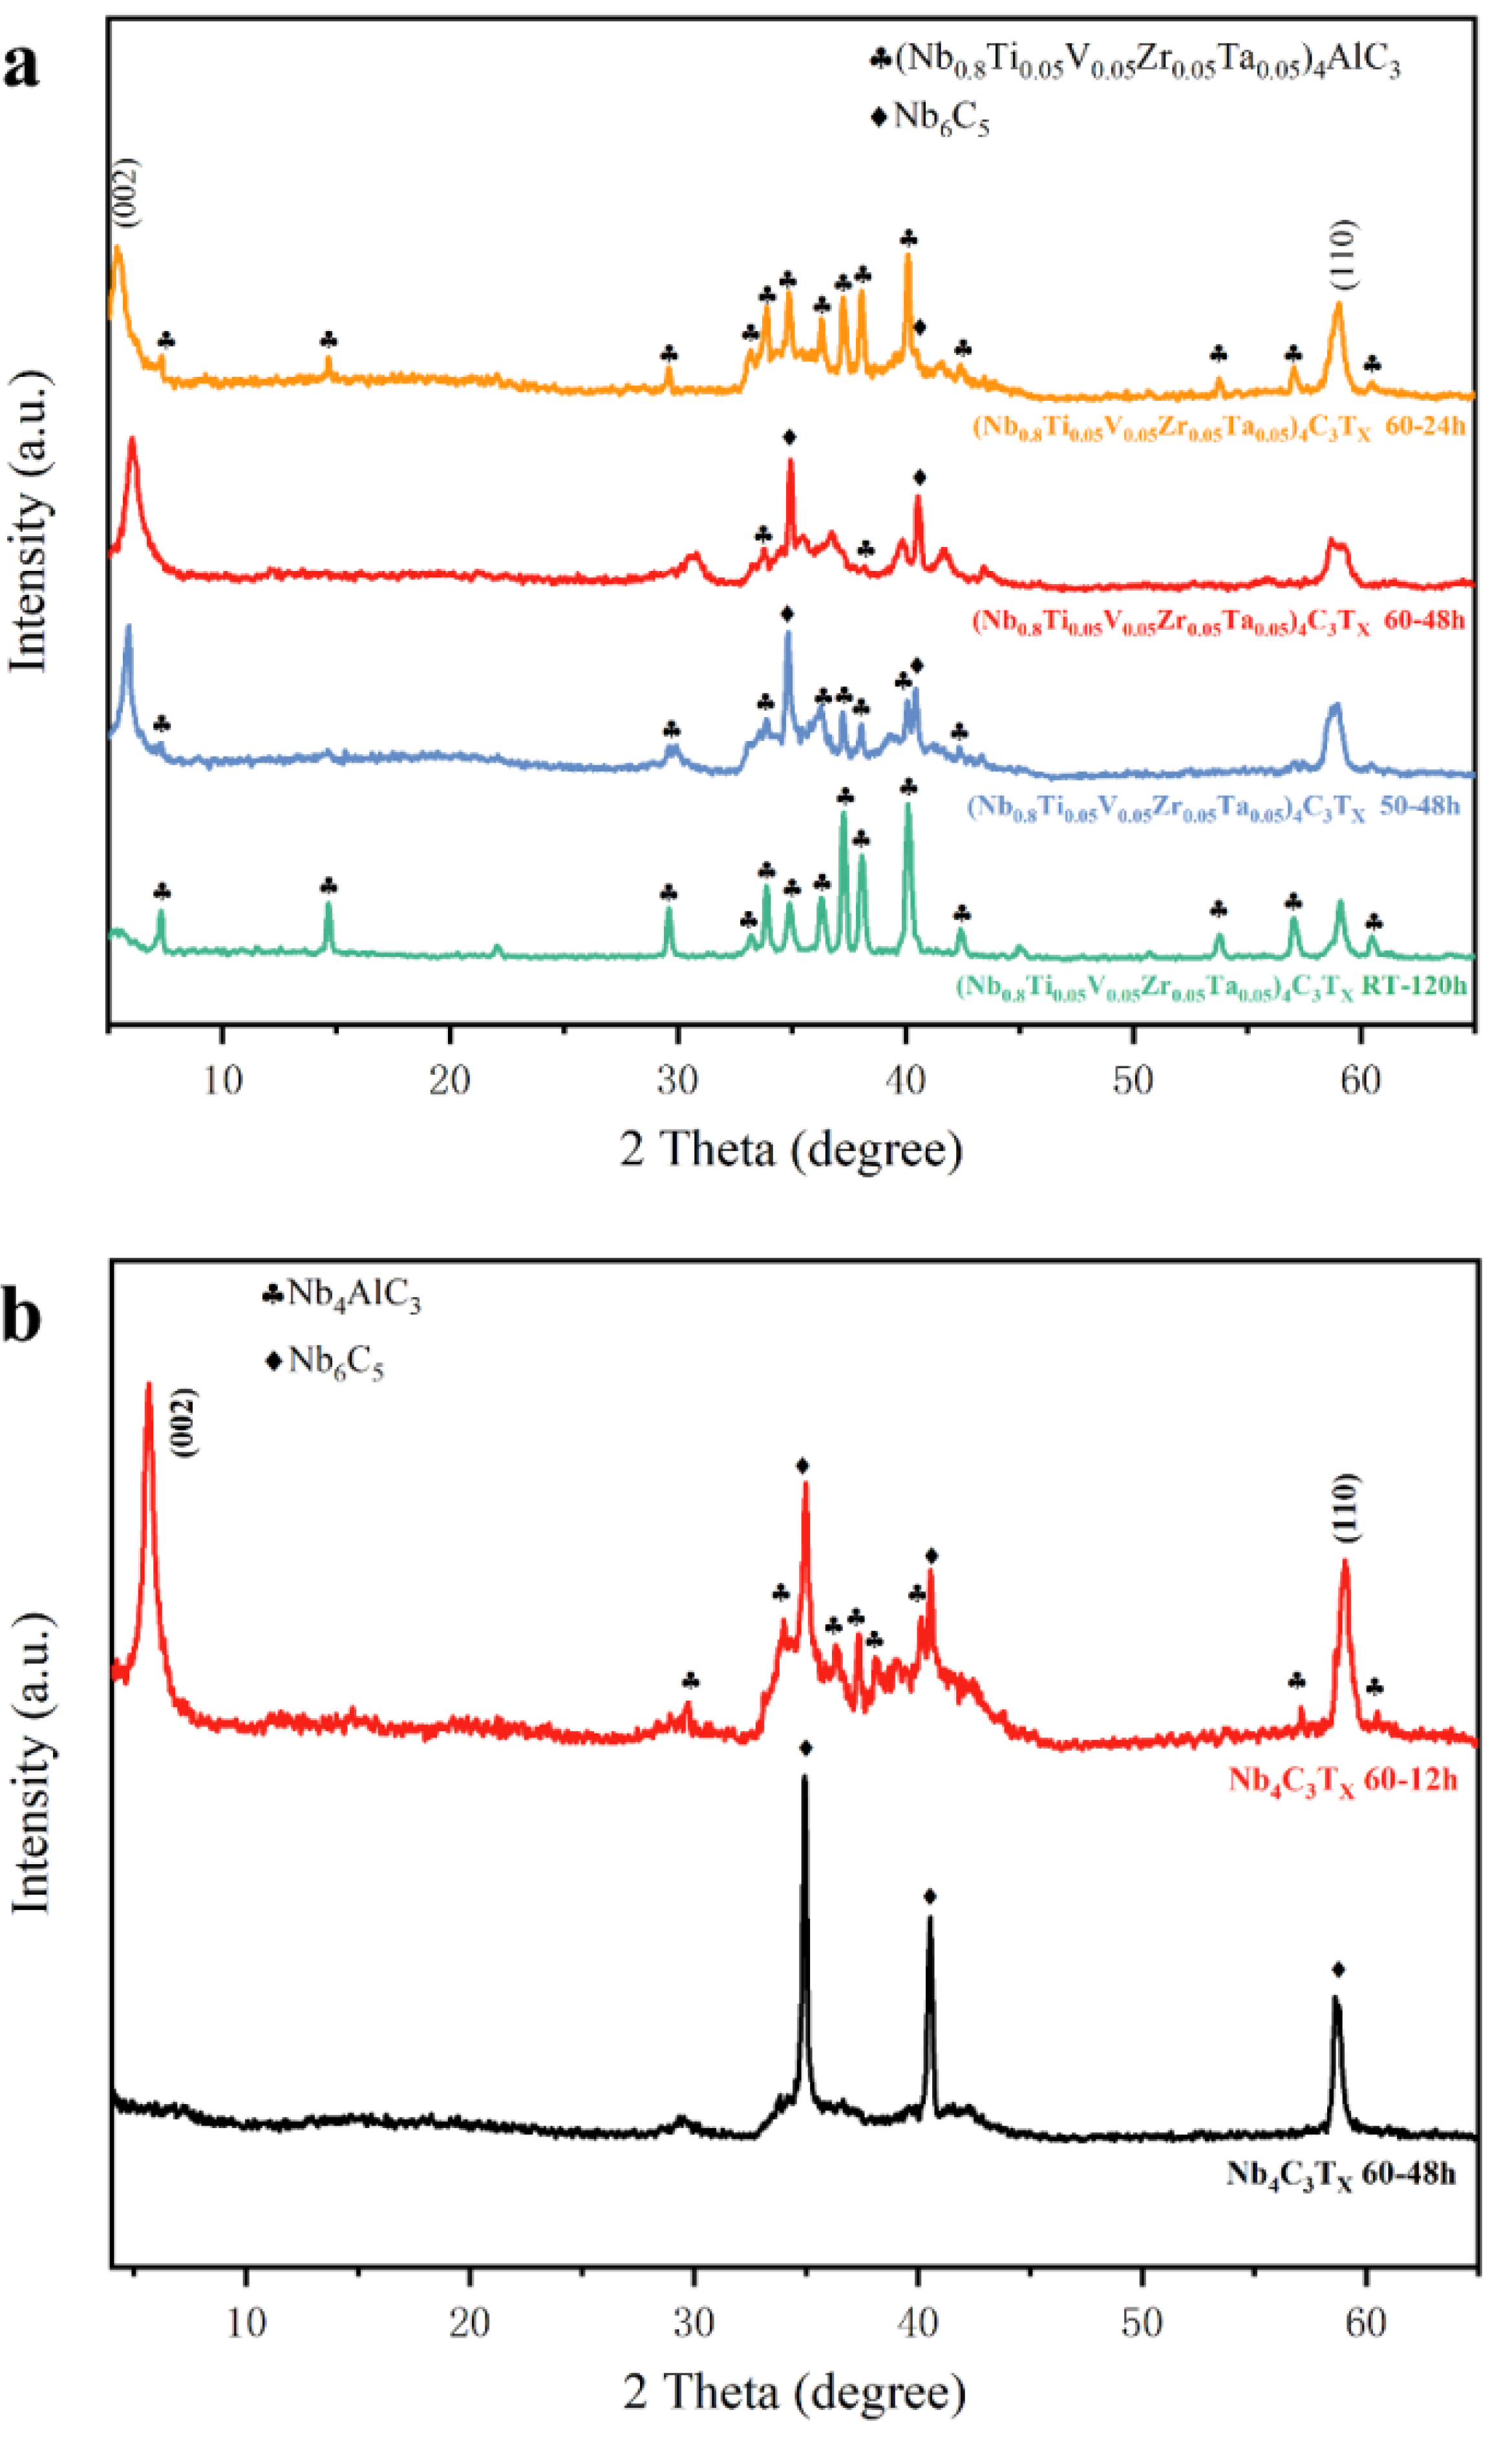
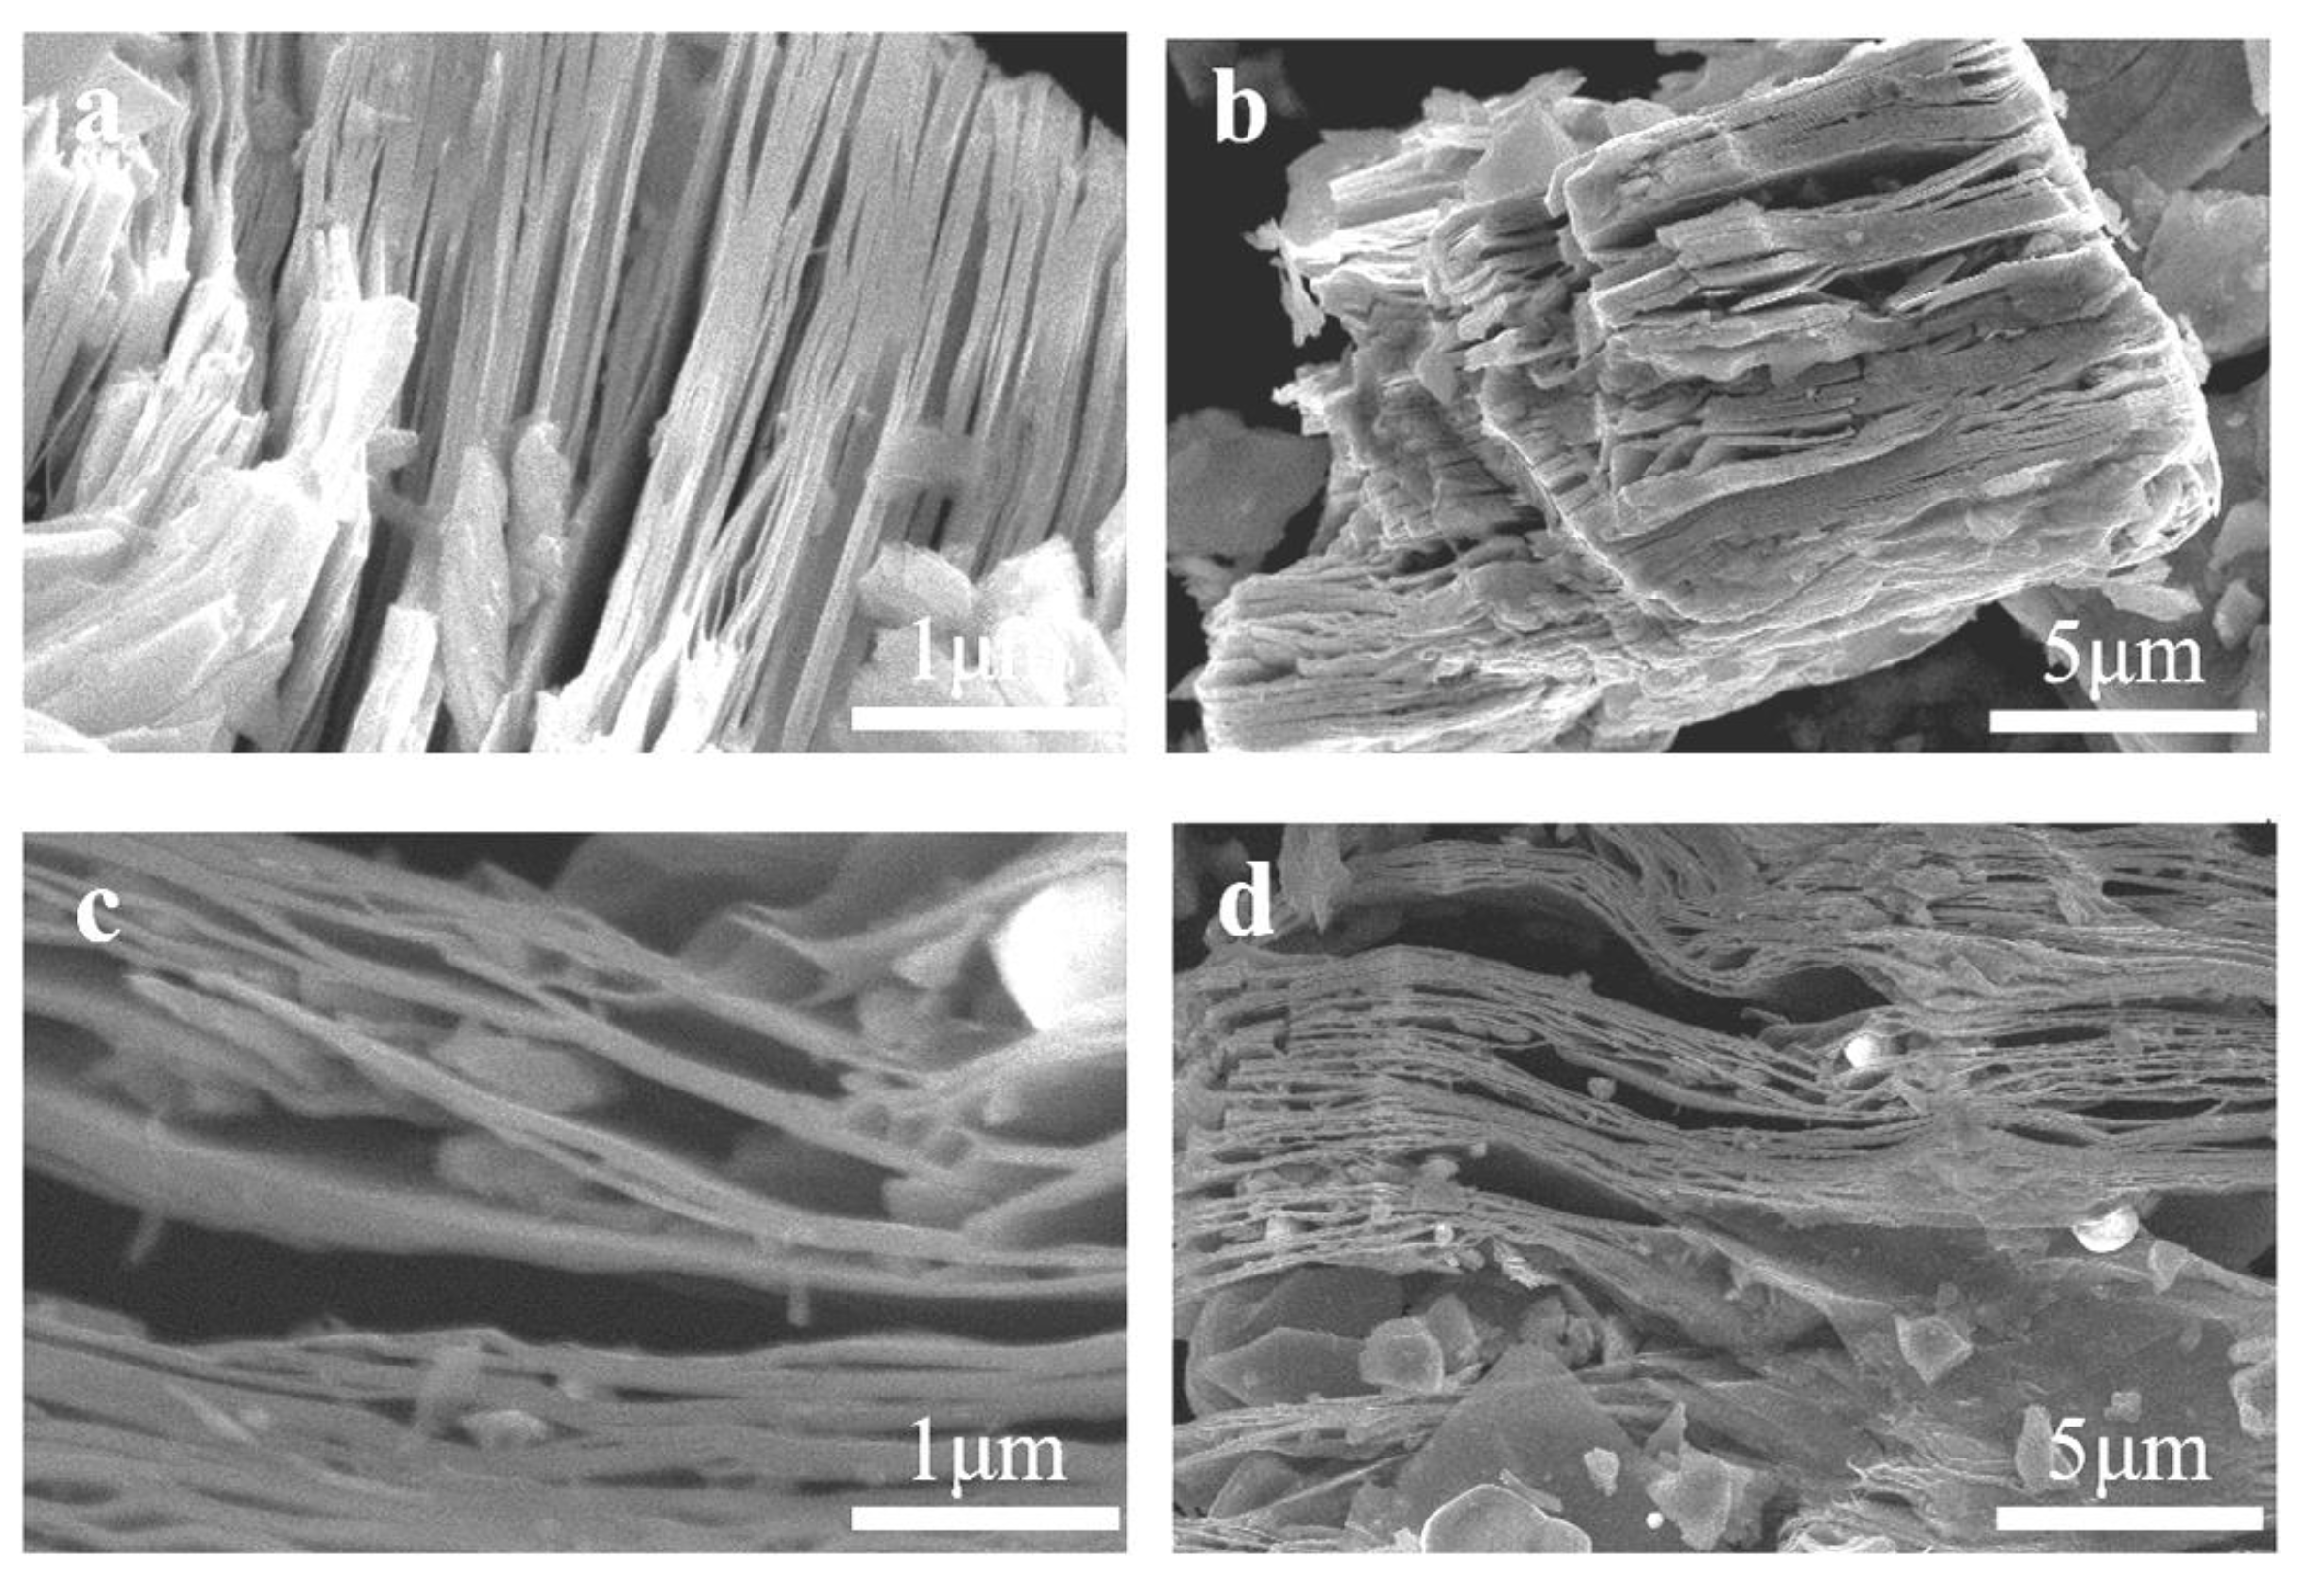
| Sample | Nb : Ti : V : Zr : Ta (Atomic Ratio) |
Al : M-Site Elements (Atomic Ratio) |
|---|---|---|
| (Nb0.8V0.05Zr0.05Ti0.05Ta0.05)4AlC3 | 80 : 4.02 : 4.88 : 5.03 : 4.72 | 0.844 : 4.00 |
| 60-48h-LE | 80 : 5.81 : 6.52 : 2.58 : 7.64 | 0.034 : 4.00 |
| Nb4AlC3 | - | 1.061 : 4.00 |
| 60-12h | - | 0.095 : 4.00 |
Disclaimer/Publisher’s Note: The statements, opinions and data contained in all publications are solely those of the individual author(s) and contributor(s) and not of MDPI and/or the editor(s). MDPI and/or the editor(s) disclaim responsibility for any injury to people or property resulting from any ideas, methods, instructions or products referred to in the content. |
© 2023 by the authors. Licensee MDPI, Basel, Switzerland. This article is an open access article distributed under the terms and conditions of the Creative Commons Attribution (CC BY) license (http://creativecommons.org/licenses/by/4.0/).


