Preprint
Article

The Role of Active Design Approach in Improving the Environmental Psychology of a Healthy Built Environment: The Case-University Campus

Altmetrics

Downloads

301

Views

148

Comments

0

A peer-reviewed article of this preprint also exists.

Submitted:

06 June 2023

Posted:

06 June 2023

You are already at the latest version

Alerts
Abstract
Environmental psychology plays an important role in the overall development of human mental health. Student activism and health concerns also arose about the human health costs associated with a healthy built environment. This research focuses on recent design "trends", active design, and their relationship to environmental psychology and campus health. This study investigates how an active design approach can improve the environmental psychology of universities to achieve a healthy campus for students to be healthy. The total student participants are 428, 176 male (41.2%) and 251 female (58.8%), from ten university campuses. The methodology is a questionnaire survey including an active design approach based on physical activity categories with SPSS analyses. The results of this study revealed that only 19.7% of students were active on campus, 74.6% active off campus, and 5.7% active on and off campus. Students are more interested in social activity than in mental and physical activity. In addition, the ob-stacles to students' physical inactivity are lack of time, opportunities on campus and the psychological feeling of anxiety, depression and tension due to social activity and work performance in universities. In conclusion, a model is designed to demonstrate the relationship between environmental psychology and active design variables
Keywords: 
Subject: Engineering  -   Architecture, Building and Construction

1. Introduction

The introduction
The growing urban population has increased environmental demands and also affects human health. As the global population becomes more urbanized, there is a concern that it will negatively affect not just physical health, but also mental health. (Chen, W., M. Zaid, S., & Nazarali, N. (2016)). A new trend introduced by scientists and researchers for solving this issue is the active design approach (Bloomberg, M. et al.2010). The built environment includes all of the physical parts of where we live and work (e.g., homes, buildings, streets, open spaces, and infrastructure). The built environment influences a person’s level of physical activity. For example, inaccessible or nonexistent sidewalks and bicycle or walking paths contribute to sedentary habits. These habits lead to poor health outcomes such as obesity, cardiovascular disease, diabetes, and some types of cancer. Today, approximately two-thirds of Americans are overweight. (Danaei, G. et al 2009, Lam, T.M. et al 2021 ) that affect not physically but also mentally.
Environmental psychology accepts the real world through which we experience life. Environmental psychologists take into consideration any individual activity to be situated along three measurements at the same time: the person (e.g., age, gender, personality, culture), the place (e.g., home, classroom, workplace, park, nature), and the psychological procedure of enthusiasm (e.g., socialising, working, learning, playing, exploring). Another significant aspect is change throughout time. Environmental psychology also includes social-psychological contextual elements, such as the presence of others or one’s place in the group, which can affect behaviour in a specific physical setting (Gifford, 2014).
In "architectural psychology," which emphasized how people interact with the built environment, the study increased in the 1950s. This research’s principal goal was to enhance human peace of mind and well-being by designing or modifying architectural settings. One significant example is the remodelling of specific areas of a sizable, fortress-like psychiatric establishment from the 1950s. When redesigning the hospital in Weyburn, Saskatchewan, a team composed of a psychiatrist, a psychologist, and an architect carefully studied the unique requirements and behaviours of the patients (Osmond, 1957). The urban design will be impacted by the long-term reconfiguration of personal and societal norms, values, and beliefs caused by social isolation, social segregation, and quarantine (Hamidi et al., 2020; Stevens et al., 2021; Tootell et al., 2021). In addition, some people in the fields of interior design, architecture, landscape design and urban design, have done structured research using behavioural sciences and this group grows larger day by day. Both groups believe that behavioural sciences can develop some models and concepts that lead to a clear understanding of human-environment relations (Charehjoo, F., Etesam, I. and Rasoulpour, H., 2018). The University campus environment is the most important environment influencing students’ daily activities and health, from the perspective of environmental behaviour, and the campus space environment (Xu, S., Li, W. S., & Cheng, B. (2021).)
The environment plays an important role in disease dynamics and in determining the health of individuals. Specifically, the built environment has a large impact on the prevention and containment of both chronic and infectious diseases in humans. The effects of the built environment on health can be direct, for example, by influencing environmental quality, or indirect by influencing behaviours that impact disease transmission and health (Lam, T.M., Vaartjes, I., Grobbee, D.E. et al 2021). Besides mental health became the main world issue. Mental and physical health are equally important components of overall health. As Dober (1996, p. 12) observed, “Lacking an organized body of research or theory, campus planning is likely to be continued on a pragmatic basis.” Thus, the environmental psychology of campus is perhaps the most neglected. This research is an attempt to evaluate the role of the active design approach in improving the environmental psychology of campus built environment.

1.1. Environmental Psychology

Environmental psychology is a branch of psychology that studies the mutual relationships and interactions between human behaviour (including experience and action) and its surroundings (material, social, and cultural),(Xu et al 2021)(Tam et al 2020). There are multiple pieces of evidence showing environmental psychology could be considered a psycho-social approach to people’s environmental relationships (Bonnes, M., & Secchiaroli, G., 1995)( (Russell Veitch & Daniel Arkkelin,1995) (Pronello, C. et al 2018) Space perception (Russell Veitch & Daniel Arkkelin,1995) (Nesma Sherif et al 2023) and utilization (Russell Veitch & Daniel Arkkelin,1995)( Feng, H.&, Yang, F. 2023) and recycling behaviour (Russell Veitch & Daniel Arkkelin,1995)( Nurliyana Jekria &Salina Daud 2016) environmental stress, valuation of public goods (Pelgrims, I., et al 2021) and Alzheimer’s disease, landscape aesthetics environmental cognition, behaviour in the natural environment, health behaviour change helping behaviour (Paul Bell et al,1996)on stress related to toxic exposure. community psychology, stress, coping & health (Tony Cassidy 1997). Population & Environment (Robert Gifford,1997) enclosing behaviour and method in environmental and behaviour (Robert Bechtel, 1997) multi-disciplinary centre for environmental strategy (Jonathan Sime,1999). Cross-cultural environmental psychology since-human–environment interactions are culture-bound(Tam et al 2020). Thus each of these scientists mentioned a parameter effect on the psycho-social approach of environmental psychology.
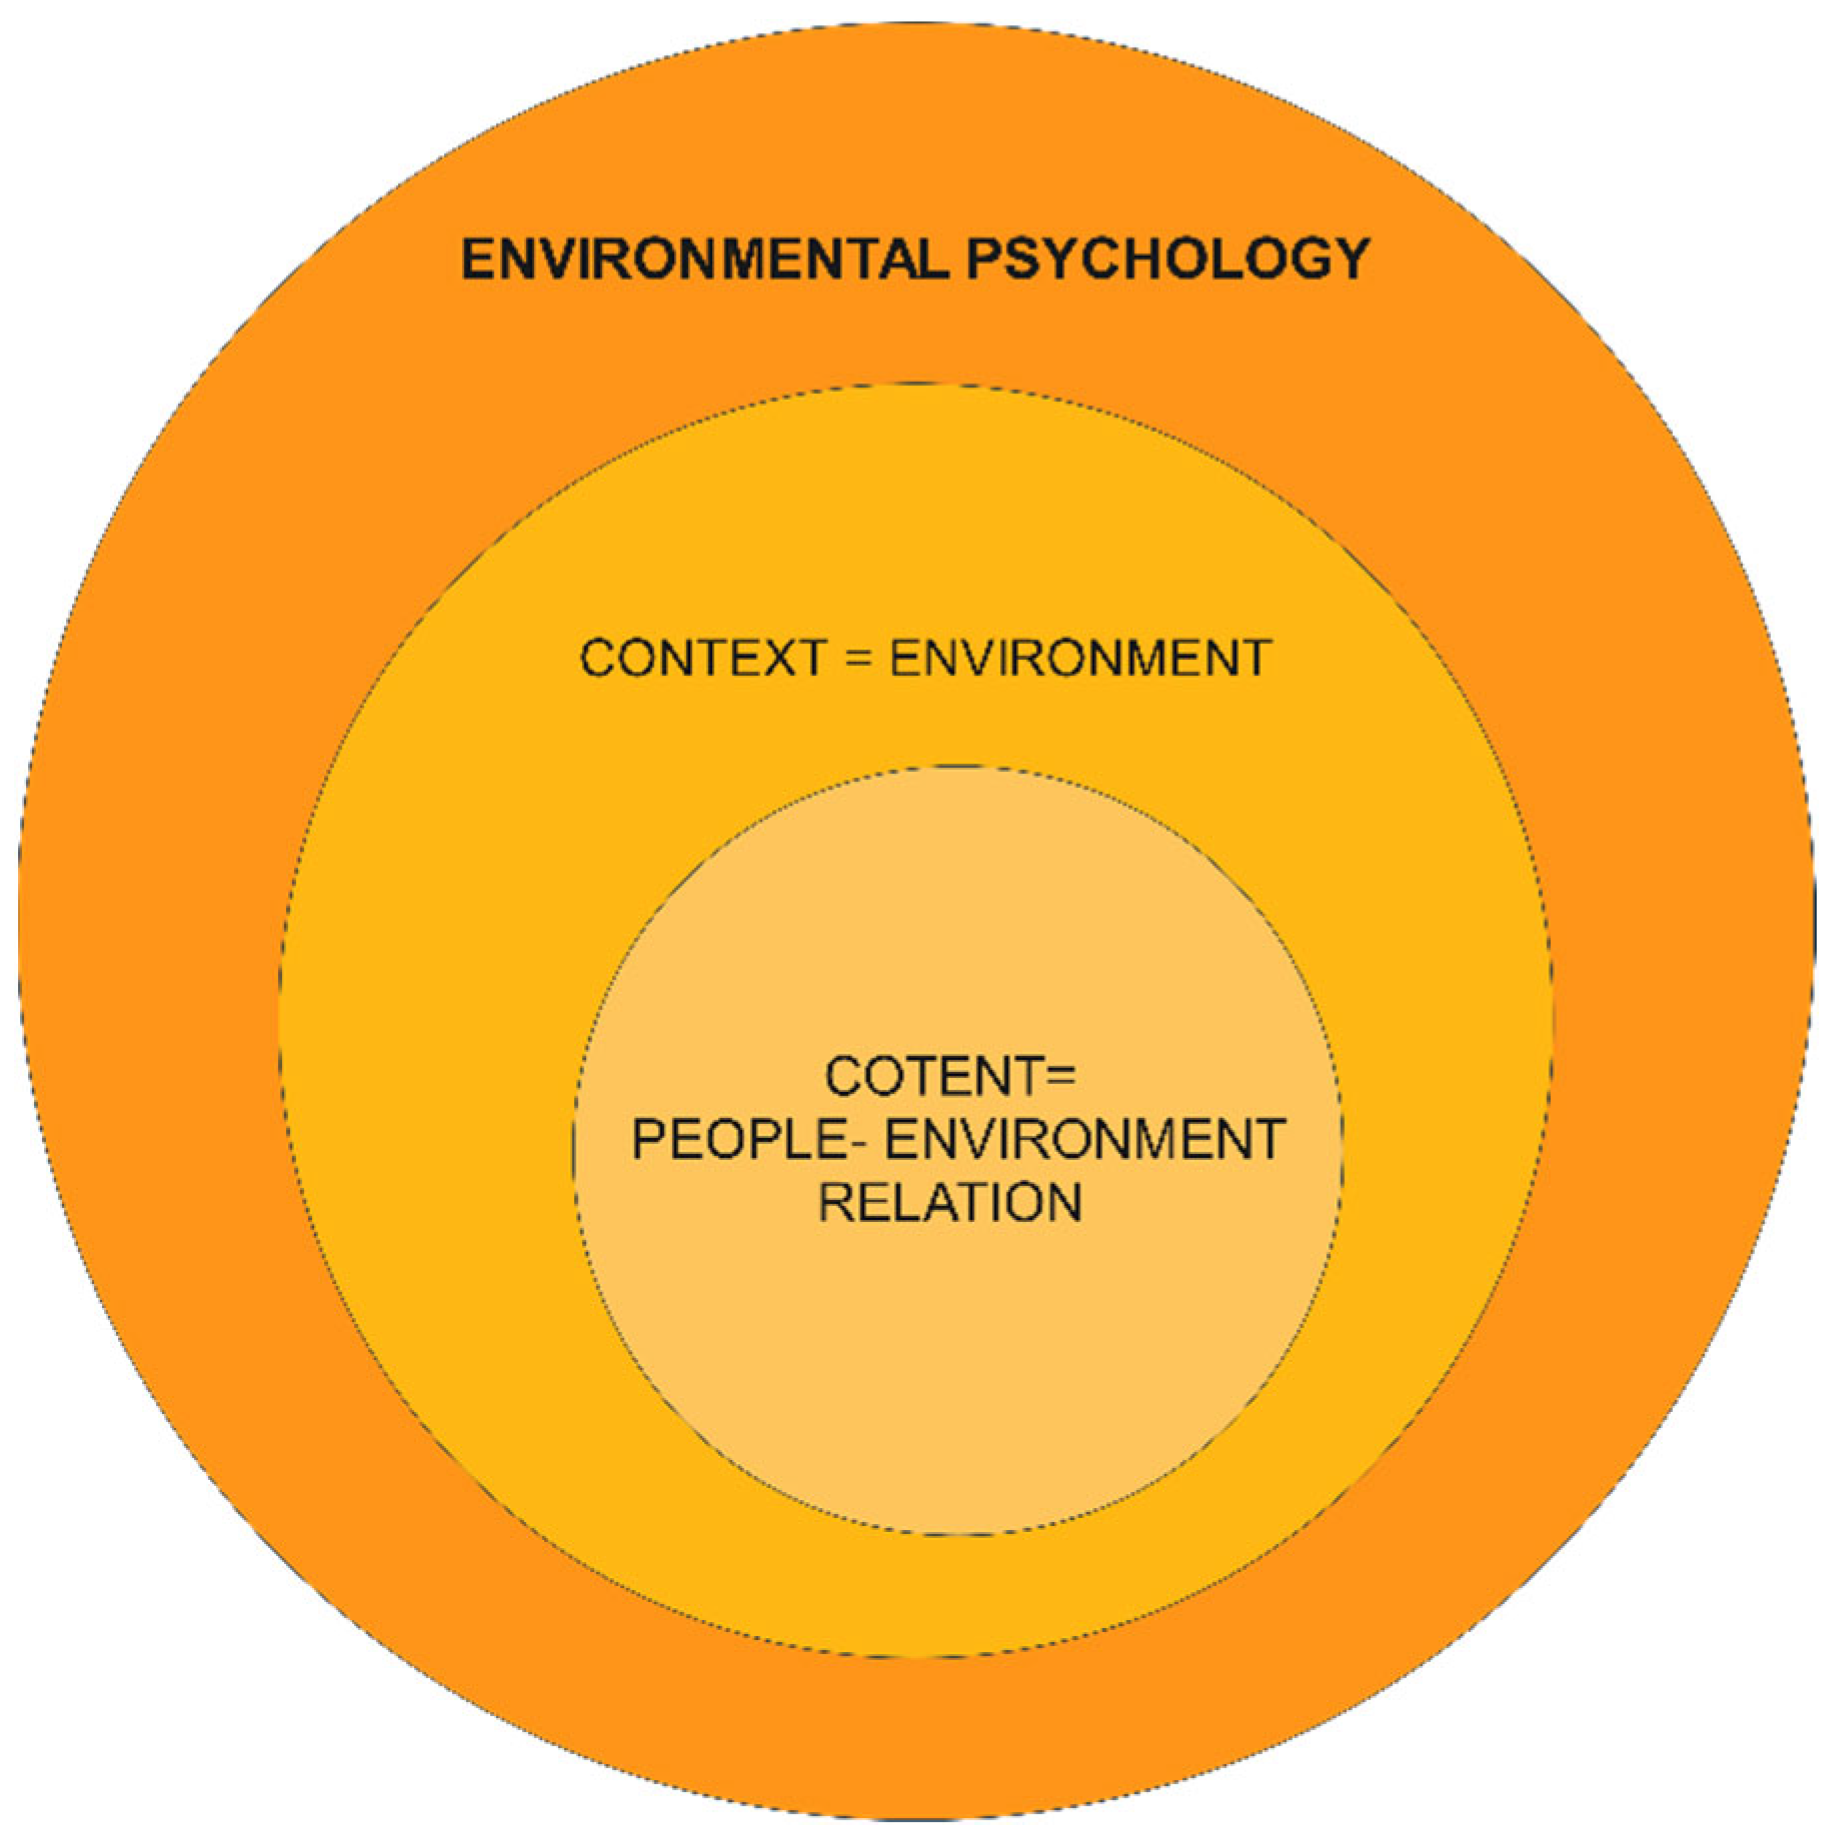
Therefore Environmental psychology (EP) is many things it is something which is seen and felt more as an area of overlap between psychology and several disciplines or domains (Jonathan D.Sime,1999) and EP is not only an area within psychology but interdisciplinary suggests the need to develop a coherent core for EP and recognize its applied context. The most relevant definition for environmental psychology used in this paper was defined as a “multidisciplinary behavioural science, both basic and applied in orientation, whose foci are the systematic interrelationships between the physical and social environments and individual human behaviour and experience” (Veitch, Russell 1995). In other words, environmental psychology is the study of interactions between humans and their surroundings. Because human-environment interactions are culturally determined (Tam et al 2020). There are multiple ecological models used by other researchers to determine the linkage and relationships among multiple factors affecting health, as an ecological model by (Gruenewald et al., 2014). but here we design a model to identify parameters of environmental psychology and relate them to active design approaches through physical activity categories. Figure 1 shows that environmental psychology is equal to context(environment) plus content (people-environment relation) which most of them emphasise social. For instance, the environmental psychology of campus built environment is equal to context (campus environment) and content (student-environment relation).
Figure 1. Environmental psychology model for determining its parameters (Authors).
Preprints 75858 g001

1.2. Healthy Campus as a New Trend

In general, campus master plans prescribe a set of design and planning actions to achieve a university’s goals and objectives as a higher education institution. It start in medieval Europe and modern universities evolved in America. Some of the best university campuses developed in the 19th century and early 20th century in the USA follow certain typologies such as the quadrangle campus, picturesque campus and beaux-art campus but after world war II emphasize freestanding buildings than on-campus master plan (Coulson et al., 2010; Turner, 1984; Dober, 1996). The quality of the campus built environment determines the health of users thus most design focused on micro-scale design rather than macro-scale design therefore an index proposed by (Hajrasouliha, A., 2017) called campus score measures the main physical qualities of universities campus which are composed of three latent variables representing urbanism, greenness and on-campus living with 10 indicators. University campuses can address this wide range of issues and concerns in different ways. Coulson et al. (2014) discuss ‘‘trends’’ in contemporary campus design which are adaptive reuse of buildings and facilities, starchitecture, hub buildings, interdisciplinary science research buildings, commercial urban development, large-scale campus expansions, and revitalizing master plans. But today for modern society the new trend is a healthy built environment with a new approach as the "Healthy Campus framework" which is formulated by the American College Health Association lately presented multiple student health targets, including a requirement to "create social and physical environments that promote good health for all" to "support efforts to increase academic success, productivity, student and faculty/staff retention, and life-long learning." (American College Health Association 2023). The ecological model of (McLeroy et al. 1988) was explained by the American College Health Association’s (2015a) Healthy Campus 2020 initiative and composed of five factors intrapersonal, interpersonal processes and primary groups, institutional factors, community factors and the last public policy for creating healthy campus.
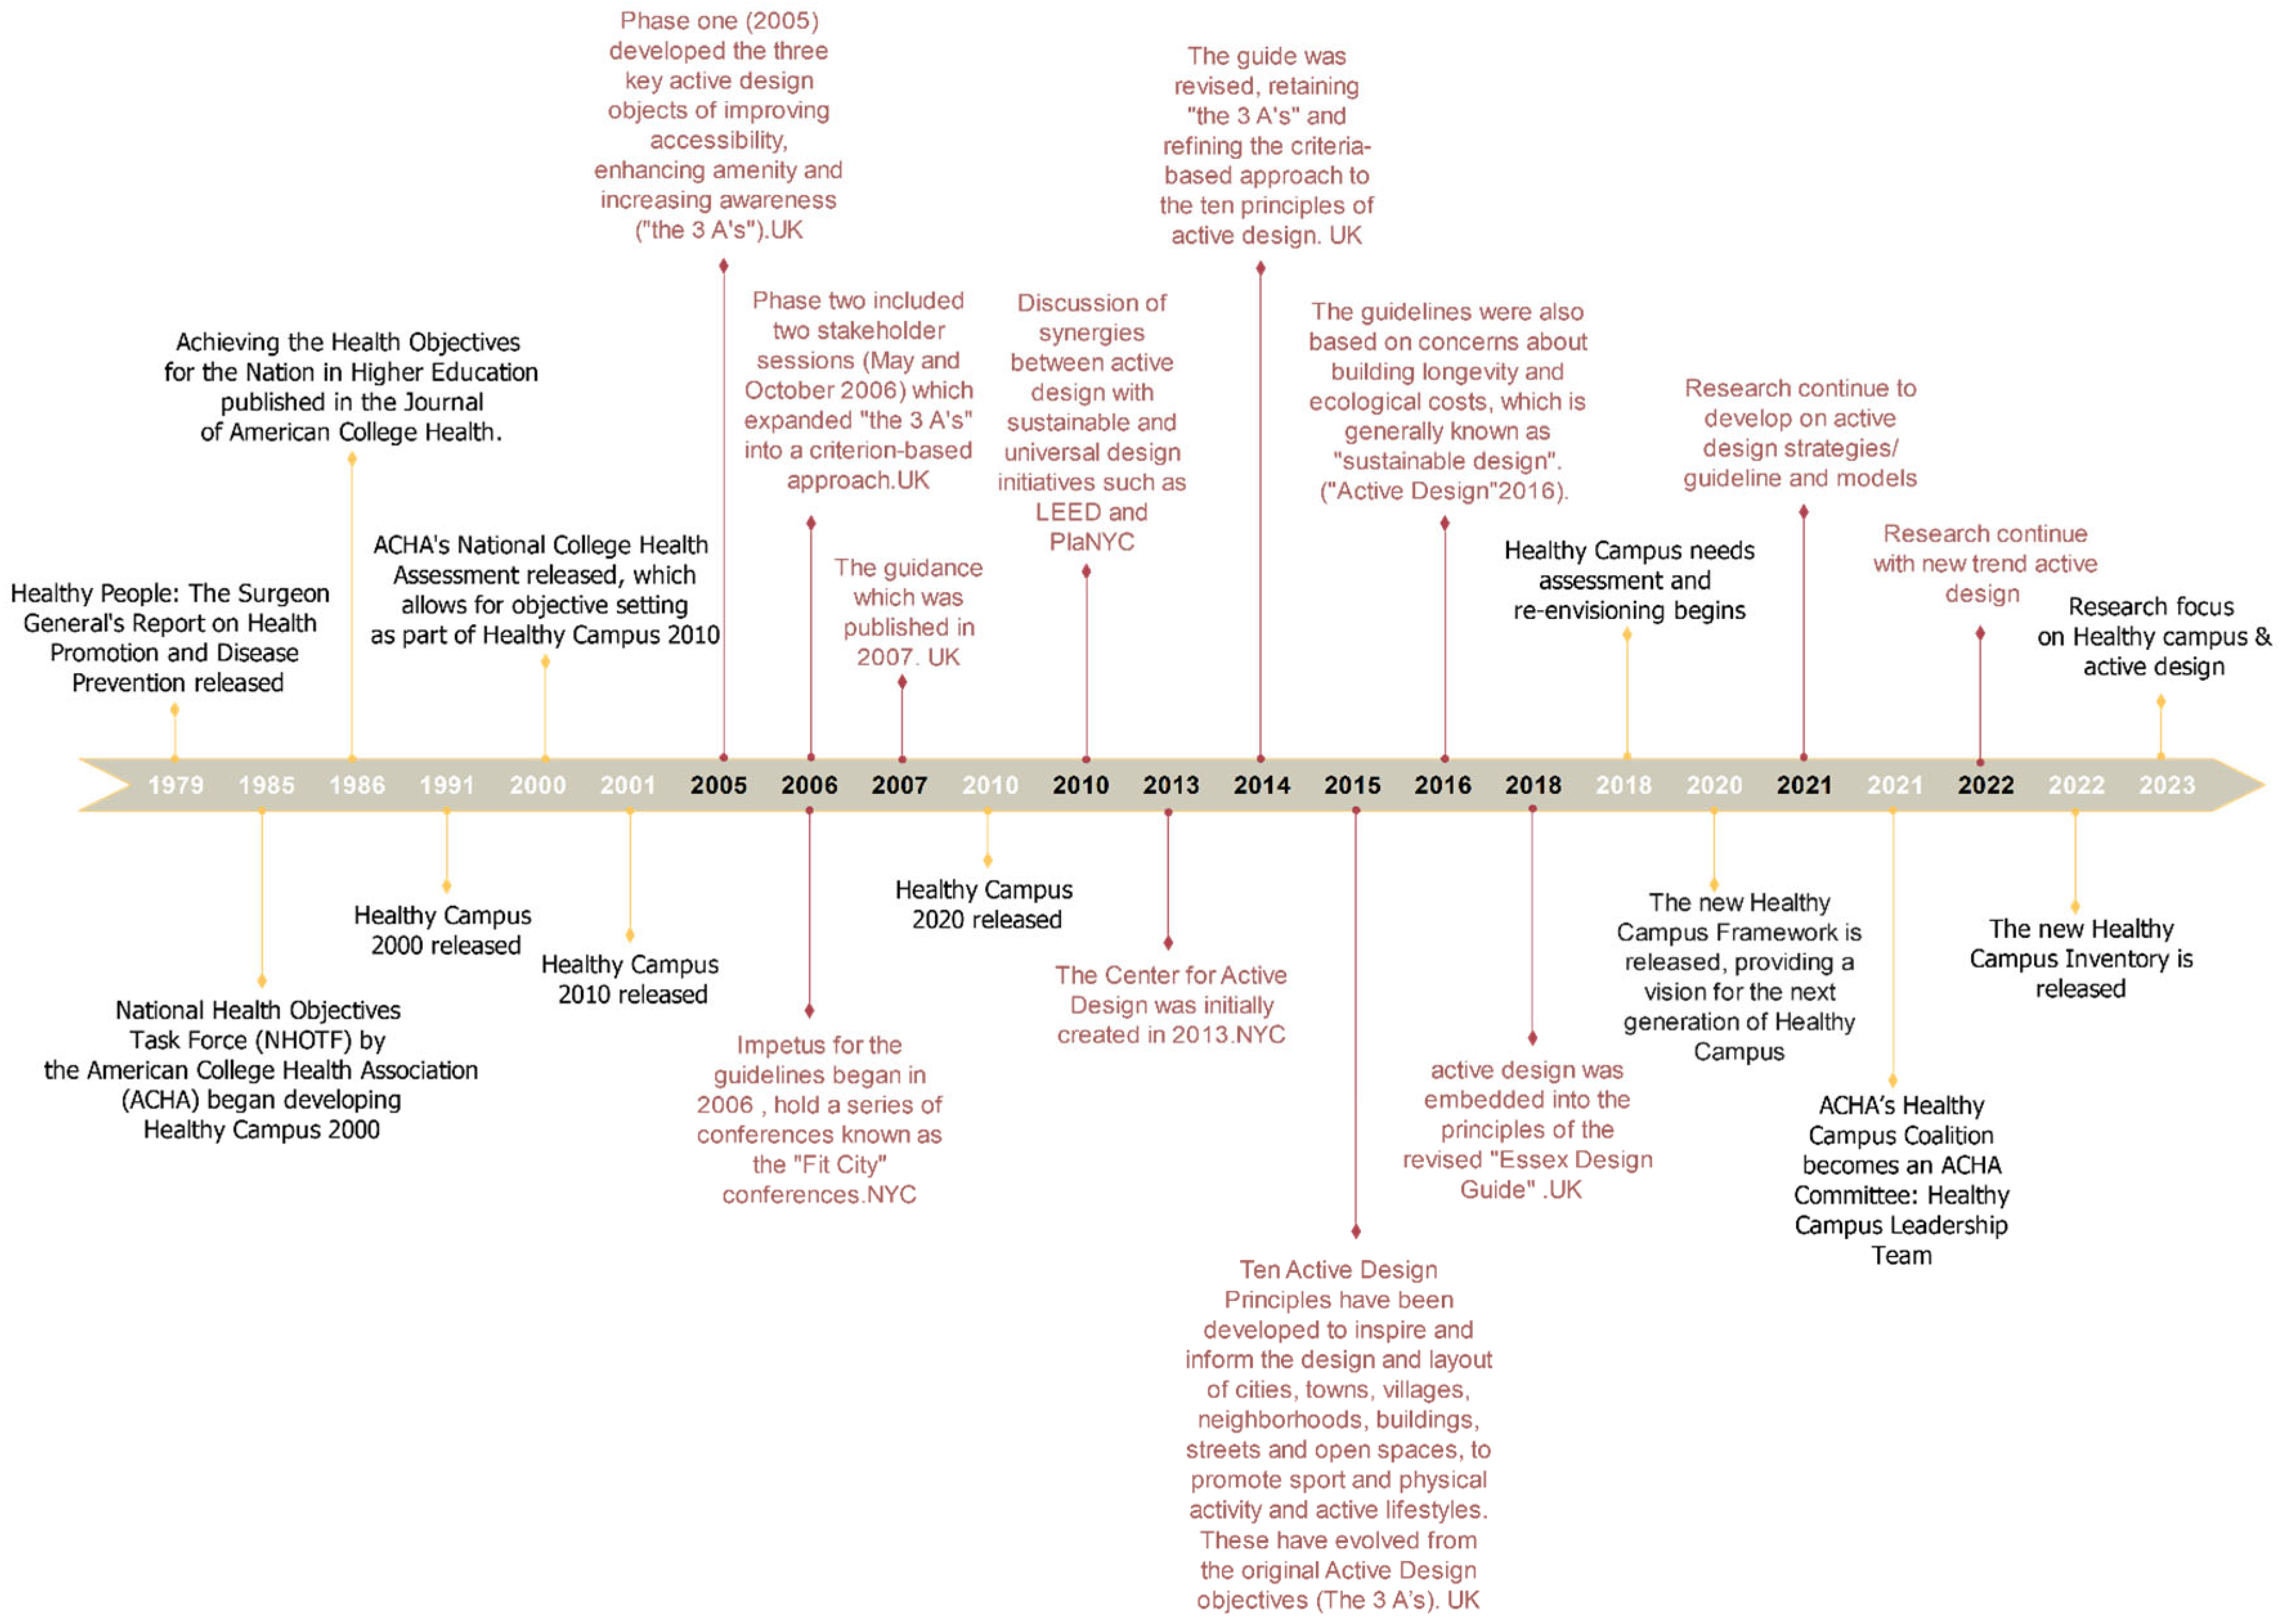
The architectural design of the campus built environment is the main factor for creating a healthy built environment for students and staff. The new trends of design by AIA and UK Sport England introduced active design for promoting physical activity in built environments to get a healthy built environment and achieve a healthy community.( (Bloomberg, M. et al.2010; Sport England- Jennie Price 2015; Sport England 2005; Sallis J. et al. 2005; Sport England 2015; Gebel, K. et al 2005; Silver, L. et al. 2023; Robbins, J.L.2023; Fit City 2 ,2007; Lacasse, M.& Nienaber, S.2015; Bustler FitCity 10 2015; Public Health England,2015; Michael R. B et al. 2010). Figure 2 illustrates the chronological trend of a healthy campus by (the American College Health Association (2015a) and active design by Sport Englan and AIA. The start f a healthy campus from 1979 till now continued and developed. But the start of active design after the growth of chronic disease and obesity among people since 2005. The chronological combination between the two trends when and where started since the active design approach will be used to show it’s a way of achieving a healthy campus and improving the environmental psychology of campus.
Figure 2. Significant moments in healthy campus history data from American College Health Association 2023 with the active design approach. Timeline diagram (by the authors).
Preprints 75858 g002

1.3. Active Design and Physical Activity

1.3.1. Classification of Physical Activity in Terms of the Active Design Approach

The definitions for active design in U.K. and U.S.A. are similar in that both promote physical activity to create a healthy environment and society. Likewise, Physical activity is the primary variable of active design, so the last updated definition for the active method is by Piggin J (2020) defined physical activity as "people moving, acting and performing within culturally specific spaces and contexts, and influenced by a unique array of interests, emotions, ideas, instructions, and relationships." There is overwhelming evidence corroborating the definition of physical activity from Caspersen et al. 1985, reviewed from different sources, which cover all aspects as cerebral, social, situated, and political. The last updated definition by Piggin (2020) was accepted, studied and analyzed by being categorized into three categories by the author (Figure 3):
  • Physically active: such as the person moving, acting and performing to achieve physical wellness in the built environment could be adopted as indoor staircases and outdoor walkways encourage more physical activity on campus .etc.
  • Mentally active: influenced by a unique array of interests, emotions, and ideas to achieve mental health in a built environment could be adopted as walkways that wind through quiet outdoor areas offer students calm spaces in which to relax before and after classes (DeClercq, C., 2016) (WHO)
  • Socially active: within culturally specific spaces and contexts to achieve social well-being in a built environment could be adopted as Designing community spaces within high-traffic areas encourages students to socialize with their peers.
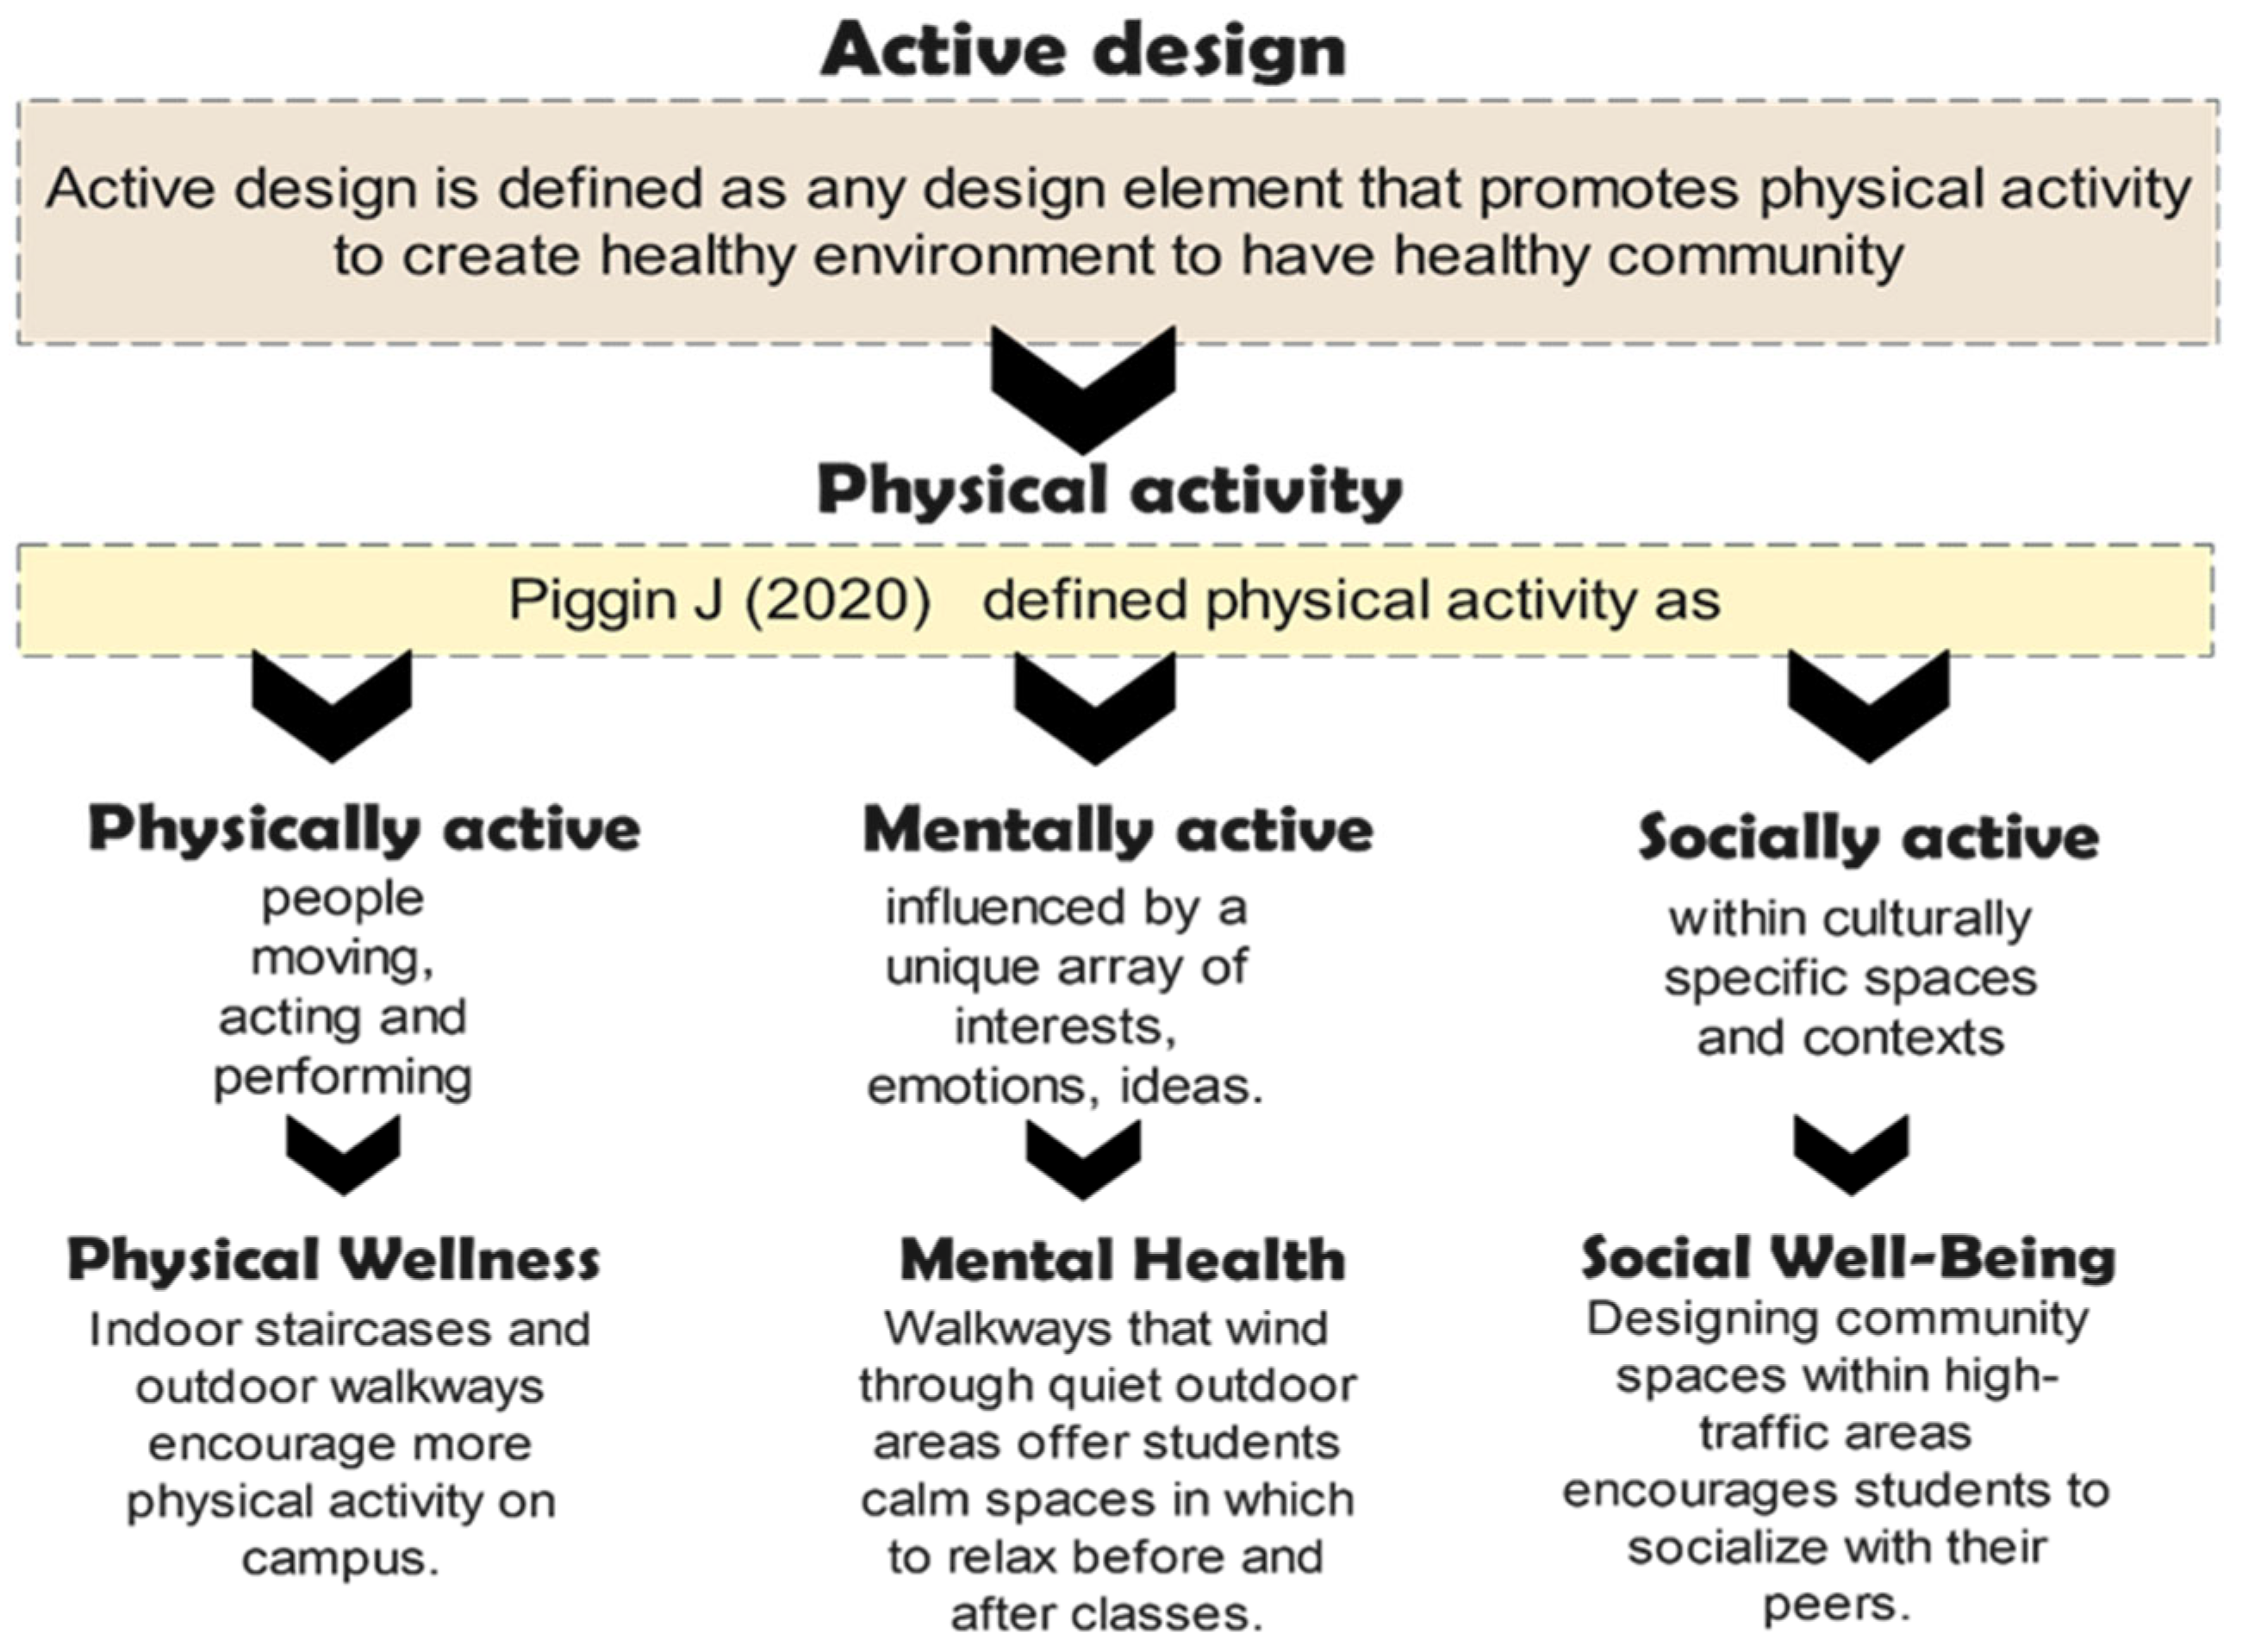
In the end, the new approach active design its definition studied, analyzed and categorized (Azeez, S.A. et al. 2023). This categorization was used to full fill the purpose and goal of this research paper.
Figure 3. Active design definitions and indicators (Authors’ analysis).
Preprints 75858 g003

1.3.2. Types of Physical Activity and its Measurement
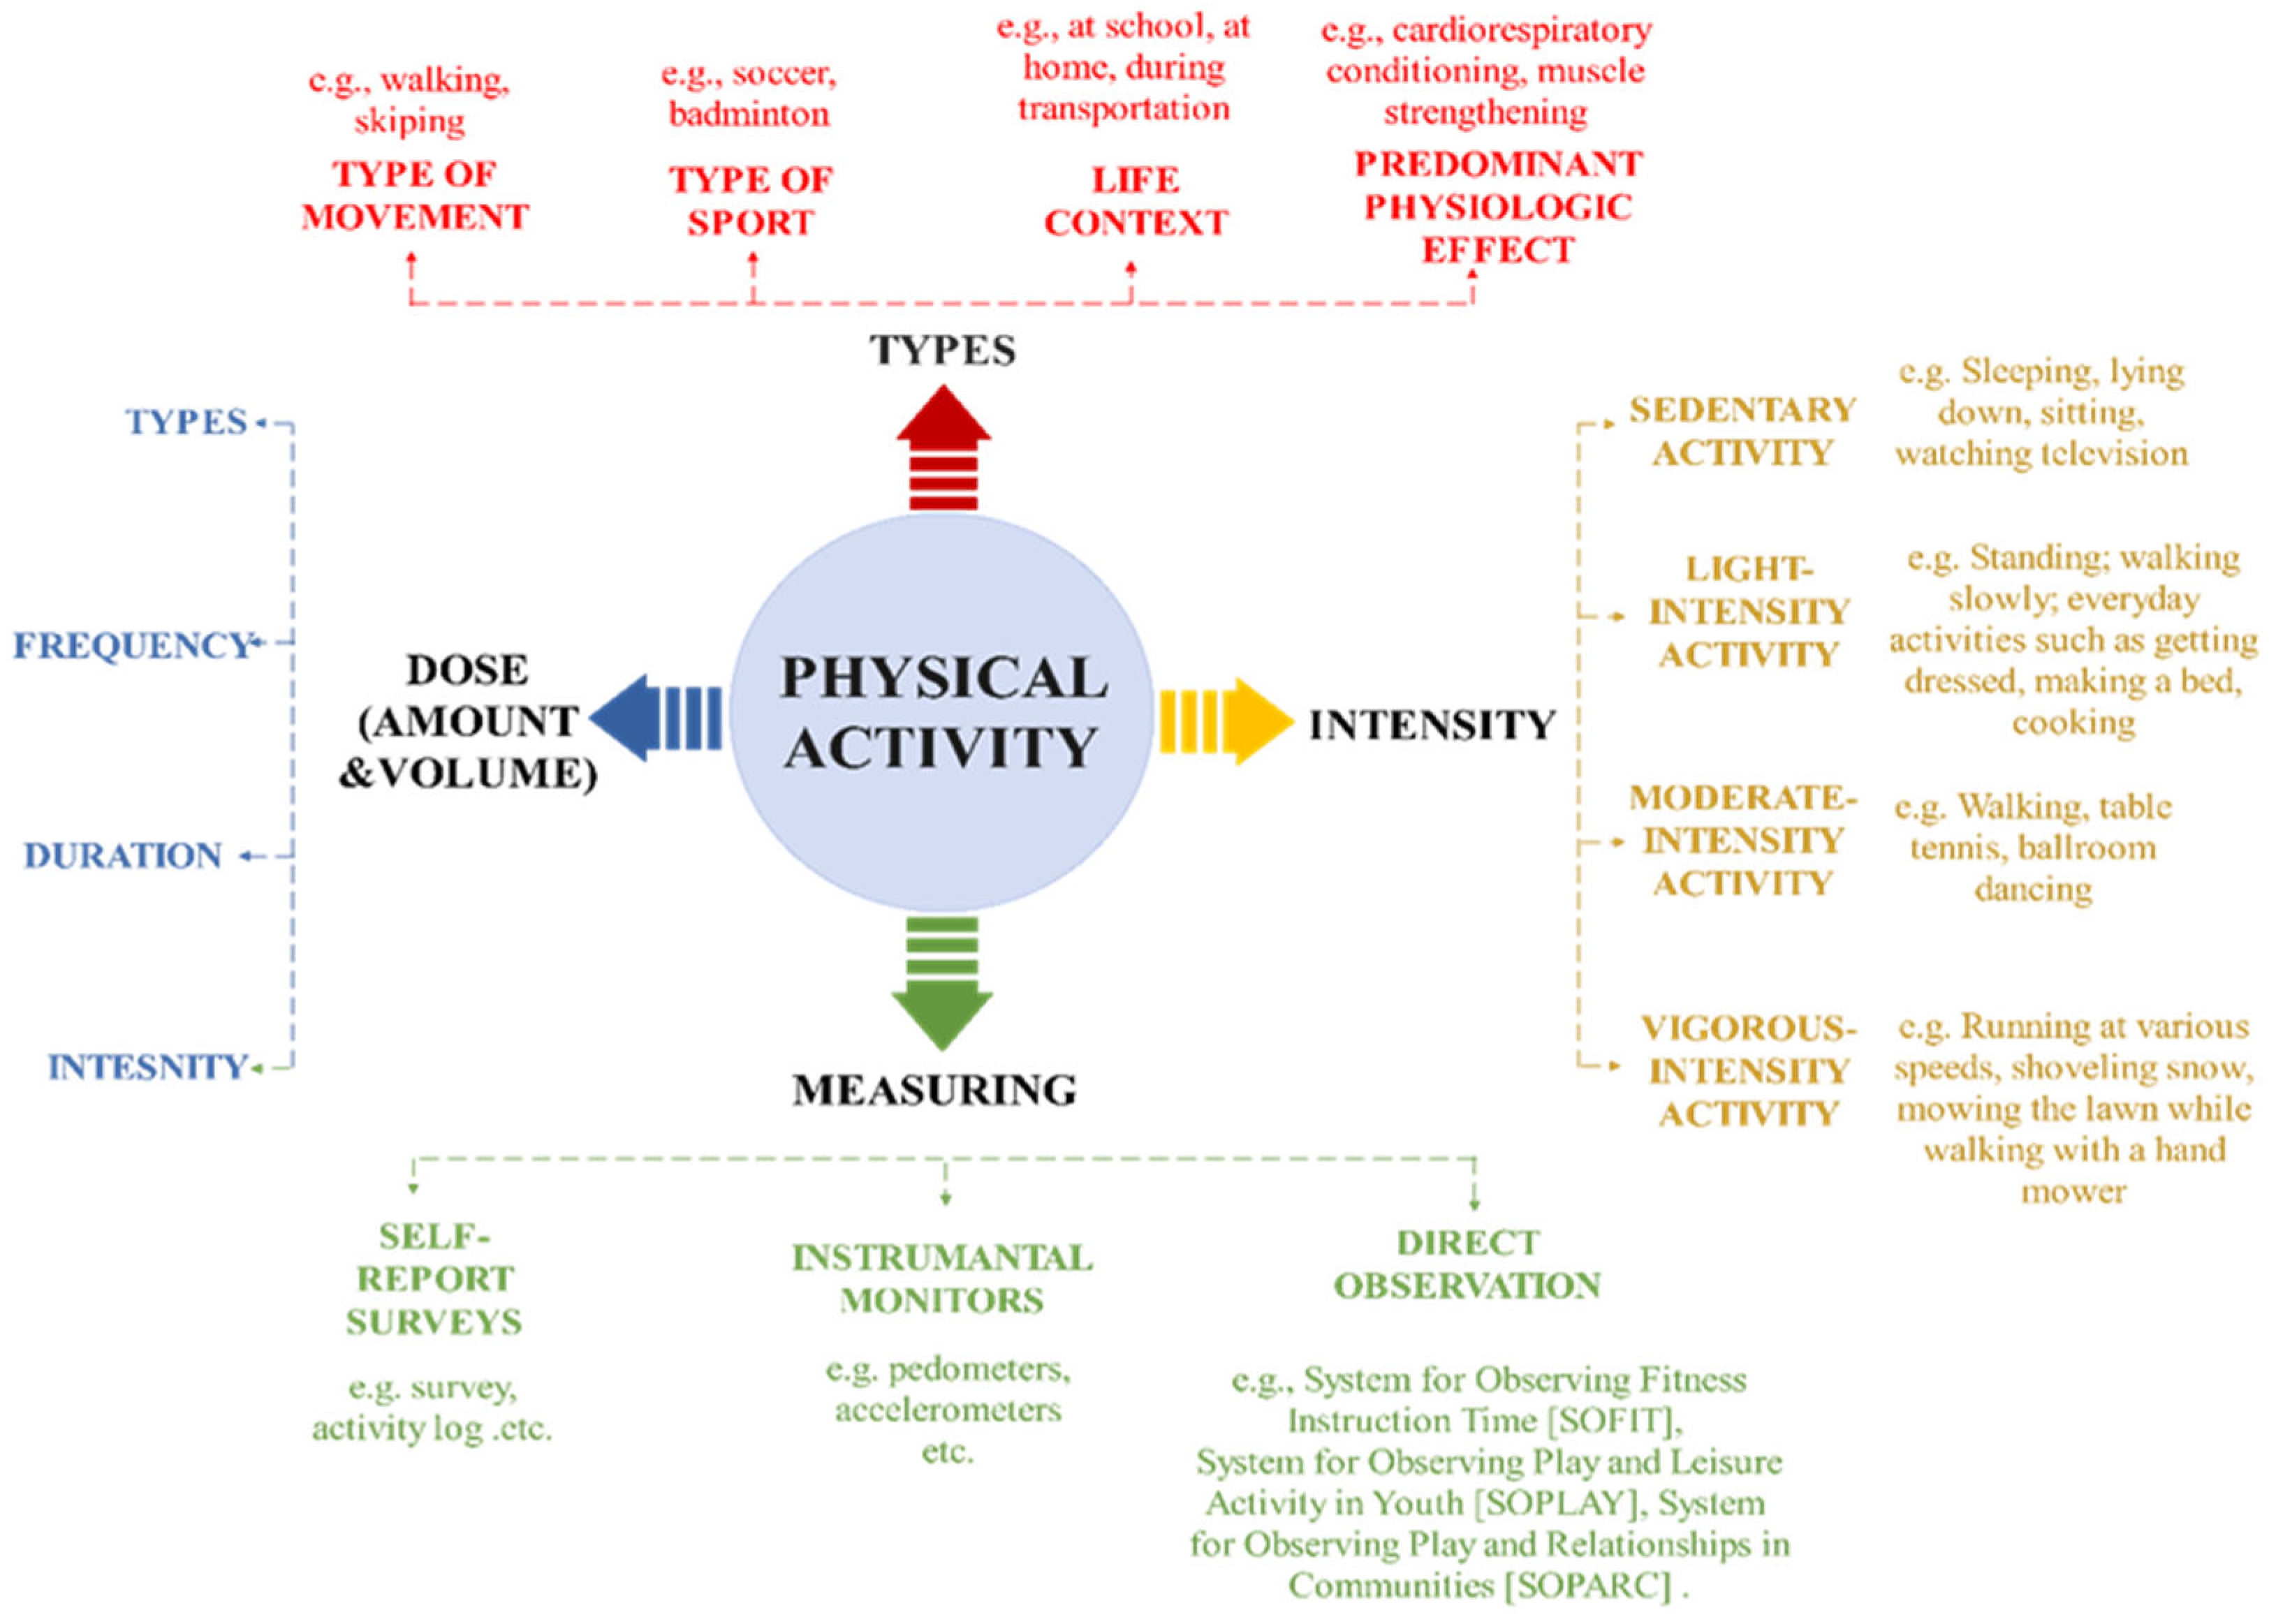
Physical activity is typically characterized as the following in the still-evolving subject of physical exercise and public health "Physical activity involves people moving, acting and performing within culturally specific spaces and contexts and influenced by a unique array of interests, emotions, ideas, instructions, and relationships." (Piggin 2020)Based on this definition physically active is categorized into three categories the individual is either physically active, mentally active or socially active (Azeez, S.A. et al 2023). Despite this easy definition, physical activity has many forms and intensities, making it a complicated habit. Physical activity can be divided into other categories, such as types of movement (such as walking or skipping), sports (such as soccer or badminton), living contexts (such as at school, home, or when travelling), or primary physiological effects (e.g., cardiorespiratory conditioning, muscle strengthening). Regardless of the classification system, physical exercise affects many health outcomes through various physiologic routes. Aerobic activities are the most popular and have the largest physiologic and physiological benefits, although physical activity is characterized and addressed in various ways. Based on the rate of energy expenditure, aerobic activities are frequently characterized as being sedentary, mild, moderate, or vigorous. Physical activity has been quantified in a variety of methods, including self-reported measures (such as surveys and activity logs), instrumental measurements (such as pedometers and accelerometers), which are sometimes referred to as "objective" measures, and direct observation, none of which are entirely adequate. (Kohl III, H.W. and Cook, H.D. eds., 2013). (See Figure 4) illustrate how physical activity could be measured and data collection will be based on this diagram.
Figure 4. The Diagram Indicates Physical Activity (types, intensity, measuring, and amount), (Designed by authors).
Preprints 75858 g004
Overall, if a place becomes active built environment should enhance physical activity and identify its types, intensity, amount, and measuring tool; this will help to know the amount of physical activity and active design in the built environment and identify its ratio of active living and lifestyle.

2. Materials and Methods

There are multiple methods for the Environmental psychology of the built environment but in this study, a new trend of the active design approach based on physical activity definition and categorization Figure (3) and Figure (1) was used to show the relationship between environmental psychology and a healthy built environment by determining its parameters. The ten university campus-built environments were selected as case studies with 428 student participants to full fill the questionnaire survey. The questionnaire is divided into three parts, part one is about the demographic survey(gender, age, college, department, weight, material status, living arrangement, having a chronic disease, doing sports, hours and location of exercise), part two is the categorization of physical activity, physically active (football, basketball, tennis, swimming, running, fitness/gym, work performance, and others). Mentally active questions based on emotion about activity, and socially active (leisure time spend in cafeteria or restaurants, public spaces- green area, library, event- halls spaces, theatre,shopping-market-kiosk), the last part open-ended questionnaires about the university campus, the most activated place, how it will be active in students point view, the positive and negative aspects of their university. The Data was analysed using the MedCalc Statistical Software, Version 20.218 (MedCalc Software Ltd., Ostend, Belgium; https://www.medcalc.org; accessed on 4 November 2022). The statistical analyses are descriptive statistics, ANOVA test and factor analysis to extract the most affected activity on students based on frequency. Statisticians employ factor analysis to find patterns or underlying factors in datasets and investigate the links between a group of observable variables and discover the latent variables that may be affecting them. Thus the primary goal of factor analysis is to explain the variance among observed variables by reducing them to a smaller number of unobserved factors. These factors stand in for the shared dimensions or constructs responsible for the correlation between the measured variables. Factor analysis does this by providing insight into the underlying structure of the data and aiding in the simplification of large datasets. The process of factor analysis involves estimating the factor loadings, which indicate the strength of the relationship between each observed variable and each factor. These loadings determine how much each variable contributes to each factor. The researcher typically decides on the number of factors to extract based on theoretical knowledge or statistical criteria (AHMED, R.M et al. 2022).

3. Results

3.1. Demographic Survey

The questionnaire survey was distributed over 428 student participants from 10 university campuses in the Kurdistan region. The participation rate takes out based on the total student number in university campuses with 10% (Table 1). The questionnaires were randomly distributed to students from different colleges. The female participants were more than males, 58.8% and 41.2% respectively. About age from 18 years old to 33 years old, the fresh student’s first-year stage rate is 4.8%. The students who have more than one year of experience on campus rate is 79.3% which is the maximum rate of participants. Other participants are those who went to university after the age of 24 years old 15% and 1% respectively. The weight of students ranged from 40kg to 140 kg. Most students have a normal weight between 41-60kg and 61-80 kg, their rates are 48.2 %and 36.6%. the overweight students are categorized as 81-100kg rate is 12.1%, 101-120 kg rate is 2.2% and 121-140 kg is 0.2%. this indicates a low percentage of students are overweight. For material status, most students are single rate is 91.7%. Most of the students live with family in the house its rate is 78.8%, and only 18.6% live in the dormitory. A small rate of students living with their friends in rented apartment rate is 2.6%. Only 10.6 % of students suffer from chronic (thyroid, arthritis, chronic kidney disease, liver disease, diabetes and depression). For sports, 58.2% of students do sports and 41.8 % are not interested in doing sports, the result is nearly the same. The percentage of hours doing sport per week maximum is ≤ 1-hour rate is 42% and minimum ≥4 rate is 13.7%. Most students are interested to do sports outside campus its rate is 74.6%, only 19.7% do sports inside the university campus, and 5.7% who are boys do sports inside and outside the campus. This is parallel to (von Sommoggy J,2020) conclusion in that “campuses discouraged students from being physically active by missing out on opportunities—indoors and outdoors— campuses discouraged students from being physically active by missing out on opportunities—indoors and outdoors—for fostering movement, such as designating the greens for games or walks or providing sufficient lockers for biking gear. The results can serve as a basis to plan custom-made public health interventions”. The number decreased after COVID-19 (Wong, M.-Y.C. et al 2023) (Mir IA et al. 2023). In addition, 50% do exercise inside the building, 43.9% outside of the building and only a small number 6.1% do sport in and out of the building.
Table 1. Demographic survey.
Demographic Survey Count Table N %


University Campus
Case 1 = University of Dohuk 141 32.9%
Case 2 = University of Sulaimani 67 15.7%
Case 3 = University of Zakho 29 6.8%
Case 4 = Koya University 28 6.5%
Case 5 = Cihan University - Erbil 43 10.0%
Case 6 = University of Tishk-Erbil 40 9.3%
Case 7 = The Lebanese French University-Erbil 25 5.8%
Case 8 = Knowledge University-Erbil 25 5.8%
Case 9 = Nawroz University -Dohuk 18 4.2%
Case 10 = Catholic University -Erbil 12 2.8%

Gender
Male 176 41.2%
Female 251 58.8%

Age (Binned)
<= 18 20 4.8%
19 - 23 334 79.3%
24 - 28 63 15.0%
29 - 33 4 1.0%
34+ 0 0.0%


Weight (Binned)
<= 40 3 0.7%
41 - 60 199 48.2%
61 - 80 151 36.6%
81 - 100 50 12.1%
101 - 120 9 2.2%
121 - 140 1 0.2%
141+ 0 0.0%

Material status
Single 387 91.7%
Married 35 8.3%

Living arrangement
Home 335 78.8%
Dormitory 79 18.6%
with a friend to rent a house/apartment 11 2.6%

Having chronic disease
Yes 45 10.6%
No 379 89.4%

Do sport (any kind)
Yes 245 58.2%
No 176 41.8%


Hours of exercise per week
<=1 150 42.0%
2 108 30.3%
3 50 14.0%
>=4 49 13.7%

Location (doing sport)
Inside University Campus 66 19.7%
Outside University Campus 250 74.6%
Both 19 5.7%

Fixed setting (doing sport)
Indoor (building) 157 50.0%
Outdoor (site plan) 138 43.9%
Both 19 6.1%

3.2. Missing

There are some answers in the questionnaire survey, that are either not answered by students or the answers are not clear for the reliability and accuracy of results they are excluded as shown in Table (2). The maximum percentage of answers in the mentally active 99.5% included, and the Socially active range between 91.6%-93.5% answers included. Physical activity answers included a rate between 84.6%-85.3%. Overall the total average from 428 participants was only 9.7% unbailable answers excluded.
Table 2. The percentage of included and excluded participants who answer in the study.
Case Processing Summary
Cases
Included Excluded Total
N Per cent N Per cent N Percent
Physical activity (Frequency) * University campus 364 85.0% 64 15.0% 428 100.0%
Physical activity (Duration) * University campus 362 84.6% 66 15.4% 428 100.0%
Physical activity (Intensity) * University campus 365 85.3% 63 14.7% 428 100.0%
Mentally active (Emotion) * University campus 426 99.5% 2 0.5% 428 100.0%
Socially active(Frequency) * University campus 396 92.5% 32 7.5% 428 100.0%
Socially active(Duration) * University campus 392 91.6% 36 8.4% 428 100.0%
Socially active(Importance) * University campus 400 93.5% 28 6.5% 428 100.0%

3.3. Physical Activity Categories

3.3.1. Physical Activity

The physical activity types included are football, basketball, tennis, swimming, running, fitness/gym, walking, bicycling, exercise physiology (aerobic, yoga), and work performance (university activity participation). The result showed that physical activity such as football, walking and work performance was done by most students inside university campuses other activities were done outside of campus based on individual interest. Most of the students give importance to exercise physiology, swimming, and fitness/gym to shape their body and look good, activities such as bicycling and running are done by some students who are interested in it doing these activities one time for an hour per week. Table 1 showed just 19.7% of students active on campus which is very less, the reason behind it return to most of the campuses did not have the opportunity for students to be active, another reason is that the students who have a lab and practical lectures they do not have time for doing activities inside the campus also (Salonee Jambusaria et al 2020) find out students that do not work out the reasons are the lack of time, energy, and inspiration to work out, a study by (Wu, Y. et al 2023) managing schedule of education for promoting physical activity is crucial. In addition, students engage in higher sedentary time in university for instance sitting in lectures for a long time(Castro, O. et al 2020). Campus universities such as Case 1, case 2, case 3, and Case 4 since having College of physical education and Sport Sciences have all the physical activities but Case 5, case 6 and Case 10 just have a football stadium that could be used for basketball and running too. Case 9 has a basketball and tennis field that can be used by students whenever interested to do so, but the last cases 6 and case 8 do not have any physical activities inside campuses in future they plan to add these activities. In a study by (Melissa L. deJonge et al . 2021), the findings have implications for adopting physical activity programs on campus as a mental health and well-being intervention. Statistically, there is a significant reduction in anxiety symptoms, depressive symptoms, and psychological distress before and after the program. Therefore finding and other research studies indicate that there is a strong relationship between physical activity and mental health (Rodríguez-Romo, G et al.2023, Shahadan, S.Z. et al 2022, Zhang, Z. et al 2023), thus physical activity interventions are crucial for the campus to improve the mental health of their students. For this study, the statistical descriptive includes the number of the sample (N), mean, 95% confidence interval for the mean, standard deviation with minimum and maximum for physical activities (frequency: repetition of activity per week), (duration: number of hours spend each time on the activity) with what intensity do (light, moderate and vigorous). Table (3) The mean for total physical activity frequency for case 1, case 9 and case 10 are 3.2, 3.6, and 3.4 times respectively which is the standard minimum number of activities done 3 times per week. But for other case studies less than this range. For the duration which is several hours for doing these exercises each time the mean for all cases is nearly the same starting from 1.32 hours for each time to 1.9 hours. With 95% coefficient intervals of mean of an hour less than one hour to two hours maximum, most of the students spend time on physical activities. Furthermore for physical activity intensity for all cases nearly the same intensity from light to moderate with a low number in vigorous-intensity especially in sports and fitness/gym. Its mean range is from 1.2 to 1.9.
Table 3. Descriptive statistics for the physical activity category.
Descriptives statistics
N Mean Std. Deviation Std. Error 95% Confidence Interval for Mean Minimum Maximum
Lower Bound Upper Bound
Physical activity (Frequency) Case 1 116 3.2059 1.88316 0.17485 2.8596 3.5523 1 7
Case 2 48 1.8771 1.19052 0.17184 1.5314 2.2228 1 5
Case 3 28 2.5493 1.49646 0.28281 1.9691 3.1296 1 5
Case 4 17 1.4765 0.9763 0.23679 0.9745 1.9784 1 3.5
Case 5 42 2.4901 1.64798 0.25429 1.9765 3.0036 1 7
Case 6 39 1.7465 0.45192 0.07237 1.6 1.893 1 3.75
Case 7 25 1.178 0.26657 0.05331 1.068 1.288 1 2
Case 8 24 2.5357 1.10814 0.2262 2.0678 3.0036 1 4.75
Case 9 15 3.6756 1.36785 0.35318 2.9181 4.433 1.5 6
Case 10 10 3.4567 1.59831 0.50543 2.3133 4.6 1 7
Total 364 2.5032 1.60788 0.08428 2.3375 2.669 1 7
Physical activity (Duration) Case 1 115 1.6391 0.80329 0.07491 1.4907 1.7875 1 4
Case 2 47 1.7259 1.29861 0.18942 1.3446 2.1072 1 7
Case 3 29 1.908 1.32667 0.24636 1.4034 2.4127 1 6
Case 4 16 1.3688 0.69447 0.17362 0.9987 1.7388 1 3
Case 5 42 1.7286 0.50822 0.07842 1.5703 1.887 1 3
Case 6 39 1.4774 0.40715 0.0652 1.3454 1.6094 1 2.5
Case 7 25 1.3219 0.29562 0.05912 1.1999 1.4439 1 2
Case 8 24 1.6657 0.77699 0.1586 1.3376 1.9938 1 4
Case 9 15 1.5744 0.56851 0.14679 1.2596 1.8893 1 2.5
Case 10 10 1.5633 0.9326 0.29491 0.8962 2.2305 1 3.5
Total 362 1.628 0.84941 0.04464 1.5402 1.7158 1 7
Physical activity (Intensity) Case 1 116 1.9253 0.5733 0.05323 1.8198 2.0307 1 3
Case 2 49 1.6095 0.53709 0.07673 1.4553 1.7638 1 3
Case 3 29 1.7836 0.57828 0.10738 1.5637 2.0036 1 3
Case 4 17 1.584 0.44265 0.10736 1.3564 1.8116 1 2
Case 5 42 1.5935 0.479 0.07391 1.4442 1.7427 1 2.5
Case 6 39 1.45 0.52432 0.08396 1.28 1.62 1 3
Case 7 25 1.1295 0.20258 0.04052 1.0459 1.2131 1 1.6
Case 8 23 1.2479 0.38154 0.07956 1.0829 1.4129 1 2
Case 9 15 1.6333 0.44633 0.11524 1.3862 1.8805 1 2
Case 10 10 1.65 0.53547 0.16933 1.2669 2.0331 1 2.5
Total 365 1.6501 0.56258 0.02945 1.5921 1.708 1 3

3.3.2. Mentally Active

There are nine questions asked about their emotion as to how they feel by doing physical activity and daily routine including being socially active with a Likert scale of either agree with the statement or not. Out of 428 participants, just 2 participants were excluded, and 426 answered positively. Table (4) illustrates among these numbers case 1, case 4 and case 9 same mean are 4. This indicates they agree and feel safe, comfortable, motivated, and expend energy when they are active. Seven out of ten cases nearly have the same mean which is 3.8. This showed that all have nearly the same opinion and agree with these statements. A the end of the questionnaire survey they asked open-ended questions even though they have a positive perception about physical activity will affect mental health (Rodríguez-Romo, G et al.2023, Shahadan, S.Z. et al 2022, Zhang, Z. et al 2023, LaBelle, B.2023), they claimed they do not have enough time to do it on campus but they are more socially active they feel good and satisfied. In addition, mental health is the main parameter of environmental psychology.
Table 4. Descriptive statistics for the mentally active category.
Descriptives statistics
N Mean Std. Deviation Std. Error 95% Confidence Interval for Mean Minimum Maximum
Lower Bound Upper Bound
Mentally active (Emotion) Case 1 140 4.1008 0.49119 0.04151 4.0187 4.1828 3 6.5
Case 2 67 3.7299 0.628 0.07672 3.5768 3.8831 1 4.88
Case 3 28 4.0079 0.48574 0.0918 3.8195 4.1962 3.13 5
Case 4 28 3.8386 0.37015 0.06995 3.6951 3.9822 3.25 4.63
Case 5 43 3.8343 0.40341 0.06152 3.7102 3.9585 3 4.63
Case 6 40 3.8469 0.50676 0.08013 3.6848 4.0089 2.63 4.63
Case 7 25 3.685 0.59852 0.1197 3.4379 3.9321 1.88 4.88
Case 8 25 3.8721 0.63768 0.12754 3.6089 4.1354 1.75 5
Case 9 18 4.0625 0.56107 0.13225 3.7835 4.3415 2.88 4.75
Case 10 12 3.9896 0.42459 0.12257 3.7198 4.2594 3.38 4.75
Total 426 3.9258 0.53567 0.02595 3.8748 3.9768 1 6.5

3.3.3. Socially Active

There are six social activities spending time with friends including the survey as leisure time (cafeteria, restaurant), public spaces (green area, park, benches), library, event hall spaces, theatre and shopping market kiosk. They are asked about frequency (how many times they visit this location), duration (how much they spend time when they visit these spaces) and how much this social activity is important for them. The result showed that the frequency means for visiting the social location on campuses in Case 8, case 9 and Case 10 is nearly the same between 3-3.5 times. For case 1, case 2, case 3, case 4, case 5, and case 6 mean is from 1.7 to 2.2 times which is nearly the same except case 7 has a minimum mean is 1.2 times per week. (time spend at social location). The duration means for all groups is somehow the same starting from 1.39 to 2.1 hours for each time. The break time for all universities same they have a lunch break starting from 12:00 till 13.30 nearly a 1.5-hour small break between lectures from 10-15 minutes. Also, a study by (Ingy Ibrahim El-Darwish 2021) claimed that universities must integrate more outdoor space to encourage social interaction. Social contact on university campuses can improve student’s sense of belonging and well-being and the study emphasizes the necessity of student involvement in creating appropriate social interaction sites, pathways, and routes on campuses that satisfy their requirements. This show that they spend all their break time on social activity more than physical activity. For the rate of the importance of social activity as shown in Table (5) the minimum mean is case 7 (1.32) and the maximum mean is case 2 (1.78) the other cases between them. This indicates that all of them give importance to social activity during break time at university campuses.
Table 5. Descriptive statistics for the socially active category.
Descriptives statistics
N Mean Std. Deviation Std. Error 95% Confidence Interval for Mean Min Max
Lower Bound Upper Bound
Socially active (Frequency) Case 1 132 2.2109 1.11347 0.09692 2.0191 2.4026 1 8
Case 2 57 1.7497 1.16049 0.15371 1.4418 2.0576 1 7
Case 3 25 1.9567 1.57253 0.31451 1.3076 2.6058 1 7
Case 4 24 1.8153 0.87774 0.17917 1.4446 2.1859 1 4.33
Case 5 40 1.8854 0.80801 0.12776 1.627 2.1438 1 4
Case 6 40 1.7846 0.38993 0.06165 1.6599 1.9093 1 2.67
Case 7 25 1.266 0.33494 0.06699 1.1277 1.4043 1 2.25
Case 8 24 3.2569 0.89108 0.18189 2.8807 3.6332 1.5 5
Case 9 18 3.5139 1.3661 0.32199 2.8345 4.1932 1 6
Case 10 11 3.0848 0.98819 0.29795 2.421 3.7487 1.2 4.5
Total 396 2.1158 1.14925 0.05775 2.0022 2.2293 1 8
Socially active (Duration) Case 1 132 1.954 0.84987 0.07397 1.8077 2.1004 1 6.33
Case 2 55 2.0909 1.01312 0.13661 1.817 2.3648 1 6
Case 3 24 2.0354 2.02444 0.41324 1.1806 2.8903 1 10
Case 4 23 1.4312 0.62293 0.12989 1.1618 1.7005 1 3.67
Case 5 40 2.1004 1.43208 0.22643 1.6424 2.5584 1 10
Case 6 40 1.5362 0.46975 0.07427 1.386 1.6865 1 2.5
Case 7 25 1.3933 0.26308 0.05262 1.2847 1.5019 1 1.75
Case 8 24 1.7014 1.30516 0.26642 1.1503 2.2525 1 6.75
Case 9 18 1.7824 0.85517 0.20157 1.3571 2.2077 1 4.5
Case 10 11 1.8682 0.7744 0.23349 1.3479 2.3884 1 3.5
Total 392 1.8583 1.03942 0.0525 1.7551 1.9615 1 10
Socially active (Importance) Case 1 132 1.7068 0.44653 0.03887 1.6299 1.7837 1 3
Case 2 60 1.7869 0.43991 0.05679 1.6733 1.9006 1 2.67
Case 3 27 1.6407 0.42848 0.08246 1.4712 1.8102 1 2.33
Case 4 23 1.5022 0.48654 0.10145 1.2918 1.7126 1 2.33
Case 5 40 1.6767 0.43963 0.06951 1.5361 1.8173 1 2.5
Case 6 40 1.4254 0.40236 0.06362 1.2967 1.5541 1 2.33
Case 7 25 1.322 0.37527 0.07505 1.1671 1.4769 1 2.33
Case 8 24 1.4757 0.4541 0.09269 1.2839 1.6674 1 2
Case 9 18 1.588 0.40672 0.09586 1.3857 1.7902 1 2
Case 10 11 1.7636 0.28302 0.08533 1.5735 1.9538 1.33 2.2
Total 400 1.6298 0.44966 0.02248 1.5856 1.6739 1 3
In the end, the ANOVA test was done for all groups’ physical activity in terms of (frequency, duration and intensity), mentally active and socially active in terms of (frequency, duration and importance) between groups and within groups as shown in Table (6) The F-value in ANOVA has calculated variation between sample mean/ variation within sample The higher F-value the higher the variation between sample mean/variation within samples. The higher the F-value the lower the corresponding p-value. The F- value is high for physical activity (frequency and intensity). (F(21,2)=9.9,p=0.000) and (F(2.4,0.2)=9.1, p=0.000) which is significant but for physical activity duration (F(0.8,0.7)=1.1, p=0.31) which is not significant since the p-value is not less than 0.05. this means the variation between samples is not high enough relative to the variation within samples, to reject the null hypothesis. On the other hand, for mentally active and socially active (frequency, duration and importance) F-value is high enough so it’s significant.
Table 6. ANOVA statistical test for showing the effect of activity between groups and within the groups.
ANOVA
Sum of Squares df Mean Square F Sig.

Physical activity (Frequency)
Between Groups 190.059 9 21.118 9.989 .000
Within Groups 748.397 354 2.114
Total 938.455 363

Physical activity (Duration)
Between Groups 7.585 9 .843 1.173 .311
Within Groups 252.876 352 .718
Total 260.461 361

Physical activity (Intensity)
Between Groups 21.652 9 2.406 9.129 .000
Within Groups 93.553 355 .264
Total 115.205 364

Mentally active (Emotion)
Between Groups 9.773 9 1.086 4.027 .000
Within Groups 112.177 416 .270
Total 121.951 425
Socially active (Frequency) Between Groups 112.964 9 12.552 11.853 .000
Within Groups 408.739 386 1.059
Total 521.704 395
Socially active (Duration) Between Groups 21.729 9 2.414 2.302 .016
Within Groups 400.703 382 1.049
Total 422.432 391
Socially active (Importance) Between Groups 7.568 9 .841 4.486 .000
Within Groups 73.107 390 .187
Total 80.675 399

3.3.4. Factor Analyses for Physical Activity, Mentally Active and Socially Active

The factor analysis and statistics were used to show the most activity done by students (behaviour observation) and the most related activity to each other. Factor Analysis is a statistical method that looks at how lots of different observations correlate and determines how many theoretical constructs could most simply explain what you see (Ahmed, R.M et al. 2022). In other words, as follows:
  • Physical activity extraction:
In the questionnaire, the physical activity asked for ten activities (Football, basketball, tennis, Swimming, running, fitness/gym, walking, bicycling, exercise physiology(aerobic, yoga), and work performance (university activity participation).
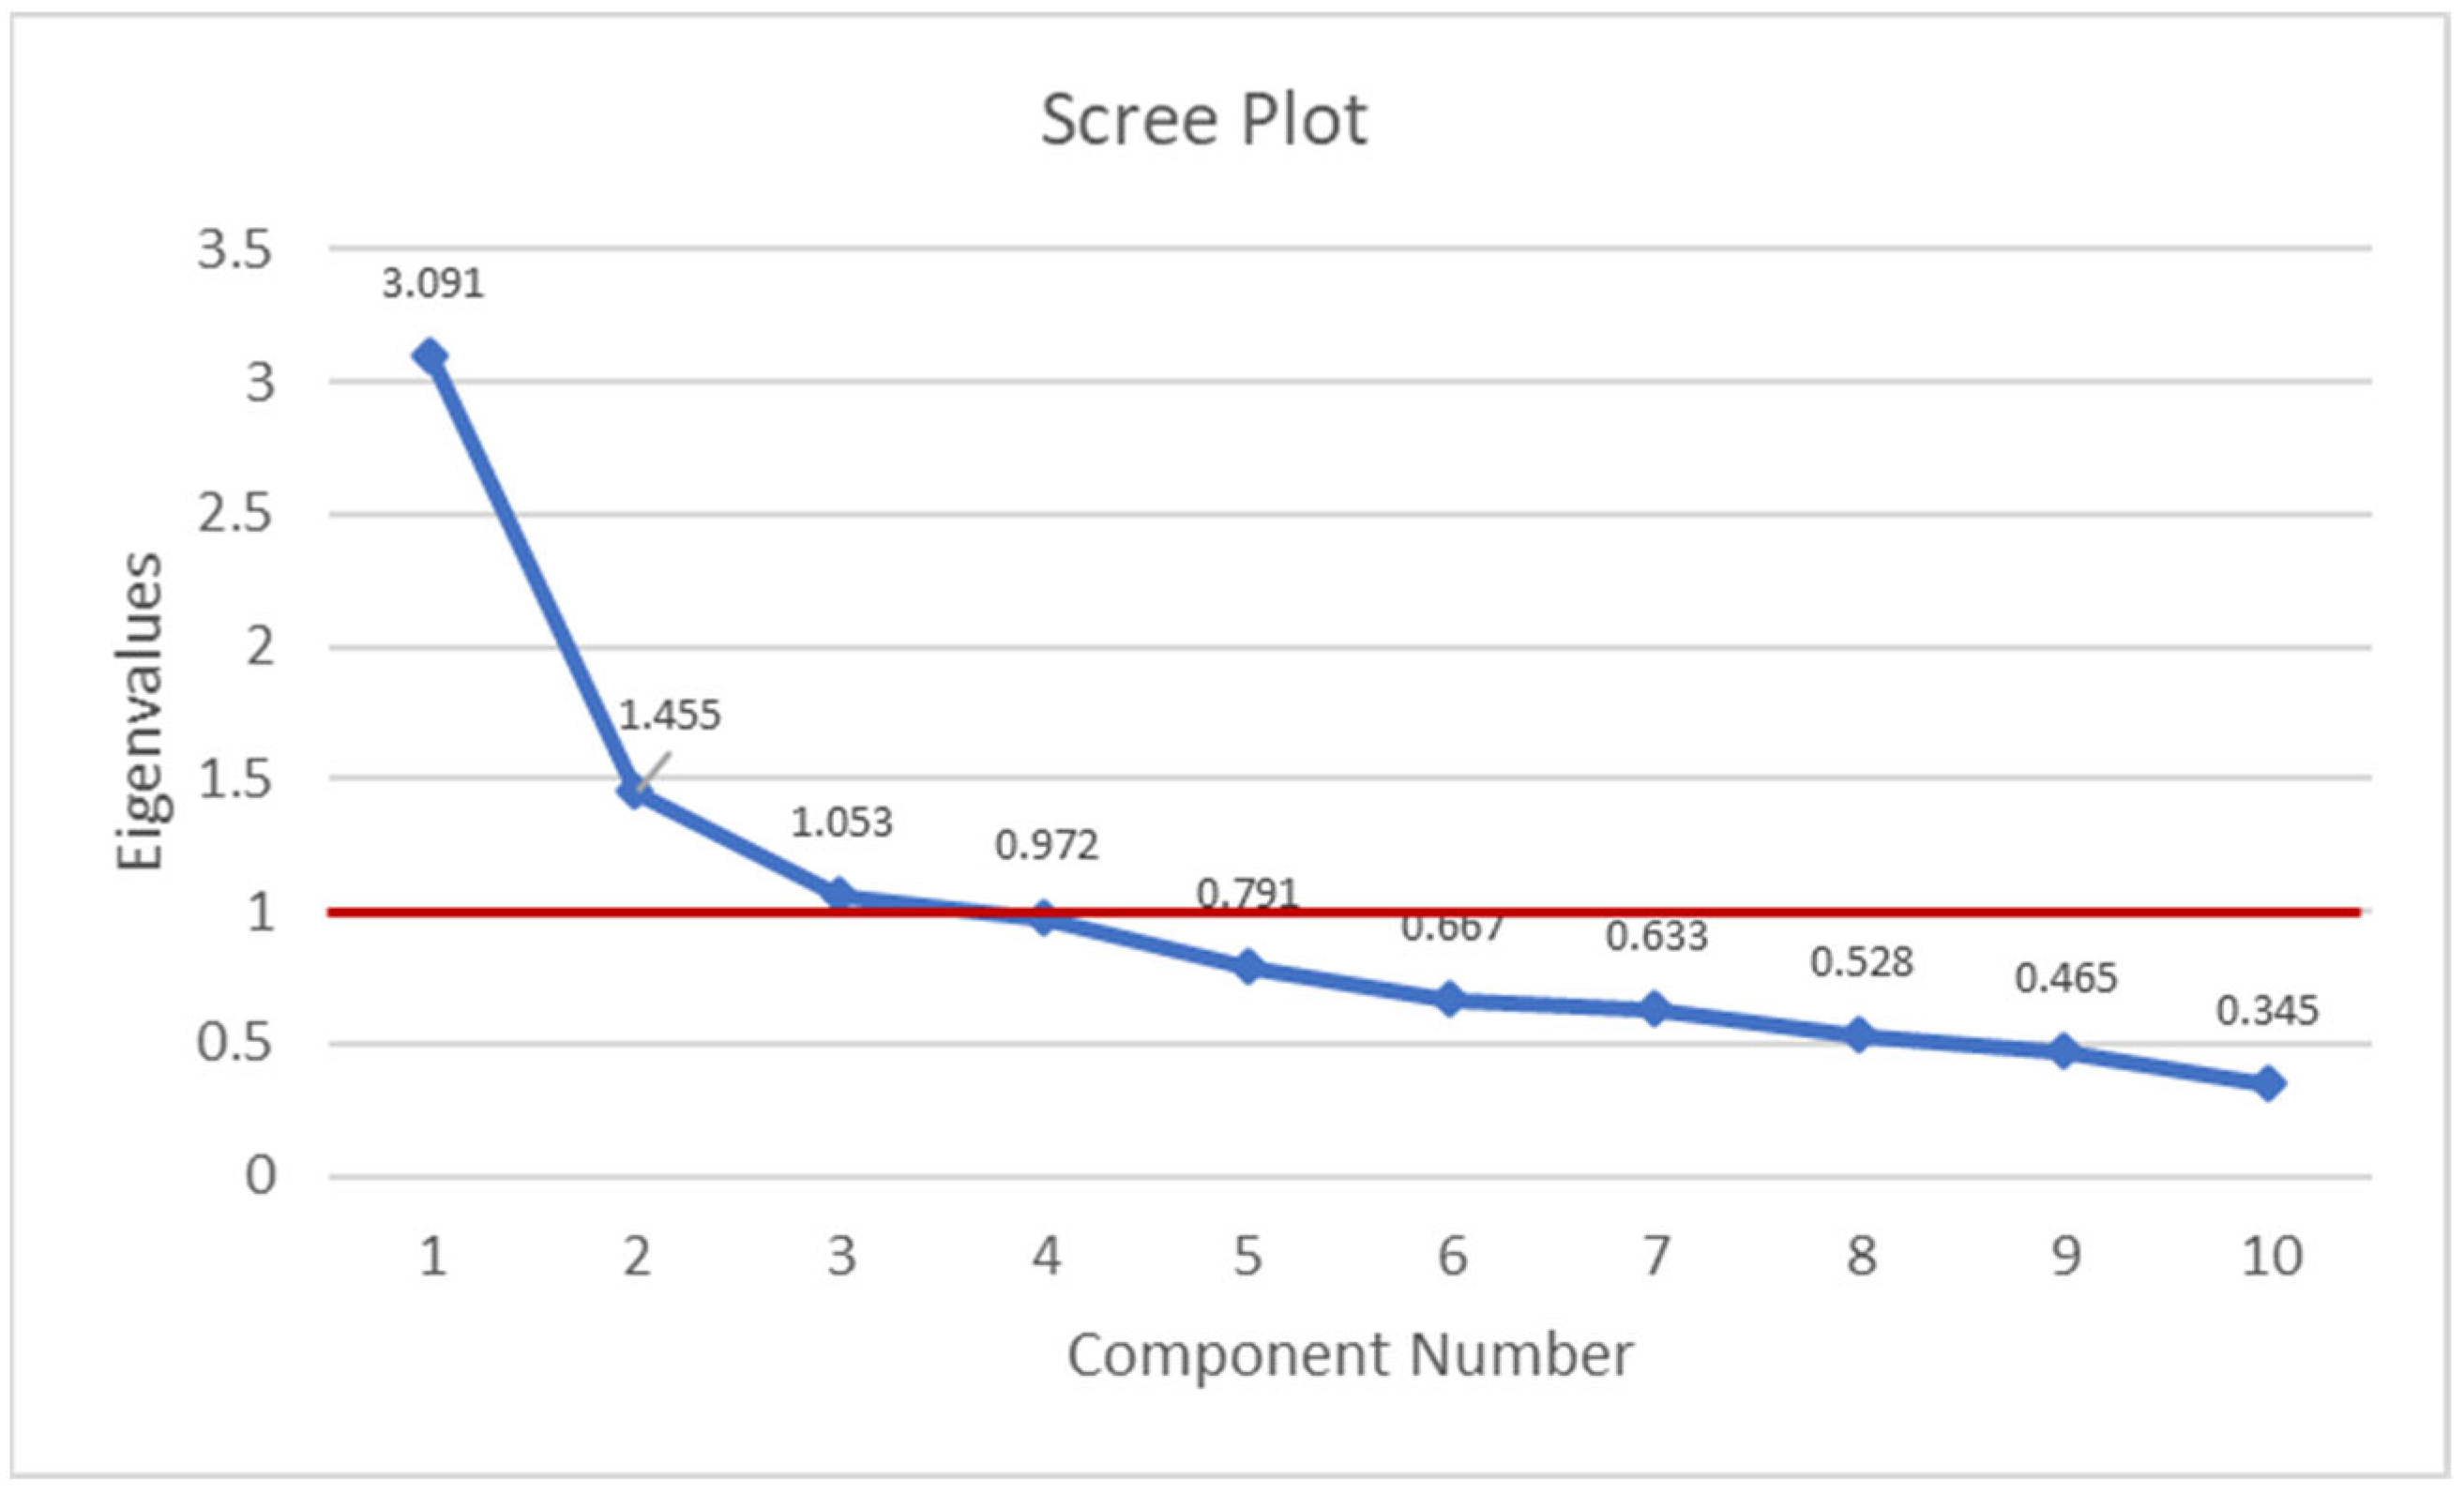
The scree plot method is used to determine the number of factors for physical activity. The y-axis shows the total eigenvalue and the x-axis number of components (physical activity). The scree plot orders the eigenvalues from largest to smallest. The first three factors have eigenvalues of more than 1, extracted three components. From largest to smallest (3.091), (1.455) and (1.053) respectively as shown in scree plot Figure (5).
The eigenvalues change less markedly when more than 9 factors are used. Therefore, 4–9 factors appear to explain most of the variability in the data. The percentage of variability explained by factor 1 is 3.091 or 30.91%. The percentage of variability explained by Factor 3 is 1.053 or 10.53%. The scree plot shows that the first three factors account for most of the total variability in data. The remaining factors account for a very small proportion of the variability and are likely unimportant.
Figure 5. Scree Plot to determine the number of factors for physical activity.
Preprints 75858 g005
Table 7 rotated component matrix extracted the 10 factors into three components and the relation of each factor with each other component 1 composed of 6 factors are swimming, tennis, basketball, working performance, exercise physiology and football. This indicates that out of six factors only two of them students have done. this means students are more active outside of university campuses. The second components have three factors are (walking, running and fitness/gym), walking also another factor students do inside university campuses the last components just have one factor which is bicycling which has done just by a few students outside the campus as an interest for doing this activity. The reason students do not use is the transportation system does not have a bicycle lane therefore there is no safety for students. The other students come from the countryside which is far away from university campuses. The dormitory students by walking they go to buildings.
Table 7. Extraction components of physical activity.
Rotated Component Matrixa Rotated Component Matrixa Factor Matrixa
Physically active Component Mentally active Component Socially active Factor
1 2 3 1 2 1
Swimming 0.8 I feel anxiety every 4 weeks. 0.676 Leisure time (cafeteria, restaurant) 0.484
Tennis 0.747 I feel depressed when I am not active 0.622 Public spaces (green area, park, benches) 0.714
Basketball 0.663 I feel safer when I am doing physical activities. 0.602 Library 0.753
Working performance (university activity participants) 0.611 Emotionally I feel good when I am physically active 0.509 Event-Hall spaces 0.959
Exercise physiology (aerobic, yoga) 0.539 I feel comfortable everyday walking 0.454 Theatre 0.943
Football 0.517 I expend energy on daily activities. 0.792 Shopping- market- kiosk 0.761
Walking 0.78 I feel good about my Skeletal muscles and health 0.611 Extraction Method: Principal Component Analysis.
Running 0.734 My mood motivates me to move. 0.567 a. 1 factor extracted. 5 iterations required.
Fitness/gym 0.693 Extraction Method: Principal Component Analysis. Only one factor was extracted. The solution cannot be rotated.
8-Bicycling 0.8 Rotation Method: Varimax with Kaiser Normalization. a
Extraction Method: Principal Component Analysis. a. Rotation converged in 3 iterations.
Rotation Method: Varimax with Kaiser Normalization. a
a. Rotation converged in 5 iterations.
2.
Mentally active extraction
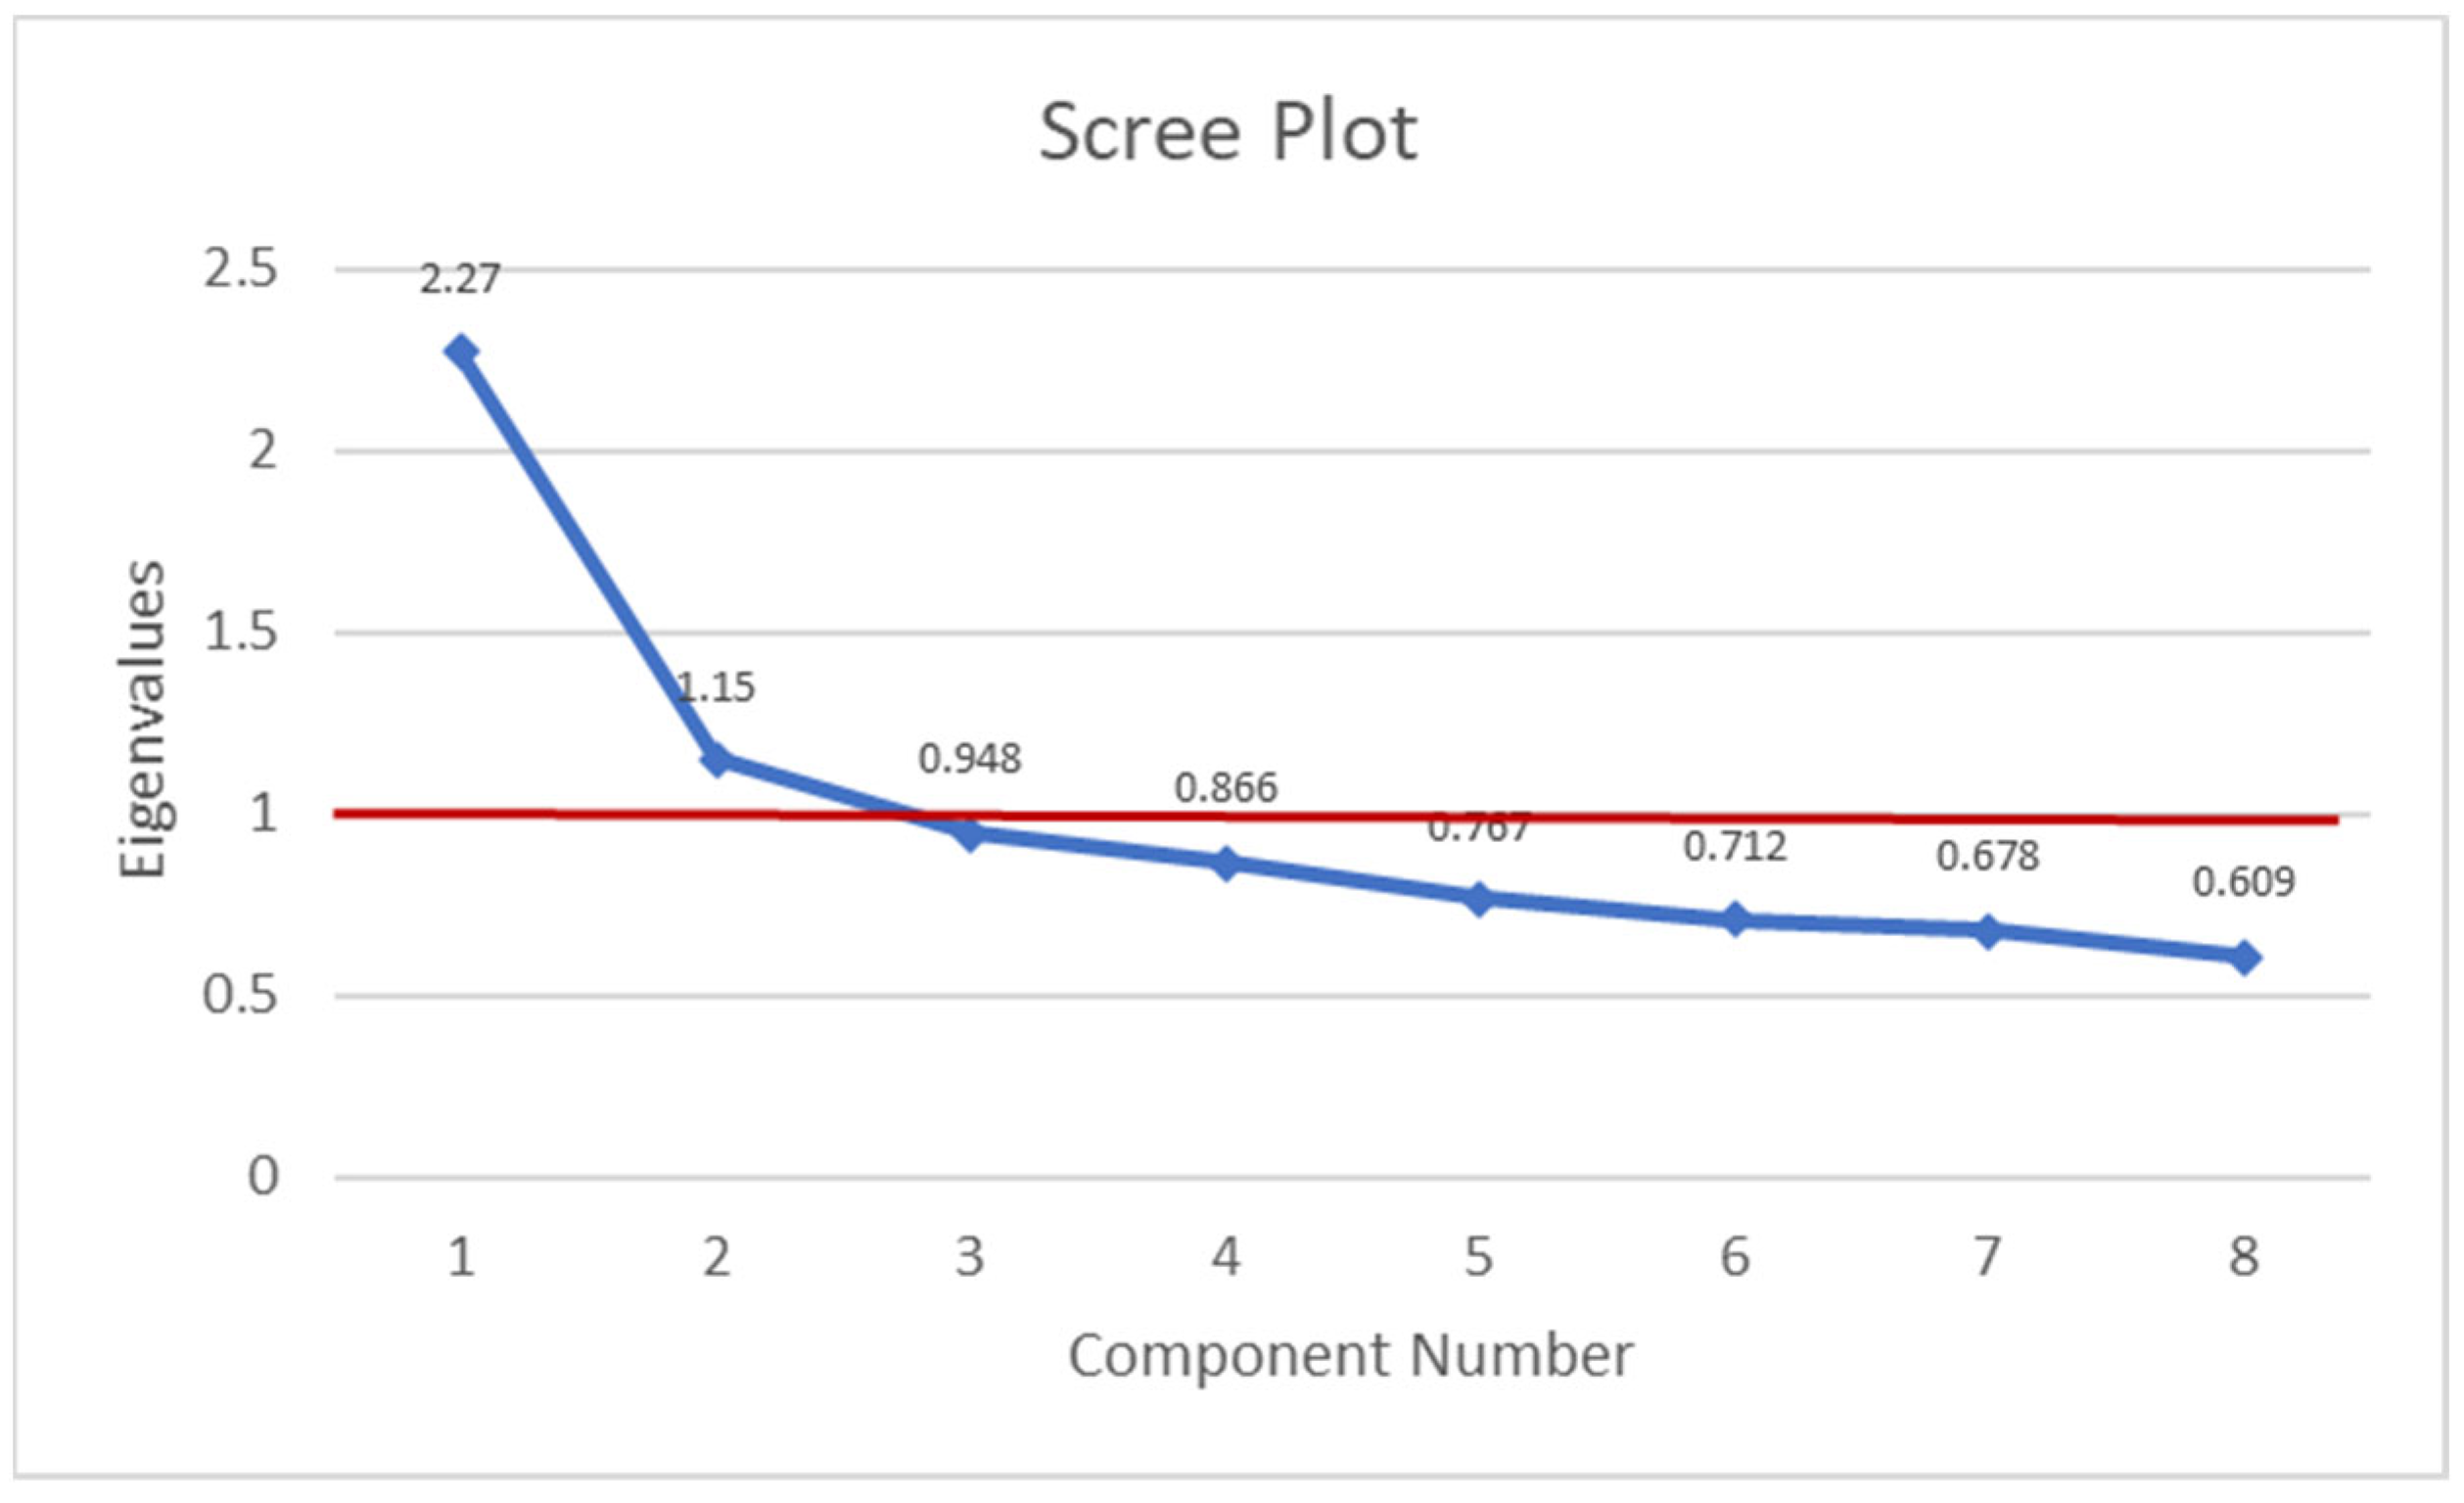
There are eight questions asked in the questionnaire survey about how they feel about doing activities related to being physically active and socially active. The scree plot method is used to determine the number of factors for being mentally active. The y-axis shows the total eigenvalue and the x-axis number of components (mentally active). The scree plot orders the eigenvalues from largest to smallest. in scree plot (Figure 6). As shown have extracted two components more than 1. The eigenvalues change less markedly when 8 factors are used. Therefore, 8 factors appear to explain most of the variability in the data. The percentage of variability explained by factor 1 is 2.270 or 22.7 %. The percentage of variability explained by Factor 2 is 1.150 or 11.5%. The scree plot shows that the first two factors account for most of the total variability in data. The remaining factors account for a very small proportion of the variability and are likely unimportant.
Figure 6. Scree Plot to determine the number of factors for mentally active.
Preprints 75858 g006
This can be shown in Table (7) in Component 1 they feel anxiety every four weeks and depression when they are not active at the first point in open-ended questionnaires they mention social activity and during exams, they have such emotions. The other two factors they feel good when they are physically active and comfortable by walking. The second component factors are they spend energy on daily activities such as assignments and exams with socially active, and the two last one is their emotion about their health and motivation. This indicates that students give time more to assignments and exams than social activity and the last one even though they know that physical activities are good for their health but they give less importance to them.
3.
Socially active extraction
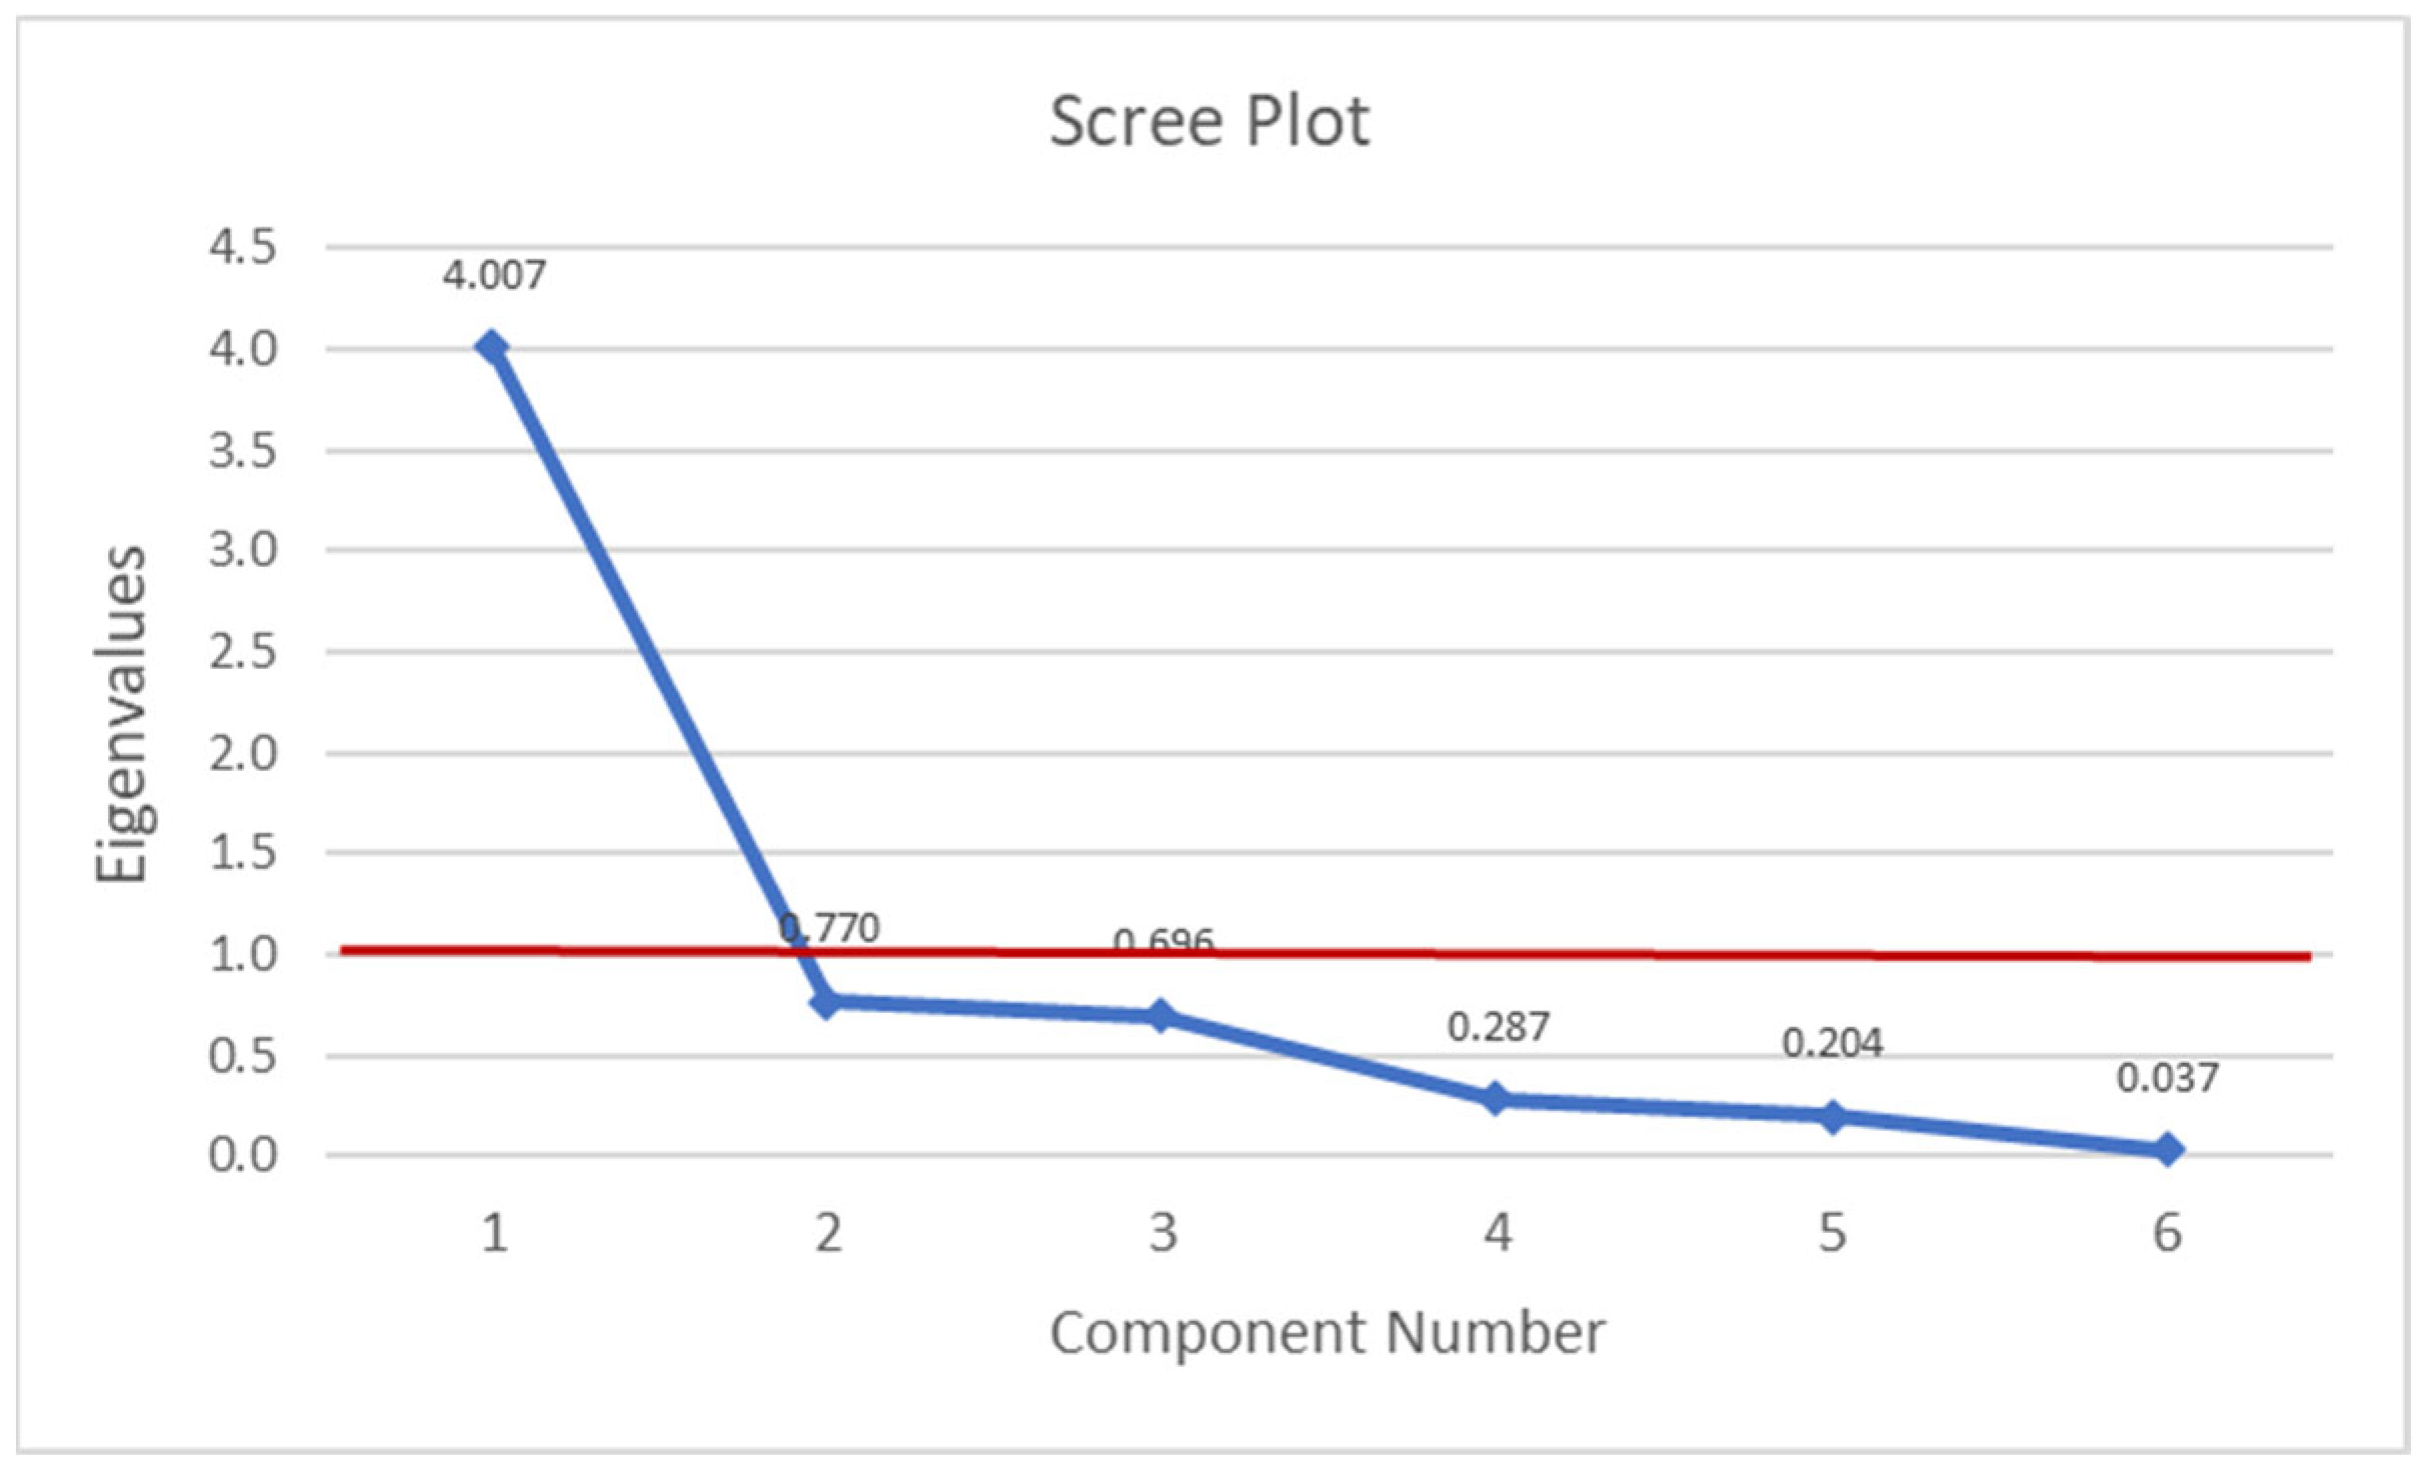
There are six questions have been asked in the questionnaire survey public space on the frequency and duration they spend on social activity with friends with the importance level of this activity to them. The scree plot method is used to determine the number of factors for being socially active. The y-axis shows the total eigenvalue and the x-axis number of components (socially active). The scree plot orders the eigenvalues from largest to smallest. in scree plot (Figure 7). As shown have extracted one factor which is more than 1.
Figure 7. Scree Plot to determine the number of factors for Social activity.
Preprints 75858 g007
The eigenvalues change less markedly when 6 factors are used. Therefore, just one factor appears to explain most of the variability in the data. The percentage of variability explained by factor 1 is 4.007 or 40.07 %. There is we have only one factor then that suggests all of the items fit onto a single theoretical construct. As an operational definition, that means they’re one dimension/scale. The remaining factors account for a very small proportion of the variability and are likely unimportant. This can be shown in Table 7 as only one factor and can not be rotated this factor include all social activities leisure time (cafeteria, restaurant), public spaces (green area, park, benches), theatres, event halls, shopping market- kiosks, and libraries. If we compared it to the open-ended questionnaire survey, most of the students interested to enjoy their free time at the restaurant, café and public spaces such as gardens, parks resting on benches, then shopping-market- kiosks, after that library and the last place are event halls and theatres. In the end, we can say that social activity could be counted under the theoretical concept of environmental psychology.

4. Discussion

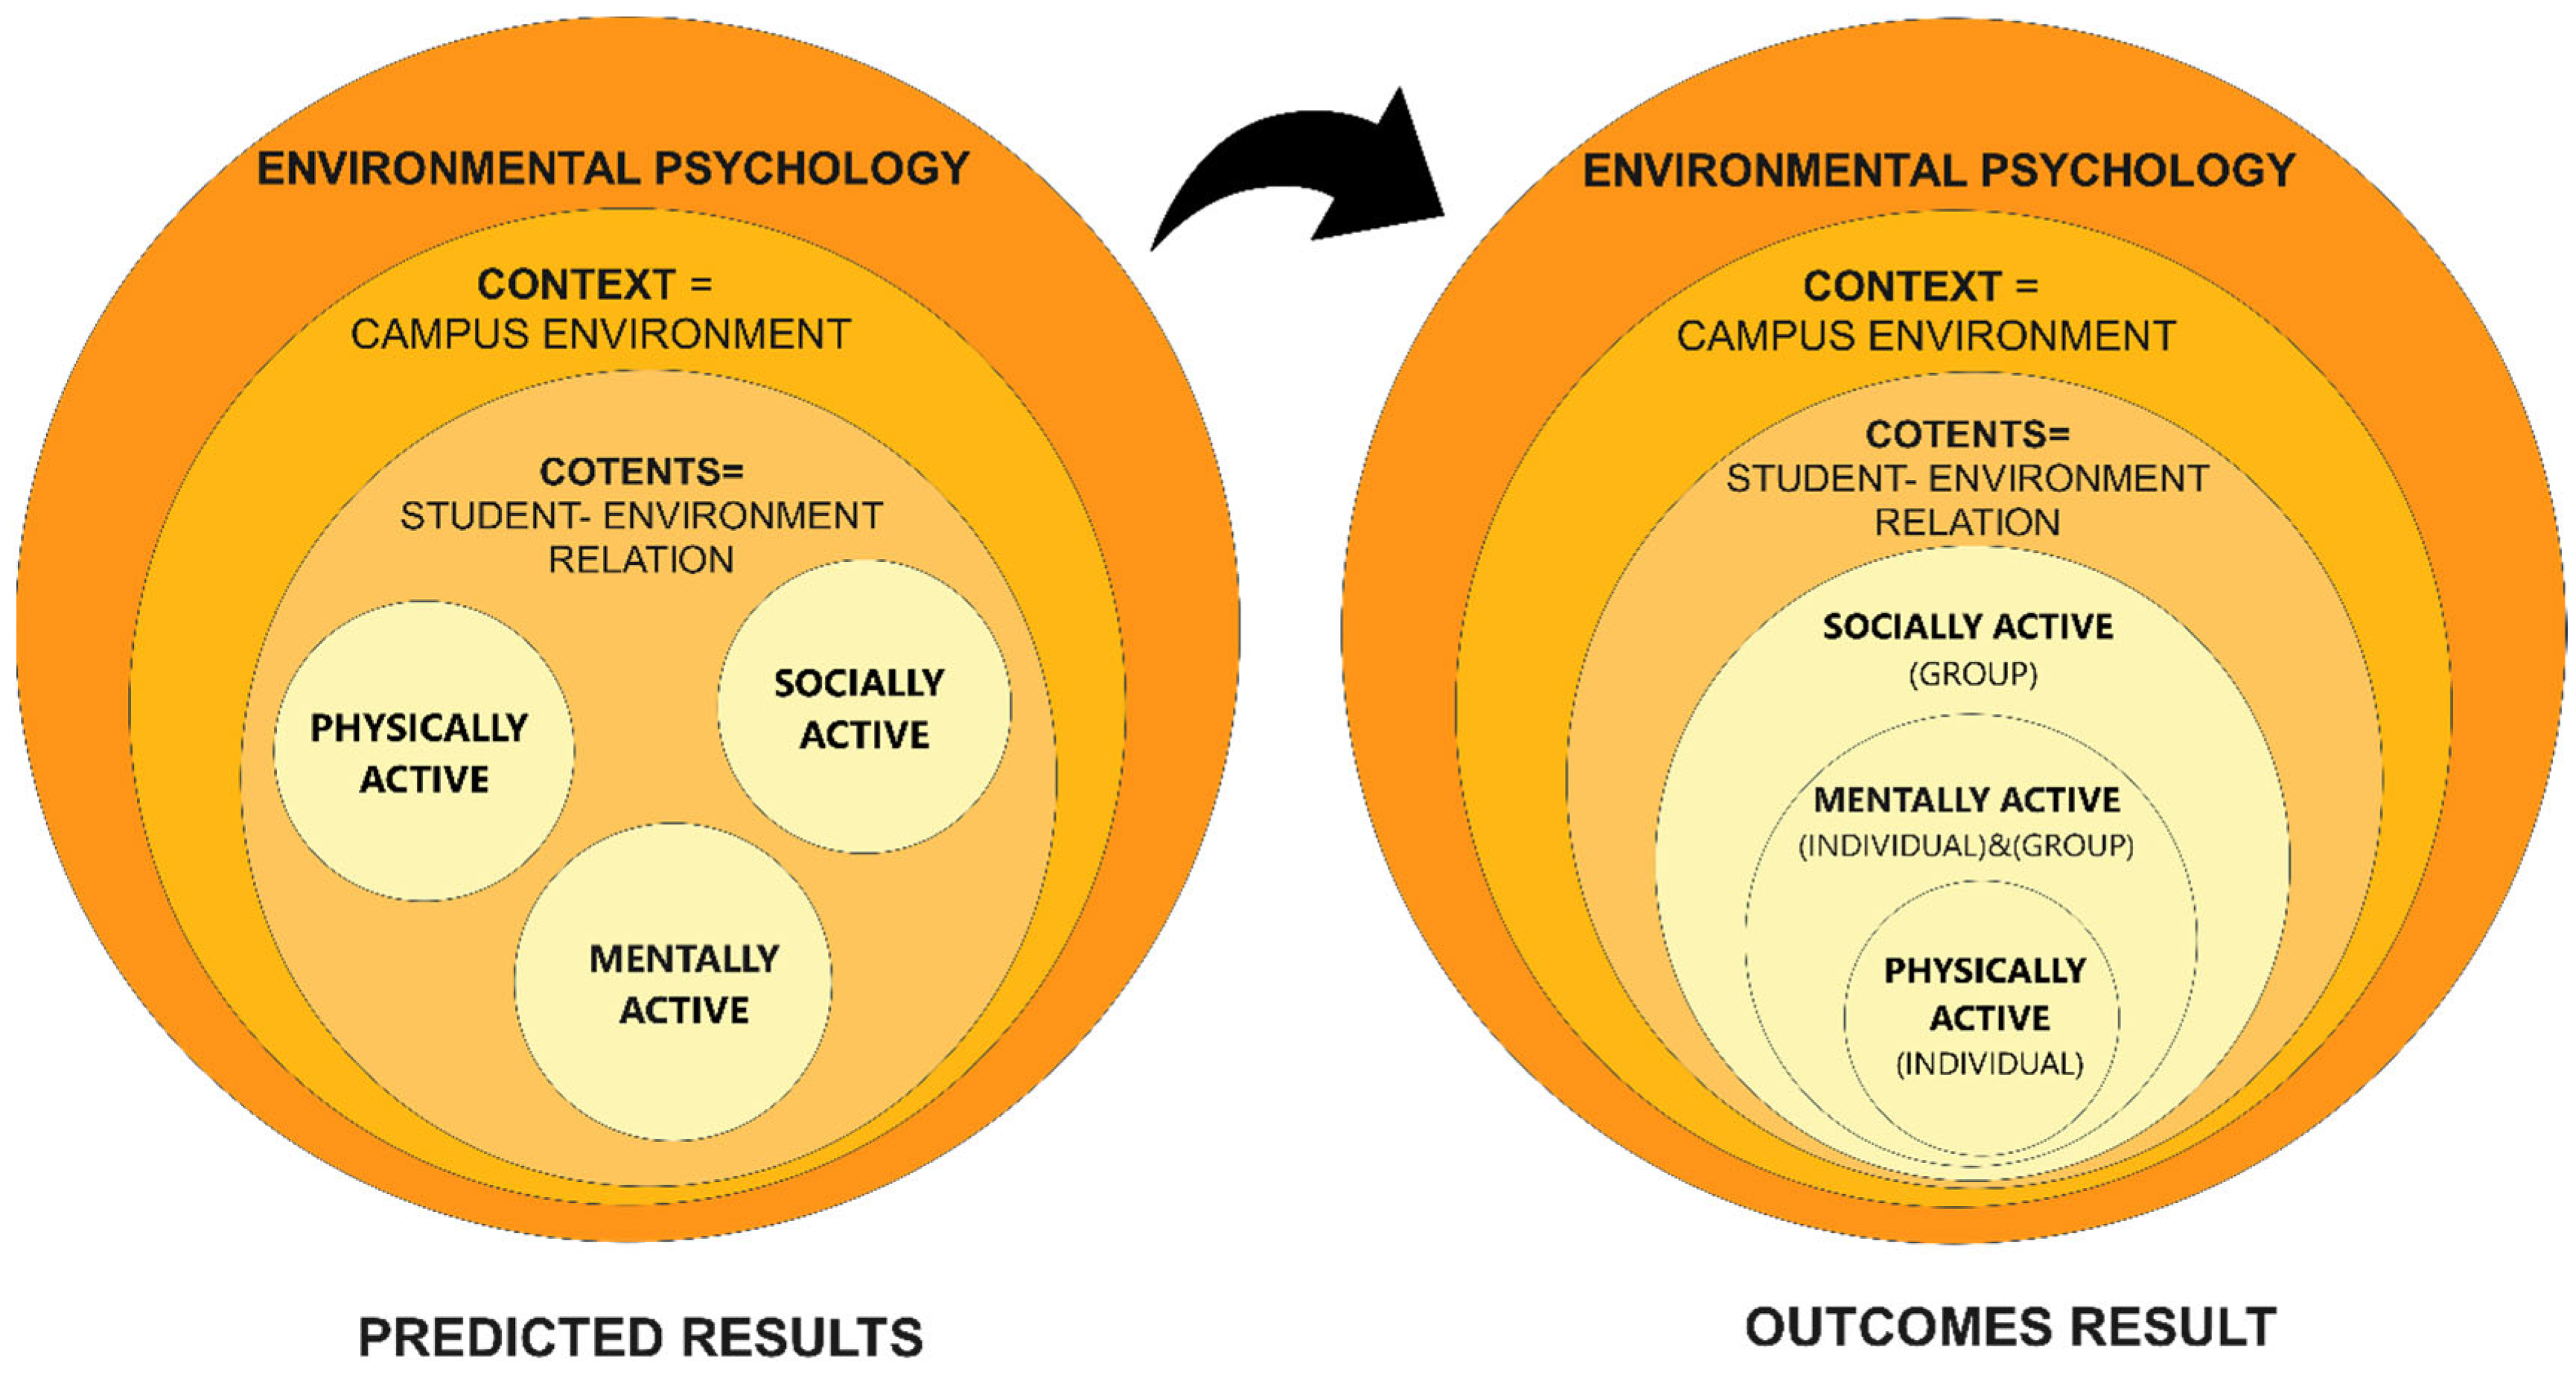
Environmental psychology is the core of today’s research. In this study, the context is the university campus environment and the content is student environment relation. The question is that “Is the new approach to active design could improve the environmental psychology of the campus environment to achieve a healthy campus-built environment?”This study designed a model based on active design parameters to answer this question.
The main notion for active design is to create active behaviour among society to achieve a healthy community could be matched with healthy behaviour theory (Azeez S. et al 2023) this means active behaviour (individual) but environmental psychology emphasises social relations with the environment means the group of people with the environment. The result showed that students are interested to be active socially even though they know physical activity has a positive effect on their health and mental health and show positive agreement with the mentally active statement. In the open-ended question, they showed just the place where group assemblies are active on the university campus for 1.5 hours have a break, they are socially active. The demographic survey showed that only 10 per cent of students have a chronic disease (thyroid, arthritis, chronic kidney disease, liver disease, diabetes and depression), in addition mostly have stress and anxiety about daily university activity and social activity and communication. The contribution of the research (Figure 8) is environmental psychology emphasises group mental health by being socially active and the theory for environmental psychology is (Phenomenology, ontology, arousal, stimulus load, behaviour constraint t, adaptation level, environmental stress and ecological theory)( Veitch, Russell 1995 ) but active design creates active behaviour in the community starting from an individual with healthy behaviour theory could be solved. Thus could be said environmental psychology is a part of the active design approach which could be used to increase social activity inside the campus and motivate students towards physical activity in this way improving the health and mental health of students.
Figure 8. Environmental psychology relation with active design approach result.
Preprints 75858 g008

5. Conclusions

This study revealed the relationship between environmental psychology and an active design approach through three categories of physical activities. The ten campus environments used to show student relationship environment to demonstrate active design approach can improve or not campus environmental psychology as follows:
  • It concluded that only 19.7 % do physical activity at university campus .this indicate that students are not physically active at university campus the reason behind it they do not have time to do so. They are more physically active out on campus. Another reason all physical activities are not provided for students from university campuses. And 74.6% are physically active outside campus the reason to shape their body become attractive more than mentally be active only 5.7% of students do sport both inside and outside of campus this rate is for males who use the football stadium at the university campus.
  • The new trends of active design emphasise creating active behaviour in the built environment starting from the individual, therefore society becomes active and would have mental well-being individually. But this study discovered that students are more interested in socially being active and they spend their break time with their friends at social locations on campus emotionally they are more satisfied than physical activity used to shape their bodies. This indicates that by creating new social activities inside the campus-built environment rapidly and positively students achieve mental well-being. Thus The environmental psychology of the campus could be considered as social-well being of users either students or staff the context is the environment of students that includes activity that affects the social well-being of students. In open-ended questions the student claimed to have more time to join social activities therefore university should think about it how they can make them socially active during university time which has a direct effect on the mental health of the university.
  • The theory to achieve healthy behaviour for an active approach is different from the theory used for environmental psychology such as phenomenology, ontology..etc. A future study should be done to accumulate all environmental psychology theories to create a foundation for inventing new social activities for university campuses.
  • Several researchers introduced their work in environmental psychology which differs from healthy behaviour theory in that something effect indirectly on human psychology and behaviour through experiencing in context but in healthy behaviour theory the activity could be created in a built environment and encourage them to do so.
  • The context and content of environmental simulation are essential components of EP social psychology. Therefore, the environment is now the basis of context in EP, but other disciplines regard the social context as context when describing people-environment interactions.
  • Future research should incorporate context-based theory since it will enhance EP’s fundamental concepts. EP should be just as willing to consider context as core which is after all the way offer subjects treat psychology (as one of their contexts). Thus EP is still a subject with a variety of physical world paradigms physical world. In addition, where do the boundaries of EPS content and context lie? What content and context? Local and global real world in which people live that EP and other areas of psychology should extend their focus of attention from individual psychological processes to their social, physical and temporal context.
  • Another future research that could focus on EP could be set through perception & cognition the theory adopted for it is phenomenology ontology healthy behaviour, healthy in context increase social-wellbeing for EP.

Author Contributions

S.A.A.: Collected data, prepared, analysed and, conceptualization the model, and wrote original draft preparation. F.A.M.: initiated and managed the project’s revision, editing, and manuscript completion. R.M.: supervised the methodology and statistical analyses including statistical description, ANOVA and factor analyses. All authors have read and agreed to the published version of the manuscript.

Funding

This research received no external funding.

Acknowledgments

We gratefully appreciate the efforts of everyone who made this research project successful.

Conflicts of Interest

The authors have no conflict of interest to declare.

References

  1. "Fit-City 2: Promoting Physical Activity through Design"(PDF). American Institute of Architects New York Chapter. 2007. pp. 10–11. Archived from the original on 13 December 2016. https://web.archive.org/web/20161213211217/http://aiany.aiany.org/corecode/uploads/document/uploaded_pdfs/corecode_aianyaia/FitCity2_Publication_Final_163.pdf.
  2. Ahmed, R.M., Abdullah, M.O. and Altun, Y., 2022. Comparison Between Factor Analysis and Cluster Analysis to Determine the Most Important Affecting Factors for Students’ Admission and Their Interests in The Specializations: A Sample of Salahaddin University-Erbil. Zanco Journal of Pure and Applied Sciences, 34(s6), pp.12-23. DOI: https://doi.org/10.21271/ZJPAS.34.s6.3. [CrossRef]
  3. American College Health Association. (2023). The healthy campus framework. Silver Spring, MD: American College Health Association. https://www.acha.org/HealthyCampus/HealthyCampus/Framework.aspx accessed 4 May of 2023.
  4. American College Health Association. 2015a. Healthy Campus 2020: About. Retrieved December 15, 2015, from the World Wide Web: www.acha.org/HealthyCampus/About/HealthyCampus/About. aspx?hkey=2c0c96b6-c330-47e1-87fe-747ec8397e85.
  5. Azeez, S.A.; Mustafa, F.A.; Ahmed, R.M. A Meta-Analysis of Evidence Synthesis for a Healthy Campus Built Environment by Adopting Active Design Approaches to Promote Physical Activity. Buildings 2023, 13, 1224. https://doi.org/10.3390/buildings13051224. [CrossRef]
  6. Bloomberg, M. R., Burney, D., Farley, T., Sadik-Khan, J., & Burden, A. (2010). Active design guidelines: promoting physical activity and health in design. The City of New York.: Report from City Council. https://www1.nyc.gov/assets/doh/downloads/pdf/environmental/active-design-guidelines.pdf.
  7. T., Yan, Z. and Heene, M., 2020. Applying the Rasch model: Fundamental measurement in the human sciences. Routledge.
  8. Bustler FitCity 10: Promoting Physical Activity through Design 2015. Available online: https://bustler.net/events/latest/6401/fitcity-10-promoting-physical-activity-through-design (accessed on 17 March 2023).
  9. Castro, O., Bennie, J., Vergeer, I. et al. How Sedentary Are University Students? A Systematic Review and Meta-Analysis. Prev Sci 21, 332–343 (2020). https://doi.org/10.1007/s11121-020-01093-8. [CrossRef]
  10. Chapman, M.P. (2006) American places: In search of the twenty-first-century campus. Westport: Greenwood.
  11. Charehjoo, F., Etesam, I. and Rasoulpour, H., 2018. The Role of environmental psychology in Architecture and urban design. Scientific Journal “Academia Architecture and Construction, 1(2), pp.11-15.
  12. Chen, W., M. Zaid, S., & Nazarali, N. (2016). Environmental psychology: the urban built environment impact on human mental health. Planning Malaysia, 14(5). https://doi.org/10.21837/pm.v14i5.190. [CrossRef]
  13. Coulson, J., Roberts, P., and Taylor, I. (2010) University planning and architecture: The search for perfection. Westport: Routledge.
  14. Coulson, J., Roberts, P., and Taylor, I. (2014) University trends: Contemporary campus design. Abingdon: Routledge.
  15. Craik, K.H., 1973. Environmental psychology. Annual review of psychology, 24(1), pp.403-422. https://doi.org/10.1146/annurev.ps.24.020173.002155. [CrossRef]
  16. Danaei, G.; Ding, E.L.; Mozaffarian, D.; Taylor, B.; Rehm, J.; Murray, C.J.L.; Ezzati, M. The Preventable Causes of Death in the United States: Comparative Risk Assessment of Dietary, Life. style, and Metabolic Risk Factors. PLoS Med. 2009, 6, e1000058.
  17. De Groot, J.I., 2019. Environmental psychology: An introduction.
  18. DeClercq, Caitlin. "Toward the healthy campus: methods for evidence-based planning and design." Planning for Higher Education, vol. 44, no. 3, Apr.-June 2016, pp. 86+. Gale Academic OneFile, link.gale.com/apps/doc/A471145041/AONE?u=anon~d3d2aea2&sid=googleScholar&xid=ebb6fe81. Accessed 24 May 2023.
  19. DeJonge, M.L., Jain, S., Faulkner, G.E. and Sabiston, C.M., 2021. On campus physical activity programming for post-secondary student mental health: examining effectiveness and acceptability. Mental Health and Physical Activity, 20, p.100391. https://doi.org/10.1016/j.mhpa.2021.100391. [CrossRef]
  20. Dober, R. P. 1996. Campus Planning. Ann Arbor, MI: Society for College and University Planning.
  21. Feng, H., Yang, F. Does environmental psychology matter: role of green finance and government spending for sustainable development. Environ Sci Pollut Res 30, 39946–39960 (2023). https://doi.org/10.1007/s11356-022-24969-4. [CrossRef]
  22. Ferraro, K. and Carr, D. eds., 2021. Handbook of ageing and the social sciences. Academic Press.
  23. Gebel, K.; King, L.; Bauman, A.; Vita, P.; Gill, T.; Rigby, A.; Capon, A. Creating Healthy Environments—A Review of Links between the Physical Environment, Physical Activity and Obesity; The University of Sydney: Sydney, Australia, 2005.
  24. Gifford, R. (2014). Environmental psychology matters. Annual Review of Psychology, 65, 541-579. https://doi.org/10.1146/annurev-psych-010213-115048. [CrossRef]
  25. Gruenewald, P.J., Remer, L.G., LaScala, E.A., 2014. Testing a social-ecological model of alcohol use: the California 50-city study. Addiction 109 (5), 736–745. https://doi.org/10.1111/add.12438. [CrossRef]
  26. Hajrasouliha, A., 2017. Campus score: Measuring university campus qualities. Landscape and Urban Planning, 158, pp.166-176. https://doi.org/10.1016/j.landurbplan.2016.10.007Get rights and content. [CrossRef]
  27. Hajrasouliha, A.H. Master-planning the American campus: goals, actions, and design strategies. Urban Des Int 22, 363–381 (2017). https://doi.org/10.1057/s41289-017-0044-x. [CrossRef]
  28. Hamidi, S., Sabouri, S., & Ewing, R. (2020). Does density aggravate the COVID-19 pandemic? Early findings and lessons for planners. Journal of the American Planning Association, 86(4), 495-509. https://doi.org/10.1080/01944363.2020.1777891. [CrossRef]
  29. Jonathan d. Sime, what is environmental psychology? Texts, content and context, Journal of Environmental Psychology, Volume 19, Issue 2,1999, Pages 191-206, ISSN 0272-4944,https://doi.org/10.1006/jevp.1999.0137.(https://www.sciencedirect.com/science/article/pii/S0272494499901378). [CrossRef]
  30. Kenney, D.R., Dumont, R., and Kenney, G.S. (2005) Mission and place: Strengthening learning and community through campus design. Westport: Greenwood.
  31. LaBelle, B. Positive Outcomes of a Social-Emotional Learning Program to Promote Student Resiliency and Address Mental Health. Contemp School Psychol 27, 1–7 (2023). https://doi.org/10.1007/s40688-019-00263-y. [CrossRef]
  32. Lacasse, M.; Nienaber, S. Get Active: Implement Active Design in Your Neighborhoods and Open Spaces; The American Society of Landscape Architects: Washington, DC, USA, 2015. [Google Scholar].
  33. Lam, T.M.; Vaartjes, I.; Grobbee, D.E.; Karssenberg, D.; Lakerveld, J. Associations between the Built Environment and Obesity: An Umbrella Review. Int. J. Health Geogr. 2021, 20, 7.
  34. Lee, K. K. (2012). Developing and implementing the active design guidelines in New York City. Health & Place, 18(1), 5-7. https://doi.org/10.1016/j.healthplace.2011.09.009. [CrossRef]
  35. Michael R. B., David B., Thomas F., Janette S.& Amanda B. (2010) .Active Design Guidelines: Promoting Physical Activity and Health Design. New York City. https://www1.nyc.gov/assets/doh/downloads/pdf/environmental/active-design-guidelines.pdf.
  36. Mir IA, Ng SK, Mohd Jamali MNZ, Jabbar MA, Humayra S (2023) Determinants and predictors of mental health during and after COVID-19 lockdown among university students in Malaysia. PLoS ONE 18(1): e0280562. https://doi.org/10.1371/journal.pone.0280562. [CrossRef]
  37. Mirilia Bonnes and Gianfranco Secchiaroli.Environmental Psychology: A Psycho-social Introduction. London: Sage Publications, 1995. ISBN 0 8039 7905 3. ISBN 0 8039 7906 1 (Translated from Italian, Psicologia Ambientale, 1992, by Claire Montagna).
  38. Mitchell, W.J., and Vest, C.M. (2007) Imagining MIT: Designing a campus for the twenty-first century. Cambridge, MA: MIT Press.
  39. Nesma Sherif Samir Elrafie, Ghada Farouk Hassan, Mohamed A. El Fayoumi, Ayat Ismail, Investigating the perceived psychological stress in relevance to urban spaces’ different perceived personalities, Ain Shams Engineering Journal, Volume 14, Issue 6,2023,102116, ISSN 2090-4479, https://doi.org/10.1016/j.asej.2023.102116.(https://www.sciencedirect.com/science/article/pii/S2090447923000059). [CrossRef]
  40. Nurliyana Jekria, Salina Daud, Environmental Concern and Recycling Behaviour, Procedia Economics and Finance,Volume 35,2016, Pages 667-673, ISSN 2212-5671,https://doi.org/10.1016/S2212-5671(16)00082-4.(https://www.sciencedirect.com/science/article/pii/S2212567116000824). [CrossRef]
  41. Osmond, H. (1957). Function as the basis of psychiatric ward design. Psychiatric Services, 8(4), 23-30. https://doi.org/10.1176/ps.8.4.23. [CrossRef]
  42. Paul A. Bell, Thomas C. Greene, Je¡rey D. Fisher and Andrew Baum,1996.Environmental Psychology (4th ed). By. Fort Worth: Harcourt Brace. ISBN 0 15 501496-X, , 9780155014961Length 645 pages.
  43. Pelgrims, I., Devleesschauwer, B., Guyot, M. et al. Association between urban environment and mental health in Brussels, Belgium. BMC Public Health 21, 635 (2021). https://doi.org/10.1186/s12889-021-10557-7. [CrossRef]
  44. Pinter-Wollman N, Jelić A, Wells NM. The impact of the built environment on health behaviours and disease transmission in social systems. Philos Trans R Soc Lond B Biol Sci. 2018 Aug 19;373(1753):20170245. doi 10.1098/rstb.2017.0245. PMID: 29967306; PMCID: PMC6030577. [CrossRef]
  45. Pronello, C.; Gaborieau, J.-B. Engaging in Pro-Environment Travel Behaviour Research from a Psycho-Social Perspective: A Review of Behavioural Variables and Theories. Sustainability 2018, 10, 2412. https://doi.org/10.3390/su10072412. [CrossRef]
  46. Public Health England (2015) Active Design: Planning for health and wellbeing through sport and physical activityActive Design checklist. Sport England. https://sportengland-production-files.s3.eu-west-2.amazonaws.com/s3fs-public/active-design-checklist-oct-2015.pdf?VersionId=az73PYXRmKYaXMfLu8BCxgXSByeiAQ1.
  47. Robbins, J.L. A New Design Movement that Can Help Us Beat Obesity. Available online: https://www.fastcompany.com/1663272/a-new-design-movement-that-can-help-us-beat-obesity (accessed on 16 March 2023).
  48. Robert Bechtel; Environment & Behavior: An Introduction. Thousand Oaks, CA: Sage Publications, 1997. ISBN 0 8039 5795 5.
  49. Robert Gi¡ord. Boston: Allyn and Bacon (1997).Environmental Psychology: Principles and Practice (2nd ed). ISBN 0 205 18941 5.
  50. Rodríguez-Romo, G.; Acebes-Sánchez, J.; García-Merino, S.; Garrido-Muñoz, M.; Blanco-García, C.; Diez-Vega, I. Physical Activity and Mental Health in Undergraduate Students. Int. J. Environ. Res. Public Health 2023, 20, 195. https://doi.org/10.3390/ijerph20010195. [CrossRef]
  51. Russell Veitch and Daniel Arkkelin (1995).Environmental Psychology: An Interdisciplinary Perspective. Upper Saddle River, NJ: Prentice Hall, Inc. ISBN 0 13 739954 5.
  52. Sallis, J.F.; Linton, L.S.; Kraft, M.K. The First Active Living Research Conference: Growth of a Transdisciplinary Field. Am. J. Prev. Med. 2005, 28 (Suppl. 2), 93–95.
  53. Salonee Jambusaria, Sara Berry, Shivam Bhadra, Shrutika Sanghvi (2020). Research paper on physical activity and fitness patterns among university students in Mumbai. International Journal of Advance Research, Ideas and Innovations in Technology, 6(3) www.IJARIIT.com.
  54. Shahadan, S.Z., Bolhan, N.S. and Ismail, M.F.M., The Association between Physical Activity Status and Mental Wellbeing among Overweight and Obese Female University Students. Malaysian Journal of Medicine and Health Sciences (2022) 18(19) 80-86. doi:10.47836/mjmhs.18.s19.13. [CrossRef]
  55. Silver, L.; Bell, F. FAIA Fit-City 2: Promoting Physical Activity through Design. Available online: https://www.aiany.org/wp-content/uploads/2017/10/FitCity2_Publication_Final_163.pdf (accessed on 17 March 2023).
  56. Sport England. Active Design Checklist; Sport England: Loughborough, UK, 2015.
  57. Sport England. Active Design The Role of Master Planning|Phase 1; Sport England: Loughborough, UK, 2005; p. 68.
  58. Sport England. Jennie Price Active Design: Planning for Health and Wellbeing through Sport and Physical Activity. Public Health Engl. 2015, 2–64. Available online: https://www.rossendale.gov.uk/downloads/file/15002/active_design_planning_for_health_and_wellbeing_through_sport_and_physical_activity_sport_england_2015 (accessed on 25 November 2022).
  59. Steinmetz, C.A. (2009) Universities as a place: An intergenerational perspective on the experience of Australian university students (Doctoral dissertation, University of New South Wales Sydney, Australia 2009).
  60. Stevens, N. J., Tavares, S. G., & Salmon, P. M. (2021). The adaptive capacity of public space under COVID-19: Exploring urban design interventions through a sociotechnical systems approach. Human Factors and Ergonomics in Manufacturing & Service Industries, 31(4), 333-348. https://doi.org/10.1002/hfm.20906. [CrossRef]
  61. Strange, C.C., and Banning, J.H. (2001) Education by design: Creating campus learning environments that work. The Jossey-Bass higher and adult education series. San Francisco, CA: Jossey-Bass.
  62. Tam, K.P. and Milfont, T.L., 2020. Towards cross-cultural environmental psychology: A state-of-the-art review and recommendations. Journal of Environmental Psychology, 71, p.101474. https://doi.org/10.1016/j.jenvp.2020.101474. [CrossRef]
  63. Tony Cassidy (1997).Environmental Psychology: Behaviour and Experience in Context. Hove, East Sussex, U.K.: Psychology Press (Taylor & Francis).ISBN 0 86377.
  64. Tootell, R. B., Zapetis, S. L., Babadi, B., Nasiriavanaki, Z., Hughes, D. E., Mueser, K., … & Holt, D. J. (2021). Psychological and physiological evidence for an initial ‘Rough Sketch’calculation of personal space. Scientific Reports, 11(1), 1-15. https://doi.org/ 10.1038/s41598-021-99578-1. [CrossRef]
  65. Veitch, Russell. Environmental psychology: an interdisciplinary perspective;1995; Environmental psychologyPublisher;Englewood Cliffs, N.J. : Prentice Hall Collection; urn:OCLC:record:1244737389urn:lcp:environmentalpsy0000veit:lcpdf:06fbd702-b8f6-49b3-8681-46ba1f6b73c8urn:lcp:environmentalpsy0000veit:epub:174436d4-37db-4028-8bc8-52d8272db1fd.
  66. Von Sommoggy J, Rueter J, Curbach J, Helten J, Tittlbach S and Loss J (2020) How Does the Campus Environment Influence Everyday Physical Activity? A Photovoice Study Among Students of Two German Universities. Front. Public Health 8:561175. doi ;10.3389/.2020.561175. [CrossRef]
  67. Wong, M.-Y.C.; Fung, H.-W.; Yuan, G.F. The Association between Physical Activity, Self-Compassion, and Mental Well-Being after COVID-19: In the Exercise and Self-Esteem Model Revised with Self-Compassion (EXSEM-SC) Perspective. Healthcare 2023, 11, 233. https://doi.org/10.3390/healthcare11020233. [CrossRef]
  68. Wu, Y.; Van Gerven, P.W.M.; de Groot, R.H.M.; O. Eijnde, B.; Seghers, J.; Winkens, B.; Savelberg, H.H.C.M. The Association between Academic Schedule and Physical Activity Behaviors in University Students. Int. J. Environ. Res. Public Health 2023, 20, 1572. https://doi.org/10.3390/ijerph20021572. [CrossRef]
  69. Xu, S., Li, W. S., & Cheng, B. (2021). Study on Campus Planning from the Perspective of Environmental Behavior. Open Journal of Social Sciences, 9, 326-333. https://doi.org/10.4236/jss.2021.98022. [CrossRef]
  70. Zhang, Z., He, Z., Qian, J., Qi, X., & Tong, J. (2023). Relationship Between Mindfulness and Physical Activity in College Students: The Mediating Effect of Eudaimonic Well-Being. Perceptual and Motor Skills, 130(2), 863–875. https://doi.org/10.1177/00315125221149833. [CrossRef]
Disclaimer/Publisher’s Note: The statements, opinions and data contained in all publications are solely those of the individual author(s) and contributor(s) and not of MDPI and/or the editor(s). MDPI and/or the editor(s) disclaim responsibility for any injury to people or property resulting from any ideas, methods, instructions or products referred to in the content.
Copyright: This open access article is published under a Creative Commons CC BY 4.0 license, which permit the free download, distribution, and reuse, provided that the author and preprint are cited in any reuse.
Prerpints.org logo

Preprints.org is a free preprint server supported by MDPI in Basel, Switzerland.

Subscribe

© 2024 MDPI (Basel, Switzerland) unless otherwise stated