3.1. Formability Analysis
Wetting refers to the process in which one fluid on the solid surface is replaced by another fluid. The schematic diagram is shown in
Figure 4. The basic wetting can be expressed by Young Dupre equation [
25]:
In the formula,
θ is the wetting angle;
σsg is the surface tension of solid;
σsl is the solid-liquid interfacial tension;
σlg is the liquid surface tension. The smaller the
θ, the better the wettability. The wettability depends on the surface tension of the solid, the solid-liquid interface tension and the liquid surface tension. For liquid, the lower the surface tension, the better the wettability [
26,
27].
The addition of rare earth elements in the surfacing alloy can also improve the fluidity and wettability of the metal-based composite powder, eliminate defects such as pores, and improve the macroscopic formability of the weld [
28,
29].
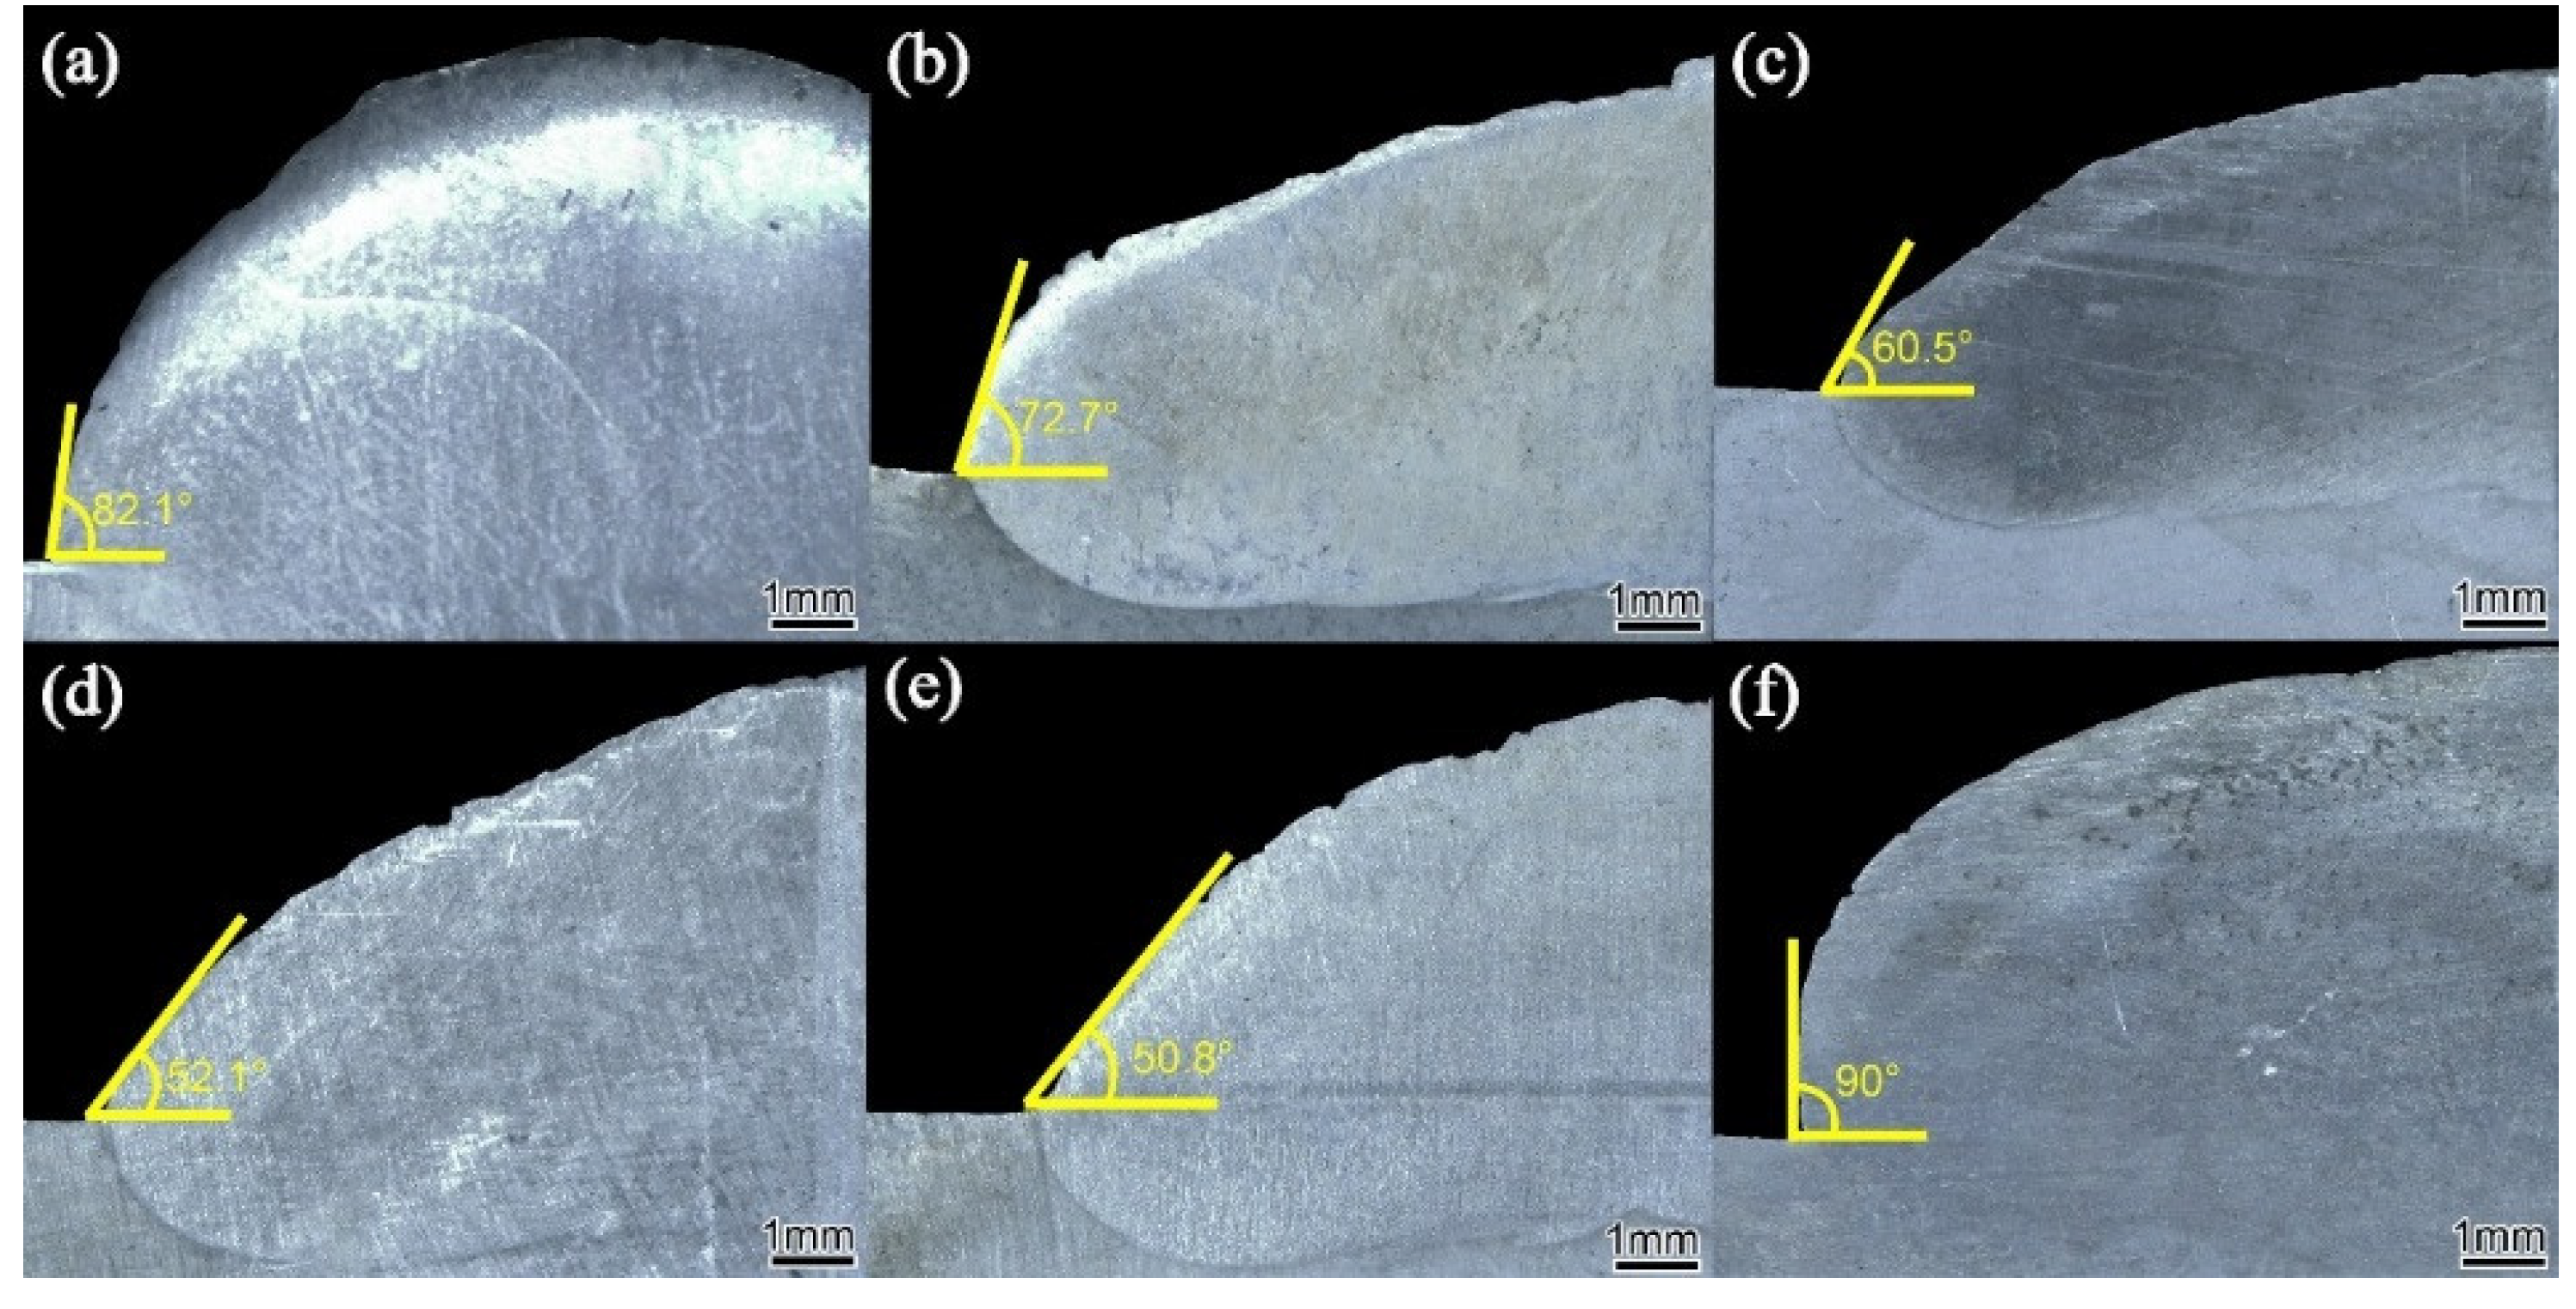
Figure 5 is the cross-section morphology of the surfacing alloy with different nano-Y
2O
3 content perpendicular to the welding direction.
With the increase of nano-Y2O3 addition from 0 wt. % to 0.456 wt. %, the wetting angle decreases to a minimum of 50.8 °, and the formability of the surfacing alloy is good. When the addition of nano-Y2O3 is 0.570 wt. %, the wetting angle of the surfacing alloy increases to 90 °, and the formability becomes worse. The reason is that nano-Y2O3 is added to the deposited metal as an oxide dispersion particle. With the increase of nano-Y2O3 content, the conductivity and thermal conductivity of the deposited metal decrease, thereby reducing the surface tension of the molten pool metal and reducing the wetting angle, which will lead to the improvement of the wettability between the molten pool metal and the base metal. Therefore, adding an appropriate amount of nano-Y2O3 can obtain a surfacing alloy with good forming quality.
3.2. Phase Analysis
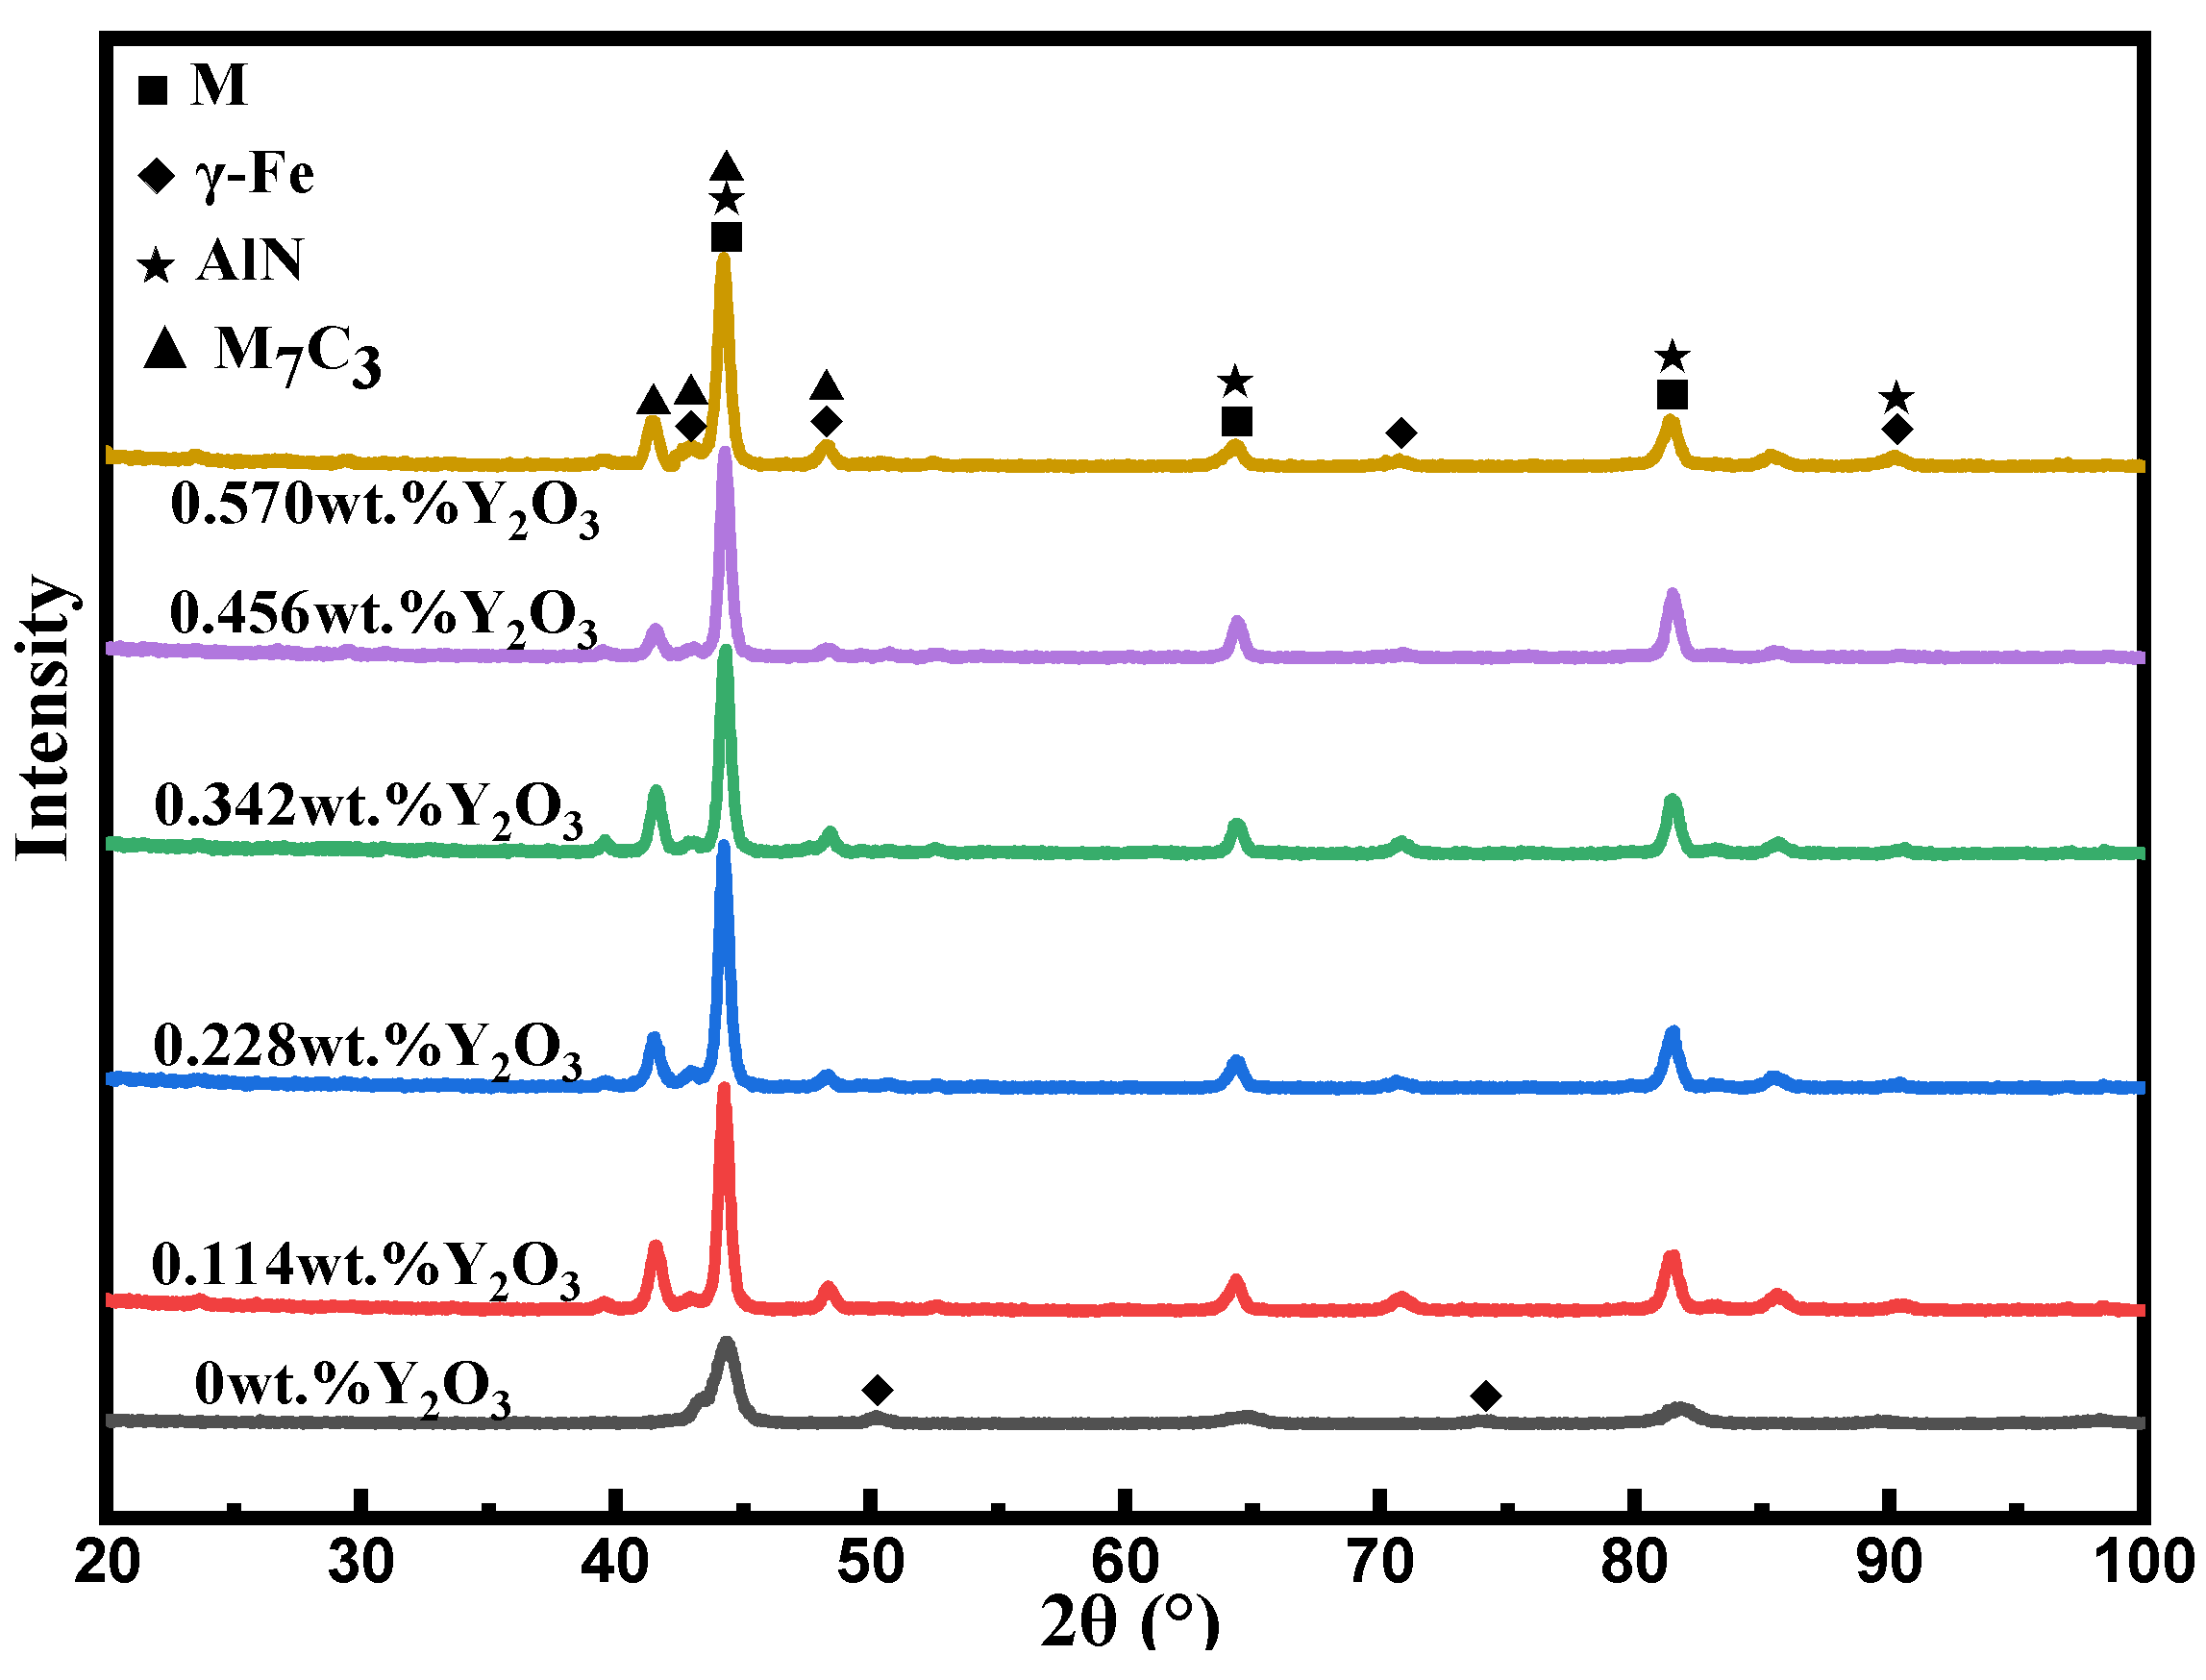
Figure 6 is the XRD diffraction pattern of the surfacing alloy with different contents of nano-Y
2O
3. It can be found that the matrix structure of the surfacing alloy is composed of retained austenite (γ-Fe) and martensite M, and the hard phase is mainly composed of M
7C
3 eutectic carbide and AlN. It can be found that the base microstructure of the surfacing alloy is composed of retained austenite (γ-Fe) and M, and the hard phase is mainly composed of M
7C
3 and AlN. The addition of nano-Y
2O
3 has little effect on the phase composition of the surfacing alloy. However, compared with the surfacing alloy without nano-Y
2O
3 additive, the diffraction peaks of γ-Fe in the surfacing alloy with nano-Y
2O
3 additive shifted from 49.9 ° and 73.84 ° to 48.26 ° and 70.76 °. According to Bragg 's law:
In the formula:
λ is the wavelength of X-ray,
d is the interplanar spacing, and
θ is the diffraction angle. In the experiment, the diffraction condition of X-ray diffraction experiment is constant. The decrease of diffraction angle leads to the increase of γ-Fe crystal plane spacing
d, resulting in lattice distortion. Because the atomic radius of Y atom is 2.27Å. With the larger atomic radius Y occupying the γ-Fe lattice position, the lattice distortion energy increases significantly, the solid solution strengthening effect increases, and the strength of the surfacing alloy matrix is improved [
30]. With the addition of nano-Y
2O
3 additive, M
7C
3 has an obvious diffraction peak at 41.5 °. This shows that the addition of nano-Y
2O
3 changes the growth orientation of M
7C
3. However, no diffraction peak of nano-Y
2O
3 was found in the X-ray diffraction pattern, which may be due to the fact that the content of rare earth elements added is lower than the limit value that XRD equipment can detect.
3.3. Microstructure Analysis
Figure 7 shows the metallographic structure of surfacing alloy with different nano-Y
2O
3 content. It can be found from the figure that the surfacing alloy is a typical hypoeutectic structure. The matrix is composed of γ-Fe and M, and the precipitated phase is composed of network M
7C
3 and black spotted AlN. When the addition amount of nano-Y
2O
3 is 0.456 wt. %, the microstructure of the surfacing alloy is the smallest, and the original coarse dendrites become equiaxed grains. The precipitation of M
7C
3 and AlN is the largest and evenly distributed. This is because the high melting point nano-Y
2O
3 is difficult to completely melt during the surfacing process. The incompletely melted Y
2O
3 in the surfacing alloy can easily become the core of heterogeneous nucleation, which can improve the nucleation rate and promote the formation of AlN. The large amount of dispersed AlN can effectively pin the grain boundary, hinder the grain boundary migration and refine the grain [
31,
32]. As the addition of nano-Y
2O
3 continues to increase to 0.570 wt. %, the structure becomes coarse dendrite crystals again. This is because the addition of excessive nano-Y
2O
3 leads to a decrease in the fluidity of the molten pool, slowing down the convection speed, slowing down the cooling of the molten pool, thereby increasing the time of dendrite growth [
33,
34]. This shows that adding an appropriate amount of nano-Y
2O
3 can play a role in grain refinement, and excessive nano-Y
2O
3 is not conducive to improving the microstructure of the surfacing alloy.
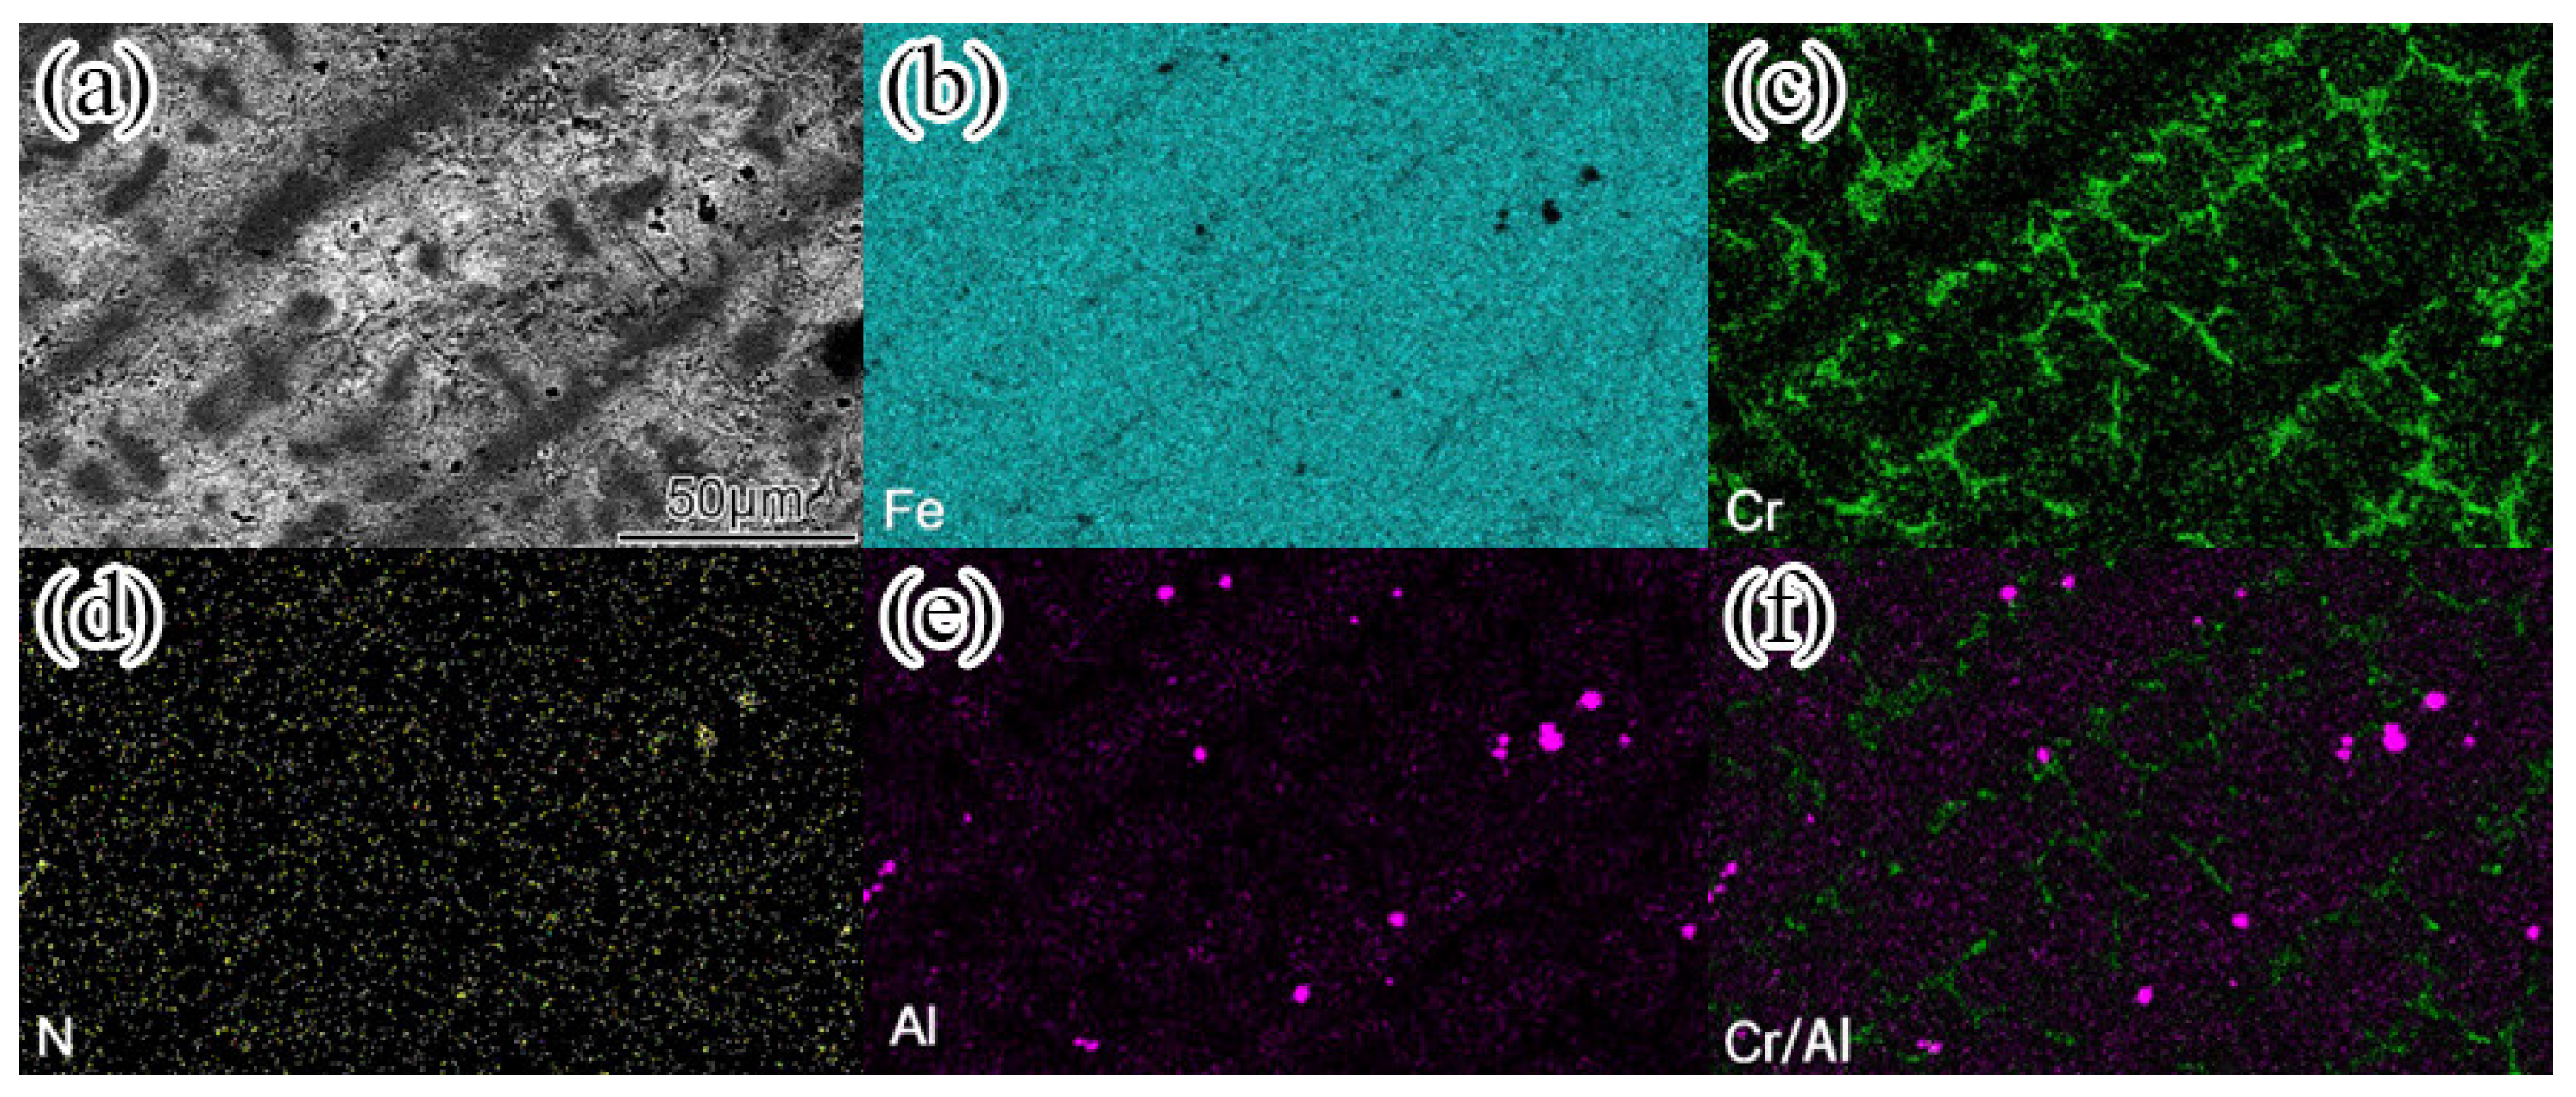
In order to intuitively understand the element composition of each phase in the surfacing alloy structure. The EDS element distribution of the surfacing alloy with 0.456wt. % nano-Y
2O
3 was analyzed. The analysis results are shown in
Figure 8.
Figure 8a is the microstructure morphology of the surfacing alloy.
Figure 8b–f are the element distribution maps of Fe, Cr, N, Al and Al / Cr, respectively. Due to the low content of Y and the small atomic radius of C, the element distribution of these two elements is not accurate and therefore not listed in the figure. The area with bright color in the figure is the element enrichment area, while the dark area represents the element depletion area. From the diagram, it can be clearly observed that the surfacing alloy is Fe matrix, and the network eutectic carbide is rich in Cr, and the content of Fe is lower than that of Cr. The hard phase particles are rich in Al and N. Combined with XRD analysis, M
7C
3 carbide is (Cr, Fe)
7C
3. The black granular hard phase is AlN. Meanwhile, a small amount of Al, N and Cr are also distributed in the matrix. These alloying elements present in the matrix can play a role in solid solution strengthening of the surfacing alloy and play a positive role in improving the wear resistance of the surfacing alloy. In the analysis of the surface distribution of surfacing alloy elements, the presence of Y in AlN cannot be actually detected. In order to prove that nano Y
2O
3 can become the nucleation particle of AlN, the microstructure of surfacing alloy should be analyzed by TEM.
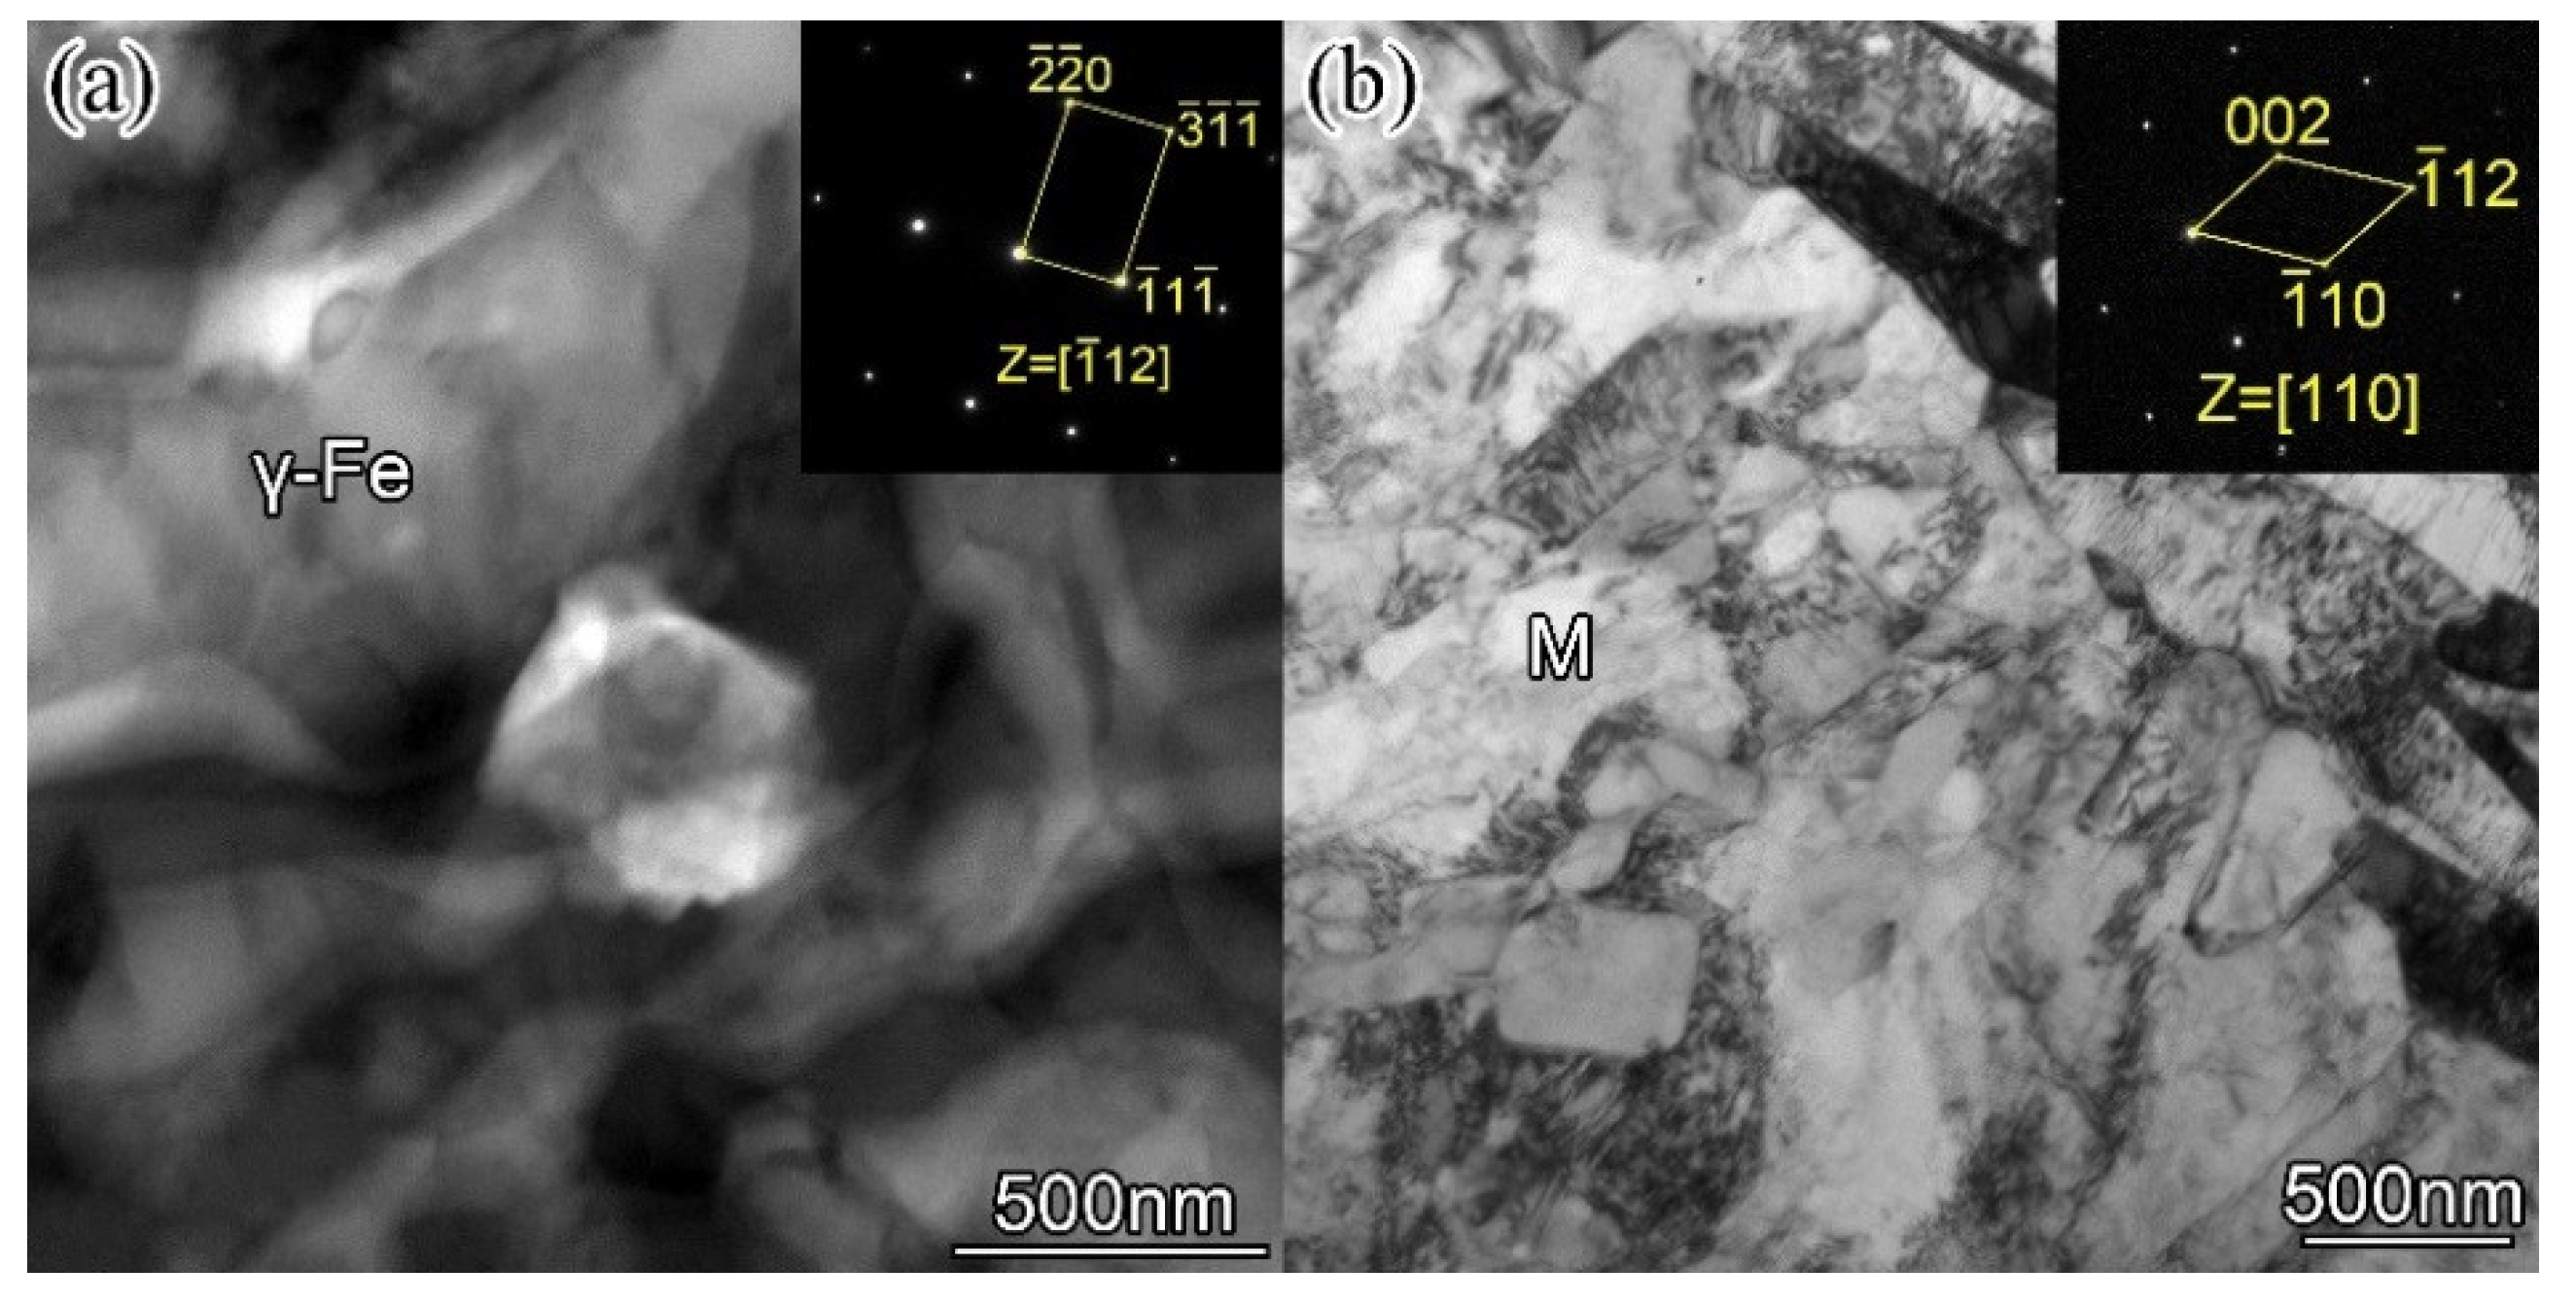
Figure 9 is the STEM-BF image and selected area electron diffraction pattern (SAED) of the surfacing alloy matrix with 0.456 wt. % nano-Y
2O
3 addition. From the electron diffraction pattern of
Figure 9a, it can be analyzed that the matrix is austenite γ-Fe, face-centered cubic structure (fcc), crystal band axis is [112], lattice constant a = 0.385 nm. From the electron diffraction pattern of
Figure 9b, it can be analyzed that the matrix is M, body-centered cubic structure (bcc), band axis [110], lattice constant a = 0.293, c = 0.315. Through TEM analysis, the matrix of the surfacing alloy is composed of retained austenite and martensite, which is consistent with the results of XRD analysis.
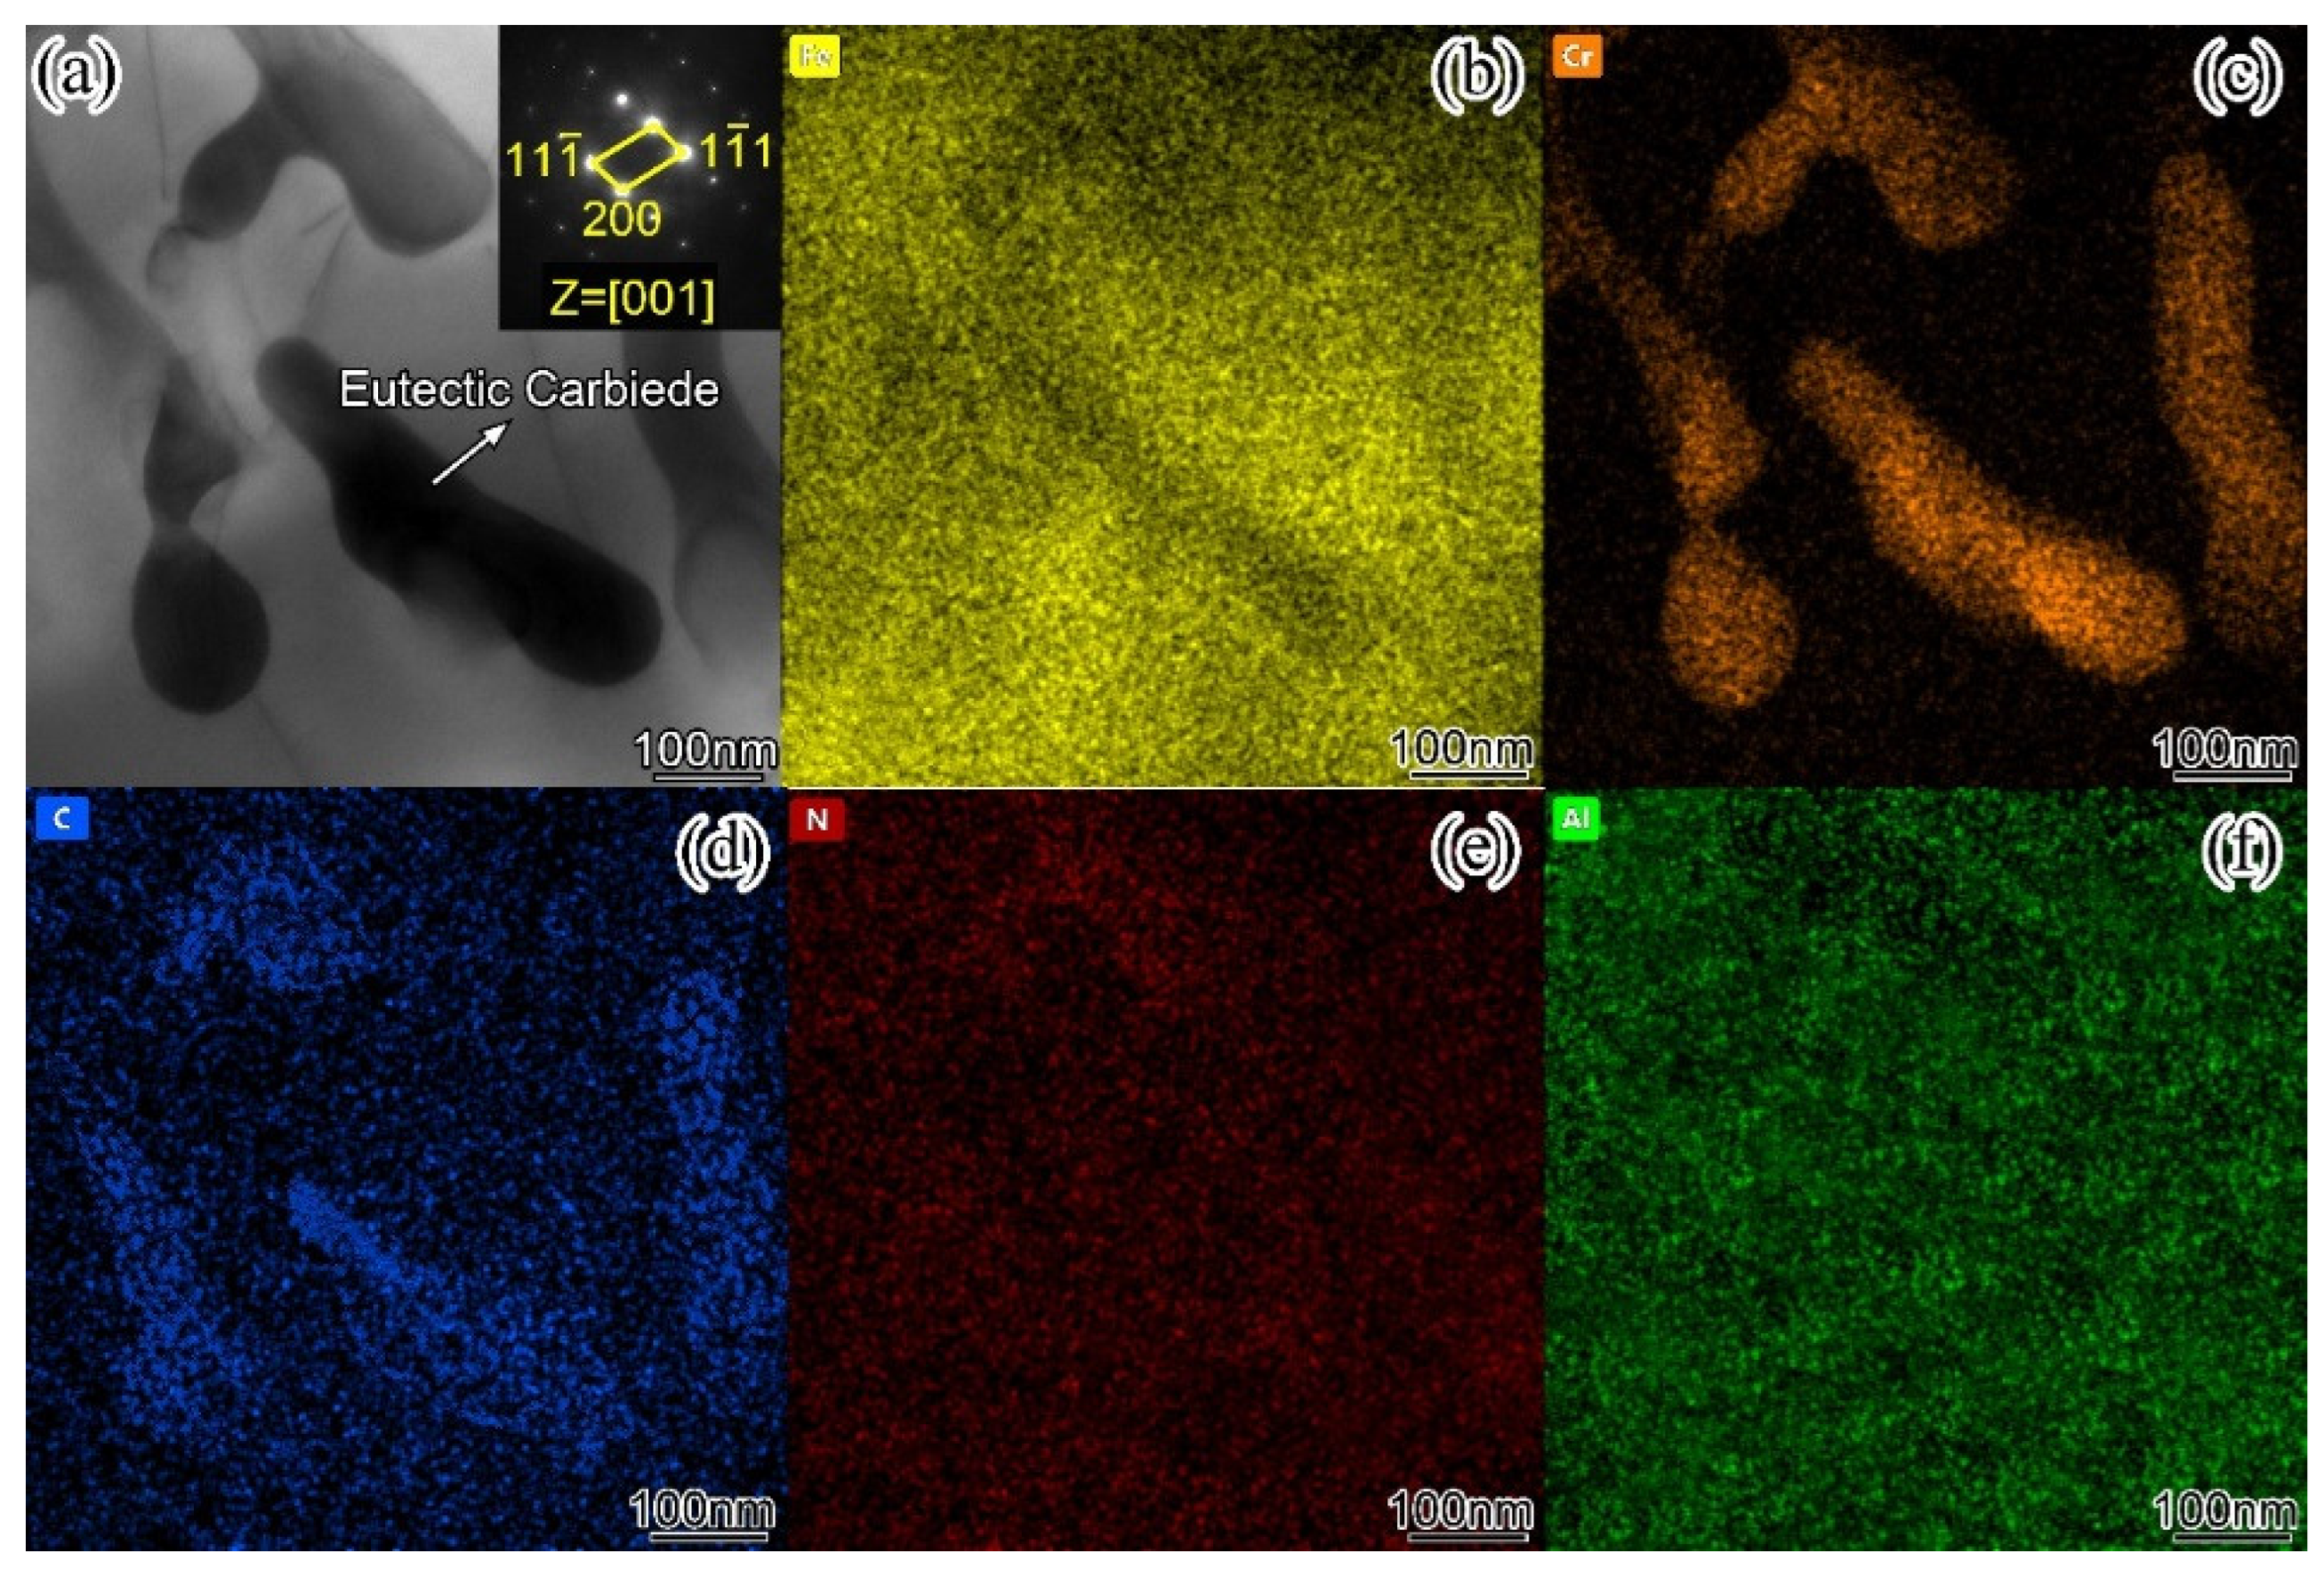
Figure 10 is the STEM-BF and the corresponding STEM-EDS of eutectic carbides in the surfacing alloy with 0.456 wt. % nano-Y
2O
3 addition. From
Figure 10a, it can be seen that the dark irregular area is eutectic carbide, and the light area is surfacing alloy iron matrix. From the STEM-EDS corresponding to
Figure 10a (
Figure 5.11b–f), it can be found that the eutectic carbide region is poor in N and Al. The enrichment area of Cr and C corresponds to the shape of eutectic carbides. Combined with the electron diffraction pattern of eutectic carbide in
Figure 10a, it can be seen that the eutectic carbide is face-centered cubic structure (fcc) and the crystal band axis is [001]. The lattice constants are a = 4.53Å, b = 7.01Å, c = 12.2Å. This is consistent with the M
7C
3 structure. When the Fe atom replaces the Cr atom in Cr
7C
3, because the difference between the radius of Fe atom and the radius of Cr atom is very small, the crystal structure of the formed (Cr, Fe)
7C
3 eutectic carbide does not undergo large lattice distortion, and the final eutectic carbide structure is orthogonal.
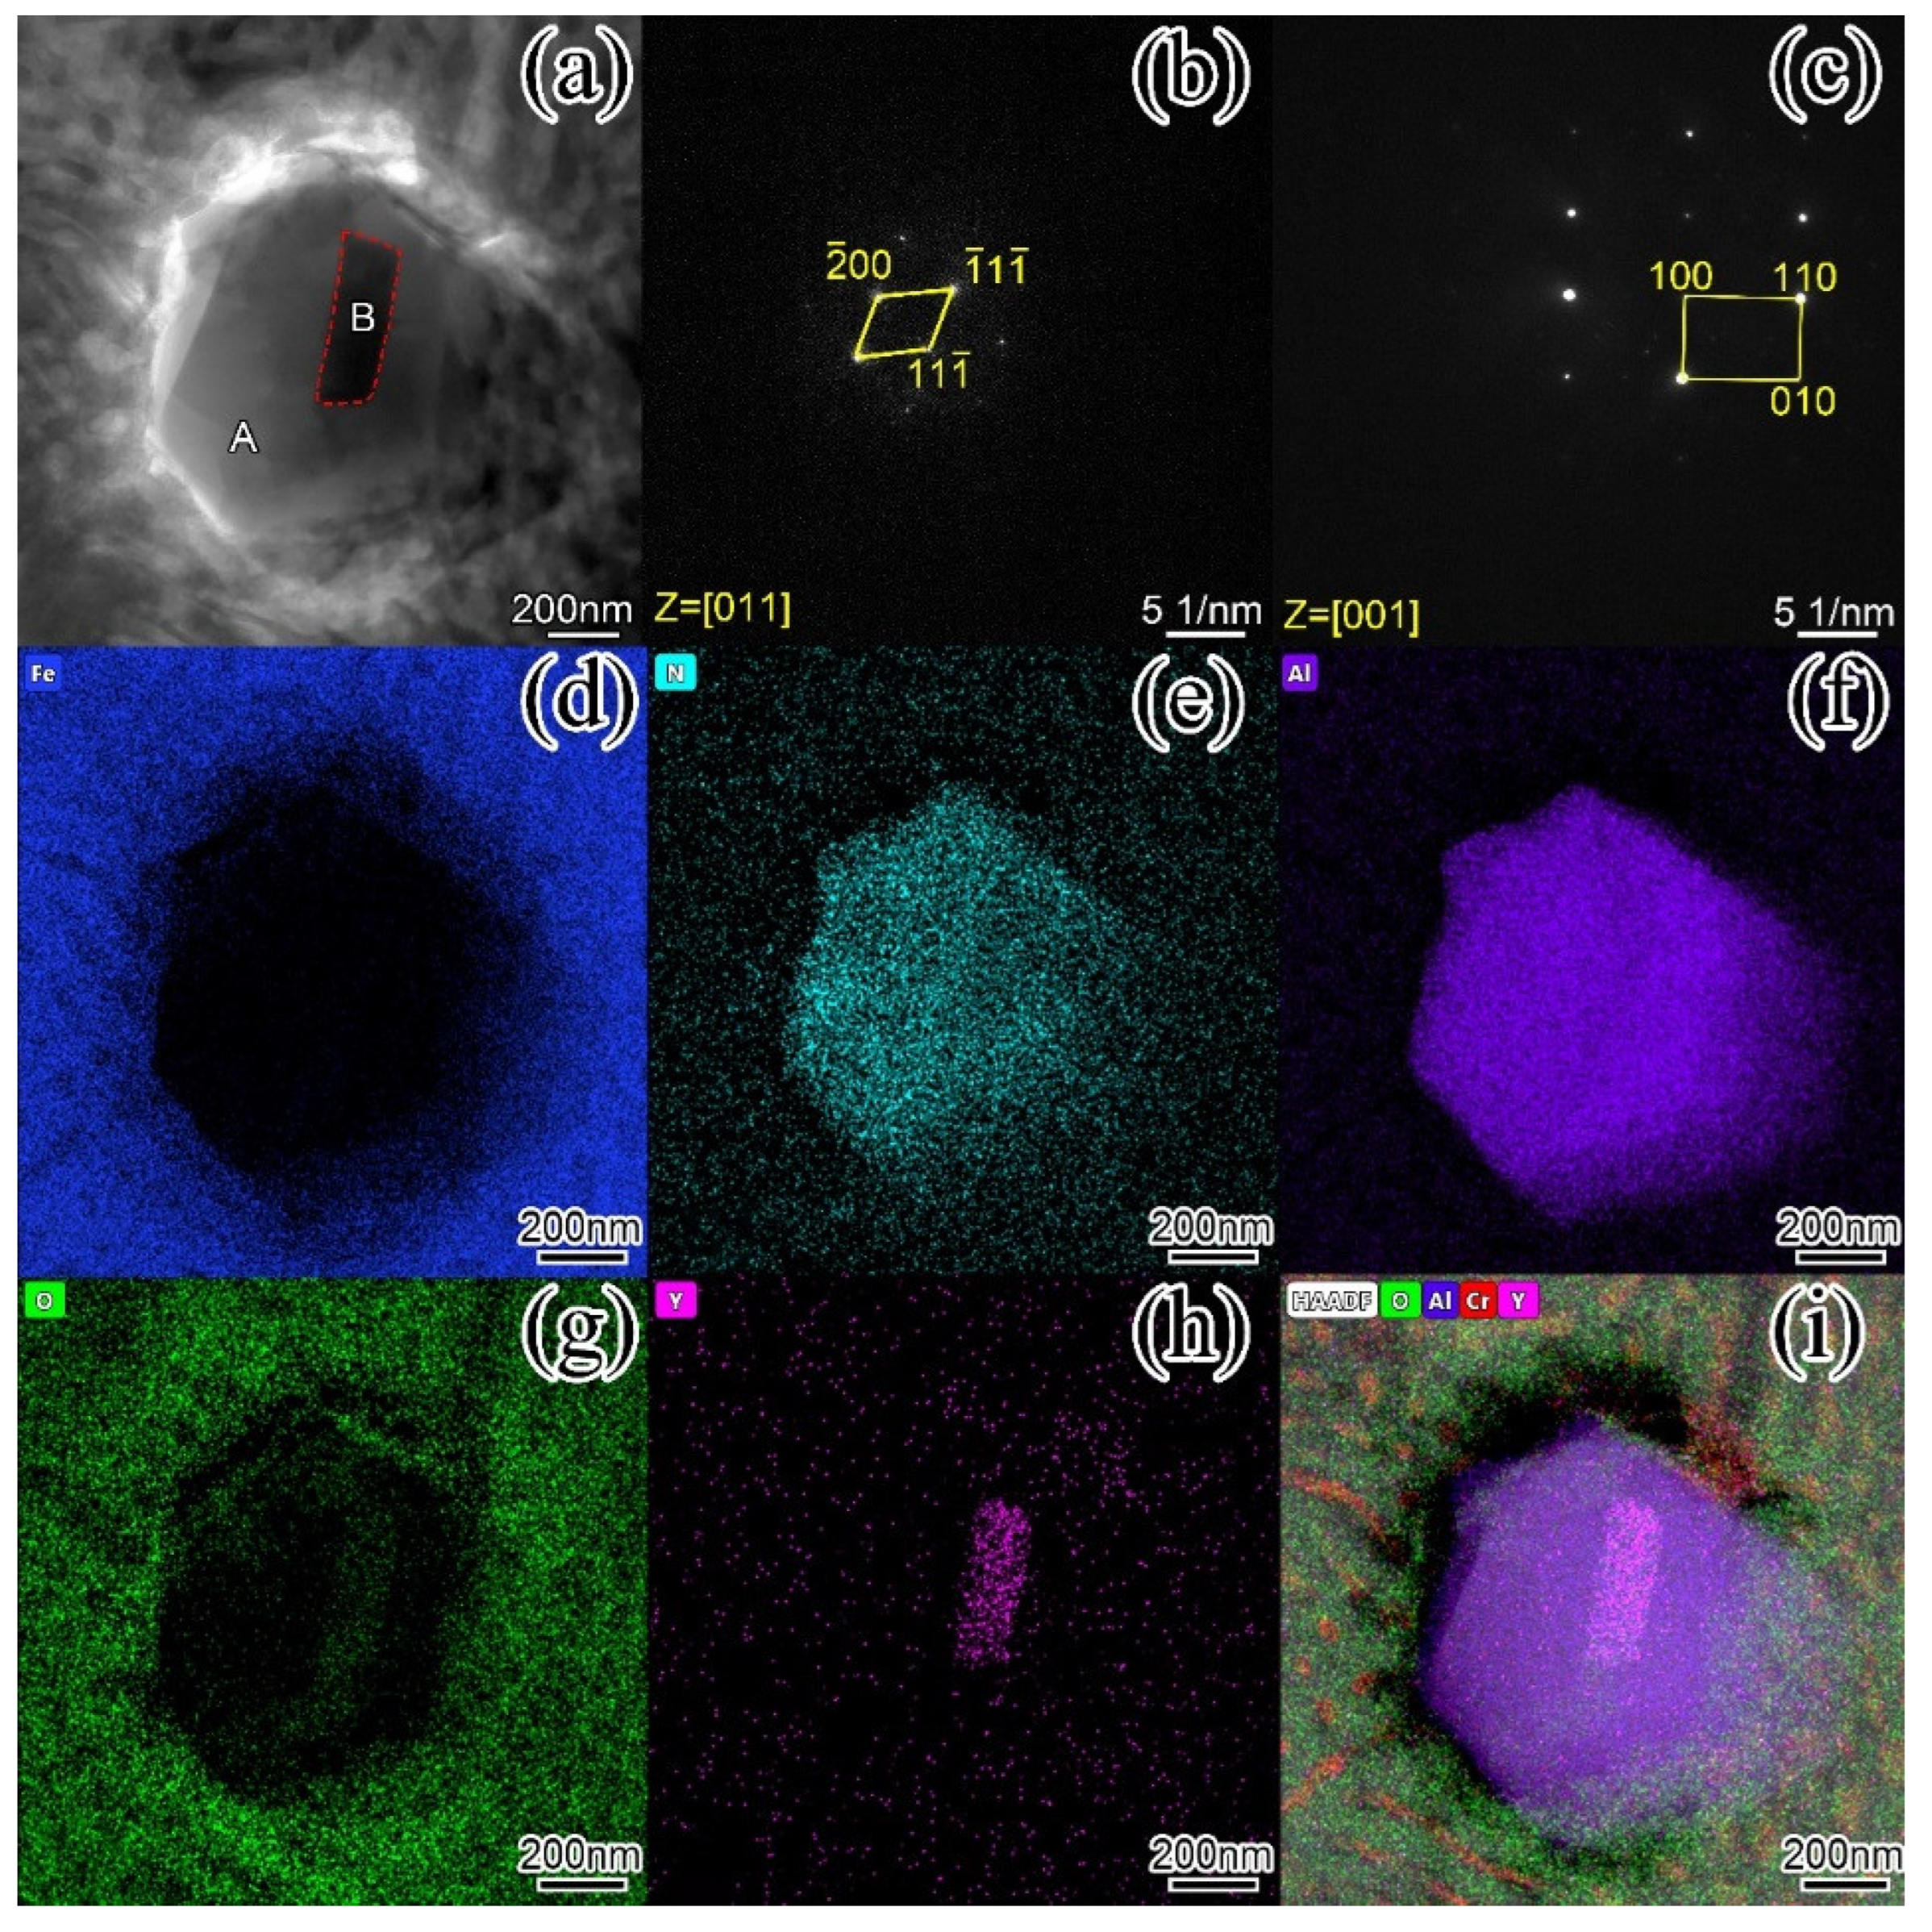
Figure 11 is the STEM image of the hard phase of the surfacing alloy with 0.456 wt. % nano-Y
2O
3 addition. It can be found from
Figure 11a that the hard phase is an irregular hexagon, and there are dark strip particles in the middle area of the hard phase. The corresponding electron diffraction patterns were obtained by selecting electron diffraction in A and B regions. In
Figure 11b, it can be known from the calibration of the diffraction pattern that the A region is a typical face-centered cubic structure (bcc), the crystal band axis is [011], and the lattice constant is a = 4.1Å. By comparing with the PDF card, it is determined that the hard phase is AlN and the space group is Fm-3m (225). In
Figure 11c, it was found to be a face-centered cubic structure, a = 10.554Å, and it can be determined to be Y
2O
3 after comparing the PDF card. From
Figure 5.12a, it can be clearly seen that the AlN hard phase grows around Y
2O
3, and the two are closely combined. This confirms from the experimental results that AlN and Y
2O
3 can form a heterogeneous nucleation interface. Y
2O
3 can be used as a nucleation particle to effectively promote the formation of AlN, refine the grains and promote the precipitation of eutectic carbides, and the wear resistance of the surfacing alloy is significantly improved.
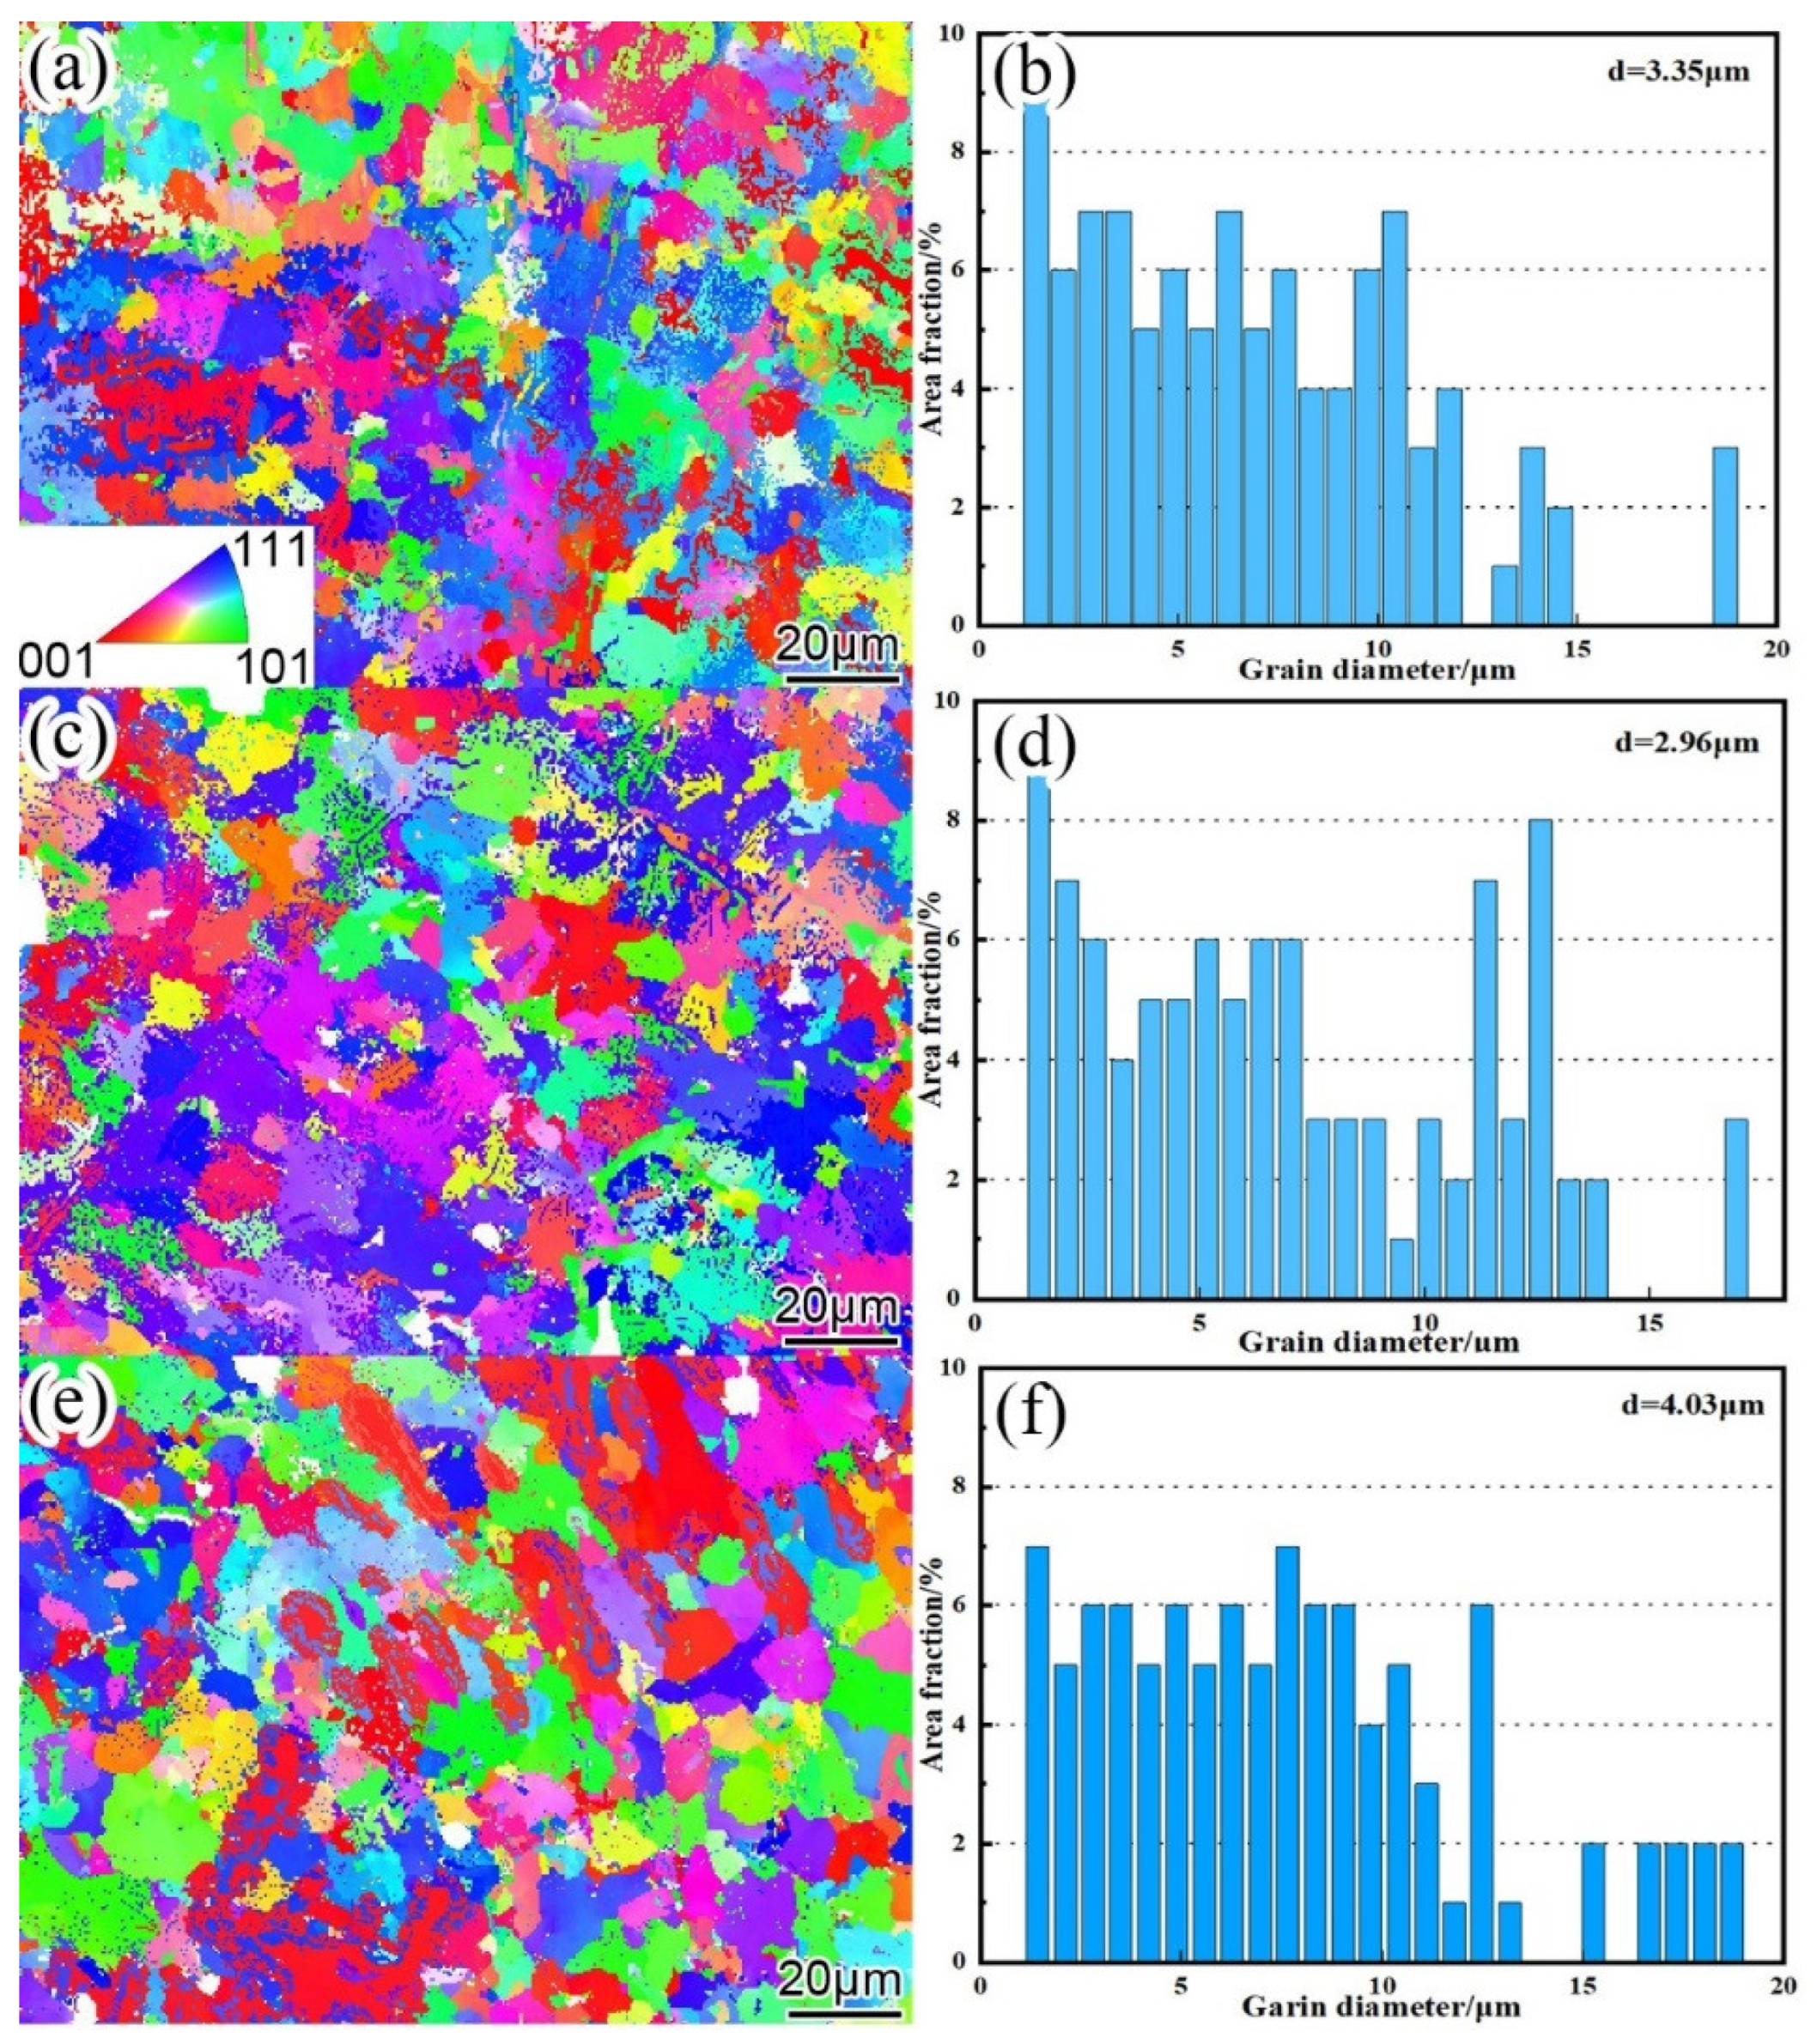
Figure 12 is the EBSD inverse pole figure (IPF) and grain size statistics of nano-Y
2O
3 surfacing alloys with different contents. It can be seen from the figure that with the increase of nano-Y
2O
3 content to 0.456 wt. % Y
2O
3, the grain refinement of the surfacing alloy is obvious, the average grain equivalent diameter is reduced from 3.35μm to 2.96μm, and the grain size distribution is more uniform. As the content of nano-Y
2O
3 continues to increase to 0.570 wt. %, the grain size of the surfacing alloy increases to 4.03μm and the grain size varies.
The decrease of grain size will increase the hardness of surfacing alloy. The relationship between yield strength and grain size can be expressed by Hall-Petch [
35]:
In the formula: σs represents the yield limit of the material; σi represents the lattice friction resistance generated by moving a single dislocation; k represents the correlation constant; d represents the grain size. It can be found that the yield strength increases with the decrease of grain size. Generally, the hardness of the material increases with the increase of strength. With the addition of nano-Y2O3, the grains are refined, which increases the hardness of the surfacing alloy. When the nano-Y2O3 is added too much, the microstructure of the surfacing alloy is gradually coarse, which in turn reduces the hardness.
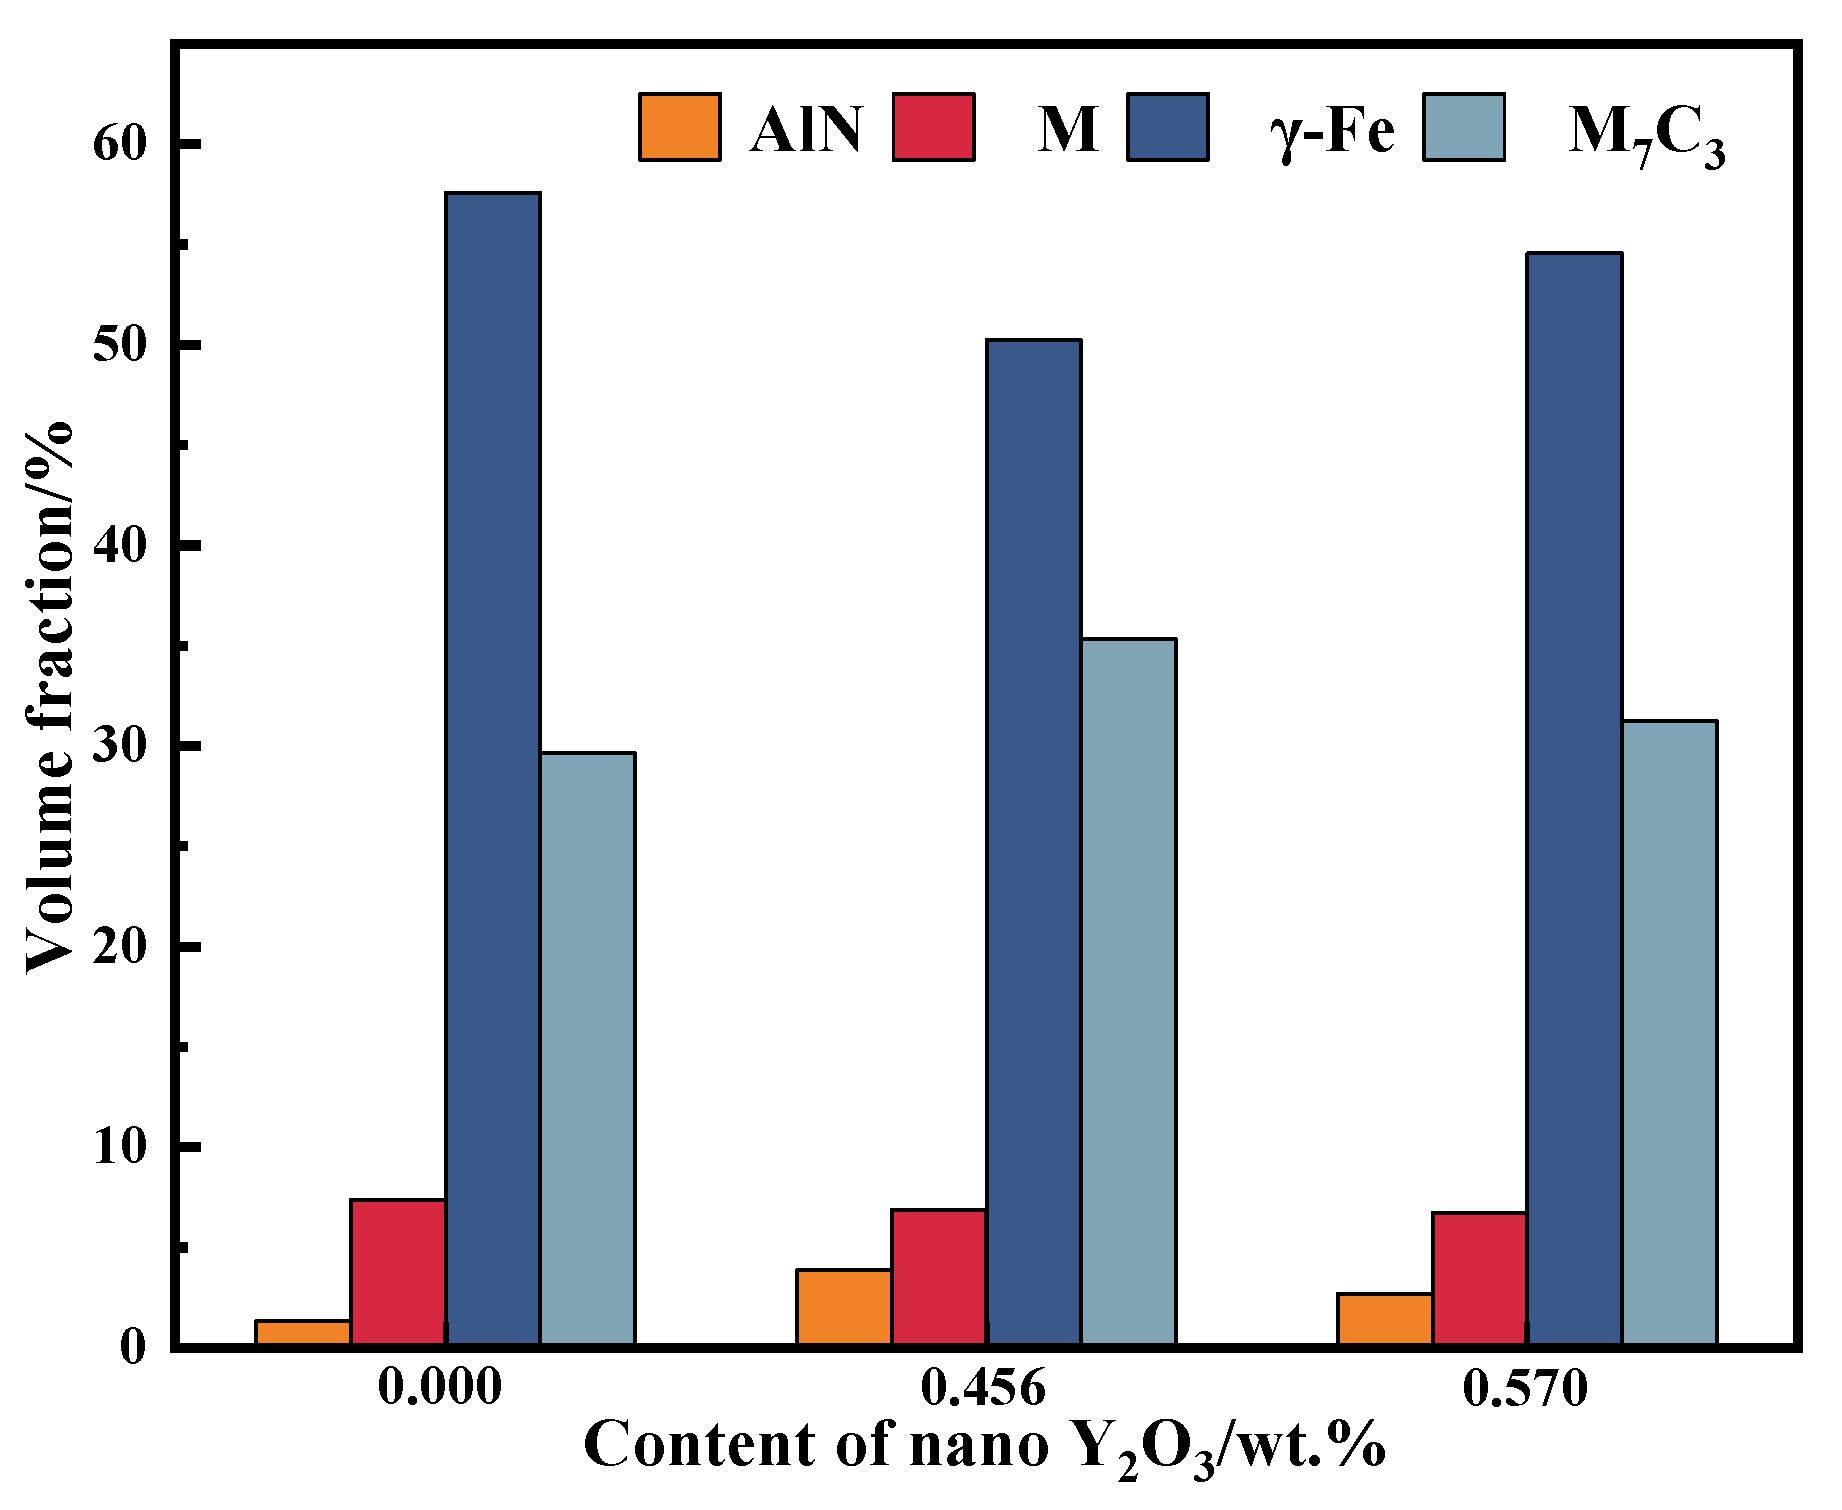
Figure 13 is the variation trend of the volume fraction of each phase of EBSD with the content of nano-Y
2O
3 additive. It can be seen from the figure that with the increase of nano-Y
2O
3 additive content, the volume fraction of e M
7C
3 and AlN in the surfacing alloy increases first and then decreases. When the content of nano-Y
2O
3 is 0.456 wt. %, the volume fractions of M
7C
3 and AlN are 35.34 % and 3.87 %, respectively. The volume fraction of M
7C
3 and AlN increased by 5.7 % and 2.52 % compared with that without nano-Y
2O
3. With the increase of nano-Y
2O
3 content, the volume fraction of M
7C
3 and AlN changes little.
This indicates that the addition of appropriate nano-Y2O3 can effectively act as heterogeneous nucleation particles, increase the precipitation amount of AlN and increase the volume fraction of M7C3. The matrix of surfacing alloy is mostly retained austenite, the volume fraction of martensite is less and the change of nano-Y2O3 content has little effect on the volume fraction of martensite. The surfacing alloy matrix is mainly composed of retained austenite and a small amount of martensite, which ensures that the surfacing alloy matrix has good strength and toughness.
3.4. Analysis of Hardness and Wear Resistance
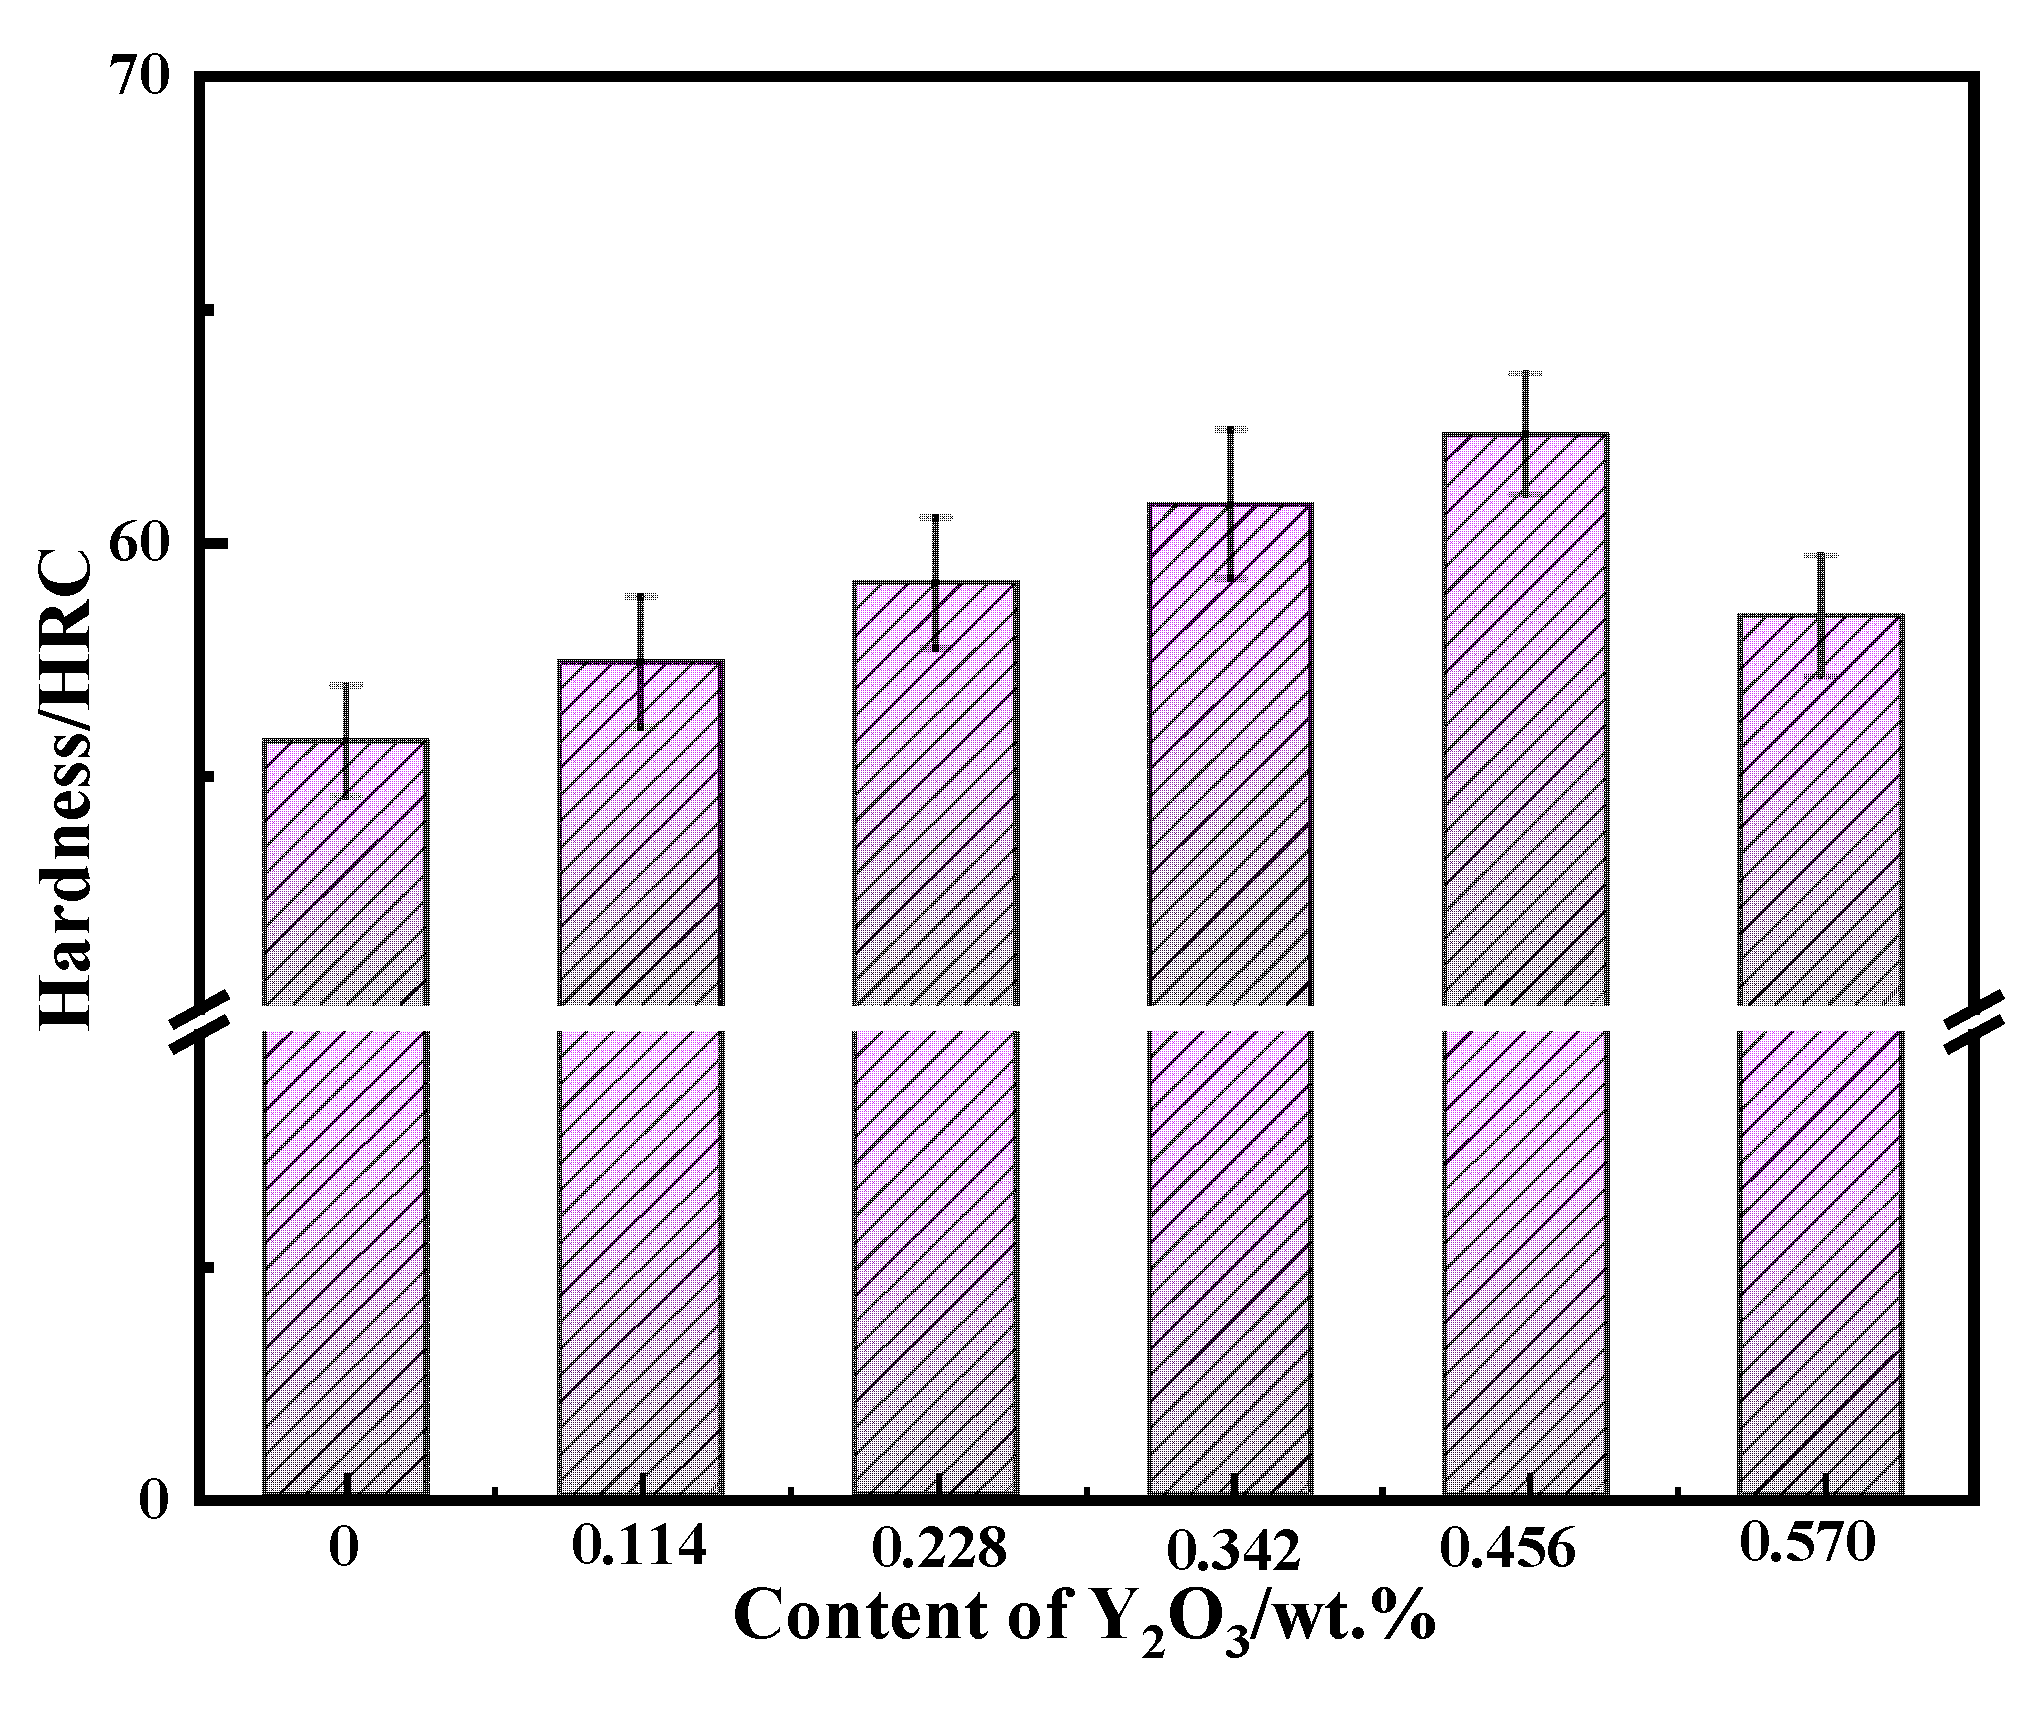
Figure 14 is the histogram of Rockwell hardness change of surfacing alloy with different content of nano-Y
2O
3. From the diagram, it can be found that with the increase of nano-Y
2O
3 content, the hardness of the surfacing alloy increases first and then decreases. When nano-Y
2O
3 is not added, the Rockwell hardness of the surfacing alloy is 55.7 HRC. When the addition amount of nano-Y
2O
3 is 0.456%, the Rockwell hardness of the surfacing alloy reaches 62.3HRC, and the Rockwell hardness increases by 11.8 %. From the above volume fraction analysis results, it can be seen that with the increase of nano-Y
2O
3 content, the volume fraction of martensite and retained austenite in the surfacing alloy matrix does not change much, while the volume fraction of M
7C
3 and AlN precipitates increases significantly. However, the content of nano-Y
2O
3 in the surfacing alloy continues to increase, which will lead to the weakening of the fluidity of the surfacing alloy molten pool, the difficulty of slag and gas discharge, the slow cooling rate of the surfacing alloy molten pool, the long growth time of the surfacing alloy structure, and the coarse structure, which will reduce the hardness of the surfacing alloy [
36].
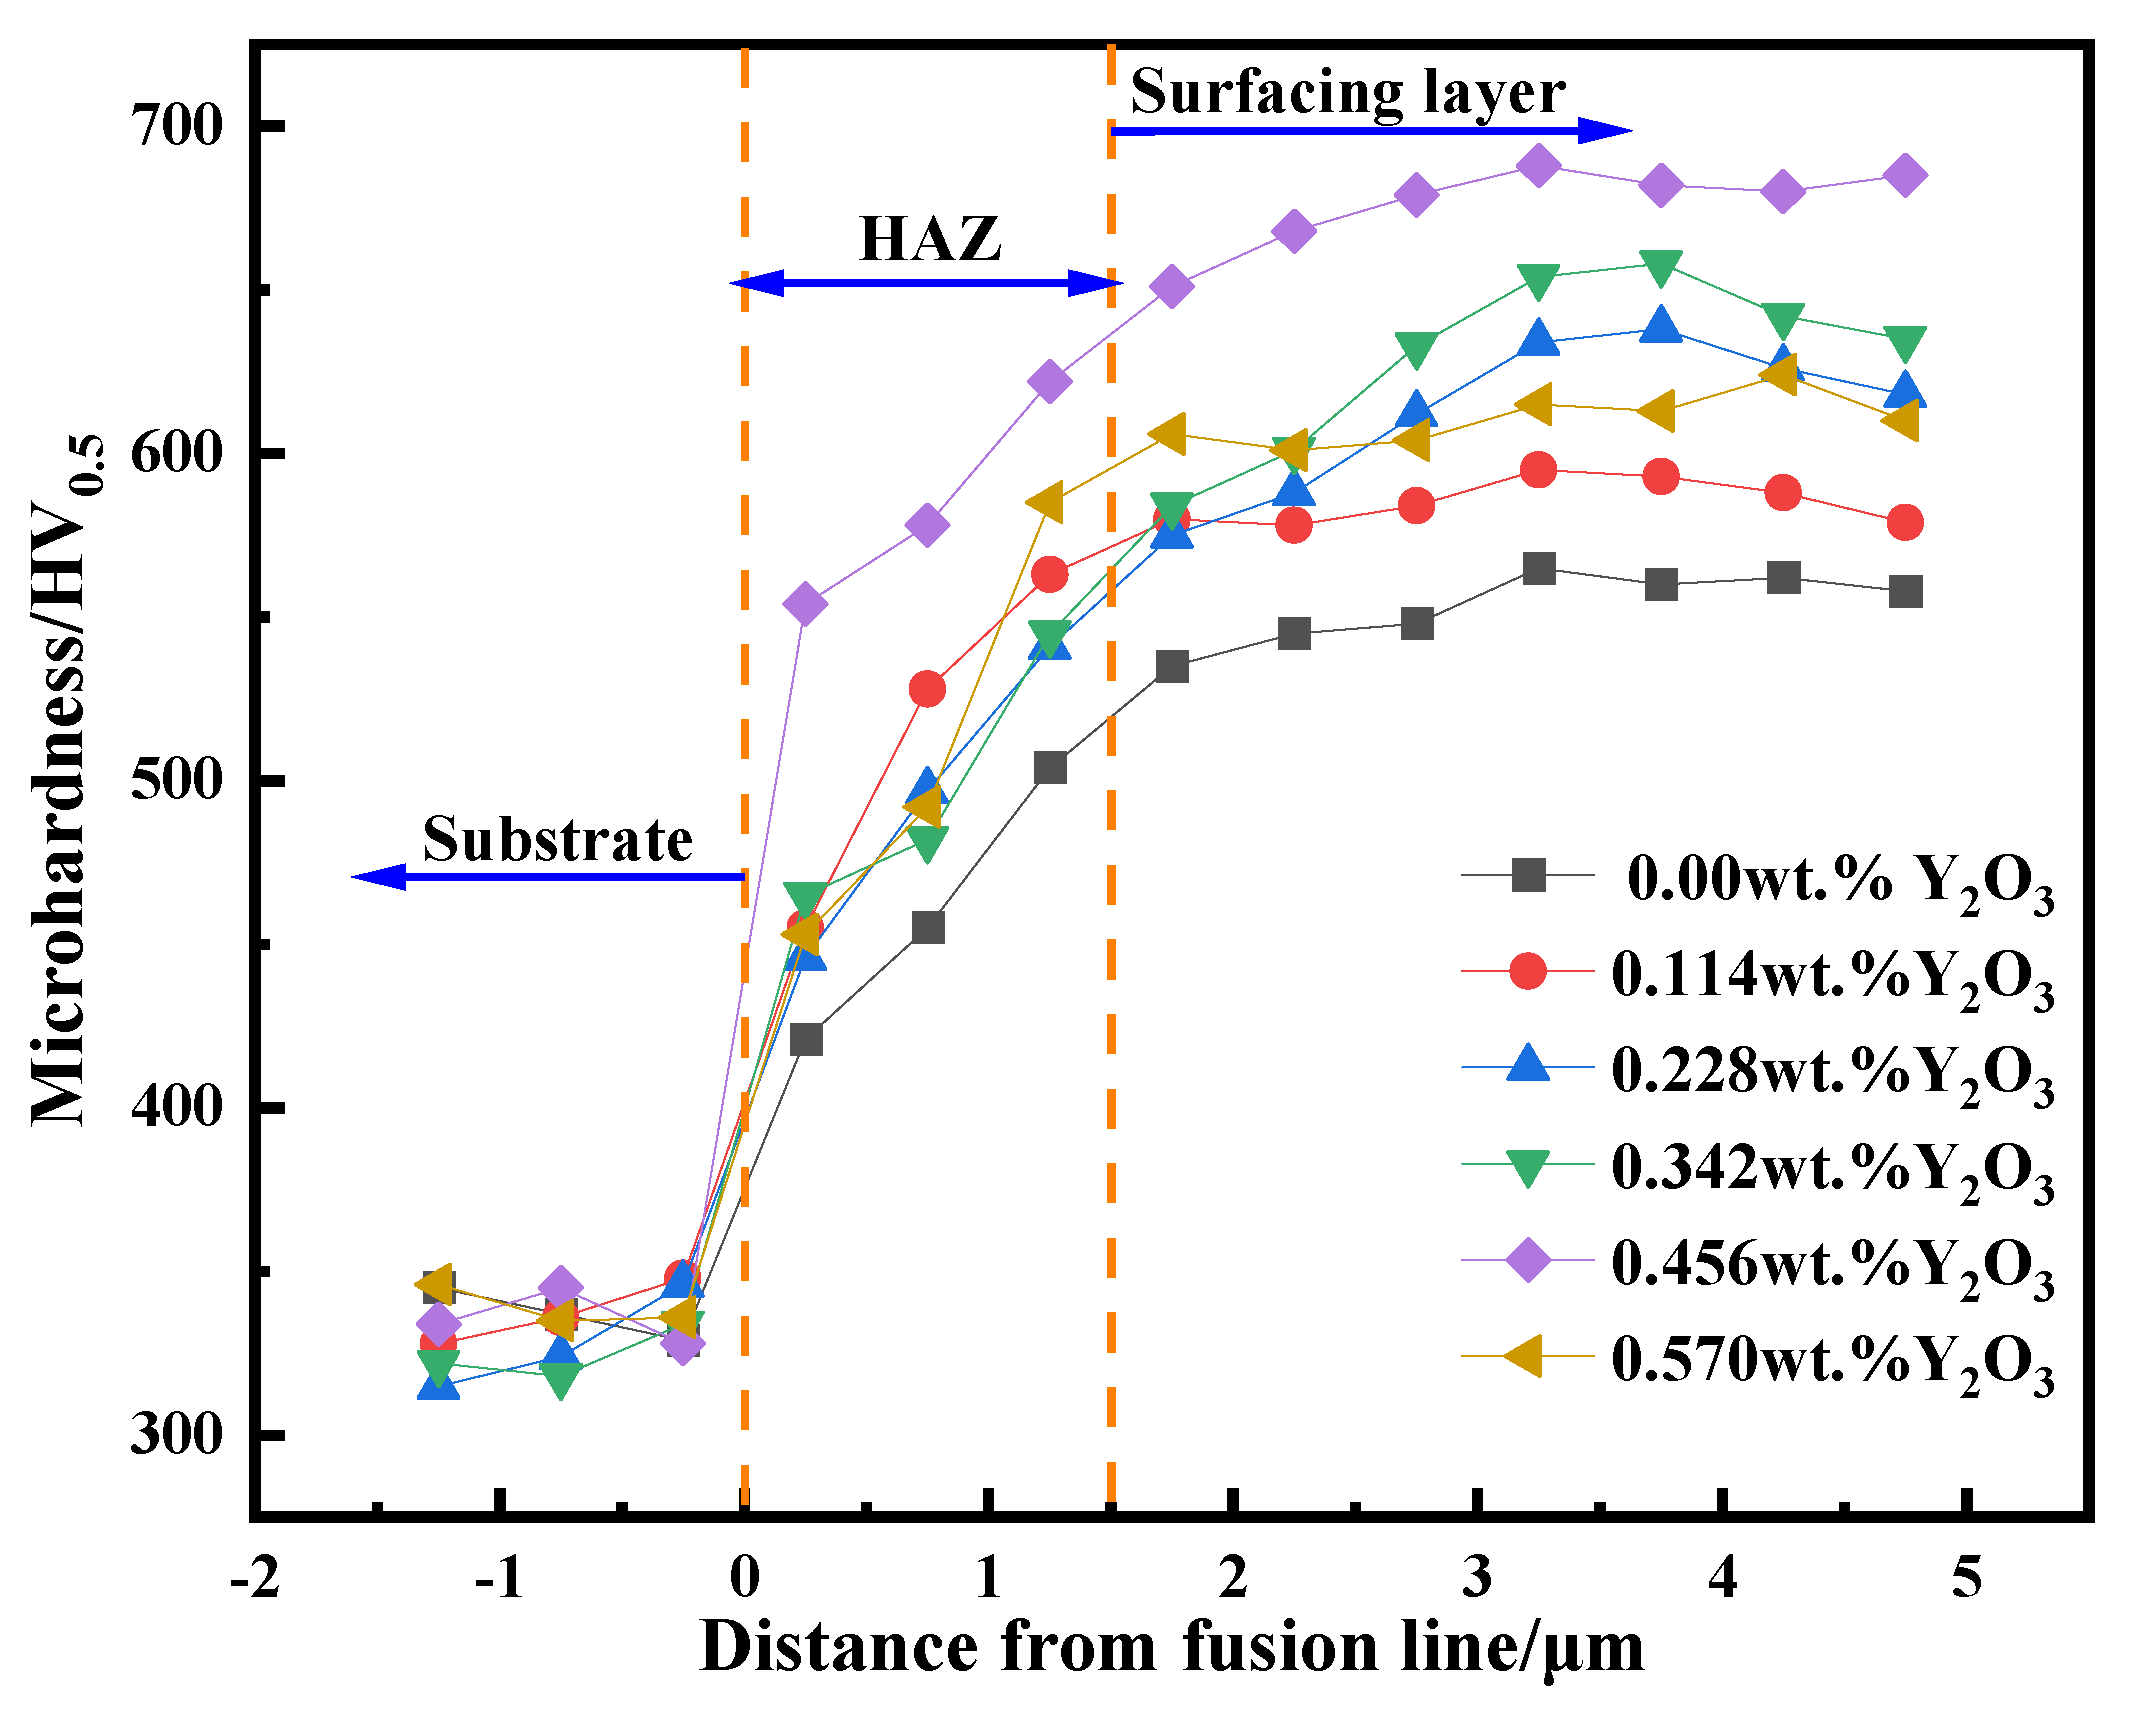
Figure 15 is the lateral microhardness distribution map of surfacing alloy with different nano-Y
2O
3 content. It can be found from the figure that with the increase of nano Y
2O
3 content, the hardness of surfacing alloy increases first and then decreases. When the content of nano-Y
2O
3 reaches 0.456wt. %, the microhardness of the surfacing alloy reaches the maximum value of 688HV
0.5, which is 23 % higher than that without nano-Y
2O
3. Due to the low hardness of the base metal Q235 itself, it is generally around 330 HV, as the distance from the surface of the surfacing alloy is closer, the microhardness gradually increases. This is due to the dilution effect of the base metal on the surfacing alloy. The eutectic carbide M
7C
3 of the surfacing alloy is small and the hardness is low.
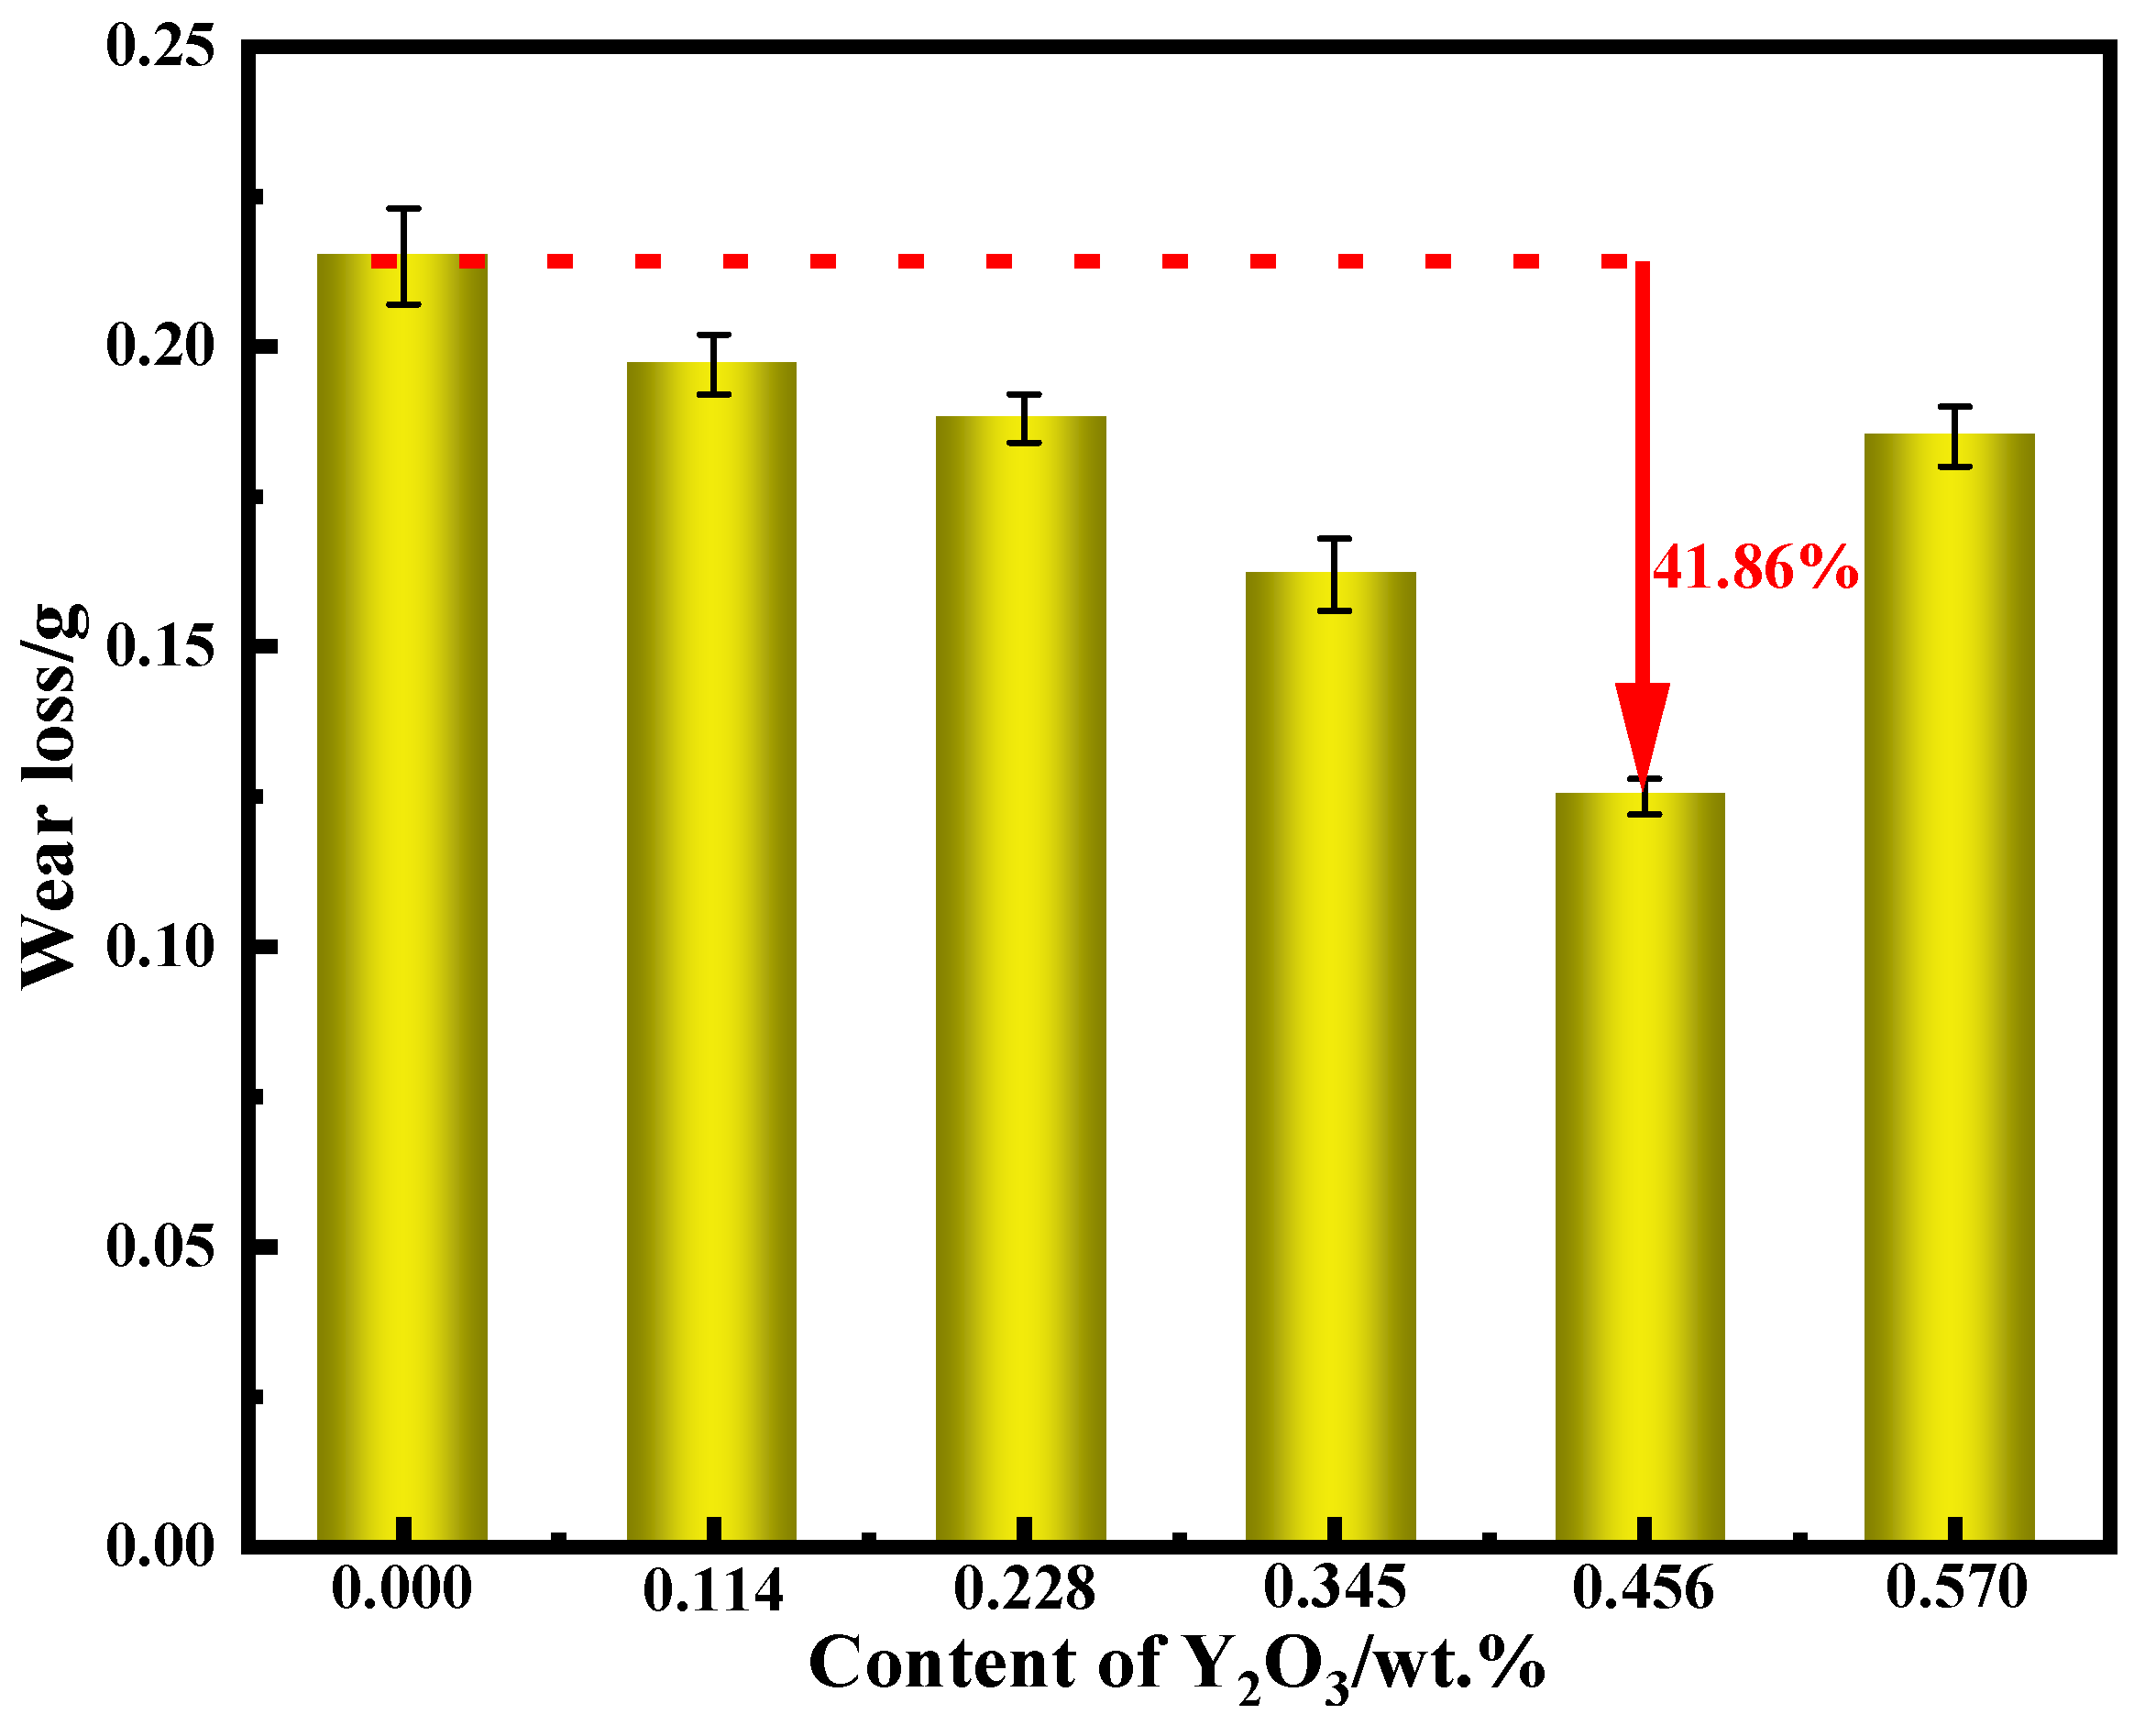
Figure 16 is the change of wear weight loss of surfacing alloy with different content of nano-Y
2O
3. It can be seen from the diagram that with the increase of nano-Y
2O
3 additive content, the wear weight loss of the surfacing alloy decreases first and then increases. When the addition of nano-Y
2O
3 is 0.456wt. %, the wear resistance of the surfacing alloy is the best, and the minimum wear loss is 0.125g. Compared with the surfacing alloy without nano-Y
2O
3, the wear resistance is increased by 41.86 %. As the content of nano-Y
2O
3 additive continues to increase to 0.570 wt. %, the wear loss increases and the wear rate decreases. The change trend of wear resistance of surfacing alloy with the content of nano Y
2O
3 additive is basically consistent with the change of hardness. Adding an appropriate amount of nano-Y
2O
3 will increase the precipitation of AlN hard phase with small size and uniform distribution. The increase of AlN hard phase can further improve the distribution and precipitation of M
7C
3. The increase of hard phase will inevitably lead to the increase of hardness and wear resistance. The austenitic matrix has the ability of work hardening. When under the action of abrasive wear load, the surface of the surfacing alloy will undergo work hardening, which hinders the expansion of microcracks and improves the wear resistance of the surfacing alloy. When excessive nano-Y
2O
3 is added, the microstructure of the surfacing alloy will be coarse, which will reduce the wear resistance of the surfacing alloy.
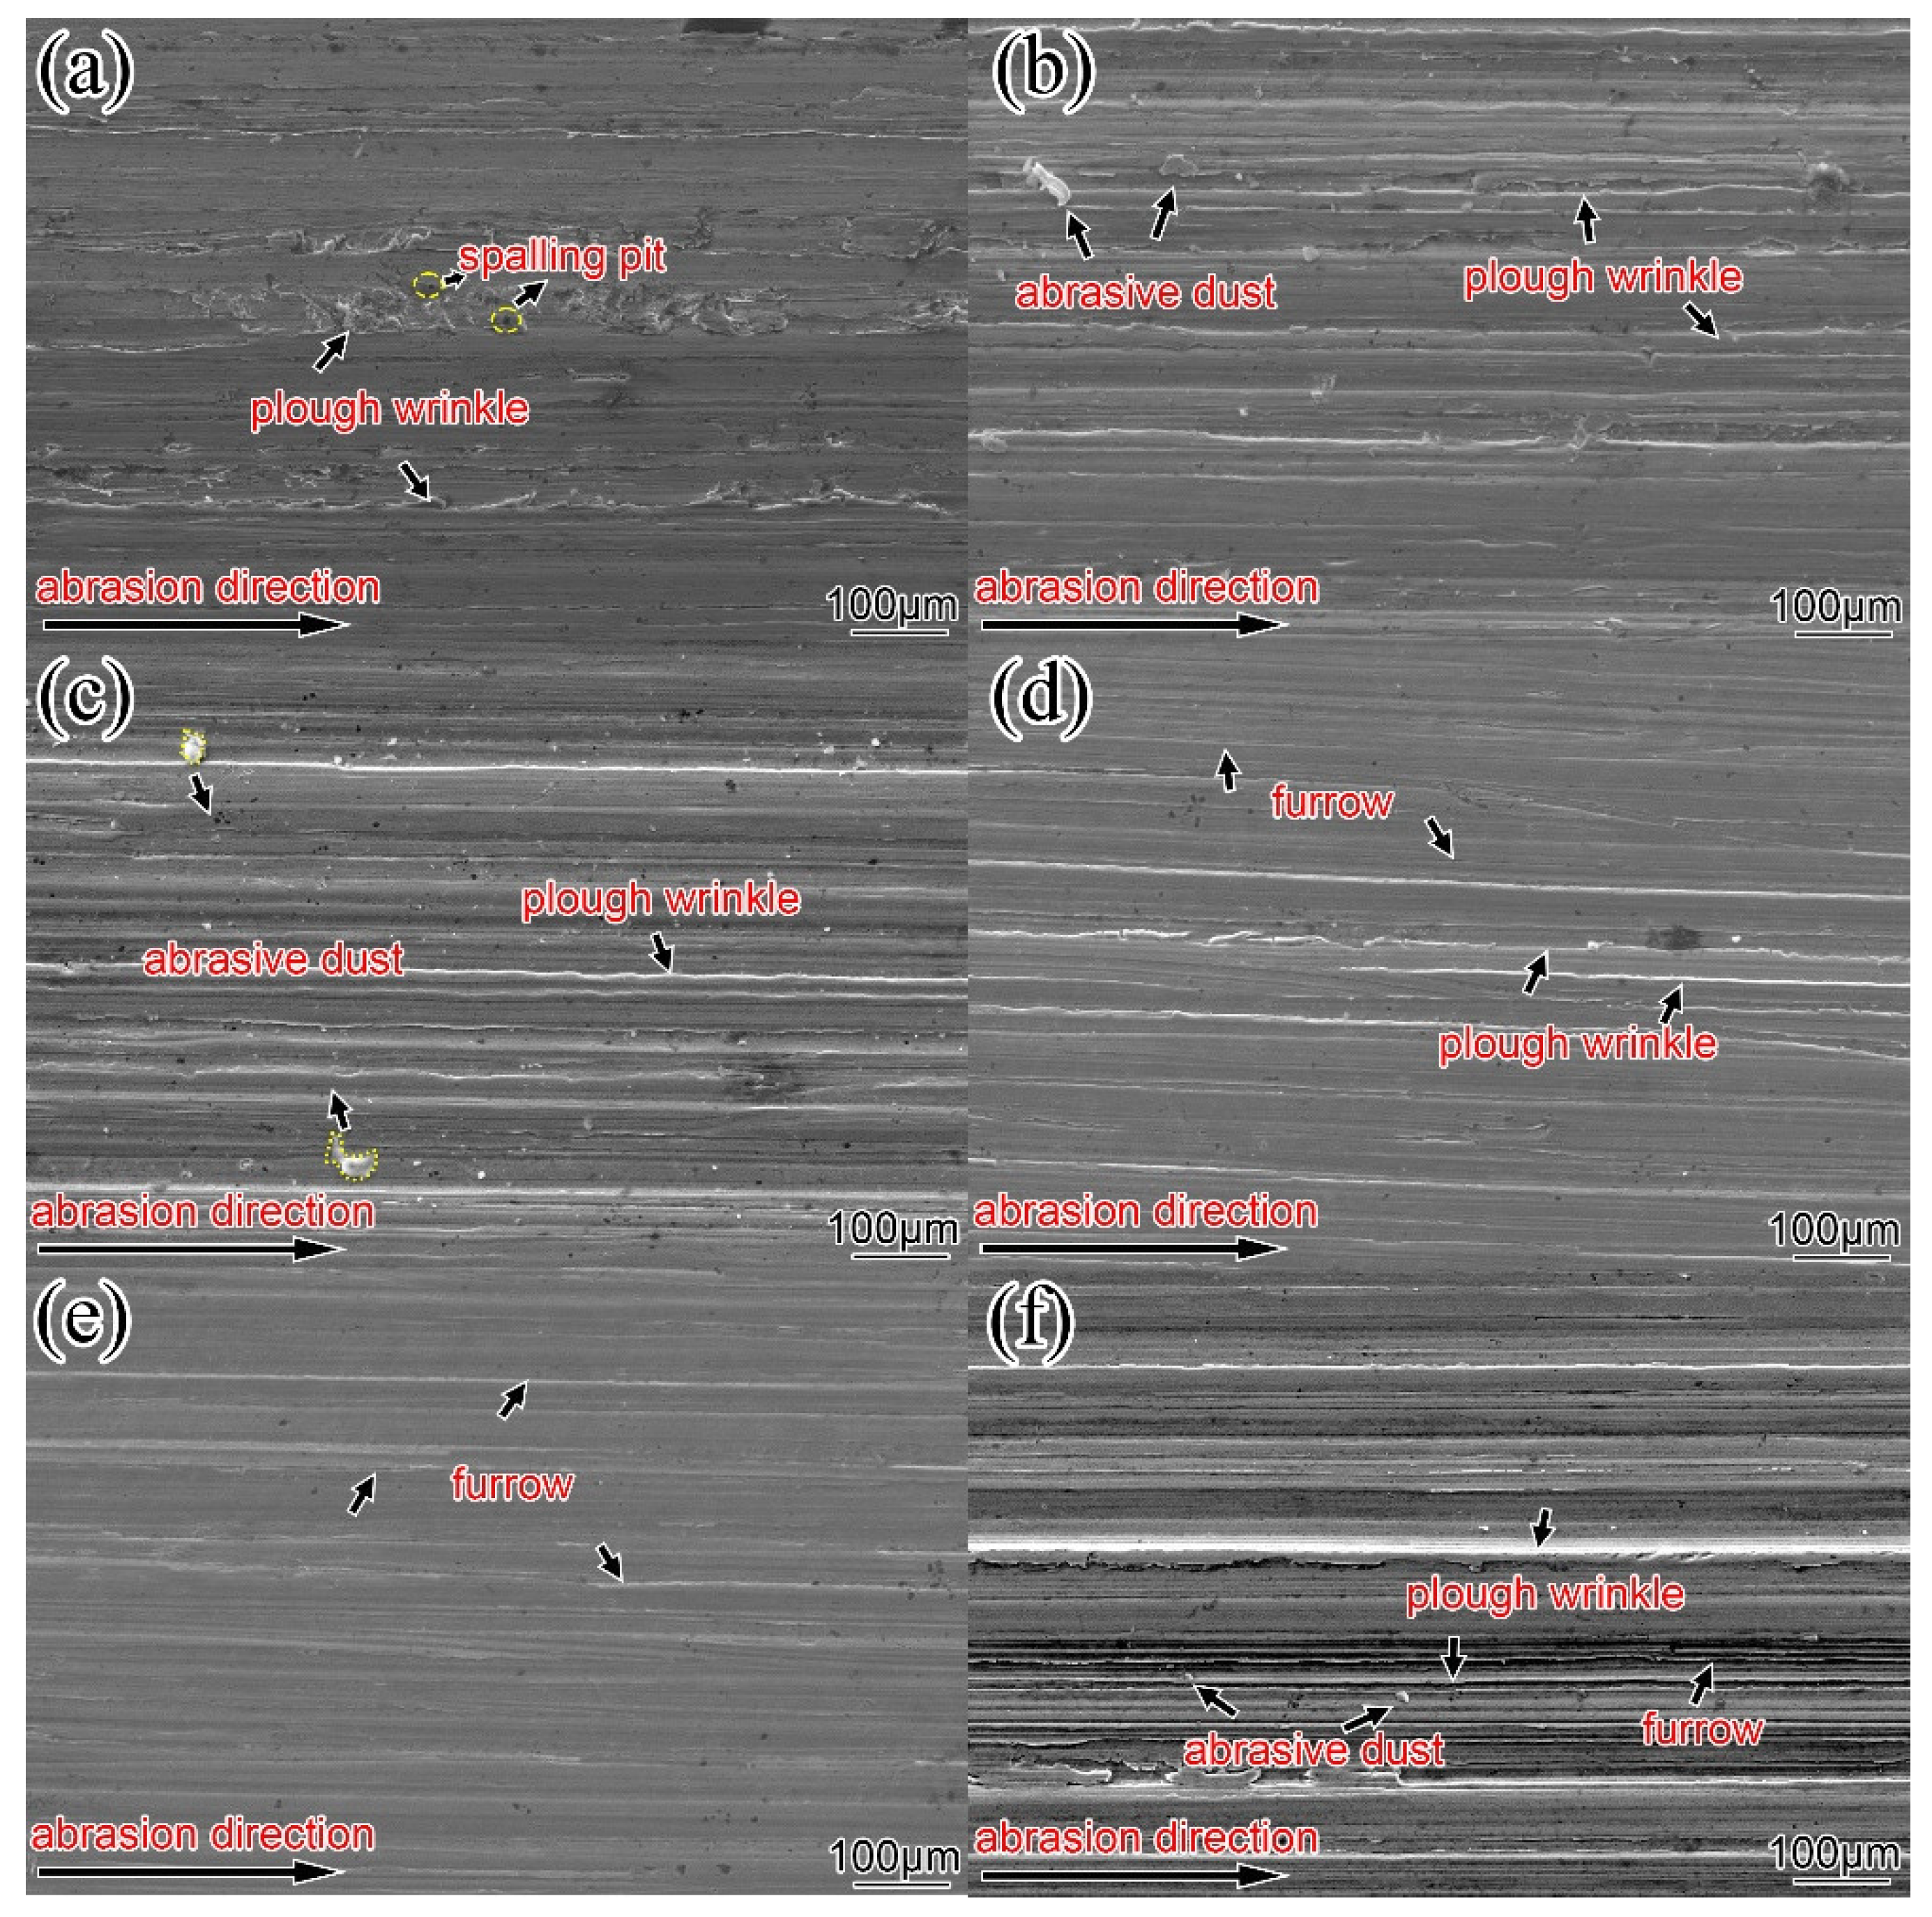
Figure 17 is the wear morphology of the surfacing alloy with different content of nano-Y
2O
3.
Figure 17a shows the wear morphology of the surfacing alloy without nano-Y
2O
3.At this time, the furrow is deep and there are plough wrinkles and spalling pits, and no obvious cracks are observed on the surface. It can be seen from
Figure 17b–e that after adding nano-Y
2O
3 to the surfacing alloy, the plough wrinkles and peeling pits on the surface of the surfacing alloy are reduced, and the furrows become shallow. It can be found from
Figure 17e that when the content of nano-Y
2O
3 reaches 0.456 wt. %, the depth of wear marks on the surface of the surfacing alloy is the shallowest and evenly distributed, and the spalling pits disappear. At this time, the wear resistance of surfacing alloy is the best. With the further increase of nano-Y
2O
3 content, the surface wear scar of the surfacing alloy becomes deeper, the surface appears abrasive dust and furrows, and the wear resistance of the surfacing alloy becomes worse. Appropriate amount of nano-Y
2O
3 can increase the precipitation of AlN, change the distribution of M
7C
3, and significantly improve the wear resistance of surfacing alloy.
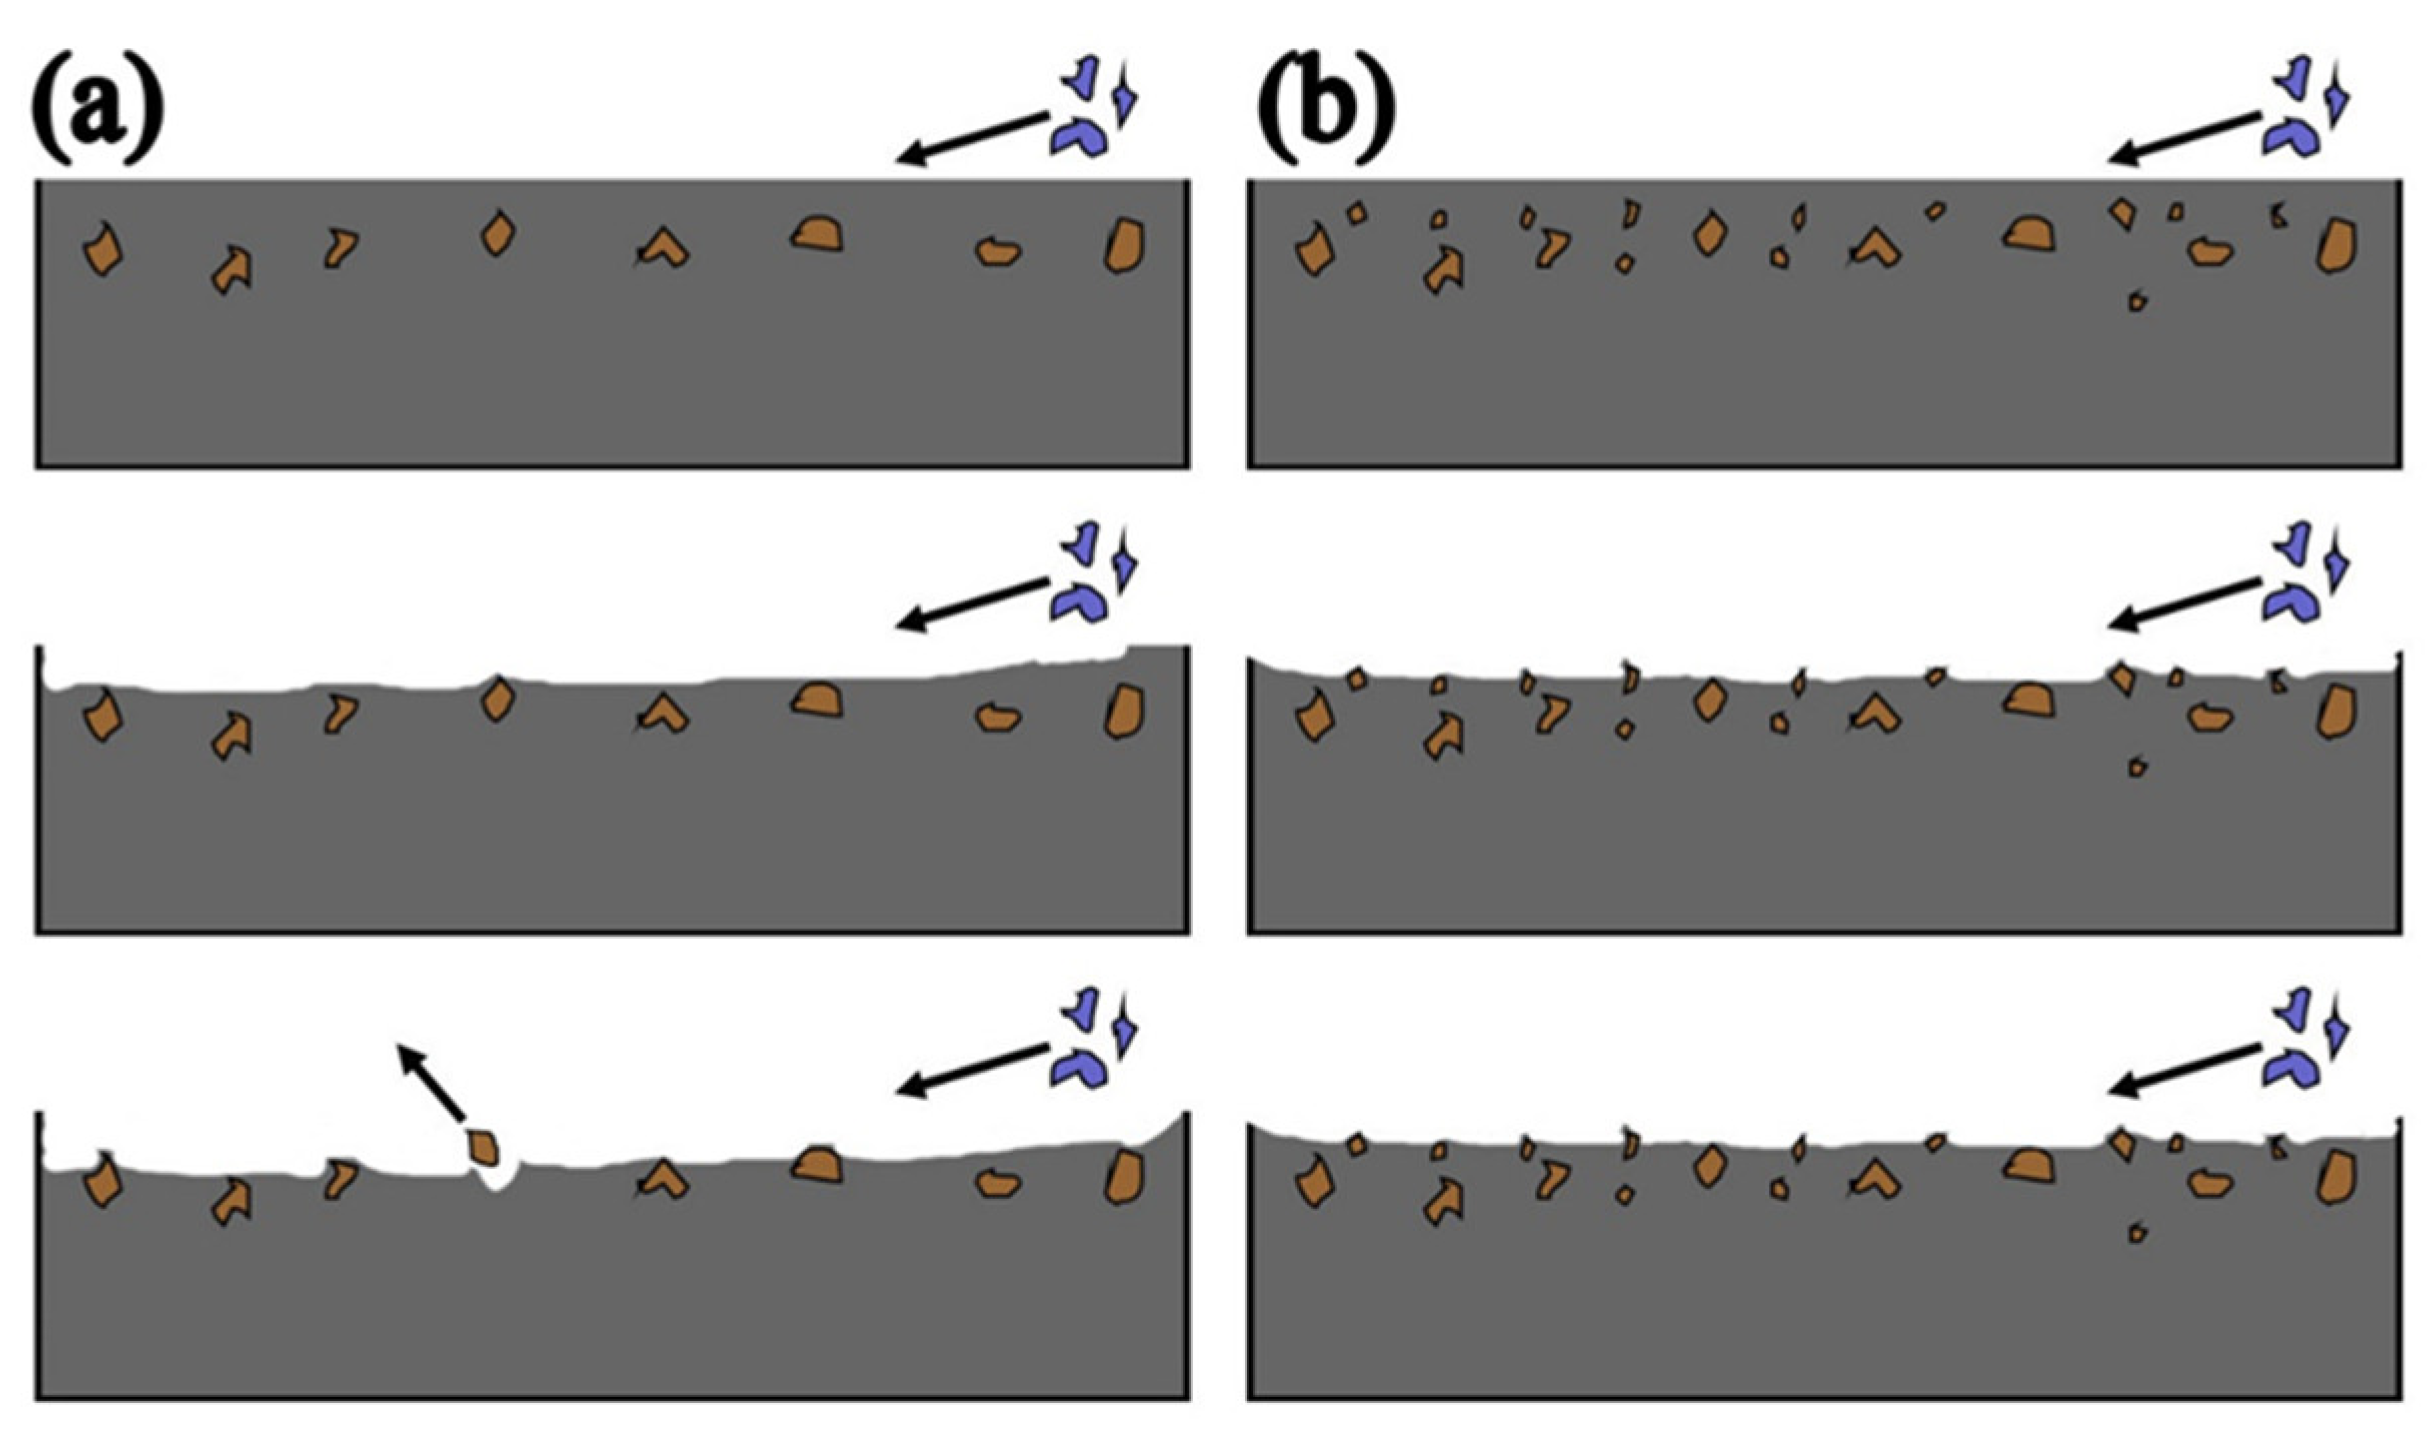
Figure 18 shows the effect of AlN on abrasive wear. In this study, the hard phase of the surfacing alloy is mainly AlN particles + M
7C
3. Among them, M
7C
3 has high hardness and is distributed in the matrix in a grid shape, playing the role of wear-resistant skeleton. A large number of dispersed AlN particles also play a positive role in the wear resistance of surfacing alloy. When nano-Y
2O
3 is not added to the surfacing alloy, the amount of AlN precipitation is less, so that the wear resistance can not be effectively exerted. When an appropriate amount of nano-Y
2O
3 is added to the surfacing alloy, the amount of AlN precipitates is large, the hard phase is evenly distributed and the interval between them is small, which makes the abrasive unable to continuously cut the matrix, thus obtaining higher wear resistance.
