Introduction
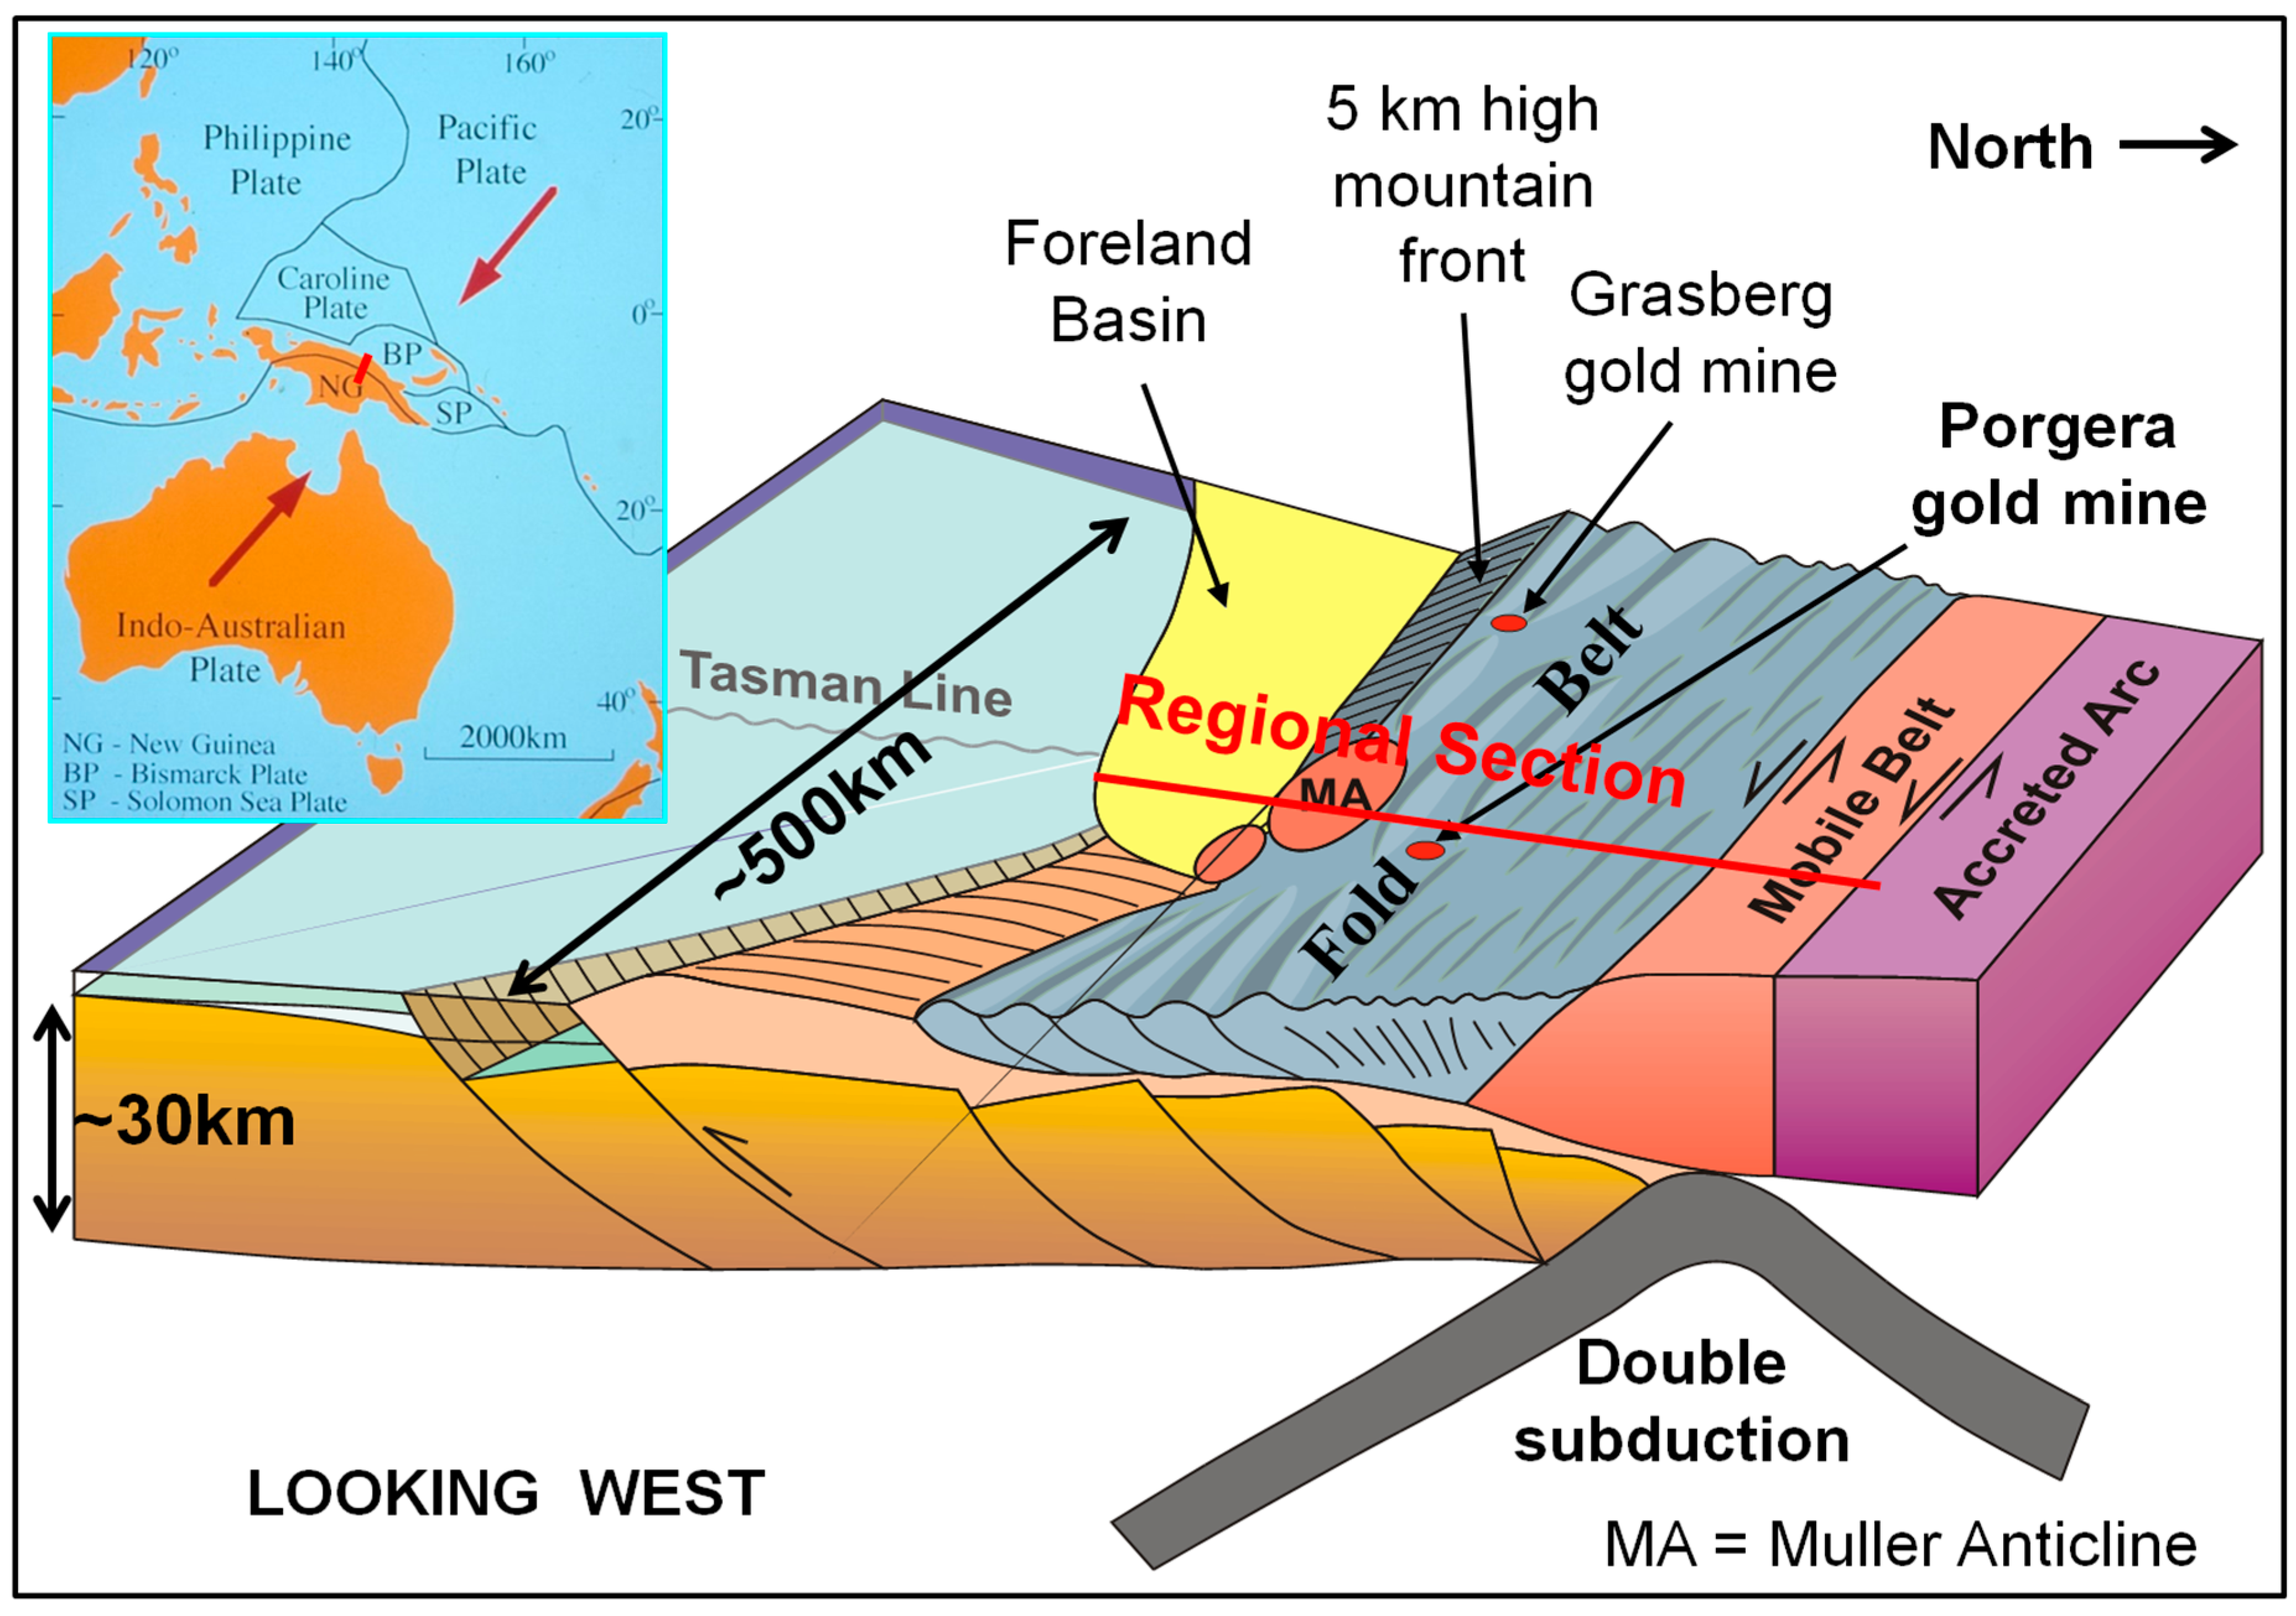
The island of New Guinea lies along the northern margin of the Indo-Australian plate where it is undergoing oblique convergence with the Pacific Plate (
Figure 1 inset). Southern New Guinea comprises relatively undeformed Australian crust that is bowed down in the west to form a foreland basin in front of the Fold Belt mountains (Hill & Hall 2003). The Fold Belt comprises a broad zone of folded and thrust Jurassic-Pliocene sediments that were deposited along the northern Australian margin. It is underlain by extensional faults formed during Jurassic rifting some of which were reactivated during the Late Miocene to Pliocene compression (
Figure 1). The Fold Belt is bound to the north by a Mobile Belt (shown very schematically on
Figure 1) comprising distal sediments, ophiolites, igneous and metamorphic rocks. It is bound to the north by the Paleogene Melanesian arc that collided in the Middle Miocene causing orogenesis of the margin.
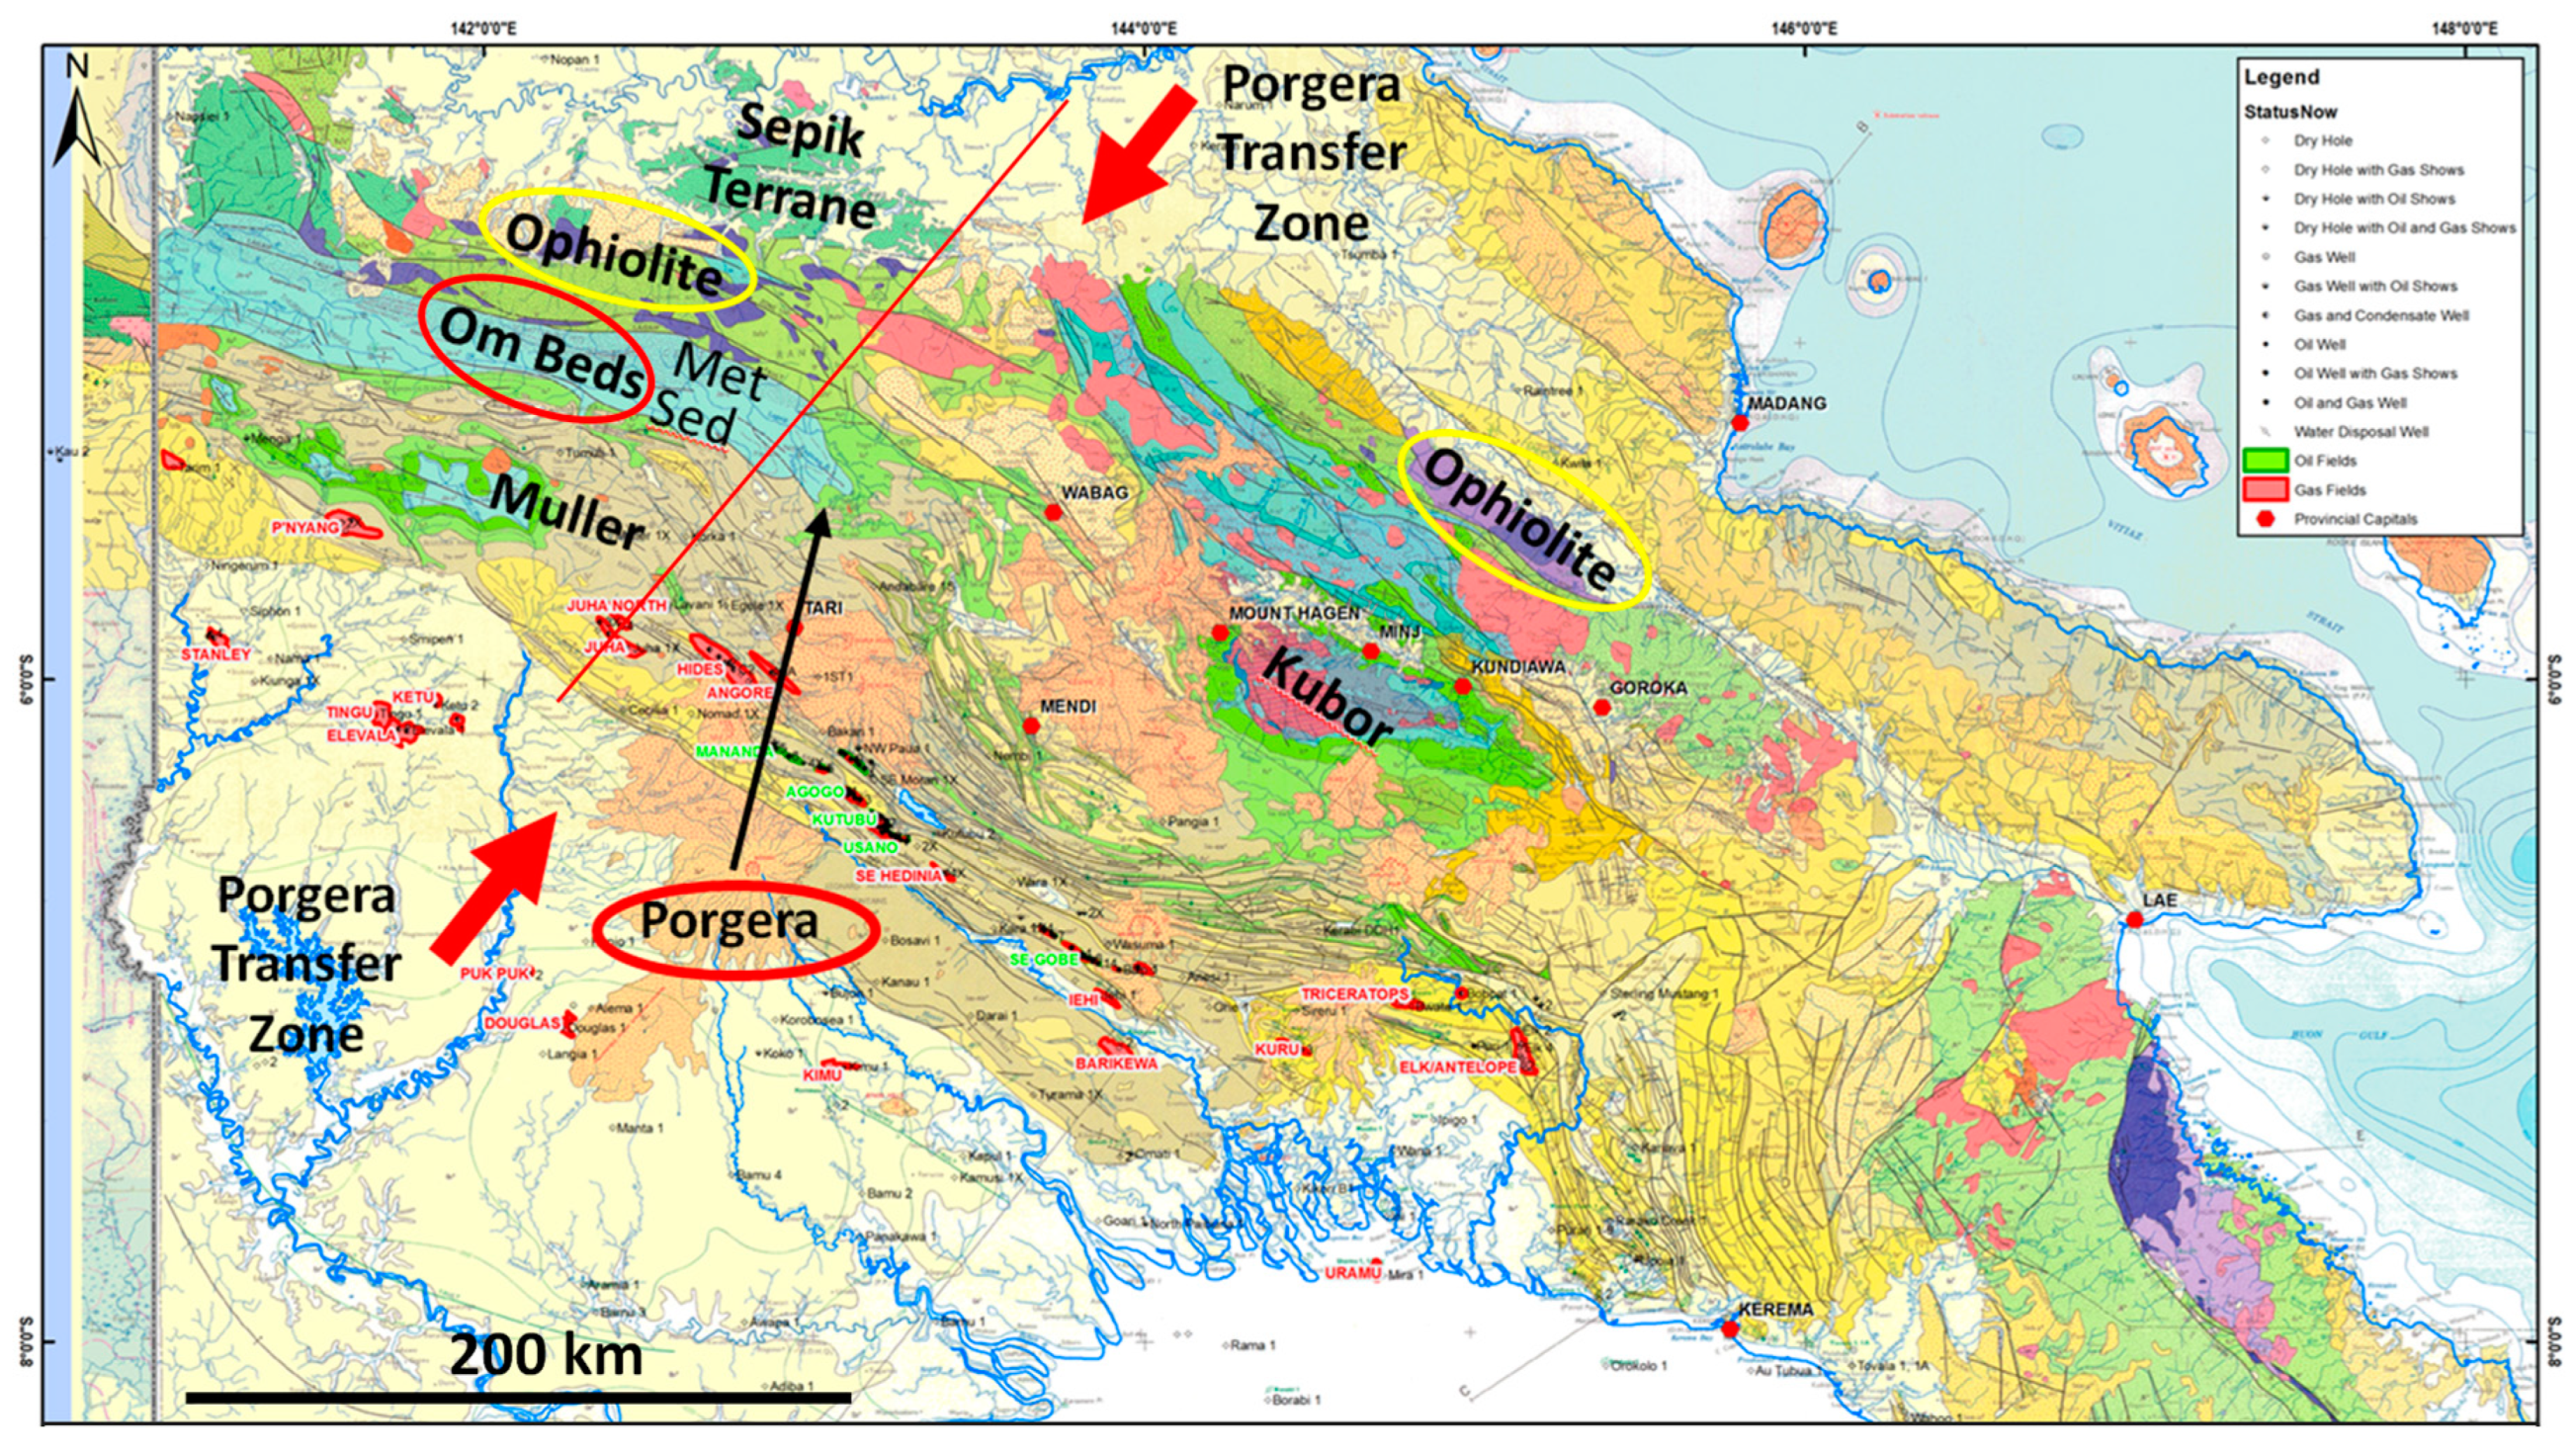
Hill & Hall (2003) considered that the margin underwent extension and rifting in the Early to Middle Jurassic leading to Late Jurassic breakup and passive margin subsidence in the Early Cretaceous. Renewed Late Cretaceous rifting led to a second period of breakup in the latest Cretaceous leading to drifting away of the Sepik Terrane (Zahirovic et al. 2014). The Eocene onset of rapid northward movement of the Australian Plate caused the Sepik terrane to dock with northern PNG in the Oligocene (Crowhurst et al. 1996; see location on
Figure 2) inverting parts of the PNG margin (Mahoney et al. 2019) prior to Early Miocene extension and subsidence. The ongoing rapid northward movement of the Australian Plate generated subduction to the north remote from New Guinea creating the Melanesian island arc that collided obliquely with PNG in the Middle Miocene causing Late Miocene to Present orogenesis and compression.
Along the PNG margin in the Middle Miocene there was substantial volcanism associated with emplacement of the Maramuni Arc above the southward-subducting slab shown in
Figure 1 (Hill & Hall 2003). However, this volcanism declined significantly with the onset of compression in the Late Miocene. Traversing the Fold Belt there are some lines of volcanoes, such as the Bosavi lineament, and Pliocene volcanic stocks that get younger to the south (Davies 1991). Corbett (1994) and Hill et al. (2002) suggested that these lines were controlled by an underlying NNE trending fabric in basement within which there were local reactivated NNE-trending shear zones.
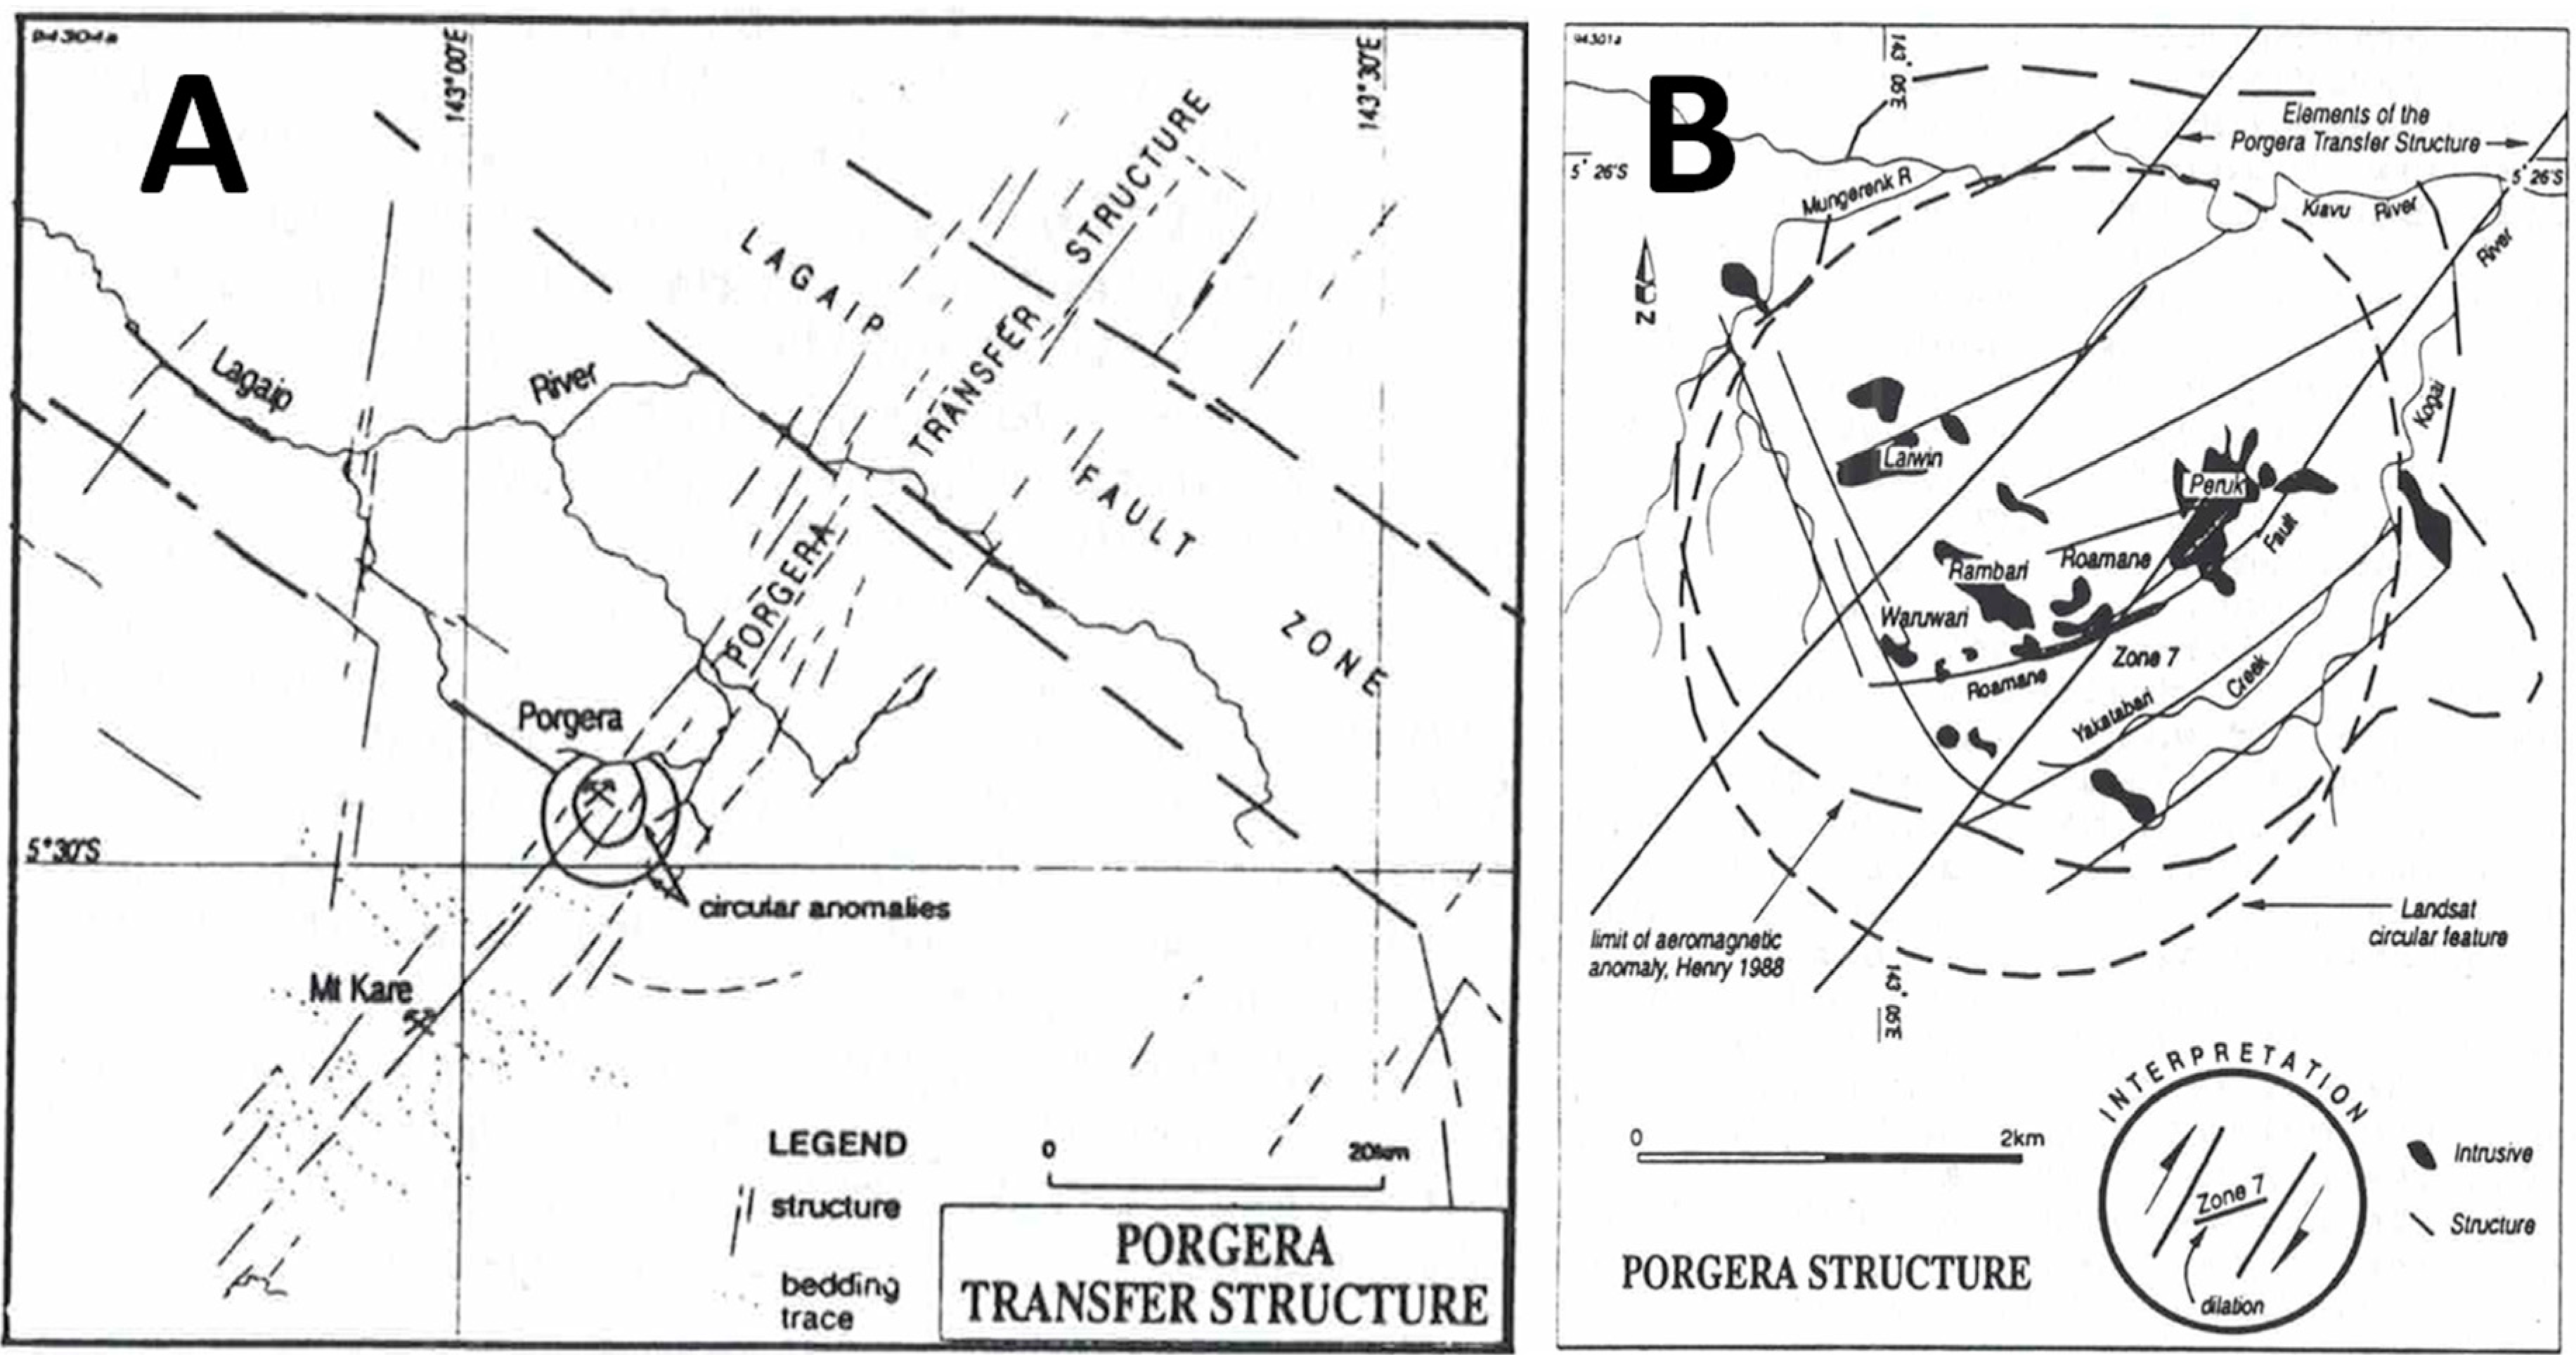
The Porgera Intrusive Complex (PIC) was emplaced at 6.0+-0.3 Ma (Richards & McDougall 1990) along the Porgera Transfer Zone (Corbett 1994) in the northern portion of the PNG Fold Belt (
Figure 2 and
Figure 3). The mesothermal/epithermal gold mineralisation occurs in structurally controlled veins and disseminations which overprint and cross-cut a suite of shallow-level, comagmatic, mafic alkaline stocks and dykes (Richards & McDougall 1990). These are hosted in friable black mudstones of the Chim Formation of uppermost Cretaceous age (Gunson et al. 2000).
Structural Setting
The Porgera Transfer Zone (PTZ) is readily apparent on a geological map (
Figure 2). It coincides with the eastern plunging nose of the basement-cored Muller Anticline and the plunging nose of the Jurassic syn-rift Om beds (
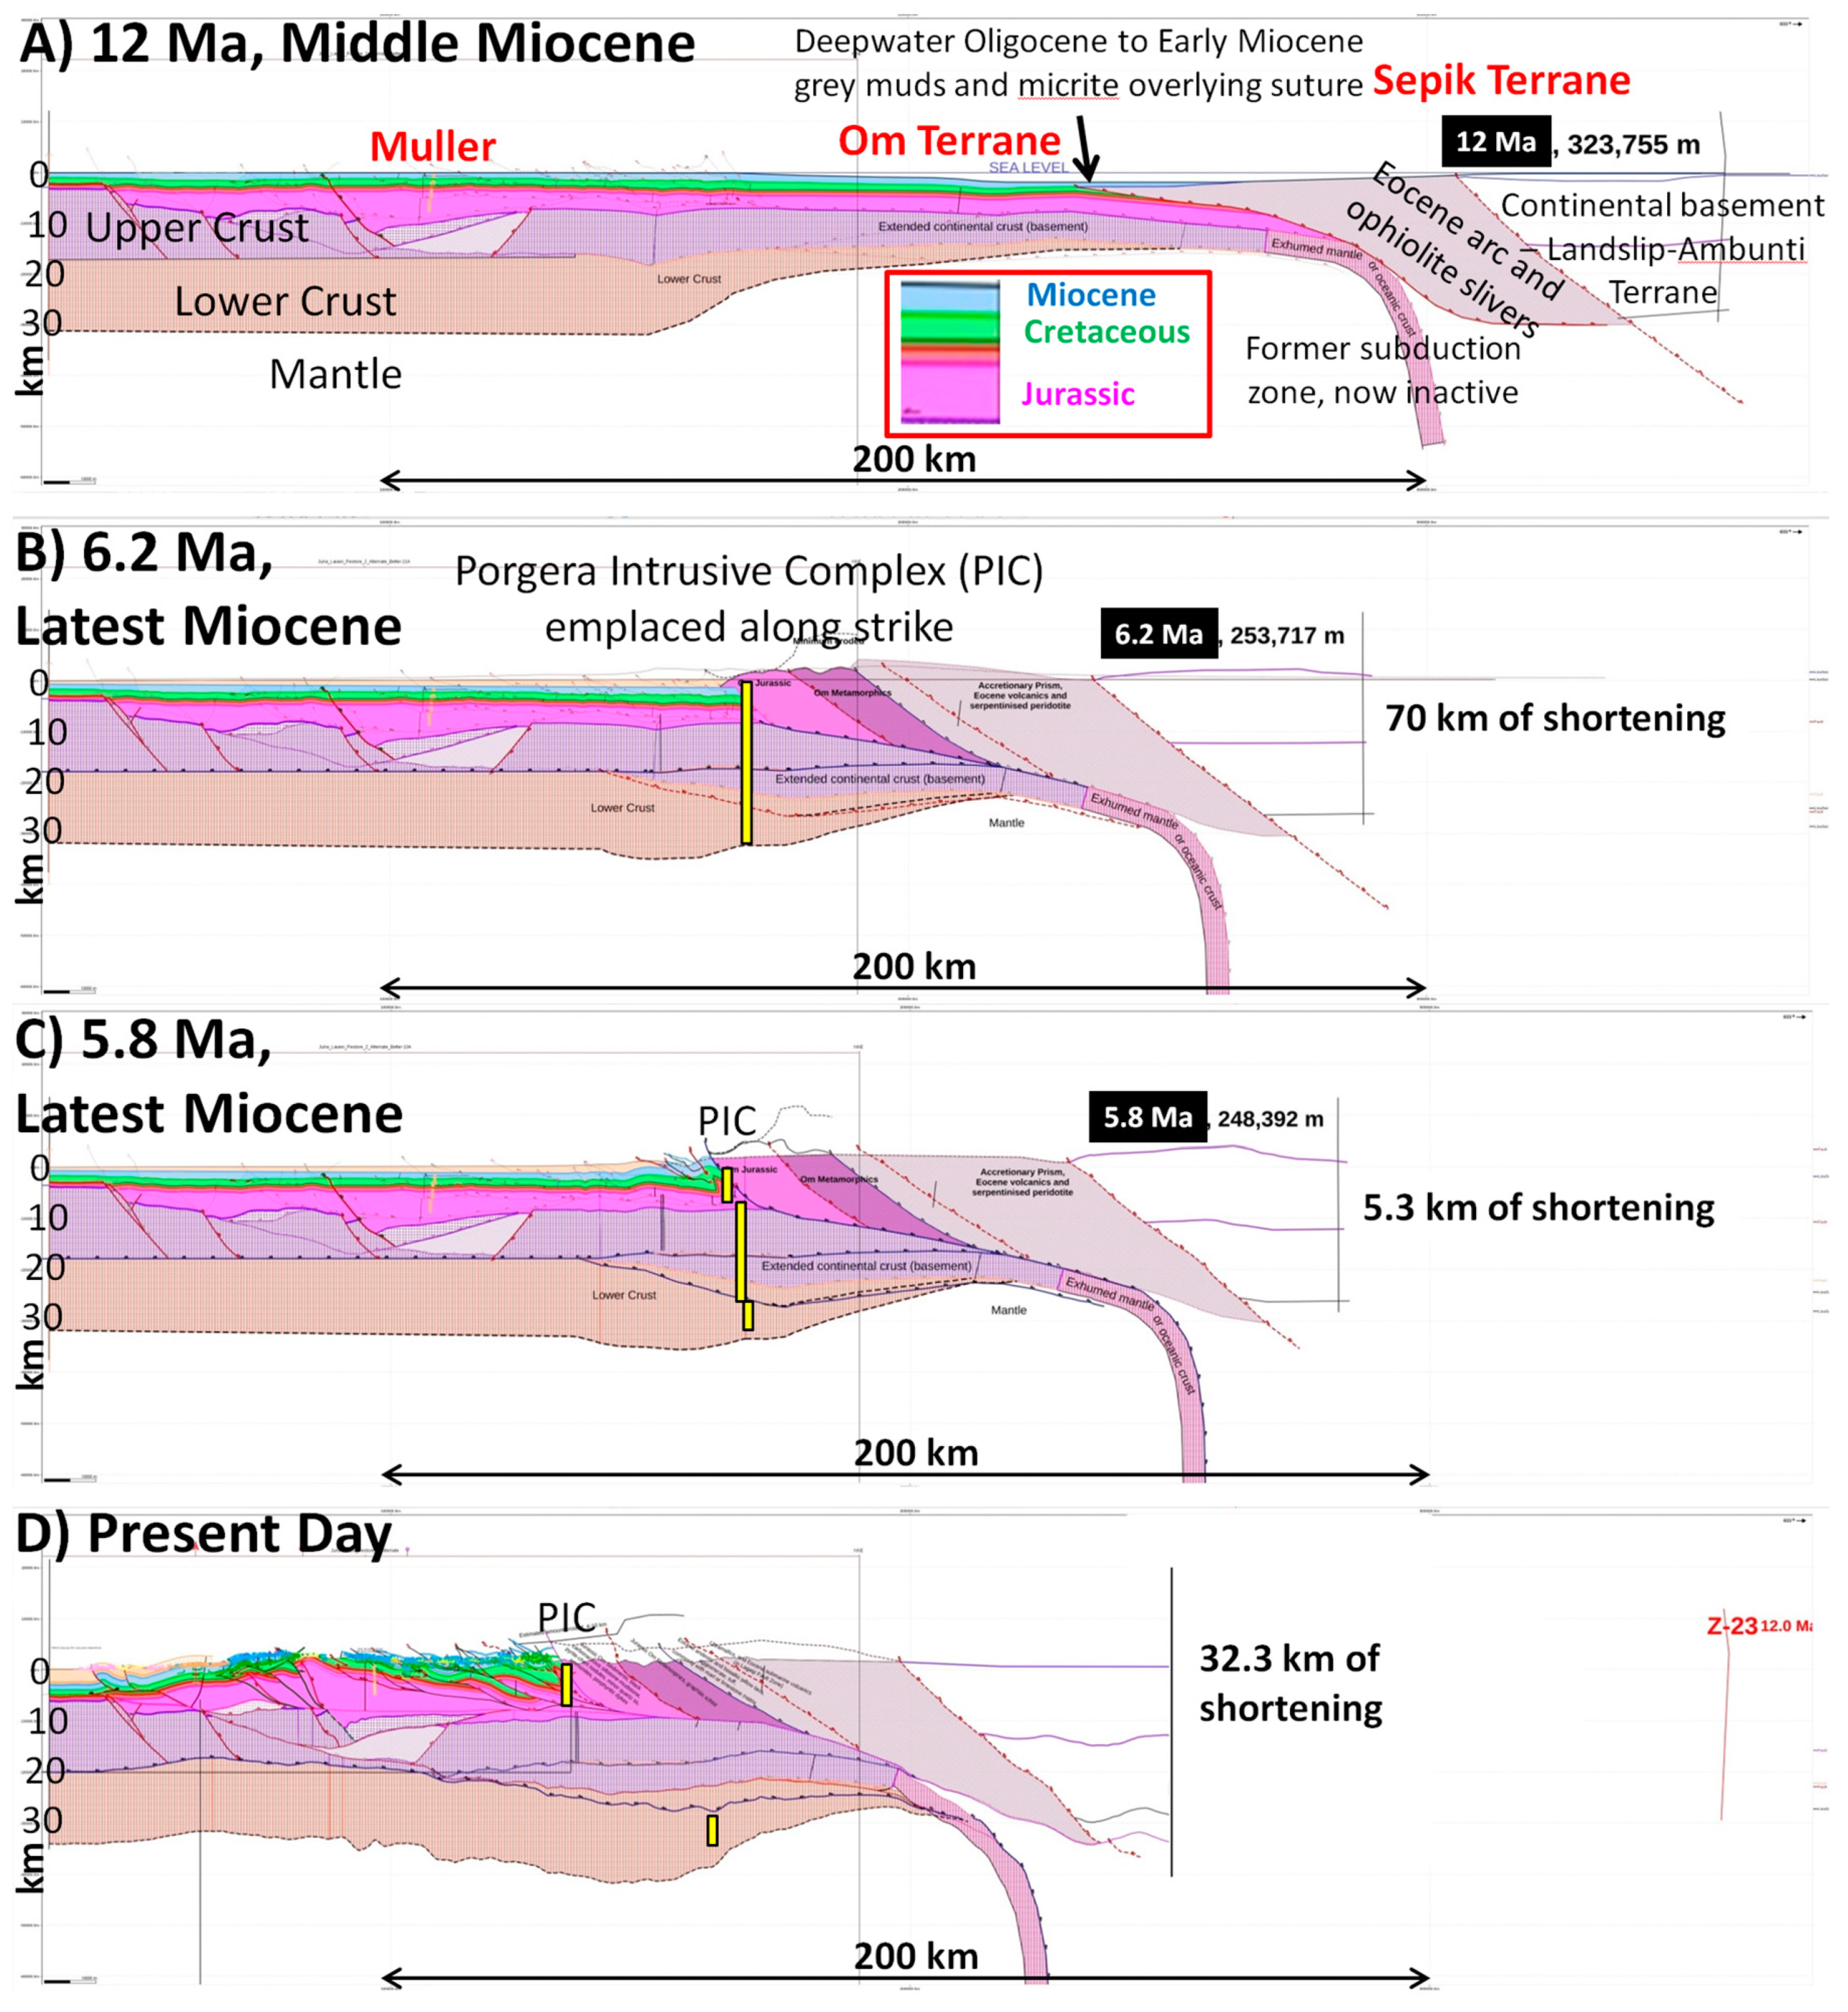
Figure 2). It aligns with the eastern edge of the Sepik Terrane and with a 50 km sinistral offset of the leading edge of the ophiolites (see Hill et al. 2002 for more details). A regional cross section has been constructed from the Juha Anticline at the leading edge of the Fold Belt to the Sepik Terrane and has been balanced and restored (Hill et al. 2020). The section is shown in
Figure 4 and its position is shown on
Figure 1 and
Figure 2, 25 km west of the PTZ and parallel to it.
Section A shows the pre-compression geometry of the margin at ~12 Ma (
Figure 4). The section shows large extensional, rift faults in the Jurassic beneath the Muller Anticline and these probably continue further north but are unproven. The upper and lower crust are interpreted to thin to the north as part of the Jurassic and Cretaceous rifting and break-up processes. The Cretaceous sequence is inferred to be relatively constant in thickness, but there may be extensional faults and growth sequences in the northern region above the thinned crust. The Miocene sequence is also relatively constant in thickness, consistent with regional subsidence of the margin, but it thins to the north where it passes from reefal carbonates into deep-water mudstones. Importantly, some of these muds and micrites are interpreted to lie across the suture between the Ophiolites/Eocene volcanics of the Sepik Terrane and the PNG margin sediments. An inactive subduction zone is shown beneath the Sepik Terrane which is a remnant from when it docked with the PNG margin in the Oligocene. Please note that the crustal thickness is approximate as it is only shown schematically.
Around 12 Ma the Melanesian Arc collided with the northern edge of the Sepik Terrane and shunted it onto the PNG margin (Section B,
Figure 4). There was relatively little shortening within the Sepik Terrane itself, but from 12 Ma to 6.2 Ma there was ~70 km shortening of the PNG margin. This shortening was mainly within the Om Beds, the northern portion of which was substantially uplifted and eroded exposing medium to high-grade metamorphic rocks at the surface. However, there was a similar amount of shortening and thickening of the crust beneath the Om Beds, here shown schematically as a triangle zone in basement. Please note that the PIC was emplaced along strike at ~6 Ma during maximum compression which is problematic (see later). It is here shown schematically as an intrusive from the mantle.
From 6.2 Ma to 5.8 Ma, during emplacement of the PIC, the section was shortened by a further 5.3 km as shown on Section C. The thrusting would have dismembered the igneous pipe that fed the PIC, shown schematically on Section C. From 5.8 Ma to the Present there was a further 32.3 km of shortening within the PNG Fold Belt as shown on section D and in more detail in Hill et al. (2020). The igneous pipe that fed the PIC was probably further dismembered and is not shown in detail here.
A Tectonic Model for Emplacement of the Porgera Intrusive Complex
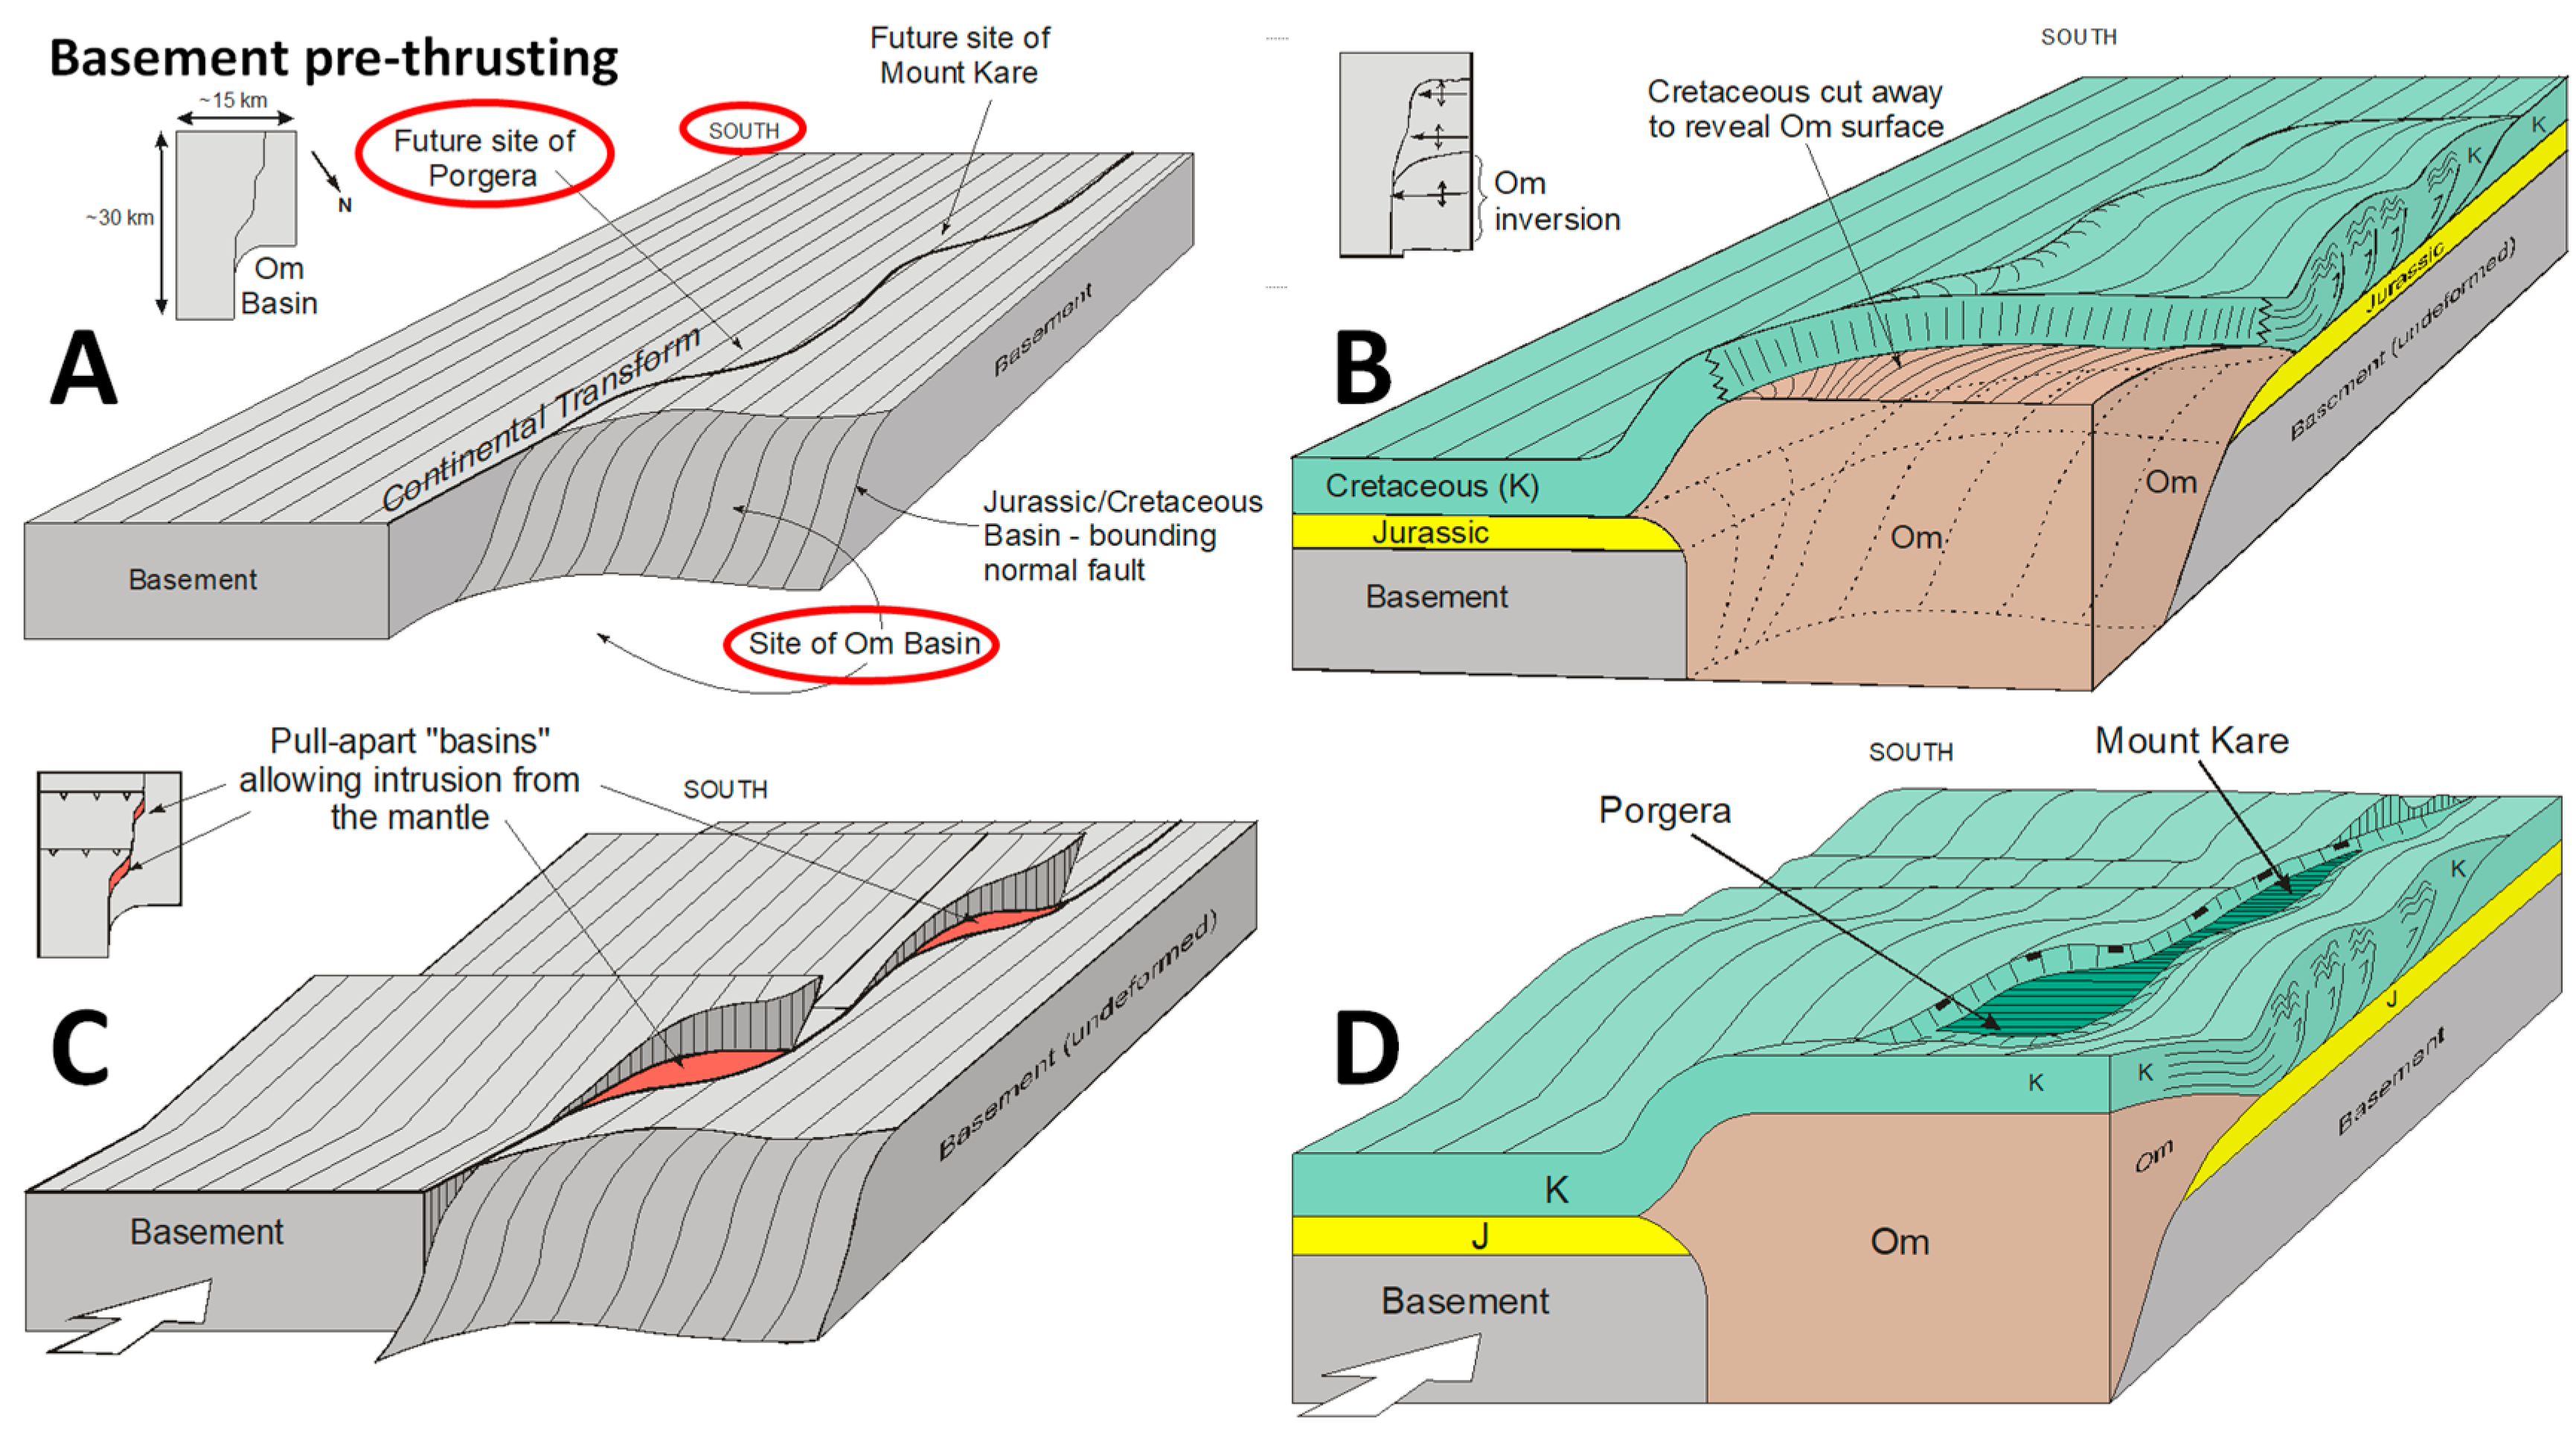
Figure 4 shows that the PIC was emplaced during a time of maximum compression, so a model is needed to provide dilation so that the magma can ascend through the thickening crust. Hill (2004) suggested that this was caused by differential movement across the PTZ, an old basement fault zone that was reactivated (
Figure 5).
Figure 5A shows a 3D view and map of the continental crust (basement) looking to the south across the PTZ. During Jurassic rifting the margin had a step-shape such that there was an embayment with oceanic crust in the Om region adjacent to normal thickness crust to the east, which was a continental promontory. This is similar to the Jurassic oceanic crust of the Argo Abyssal Plain next to the continental promontory of the Exmouth Plateau on todays’ NW Shelf of Australia. The Jurassic, Cretaceous and Paleogene/Miocene sediments were deposited across the margin, with substantial thickening of the Om Beds into the embayment. For simplicity, the Paleogene/Miocene sediments are not shown on
Figure 5B,D.
At the onset of compression in the Middle Miocene it is inferred that the Om beds were inverted causing thin-skinned compression of the Cretaceous and Tertiary sequence to the south as shown on
Figure 5B. Probably at the same time, there was substantial shortening of the continental promontory to the east of the PTZ as shown on
Figure 5C. Small offsets across the PTZ led to the local development of strike-slip pull-apart basins along the PTZ allowing intrusive rocks from the mantle to ascend.
Figure 5D shows the combined effects of B and C. At the same time as folding and thrusting occurred both to the east and west of the PTZ, there was extensional collapse into the local pull-apart basins along it. The rising magma encountered shattered Mesozoic and Tertiary sediments within the collapse grabens and gold was precipitated in the upper most Cretaceous shales at the contact with the Tertiary marls and carbonates.
Testing the Tectonic Model—LIDAR and Cross-Sections
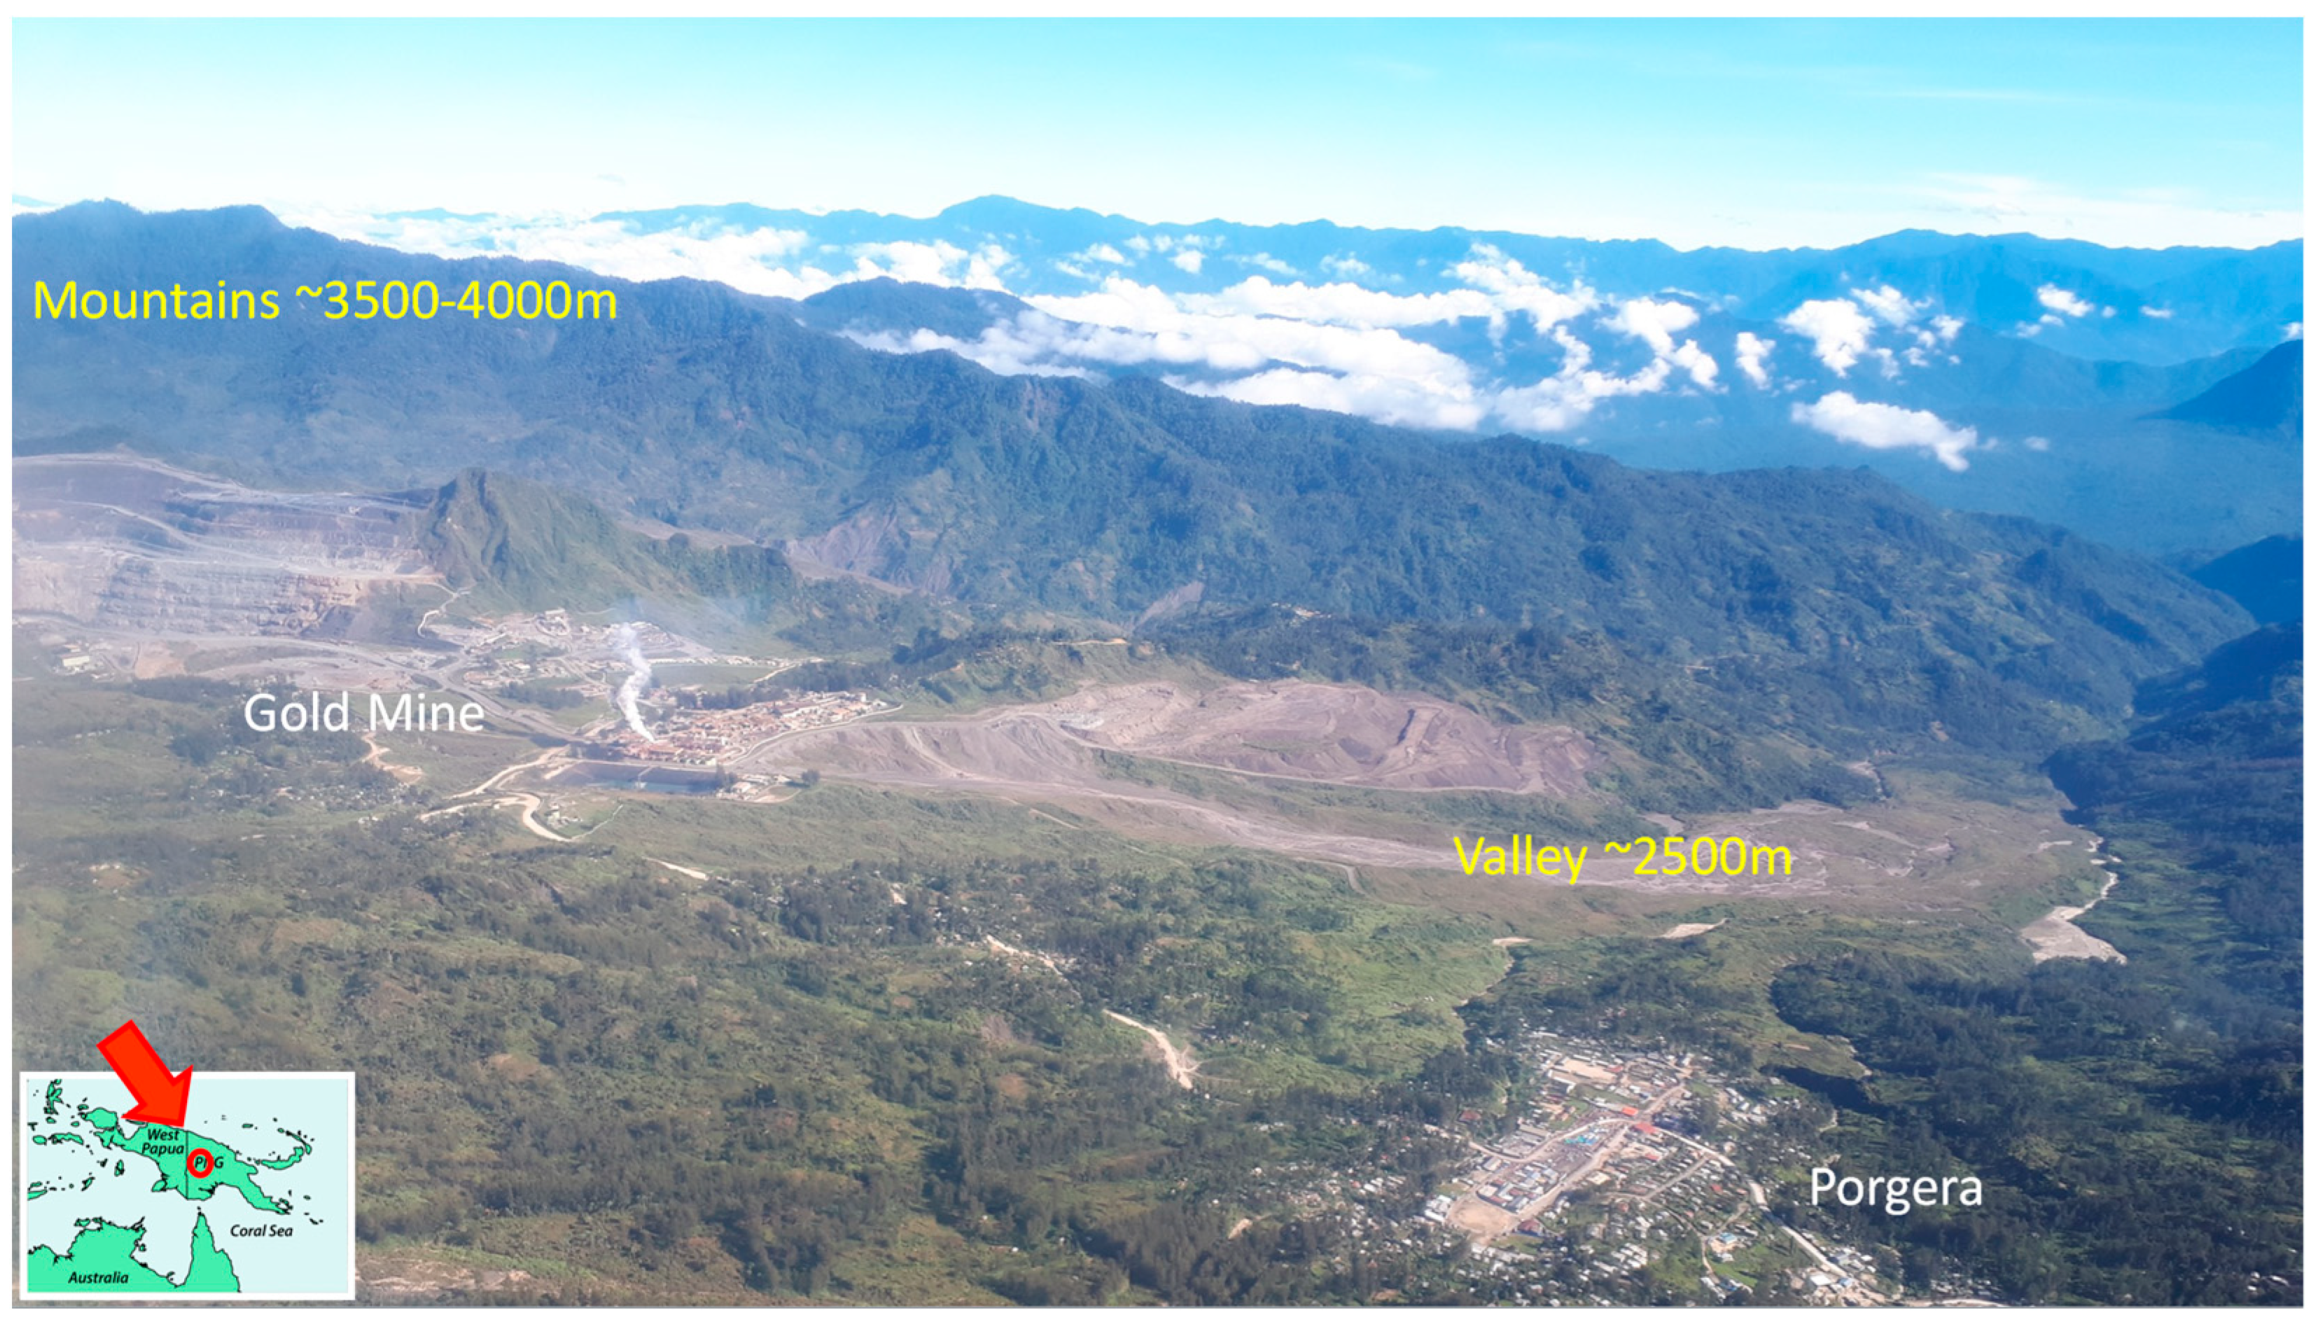
Within the Fold Belt, the Porgera gold mine lies in a valley at an elevation of ~2500m surrounded by mountains at an elevation of 3500m to almost 4000m (
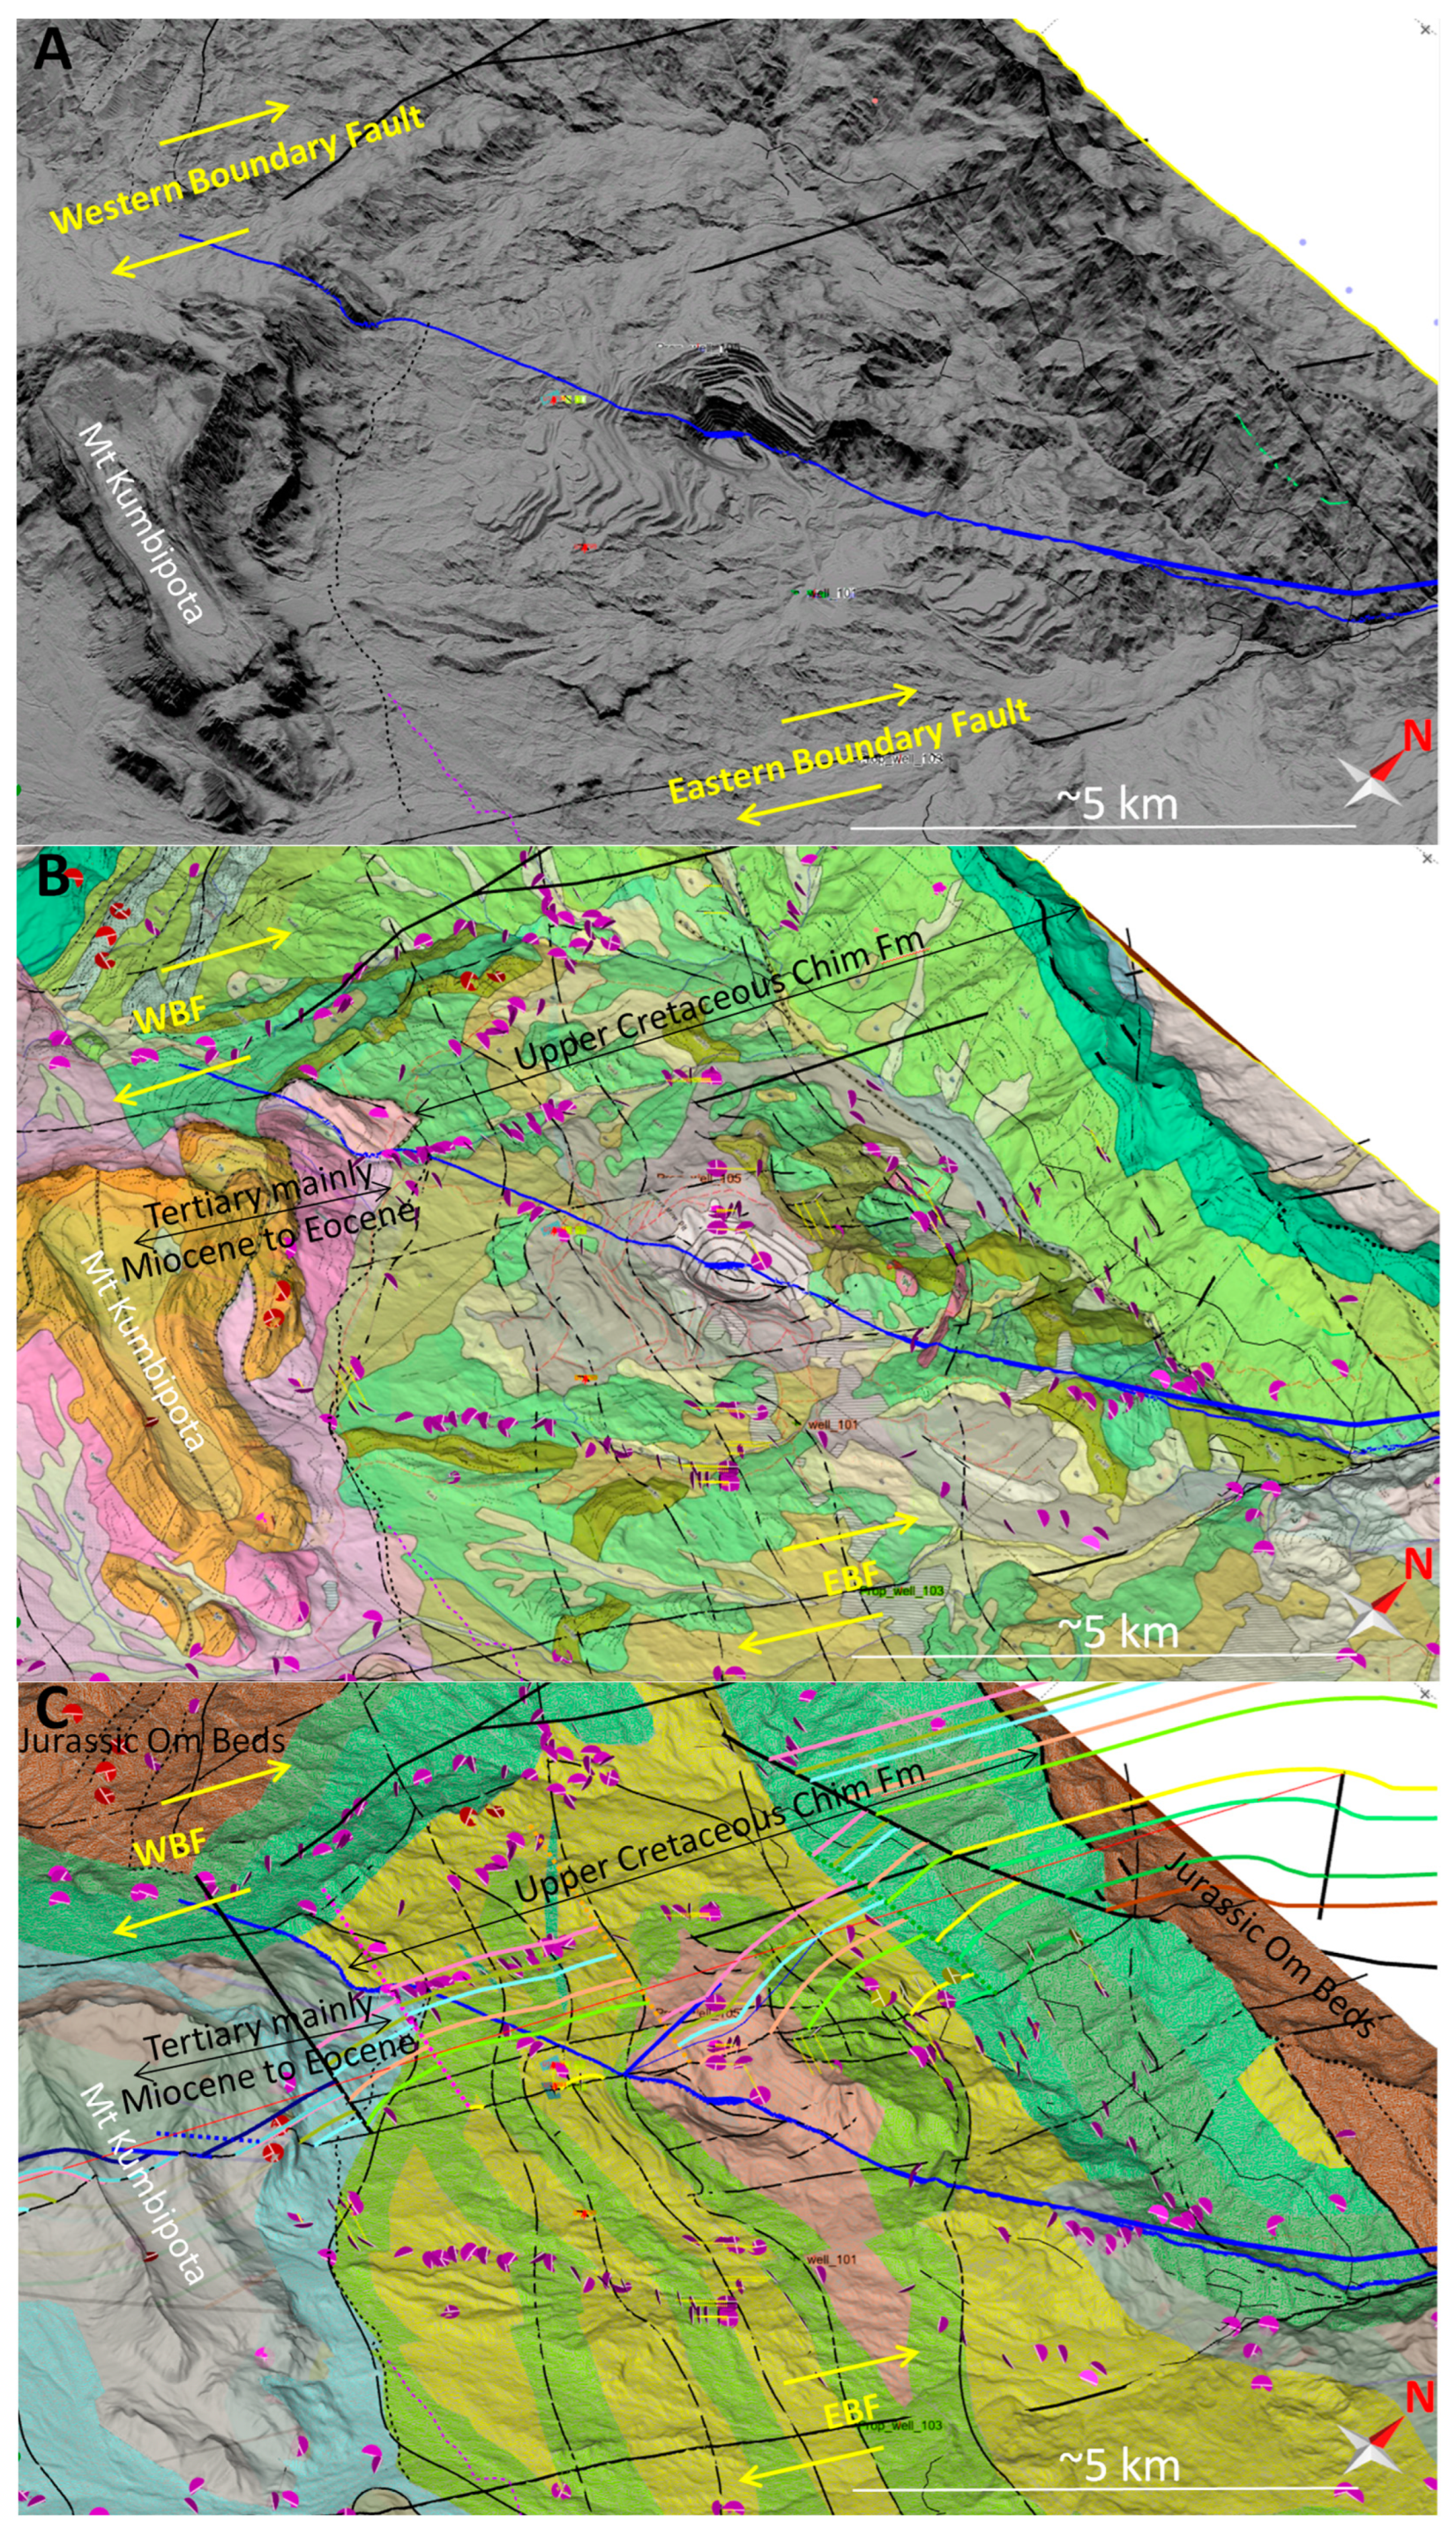
Figure 6). The terrain is mountainous with only one road and is heavily vegetated by either tropical forest or impenetrable, 2-3 metre tall Kunai grass. Outcrop is generally scarce except in the cliffs and some creeks. Around the mine there are many shallow boreholes providing samples and stratigraphic sections (Gunson et al. 1997) but elsewhere relatively few outcrops have been recorded, mainly by Thornton et al. (1996) and Davies (1983). To improve mapping of the area, the Porgera JV acquired high resolution LIDAR data and spectral imaging in a strip continuing for 25 km to the south of the mine (
Figure 7). The resolution on the LIDAR is to less than one metre and the datasets are vast.
The data were entered into Move
TM where the detailed topography could be overlain by geology maps (
Figure 7) or the different spectral grids revealing different types of vegetation and bare rock. By sectioning the surface in the regional dip direction a good estimate of dip could be made in most areas, such as in the Kumbipota Syncline
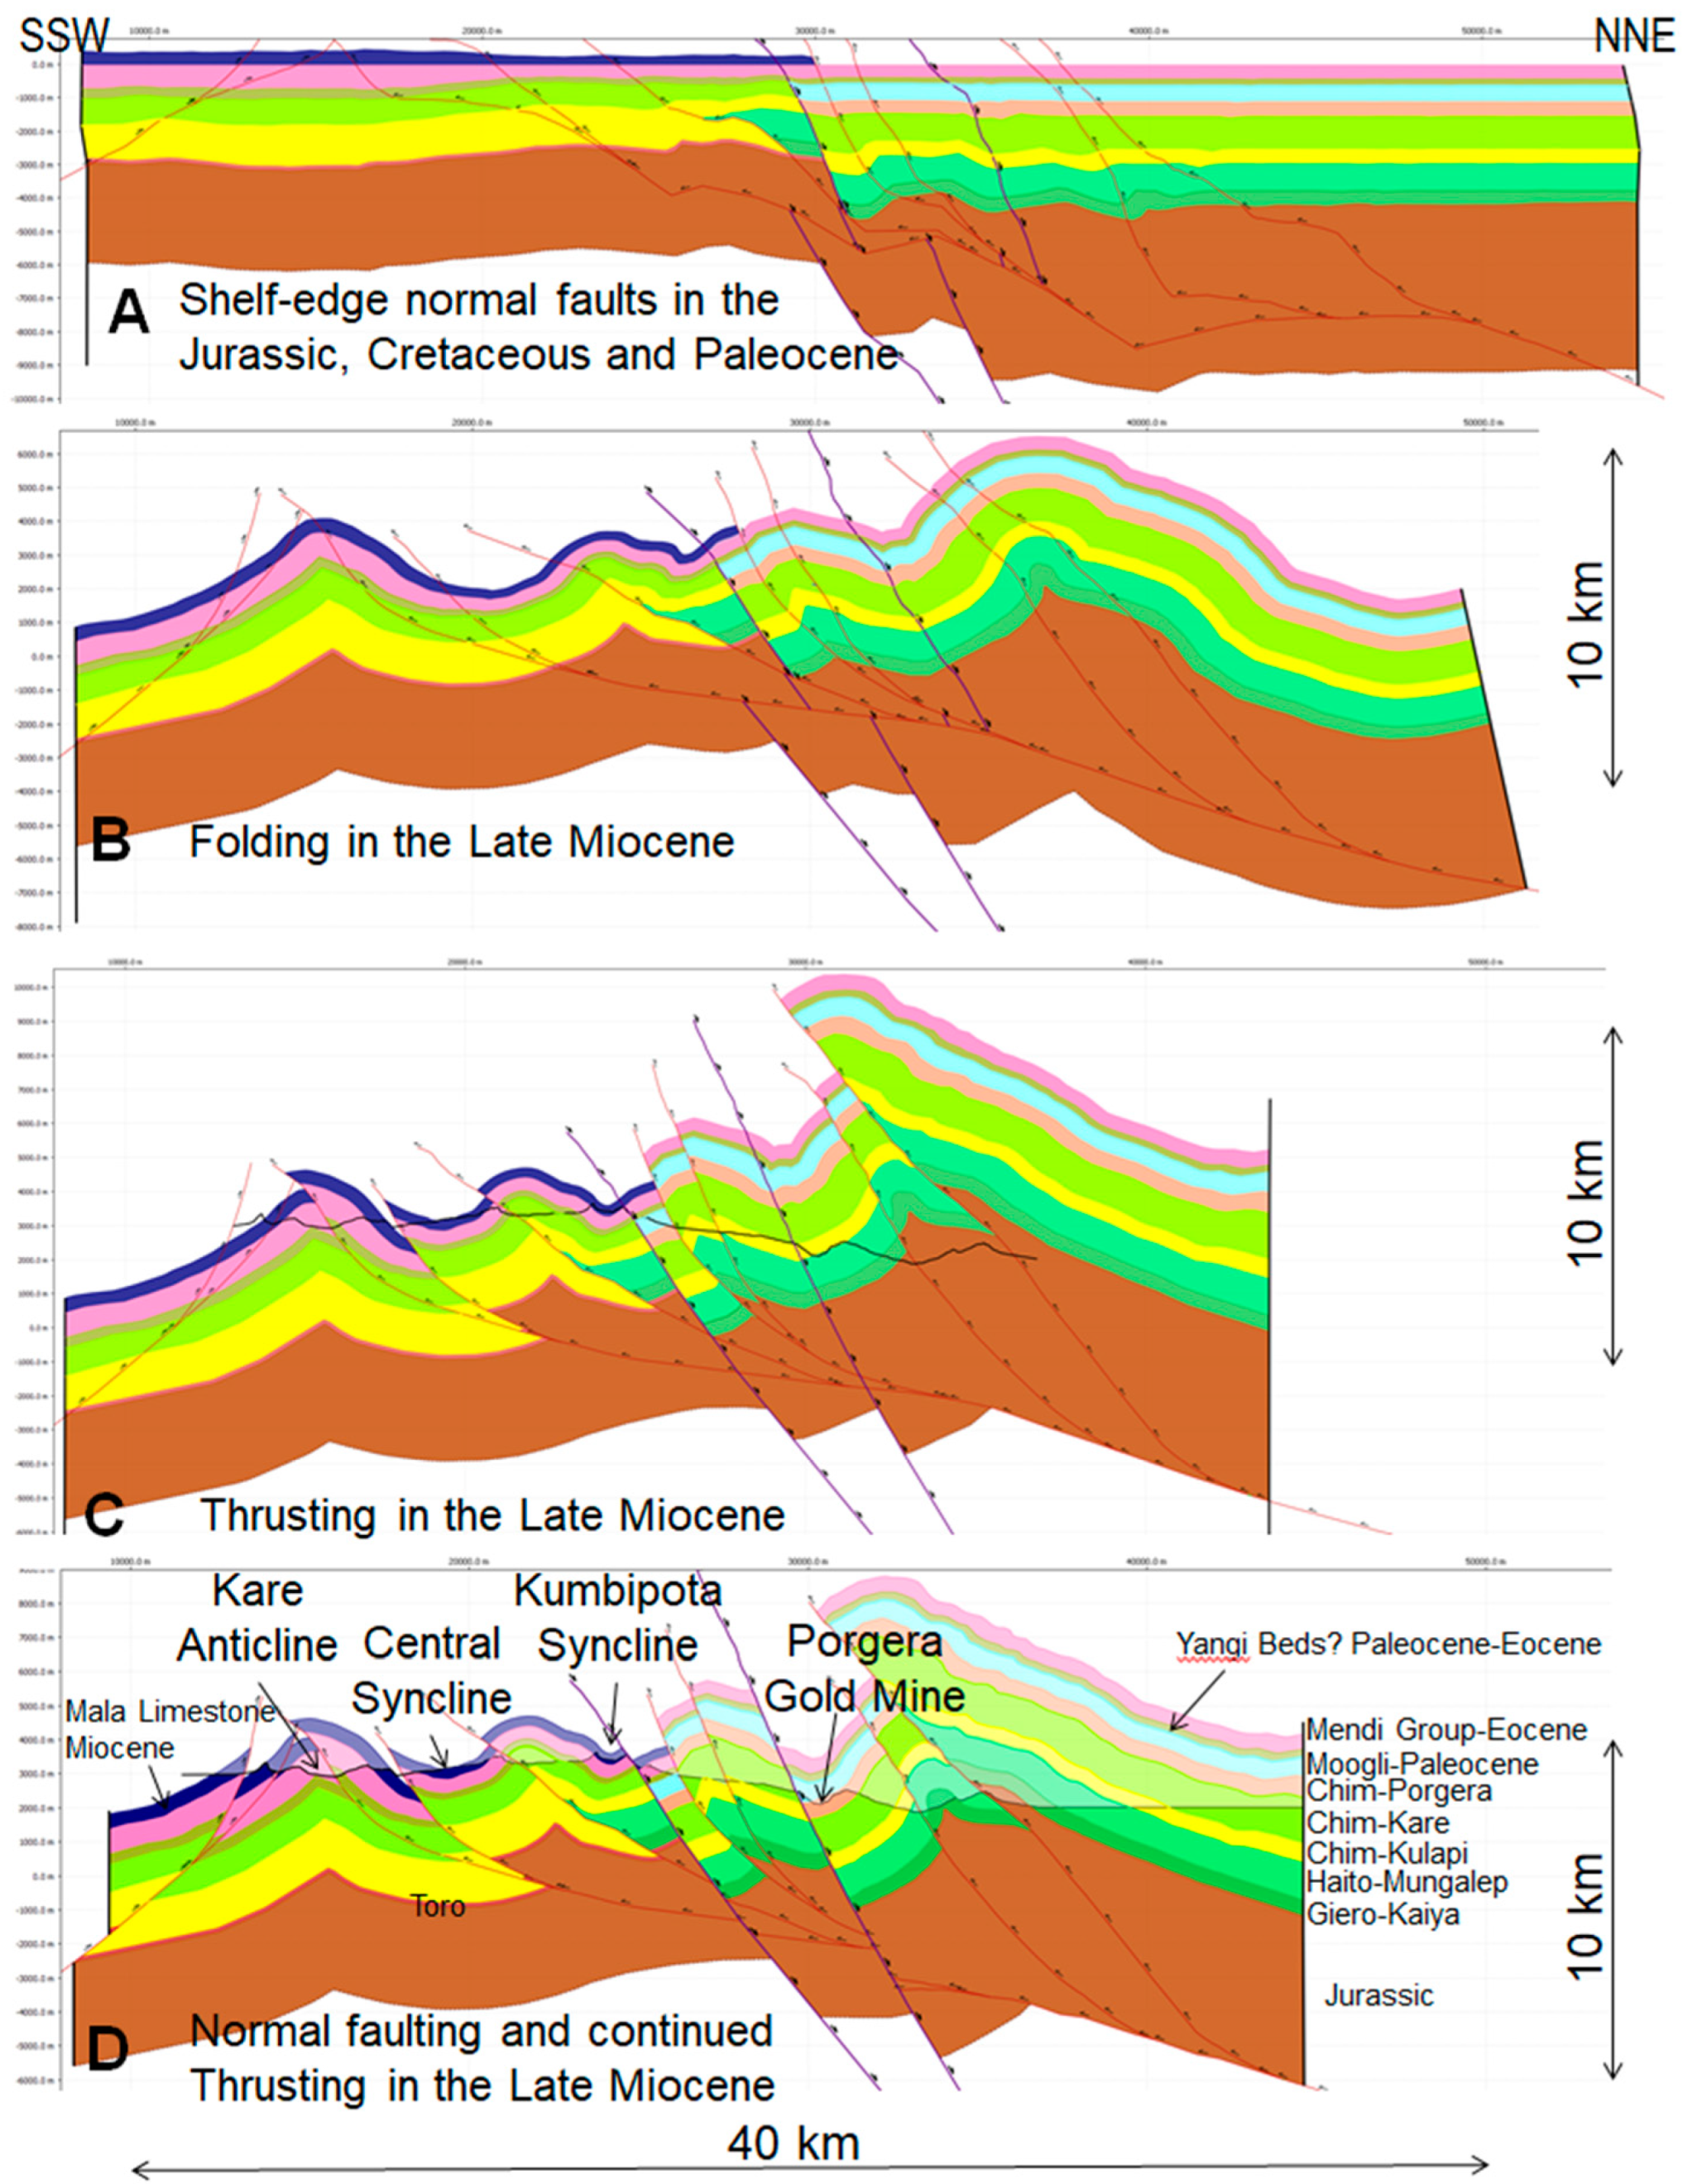
Figure 7A. Using the few surface data points and micro-palaeontological age dates a rough Tertiary and Upper Cretaceous stratigraphy was constructed, guided by the sections from Gunson et al. (1997). This allowed the construction of >100 closely-spaced dip and strike sections across the area including the balanced and restored cross-section shown in
Figure 8. The section presented (
Figure 8D) was constructed by using dips and landforms that were correlated on the LIDAR and is increasingly speculative at depth, in particular the Jurassic section which is schematic.
A key feature of the section is the two normal faults, one through the mine and the other on the NE flank of Mount Kumbipota (
Figure 8D). The latter is a SE continuation of a fault bounding the southern edge of the Jurassic Om Beds (
Figure 2) and may be the basin-bounding fault suggested in
Figure 5A. The fault through the mine is a representation of the Roamane Fault (blue line on
Figure 7) an oblique extensional fault with 1-2 km of extensional offset that hosts most of the gold mineralisation. The remaining faults are listric thrust faults interpreted to detach within the Jurassic section. The section is presented to show the evolution of the structure but was balanced and restored in reverse order using the fault-parallel-flow and simple-shear algorithms in Move
TM. First, the normal faults were restored as well as two small backthrusts in the SW of the section (
Figure 8C). Then the thrust faults were restored (
Figure 8B) and finally the section was unfolded using the fault-bend-fold algorithm (
Figure 8A). The final restored section contains minor kinks and anomalies from the restoration and could be improved, but it illustrates the evolution.
On
Figure 8, section A represents the configuration of the margin in Miocene times pre-deformation. It is unclear if the Miocene Mala Limestone continued to the north, perhaps in a shaley facies, as no Miocene rocks are preserved. The section records growth to the NE in the Paleocene, Cretaceous and Jurassic across the Kumbipota normal fault suggesting that this was a long-lived basin-bounding fault. With the onset of compression in the Late Miocene, the section was folded perhaps involving inversion of the basin bounding faults at depth as suggested on
Figure 5B (
Figure 8B). The section was then cut by thrust-faults with the underlying basin-bounding fault probably acting as a barrier, causing considerable compression and uplift to the north (
Figure 8C). Finally, there was right-lateral movement across the Porgera Transfer opening pull-apart basins as shown in
Figure 5C, with extensional faulting along the Kumbipota and Roamane Faults (
Figure 8D) allowing emplacement of the Porgera Intrusive Complex (not shown). It is likely that stages B, C and D may have overlapped substantially, but they are here shown sequentially for simplicity.
Examining the LIDAR surface on
Figure 7A, it can be seen that the Porgera mine is in a relatively low-lying area bound to the east by the Eastern Boundary Fault (EBF) and to the west by the Western Boundary Fault (WBF). The blue line cutting across the image is the previously interpreted Roamane Fault inferred by Richard & McDougall (1990) and others to be the main zone of mineralization in the mine.
One goal of the study was to examine these areas to see if there was evidence of extensional collapse as predicted in the tectonic model shown in
Figure 5.
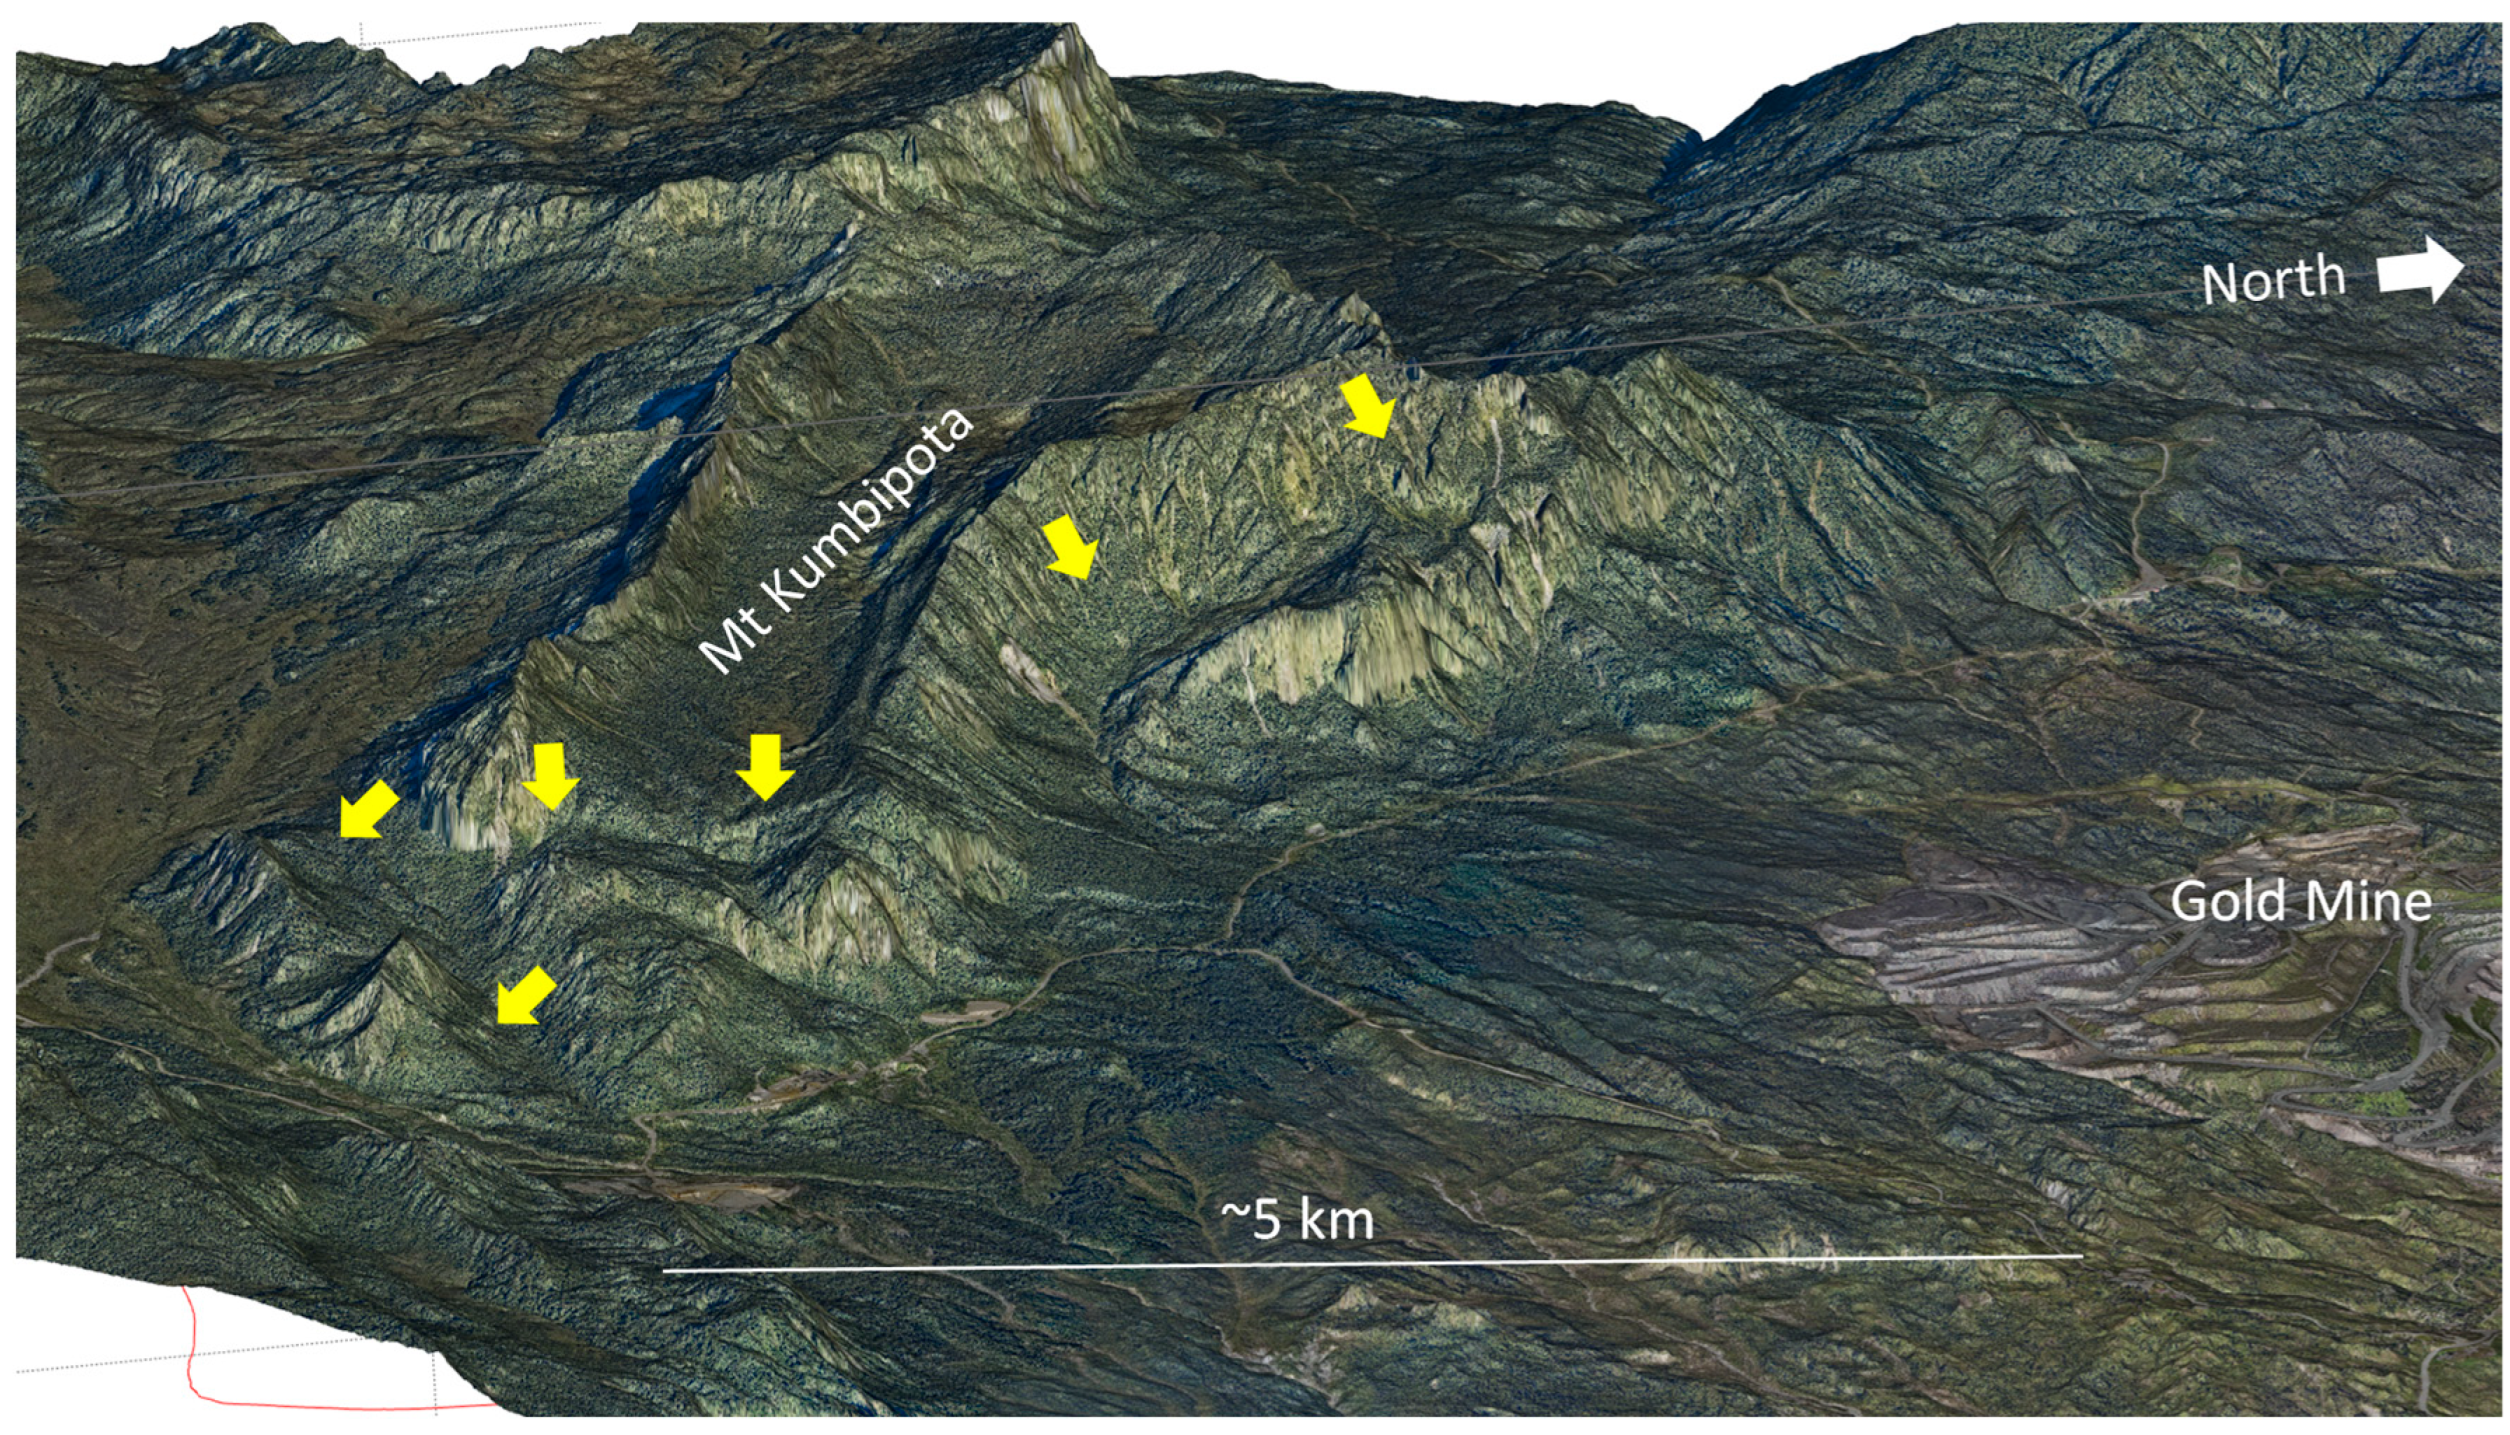
Figure 9 is looking west at the LIDAR data along the north flank of the Mount Kumbipota syncline. Around the Mount many limestone blocks can be seen that appear to have slumped down, as shown by the yellow arrows. These are interpreted to be normal faults that were active during or just after the time of compressional deformation. It is possible to infer more normal faults in the Cretaceous shales in the valleys, but they are less convincing. However, the age-dating from boreholes is consistent with some large normal faults around the mine.
Figure 10 is looking towards the SSW along the Eastern Boundary Fault marked by the valley with a gravel road. The EBF is interpreted to be a dextral strike-slip fault which was consistent with our observations that the anticline and syncline structures were not continuous across the fault. On both sides of the EBF, large normal faults are interpreted within the carbonates such that they slump down towards the EBF as in a rift valley or graben (see yellow arrows on
Figure 10). This suggests that the EBF was a strongly transtensional fault with extensional faulting along it as it moved. The observed normal faults around the mine and along the EBF are both consistent with the tectonic model proposed in
Figure 5 and the section in
Figure 8.
3D Model
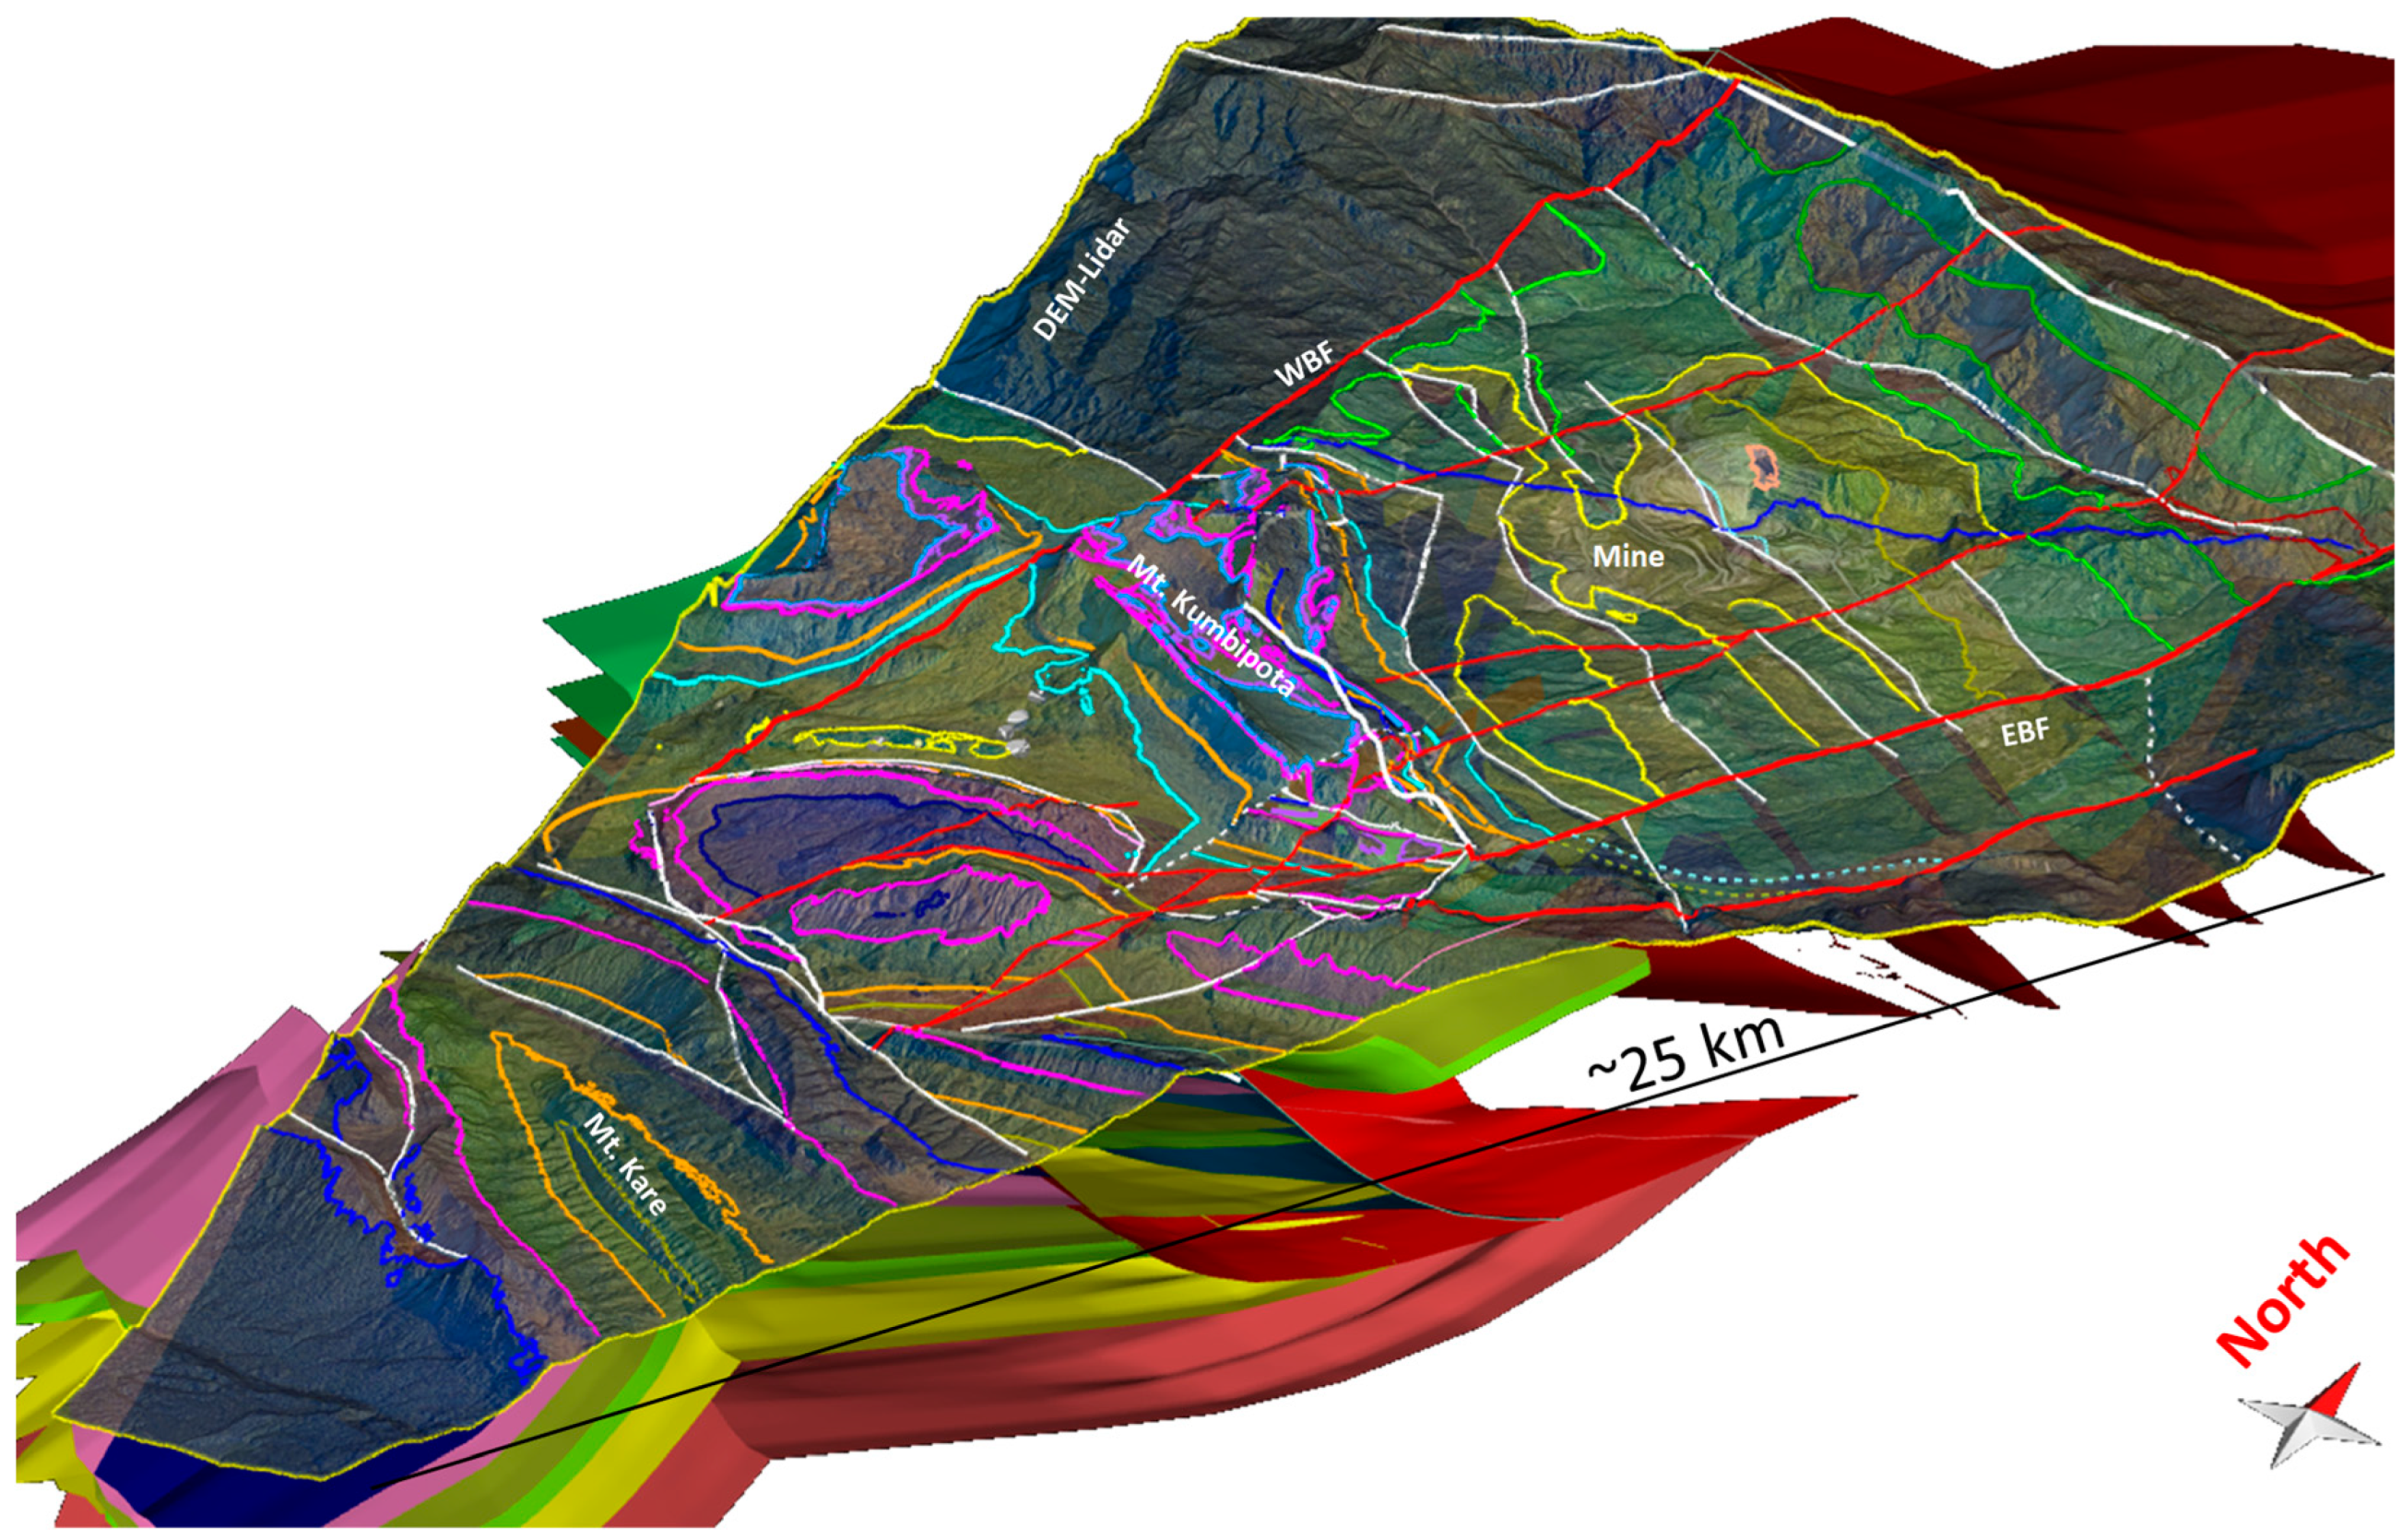
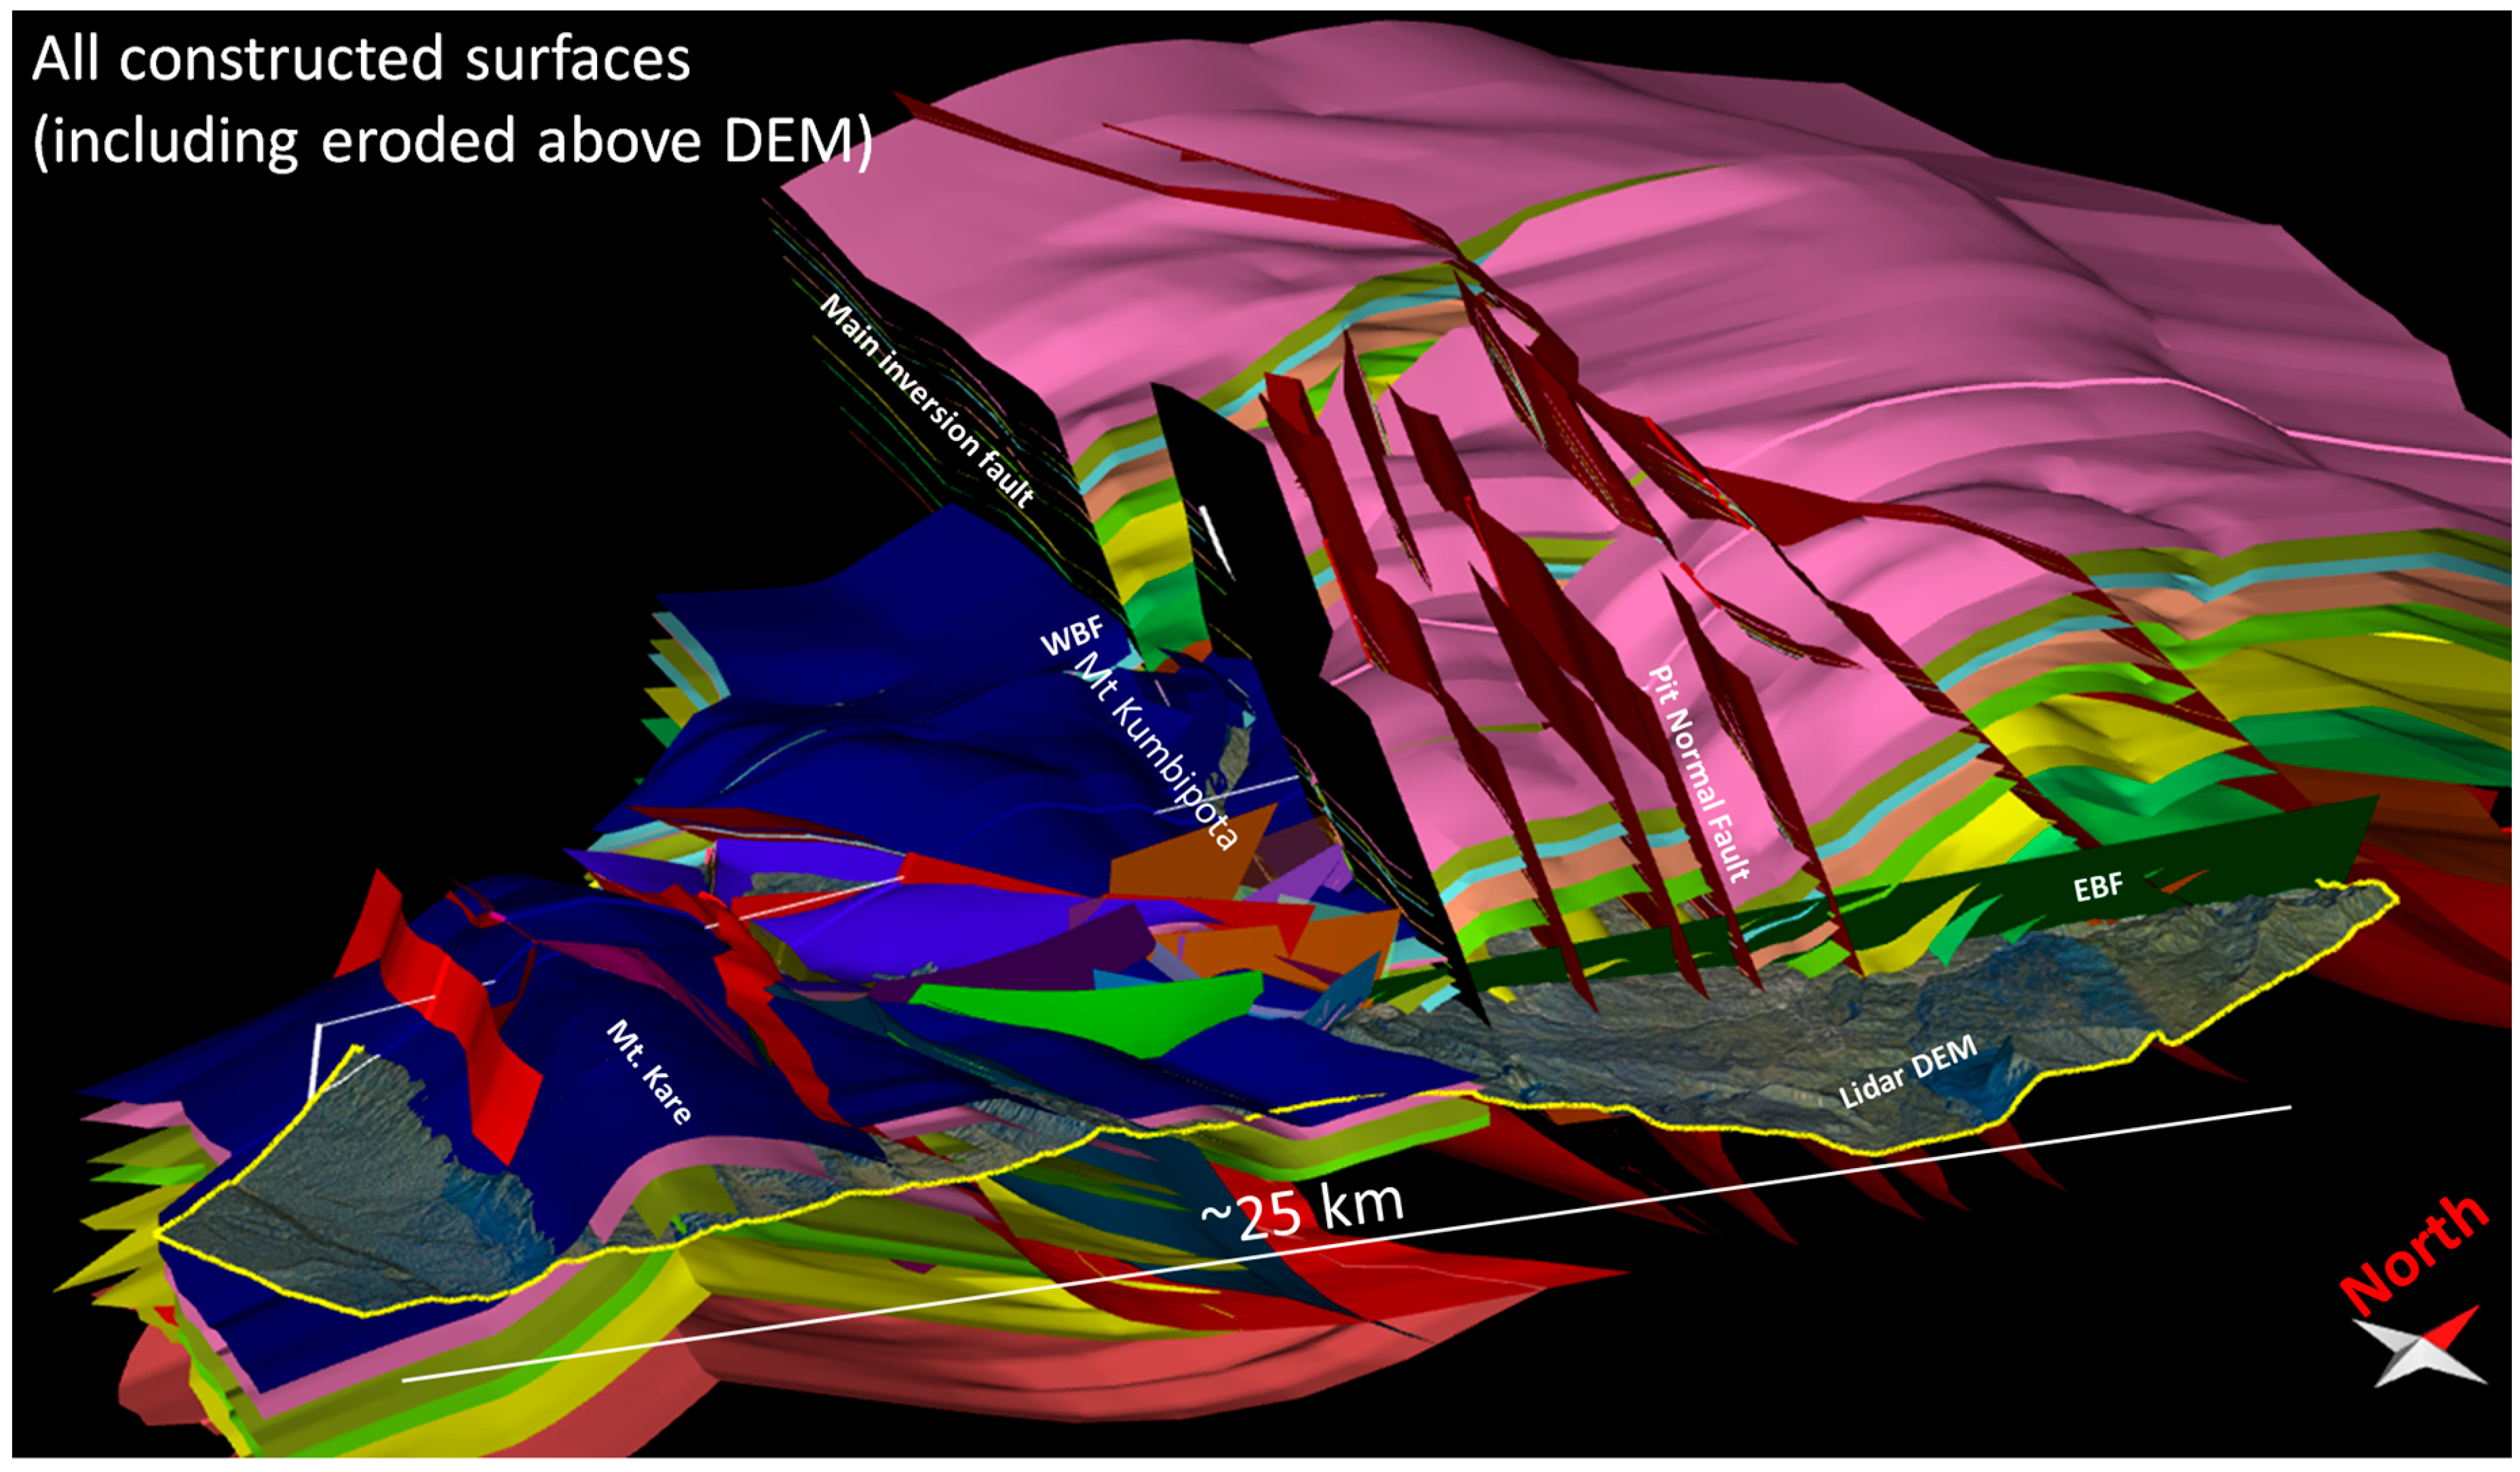
Using the LIDAR data, the field data and micro-palaeontological dating and our inferred stratigraphic section, a 3D structural model of the area was constructed by tying the >100 cross-sections, as shown in
Figure 11 and
Figure 12. In
Figure 12 the faults are shown in red except the EBF shown in green. The model shows all the horizons reconstructed including those eroded above the surface to try to give an understanding of the geology. The pink horizon is interpreted to be the top of the Eocene limestone and is present across the whole model. The yellow and green horizons correspond to members of the Upper Cretaceous Chim Formation.
One standout feature is that the NW corner of the model, above the outcropping Jurassic Om Beds, has been uplifted around 4-5 km and eroded, here interpreted to have occurred along the ‘Main Inversion Fault’ (
Figure 12) that continues to the NE of Mount Kumbipota (
Figure 8). The km-scale uplift is supported by new palynological and thermal data (Tmax/Ro) acquired as part of this study. To the south of the inversion fault, there are numerous low-angle thrust repeats creating anticlines and elevated synclines such as the Mount Kare anticline and Mount Kumbipota syncline. At the western end of the Mount Kumbipota syncline is the Western Boundary Fault (WBF,
Figure 11 and
Figure 12) across which the top Eocene horizon is dropped down significantly on several large normal faults into the mine area. On
Figure 12 the WBF is not shaded in order to allow the bed offset to be seen. At the eastern end of the Mount Kumbipota syncline there is an array of small normal faults in red, brown and green on
Figure 12 that represent those observed in
Figure 10, dropping down into a graben. It was observed that the EBF does not cut the Kare Anticline to the south, such that either displacement dies out to the south or it is transferred to the WBF on splays as can be seen in the complex fault array between Mount Kumbipota and Mount Kare on
Figure 11 and
Figure 12.
Figure 11 shows the 3D model truncated at the ground surface to make a geological map on which the EBF can be seen terminating against the northern flank of the Mount Kare Anticline.
