Submitted:
06 June 2023
Posted:
07 June 2023
You are already at the latest version
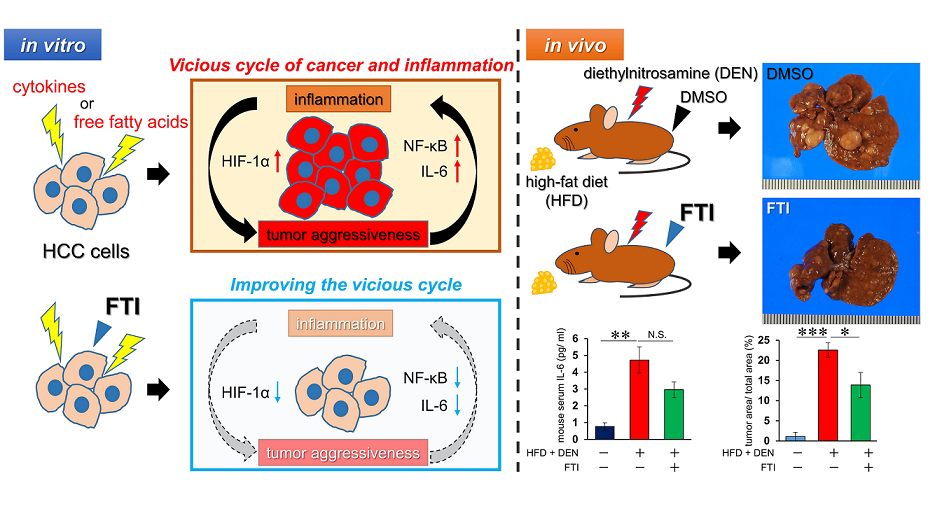
Abstract
Keywords:
1. Introduction
2. Results
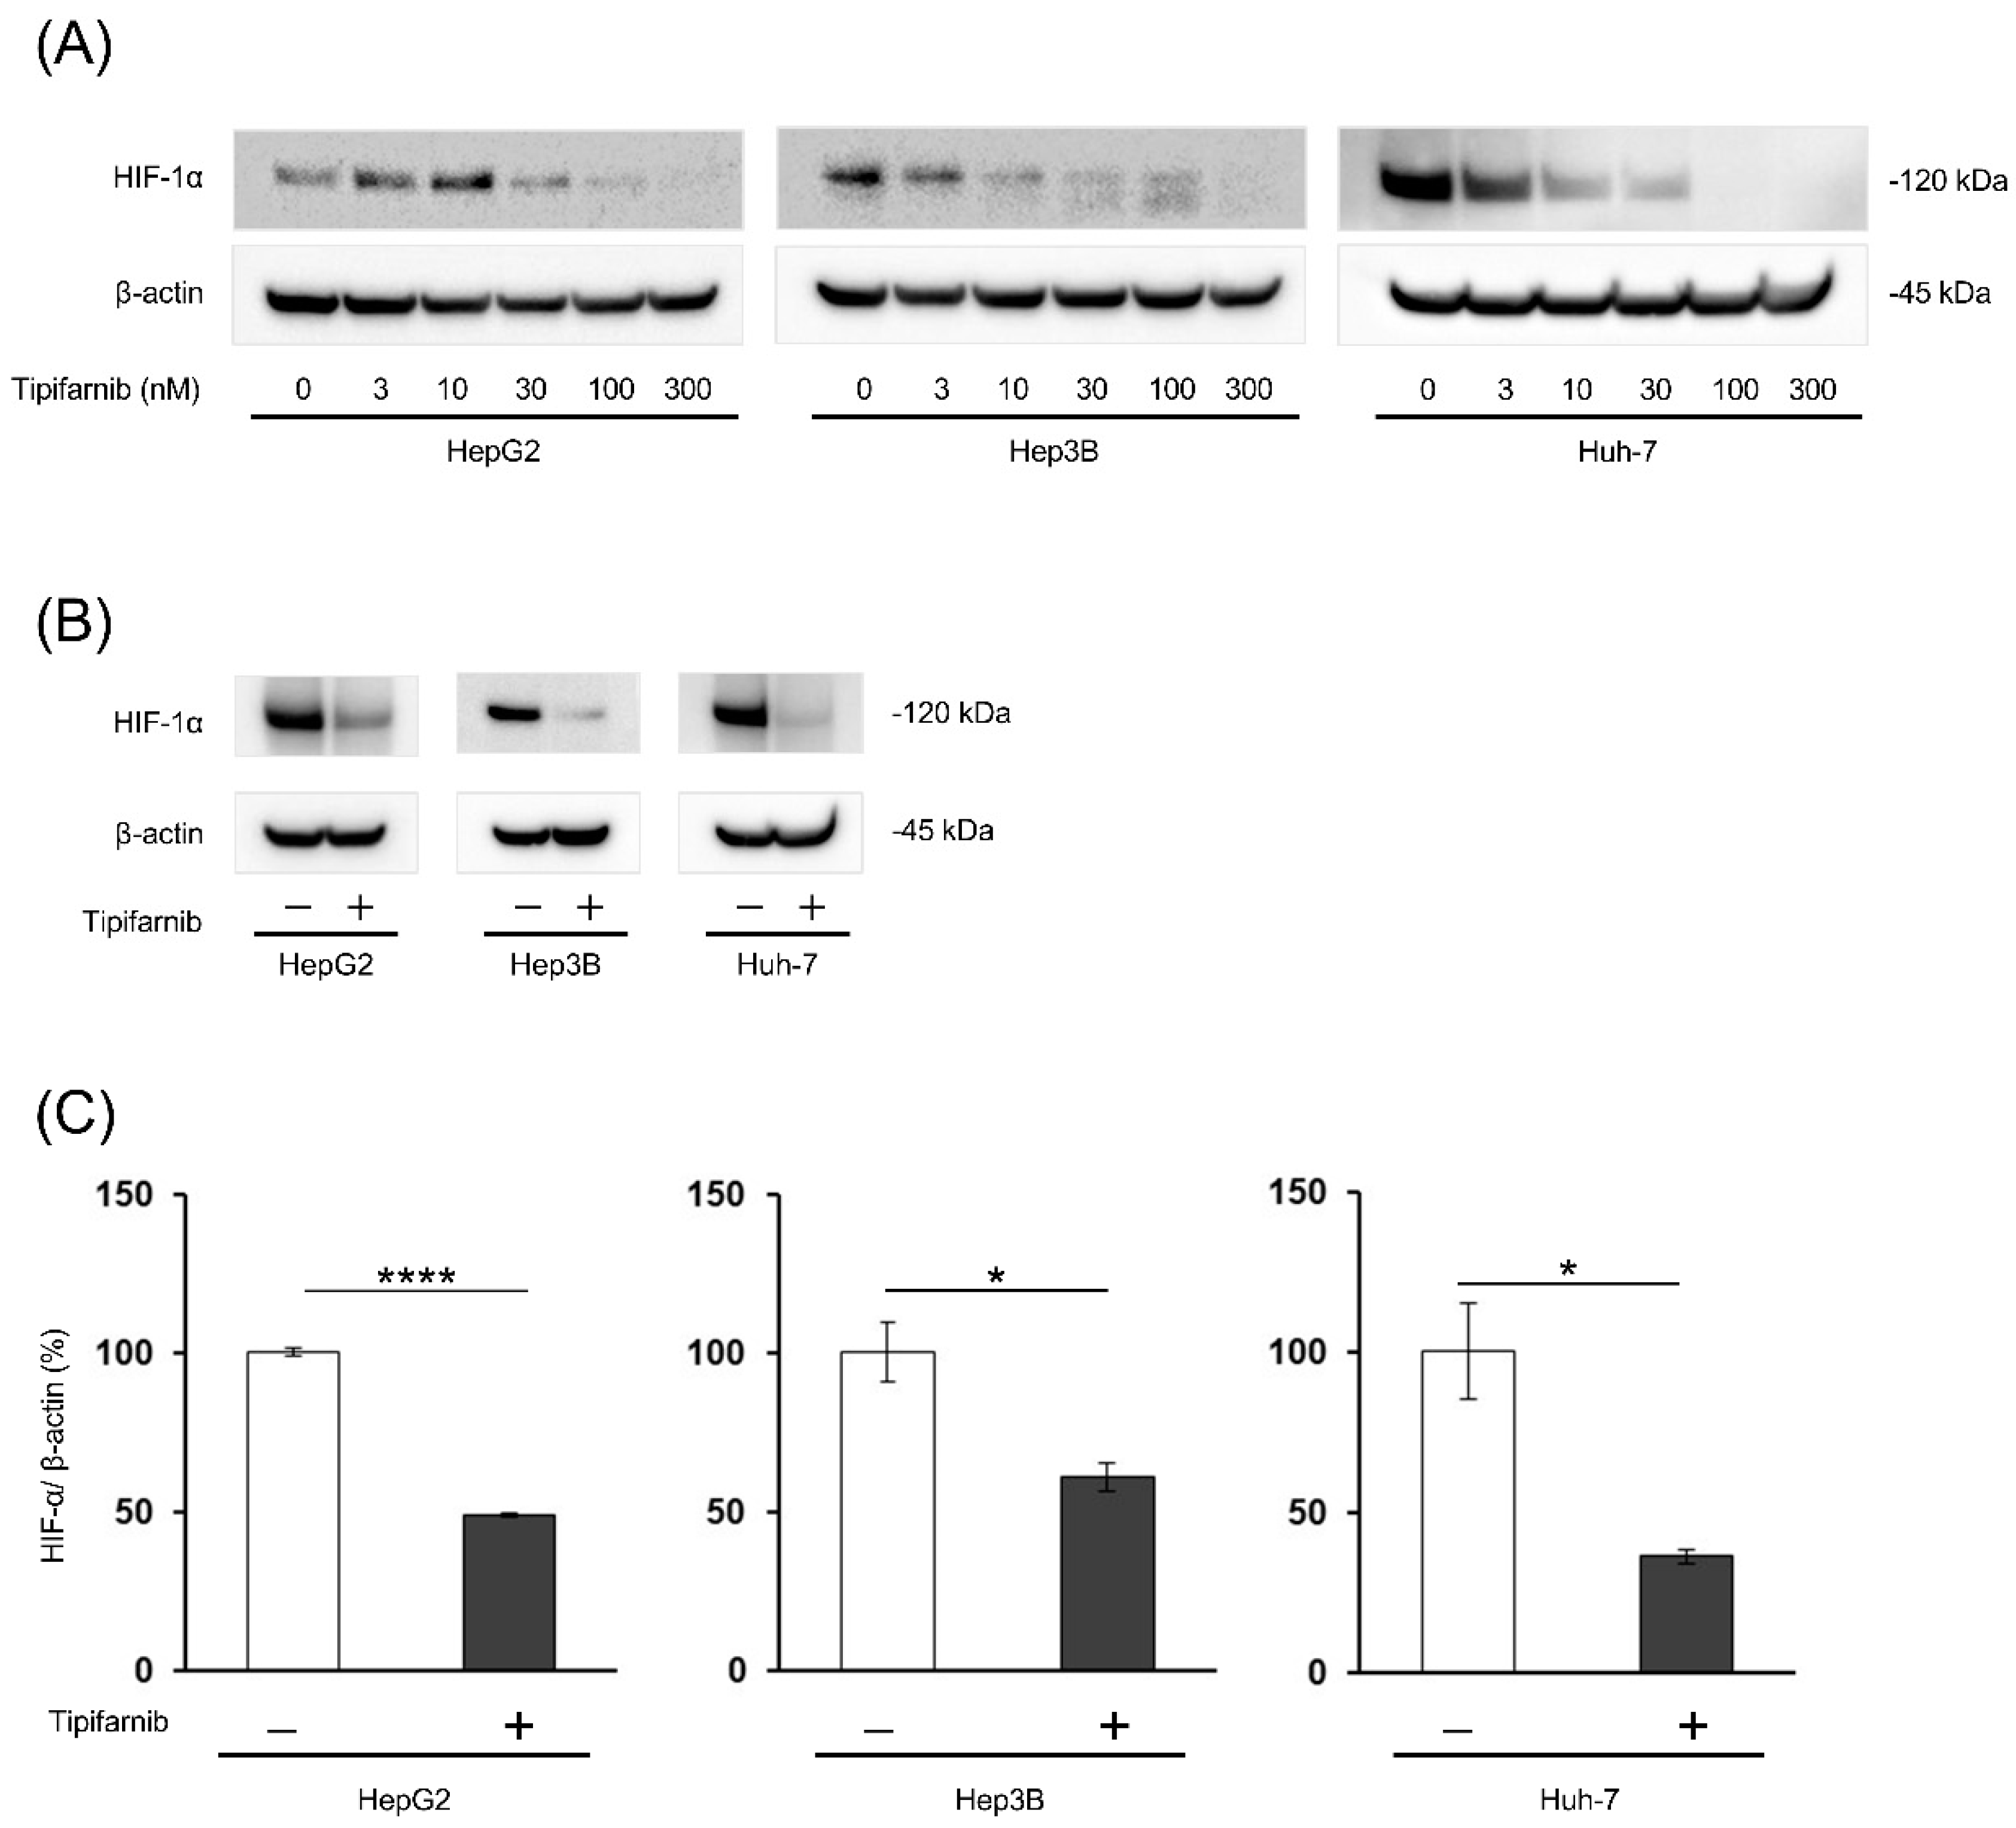
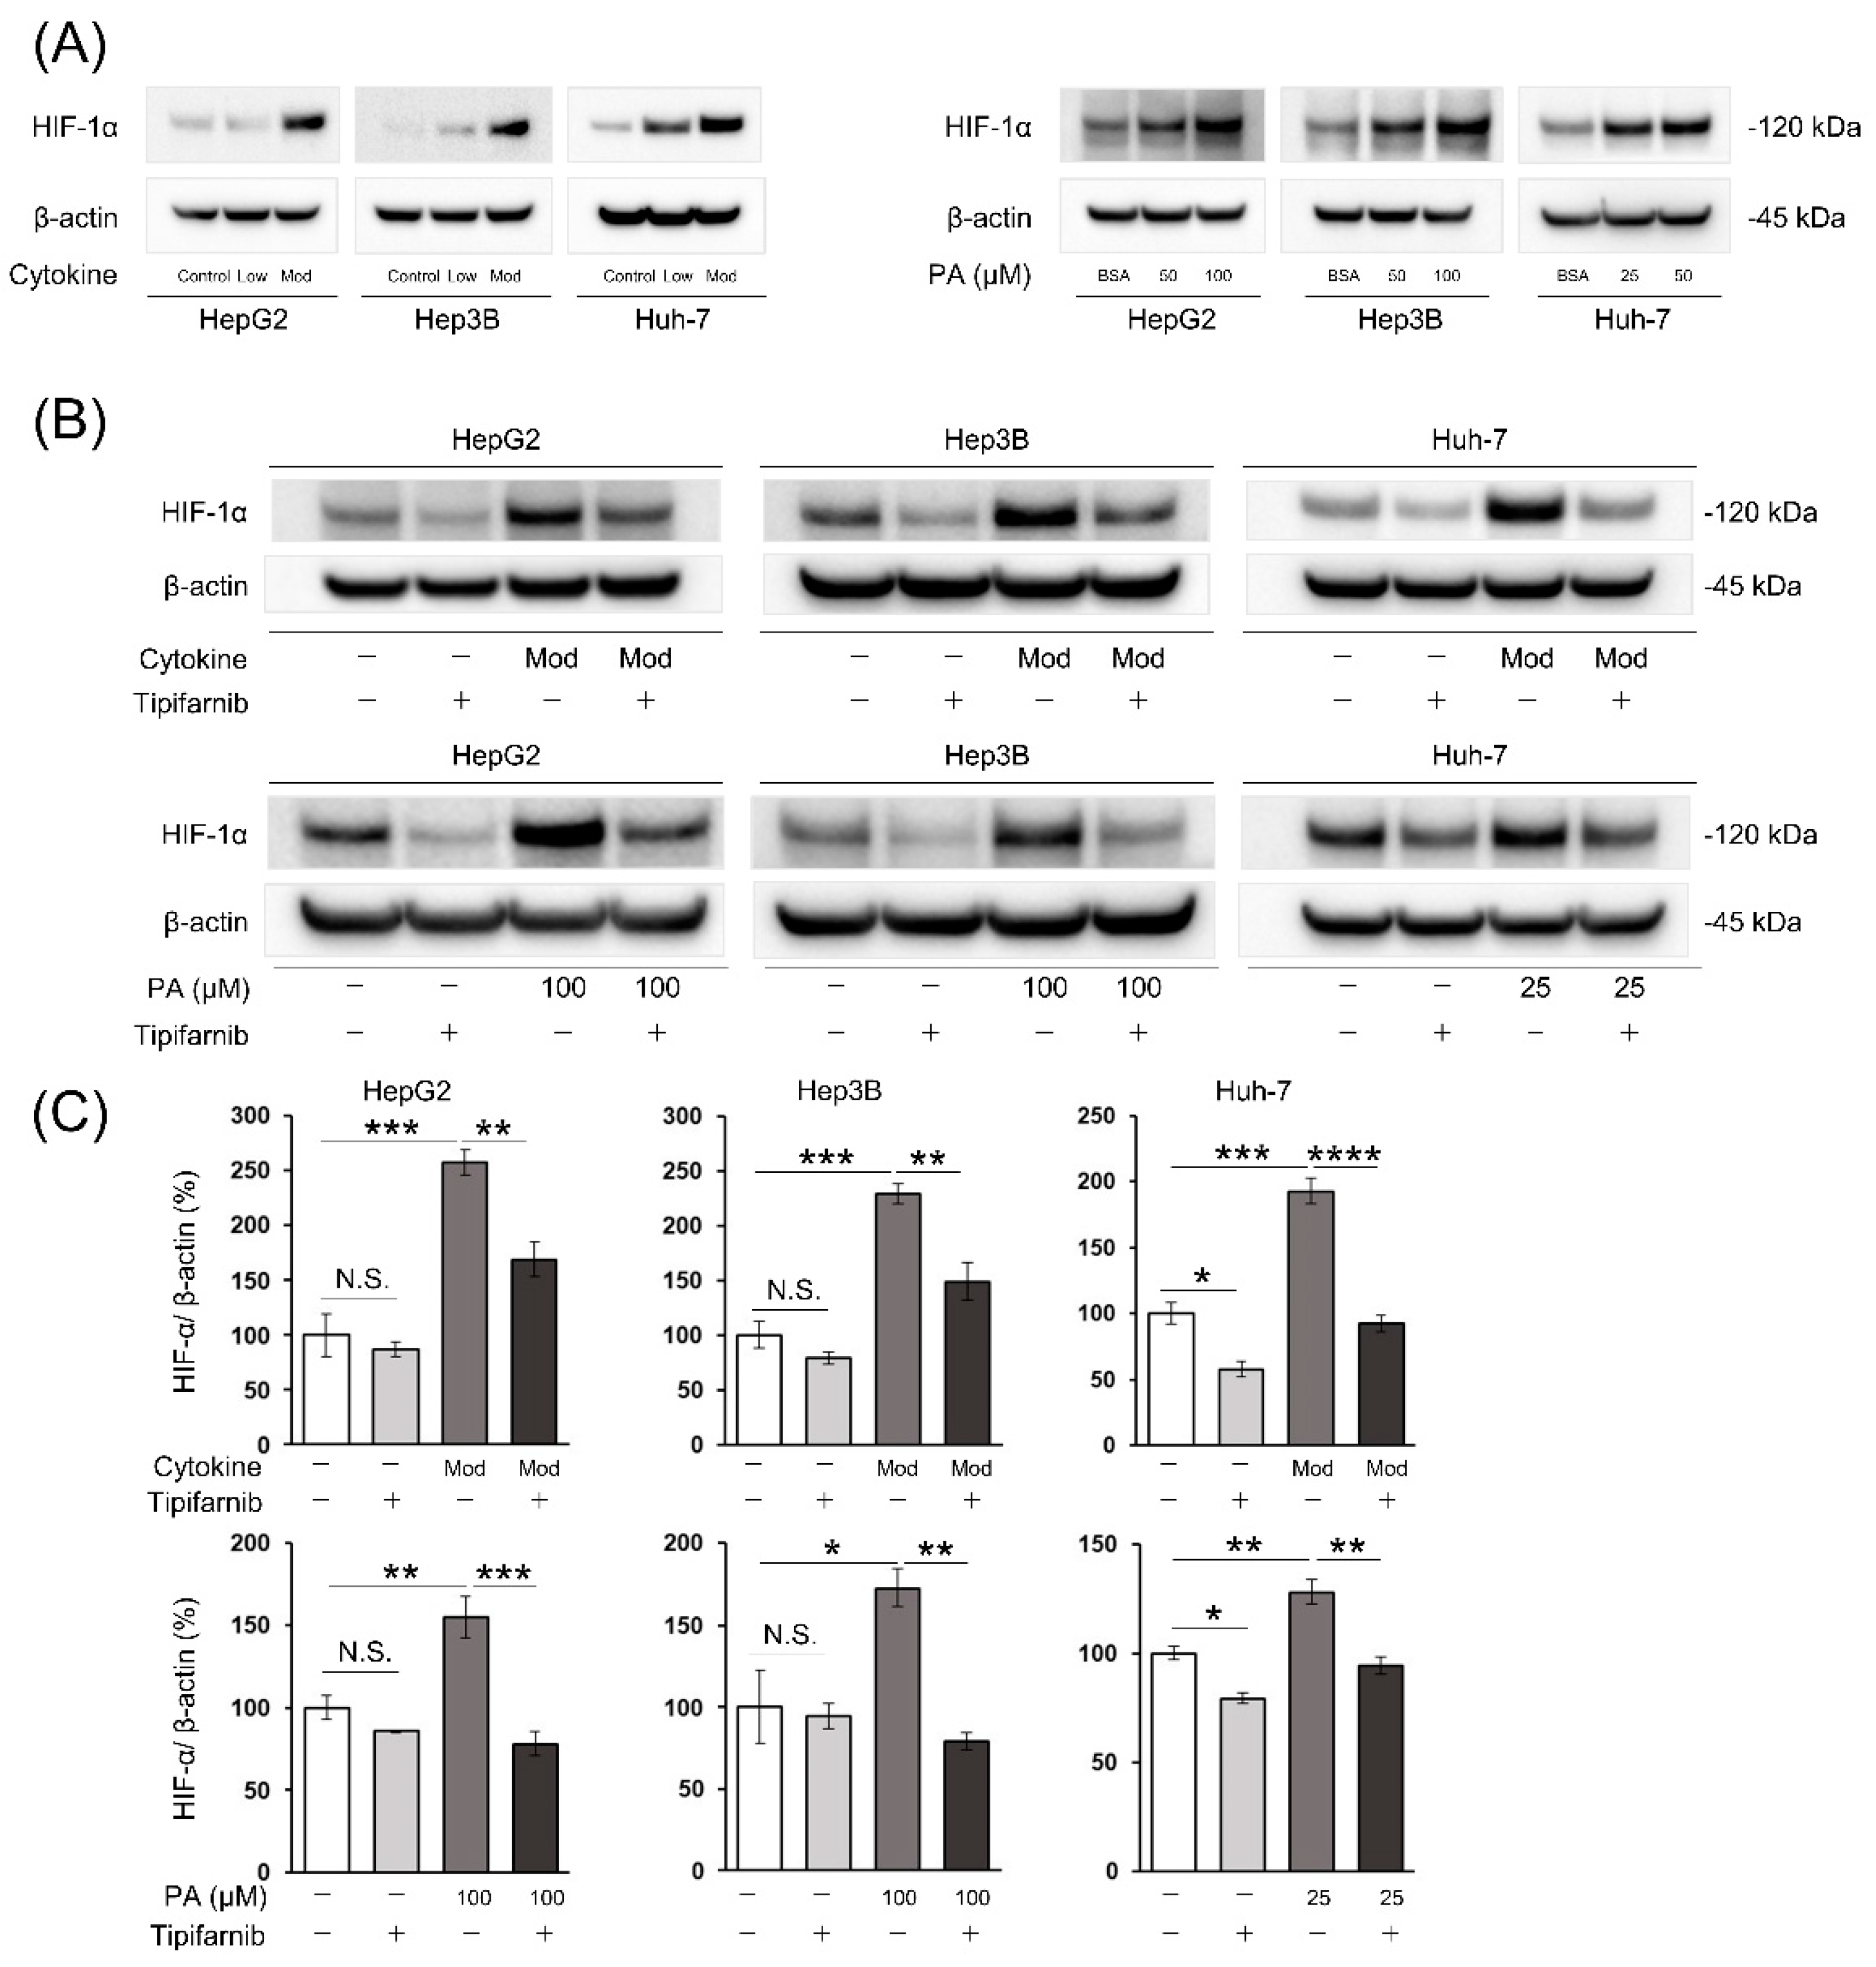
2.1. HIF-1α expression under normoxia
2.2. HIF-1α expression under NASH-like conditions
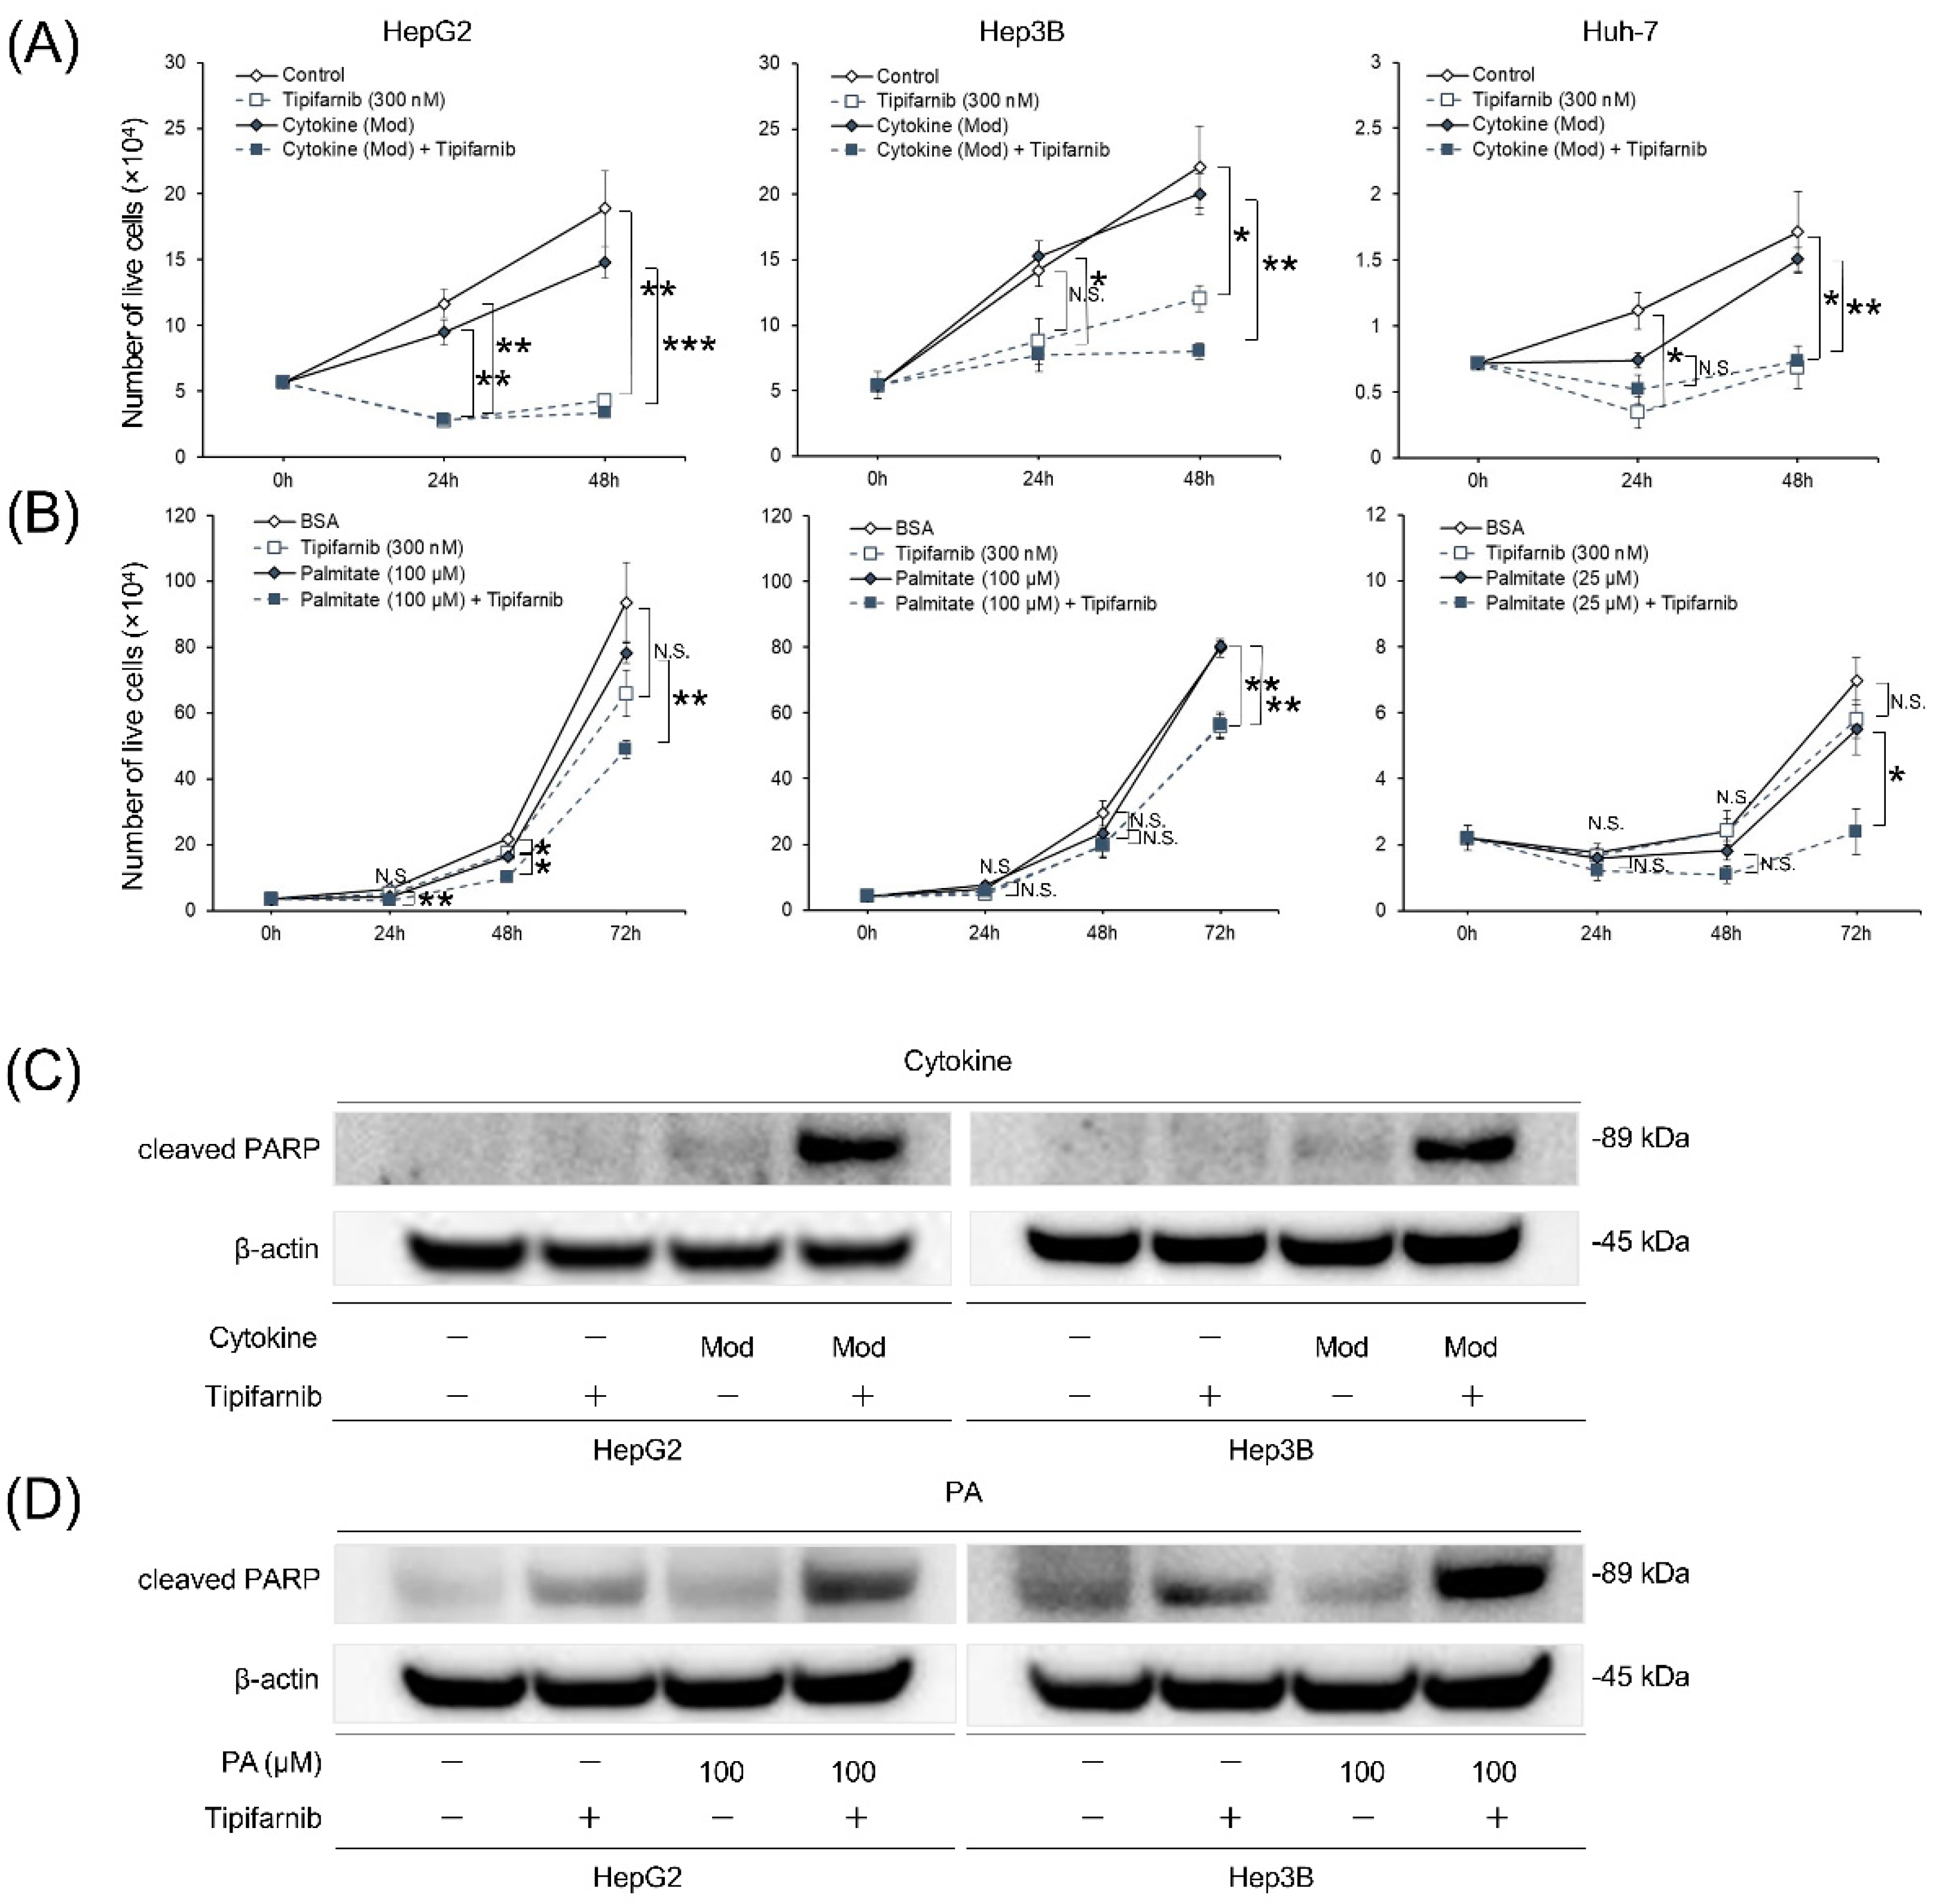
2.3. Proliferation of HCC cell lines under NASH-like conditions
2.4. Apoptosis of HCC cell lines under NASH-like conditions
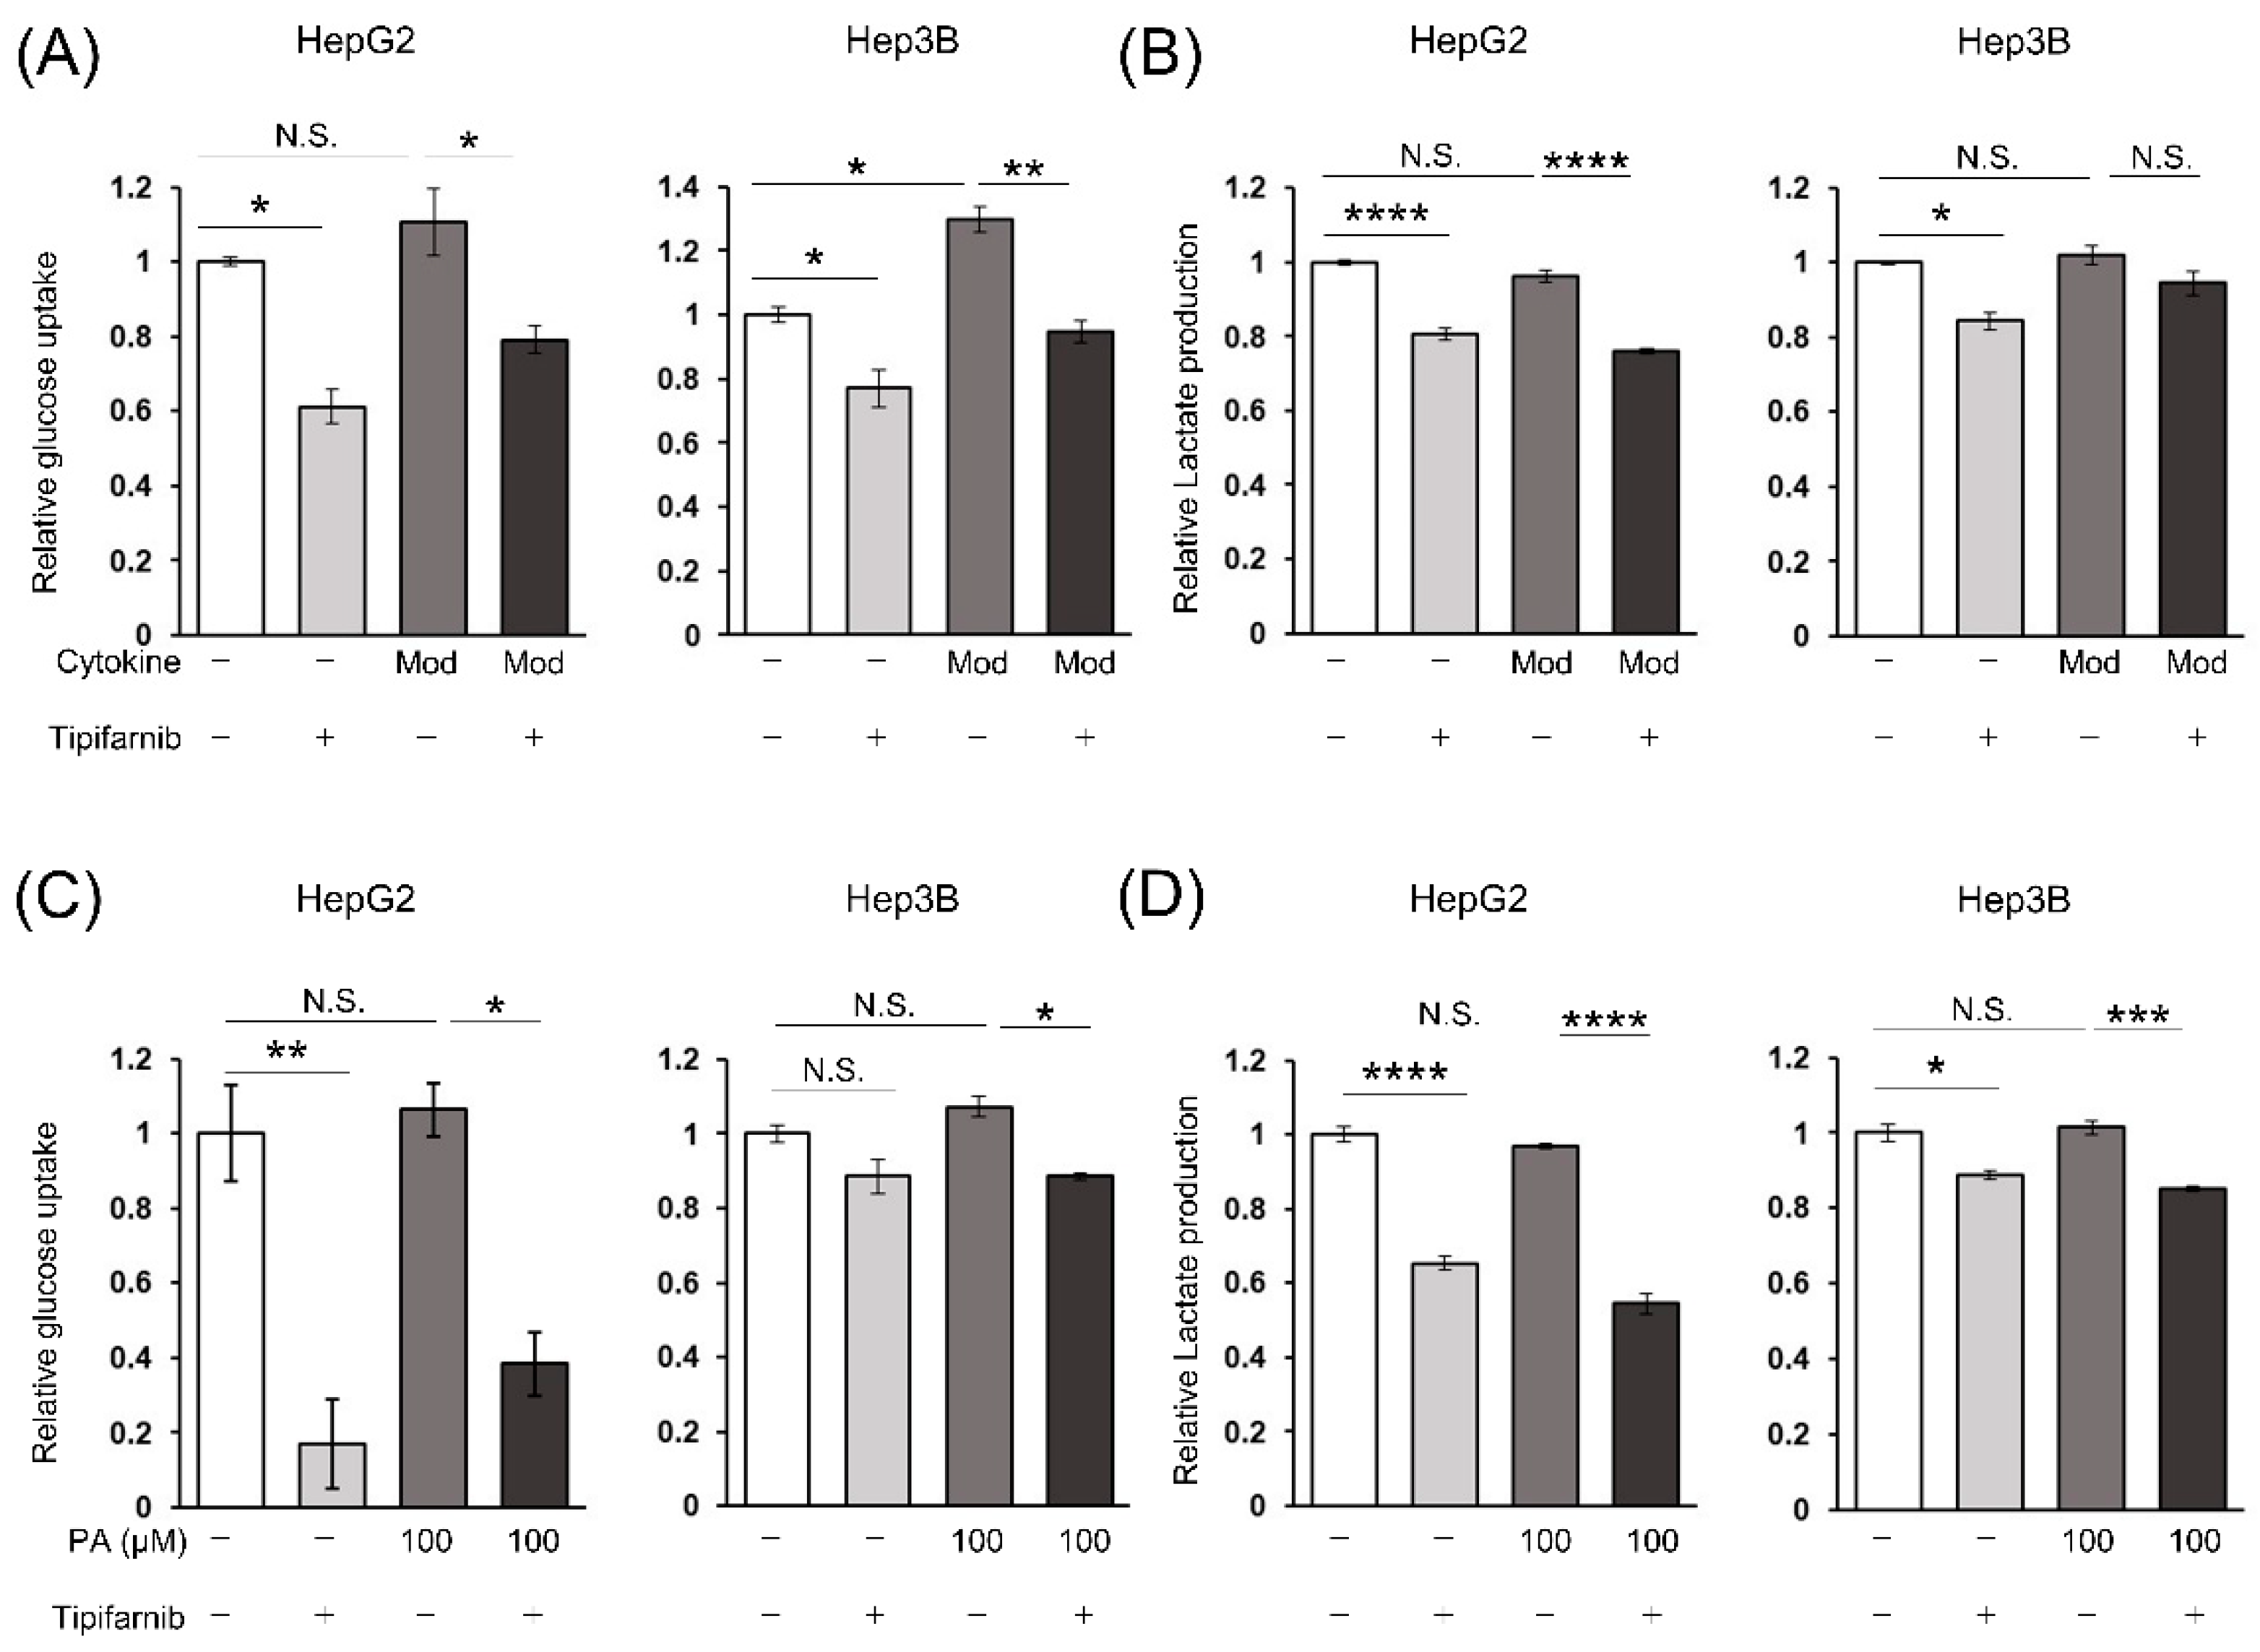
2.5. Glycolytic metabolism in HCC cells under NASH-like conditions
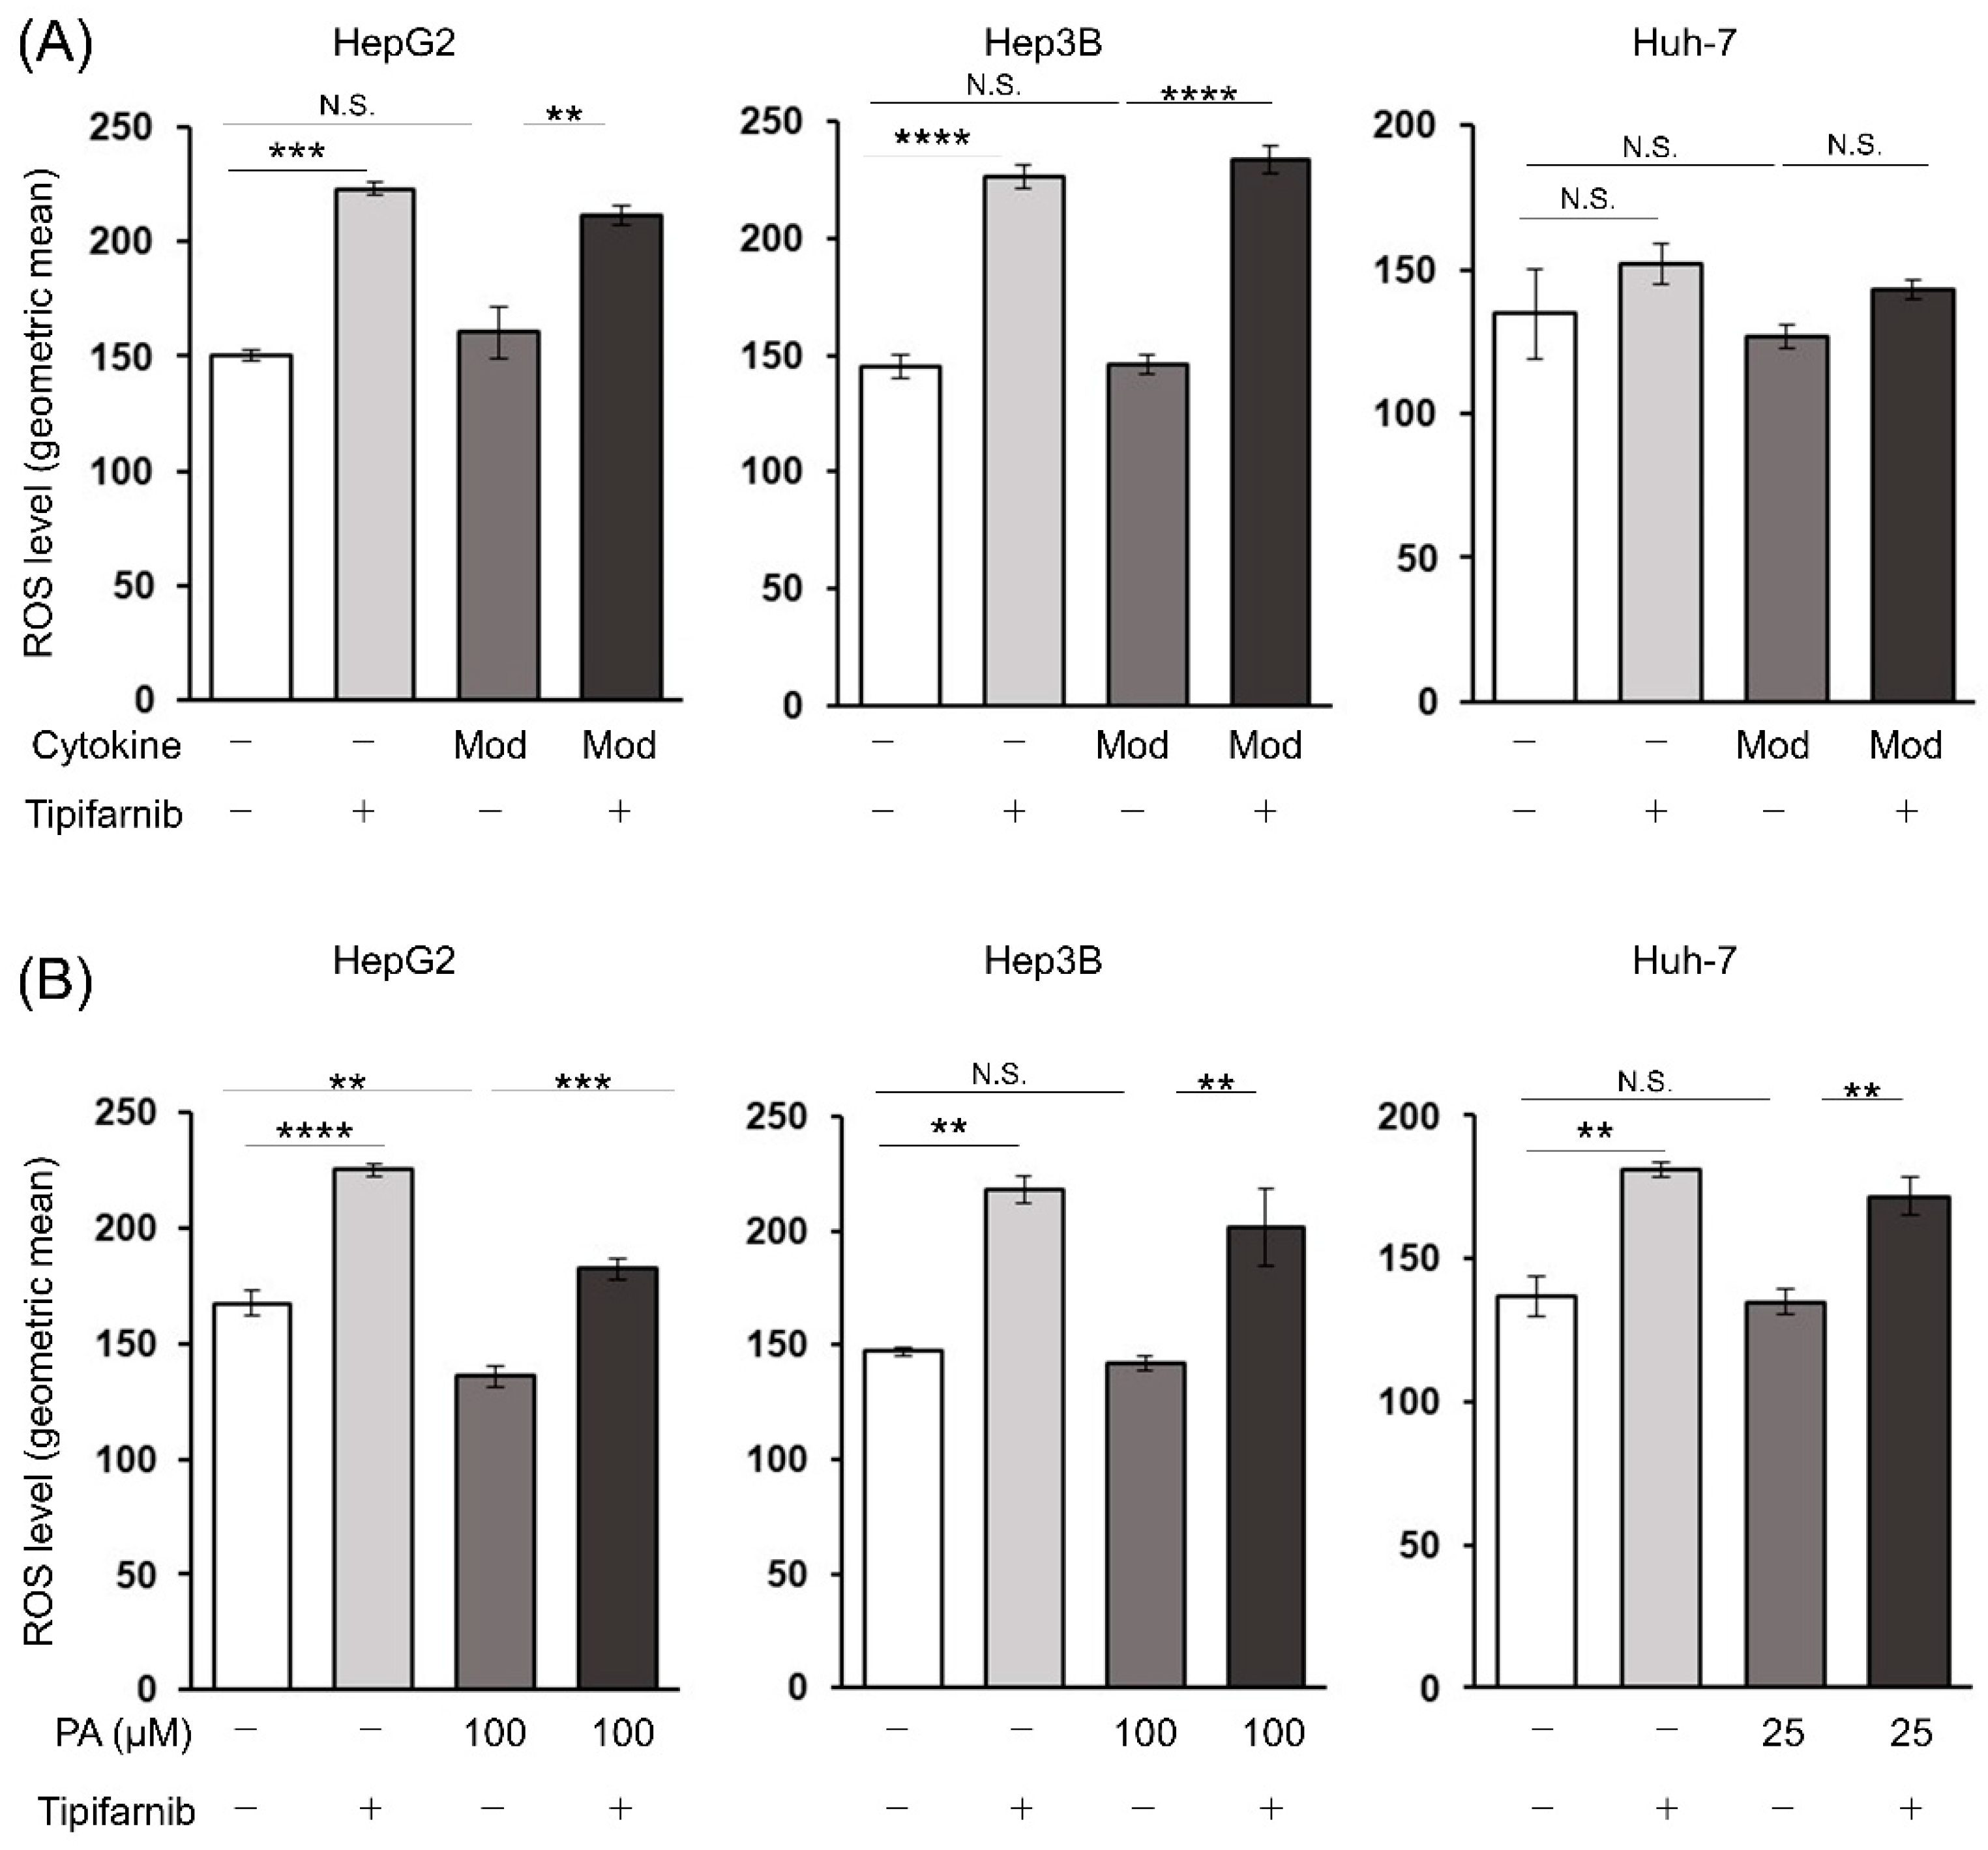
2.6. Reactive oxygen species (ROS) production in HCC cells under NASH-like conditions
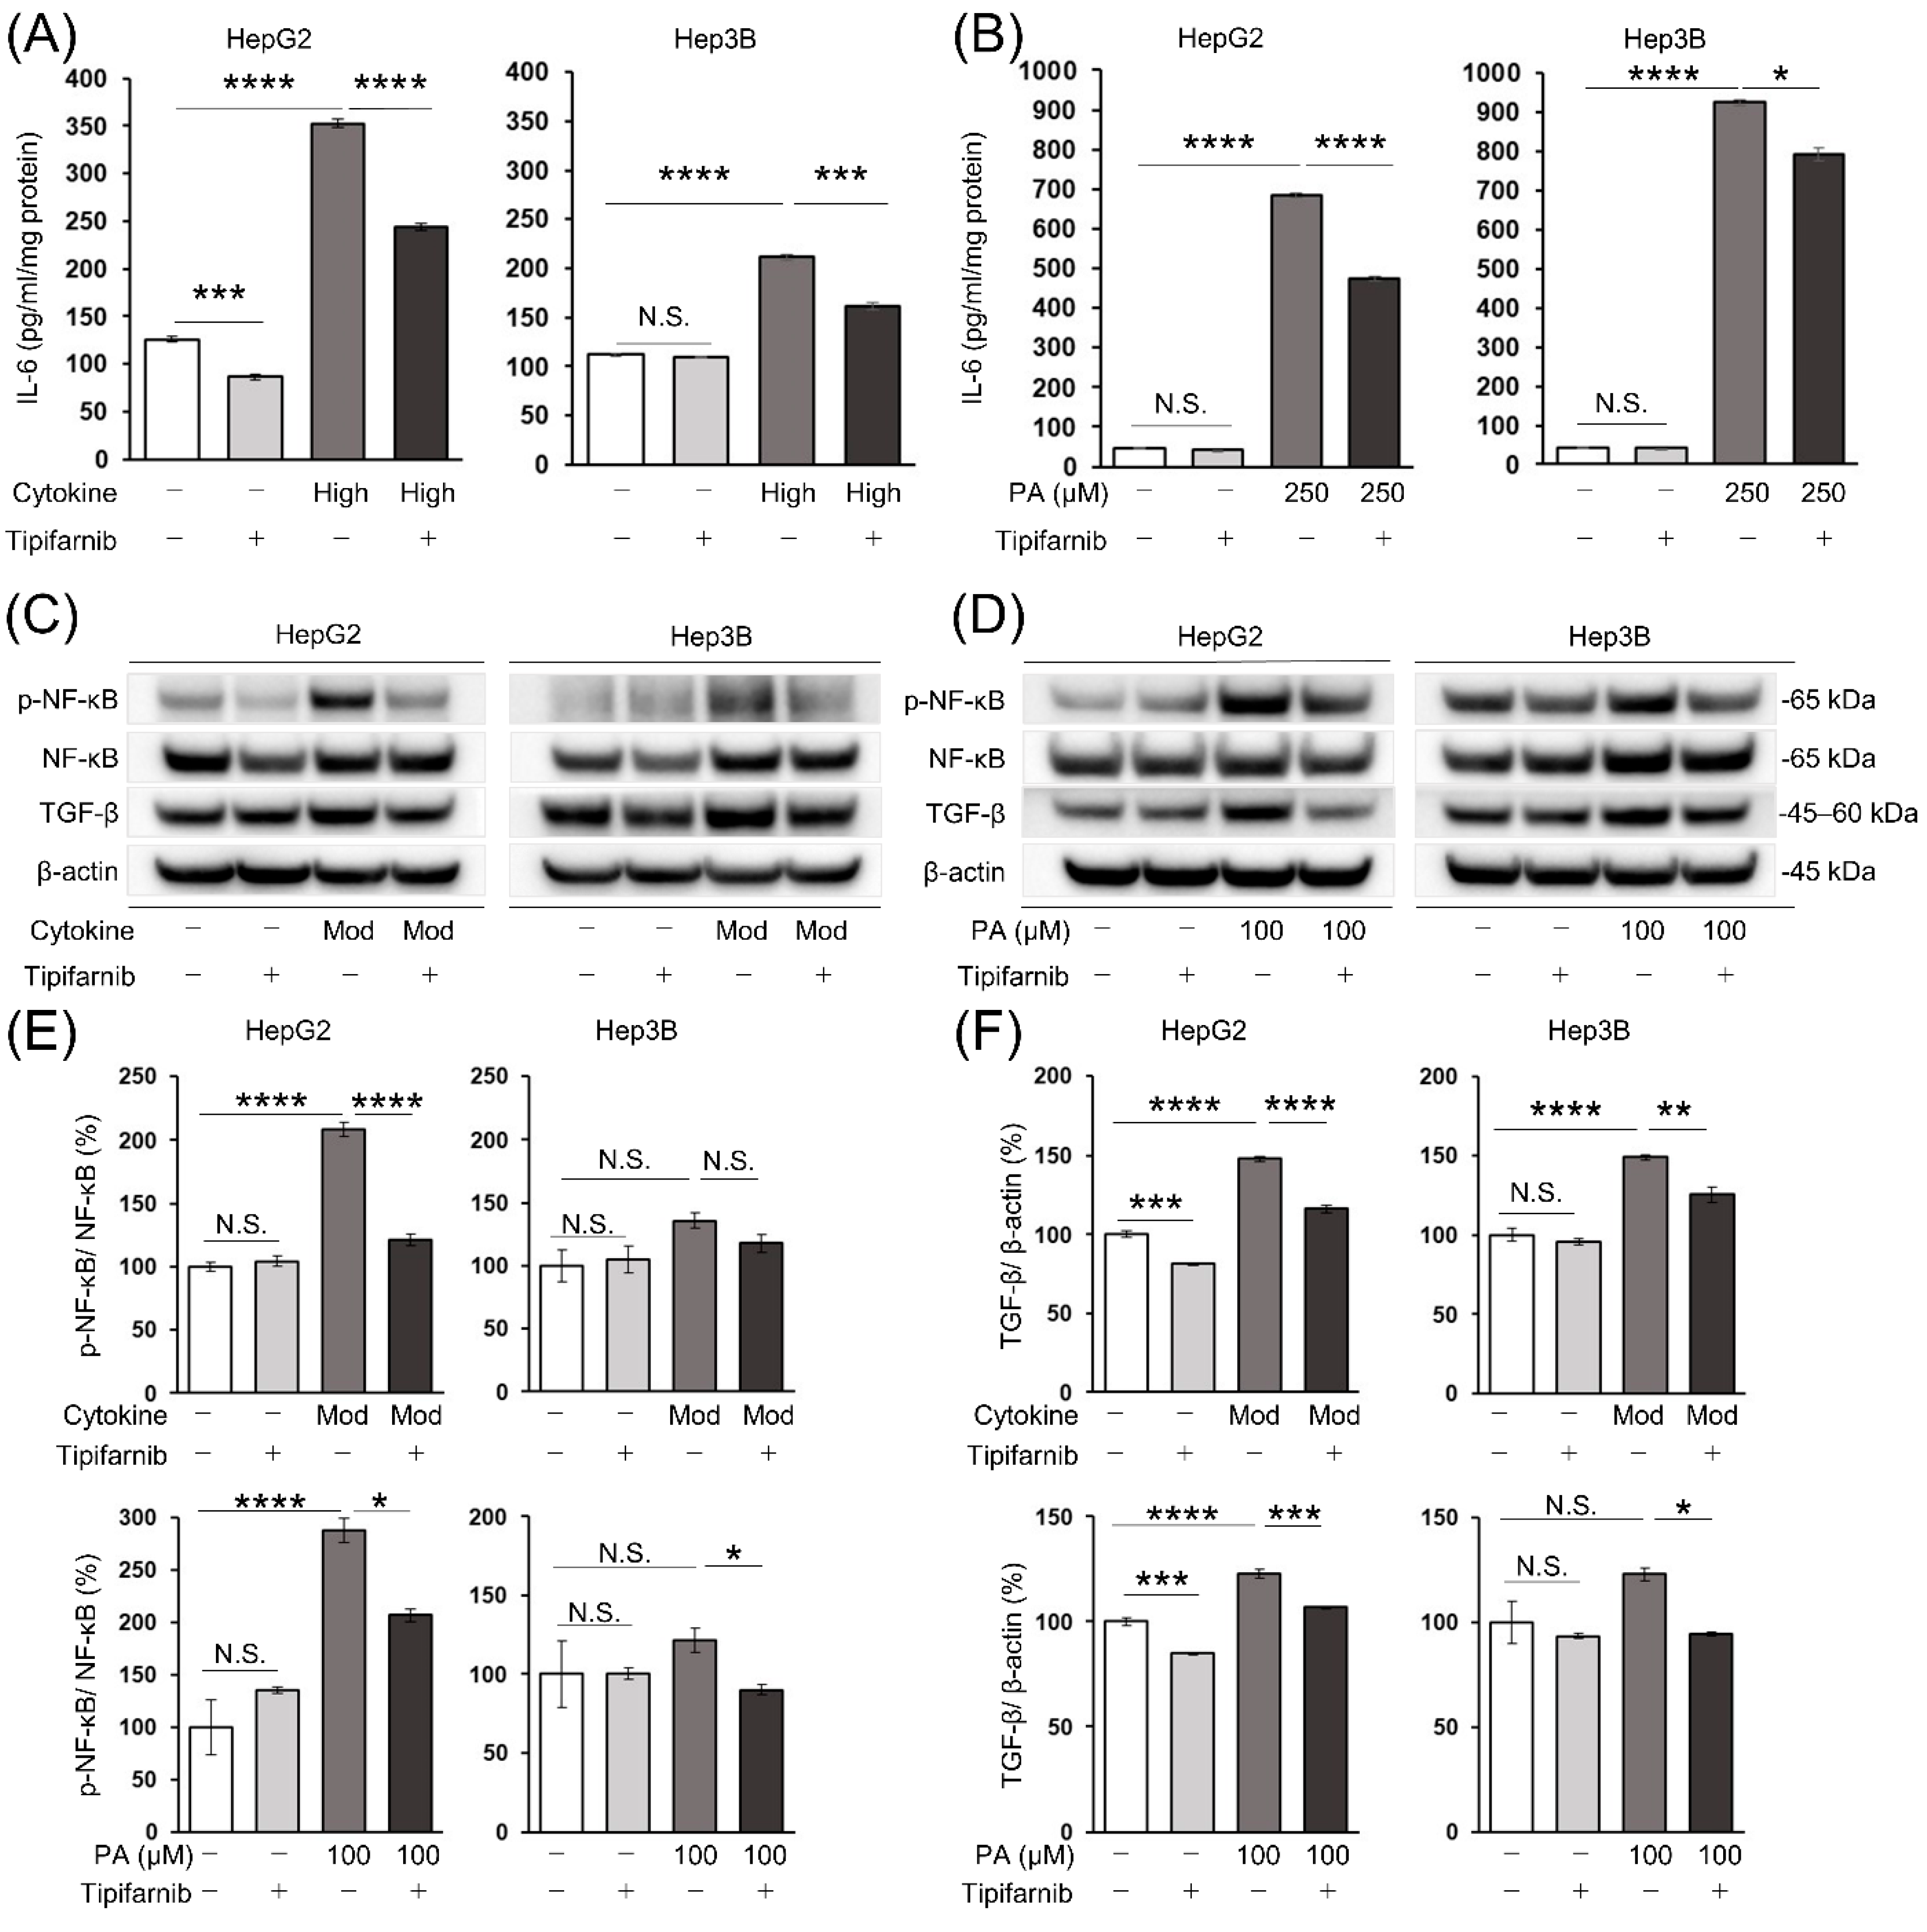
2.7. Intracellular IL-6 level in HCC cells
2.8. Nuclear factor-κB (NF-κB) and transforming growth factor-β (TGF-β) protein expression in HCC cells
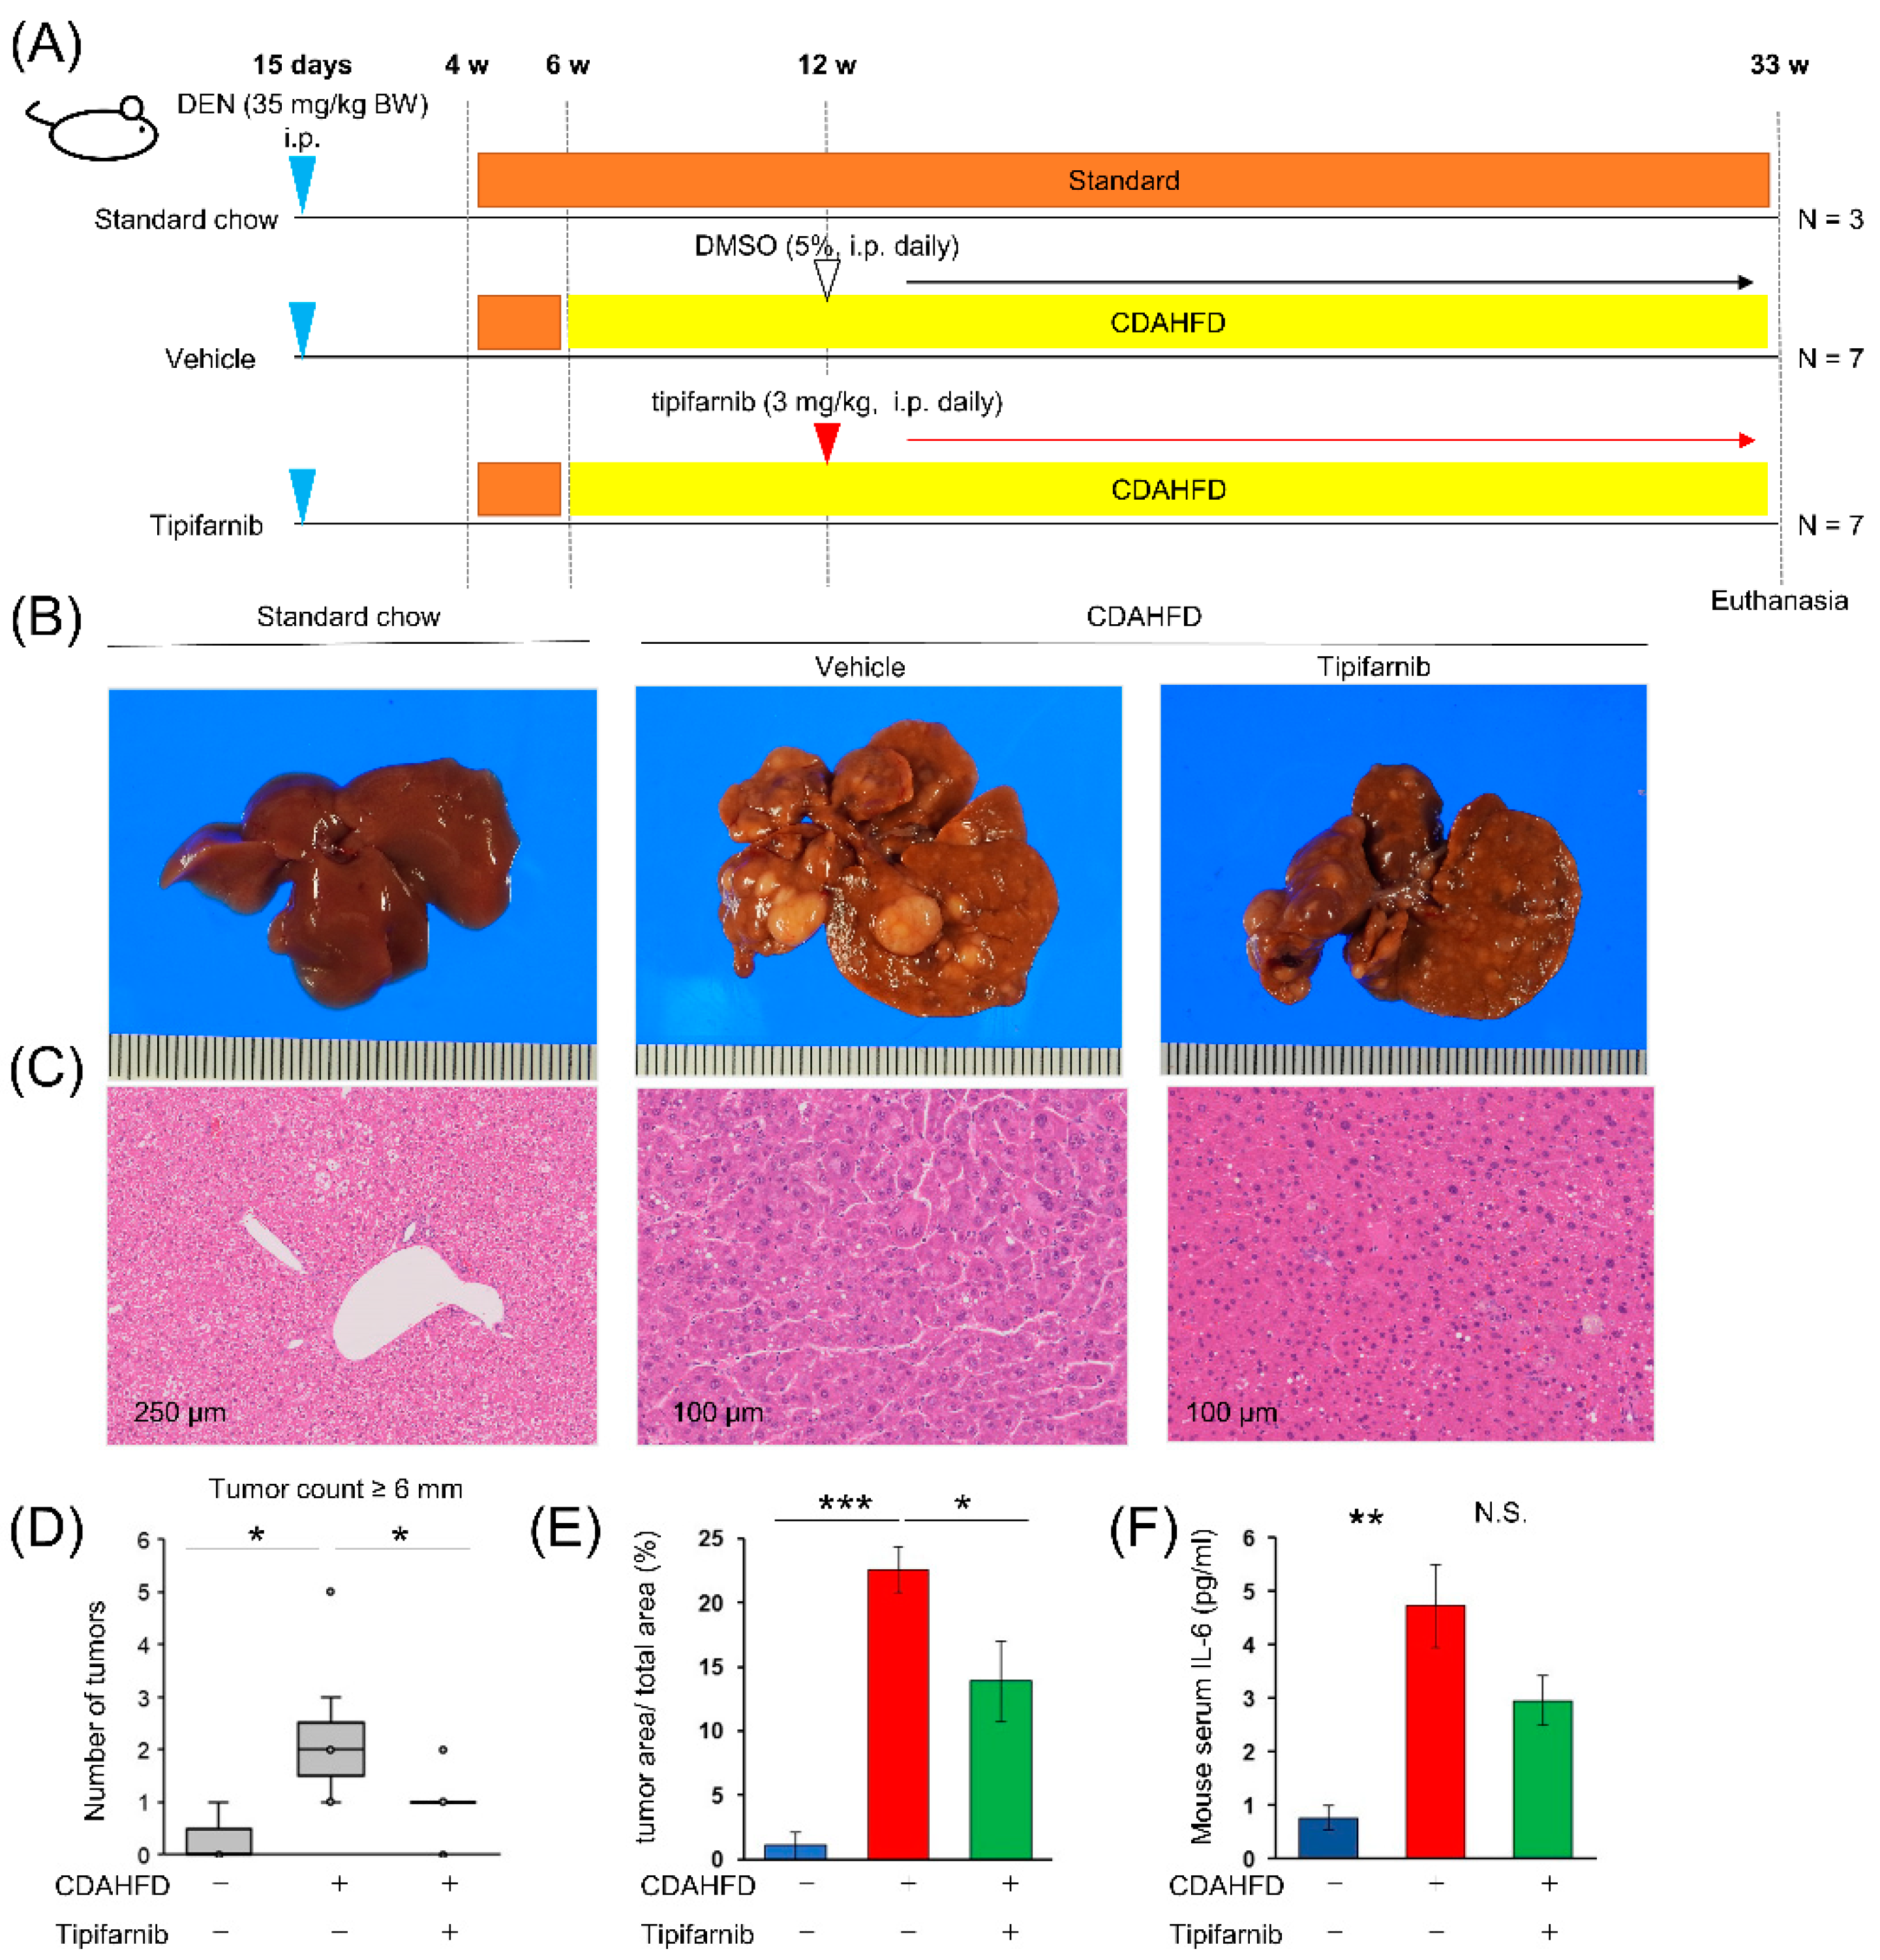
2.9. NASH-related HCC mouse model
3. Discussion
4. Materials and Methods
4.1. Cell culture
4.2. Preparation of a palmitic acid (PA)/bovine serum albumin (BSA) complex solution
4.3. Establishment of an in vitro NASH-related HCC model
4.5. Cell viability assay
4.6. Measurement of glucose uptake and lactate production
4.7. Quantification of the intracellular ROS level by flow cytometry
4.8. Measurement of intracellular IL-6 production
4.9. Animal experiments
4.10. Liver histological evaluation
4.11. Measurement of mouse serum IL-6
4.12. Statistical analysis
Supplementary Materials
Author Contributions
Funding
Acknowledgments
Conflicts of Interest
References
- Singh, G.M.; Danaei, G.; Farzadfar, F.; Stevens, G.A.; Woodward, M.; Wormser, D.; Kaptoge, S.; Whitlock, G.; Qiao, Q.; Lewington, S.; et al. The age-specific quantitative effects of metabolic risk factors on cardiovascular diseases and diabetes: a pooled analysis. PLoS ONE 2013, 8, e65174. [CrossRef]
- GBD 2015 Obesity Collaborators; Afshin, A.; Forouzanfar, M.H.; Reitsma, M.B.; Sur, P.; Estep, K.; Lee, A.; Marczak, L.; Mokdad, A.H.; Moradi-Lakeh, M.; Naghavi, M.; et al. Health Effects of Overweight and Obesity in 195 Countries over 25 Years. N. Engl. J. Med. 2017, 377, 13–27. [CrossRef]
- Subichin, M.; Clanton, J.; Makuszewski, M.; Bohon, A.; Zografakis, J.G.; Dan, A. Liver disease in the morbidly obese: a review of 1000 consecutive patients undergoing weight loss surgery. Surg. Obes. Relat. Dis. 2015, 11, 137–141. [CrossRef]
- Younossi, Z.M.; Koenig, A.B.; Abdelatif, D.; Fazel, Y.; Henry, L.; Wymer, M. Global epidemiology of nonalcoholic fatty liver disease-Meta-analytic assessment of prevalence, incidence, and outcomes. Hepatology 2016, 64, 73–84. [CrossRef]
- Carrat, F.; Fontaine, H.; Dorival, C.; Simony, M.; Diallo, A.; Hezode, C.; De Ledinghen, V.; Larrey, D.; Haour, G.; Bronowicki, J.-P.; et al. Clinical outcomes in patients with chronic hepatitis C after direct-acting antiviral treatment: a prospective cohort study. Lancet 2019, 393, 1453–1464. [CrossRef]
- Liao, S.-H.; Chen, C.-L.; Hsu, C.-Y.; Chien, K.-L.; Kao, J.-H.; Chen, P.-J.; Chen, T.H.-H.; Chen, C.-H. Long-term effectiveness of population-wide multifaceted interventions for hepatocellular carcinoma in Taiwan. J. Hepatol. 2021, 75, 132–141. [CrossRef]
- Rinella, M.E. Nonalcoholic fatty liver disease: a systematic review. JAMA 2015, 313, 2263–2273. [CrossRef]
- Park, E.J.; Lee, J.H.; Yu, G.-Y.; He, G.; Ali, S.R.; Holzer, R.G.; Osterreicher, C.H.; Takahashi, H.; Karin, M. Dietary and genetic obesity promote liver inflammation and tumorigenesis by enhancing IL-6 and TNF expression. Cell 2010, 140, 197–208. [CrossRef]
- Krawczyk, M.; Bonfrate, L.; Portincasa, P. Nonalcoholic fatty liver disease. Best Pract. Res. Clin. Gastroenterol. 2010, 24, 695–708. [CrossRef]
- Drucker, C.; Parzefall, W.; Teufelhofer, O.; Grusch, M.; Ellinger, A.; Schulte-Hermann, R.; Grasl-Kraupp, B. Non-parenchymal liver cells support the growth advantage in the first stages of hepatocarcinogenesis. Carcinogenesis 2006, 27, 152–161. [CrossRef]
- Takaki, A.; Kawai, D.; Yamamoto, K. Multiple hits, including oxidative stress, as pathogenesis and treatment target in non-alcoholic steatohepatitis (NASH). Int. J. Mol. Sci. 2013, 14, 20704–20728. [CrossRef]
- Csak, T.; Ganz, M.; Pespisa, J.; Kodys, K.; Dolganiuc, A.; Szabo, G. Fatty acid and endotoxin activate inflammasomes in mouse hepatocytes that release danger signals to stimulate immune cells. Hepatology 2011, 54, 133–144. [CrossRef]
- Shimizu, Y.; Tamura, T.; Kemmochi, A.; Owada, Y.; Ozawa, Y.; Hisakura, K.; Matsuzaka, T.; Shimano, H.; Nakano, N.; Sakashita, S.; et al. Oxidative stress and LXR agonist induce hepatocellular carcinoma in NASH model. J. Gastroenterol. Hepatol. 2020. [CrossRef]
- Vecchione, G.; Grasselli, E.; Cioffi, F.; Baldini, F.; Oliveira, P.J.; Sardão, V.A.; Cortese, K.; Lanni, A.; Voci, A.; Portincasa, P.; Vergani, L. The Nutraceutic Silybin Counteracts Excess Lipid Accumulation and Ongoing Oxidative Stress in an In Vitro Model of Non-Alcoholic Fatty Liver Disease Progression. Front. Nutr. 2017, 4, 42. [CrossRef]
- Oh, J.M.; Choi, J.M.; Lee, J.Y.; Oh, S.J.; Kim, H.C.; Kim, B.H.; Ma, J.Y.; Kim, S.K. Effects of palmitic acid on TNF-α-induced cytotoxicity in SK-Hep-1 cells. Toxicol In Vitro 2012, 26, 783–790. [CrossRef]
- Dai, Y.; Chen, S.; Pei, X.-Y.; Almenara, J.A.; Kramer, L.B.; Venditti, C.A.; Dent, P.; Grant, S. Interruption of the Ras/MEK/ERK signaling cascade enhances Chk1 inhibitor-induced DNA damage in vitro and in vivo in human multiple myeloma cells. Blood 2008, 112, 2439–2449. [CrossRef]
- Lee, K.H.; Koh, M.; Moon, A. Farnesyl transferase inhibitor FTI-277 inhibits breast cell invasion and migration by blocking H-Ras activation. Oncol. Lett. 2016, 12, 2222–2226. [CrossRef]
- Untch, B.R.; Dos Anjos, V.; Garcia-Rendueles, M.E.R.; Knauf, J.A.; Krishnamoorthy, G.P.; Saqcena, M.; Bhanot, U.K.; Socci, N.D.; Ho, A.L.; Ghossein, R.; Fagin, J.A. Tipifarnib Inhibits HRAS-Driven Dedifferentiated Thyroid Cancers. Cancer Res. 2018, 78, 4642–4657. [CrossRef]
- Gilardi, M.; Wang, Z.; Proietto, M.; Chillà, A.; Calleja-Valera, J.L.; Goto, Y.; Vanoni, M.; Janes, M.R.; Mikulski, Z.; Gualberto, A.; et al. Tipifarnib as a Precision Therapy for HRAS-Mutant Head and Neck Squamous Cell Carcinomas. Mol. Cancer Ther. 2020, 19, 1784–1796. [CrossRef]
- Nakazawa, H.; Yamada, M.; Tanaka, T.; Kramer, J.; Yu, Y.-M.; Fischman, A.J.; Martyn, J.A.J.; Tompkins, R.G.; Kaneki, M. Role of protein farnesylation in burn-induced metabolic derangements and insulin resistance in mouse skeletal muscle. PLoS ONE 2015, 10, e0116633. [CrossRef]
- Seppälä-Lindroos, A.; Vehkavaara, S.; Häkkinen, A.-M.; Goto, T.; Westerbacka, J.; Sovijärvi, A.; Halavaara, J.; Yki-Järvinen, H. Fat accumulation in the liver is associated with defects in insulin suppression of glucose production and serum free fatty acids independent of obesity in normal men. J. Clin. Endocrinol. Metab. 2002, 87, 3023–3028. [CrossRef]
- Yoshioka, N.; Tanaka, M.; Ochi, K.; Watanabe, A.; Ono, K.; Sawada, M.; Ogi, T.; Itoh, M.; Ito, A.; Shiraki, Y.; et al. The sodium-glucose cotransporter-2 inhibitor Tofogliflozin prevents the progression of nonalcoholic steatohepatitis-associated liver tumors in a novel murine model. Biomed. Pharmacother. 2021, 140, 111738. [CrossRef]
- Jojima, T.; Wakamatsu, S.; Kase, M.; Iijima, T.; Maejima, Y.; Shimomura, K.; Kogai, T.; Tomaru, T.; Usui, I.; Aso, Y. The SGLT2 Inhibitor Canagliflozin Prevents Carcinogenesis in a Mouse Model of Diabetes and Non-Alcoholic Steatohepatitis-Related Hepatocarcinogenesis: Association with SGLT2 Expression in Hepatocellular Carcinoma. Int. J. Mol. Sci. 2019, 20. [CrossRef]
- Fruci, B.; Giuliano, S.; Mazza, A.; Malaguarnera, R.; Belfiore, A. Nonalcoholic Fatty liver: a possible new target for type 2 diabetes prevention and treatment. Int. J. Mol. Sci. 2013, 14, 22933–22966. [CrossRef]
- Kamat, C.D.; Green, D.E.; Warnke, L.; Thorpe, J.E.; Ceriello, A.; Ihnat, M.A. Mutant p53 facilitates pro-angiogenic, hyperproliferative phenotype in response to chronic relative hypoxia. Cancer Lett. 2007, 249, 209–219. [CrossRef]
- Wong, C.C.-L.; Gilkes, D.M.; Zhang, H.; Chen, J.; Wei, H.; Chaturvedi, P.; Fraley, S.I.; Wong, C.-M.; Khoo, U.-S.; Ng, I.O.-L.; Wirtz, D.; Semenza, G.L. Hypoxia-inducible factor 1 is a master regulator of breast cancer metastatic niche formation. Proc Natl Acad Sci USA 2011, 108, 16369–16374. [CrossRef]
- Egawa, N.; Tanaka, T.; Matsufuji, S.; Yamada, K.; Ito, K.; Kitagawa, H.; Okuyama, K.; Kitajima, Y.; Noshiro, H. Antitumor effects of low-dose tipifarnib on the mTOR signaling pathway and reactive oxygen species production in HIF-1α-expressing gastric cancer cells. FEBS Open Bio 2021, 11, 1465–1475. [CrossRef]
- Ito, K.; Kitajima, Y.; Kai, K.; Matsufuji, S.; Yamada, K.; Egawa, N.; Kitagawa, H.; Okuyama, K.; Tanaka, T.; Noshiro, H. Matrix metalloproteinase-1 expression is regulated by HIF-1-dependent and epigenetic mechanisms and serves a tumor-suppressive role in gastric cancer progression. Int. J. Oncol. 2021, 59. [CrossRef]
- Bruning, U.; Fitzpatrick, S.F.; Frank, T.; Birtwistle, M.; Taylor, C.T.; Cheong, A. NFκB and HIF display synergistic behaviour during hypoxic inflammation. Cell. Mol. Life Sci. 2012, 69, 1319–1329. [CrossRef]
- Maxwell, P.J.; Gallagher, R.; Seaton, A.; Wilson, C.; Scullin, P.; Pettigrew, J.; Stratford, I.J.; Williams, K.J.; Johnston, P.G.; Waugh, D.J.J. HIF-1 and NF-kappaB-mediated upregulation of CXCR1 and CXCR2 expression promotes cell survival in hypoxic prostate cancer cells. Oncogene 2007, 26, 7333–7345. [CrossRef]
- Tanaka, T.; Ikegami, Y.; Nakazawa, H.; Kuriyama, N.; Oki, M.; Hanai, J.-I.; Sukhatme, V.P.; Kaneki, M. Low-Dose Farnesyltransferase Inhibitor Suppresses HIF-1α and Snail Expression in Triple-Negative Breast Cancer MDA-MB-231 Cells In Vitro. J. Cell. Physiol. 2017, 232, 192–201. [CrossRef]
- Green, C.D.; Weigel, C.; Brown, R.D.R.; Bedossa, P.; Dozmorov, M.; Sanyal, A.J.; Spiegel, S. A new preclinical model of western diet-induced progression of non-alcoholic steatohepatitis to hepatocellular carcinoma. FASEB J. 2022, 36, e22372. [CrossRef]
- Shriki, A.; Lanton, T.; Sonnenblick, A.; Levkovitch-Siany, O.; Eidelshtein, D.; Abramovitch, R.; Rosenberg, N.; Pappo, O.; Elgavish, S.; Nevo, Y.; et al. Multiple roles of IL6 in hepatic injury, steatosis, and senescence aggregate to suppress tumorigenesis. Cancer Res. 2021, 81, 4766–4777. [CrossRef]
- Luedde, T.; Schwabe, R.F. NF-κB in the liver--linking injury, fibrosis and hepatocellular carcinoma. Nat. Rev. Gastroenterol. Hepatol. 2011, 8, 108–118. [CrossRef]
- Chen, J.; Gingold, J.A.; Su, X. Immunomodulatory TGF-β Signaling in Hepatocellular Carcinoma. Trends Mol. Med. 2019, 25, 1010–1023. [CrossRef]
- Yang, Y.M.; Kim, S.Y.; Seki, E. Inflammation and liver cancer: molecular mechanisms and therapeutic targets. Semin. Liver Dis. 2019, 39, 26–42. [CrossRef]
- Chavez-Tapia, N.C.; Rosso, N.; Tiribelli, C. Effect of intracellular lipid accumulation in a new model of non-alcoholic fatty liver disease. BMC Gastroenterol. 2012, 12, 20. [CrossRef]
- Shen, C.; Chen, J.H.; Oh, H.R.; Park, J.H. Transcription factor SOX2 contributes to nonalcoholic fatty liver disease development by regulating the expression of the fatty acid transporter CD36. FEBS Lett. 2021, 595, 2493–2503. [CrossRef]
- Walton, K.L.; Johnson, K.E.; Harrison, C.A. Targeting TGF-β Mediated SMAD Signaling for the Prevention of Fibrosis. Front. Pharmacol. 2017, 8, 461. [CrossRef]
- Xu, L.; Zhang, Y.; Ji, N.; Du, Y.; Jia, T.; Wei, S.; Wang, W.; Zhang, S.; Chen, W. Tanshinone IIA regulates the TGF-β1/Smad signaling pathway to ameliorate non-alcoholic steatohepatitis-related fibrosis. Exp. Ther. Med. 2022, 24, 486. [CrossRef]
- Xu, X.; Lei, Y.; Chen, L.; Zhou, H.; Liu, H.; Jiang, J.; Yang, Y.; Wu, B. Phosphorylation of NF-κBp65 drives inflammation-mediated hepatocellular carcinogenesis and is a novel therapeutic target. J. Exp. Clin. Cancer Res. 2021, 40, 253. [CrossRef]
- Haybaeck, J.; Zeller, N.; Wolf, M.J.; Weber, A.; Wagner, U.; Kurrer, M.O.; Bremer, J.; Iezzi, G.; Graf, R.; Clavien, P.-A.; et al. A lymphotoxin-driven pathway to hepatocellular carcinoma. Cancer Cell 2009, 16, 295–308. [CrossRef]
- Pikarsky, E.; Porat, R.M.; Stein, I.; Abramovitch, R.; Amit, S.; Kasem, S.; Gutkovich-Pyest, E.; Urieli-Shoval, S.; Galun, E.; Ben-Neriah, Y. NF-kappaB functions as a tumour promoter in inflammation-associated cancer. Nature 2004, 431, 461–466. [CrossRef]
- He, G.; Karin, M. NF-κB and STAT3 - key players in liver inflammation and cancer. Cell Res. 2011, 21, 159–168. [CrossRef]
- Makino, Y.; Hikita, H.; Kato, S.; Sugiyama, M.; Shigekawa, M.; Sakamoto, T.; Sasaki, Y.; Murai, K.; Sakane, S.; Kodama, T.; et al. STAT3 is Activated by CTGF-mediated Tumor-stroma Cross Talk to Promote HCC Progression. Cell. Mol. Gastroenterol. Hepatol. 2023, 15, 99–119. [CrossRef]
- Hoesel, B.; Schmid, J.A. The complexity of NF-κB signaling in inflammation and cancer. Mol. Cancer 2013, 12, 86. [CrossRef]
- Novo, E.; Cappon, A.; Villano, G.; Quarta, S.; Cannito, S.; Bocca, C.; Turato, C.; Guido, M.; Maggiora, M.; Protopapa, F.; et al. SerpinB3 as a Pro-Inflammatory Mediator in the Progression of Experimental Non-Alcoholic Fatty Liver Disease. Front. Immunol. 2022, 13, 910526. [CrossRef]
- Yamagishi, R.; Kamachi, F.; Nakamura, M.; Yamazaki, S.; Kamiya, T.; Takasugi, M.; Cheng, Y.; Nonaka, Y.; Yukawa-Muto, Y.; Thuy, L.T.T.; et al. Gasdermin D-mediated release of IL-33 from senescent hepatic stellate cells promotes obesity-associated hepatocellular carcinoma. Sci. Immunol. 2022, 7, eabl7209. [CrossRef]
- Ploeger, C.; Schreck, J.; Huth, T.; Fraas, A.; Albrecht, T.; Charbel, A.; Ji, J.; Singer, S.; Breuhahn, K.; Pusch, S.; et al. STAT1 and STAT3 Exhibit a Crosstalk and Are Associated with Increased Inflammation in Hepatocellular Carcinoma. Cancers (Basel) 2022, 14. [CrossRef]
- Fujii, M.; Shibazaki, Y.; Wakamatsu, K.; Honda, Y.; Kawauchi, Y.; Suzuki, K.; Arumugam, S.; Watanabe, K.; Ichida, T.; Asakura, H.; Yoneyama, H. A murine model for non-alcoholic steatohepatitis showing evidence of association between diabetes and hepatocellular carcinoma. Med. Mol. Morphol. 2013, 46, 141–152. [CrossRef]
- Asgharpour, A.; Cazanave, S.C.; Pacana, T.; Seneshaw, M.; Vincent, R.; Banini, B.A.; Kumar, D.P.; Daita, K.; Min, H.-K.; Mirshahi, F.; et al. A diet-induced animal model of non-alcoholic fatty liver disease and hepatocellular cancer. J. Hepatol. 2016, 65, 579–588. [CrossRef]
- Saxena, N.K.; Ikeda, K.; Rockey, D.C.; Friedman, S.L.; Anania, F.A. Leptin in hepatic fibrosis: evidence for increased collagen production in stellate cells and lean littermates of ob/ob mice. Hepatology 2002, 35, 762–771. [CrossRef]
- Sahai, A.; Malladi, P.; Pan, X.; Paul, R.; Melin-Aldana, H.; Green, R.M.; Whitington, P.F. Obese and diabetic db/db mice develop marked liver fibrosis in a model of nonalcoholic steatohepatitis: role of short-form leptin receptors and osteopontin. Am. J. Physiol. Gastrointest. Liver Physiol. 2004, 287, G1035-43. [CrossRef]
- Nevzorova, Y.A.; Boyer-Diaz, Z.; Cubero, F.J.; Gracia-Sancho, J. Animal models for liver disease - A practical approach for translational research. J. Hepatol. 2020, 73, 423–440. [CrossRef]
- Farrell, G.; Schattenberg, J.M.; Leclercq, I.; Yeh, M.M.; Goldin, R.; Teoh, N.; Schuppan, D. Mouse models of nonalcoholic steatohepatitis: toward optimization of their relevance to human nonalcoholic steatohepatitis. Hepatology 2019, 69, 2241–2257. [CrossRef]
- Ikawa-Yoshida, A.; Matsuo, S.; Kato, A.; Ohmori, Y.; Higashida, A.; Kaneko, E.; Matsumoto, M. Hepatocellular carcinoma in a mouse model fed a choline-deficient, L-amino acid-defined, high-fat diet. Int. J. Exp. Pathol. 2017, 98, 221–233. [CrossRef]
- Verna, L.; Whysner, J.; Williams, G.M. N-nitrosodiethylamine mechanistic data and risk assessment: bioactivation, DNA-adduct formation, mutagenicity, and tumor initiation. Pharmacol. Ther. 1996, 71, 57–81. [CrossRef]
- Li, S.; Ghoshal, S.; Sojoodi, M.; Arora, G.; Masia, R.; Erstad, D.J.; Lanuti, M.; Hoshida, Y.; Baumert, T.F.; Tanabe, K.K.; Fuchs, B.C. Pioglitazone reduces hepatocellular carcinoma development in two rodent models of cirrhosis. J. Gastrointest. Surg. 2019, 23, 101–111. [CrossRef]
- Hayes, J.D.; Dinkova-Kostova, A.T.; Tew, K.D. Oxidative stress in cancer. Cancer Cell 2020, 38, 167–197. [CrossRef]
- Semenza, G.L. Hypoxia-inducible factor 1: regulator of mitochondrial metabolism and mediator of ischemic preconditioning. Biochim. Biophys. Acta 2011, 1813, 1263–1268. [CrossRef]
- Warburg, O. On the Origin of Cancer Cells. Science 1956, 123, 309–314. [CrossRef]
- Vander Heiden, M.G.; Cantley, L.C.; Thompson, C.B. Understanding the Warburg effect: the metabolic requirements of cell proliferation. Science 2009, 324, 1029–1033. [CrossRef]
- Dong, S.; Liang, S.; Cheng, Z.; Zhang, X.; Luo, L.; Li, L.; Zhang, W.; Li, S.; Xu, Q.; Zhong, M.; et al. ROS/PI3K/Akt and Wnt/β-catenin signalings activate HIF-1α-induced metabolic reprogramming to impart 5-fluorouracil resistance in colorectal cancer. J. Exp. Clin. Cancer Res. 2022, 41, 15. [CrossRef]
- Wakiyama, K.; Kitajima, Y.; Tanaka, T.; Kaneki, M.; Yanagihara, K.; Aishima, S.; Nakamura, J.; Noshiro, H. Low-dose YC-1 combined with glucose and insulin selectively induces apoptosis in hypoxic gastric carcinoma cells by inhibiting anaerobic glycolysis. Sci. Rep. 2017, 7, 12653. [CrossRef]
- Shi, L.; Zhang, G.; Zheng, Z.; Lu, B.; Ji, L. Andrographolide reduced VEGFA expression in hepatoma cancer cells by inactivating HIF-1α: The involvement of JNK and MTA1/HDCA. Chem. Biol. Interact. 2017, 273, 228–236. [CrossRef]
- Shirozu, K.; Hirai, S.; Tanaka, T.; Hisaka, S.; Kaneki, M.; Ichinose, F. Farnesyltransferase inhibitor, tipifarnib, prevents galactosamine/lipopolysaccharide-induced acute liver failure. Shock 2014, 42, 570–577. [CrossRef]
- Cousin, S.P.; Hügl, S.R.; Wrede, C.E.; Kajio, H.; Myers, M.G.; Rhodes, C.J. Free fatty acid-induced inhibition of glucose and insulin-like growth factor I-induced deoxyribonucleic acid synthesis in the pancreatic beta-cell line INS-1. Endocrinology 2001, 142, 229–240. [CrossRef]
- Festing, M.F. On determining sample size in experiments involving laboratory animals. Lab. Anim. 2018, 52, 341–350. [CrossRef]
Disclaimer/Publisher’s Note: The statements, opinions and data contained in all publications are solely those of the individual author(s) and contributor(s) and not of MDPI and/or the editor(s). MDPI and/or the editor(s) disclaim responsibility for any injury to people or property resulting from any ideas, methods, instructions or products referred to in the content. |
© 2023 by the authors. Licensee MDPI, Basel, Switzerland. This article is an open access article distributed under the terms and conditions of the Creative Commons Attribution (CC BY) license (http://creativecommons.org/licenses/by/4.0/).


