Submitted:
07 June 2023
Posted:
08 June 2023
You are already at the latest version
Abstract
Keywords:
1. Introduction
2. Experimental
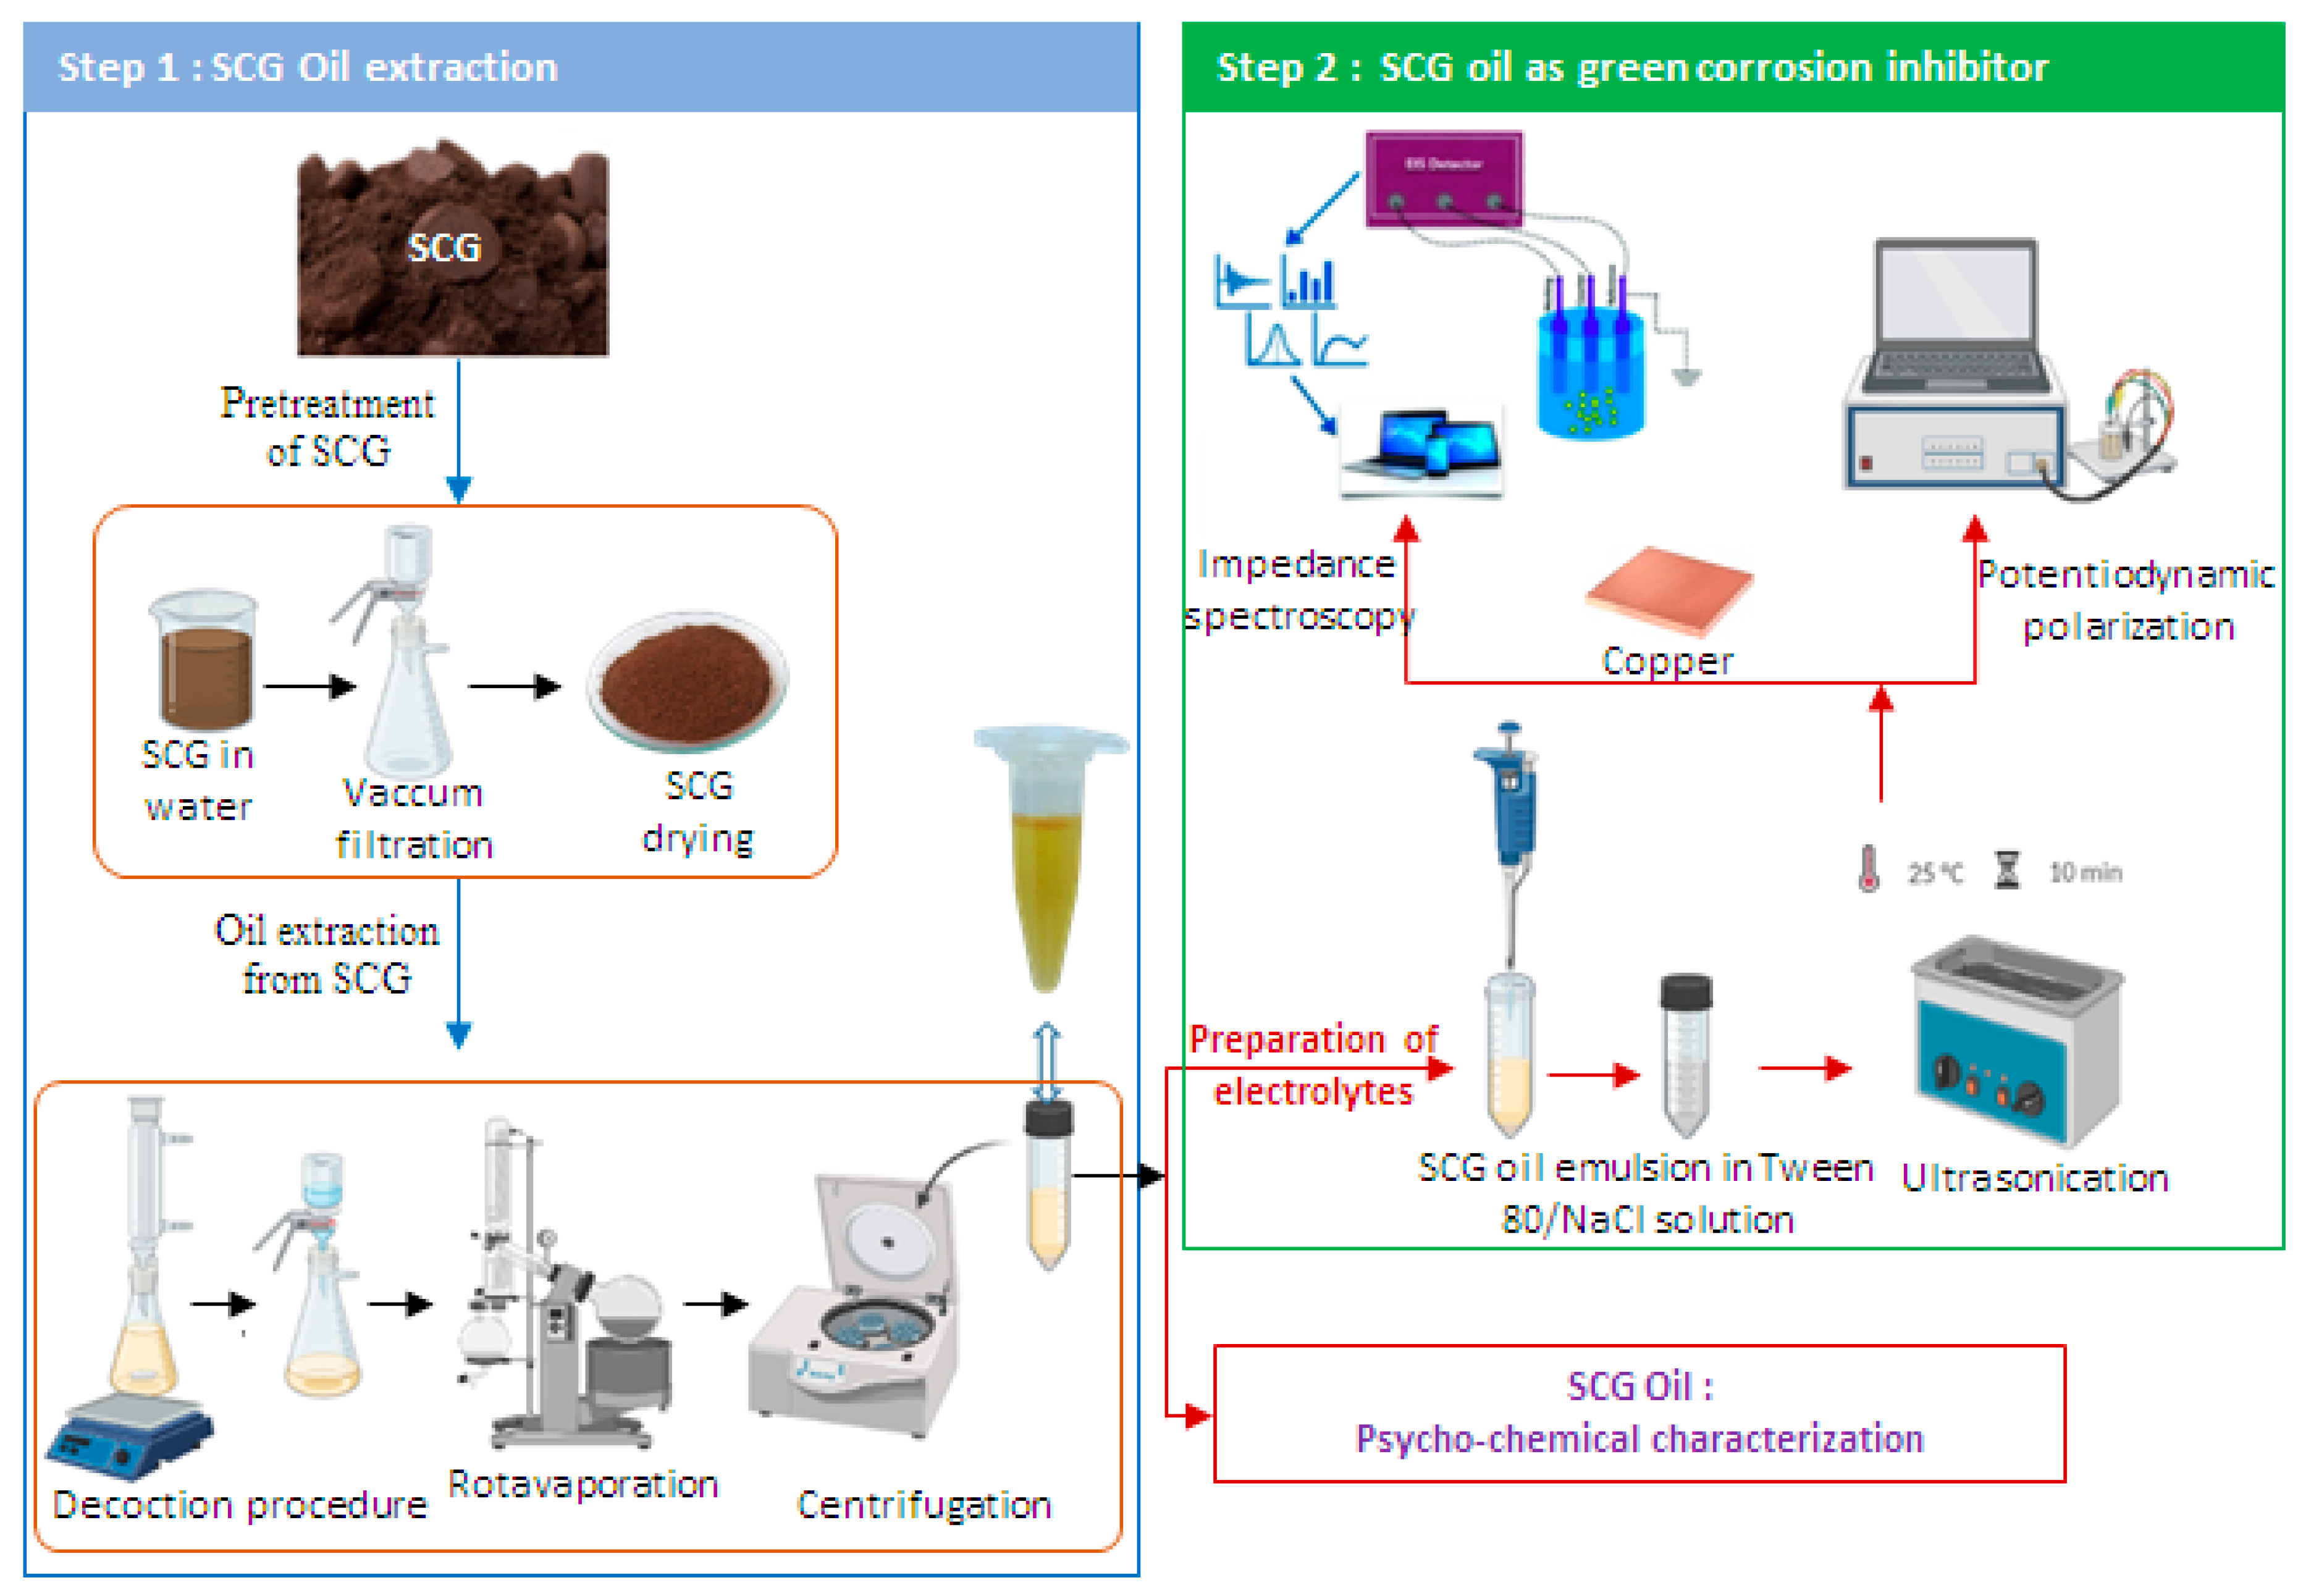
2.1. Inhibitor preparation
2.2. Characterization of the spent coffee grounds extract
2.3. Electrochemical measurements
3. Results and discussion
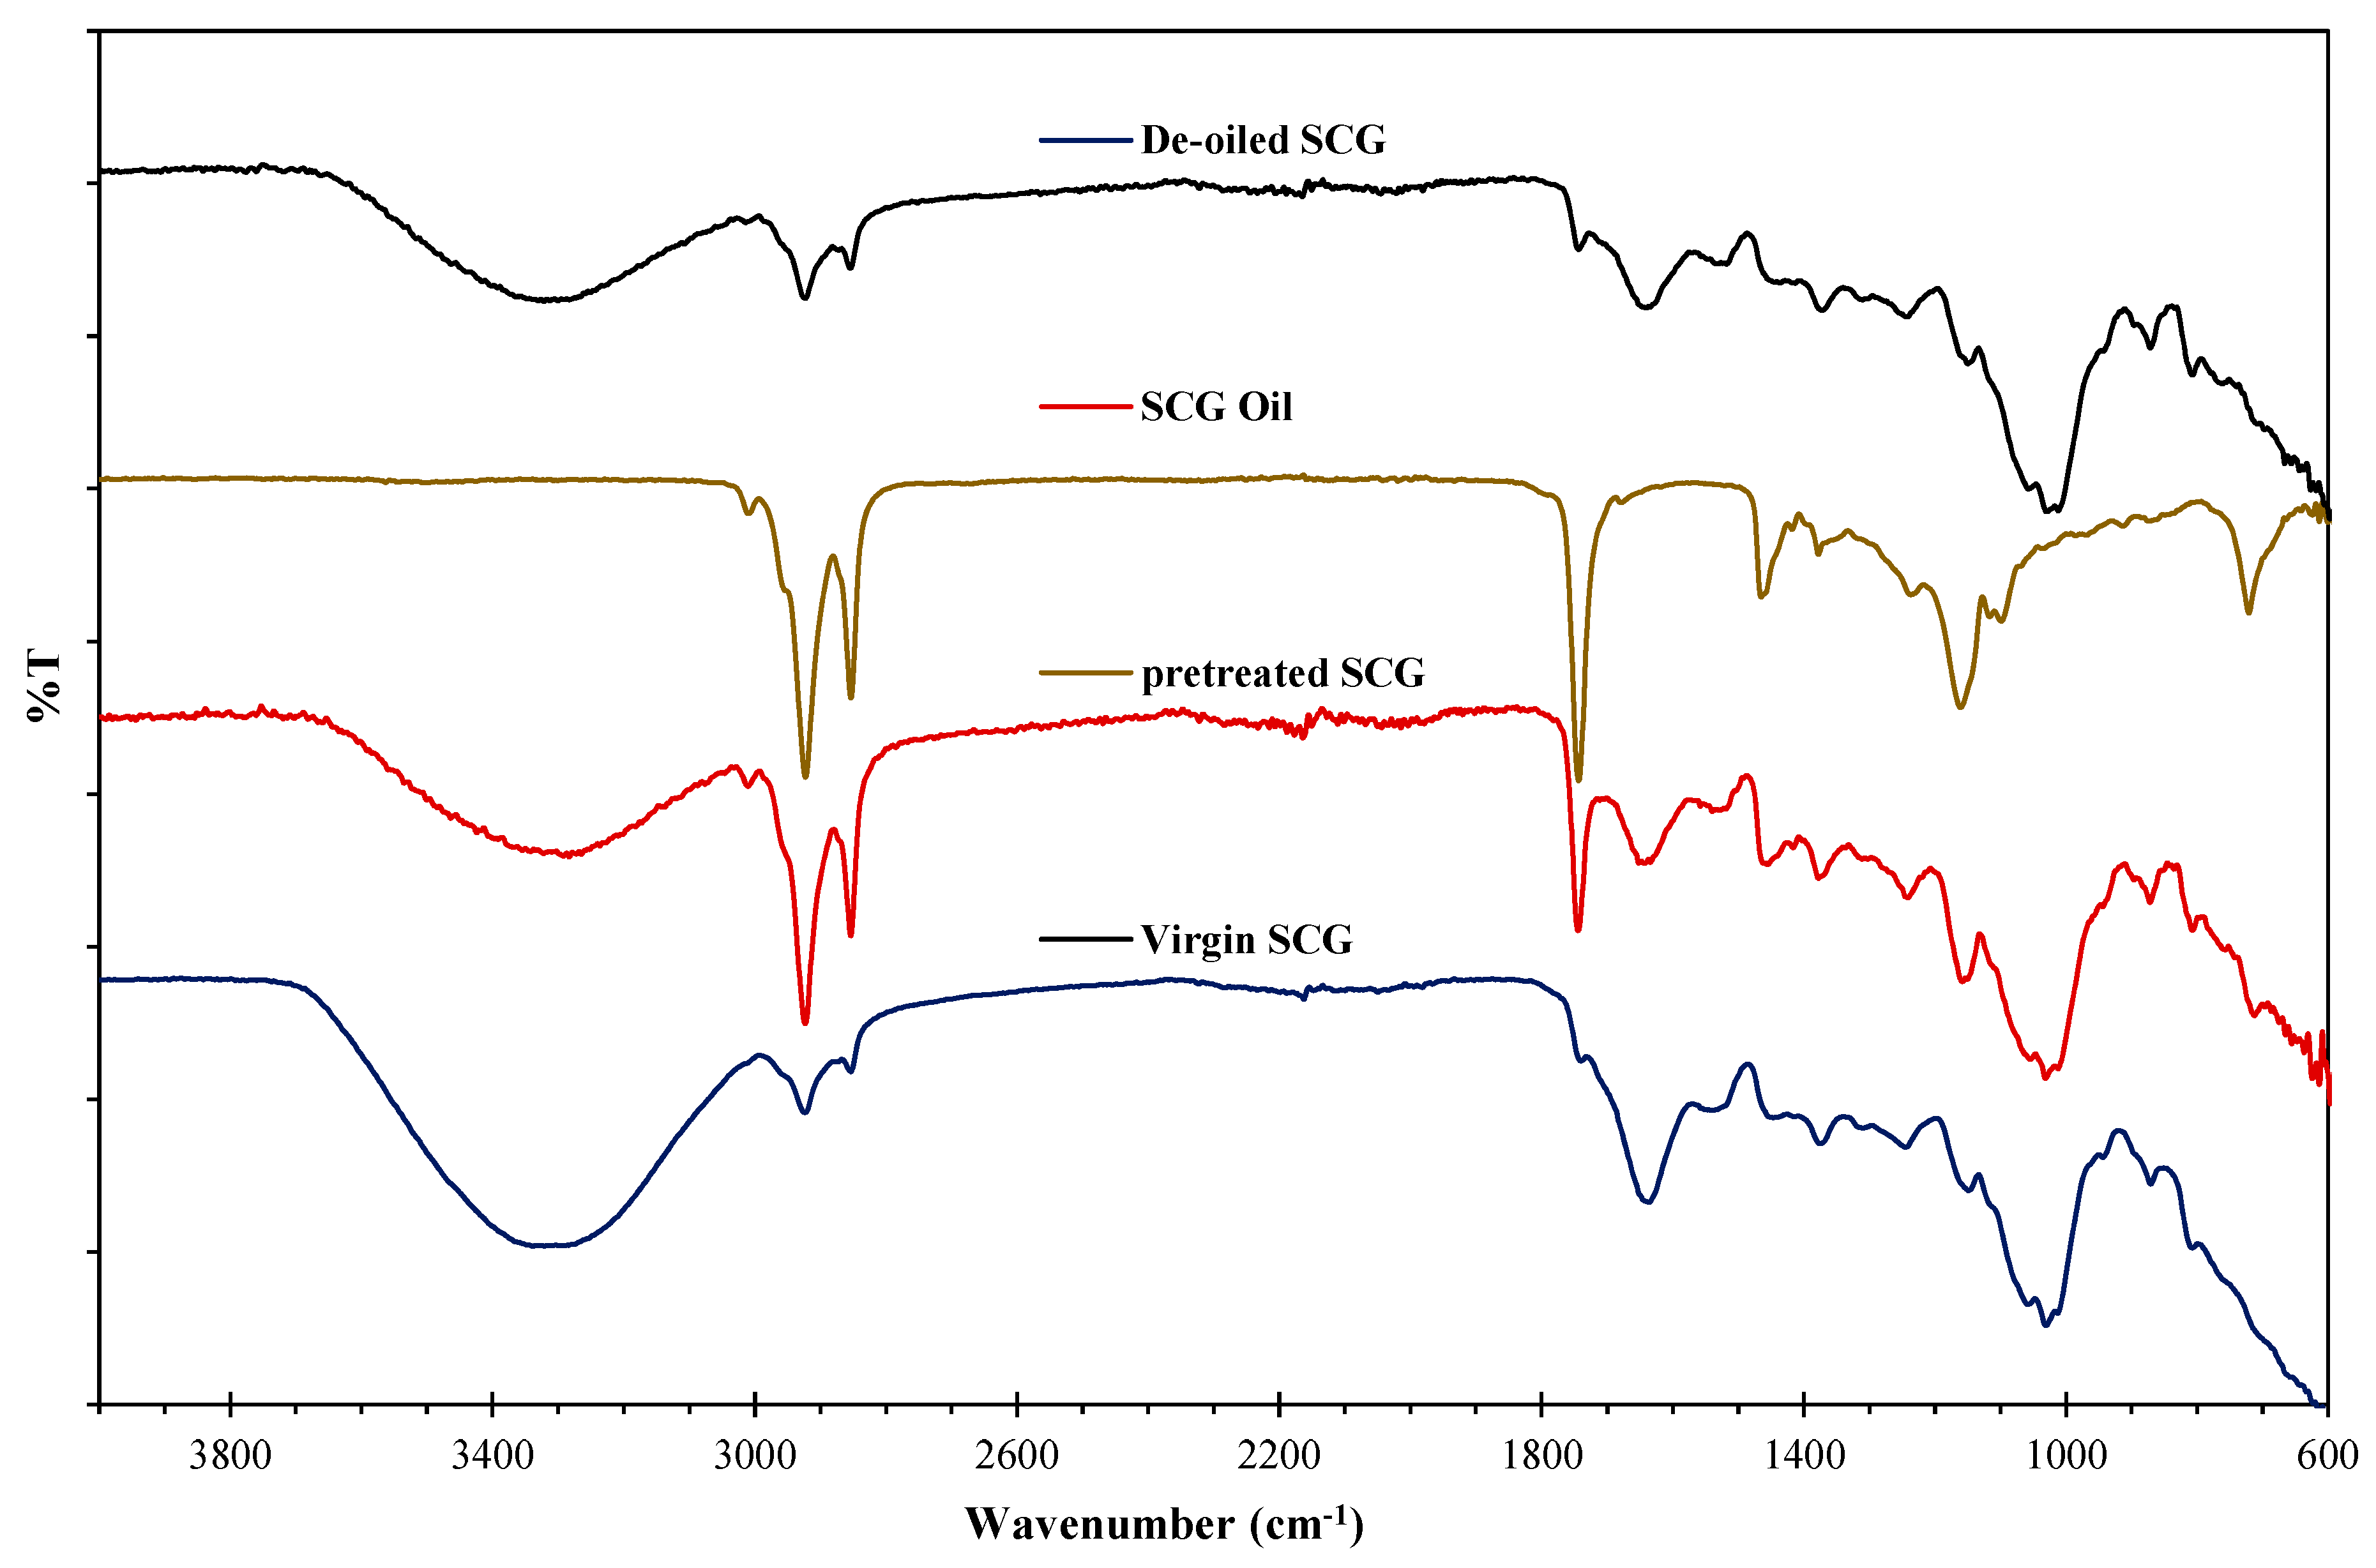
3.1. FT-IR spectral analysis
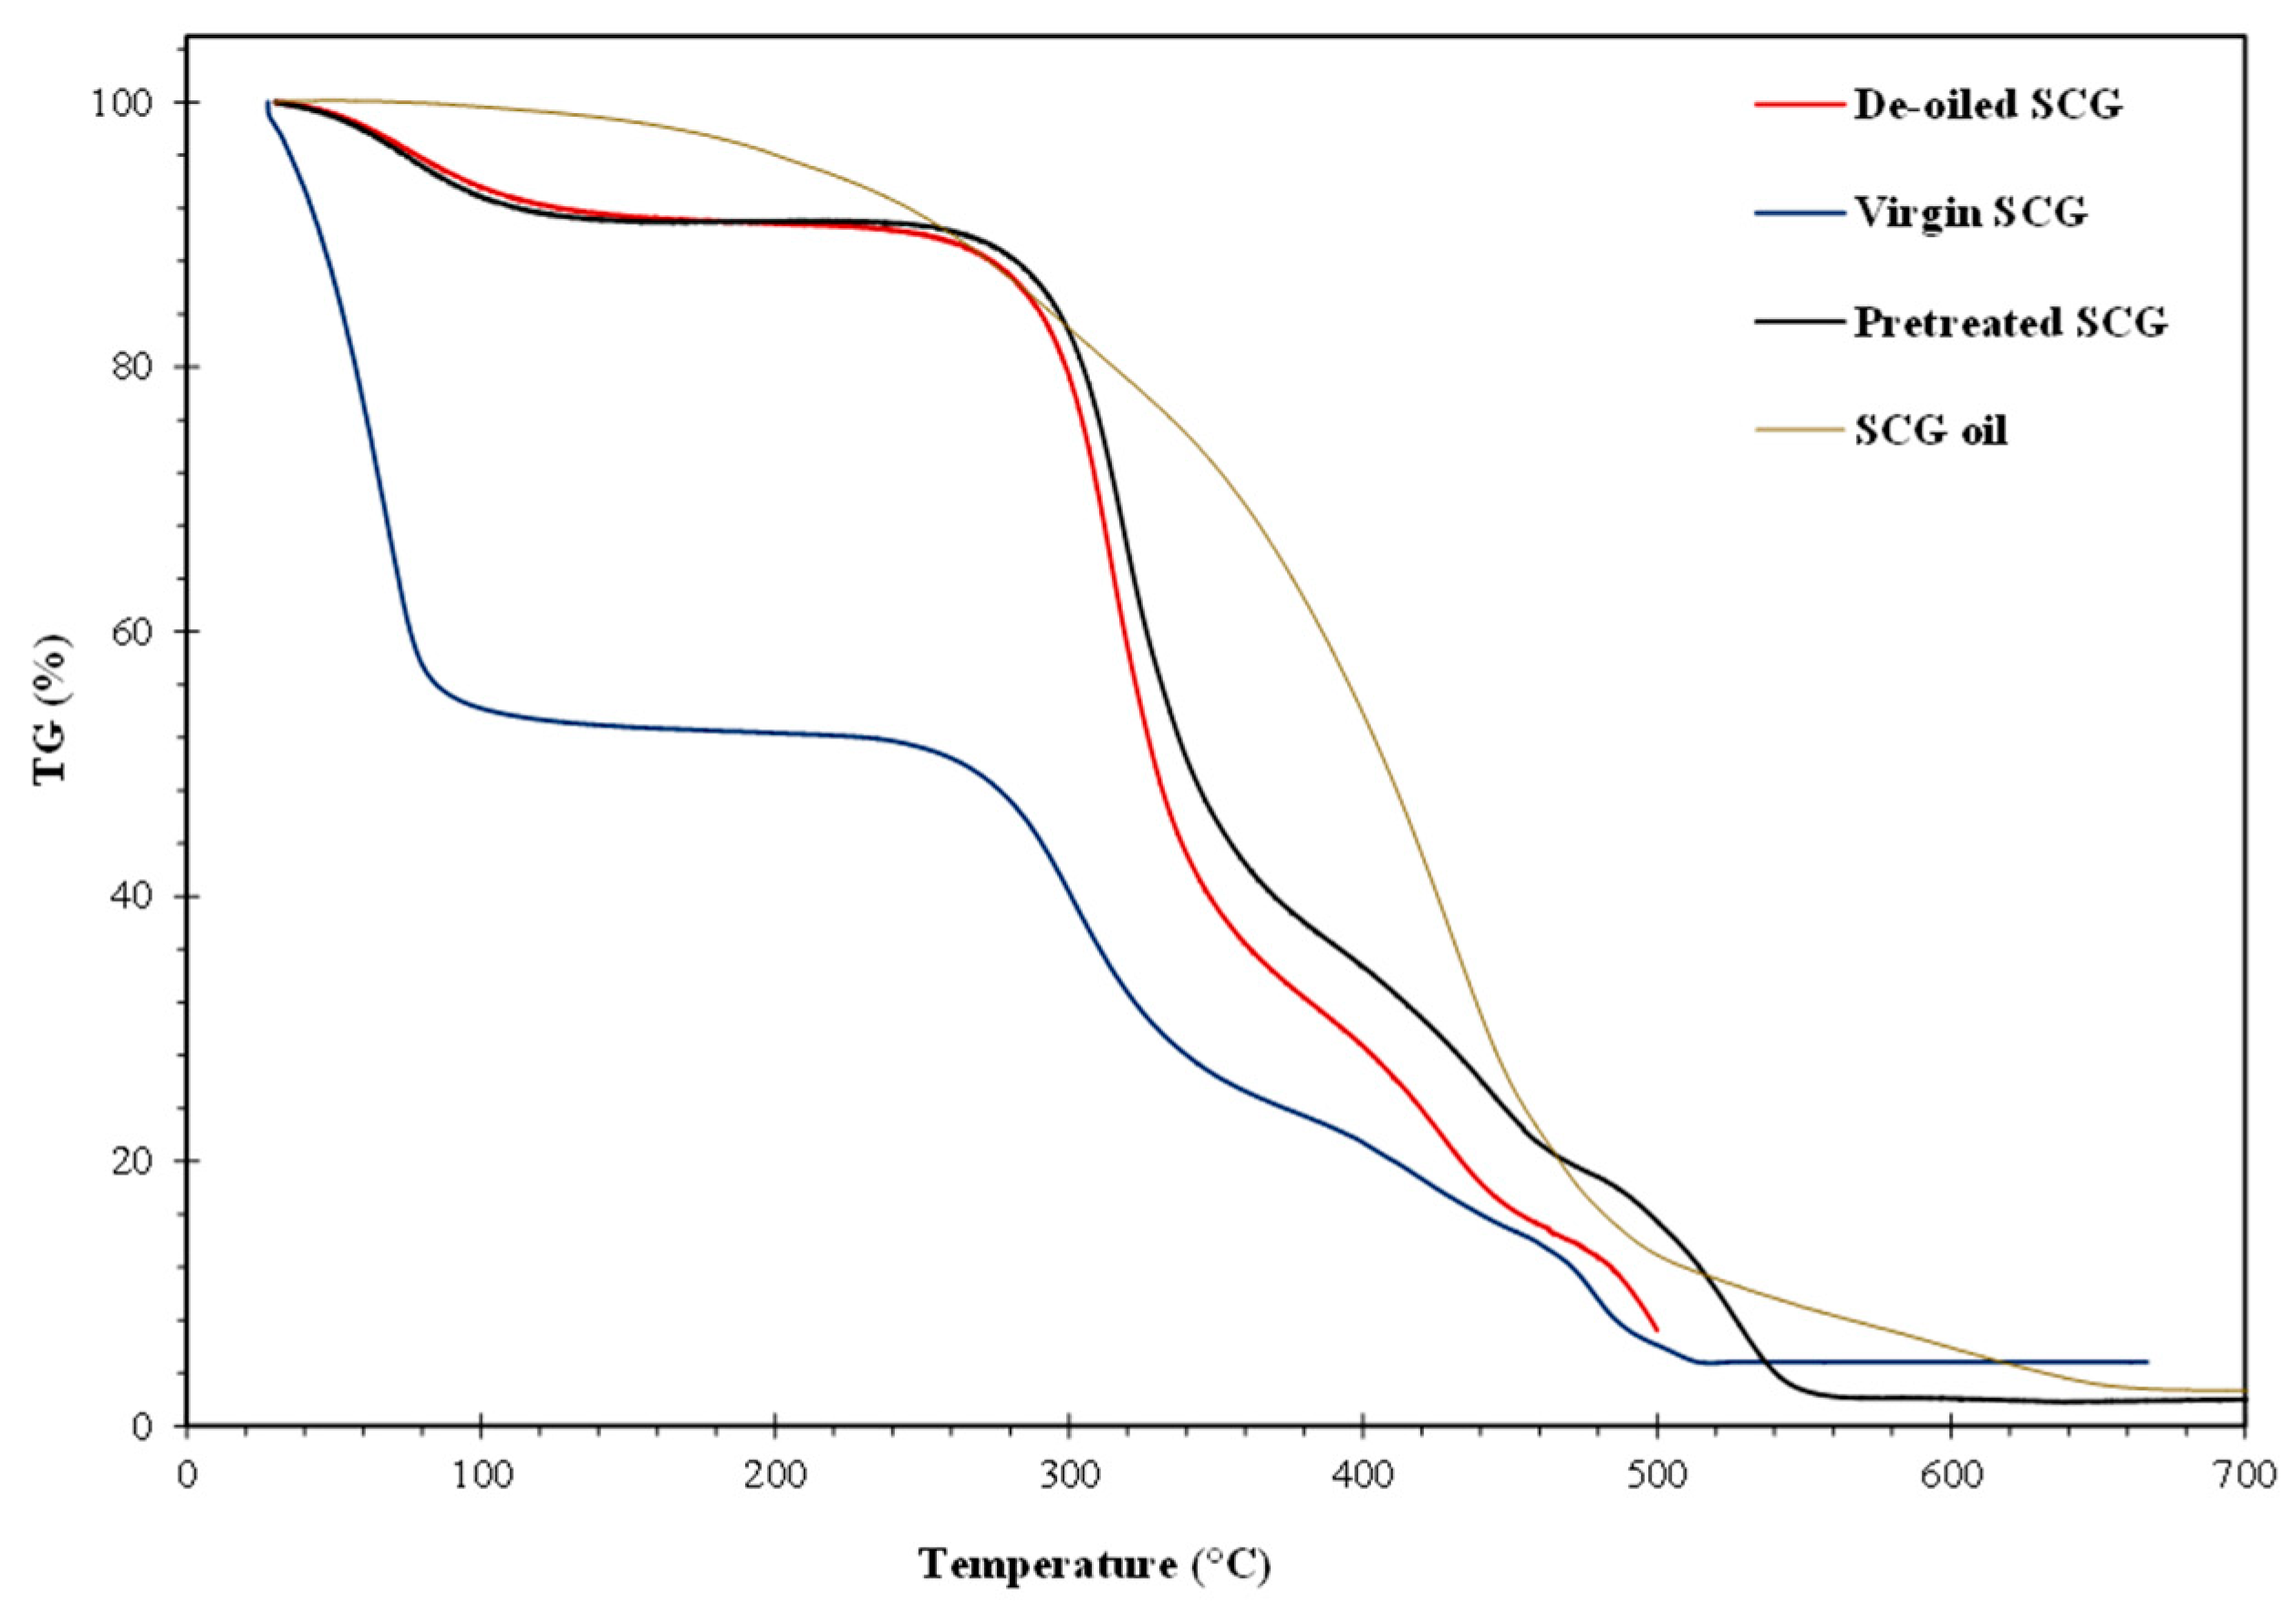
3.2. Thermogravimetric analysis:
3.3. Electrochemical studies
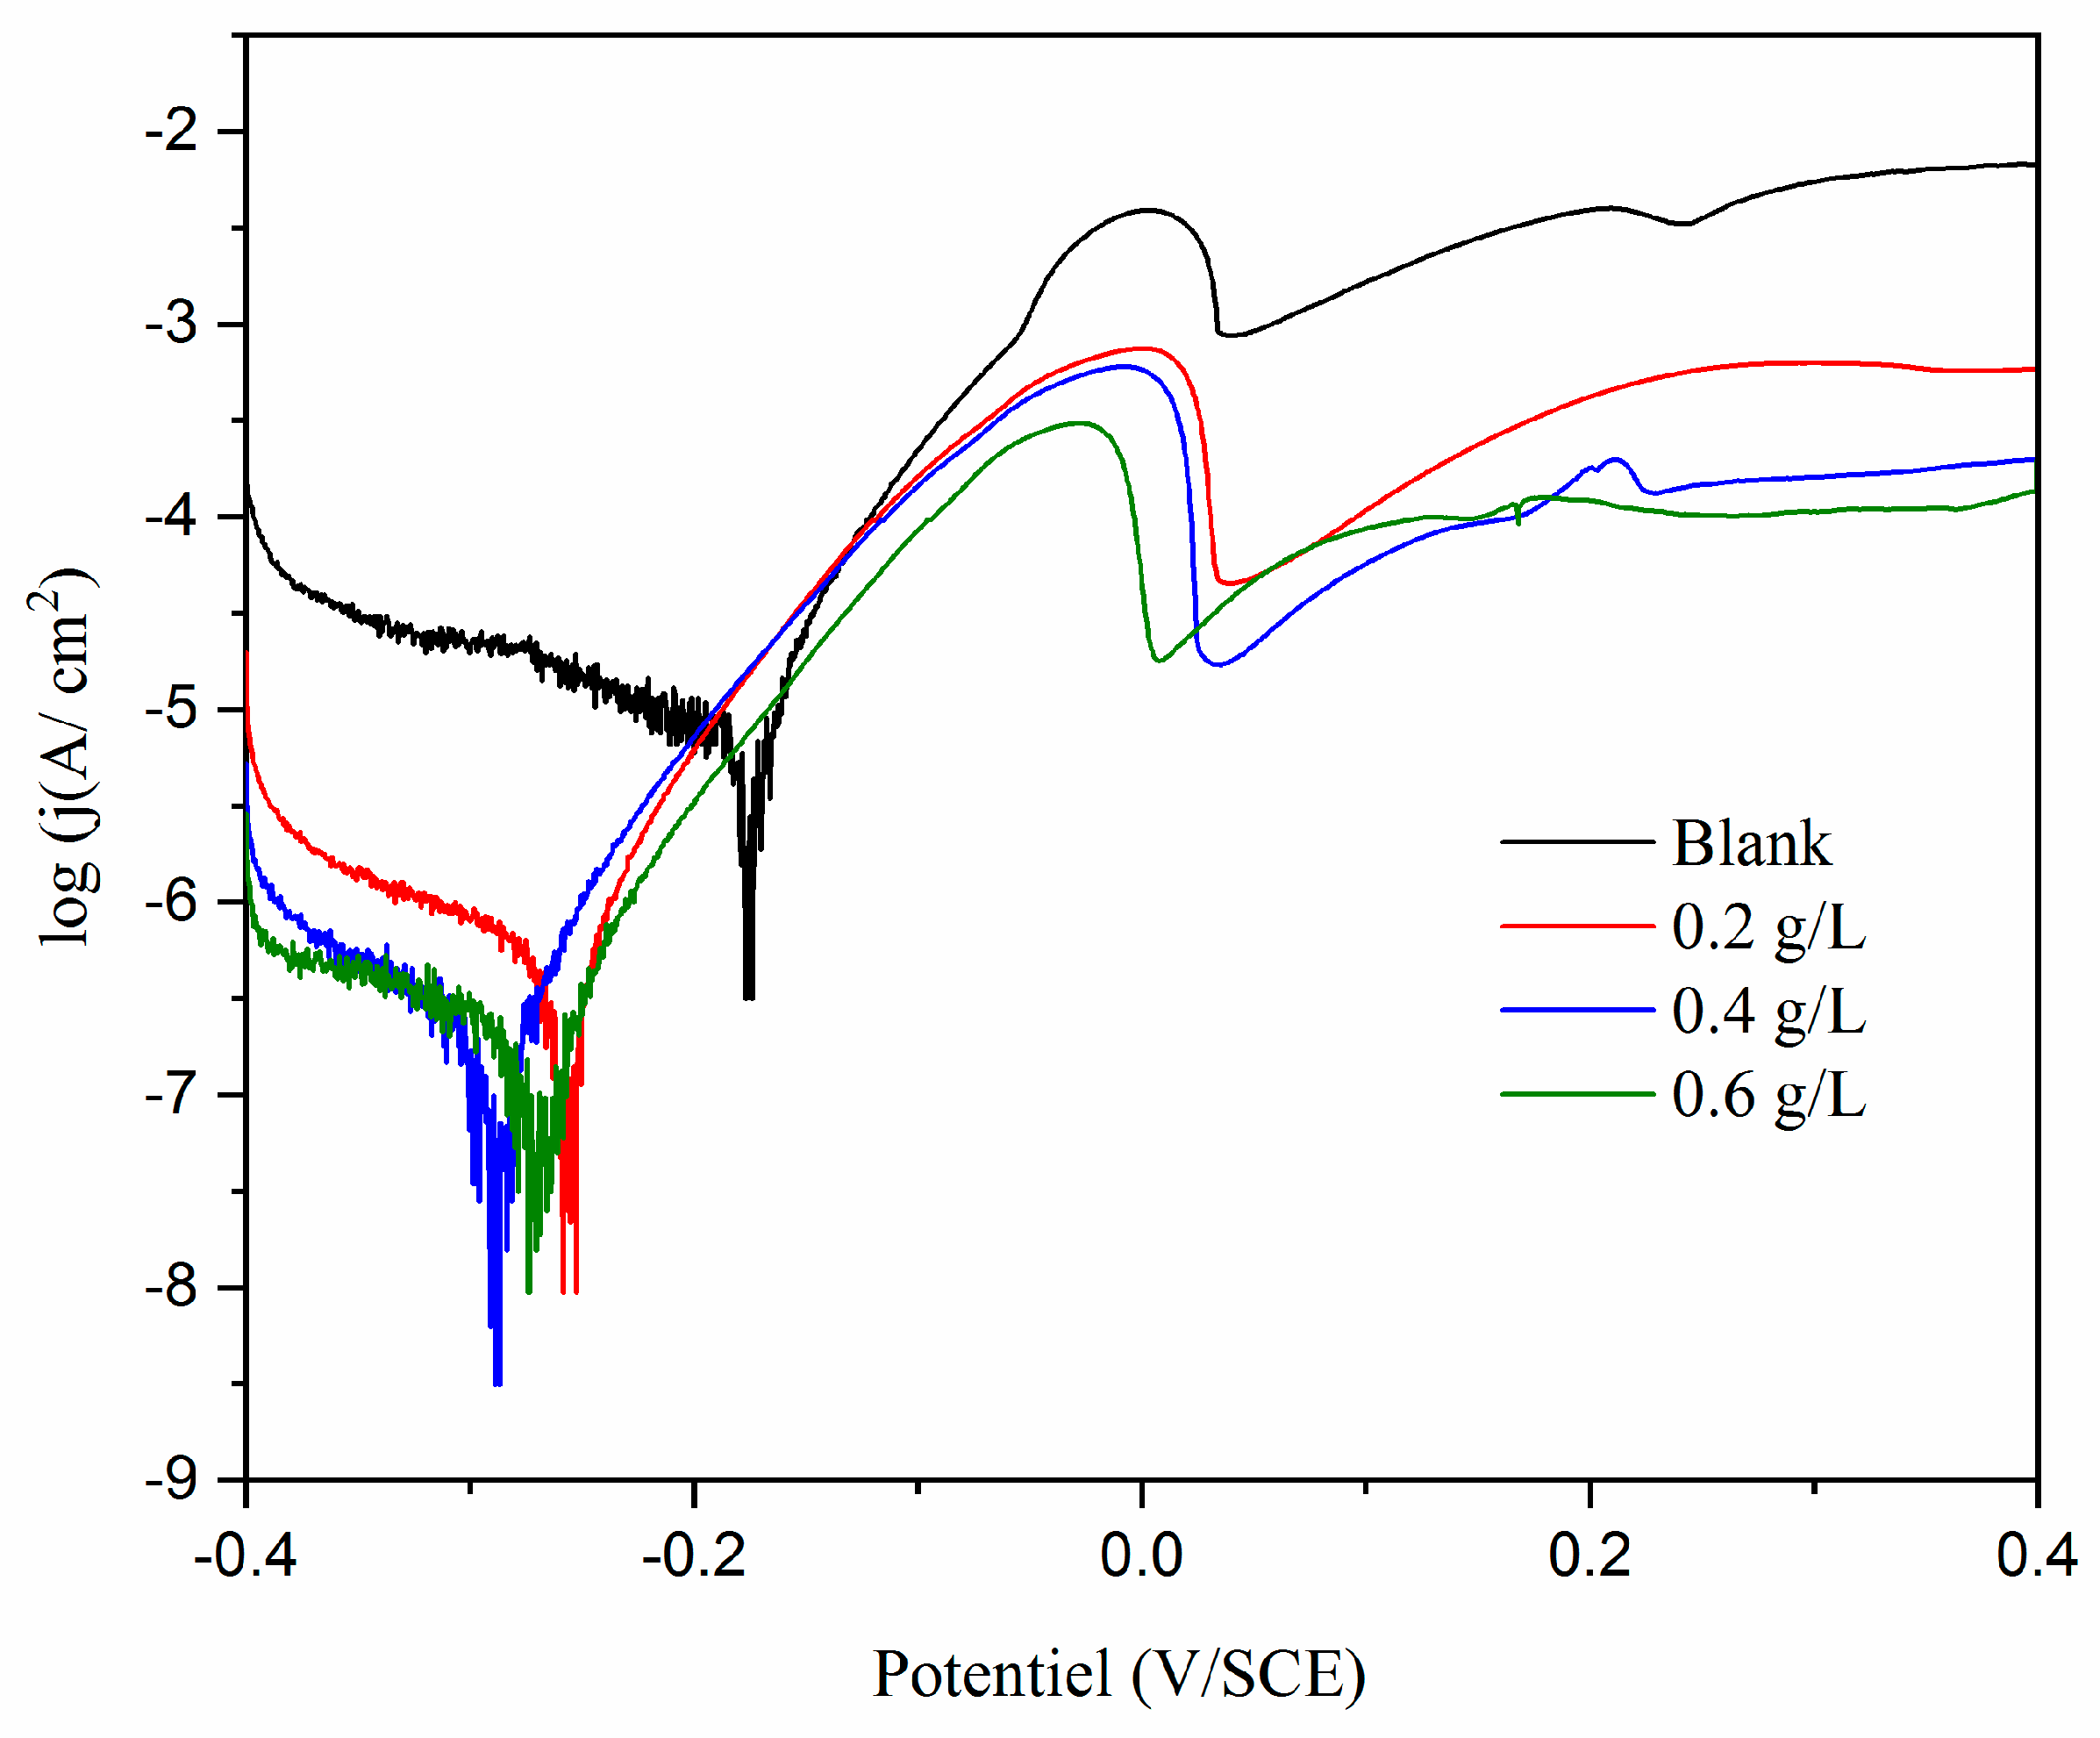
3.3.1. Potentiodynamic polarization between - 0.4 and + 0.4 V/SCE
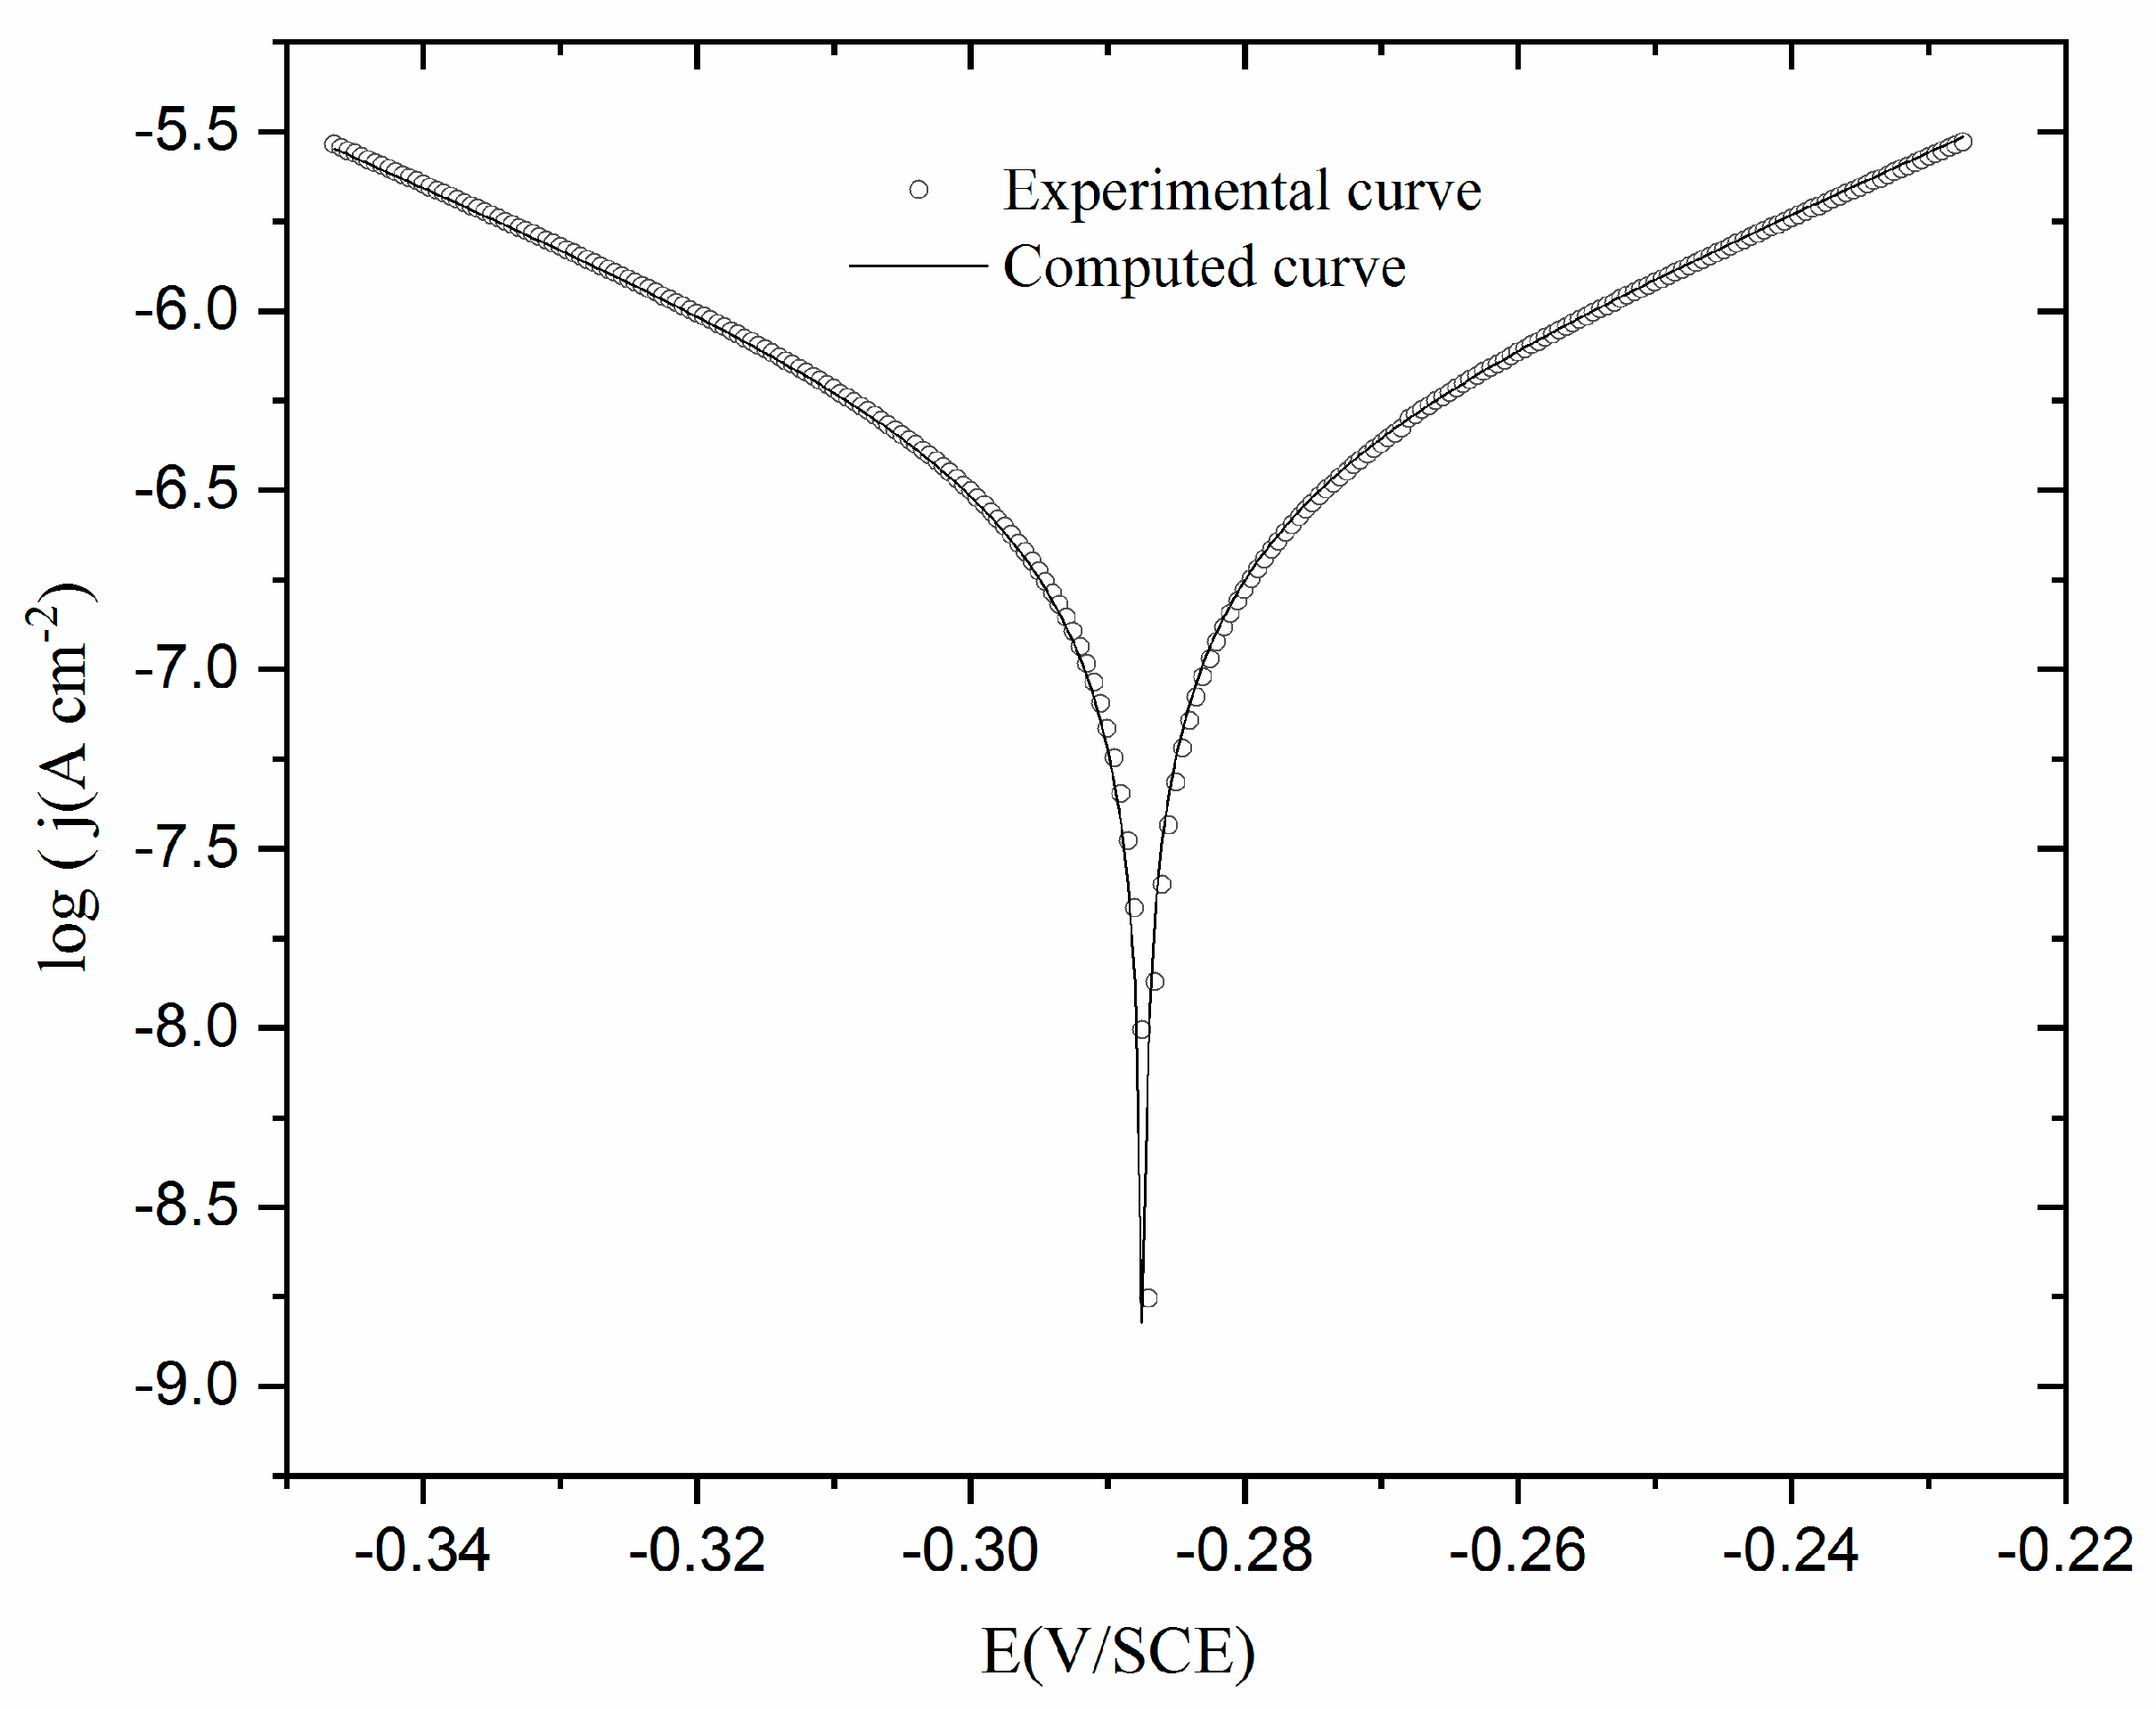
3.3.2. Voltammetry around OCP (ΔE=± 60 mV)
3.3.3. Electrochemical impedances spectroscopy (EIS)
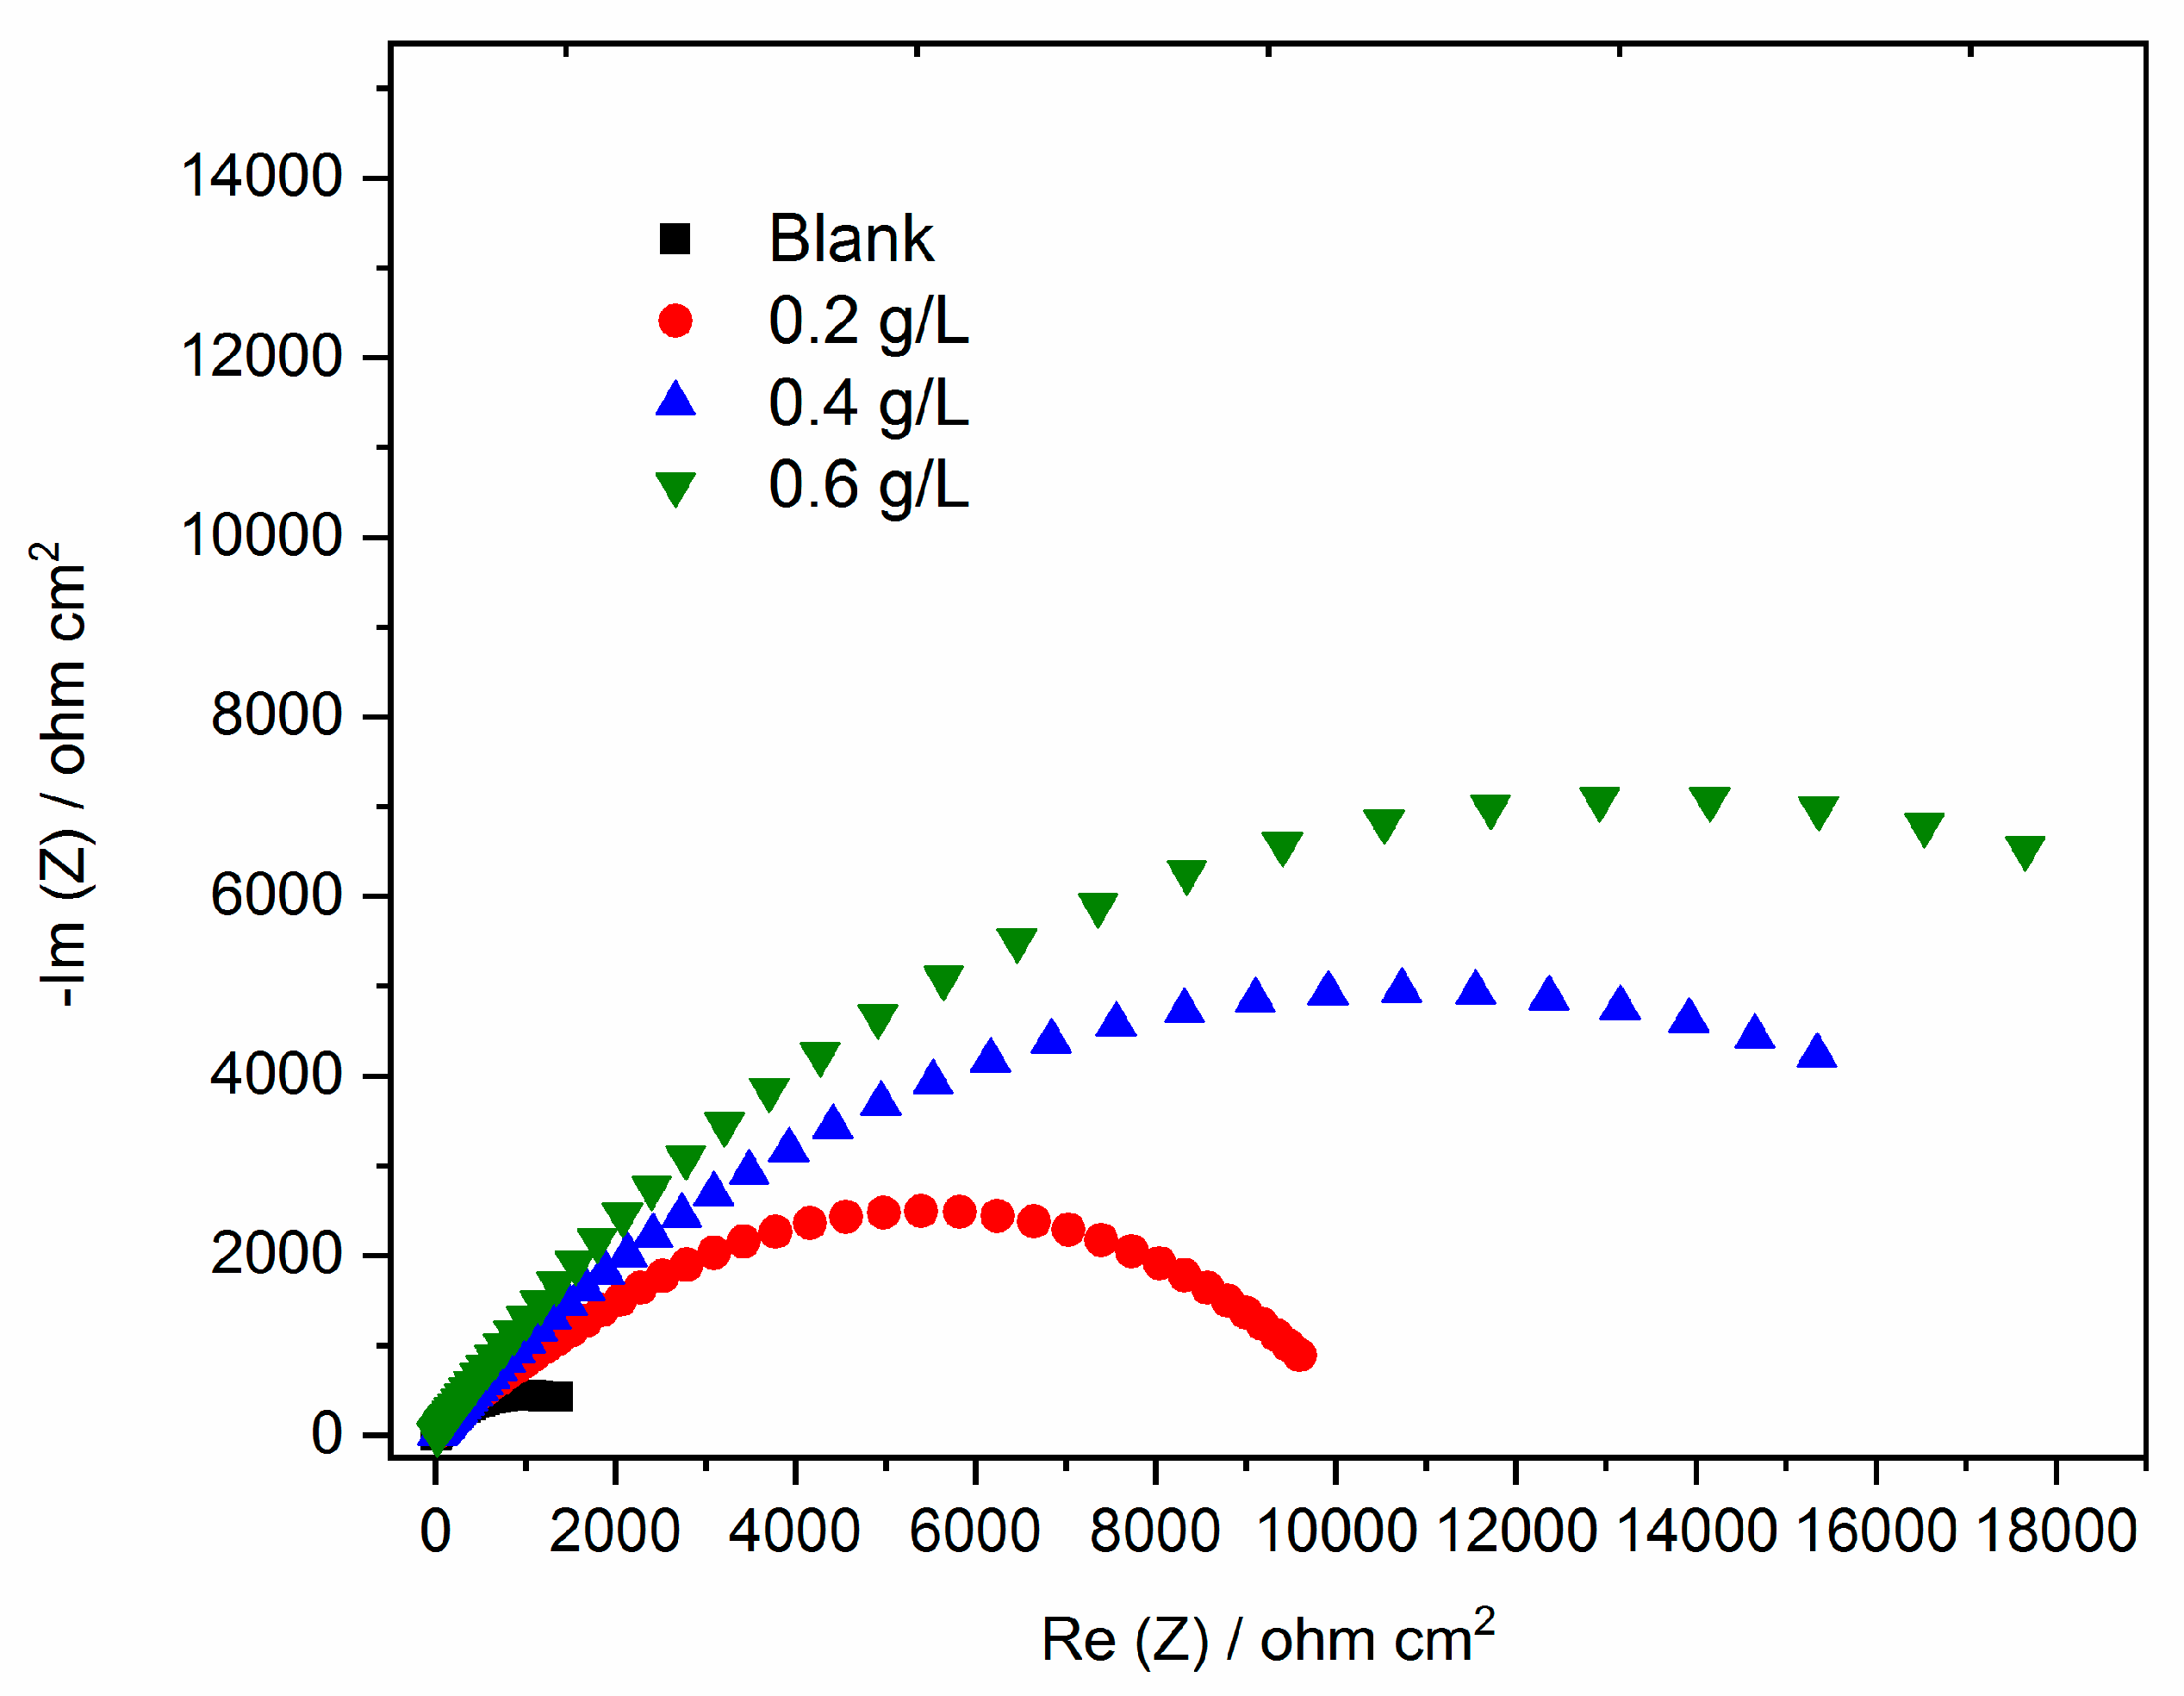
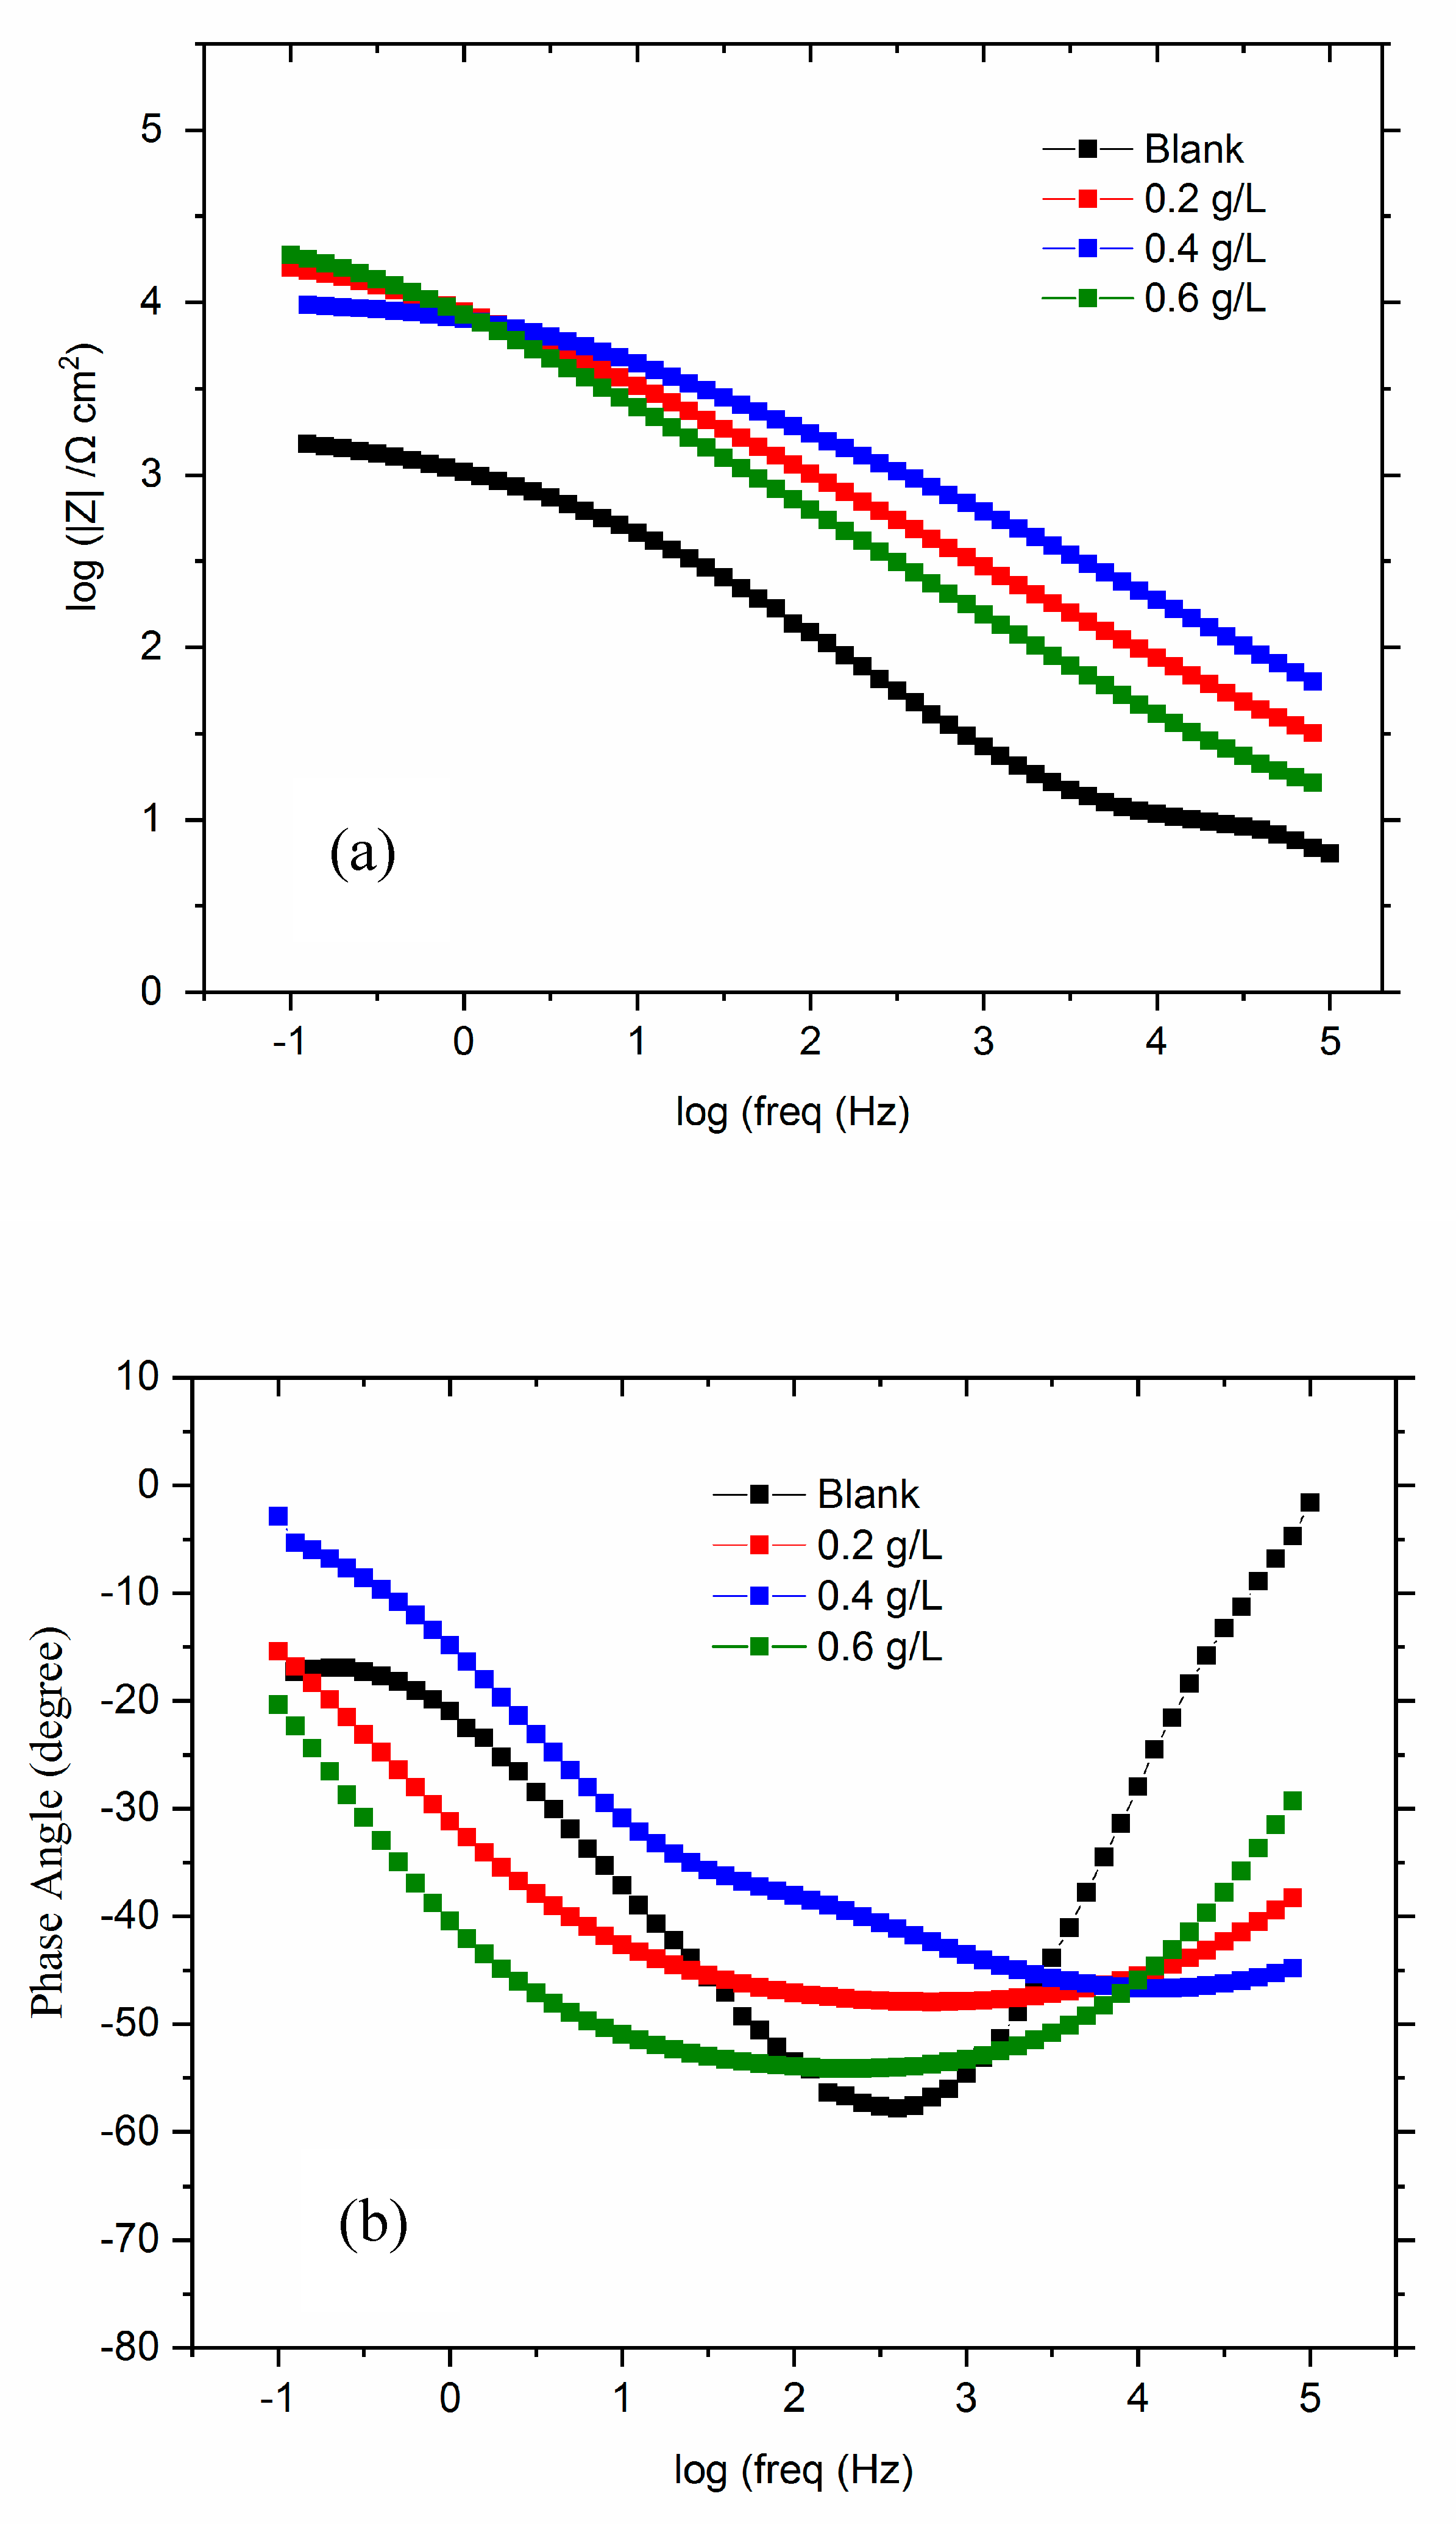
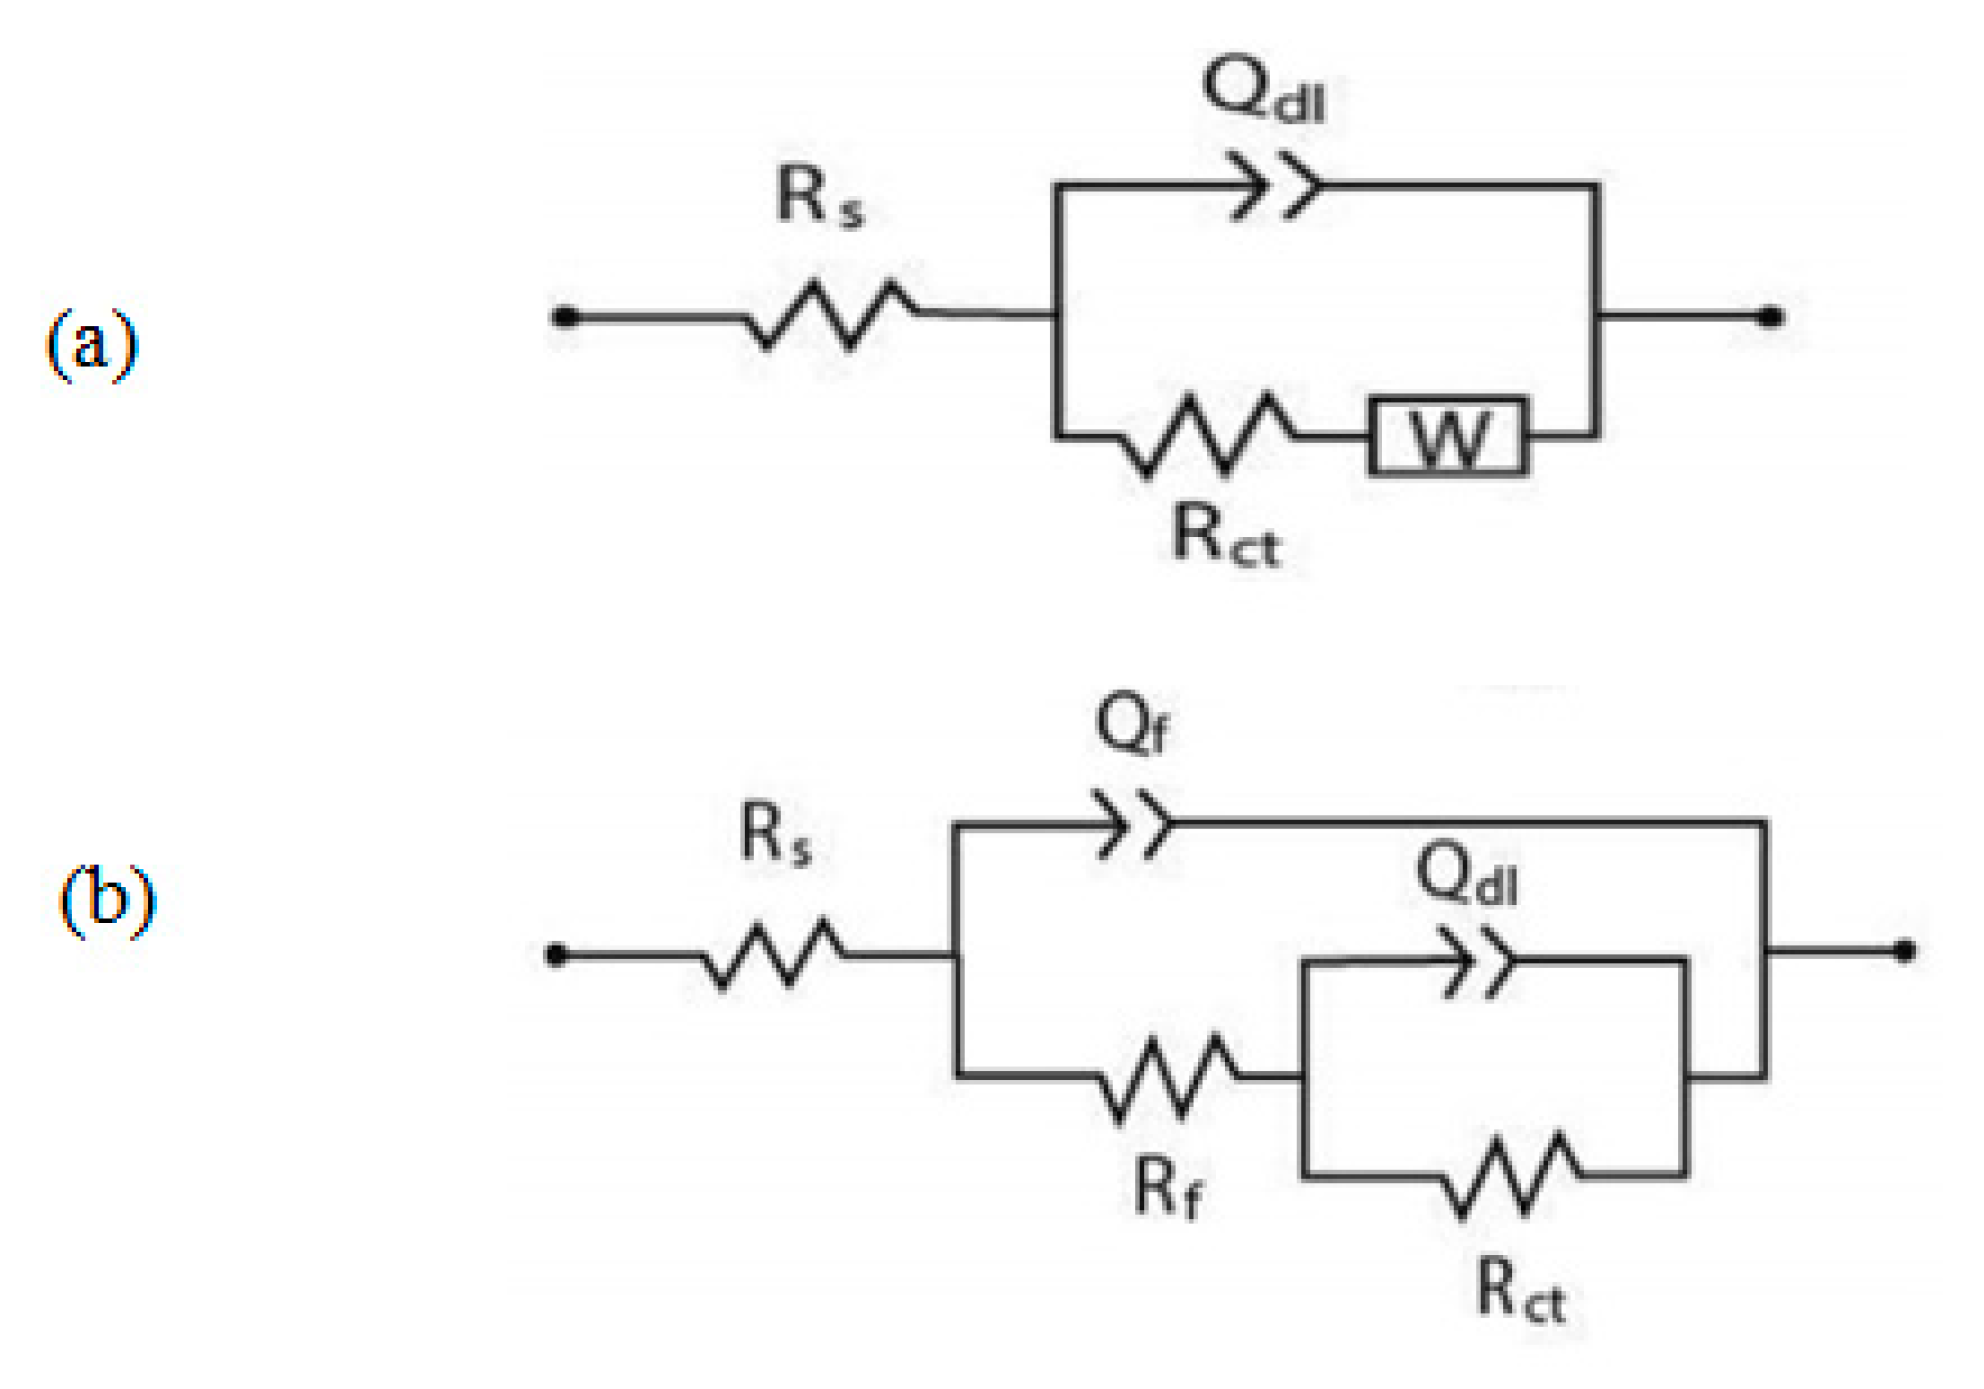
3.3.4. Adsorption isotherms modeling
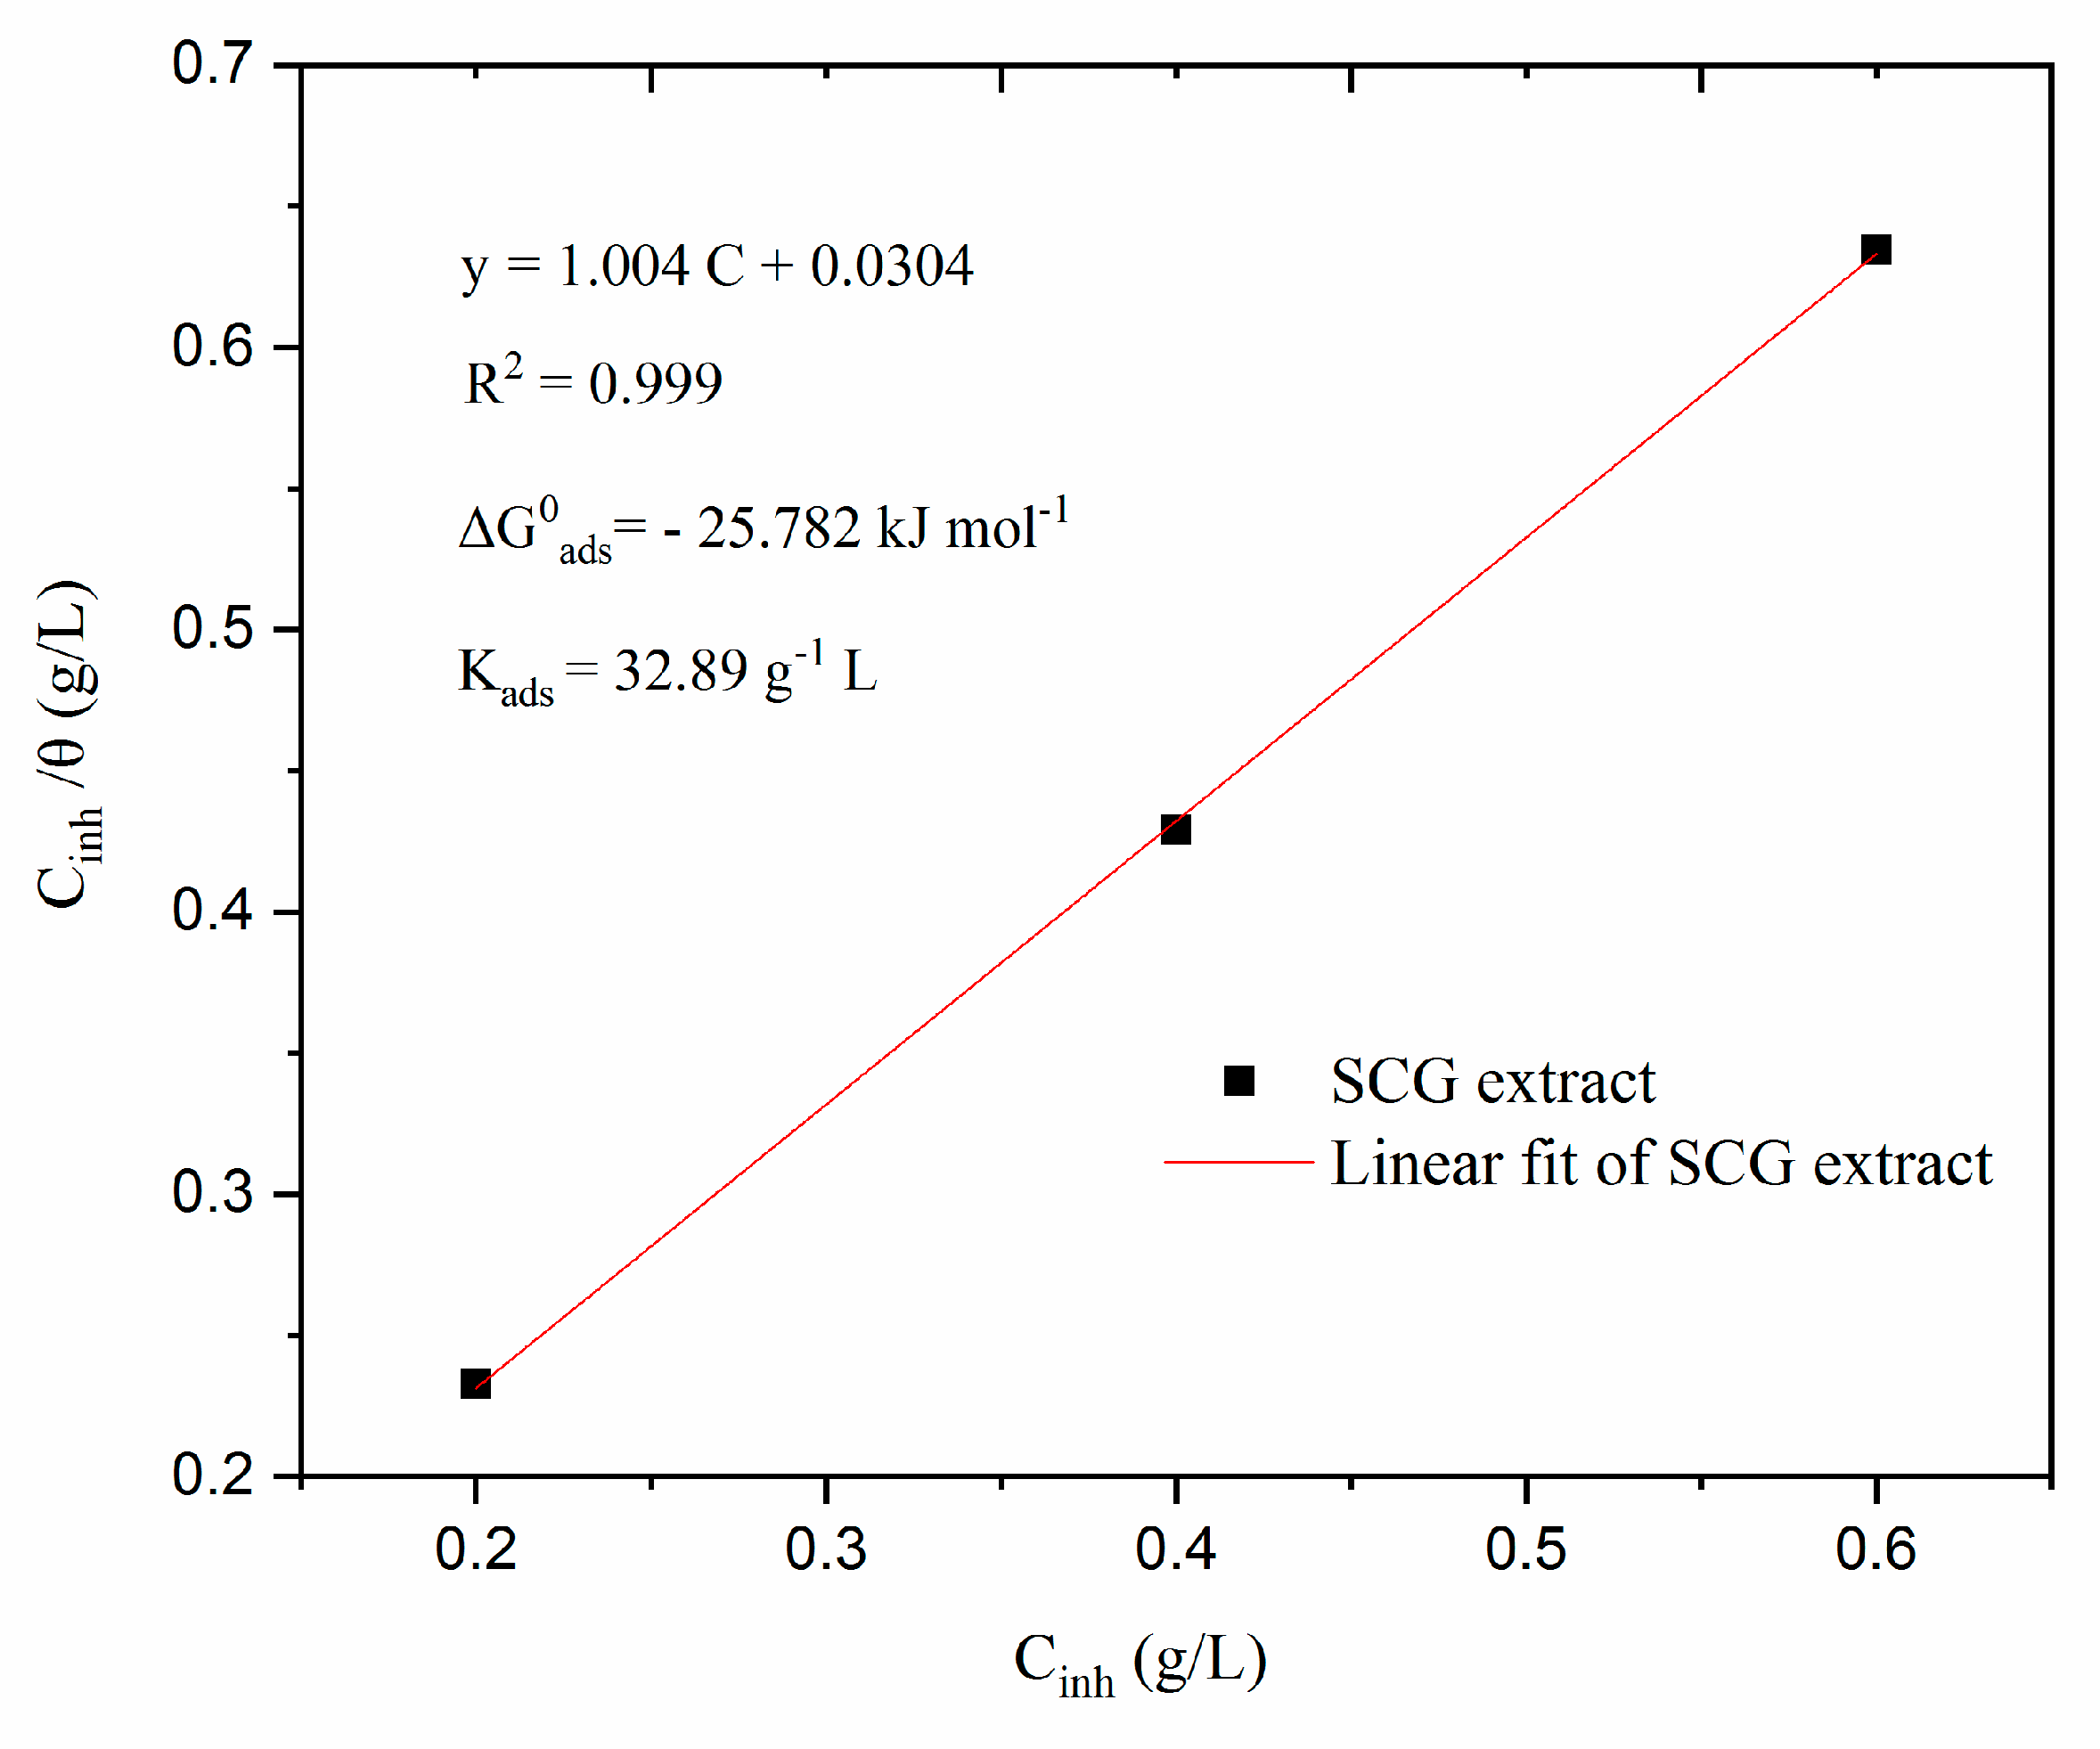
4. Conclusions
References
- Khaled, K.F. Corrosion Control of Copper in Nitric Acid Solutions Using Some Amino Acids–A Combined Experimental and Theoretical Study. Corros. Sci. 2010, 52, 3225–3234. [Google Scholar] [CrossRef]
- Dafali, A.; Hammouti, B.; Mokhlisse, R.; Kertit, S. Substituted Uracils as Corrosion Inhibitors for Copper in 3% NaCl Solution. Corros. Sci. 2003, 45, 1619–1630. [Google Scholar] [CrossRef]
- Hussin, M.H.; Kassim, M.J. The Corrosion Inhibition and Adsorption Behavior of Uncaria Gambir Extract on Mild Steel in 1 M HCl. Mater. Chem. Phys. 2011, 125, 461–468. [Google Scholar] [CrossRef]
- Kear, G.; Barker, B.D.; Walsh, F.C. Electrochemical Corrosion of Unalloyed Copper in Chloride Media—A Critical Review. Corros. Sci. 2004, 46, 109–135. [Google Scholar] [CrossRef]
- Refait, P.; Rahal, C.; Masmoudi, M. Corrosion Inhibition of Copper in 0.5 M NaCl Solutions by Aqueous and Hydrolysis Acid Extracts of Olive Leaf. J. Electroanal. Chem. 2020, 859, 113834. [Google Scholar] [CrossRef]
- Nunez, L.; Reguera, E.; Corvo, F.; Gonzalez, E.; Vazquez, C. Corrosion of Copper in Seawater and Its Aerosols in a Tropical Island. Corros. Sci. 2005, 47, 461–484. [Google Scholar] [CrossRef]
- Mellak, N.; Ghali, N.; Messaoudi, N.; Benhelima, A.; Ferhat, M.; Addou, A. Study of Corrosion Inhibition Properties of Schinus Molle Essential Oil on Carbon Steel in HCl. Mater. Corros. 2021, 72, 1270–1278. [Google Scholar] [CrossRef]
- Miralrio, A.; Espinoza Vázquez, A. Plant Extracts as Green Corrosion Inhibitors for Different Metal Surfaces and Corrosive Media: A Review. Processes 2020, 8, 942. [Google Scholar] [CrossRef]
- Chaubey, N.; Qurashi, A.; Chauhan, D.S.; Quraishi, M.A. Frontiers and Advances in Green and Sustainable Inhibitors for Corrosion Applications: A Critical Review. J. Mol. Liq. 2021, 321, 114385. [Google Scholar] [CrossRef]
- Alrefaee, S.H.; Rhee, K.Y.; Verma, C.; Quraishi, M.A.; Ebenso, E.E. Challenges and Advantages of Using Plant Extract as Inhibitors in Modern Corrosion Inhibition Systems: Recent Advancements. J. Mol. Liq. 2021, 321, 114666. [Google Scholar] [CrossRef]
- Wei, H.; Heidarshenas, B.; Zhou, L.; Hussain, G.; Li, Q.; Ostrikov, K.K. Green Inhibitors for Steel Corrosion in Acidic Environment: State of Art. Mater. Today Sustain. 2020, 10, 100044. [Google Scholar] [CrossRef]
- Daoudi, W.; El Aatiaoui, A.; Dagdag, O.; Zaidi, K.; Haldhar, R.; Kim, S.-C.; Oussaid, A.; Aouinti, A.; Berisha, A.; Benhiba, F. Anti-Corrosion Coating Formation by a Biopolymeric Extract of Artemisia Herba-Alba Plant: Experimental and Theoretical Investigations. Coatings 2023, 13, 611. [Google Scholar] [CrossRef]
- Haldhar, R.; Vanaraj, R.; Dagdag, O.; Berisha, A.; Kim, S.-C. Convolvulus Microphyllus Extract as a Green, Effective, and Affordable Corrosion Inhibitor: Theoretical Calculations and Experimental Studies. Coatings 2023, 13, 860. [Google Scholar] [CrossRef]
- Ballesteros, L.F.; Teixeira, J.A.; Mussatto, S.I. Extraction of Polysaccharides by Autohydrolysis of Spent Coffee Grounds and Evaluation of Their Antioxidant Activity. Carbohydr. Polym. 2017, 157, 258–266. [Google Scholar] [CrossRef]
- Shang, Y.-F.; Xu, J.-L.; Lee, W.-J.; Um, B.-H. Antioxidative Polyphenolics Obtained from Spent Coffee Grounds by Pressurized Liquid Extraction. South Afr. J. Bot. 2017, 109, 75–80. [Google Scholar] [CrossRef]
- Campos-Vega, R.; Loarca-Pina, G.; Vergara-Castaneda, H.A.; Oomah, B.D. Spent Coffee Grounds: A Review on Current Research and Future Prospects. Trends Food Sci. Technol. 2015, 45, 24–36. [Google Scholar] [CrossRef]
- Gómez-de la Cruz, F.J.; Cruz-Peragón, F.; Casanova-Pelaez, P.J.; Palomar-Carnicero, J.M. A Vital Stage in the Large-Scale Production of Biofuels from Spent Coffee Grounds: The Drying Kinetics. Fuel Process. Technol. 2015, 130, 188–196. [Google Scholar] [CrossRef]
- Karmee, S.K. A Spent Coffee Grounds Based Biorefinery for the Production of Biofuels, Biopolymers, Antioxidants and Biocomposites. Waste Manag. 2018, 72, 240–254. [Google Scholar] [CrossRef]
- Bouhlal, F.; Labjar, N.; Abdoun, F.; Mazkour, A.; Serghini-Idrissi, M.; El Mahi, M.; Skalli, A.; El Hajjaji, S. Chemical and Electrochemical Studies of the Inhibition Performance of Hydro-Alcoholic Extract of Used Coffee Grounds (HECG) for the Corrosion of C38 Steel in 1M Hydrochloric Acid. Egypt. J. Pet. 2020, 29, 45–52. [Google Scholar] [CrossRef]
- Bouhlal, F.; Labjar, N.; Abdoun, F.; Mazkour, A.; Serghini-Idrissi, M.; El Mahi, M.; Lotfi, E.M.; El Hajjaji, S. Electrochemical and Thermodynamic Investigation on Corrosion Inhibition of C38 Steel in 1M Hydrochloric Acid Using the Hydro-Alcoholic Extract of Used Coffee Grounds. Int. J. Corros. 2020, 2020, 1–14. [Google Scholar] [CrossRef]
- Torres, V.V.; Amado, R.S.; De Sá, C.F.; Fernandez, T.L.; da Silva Riehl, C.A.; Torres, A.G.; D’Elia, E. Inhibitory Action of Aqueous Coffee Ground Extracts on the Corrosion of Carbon Steel in HCl Solution. Corros. Sci. 2011, 53, 2385–2392. [Google Scholar] [CrossRef]
- Velazquez-Torres, N.; Martinez, H.; Porcayo-Calderon, J.; Vazquez-Velez, E.; Gonzalez-Rodriguez, J.G.; Martinez-Gomez, L. Use of an Amide-Type Corrosion Inhibitor Synthesized from the Coffee Bagasse Oil on the Corrosion of Cu in NaCl. Green Chem. Lett. Rev. 2018, 11, 1–11. [Google Scholar] [CrossRef]
- da Costa, M.A.; Gois, J.S. de; Toaldo, I.M.; Bauerfeldt, A.C.F.; Batista, D.B.; Bordignon-Luiz, M.T.; do Lago, D.C.; Luna, A.S.; Senna, L.F. de Optimization of Espresso Spent Ground Coffee Waste Extract Preparation and the Influence of Its Chemical Composition as an Eco-Friendly Corrosion Inhibitor for Carbon Steel in Acid Medium. Mater. Res. 2020, 23. [Google Scholar] [CrossRef]
- Rahal, C.; Masmoudi, M.; Abdelhedi, R.; Sabot, R.; Jeannin, M.; Bouaziz, M.; Refait, P. Olive Leaf Extract as Natural Corrosion Inhibitor for Pure Copper in 0.5 M NaCl Solution: A Study by Voltammetry around OCP. J. Electroanal. Chem. 2016, 769, 53–61. [Google Scholar] [CrossRef]
- Masmoudi, F.; Jedidi, I.; Amor, Y.B.; Masmoudi, M. Corrosion Protection Evaluation of Copper Coated with a Block Copolymer and Block Coploymer/Carbon Black Nanoparticles in 3 Wt% NaCl Solution. ChemistrySelect 2023, 8, e202202608. [Google Scholar] [CrossRef]
- Yang, L.; Mahmood, N.; Corscadden, K.; Xu, C.C. Production of Crude Bio-Oil via Direct Liquefaction of Spent K-Cups. Biomass Bioenergy 2016, 95, 354–363. [Google Scholar] [CrossRef]
- Dang, C.-H.; Nguyen, T.-D. Physicochemical Characterization of Robusta Spent Coffee Ground Oil for Biodiesel Manufacturing. Waste Biomass Valorization 2019, 10, 2703–2712. [Google Scholar] [CrossRef]
- Krause, M.C.; Moitinho, A.C.; Ferreira, F.R.; Souza, R.L. de; Krause, L.C.; Caramão, E.B. Production and Characterization of the Bio-Oil Obtained by the Fast Pyrolysis of Spent Coffee Grounds of the Soluble Coffee Industry. J. Braz. Chem. Soc. 2019, 30, 1608–1615. [Google Scholar] [CrossRef]
- Lazzari, E.; Schena, T.; Marcelo, M.C.A.; Primaz, C.T.; Silva, A.N.; Ferrao, M.F.; Bjerk, T.; Caramao, E.B. Classification of Biomass through Their Pyrolytic Bio-Oil Composition Using FTIR and PCA Analysis. Ind. Crops Prod. 2018, 111, 856–864. [Google Scholar] [CrossRef]
- Lyman, D.J.; Benck, R.; Dell, S.; Merle, S.; Murray-Wijelath, J. FTIR-ATR Analysis of Brewed Coffee: Effect of Roasting Conditions. J. Agric. Food Chem. 2003, 51, 3268–3272. [Google Scholar] [CrossRef]
- Wang, J.; Jun, S.; Bittenbender, H.C.; Gautz, L.; Li, Q.X. Fourier Transform Infrared Spectroscopy for Kona Coffee Authentication. J. Food Sci. 2009, 74, C385–C391. [Google Scholar] [CrossRef] [PubMed]
- Raba, D.N.; Poiana, M.-A.; Borozan, A.B.; Stef, M.; Radu, F.; Popa, M.-V. Investigation on Crude and High-Temperature Heated Coffee Oil by ATR-FTIR Spectroscopy along with Antioxidant and Antimicrobial Properties. PloS One 2015, 10, e0138080. [Google Scholar] [CrossRef] [PubMed]
- Phimsen, S.; Kiatkittipong, W.; Yamada, H.; Tagawa, T.; Kiatkittipong, K.; Laosiripojana, N.; Assabumrungrat, S. Oil Extracted from Spent Coffee Grounds for Bio-Hydrotreated Diesel Production. Energy Convers. Manag. 2016, 126, 1028–1036. [Google Scholar] [CrossRef]
- Atabani, A.E.; Shobana, S.; Mohammed, M.N.; Uğuz, G.; Kumar, G.; Arvindnarayan, S.; Aslam, M.; Al-Muhtaseb, A.H. Integrated Valorization of Waste Cooking Oil and Spent Coffee Grounds for Biodiesel Production: Blending with Higher Alcohols, FT–IR, TGA, DSC and NMR Characterizations. Fuel 2019, 244, 419–430. [Google Scholar] [CrossRef]
- Vlachos, N.; Skopelitis, Y.; Psaroudaki, M.; Konstantinidou, V.; Chatzilazarou, A.; Tegou, E. Applications of Fourier Transform-Infrared Spectroscopy to Edible Oils. Anal. Chim. Acta 2006, 573, 459–465. [Google Scholar] [CrossRef] [PubMed]
- Jović, O.; Smolić, T.; Jurišić, Z.; Meić, Z.; Hrenar, T. Chemometric Analysis of Croatian Extra Virgin Olive Oils from Central Dalmatia Region. Croat. Chem. Acta 2013, 86, 335–344. [Google Scholar] [CrossRef]
- Lyman, D.J.; Benck, R.; Dell, S.; Merle, S.; Murray-Wijelath, J. FTIR-ATR Analysis of Brewed Coffee: Effect of Roasting Conditions. J. Agric. Food Chem. 2003, 51, 3268–3272. [Google Scholar] [CrossRef]
- Moharam, M.A.; Abbas, L.M. A Study on the Effect of Microwave Heating on the Properties of Edible Oils Using FTIR Spectroscopy. Afr. J. Microbiol. Res. 2010, 4, 1921–1927. [Google Scholar]
- Ballesteros, L.F.; Teixeira, J.A.; Mussatto, S.I. Chemical, Functional, and Structural Properties of Spent Coffee Grounds and Coffee Silverskin. Food Bioprocess Technol. 2014, 7, 3493–3503. [Google Scholar] [CrossRef]
- Todaka, M.; Kowhakul, W.; Masamoto, H.; Shigematsu, M. Thermal Analysis and Dust Explosion Characteristics of Spent Coffee Grounds and Jatropha. J. Loss Prev. Process Ind. 2016, 44, 538–543. [Google Scholar] [CrossRef]
- Dhouibi, I.; Masmoudi, F.; Bouaziz, M.; Masmoudi, M. A Study of the Anti-Corrosive Effects of Essential Oils of Rosemary and Myrtle for Copper Corrosion in Chloride Media. Arab. J. Chem. 2021, 14, 102961. [Google Scholar] [CrossRef]
- Masmoudi, M.; Abdelmouleh, M.; Abdelhedi, R. Infrared Characterization and Electrochemical Study of γ-Methacryloxypropyltrimethoxysilane Grafted in to Surface of Copper. Spectrochim. Acta Part A Mol. Biomol. Spectrosc. 2014, 118, 643–650. [Google Scholar] [CrossRef]
- Rahal, C.; Masmoudi, M.; Abdelmouleh, M.; Abdelhedi, R. An Environmentally Friendly Film Formed on Copper: Characterization and Corrosion Protection. Prog. Org. Coat. 2015, 78, 90–95. [Google Scholar] [CrossRef]
- Elmorsi, M.A.; Hassanein, A.M. Corrosion Inhibition of Copper by Heterocyclic Compounds. Corros. Sci. 1999, 41, 2337–2352. [Google Scholar] [CrossRef]
- Raza, M.A.; Rehman, Z.U.; Ghauri, F.A. Corrosion Study of Silane-Functionalized Graphene Oxide Coatings on Copper. Thin Solid Film. 2018, 663, 93–99. [Google Scholar] [CrossRef]
- Yu, Y.; Yang, D.; Zhang, D.; Wang, Y.; Gao, L. Anti-Corrosion Film Formed on HAl77-2 Copper Alloy Surface by Aliphatic Polyamine in 3 Wt.% NaCl Solution. Appl. Surf. Sci. 2017, 392, 768–776. [Google Scholar] [CrossRef]
- Nam, N.D.; Ha, P.T.N.; Anh, H.T.; Hoai, N.T.; Hien, P.V. Role of Hydroxyl Group in Cerium Hydroxycinnamate on Corrosion Inhibition of Mild Steel in 0.6 M NaCl Solution. J. Saudi Chem. Soc. 2019, 23, 30–42. [Google Scholar] [CrossRef]
- Sui, W.; Zhao, W.; Zhang, X.; Peng, S.; Zeng, Z.; Xue, Q. Comparative Anti-Corrosion Properties of Alkylthiols SAMs and Mercapto Functional Silica Sol–Gel Coatings on Copper Surface in Sodium Chloride Solution. J. Sol-Gel Sci. Technol. 2016, 80, 567–578. [Google Scholar] [CrossRef]
- Bouhlal, F.; Mazkour, A.; Labjar, H.; Benmessaoud, M.; Serghini-Idrissi, M.; El Mahi, M.; El Hajjaji, S.; Labjar, N. Combination Effect of Hydro-Alcoholic Extract of Spent Coffee Grounds (HECG) and Potassium Iodide (KI) on the C38 Steel Corrosion Inhibition in 1M HCl Medium: Experimental Design by Response Surface Methodology. Chem. Data Collect. 2020, 29, 100499. [Google Scholar] [CrossRef]
- Hassairi, H.; Bousselmi, L.; Khosrof, S.; Triki, E. Evaluation of the Inhibitive Effect of Benzotriazole on Archeological Bronze in Acidic Medium. Appl. Phys. A 2013, 113, 923–931. [Google Scholar] [CrossRef]
- Hong, S.; Chen, W.; Zhang, Y.; Luo, H.Q.; Li, M.; Li, N.B. Investigation of the Inhibition Effect of Trithiocyanuric Acid on Corrosion of Copper in 3.0 Wt.% NaCl. Corros. Sci. 2013, 66, 308–314. [Google Scholar] [CrossRef]
- Qiang, Y.; Zhang, S.; Xu, S.; Li, W. Experimental and Theoretical Studies on the Corrosion Inhibition of Copper by Two Indazole Derivatives in 3.0% NaCl Solution. J. Colloid Interface Sci. 2016, 472, 52–59. [Google Scholar] [CrossRef] [PubMed]
- Ghelichkhah, Z.; Sharifi-Asl, S.; Farhadi, K.; Banisaied, S.; Ahmadi, S.; Macdonald, D.D. L-Cysteine/Polydopamine Nanoparticle-Coatings for Copper Corrosion Protection. Corros. Sci. 2015, 91, 129–139. [Google Scholar] [CrossRef]
- Li, Z.; Wang, X.; Zhang, Y.; Jing, C. Enhancing the Corrosion Resistance of Epoxy Coatings by Impregnation with a Reduced Graphene Oxide-Hydrophobic Ionic Liquid Composite. ChemElectroChem 2018, 5, 3300–3306. [Google Scholar] [CrossRef]
- Peng, S.; Zeng, Z.; Zhao, W.; Li, H.; Xue, Q.; Wu, X. Synergistic Effect of Thiourea in Epoxy Functionalized Silica Sol–Gel Coating for Copper Protection. Surf. Coat. Technol. 2012, 213, 175–182. [Google Scholar] [CrossRef]
- Dueke-Eze, C.U.; Madueke, N.A.; Iroha, N.B.; Maduelosi, N.J.; Nnanna, L.A.; Anadebe, V.C.; Chokor, A.A. Adsorption and Inhibition Study of N-(5-Methoxy-2-Hydroxybenzylidene) Isonicotinohydrazide Schiff Base on Copper Corrosion in 3.5% NaCl. Egypt. J. Pet. 2022, 31, 31–37. [Google Scholar] [CrossRef]
- Bentiss, F.; Lebrini, M.; Lagrenée, M. Thermodynamic Characterization of Metal Dissolution and Inhibitor Adsorption Processes in Mild Steel/2, 5-Bis (n-Thienyl)-1, 3, 4-Thiadiazoles/Hydrochloric Acid System. Corros. Sci. 2005, 47, 2915–2931. [Google Scholar] [CrossRef]
- Pourriahi, M.; Nasr-Esfahani, M.; Motalebi, A. Effect of Henna and Rosemary Extracts on the Corrosion of 304L Stainless Steel in 3.5% NaCl Solution. Surf. Eng. Appl. Electrochem. 2014, 50, 525–533. [Google Scholar] [CrossRef]
- Fateh, A.; Aliofkhazraei, M.; Rezvanian, A.R. Review of Corrosive Environments for Copper and Its Corrosion Inhibitors. Arab. J. Chem. 2020, 13, 481–544. [Google Scholar] [CrossRef]
- Ramos, S.A.F.; Senna, L.F. de; Lago, D.C.B. do Evaluation of Aqueous Coffee Husks Extracts as a Corrosion Inhibitor of 1020 Carbon Steel in 1 Mol L-1 HCl Solution. Mater. Res. 2019, 22. [Google Scholar] [CrossRef]
- Deyab, M.A. Corrosion Inhibition of Aluminum in Biodiesel by Ethanol Extracts of Rosemary Leaves. J. Taiwan Inst. Chem. Eng. 2016, 58, 536–541. [Google Scholar] [CrossRef]
- Zhang, H.H.; Qin, C.K.; Chen, Y.; Zhang, Z. Inhibition Behaviour of Mild Steel by Three New Benzaldehyde Thiosemicarbazone Derivatives in 0.5 M H2SO4: Experimental and Computational Study. R. Soc. Open Sci. 2019, 6, 190192. [Google Scholar] [CrossRef] [PubMed]
- Masmoudi, M.; Rahal, C.; Abdelhedi, R.; Khitouni, M.; Bouaziz, M. Inhibitive Action of Stored Olive Mill Wastewater (OMW) on the Corrosion of Copper in a NaCl Solution. RSC Adv. 2015, 5, 101768–101775. [Google Scholar] [CrossRef]
- de Souza, F.S.; Giacomelli, C.; Gonçalves, R.S.; Spinelli, A. Adsorption Behavior of Caffeine as a Green Corrosion Inhibitor for Copper. Mater. Sci. Eng. C 2012, 32, 2436–2444. [Google Scholar] [CrossRef]
| Wavenumbers (cm-1). | Attributions | |
|---|---|---|
| SCG samples | SCG Oil | |
| 3312 | --- | O–H stretching vibration |
| --- | 3009 | C-H stretching symmetric vibration of the cis double bonds [35] |
| 2924 2858 |
2921 2853 |
Asymmetric and symmetric stretching vibration of C–H bonds of aliphatic CH3[32,35] |
| 1740 | 1746 | Stretching vibration of ester carbonyl functional groups (C=O) |
| 1463 | 1463 | Bending vibration of C-H of CH2 and CH3 aliphatic group |
| 1640 | C=C stretching vibration cis-olefins [35] | |
| 1369 | 1376 | Bending symmetric vibration of C-H bonds of CH2 groups [35] |
| 1100 | 1161 | Stretching vibration of C-O-C ester groups [36] |
| 1400-900 | 1400-900 | Stretching vibration of (C-O), (C-H), (C-N) [27,31,37] |
| 721 | 721 | =C-H Aliphatic CH2 rocking vibration and cis substituted olefin out-of-plane vibration overlapping [32,38] |
| E | Ecorr (mV/SCE) |
Jcorr μA cm-2 |
βa (mV/dec) |
-βc (mV/dec) |
CR mm year-1 |
Rp (kΩ.cm2) |
η (%) |
|
|---|---|---|---|---|---|---|---|---|
| Blank | -176 ±2 | 5.41 ± 1.2 | 40 ± 13 | 120 ± 5 | 0.063 ± 1.1 | 2.40 ±1.3 | − | |
| 0.2g/L | -272 ±4 | 0.745 ± 0.3 | 45.4 ± 2 | 62.8 ± 6 | 0.00868 ± 0.3 | 15.35 ± 2 | 86.22 ±5 | |
| 0.4g/L | -287 ±3 | 0.305 ± 0.3 | 59.6 ± 7 | 60.7±14 | 0.00355 ± 0.3 | 42.81±1.4 | 94.36 ±4 | |
| 0.6g/L | -274 ±4 | 0.228 ± 0.2 | 46.8 ± 2 | 95.9 ± 2 | 0.00265 ± 0.2 | 59.89 ± 2.8 | 95.78 ±3 | |
| Blank | 0.2 g/L | 0.4 g/L | 0.6 g/L | |
|---|---|---|---|---|
| Rs (Ω cm2) | 6.915 | 7.03 | 8.4 | 9.02 |
| Rct (Ω cm2) | 1466 | 6725 | 13 985 | 17 980 |
| Qdl10-6(F cm-2) | 145 | 7.42 | 6.836 | 7.2 |
| ndl | 0.687 | 0.67 | 0.4 | 0.53 |
| Rf (Ω cm2) | − | 3698 | 7821 | 8932 |
| Qf10-6 (F cm-2) | − | 10.88 | 25.03 | 26.76 |
| Rp (Ω cm2) | 1466 | 10 423 | 21 806 | 26 822 |
| nf | − | 0.559 | 0.557 | 0.63 |
| W (Ω-1 cm-2 s0.5 ) | 140.2 | − | − | − |
| η (%) | − | 85.93 | 93.27 | 94.55 |
Disclaimer/Publisher’s Note: The statements, opinions and data contained in all publications are solely those of the individual author(s) and contributor(s) and not of MDPI and/or the editor(s). MDPI and/or the editor(s) disclaim responsibility for any injury to people or property resulting from any ideas, methods, instructions or products referred to in the content. |
© 2023 by the authors. Licensee MDPI, Basel, Switzerland. This article is an open access article distributed under the terms and conditions of the Creative Commons Attribution (CC BY) license (http://creativecommons.org/licenses/by/4.0/).


