Submitted:
08 June 2023
Posted:
08 June 2023
You are already at the latest version
Abstract
Keywords:
1. Introduction
2. Materials and Methods
2.1. Surface fluorination of polypropylene
2.2. Material characterization
2.3. Dye staining of polypropylene
3. Results and Discussion
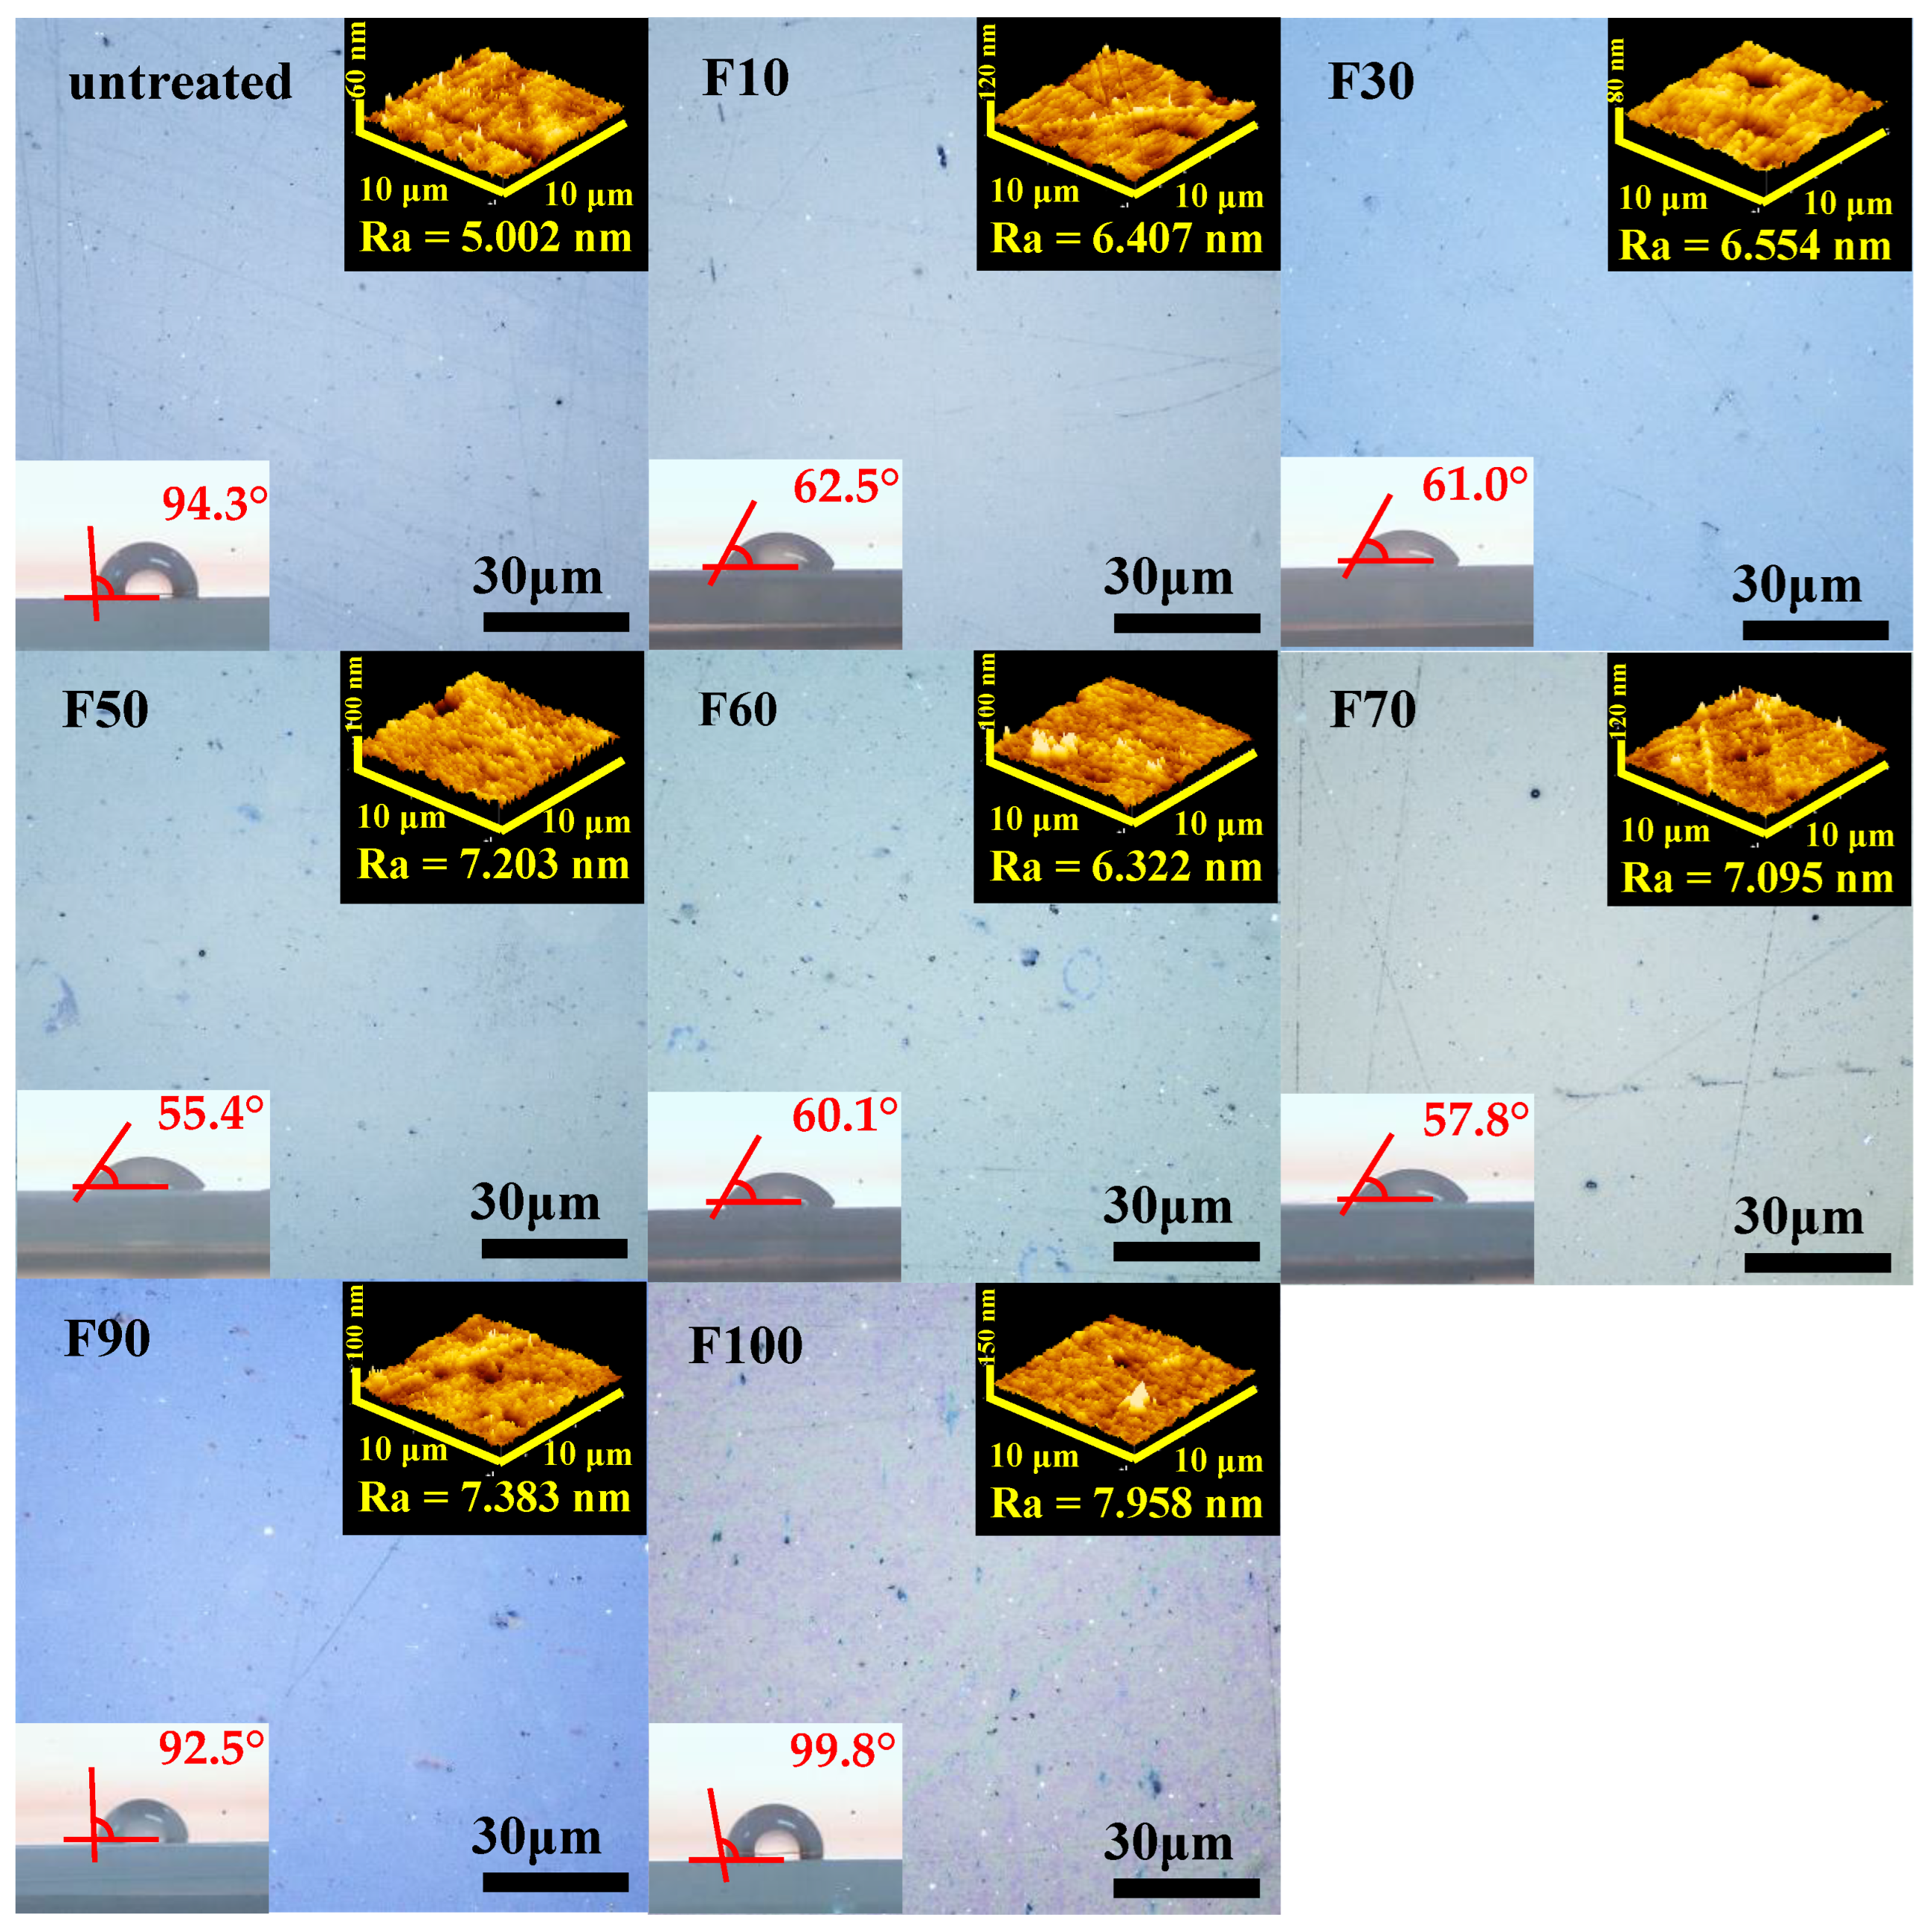
3.1. Effects of fluorination using F2 and O2 gas mixtures on the surface morphology of polypropylene
3.3. Dyeing of the surface-modified PP plates
4. Conclusions
Author Contributions
Funding
Institutional Review Board Statement
Informed Consent Statement
Data Availability Statement
Acknowledgments
Conflicts of Interest
References
- Hirai, S.; Phanthong, P.; Okubo, H.; Yao, S. Enhancement of the surface properties on polypropylene film using side-chain crystalline block copolymers. Polymers 2020, 12, 2736. [CrossRef]
- Hoff, A.; Jacobsson, S. Thermal oxidation of polypropylene in the temperature range of 120–280 °C. J. Appl. Polym. Sci. 1984, 29, 465–480. [CrossRef]
- Thakur, V.K.; Vennerberg, D.; Kessler, M.R. Green aqueous surface modification of polypropylene for novel polymer nanocomposites. ACS Appl. Mater. Interfaces 2014, 6, 9349–9356. [CrossRef]
- Akrman, J.; Prikryl, J. Dyeing Behavior of Polypropylene Blend Fiber. I. Kinetic and thermodynamic parameters of the dyeing ssystem. J. Appl. Polym. Sci. 1996, 62, 235–240.
- Geleji, F.; Selim, B.; Szabo, K. Pigmentation of polypropylene fibers. Faserforschung und Textiltechnik 1965, 16, 395–400.
- Assmann, K.; Schrenk, V. Develops new vehicle for dyeing polypropylene fibers. Inter. Fiber J. 1997, 12, 44A.
- Tengsuwan, S.; Ohshima, M. Supercritical carbon dioxide-assisted electroless nickel plating on polypropylene—The effect of copolymer blend morphology on metal–polymer adhesion, Journal Supercrit. Fluids 2014, 85, 123–134. [CrossRef]
- Shahidi, S.; Ghoranneviss, M.; Moazzenchi, B. Effect of using cold plasma on dyeing properties of polypropylene fabrics. Fibers Polym. 2007, 8, 123–129. [CrossRef]
- Hirai, S.; Phanthong, P.; Okubo, H.; Yao, S. Enhancement of the surface properties on polypropylene film using side-chain crystalline block copolymers. Polymers 2020, 12, 2736–2748. [CrossRef]
- Burkinshaw, S.M.; Froehling, P.E.; Mignanelli, M. The effect of hyperbranched polymers on the dyeing of polypropylene fibres. Dyes Pigm. 2002, 53, 229–235. [CrossRef]
- Hachim, D.; Brown, B.N. Surface modification of polypropylene for enhanced layer by layer deposition of polyelectrolytes. J. Biomed. Mater. Res. A. 2018, 106, 2078–2085. [CrossRef]
- Walzak, M.J.; Flynn, S.; Foerch, R.; Hill, J.M. UV and ozone treatment of polypropylene and poly (ethylene terephthalate). J. Adhesion Sci. Technol. 1995, 9, 1229–1248. [CrossRef]
- Tanaka, S.; Naganuma, Y.; Kato, C.; Horie, K. Surface modification of vinyl polymers by vacuum ultraviolet light irradiation. J. Photopolym. Sci. Technol. 2003, 16, 165–170. [CrossRef]
- Strobe, M.; Jones, V.; Lyons, C.S.; Ulsh, M.; Kushner, M.J.; Dorai, R.; Branch, M.C. A comparison of corona-treated and flame-treated polypropylene films. Plasmas Polym. 2003, 8, 61–95. [CrossRef]
- Blais, P.; Carlsson, D.J.; Csullog, G.W.; Wiles, D.M. The chromic acid etching of polyolefin surfaces and adhesive bonding. J. Colloid Interface Sci. 1974, 47, 636–649. [CrossRef]
- Apel, P.Y.; Orelovich, O.L. Etching of submicron pores in thin polypropylene films irradiated with heavy ions. Nucl. Tracks Radiat. Meas. 1991, 19, 25–28. [CrossRef]
- Kharitonov, A.P.; Kharitonova, L.N. Surface modification of polymers by direct fluorination: A convenient approach to improve commercial properties of polymeric articles. Pure Appl. Chem. 2009, 81, 451–471.
- Kirk, S.; Strobel, M.; Lee, C.; Pachuta, S.J.; Prokosch, M.; Lechuga, H.; Jones, M.E.; Lyons, C.S.; Degner, S.; Yang, Y.; Kushner, M.J. Fluorine plasma treatments of polypropylene films, 1-surface characterization. Plasma Process. Polym. 2010, 7, 107–122. [CrossRef]
- Kim, J.H.; Namie, M.; Yonezawa, S. Enhanced adhesion between polyethylene terephthalate and metal film by surface fluorination. Comp. Comm. 2018, 10, 205–208. [CrossRef]
- Kim, J.H.; Mishina, T.; Namie, M.; Nishimura, F.; Yonezawa, S. Effects of surface fluorination on the dyeing of polycarbonate (PC) resin, J. Coat. Res. 2021, 9, 617–624. [CrossRef]
- Namie, M.; Kim, J.H.; Yonezawa, S. Improving the dyeing of polypropylene by surface fluorination. Colorants, 2022, 1, 121–131. [CrossRef]
- Kim, J.H.; Umeda, H.; Ohe, M.; Yonezawa, S.; Takashima, M. Preparation of pure LiPF6 using fluorine gas at room temperature. Chem. Lett. 2011, 40, 360–361. [CrossRef]
- Mohammadiaheri, S.; Jaleh, B.; Mohazzab, B.F.; Eslamipanah, M.; Nasrollahzadeh, M.; Varma, R.S. Greener hydrophilicity improvement of polypropylene membrane by ArF excimer laser treatment. Surf. Coat. Technol. 2020, 399, 126198. [CrossRef]
- Kobayashi, M.; Nishimura, F.; Kim, J.H.; Yonezawa, S. Dyeable hydrophilic surface modification for PTFE substrates by surface fluorination. Membranes, 2023, 13, 57–69. [CrossRef]
- Yamaguchi, S.; Minbuta, S.; Matsui, K. Adsorption of the cationic dye methylene blue on anodic porous alumina in sodium dodecyl sulfate solutions. Langmuir, 2020, 36, 4592–4599. [CrossRef]
- Fumoto, I. Studies on dyeing of polyolefins. (1) Dyeing properties of fluorinated polypropylene fiber. Sen’i Gakkaishi 1965, 21, 590–597.
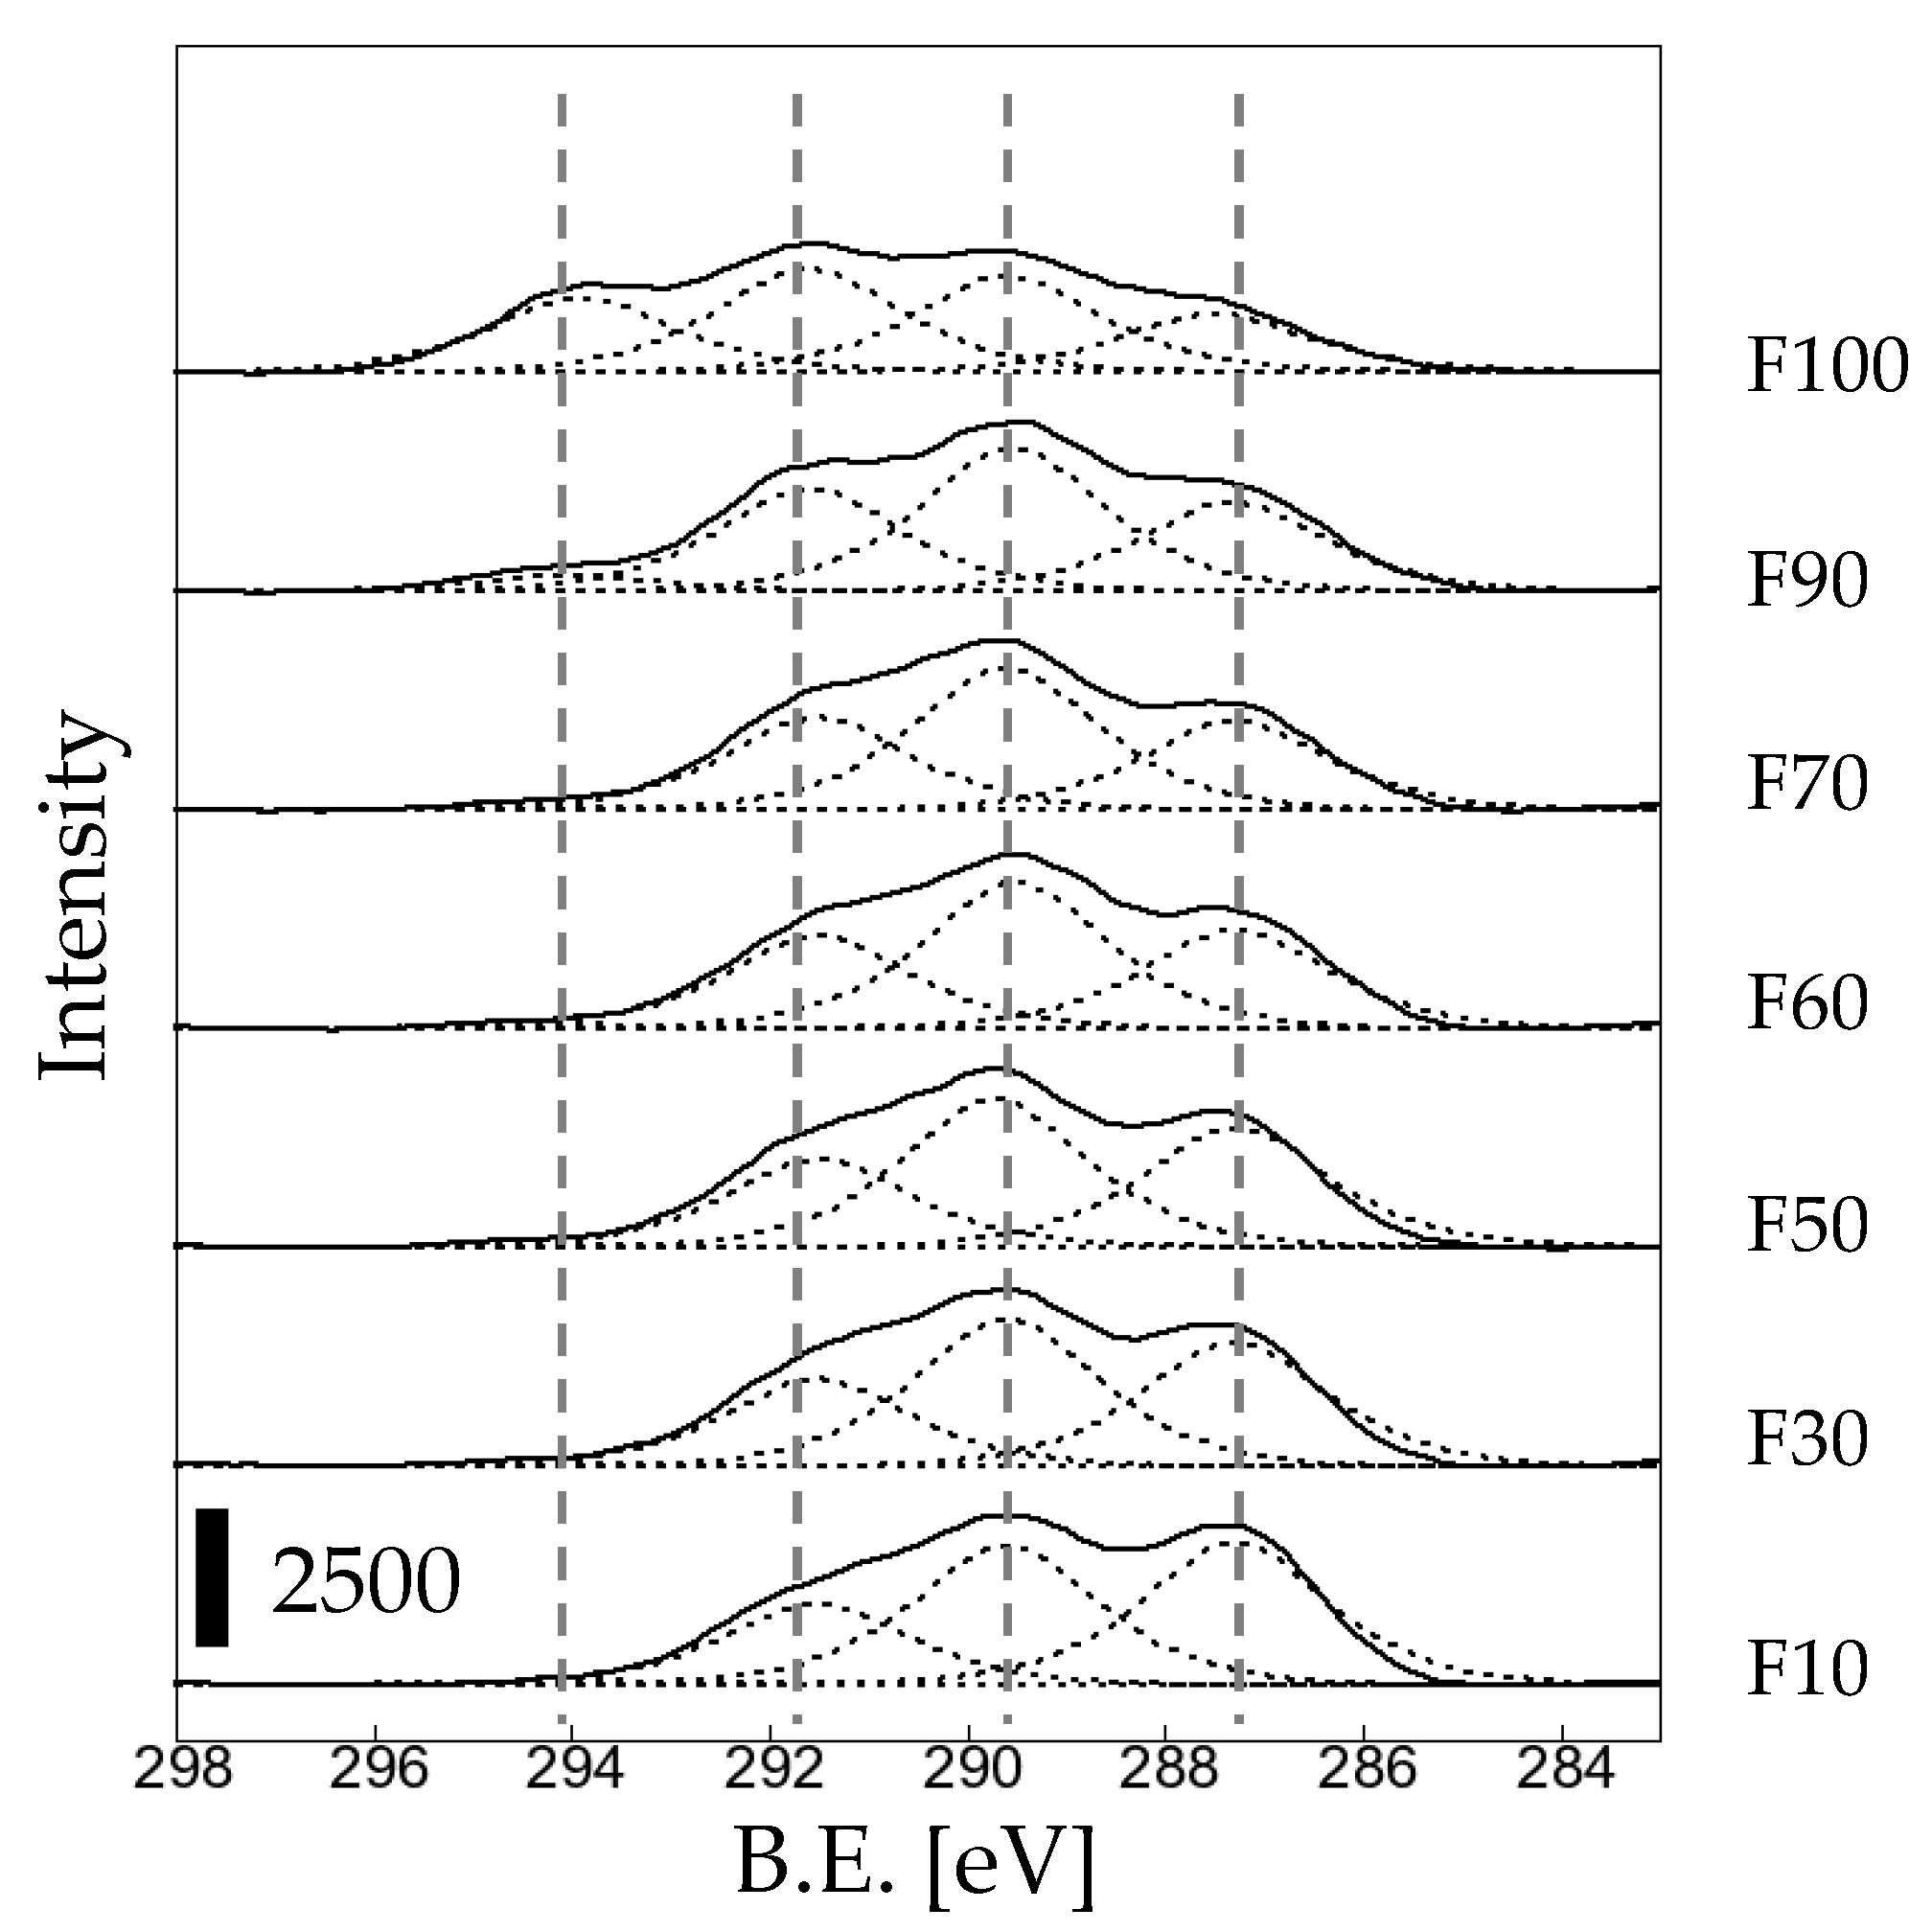
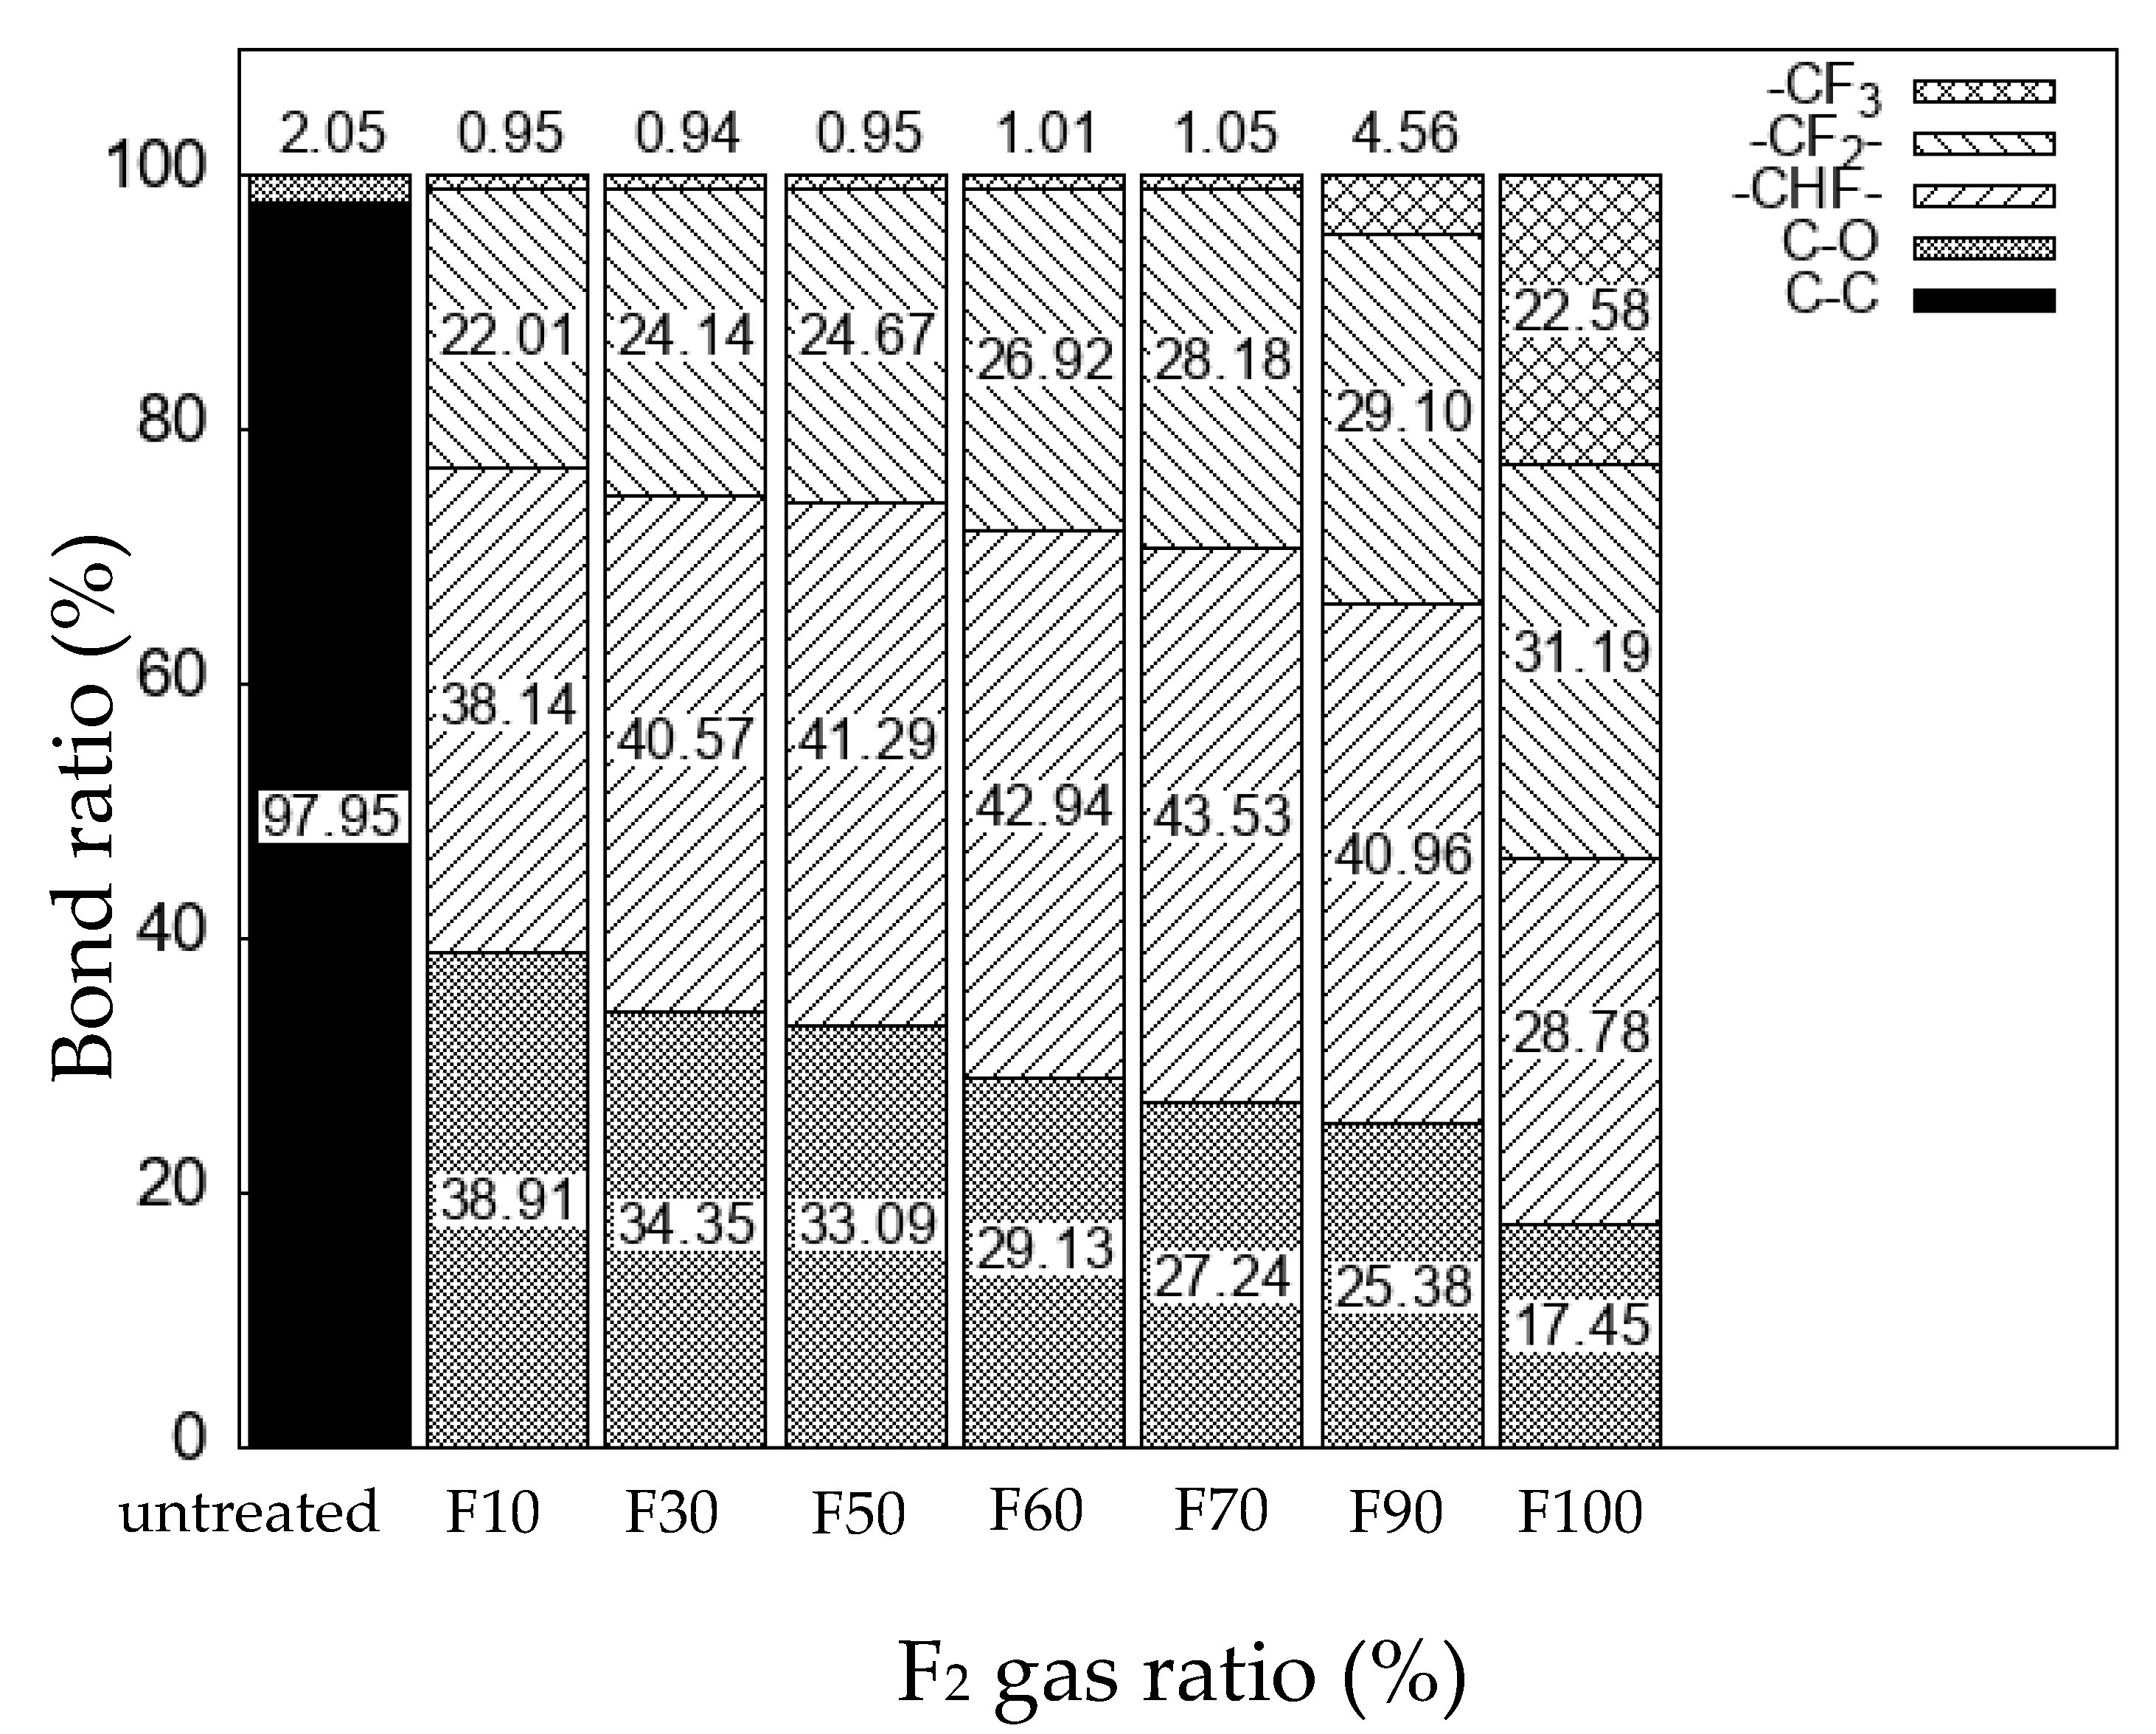
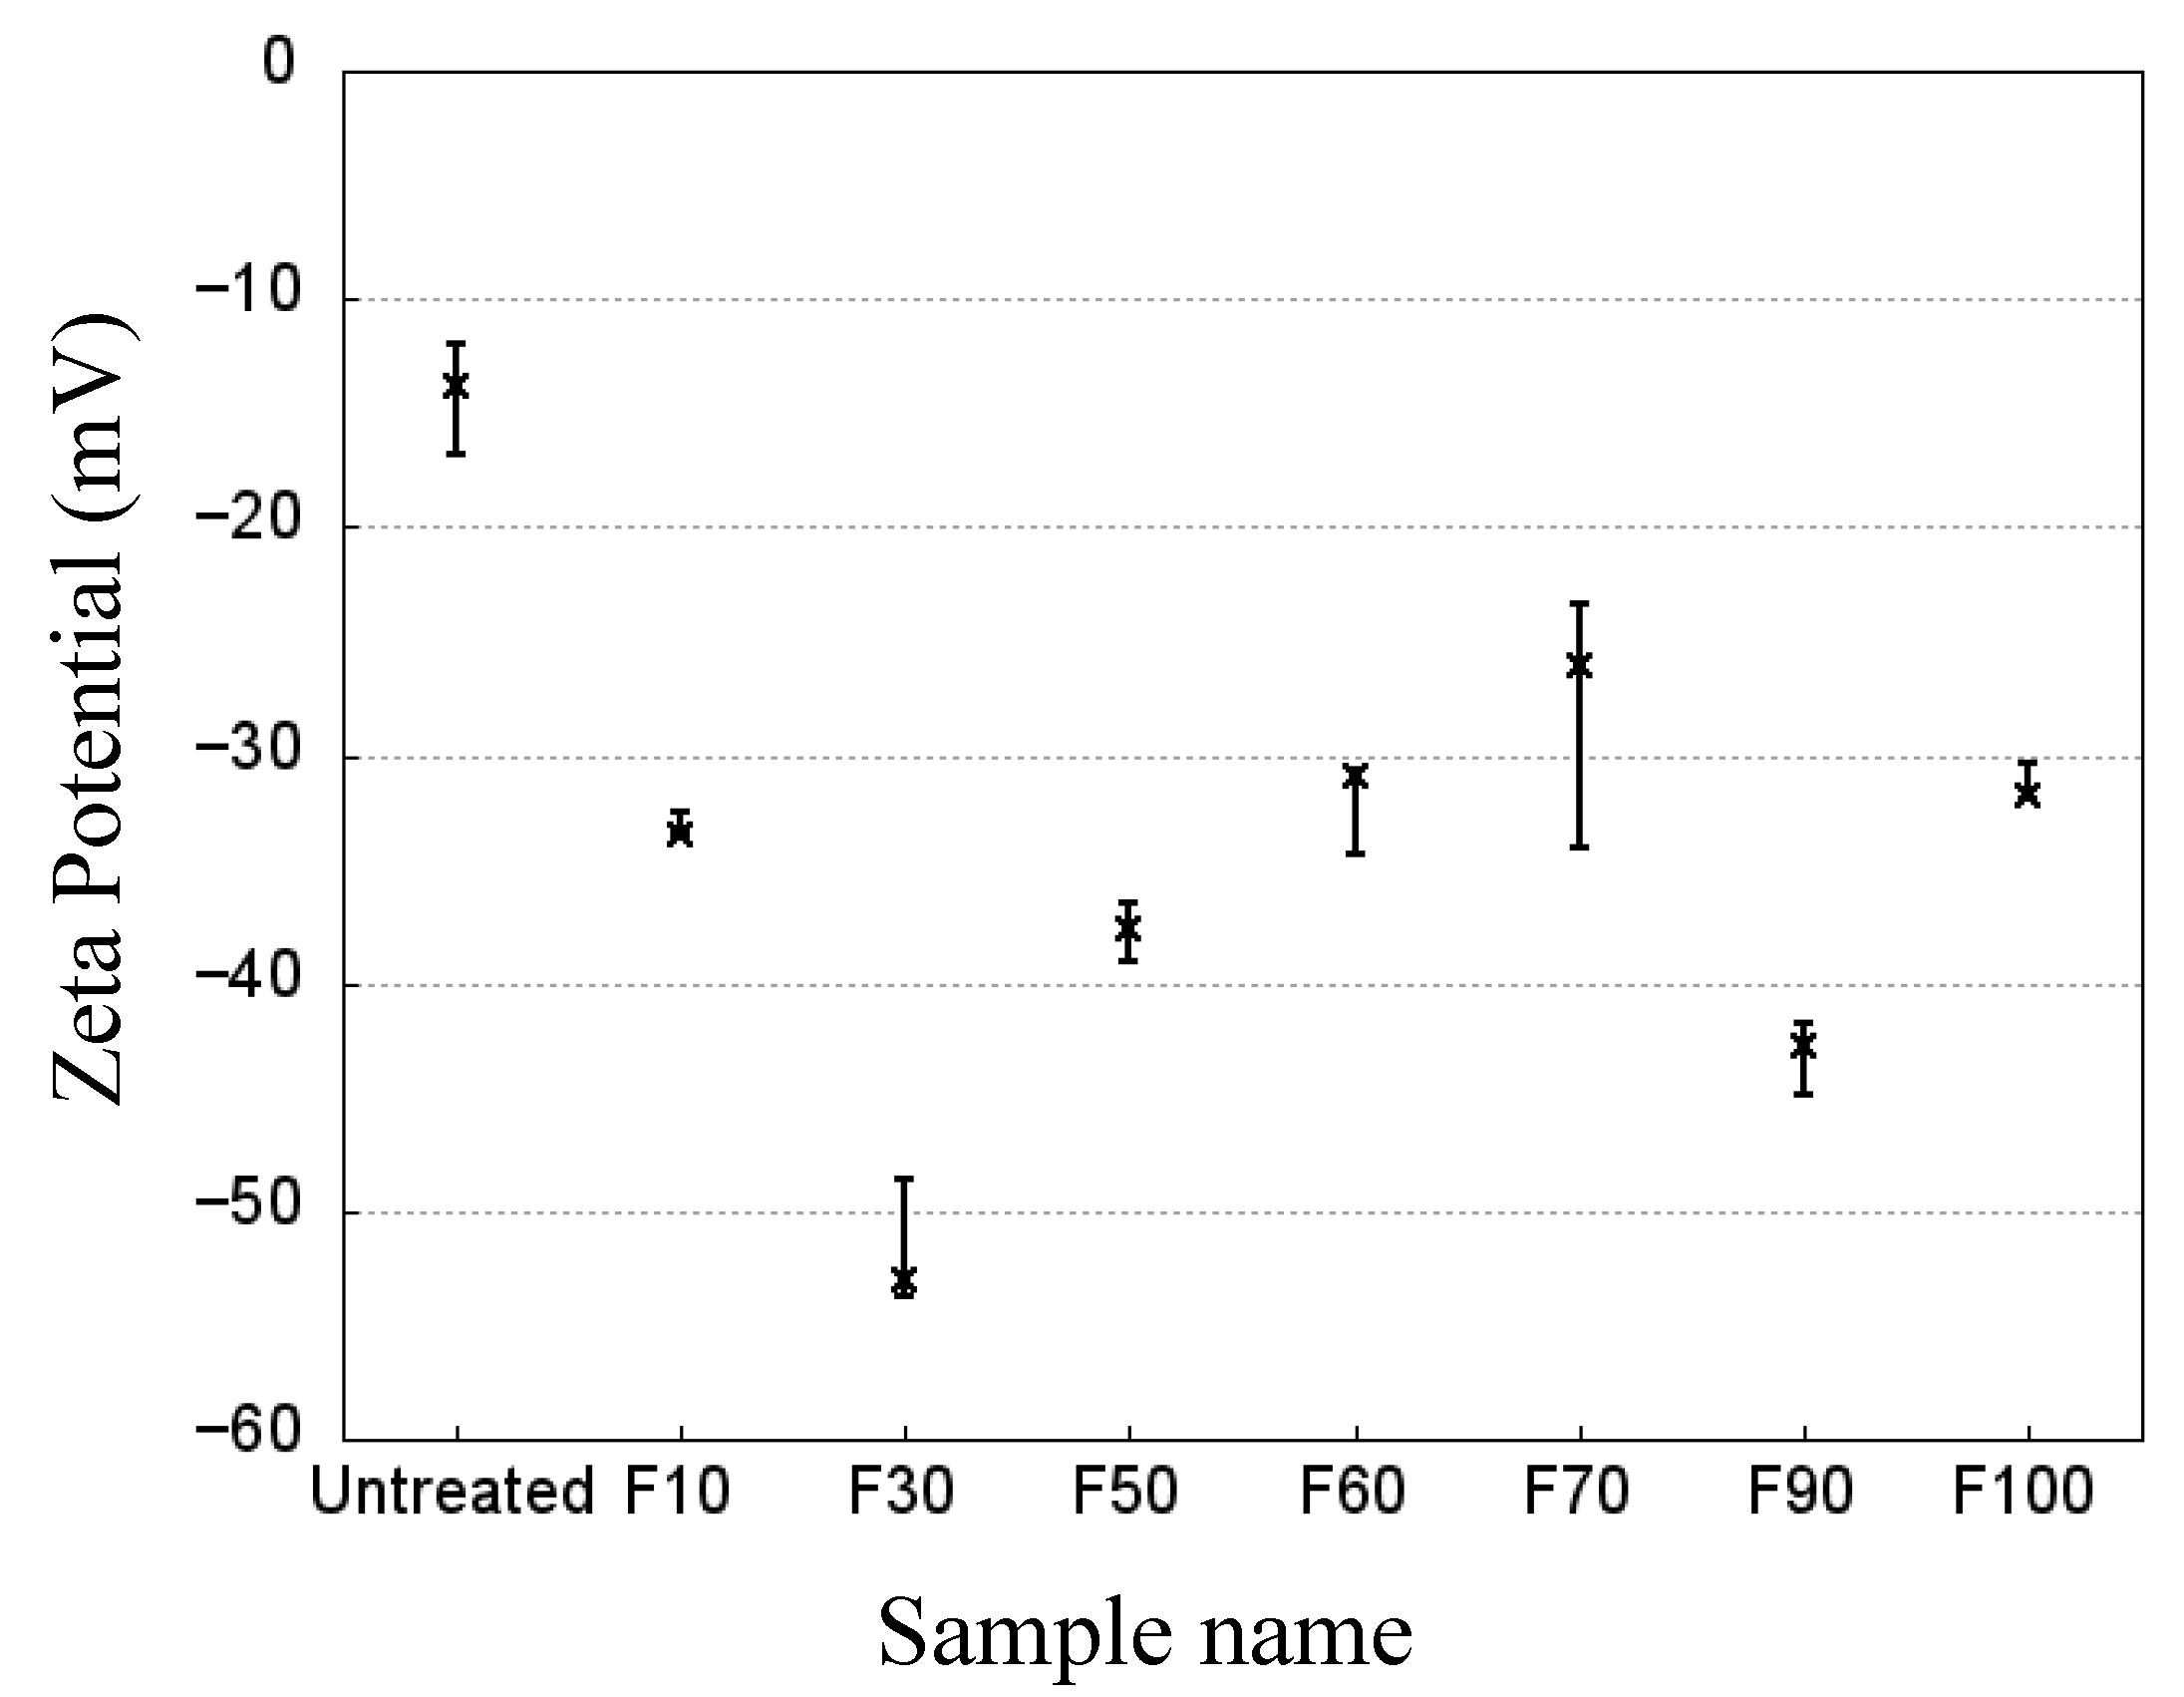
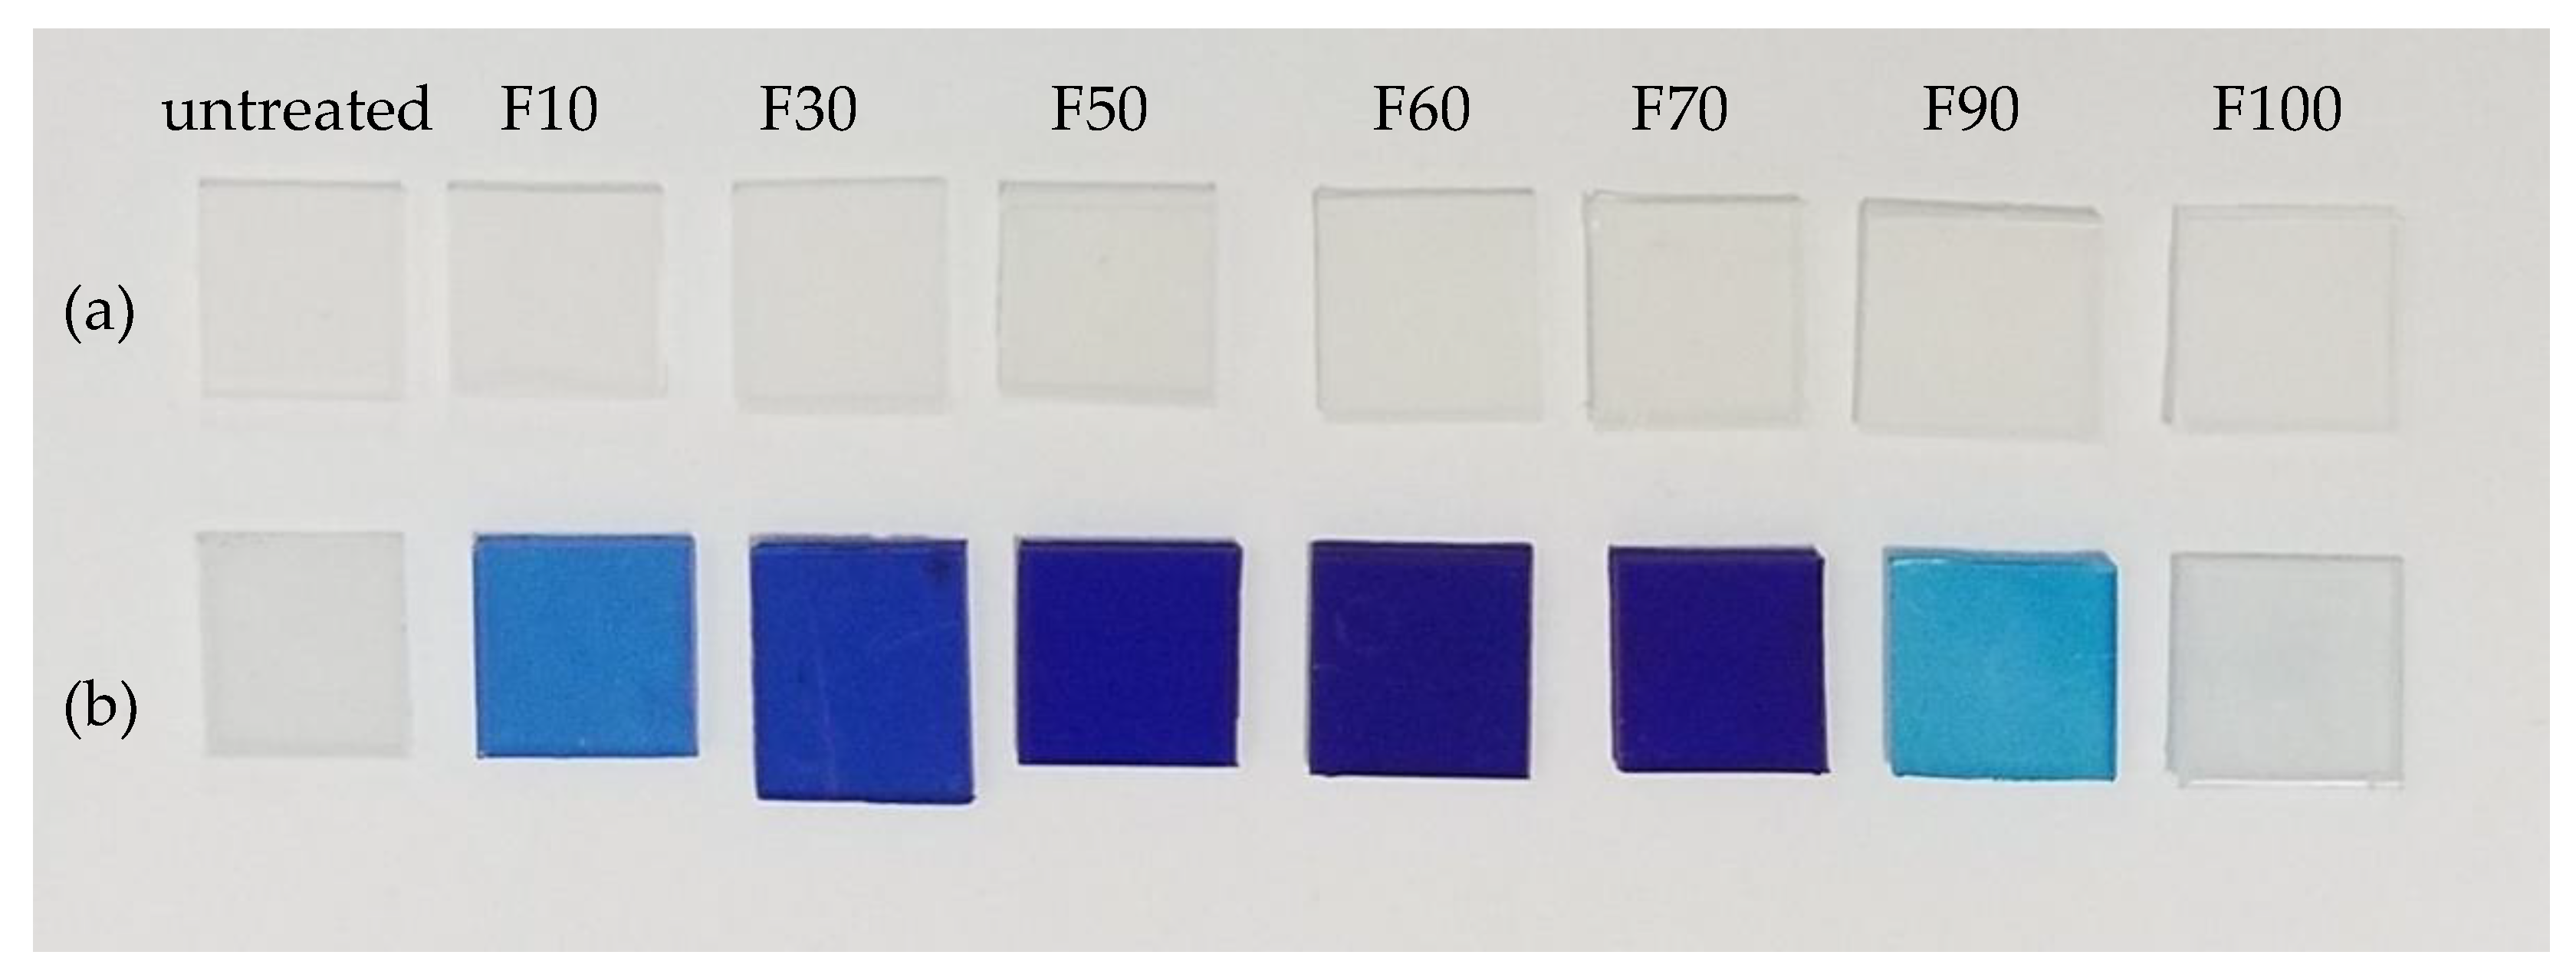
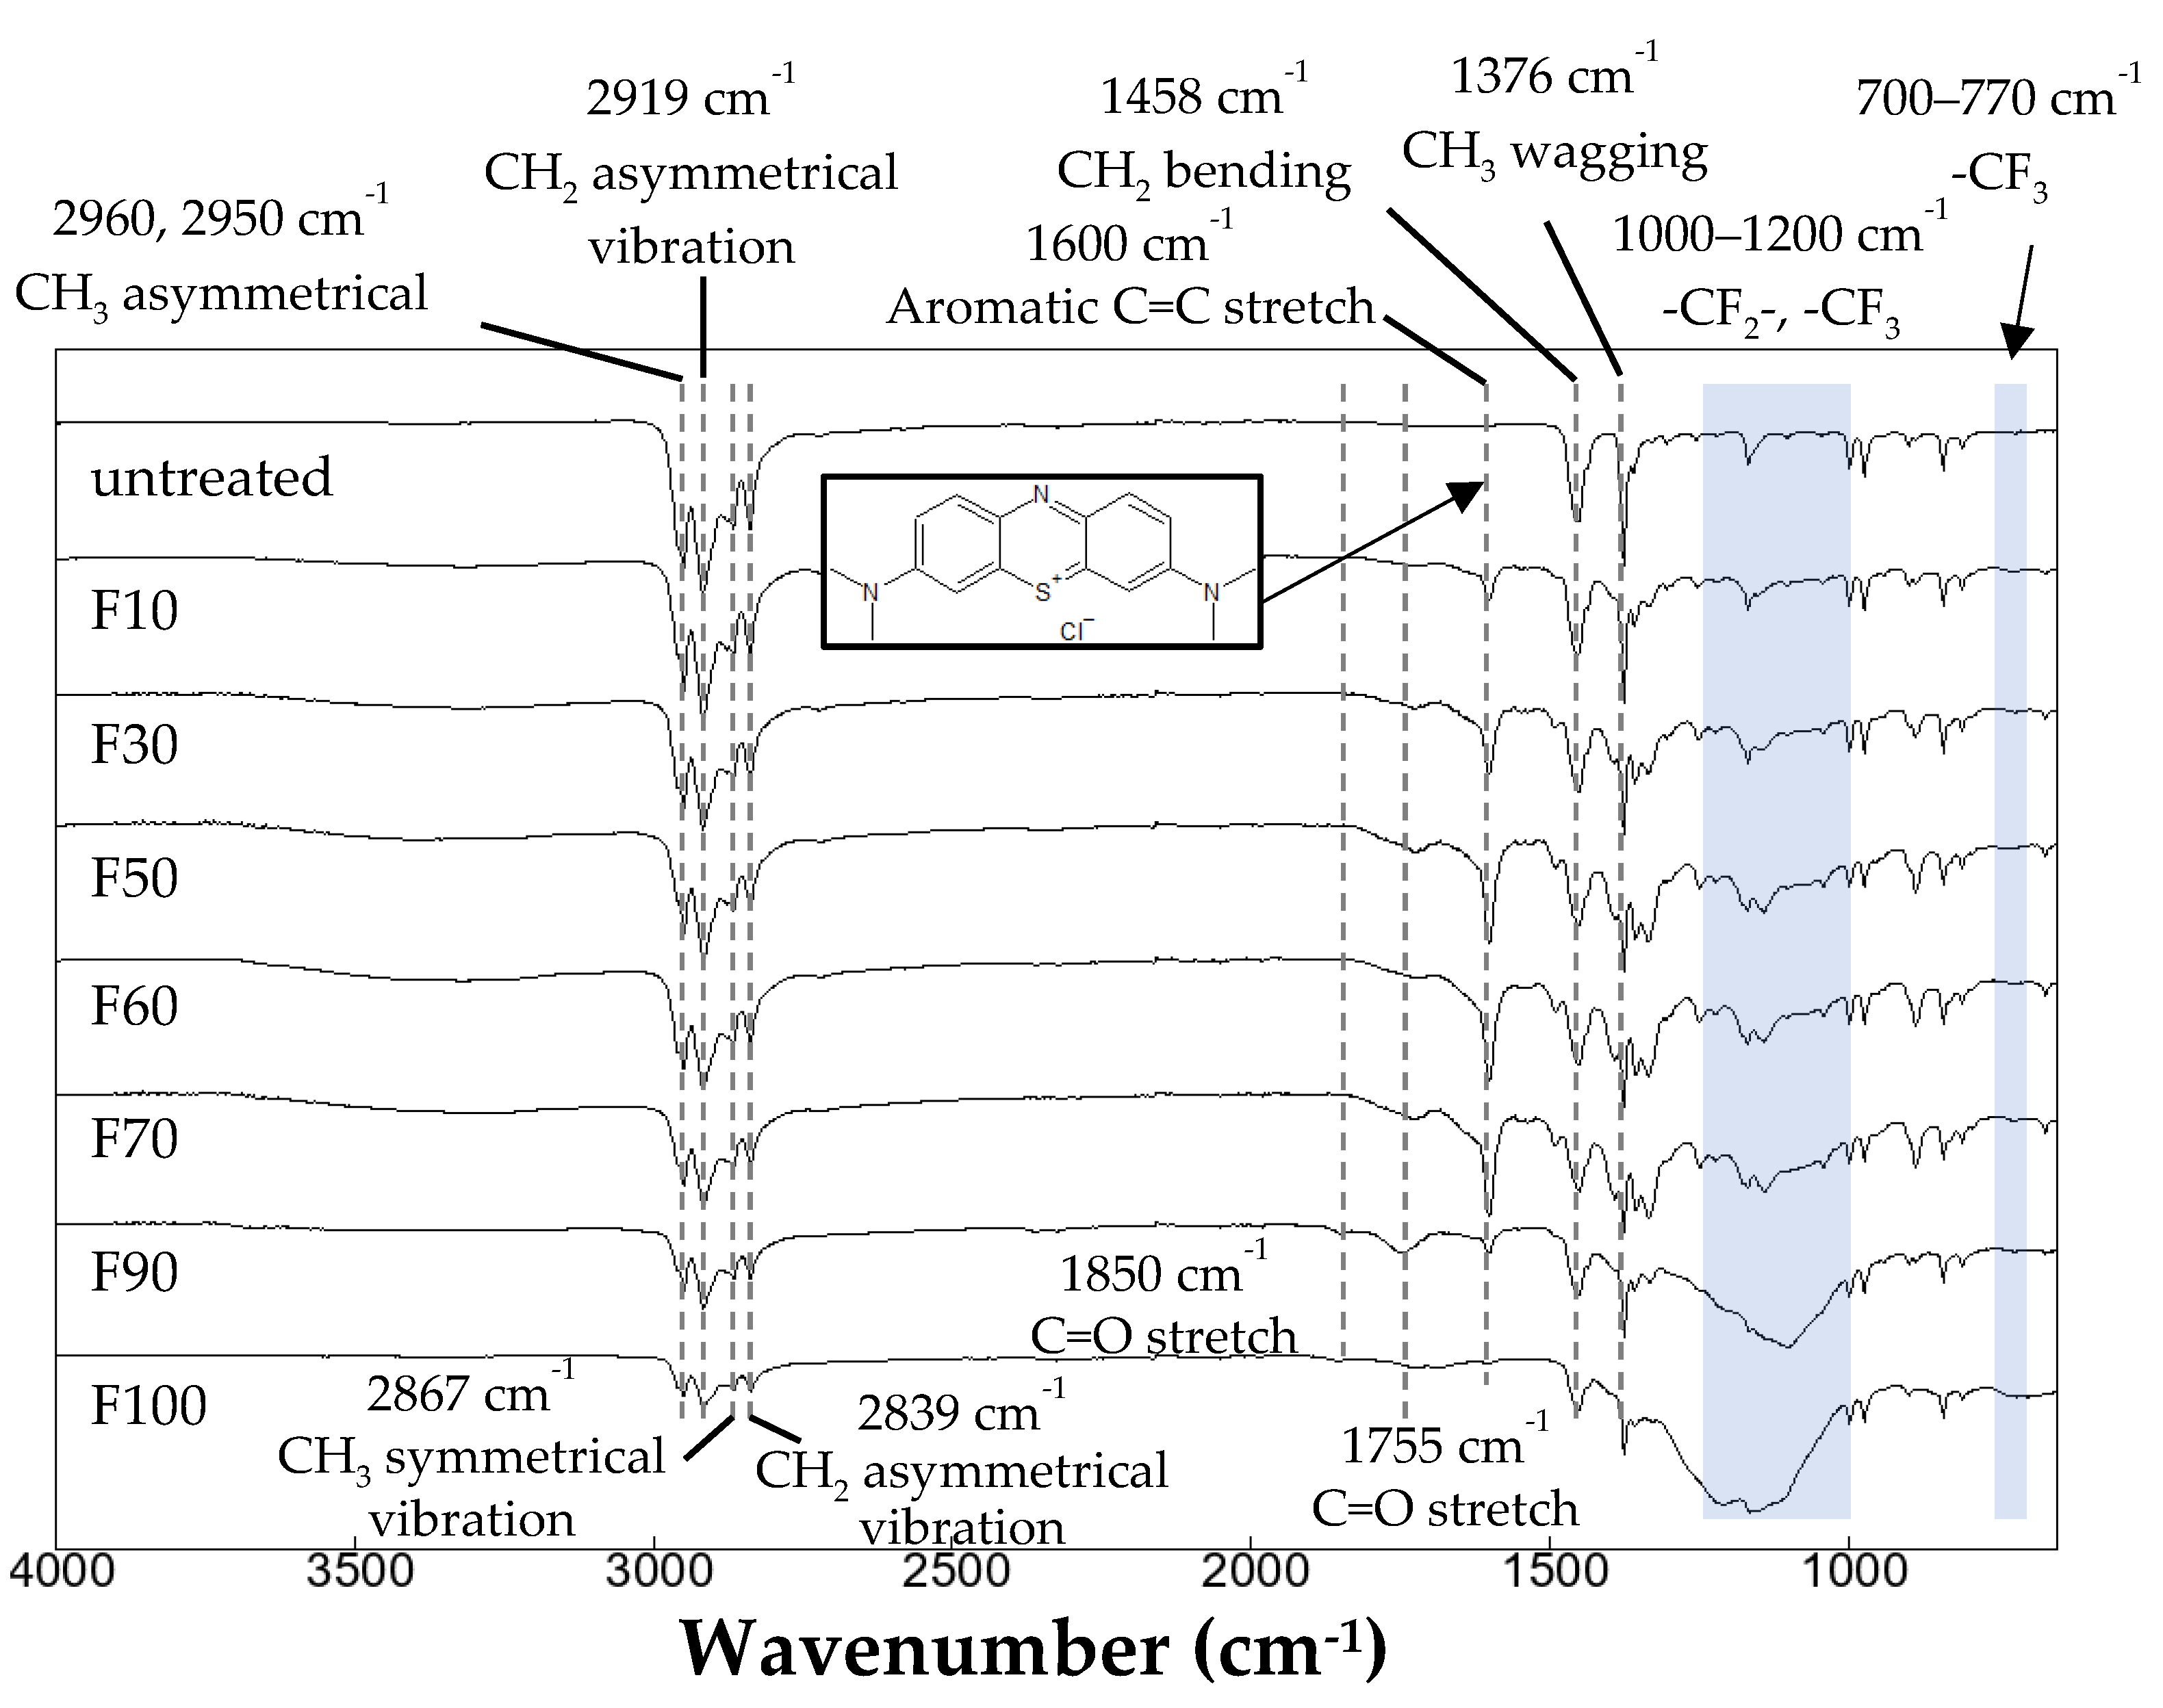
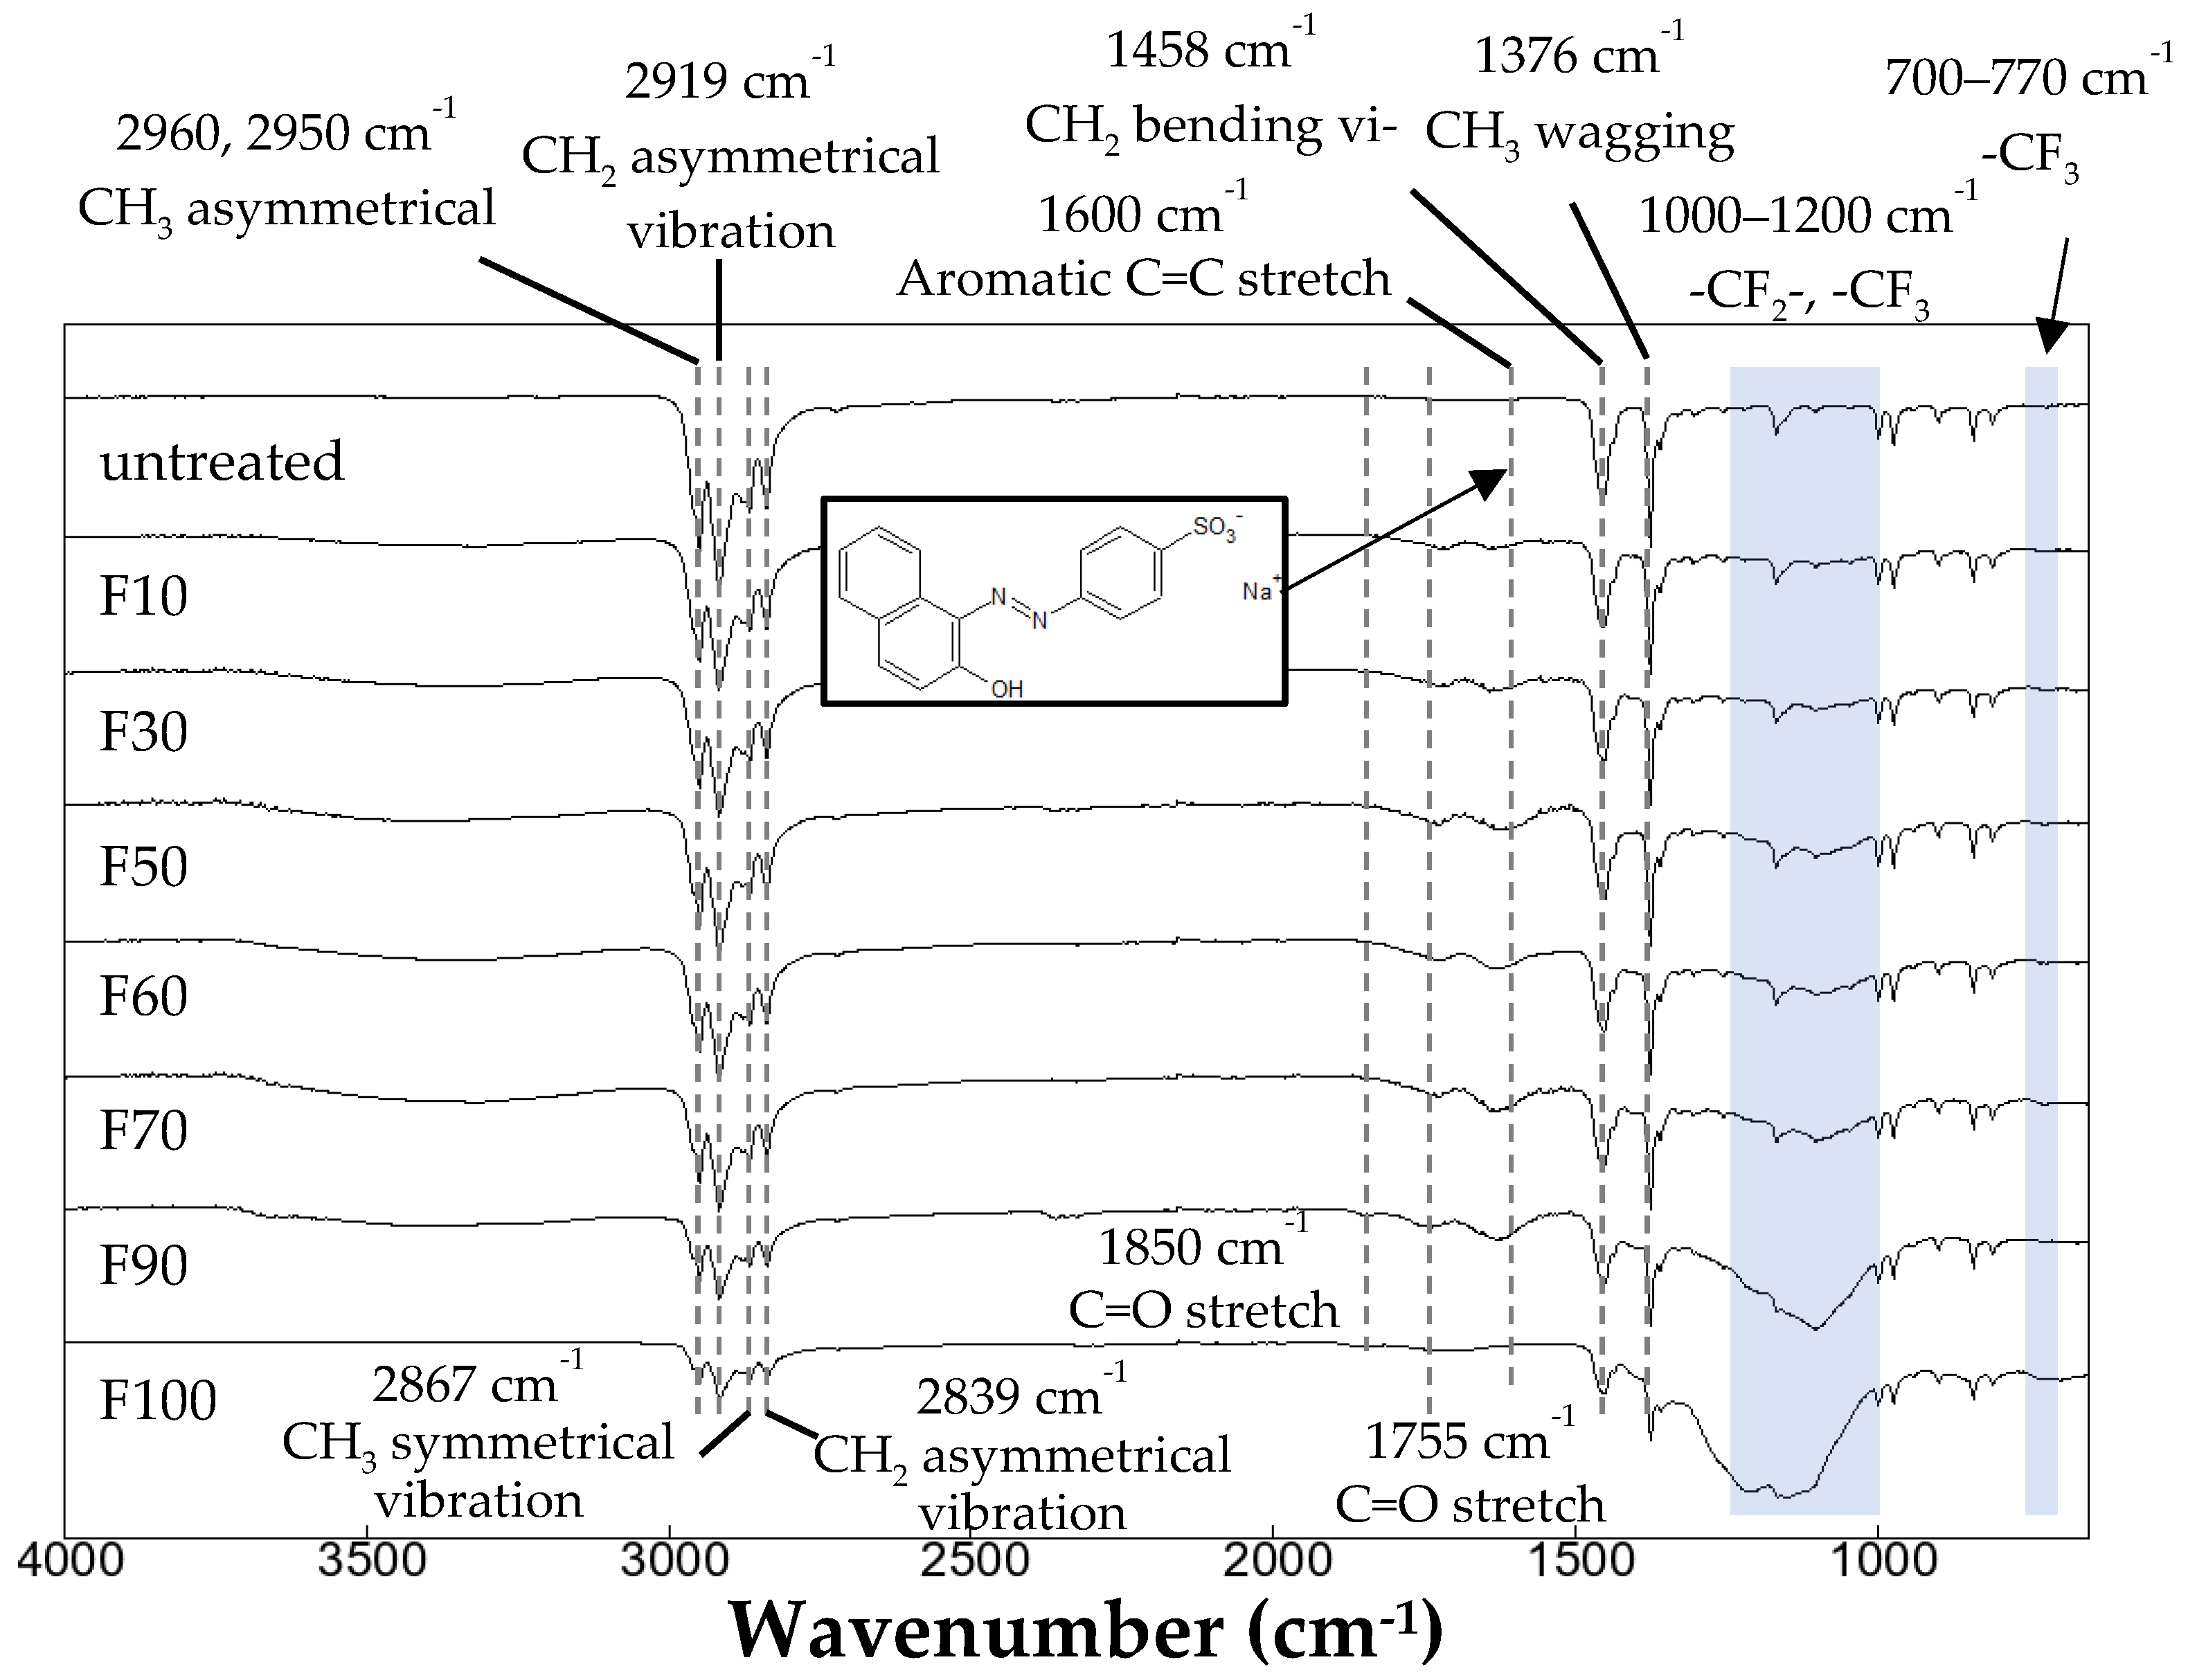
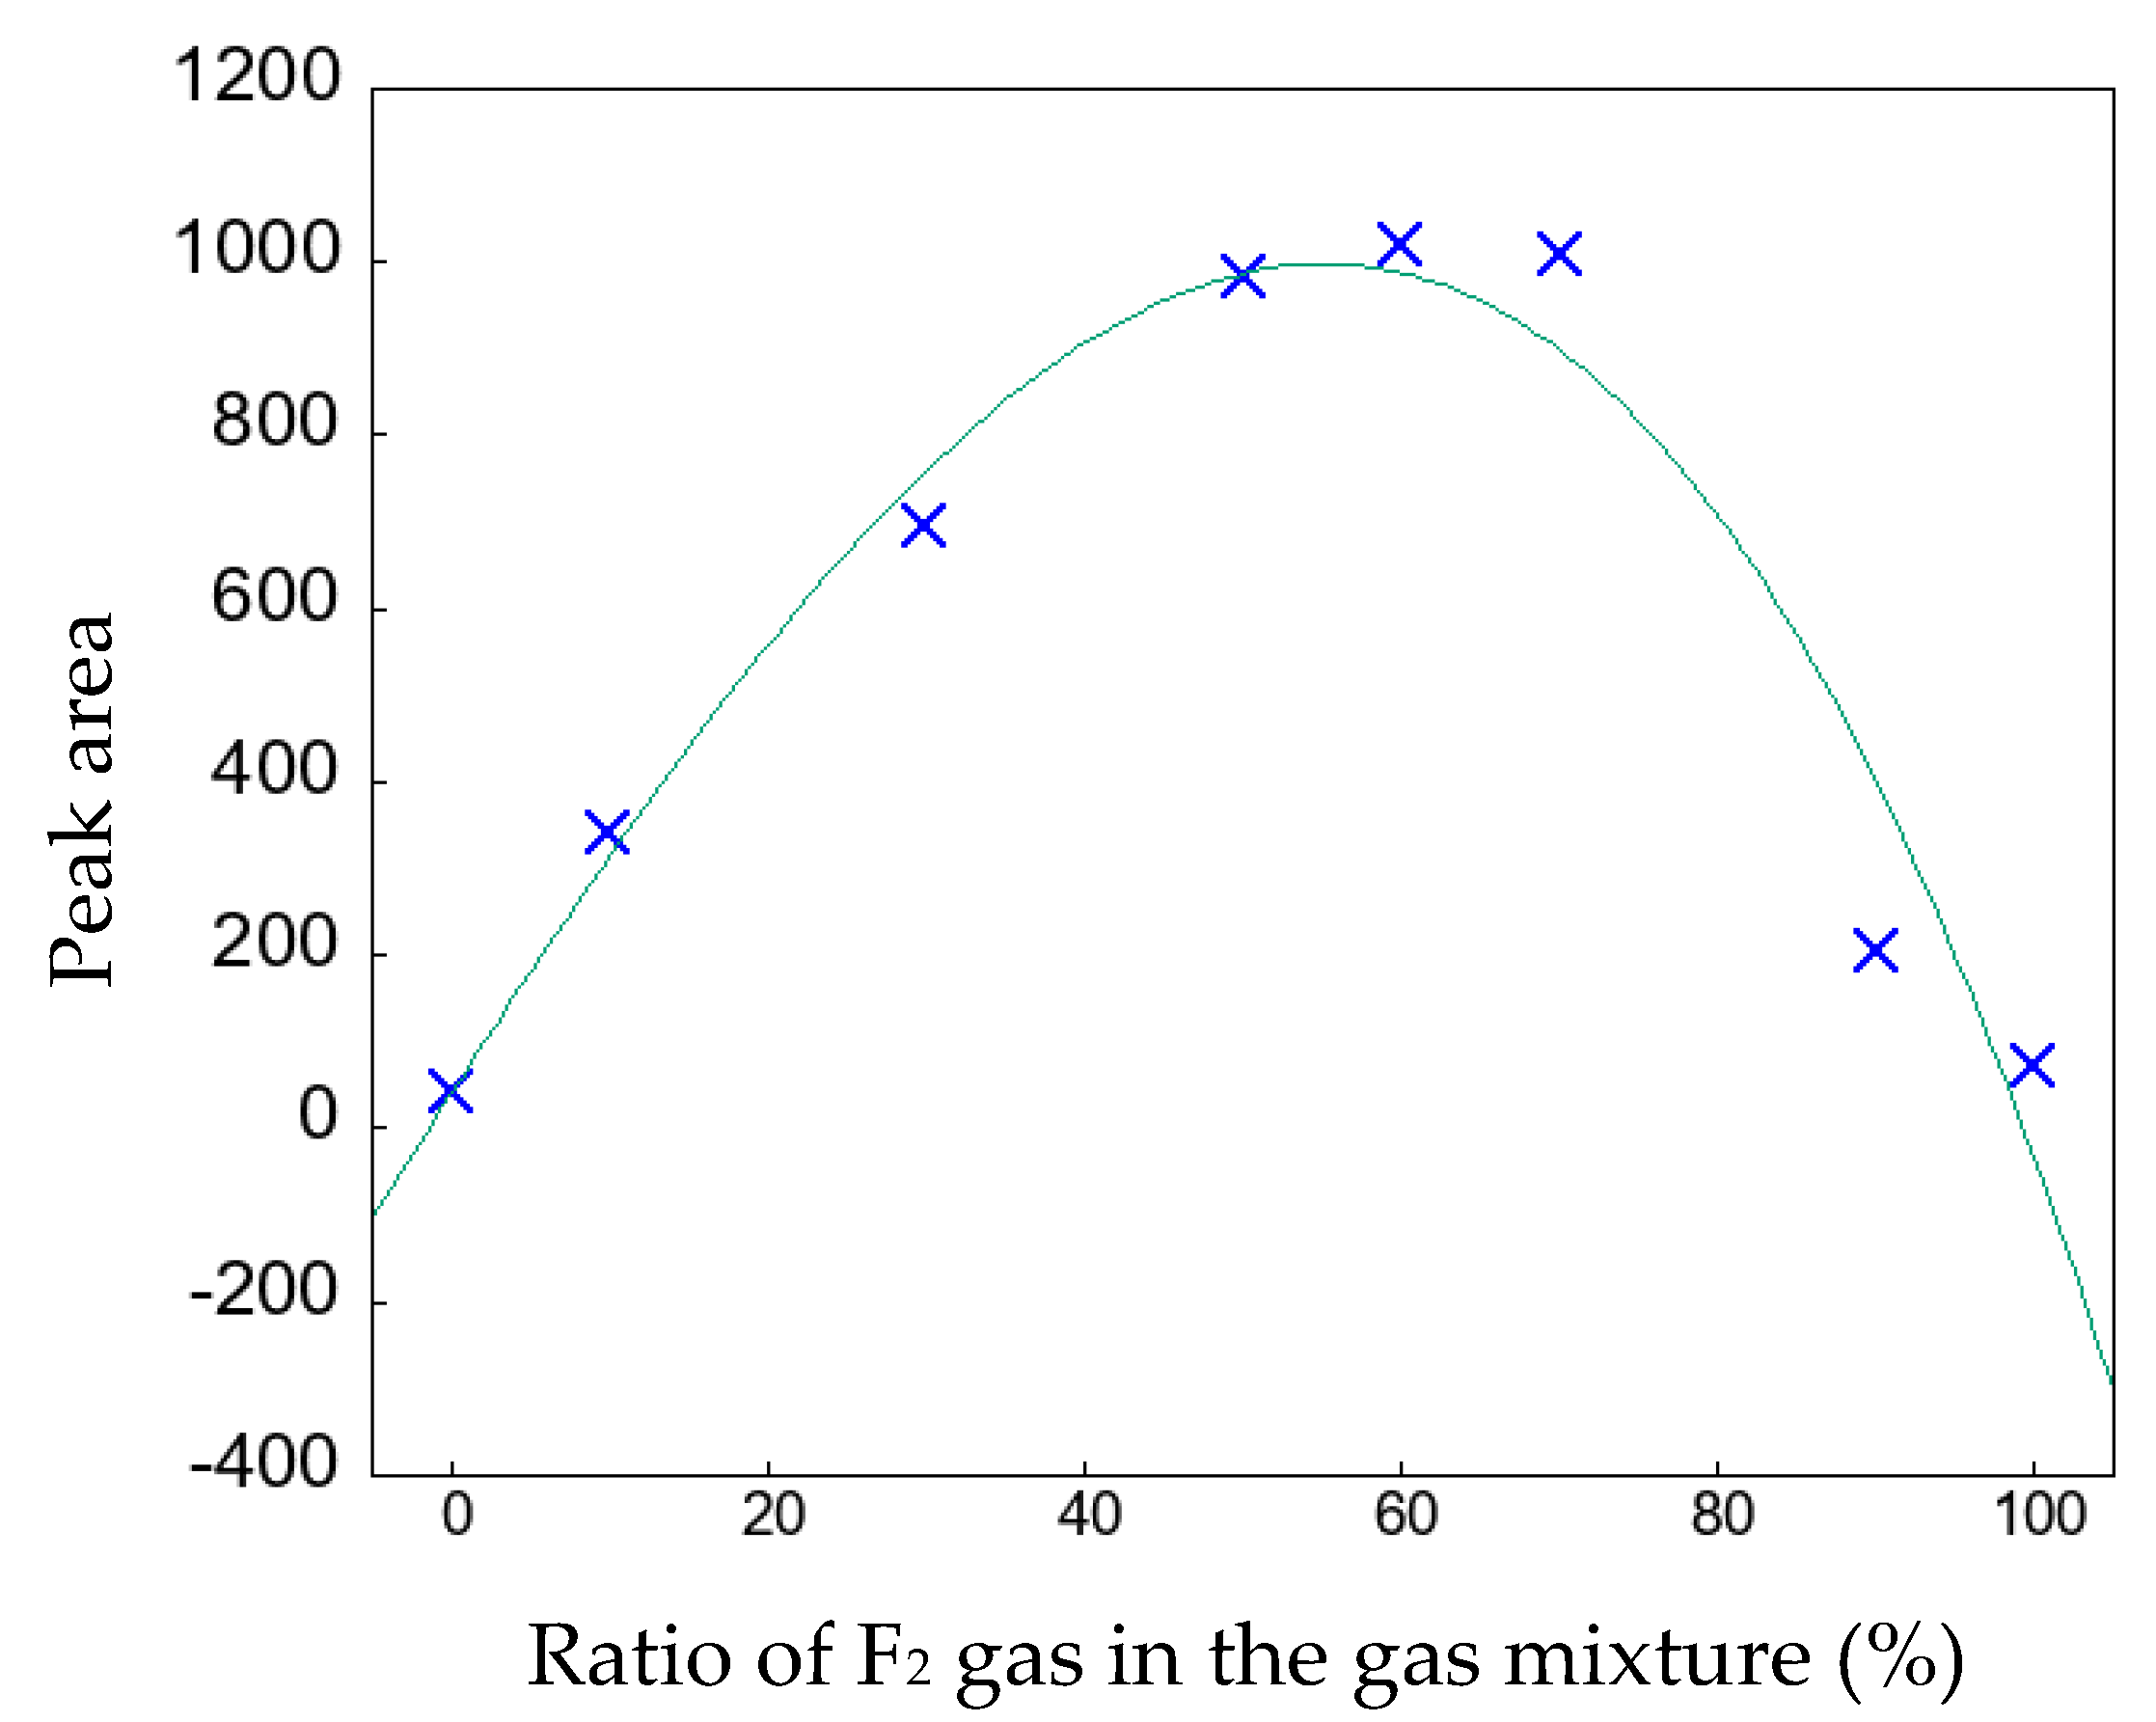
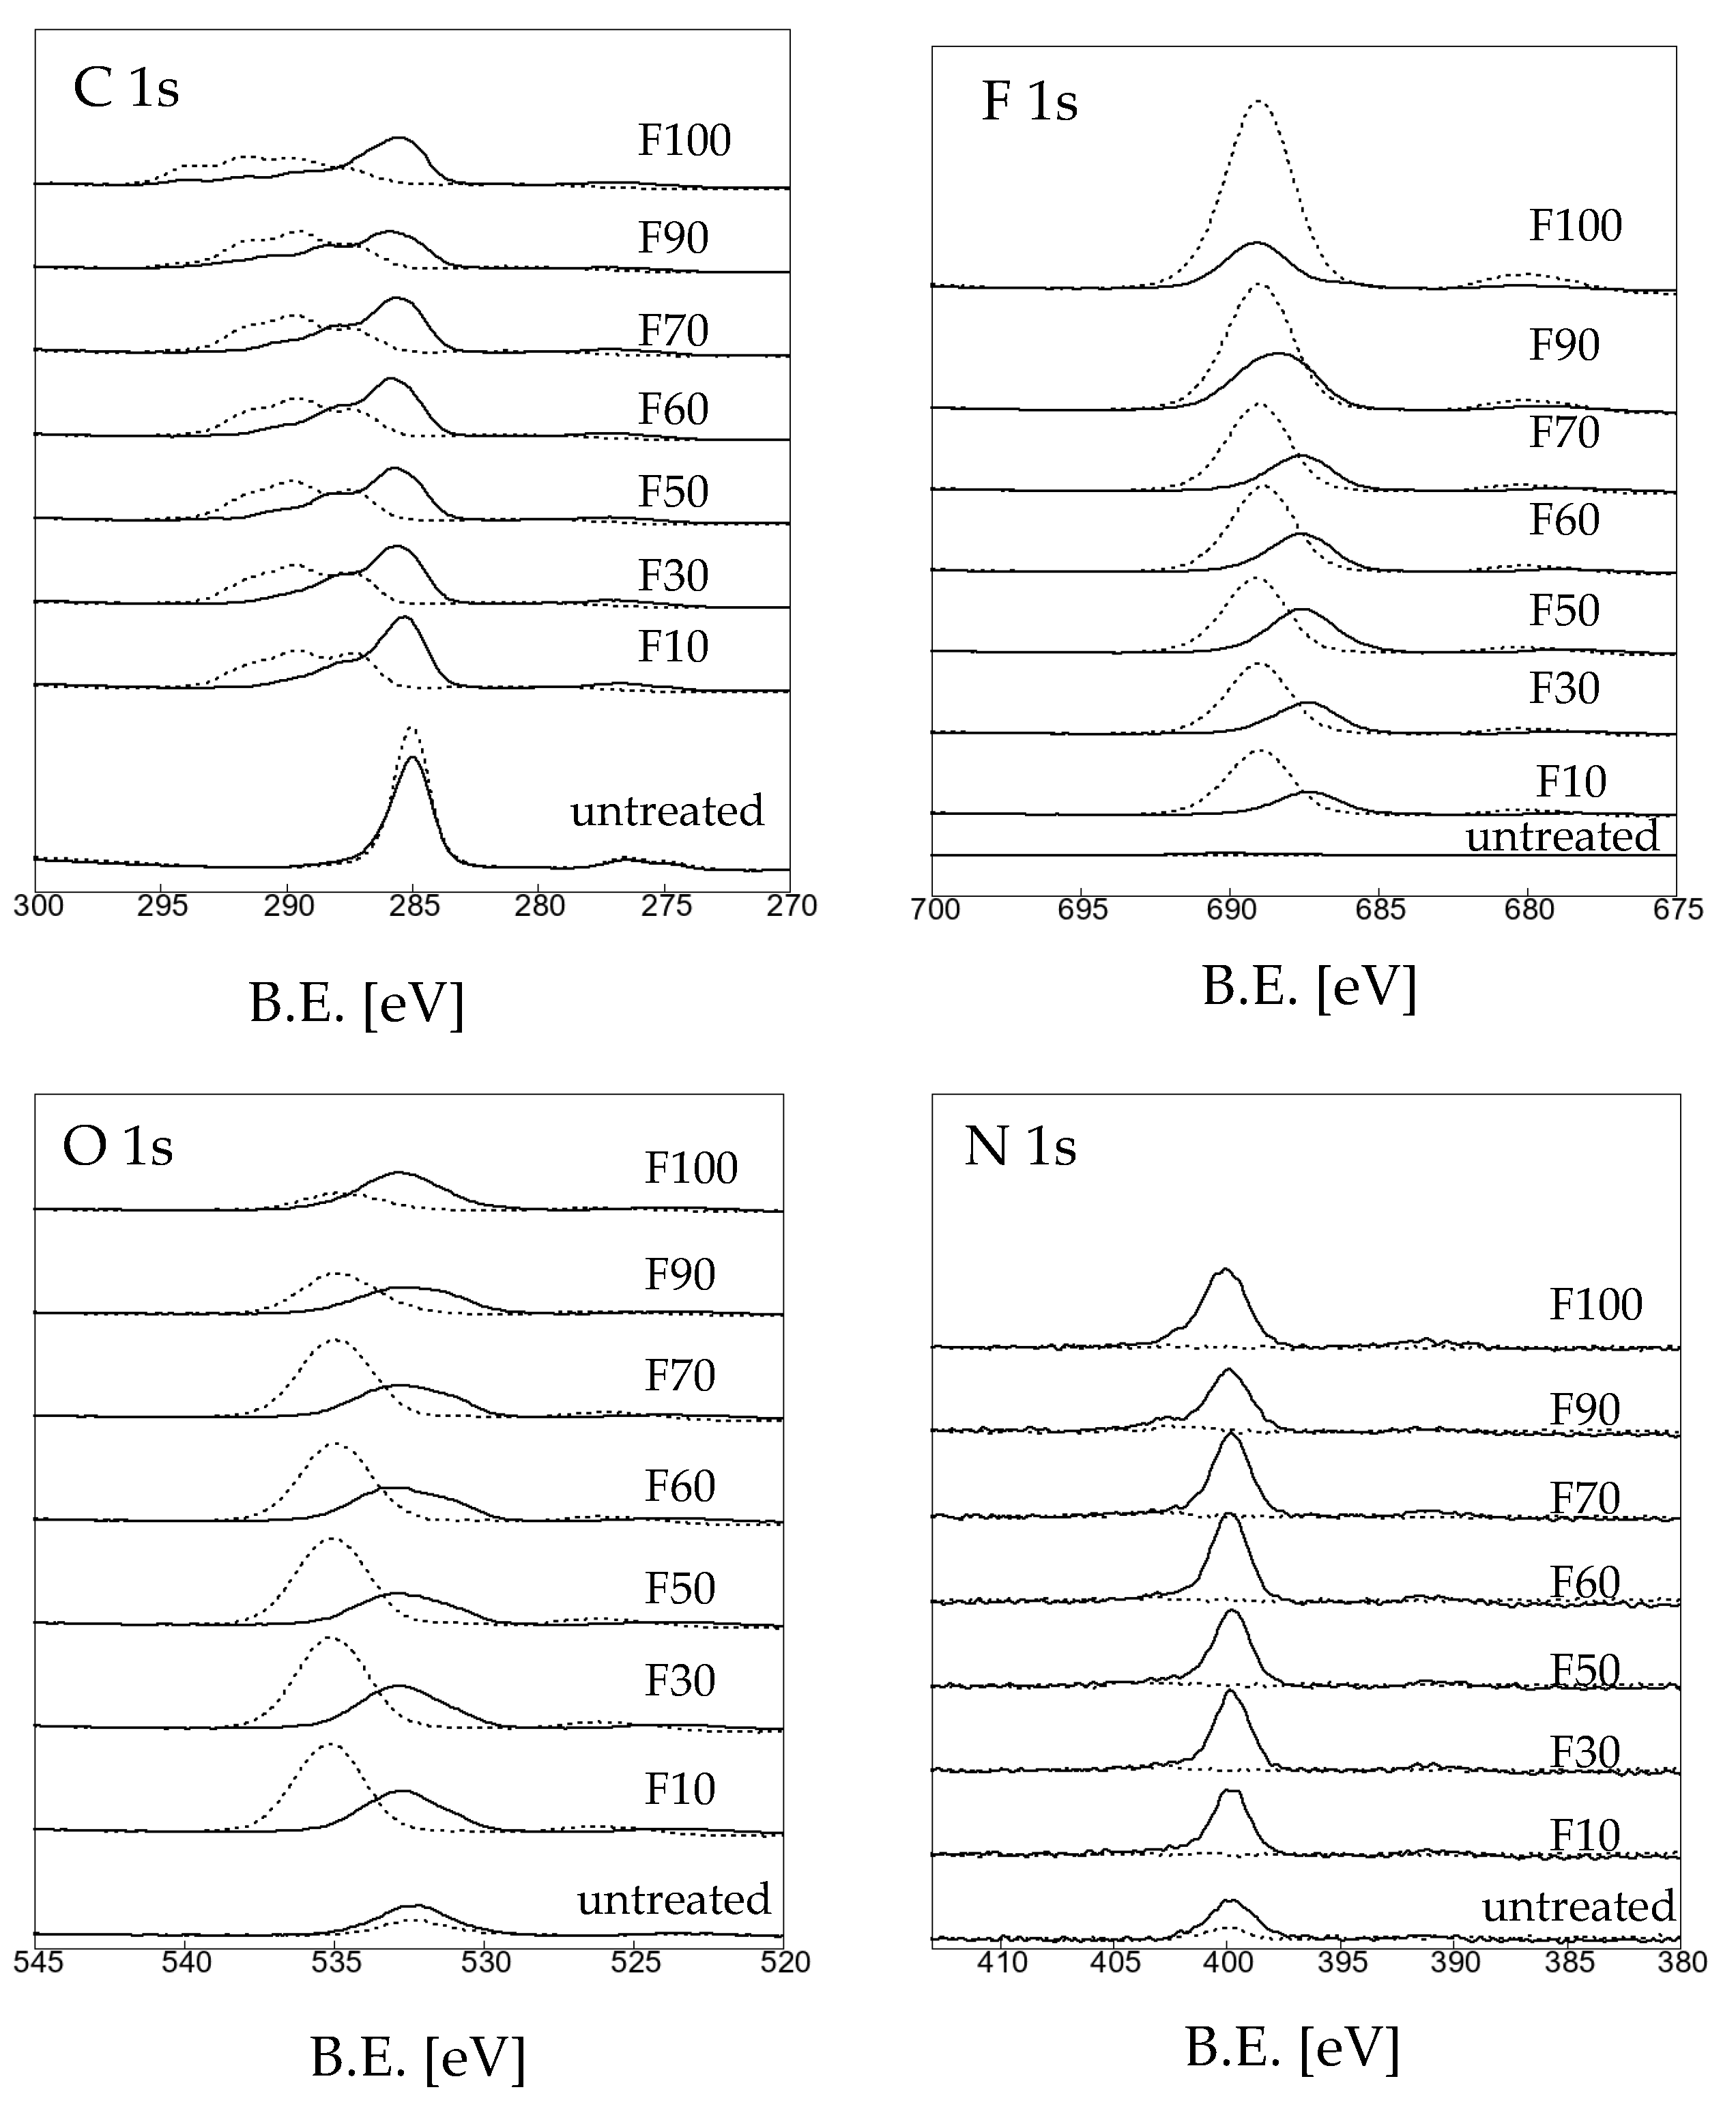
| Sample name |
Gas pressure | Gas mixture ratio (vol%) | Reaction temp. | Reaction time | |
| (kPa) | F2 | O2 | (°C) | (Min.) | |
| untreated | - | - | - | - | - |
| F10 | 13.3 | 10 | 90 | 25 | 60 |
| F30 | 30 | 70 | |||
| F50 | 50 | 50 | |||
| F60 | 60 | 40 | |||
| F70 | 70 | 30 | |||
| F90 | 90 | 10 | |||
| F100 | 100 | 0 | |||
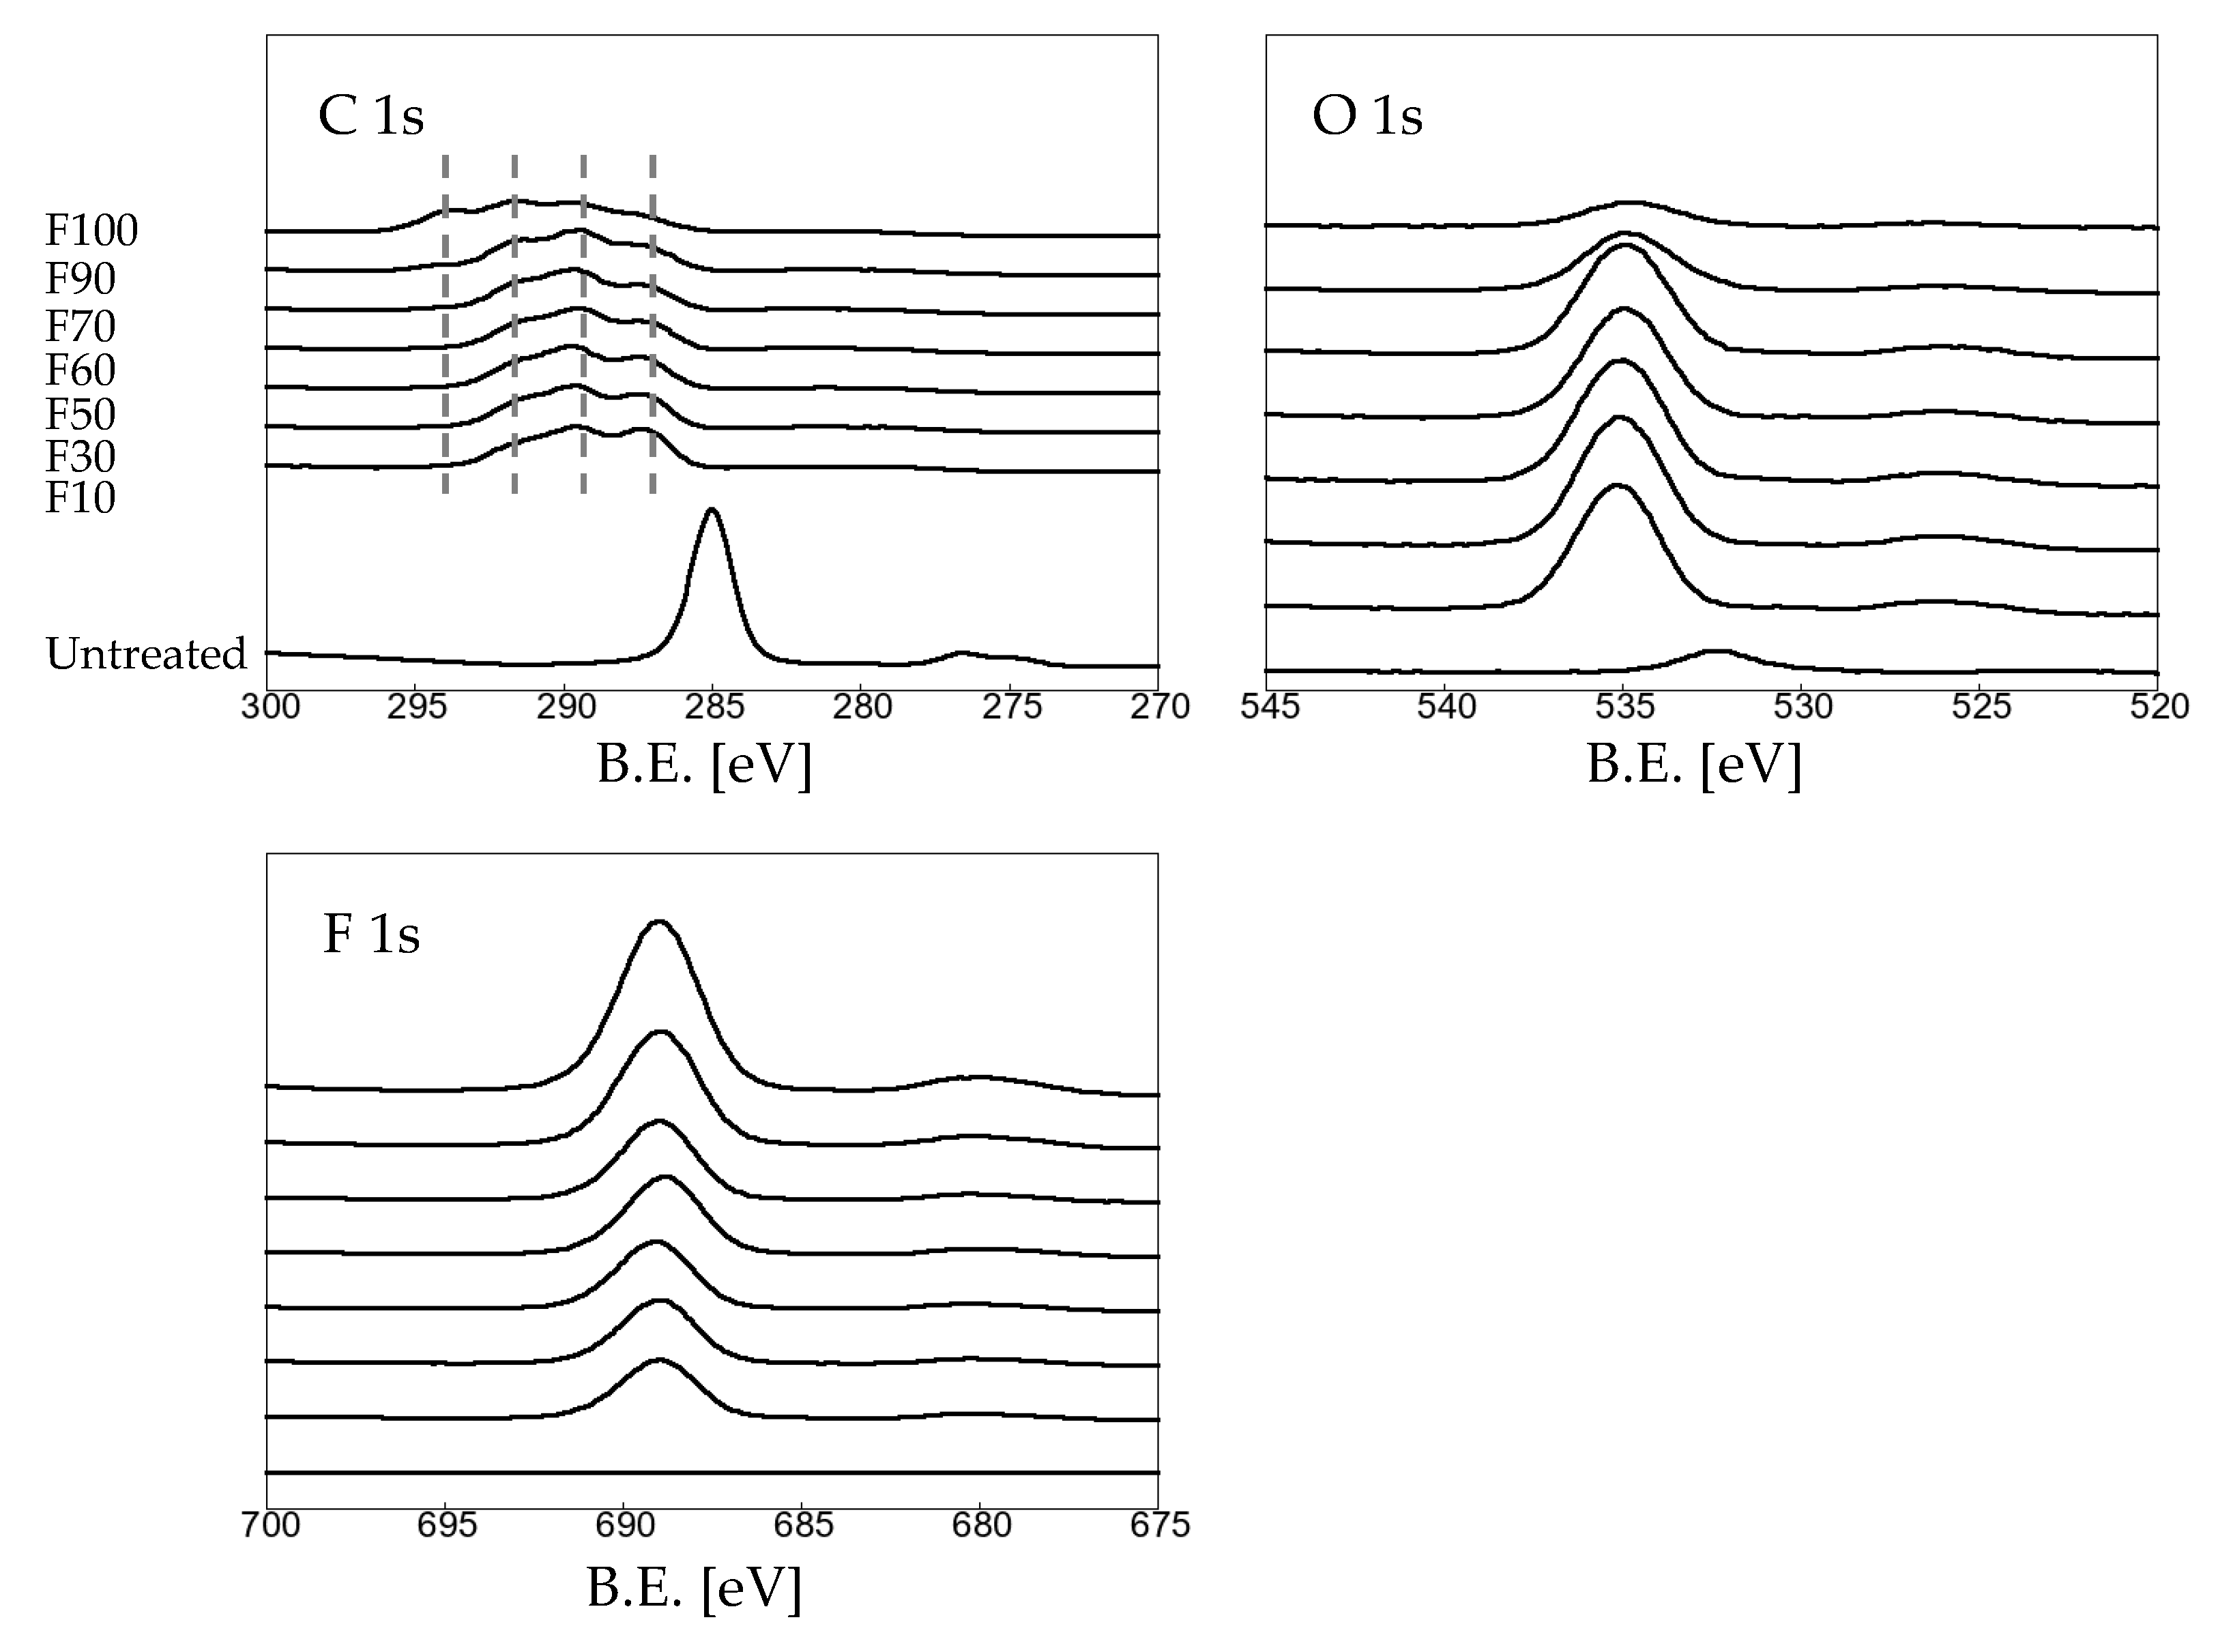
| Sample name | Elemental composition (%) | ||
| C 1s | O 1s | F 1s | |
| untreated | 94.52 | 5.45 | 0.03 |
| F10 | 47.01 | 20.76 | 32.24 |
| F30 | 45.24 | 21.09 | 33.67 |
| F50 | 44.43 | 20.16 | 35.41 |
| F60 | 42.11 | 17.50 | 40.39 |
| F70 | 41.10 | 18.30 | 40.60 |
| F90 | 38.23 | 8.57 | 53.20 |
| F100 | 29.78 | 3.05 | 67.17 |
Disclaimer/Publisher’s Note: The statements, opinions and data contained in all publications are solely those of the individual author(s) and contributor(s) and not of MDPI and/or the editor(s). MDPI and/or the editor(s) disclaim responsibility for any injury to people or property resulting from any ideas, methods, instructions or products referred to in the content. |
© 2023 by the authors. Licensee MDPI, Basel, Switzerland. This article is an open access article distributed under the terms and conditions of the Creative Commons Attribution (CC BY) license (http://creativecommons.org/licenses/by/4.0/).


