1. Introduction
Sulige is the largest gas field in China, with a cumulative gas production of more than 200 billion cubic meters and more than 18000 gas wells put into production in 20 years. The development process of Sulige is generally divided into three stages: early evaluation, large-scale development of enrichment areas, and rapid production growth. In the early evaluation stage, the development characteristics of multiple wells with low production were clarified, and an objective understanding of the strong reservoir heterogeneity, large changes in the gas reservoir thickness, and recoverable reserves of a single well were obtained. Subsequently, an idea for developing enrichment areas at low costs was proposed, which allowed gas production to rapidly grow from 280 million cubic meters in 2006 to 460 million cubic meters in 2008. From 2009, the progressive exploration was intensified to expand the development of the gas field from the central block to the east, west, and south blocks, accompanied by a gradual increase in reserves. An overall development plan was designed and the horizontal drilling technology was applied on a large scale, greatly speeding up the increase in productivity. The great success of the development of the Sulige tight gas reservoir largely depends on the low-cost development route and technological innovation, which have ensured the scale benefits [
1]. However, low-cost development has caused some problems. For example, under the mode of surface gathering and transportation of gas at the gas gathering station, the water production of multiple gas wells is centrally metered, which creates challenges in production performance analysis, productivity evaluation, and development index forecasting. These problems are more evident in the western Sulige gas field where water production is a common phenomenon and wellbore liquid loading is severe in gas wells. These gas wells were considered to be wells without water production, which caused large calculation errors and thus an inaccurate understanding of the production performance of the gas wells and the overall productivity of the block [
2,
3,
4]. Water production has always been a challenge in the development of sandstone gas reservoirs, and several studies have been conducted in recent years. To identify the types of main flow channels in the complex porous media in gas reservoirs, Li et al. [
5] defined the main flow channel index and established a mathematical model based on an equivalent flow assumption. They proposed a classification method for the main flow channels and realized quantitative characterization of the main flow channels. To understand the water production process along the different permeability layers, Hu et al. [
6] conducted an experimental study on edge water invasion of the multilayer commingled production in unconsolidated sandstone gas reservoirs. It was revealed that the edge water invasion in the commingling production was mainly affected by two major factors, i.e., the reservoir permeability and gas production rate, which jointly controlled the encroaching water advance path and speed. These previous studies on water production in tight sandstone gas reservoirs mostly focused on laboratory tests, which cannot solve the production problems caused by the lack of single well water production measurements in the Sulige gas field. In this study, based on well testing data for gas wells, static and dynamic studies were conducted to analyze the relationships between the reservoir’s physical properties and gas/water production, thus providing a basis for development index forecasting. Then, the flow rate of gas wells with continuous liquid carrying was calculated, and the gas well liquid loading law was analyzed by type. In addition, depending on the production performances of the gas wells in the different production stages, five methods for diagnosing water production were provided: gas production testing, pilot production, gas-liquid two-phase metering test, liquid level detection, and production performance analysis. Because the diagnosis of the loaded liquids and water production performance cannot provide an accurate basis for the adjustment of the gas well productivity and drainage measures, to obtain the water production data for the entire life cycle of a single well, we focused on the exploration of water production calculation, and a water production splitting method based on three-dimensional geological modeling and numerical simulation was established. The water production data calculated can be used to evaluate the two-phase gas and water productivity and to determine the best drainage cycle for gas wells.
2. Study Area
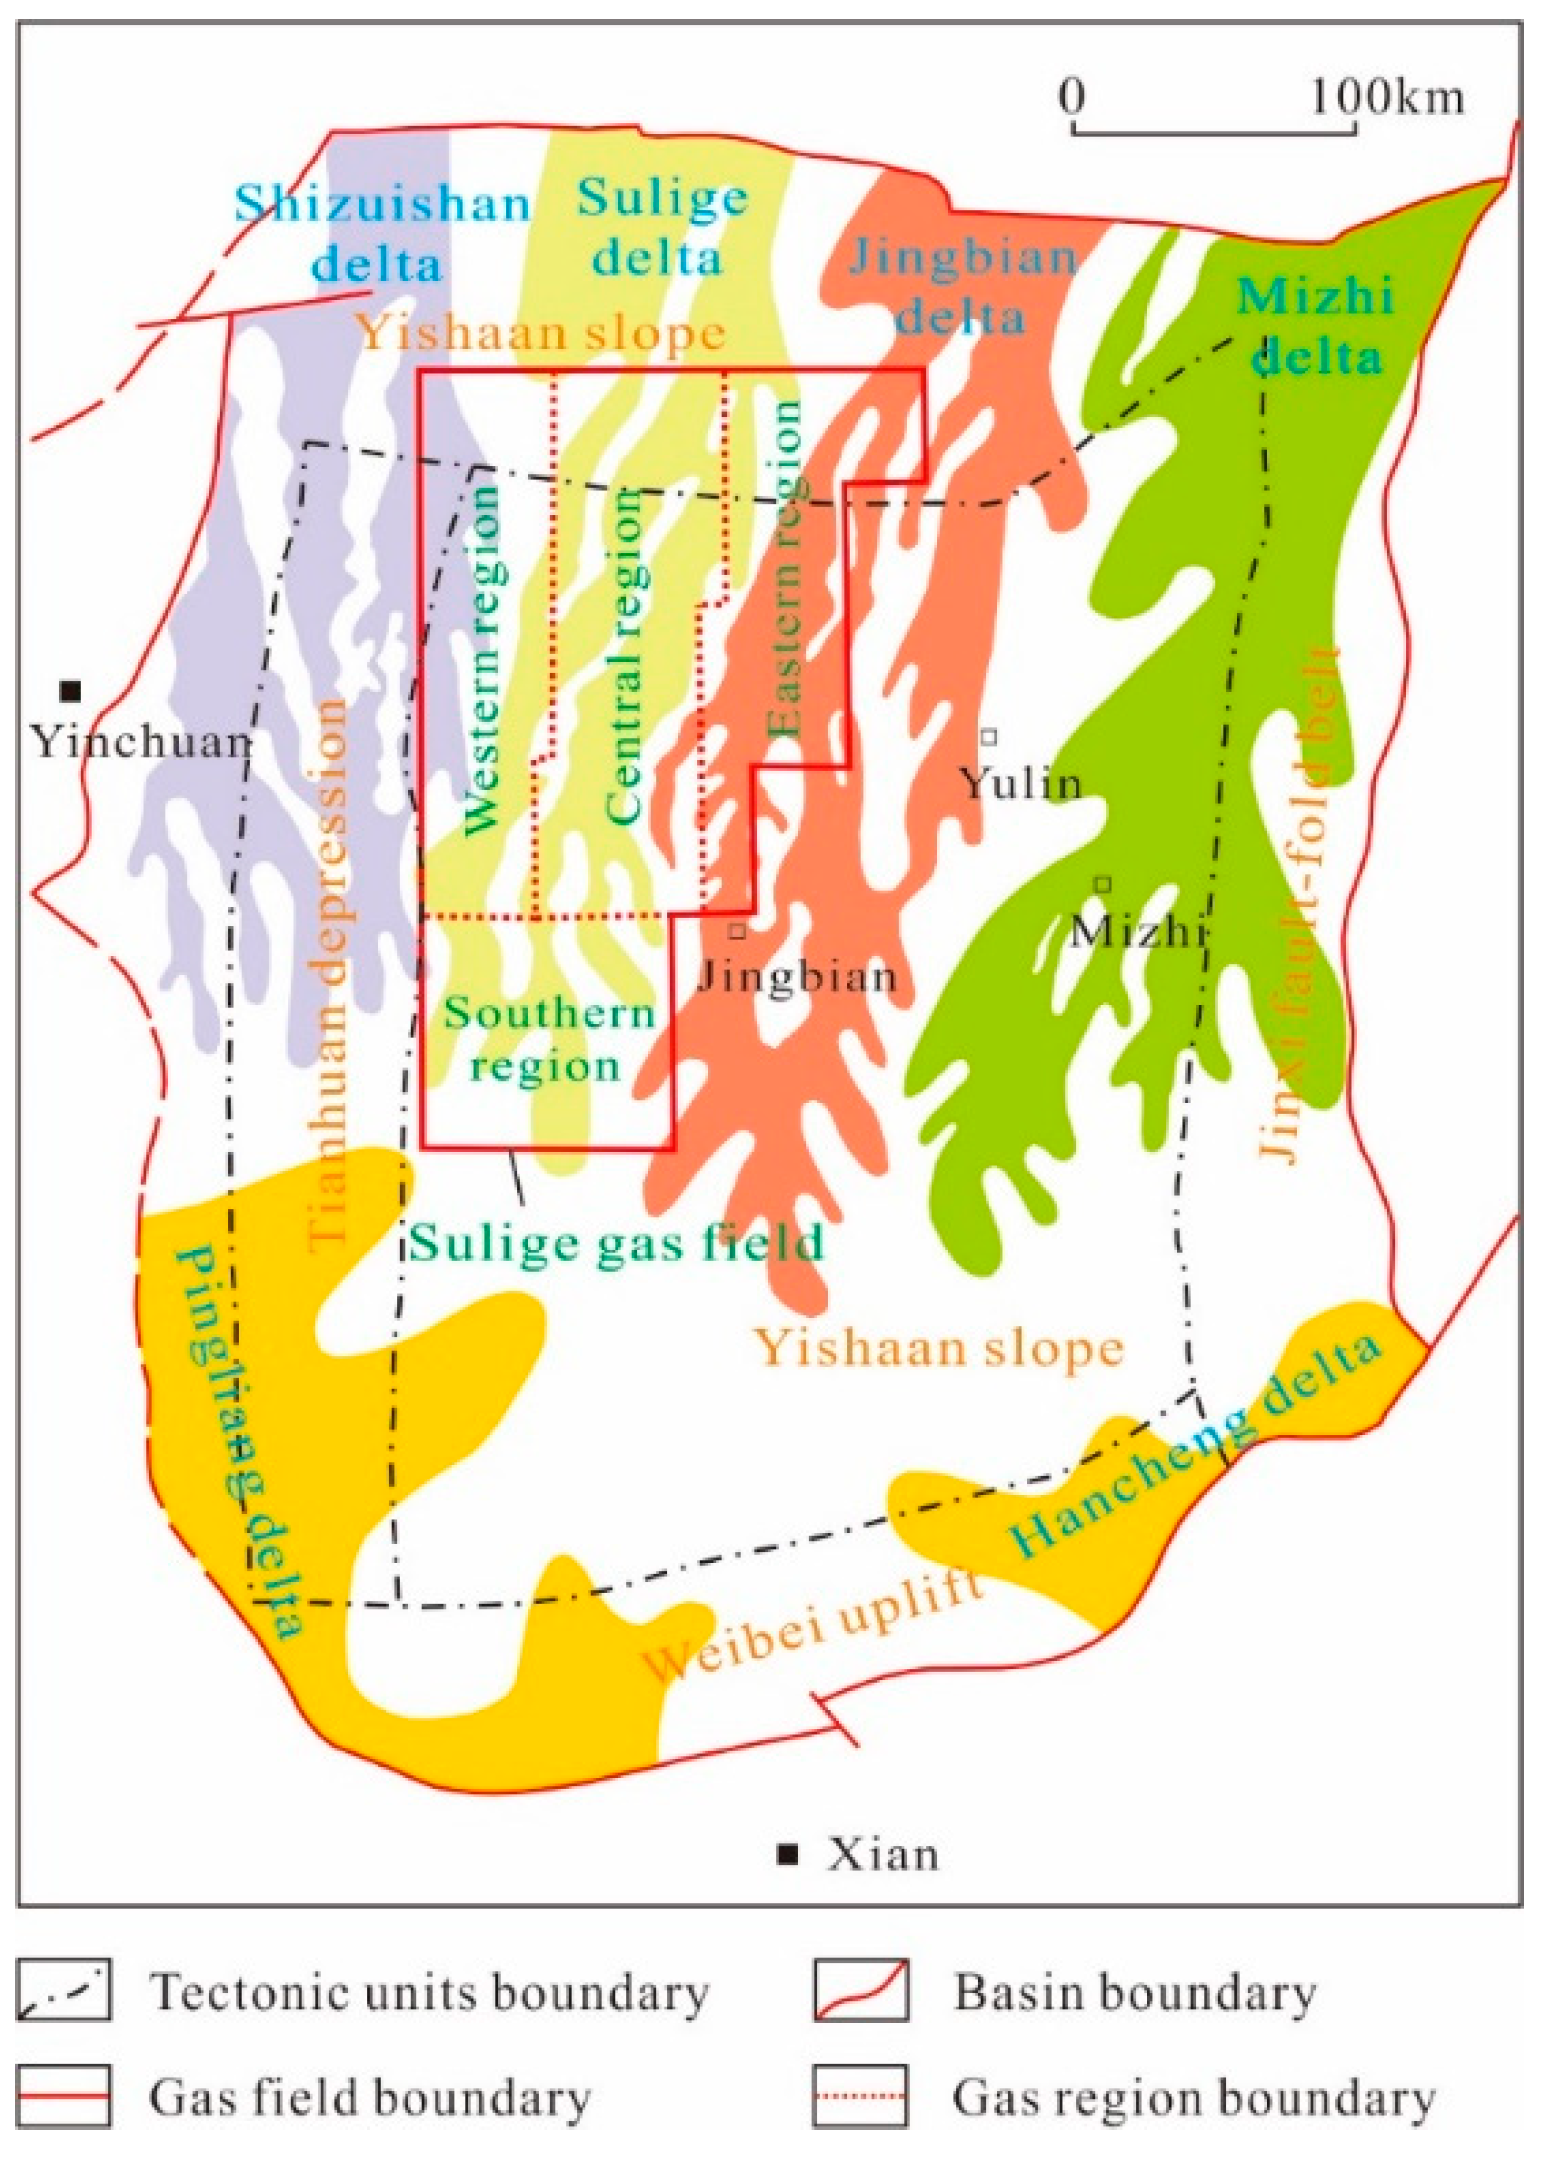
The Sulige gas field is located in the northern part of the Ordos Basin. From the tectonic perspective, it is located on the west side of the Yishan slope and connects the Tianhuan depression. Sulige is a flat west dipping monocline that stretches across the Shizuishan, Sulige, and Jingbian delta sedimentary systems, being the largest tight sandstone gas field discovered in China, and its typical characteristics are strong reservoir heterogeneity, low pressure, low permeability, and low abundance [
7,
8,
9]. Furthermore, Sulige can be divided into four sections: eastern, central, western, and southern (
Figure 1). Among them, the west block is a key reserve area for the progressive development of the Sulige gas field. In the west block, the gas–water relationship is complicated, and water production is a common phenomenon. The majority of the gas wells experience a rapid decline in the bottomhole pressure and production after a short period of production. The insufficient liquid carrying capacity of the gas wells leads to a continuous increase in the wellbore fluid accumulation until the gas wells are flooded and shut in. Consequently, over 1,000 billion cubic meters of gas in place cannot be effectively developed.
3. Characteristics and Methods
3.1. Water production characteristics
The western Sulige gas field is located in the lowland area of the overall structure, and is a gas–water transitional area, in which the water-bearing zones are widely and extensively distributed and the gas zones are poorly developed and scattered [
10]. Over 90% of the gas wells produce water after testing, pilot production, or production. By the end of 2022, the overall water-gas ratio (WGR) of the western Sulige gas field was 0.68 m
3/10
4 m
3 on average and up to 2.4 m
3/10
4 m
3 locally. The impact of water production has increased the proportion of low-production and low-efficiency wells to 60%. In addition, more than 200 wells have been shut in due to liquid loading of the wellbore [
11]. Water production has severely restricted the production of the gas wells and the effective development of regional reserves. This requires an in-depth investigation of how to diagnose liquid loading and identify water producing wells.
3.1.1. Water production mechanism
Based on the micro-pore structure of the reservoir and the hydrophilic properties of the quartz sandstones, the formation water in western Sulige can be classified into free water, retained water, and bound water [
12]. Free water is a typical type of pore water, which is not displaced due to an insufficient gas supply during the gas charging process and flows freely under its own gravity. Certain differentiation occurs between the free water and gas zones, and the water production is higher than 12 m
3 per day. The retained water is located inside the disconnected or isolated pores in the microthroats due to incomplete displacement during the gas charging process, and it is impossible for the retained water to flow freely due to the capillary force. No differentiation occurs between the retained water and gas zones and the retained water is associated with natural gas flowing to the surface after reservoir fracturing at a rate of 1–12 m
3 per day. The bound water exists in the micropores or is adsorbed on the surfaces of the particles and in the clay matrix, and it is impossible for the bound water to flow freely. No differentiation occurs between the bound water and gas zones, and the bound water cannot be easily recovered through reservoir fracturing. According to the gas production testing data for 686 wells in the study area, 0–46.5 cubic meters of water were produced per day, and the major types of water produced were retained water and free water [
13].
Based on the configuration of the sandstone and mudstone and the differences in the internal physical properties of the complex sand bodies, there are five gas and water distribution types in the western Sulige: pure gas, mixed gas and water in super-thick reservoirs, water in the upper section and gas in the lower section, gas in the upper section and water in the lower section, and gas sandwiched between water [
11]. Due to the presence of tight reservoirs across the gas field, the gas charging pressure is insufficient to balance the capillary force on the formation water, resulting in the retention of the formation water in the relatively tight zones. Therefore, the pattern of mixed gas and water in super-thick reservoirs is the most common, which leads to widespread water production in the western Sulige gas field [
14,
15].
3.1.2. Dynamic and static intersection characterization
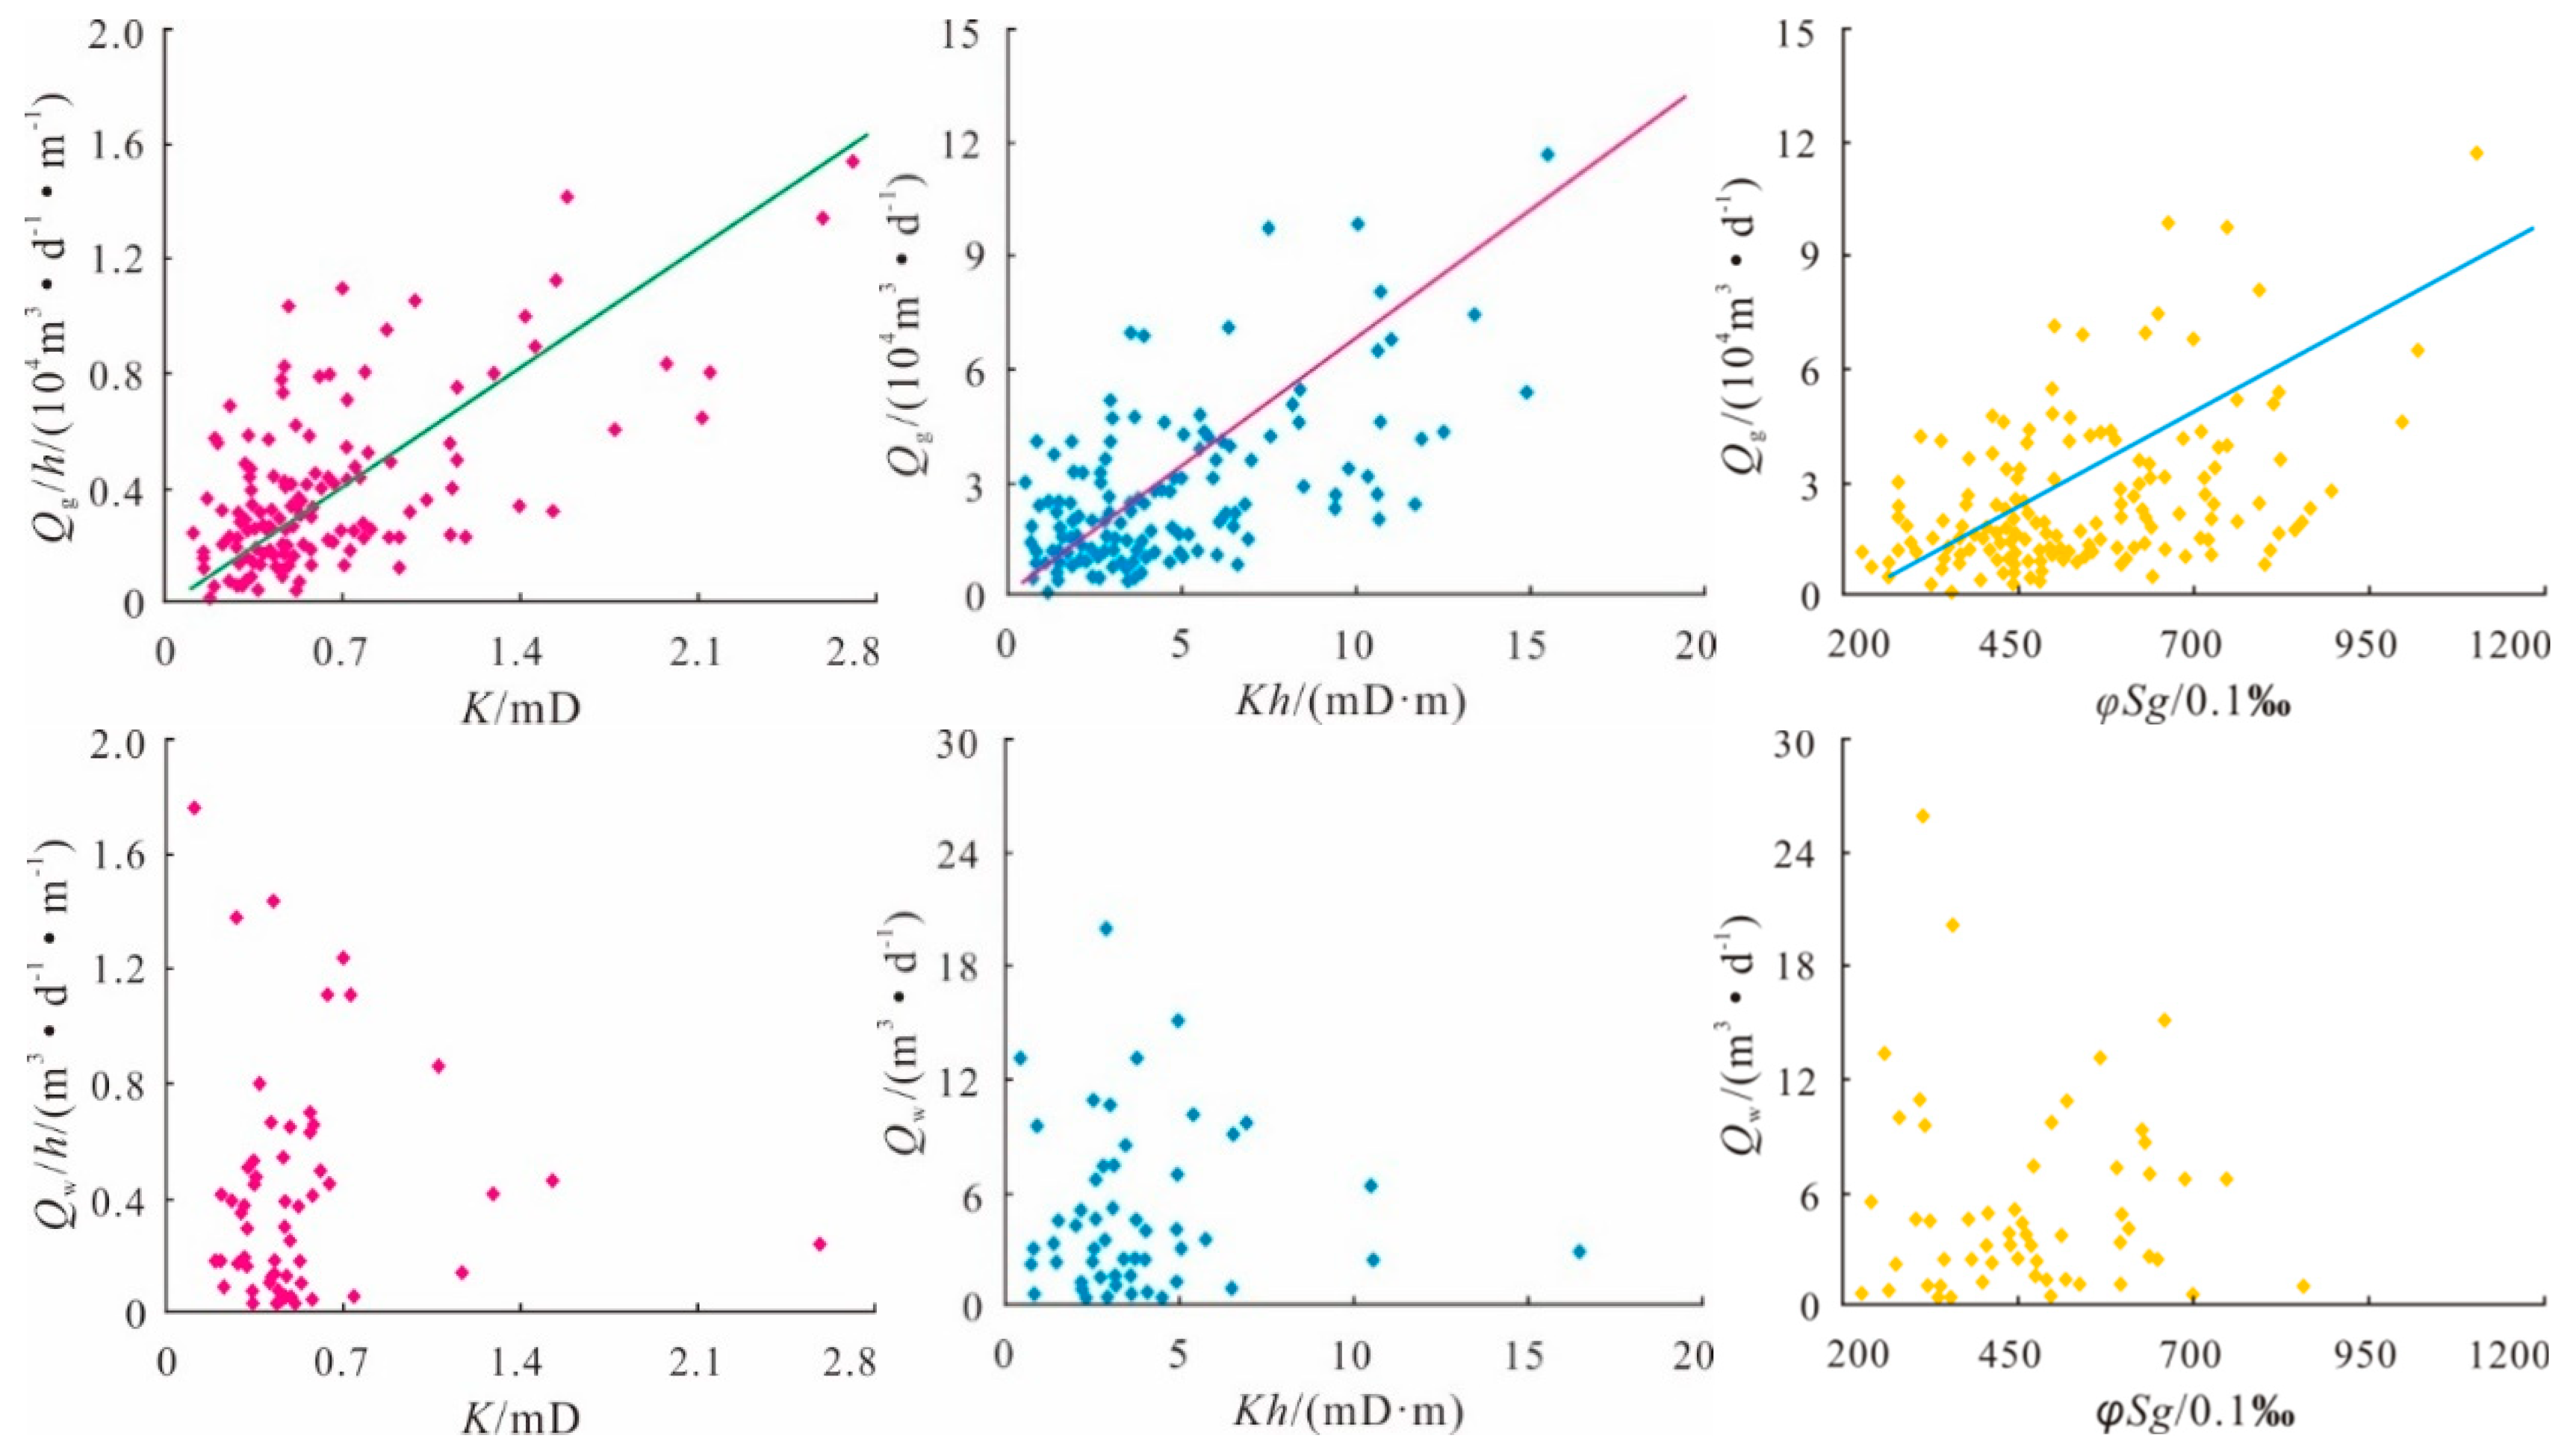
Based on the single-layer test data for 217 wells, the correlations between the physical property parameters of the pay zones and the test gas/water production were analyzed. The results show that each normalized parameter and combinations of the normalized parameters, such as the effective thickness, porosity, permeability, and gas saturation, are well correlated with the test gas production but not with the water production. For example,
K,
Kh, and
φSg are positively correlated with
Qg/
h,
Qg, and
Qg, respectively, but they are not correlated with
Qw/
h,
Qw, and
Qw, respectively (
Figure 2). This means that the test gas production of a new well can be predicted based on the static physical property parameters of the reservoir, but the test water production cannot yet be effectively prejudged for gas wells.
3.1.3. Wellbore liquid loading law
Wellbore liquids are recovered to the surface with gas in the form of a liquid membrane, which moves along the tubing wall, or as droplets, which are mixed in the high-speed gas flow and move upwards. These two forms constantly interchange [
16,
17,
18]. When gas fails to provide sufficient energy for carrying wellbore liquids out of the hole, liquids are loaded in the gas well. As liquids accumulate, the backpressure on the gas zone increases, and the water saturation of the pores or flow passages in the near-wellbore formations rapidly increases, thereby expanding the water-cut area, increasing the flow resistance, reducing the gas permeability, and limiting the productivity of the gas wells. In a low-pressure gas well, the loaded liquids may kill the well. In a high-pressure gas well, liquid slugs may exist in the well and affect the well testing results.
A widely-used ellipsoidal droplet model was used to evaluate the critical liquid-carrying flow rate within the full life cycle of 198 wells in the study area (Equations (1)–(3)) [
19], and a critical liquid carrying curve was obtained for each gas well (
Figure 3). The critical liquid-carrying flow rate was then compared with the daily gas production of each gas well to identify whether liquids were loaded during the gas production process and to identify the liquid loading status and impact on the gas production. The evaluation results show that the critical liquid-carrying flow rate ranges from 20,000 to 30,000 m
3 per day and the liquid loading can be classified into three types: (1) continuous liquid carrying, with a daily gas production higher than the critical liquid-carrying flow rate; (2) slight liquid loading, with a daily gas production fluctuating below and above the critical liquid-carrying flow rate depending on the production system; and (3) liquid loading, with a daily gas production far lower than the critical liquid-carrying flow rate (
Figure 3). In total, eight of the gas wells were continuous liquid carrying type, 20 of the gas wells were slight loading type, and 170 of the gas wells were liquid loading type, accounting for 96% of all of the wells. The analysis results show that the daily gas production of the majority of the gas wells was lower than the critical liquid-carrying flow rate. This did not allow the liquids to be carried out of the hole, and the loaded liquids interrupted normal gas production. Thus, effective deliquification measures were required to recover the productivity of gas wells.
3.1.4. Water-producing well diagnosis
The production characteristics of water-producing gas wells in each production stage were different from those of conventional water-free wells. Analysis of the water production and liquid loading of the gas wells and the critical liquid-carrying capability can provide a reference for determining a reasonable daily production of a gas well and appropriate deliquification measures [
13]. Based on the production performance of the gas wells in the different production stages, five methods for diagnosing water production were proposed: gas production testing, pilot production, gas-liquid two-phase metering test, liquid level detection, and production performance analysis. The first three methods can intuitively calculate the WGR of gas wells and determine the severity of the water production. Liquid level detection uses borehole pressure gauges to detect the liquid level inside the tubing, checking whether a gas well is loaded with liquids and how long the liquid column is. The production performance analysis method calculates the production indexes, such as the casing pressure drop rate and gas production per unit of the casing pressure drop, to check whether the production is affected by water. Gas wells diagnosed using these methods were traced and compared with conventional wells regarding the production indexes. Then, standards for determining the severity of the water production and for diagnosing liquid-loaded gas wells were formulated and relative treatments for the western Sulige gas field were selected (
Table 1) [
20,
21].
3.2. Water production splitting
3.2.1. splitting method
To analyze the water producing principles of a gas reservoir/well, three factors are necessary: (1) gas and water exist in the porous media and have relative saturation; (2) gas and water with relative saturation can flow through the porous media; and (3) a pressure field is available to provide the driving force [
22,
23]. With all three factors available, a gas well can produce both water and gas, which may separately flow or exist as mixed flow. To analyze the flow behaviors of gas and water in a real geological environment, the general approach is to obtain a gas–water relative permeability curve through a test. This type of test is called the non-steady method. In the test, a known gas is injected to displace the saturated liquid in the porous media of a core. The changes in the liquid production and the pressure difference are tracked during the test and then used to calculate the gas–water relative permeability. A curve is plotted to illustrate the change in the gas–water relative permeability with water saturation [
24].
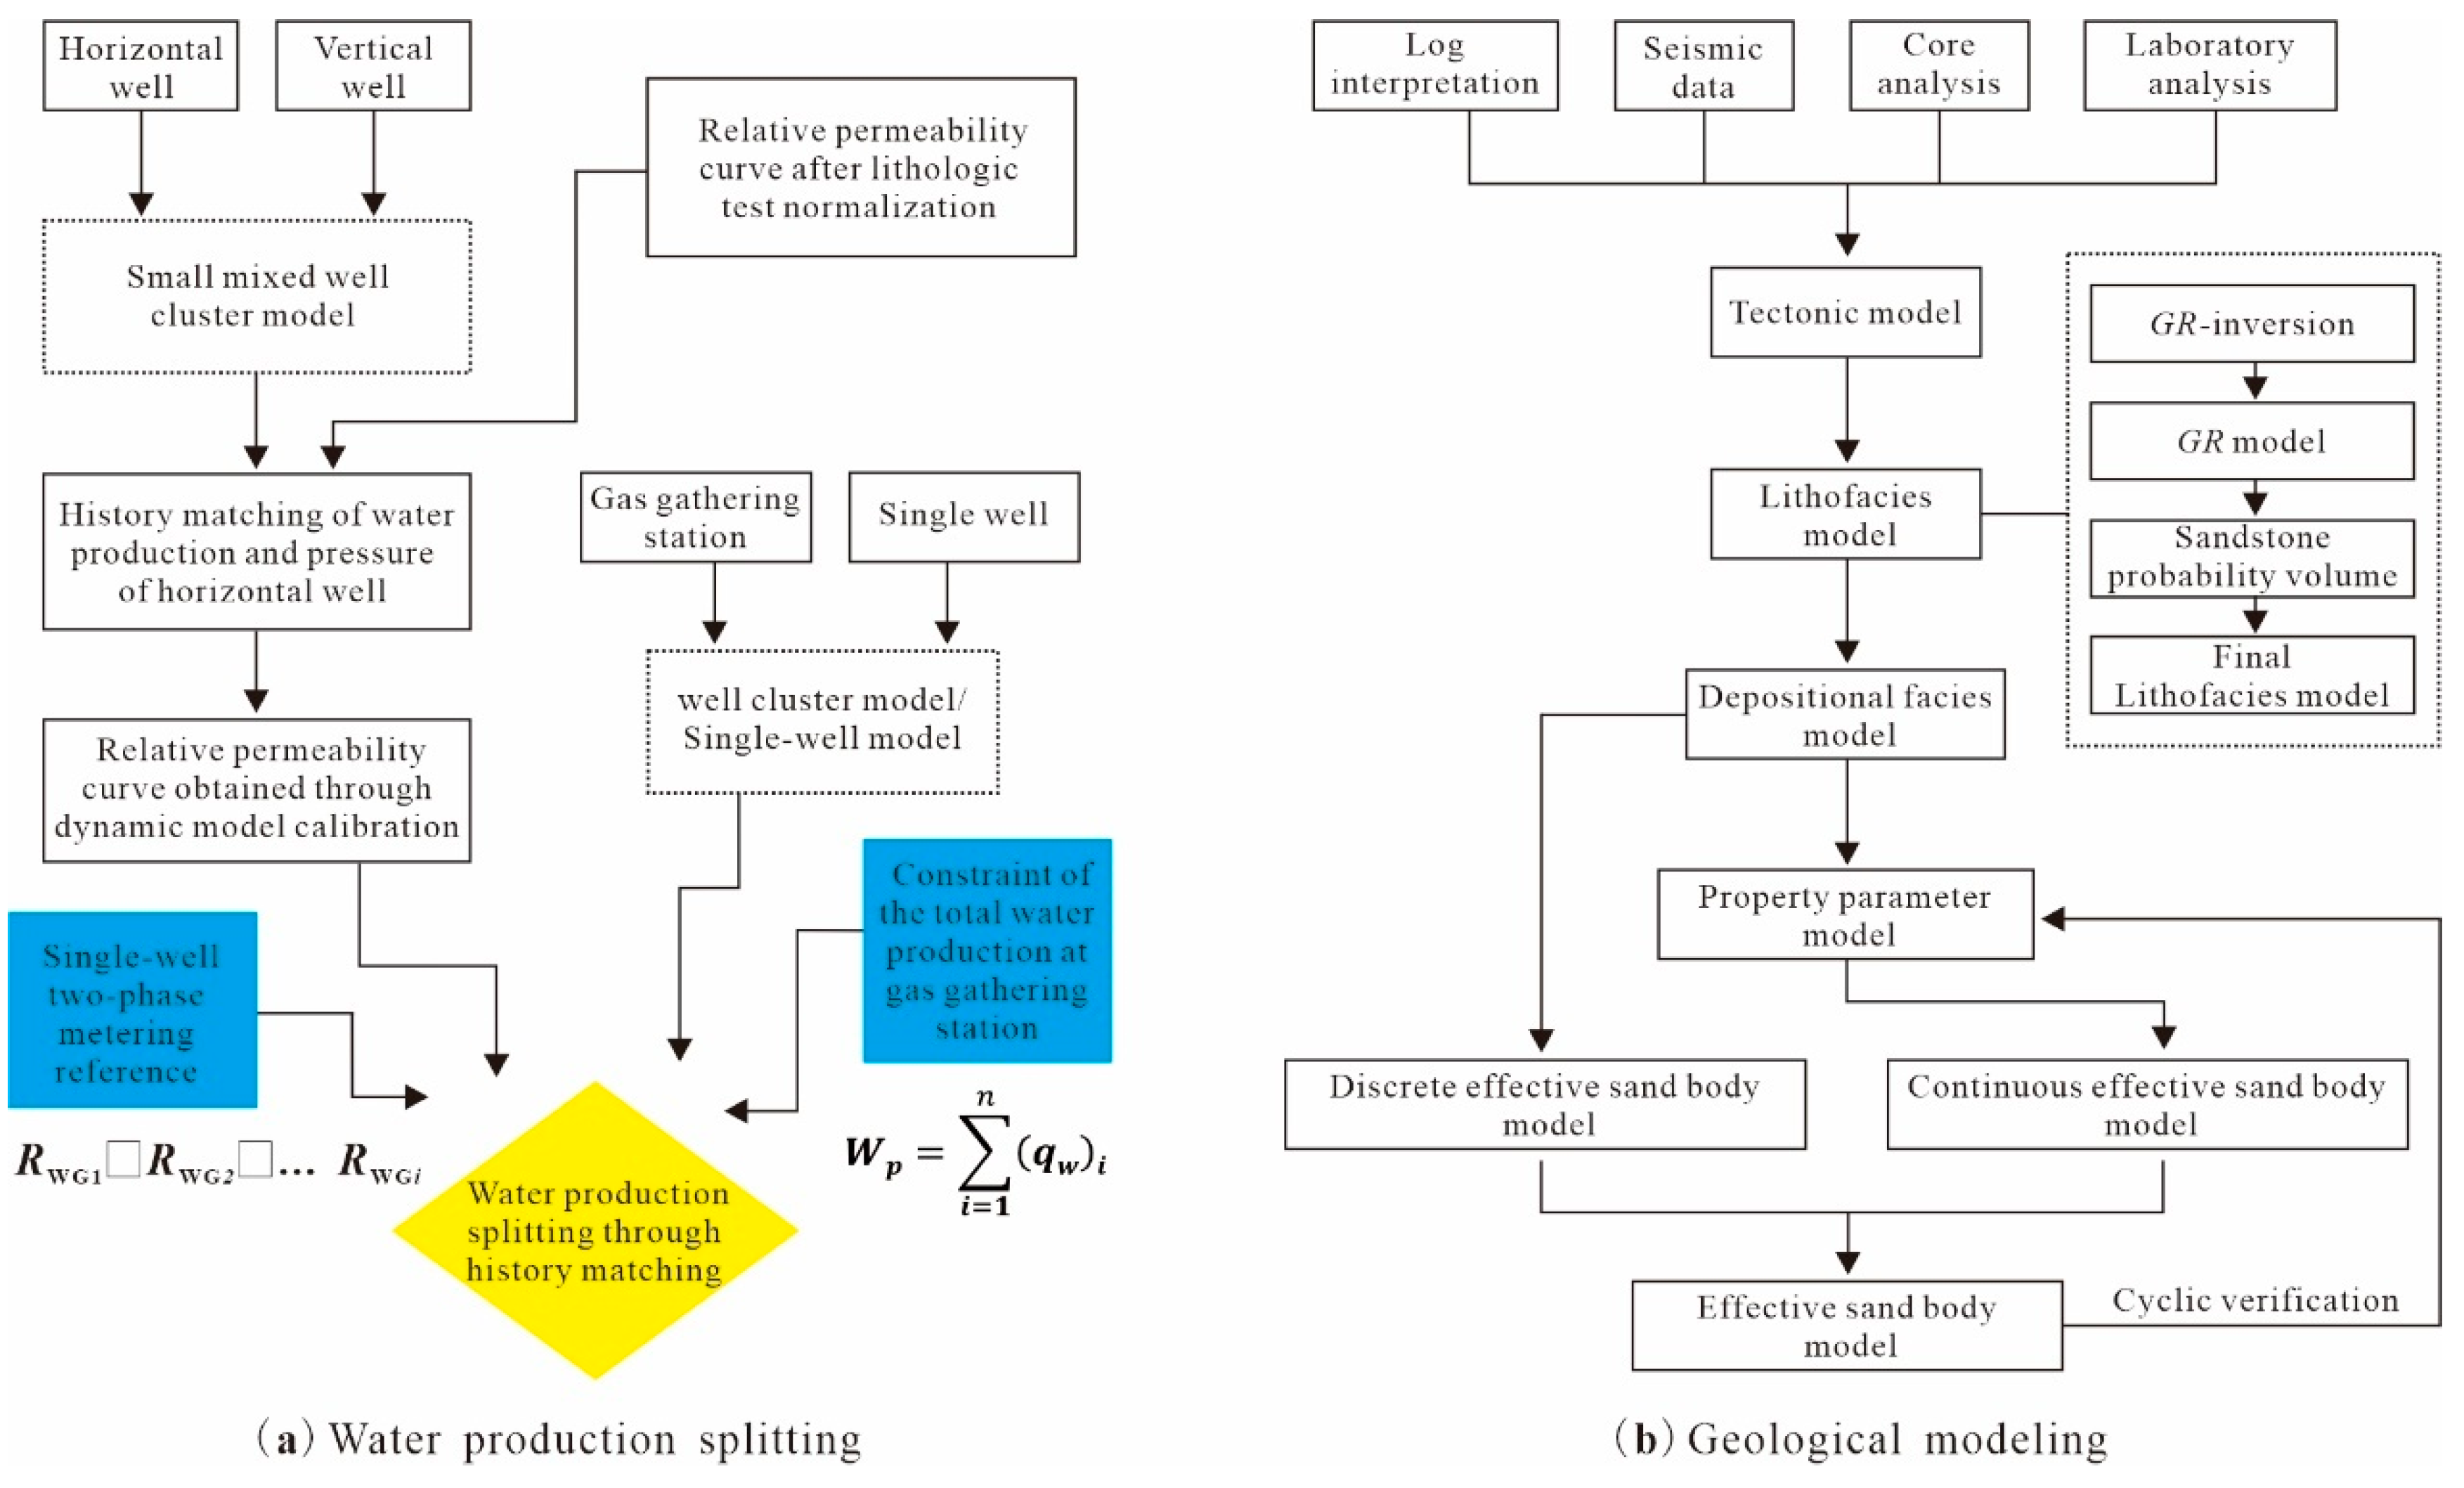
Based on how the gas–water relative permeability was obtained, it can be easily determined that water production can be obtained through reverse deduction under the conditions of the gas–water relative permeability, gas flow rate, and pressure change. Thus, a water production splitting method was generated. The splitting method uses 3-D geological modeling and numerical simulation. During the 3-D geological modeling, the high-accuracy method of phased restriction, staged sedimentary facies control, and stepped modeling are used to address the poor adaptability of the traditional methods to the discontinuous gas reservoirs in continental braided fluvial deposits in the Sulige gas field [
25]. Based on the normalization of the relative permeability curves of multiple groups of core tests, numerical simulation was performed using the model for a horizontal well and vertical well cluster, and history matching was conducted for the single-well water production and bottomhole pressure of horizontal wells. Because water production was metered only for a few horizontal wells in the Sulige gas field, accurate relative permeability data had to be obtained via numerical simulation of the horizontal wells. In the history matching progress, the relative permeability curve was calibrated and become accurate and suitable for the study area. Subsequently, the curve was applied to a large well cluster model for a gas gathering station, and the gas production and pressure of the gas wells were matched dynamically. In addition, using the total metered water production of the gas gathering station as the constraint and the gas–water two-phase metering test results of a single well, the fitting considered the change in the total water production of the gas gathering station equivalent to the water production of a gas well during production. This water production was used as a data reference for preferential matching. Then, cyclic adjustment was analyzed from three aspects: (1) single-well controlled reserves, namely, the ultimate cumulative gas production obtained through numerical simulation was fit with the dynamic reserves obtained through gas reservoir engineering evaluation; (2) reservoir connectivity, namely, a directional barrier was set up according to the development scale of the pay zones of the gas wells and the distribution of the effective sand bodies in the well cross section with surrounding gas wells to adjust the reservoir connectivity and permeability; and (3) gas well parameters, including the gas well fracture half-length, skin factors, drainage radius, and flow boundary, which were obtained using reservoir engineering methods, such as well testing and production instability analysis. The above three aspects were continuously adjusted within reasonable ranges until both the trend matching and numerical matching delivered good results for the total water production of the gas gathering stations and the single-well gas production and pressure. The errors were controlled at a reasonable level, and the simulation and splitting were ended. The ultimate water production in the full life cycle of the gas wells was obtained (
Figure 4).
3.2.2. Calibration of relative permeability curves
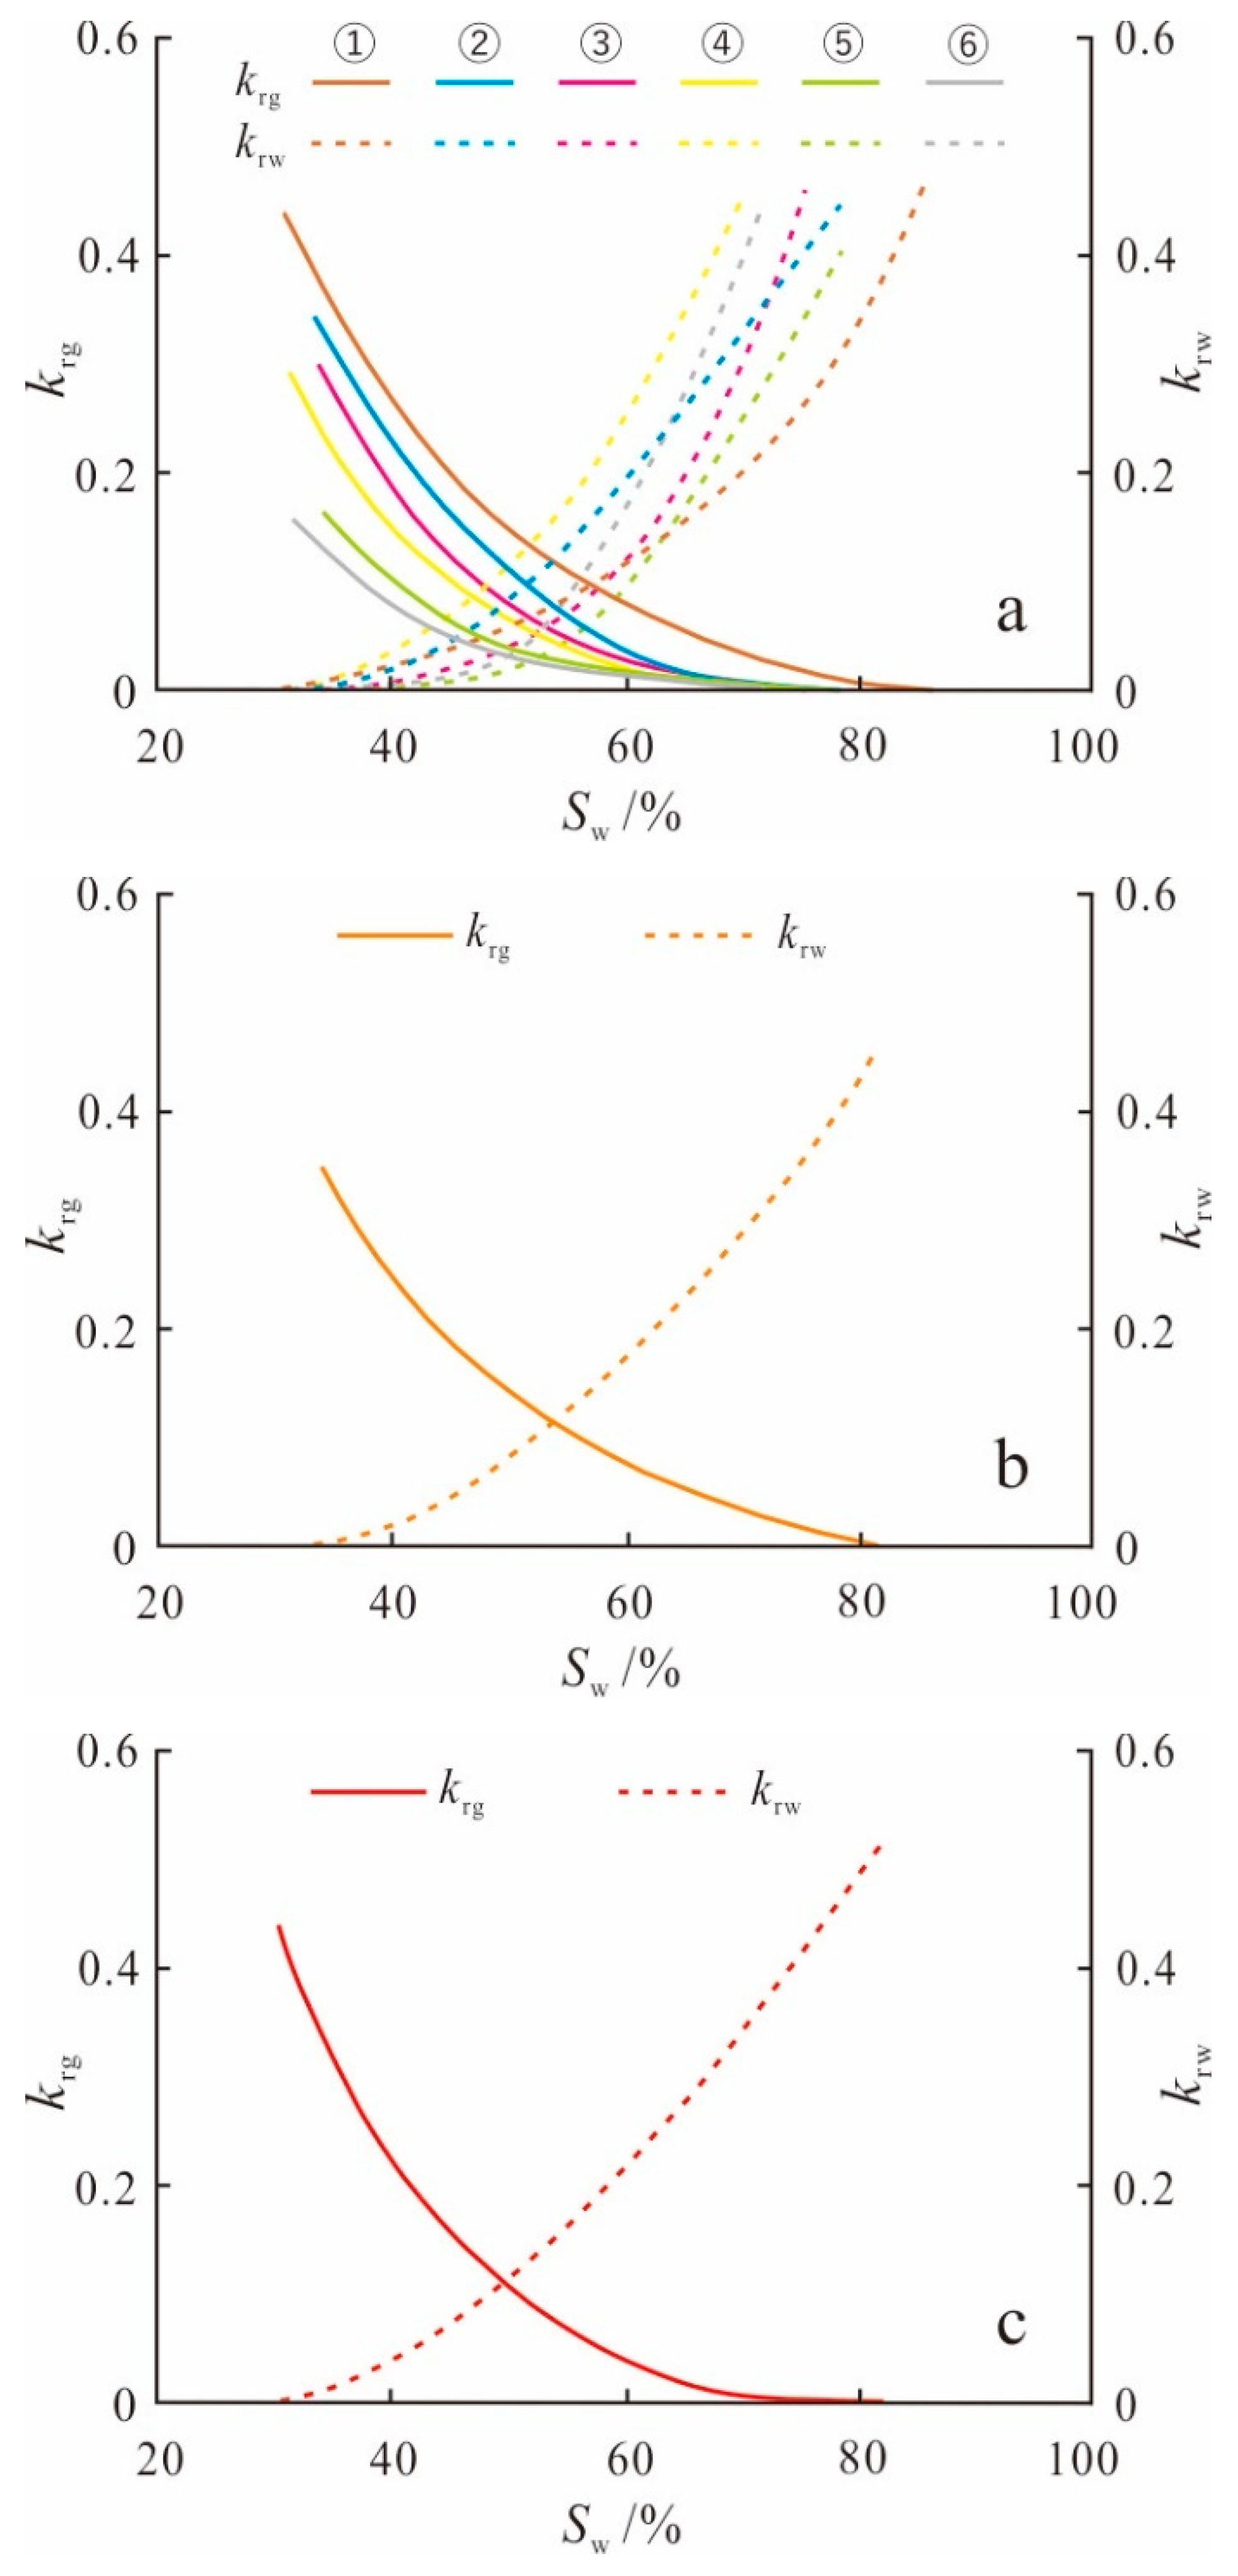
When the relative permeability curves were calibrated, a small mixed well cluster model was established for a small number of horizontal wells with metered single-well water production, as well as neighboring vertical wells, and then, reserve matching and profile verification were performed for the effective sand bodies. In general, a small well cluster model containing only several wells with a high spacing density ensured the relatively-high model accuracy. Then, the water and gas production and pressure of single horizontal wells were matched with historical data through numerical simulation. During the simulation, based on the normalization of the relative permeability curves obtained through laboratory analysis on multiple groups of cores taken from the study area (
Figure 6 and
Figure 7a,b) [
26], the normalization of the relative permeability mainly applied the cubic spline interpolation method. The normalized curve of this method is characterized by a continuous second derivative and a continuous and smooth curve, and it can have a variety of curve shapes. In addition, this method is applicable to homogeneous and heterogeneous reservoirs. Continuous adjustments and corrections are performed in combination with the reservoir property parameters and single-well completion parameters. When the gas production and pressure of the vertical wells and the gas and water production and pressure of the horizontal wells in the well cluster model are matched with historical data, accurate relative permeability curves are obtained for the study area. Six wells (S6-16-1H, S6-16-3, S6-17-2, S6-17-5, S6-18-4, and S6-18-5) were selected from the regional well pattern (with a spacing density of 4 wells per square kilometer) to build a 3-D geological model of the mixed well cluster (
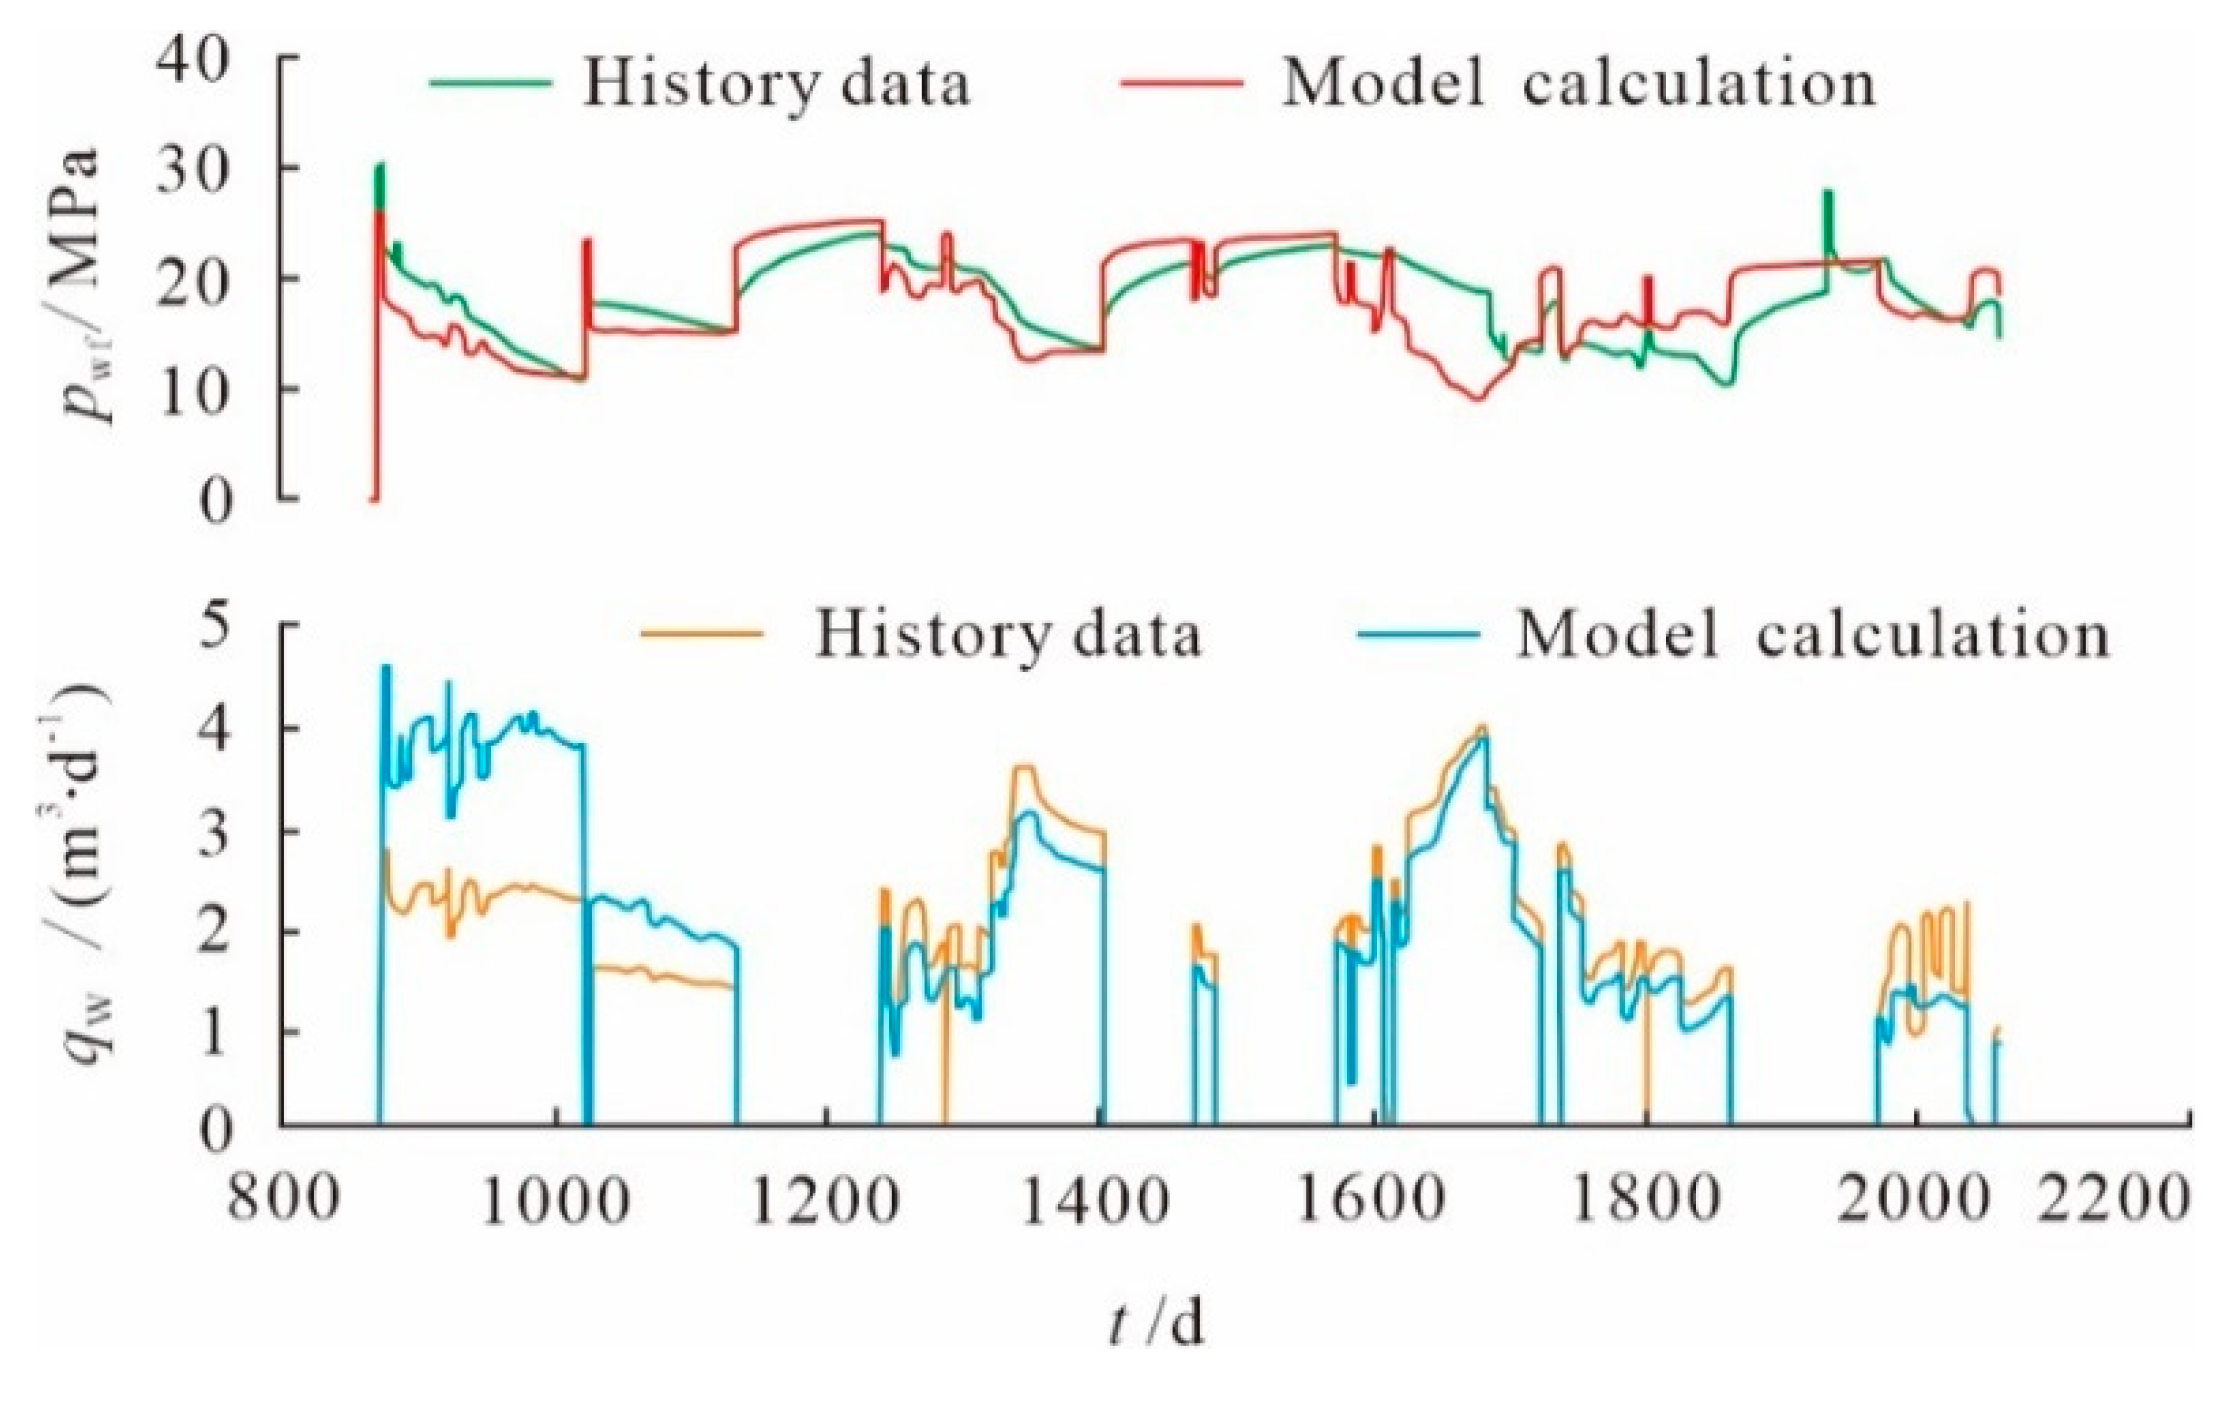
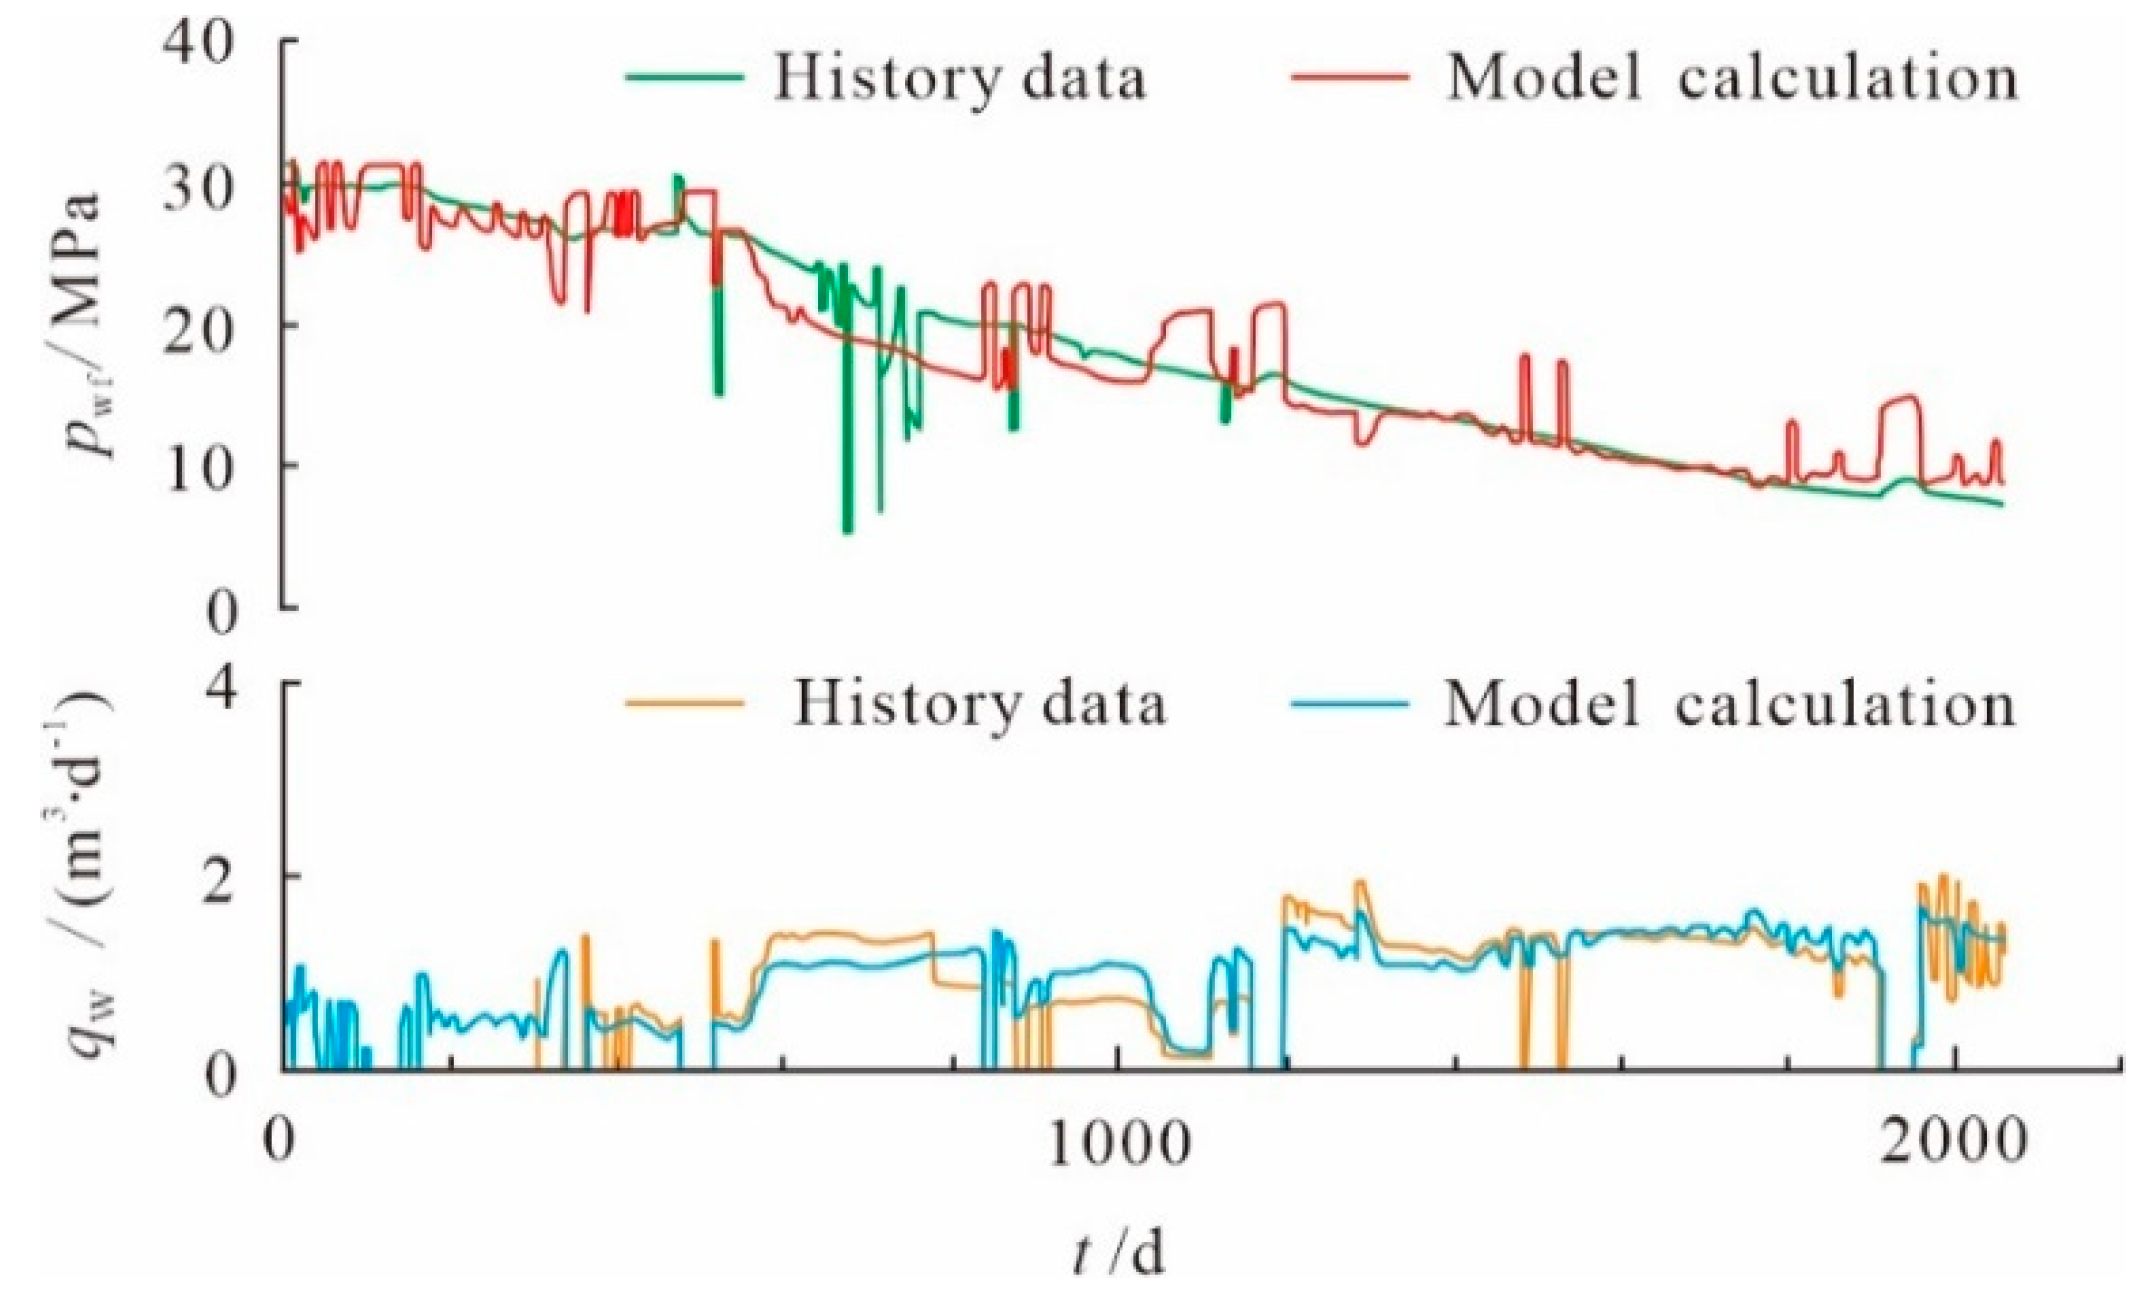
Figure 5), under the joint control of the horizontal well and its neighboring vertical wells. Metered single-well water production data were available for wells S6-16-1H and S6-16-3. Through cyclic adjustment of the relative permeability curve, the reservoir permeability, and other parameters within a reasonable range, historical matching of the gas production, water production, and bottom hole pressure of the gas well was completed (
Figure 8 and
Figure 9) and calibrated relative permeability data were obtained (
Figure 7c).
According to the calibrated relative permeability curves, the areas with a water saturation of 35–80% were the gas–water permeable areas. Generally, the water saturation obtained through the well log interpretation in western Sulige falls within this range and most of the reservoirs are gas–water permeable, which is consistent with the mixed gas–water distribution pattern in the super-thick reservoirs, the production mechanism of the retained water, and the characteristic that water production is a common phenomenon.
3.2.3. Simulation of water production splitting
In the lacustrine basin environment of the Sulige gas field, continental braided fluvial deposits have fast facies variation, poor reservoir stability, and discontinuously lenticular effective sand bodies [
27,
28]. These characteristics lead to some constraints when conventional geological modeling methods are used [
29,
30,
31,
32]. For example, logging and seismic data do not deliver good benefits when used together, and the regular wave impedance inversion accuracy cannot meet the requirements for development; setting the central bar at a fixed proportion in the river channel cannot reflect the complicated facies variations in the deposits; and significant errors exist in the identification and prediction of inter-well effective sand bodies. To address these constraints, in this paper, the methods of phased restriction, staged sedimentary facies control, and stepped modeling are used. Based on probability theory, this method fully imports logs, seismic data, and geological data and introduces multiple restrictions in phases to reduce the multiplicity and uncertainty of the data interpretation step by step. Logs are used to restrict the seismic data for gamma ray (GR) field inversion. In this process, neural network pattern recognition technology has played an important role. Through matching training between the GR curve and seismic interpretation results, a learning sample set is formed, and a series of seismic characteristics similar to the actual logging GR are established. With this as the standard, seismic inversion of the GR field is used under the logging constraints to establish a natural gamma model. Then, the relationship between this model and the sand body probability is regressed to establish a sand body probability, and the multi-point geo-statistical approach is used to establish a lithofacies model. The multi-point geo-statistical approach uses training images instead of a variogram to reveal the spatial structure of the geological variables. In addition, the sequential algorithm is applied under the premise of strictly following the cross-well data. The application of a sequential algorithm can overcome the limitations of the sequential indication simulation and target-based simulation and can achieve better modeling results [
33,
34]. Under the control of this lithofacies model and the braided fluvial system, a depositional microfacies model is established. Finally, an effective sand body model that considers the depositional microfacies, scale of the effective sand bodies, and distribution characteristics of the reservoir parameters is established. The accuracy of models built using this method has been verified from the perspectives of the geological understanding, reservoir parameters, reserve calculations, well pattern sparsing, and a one-time matching rate of as high as 60%, which is around twice those of models constructed using traditional methods [
35]. In this paper, a 3-D geological model was constructed for the S48-5 gas gathering station, which has been operated for over three years in the western Sulige gas field. This 3-D geological model has greatly improved the modeling accuracy and provides a reliable geological basis for water production splitting (
Table 2 and
Table 3;
Figure 10).
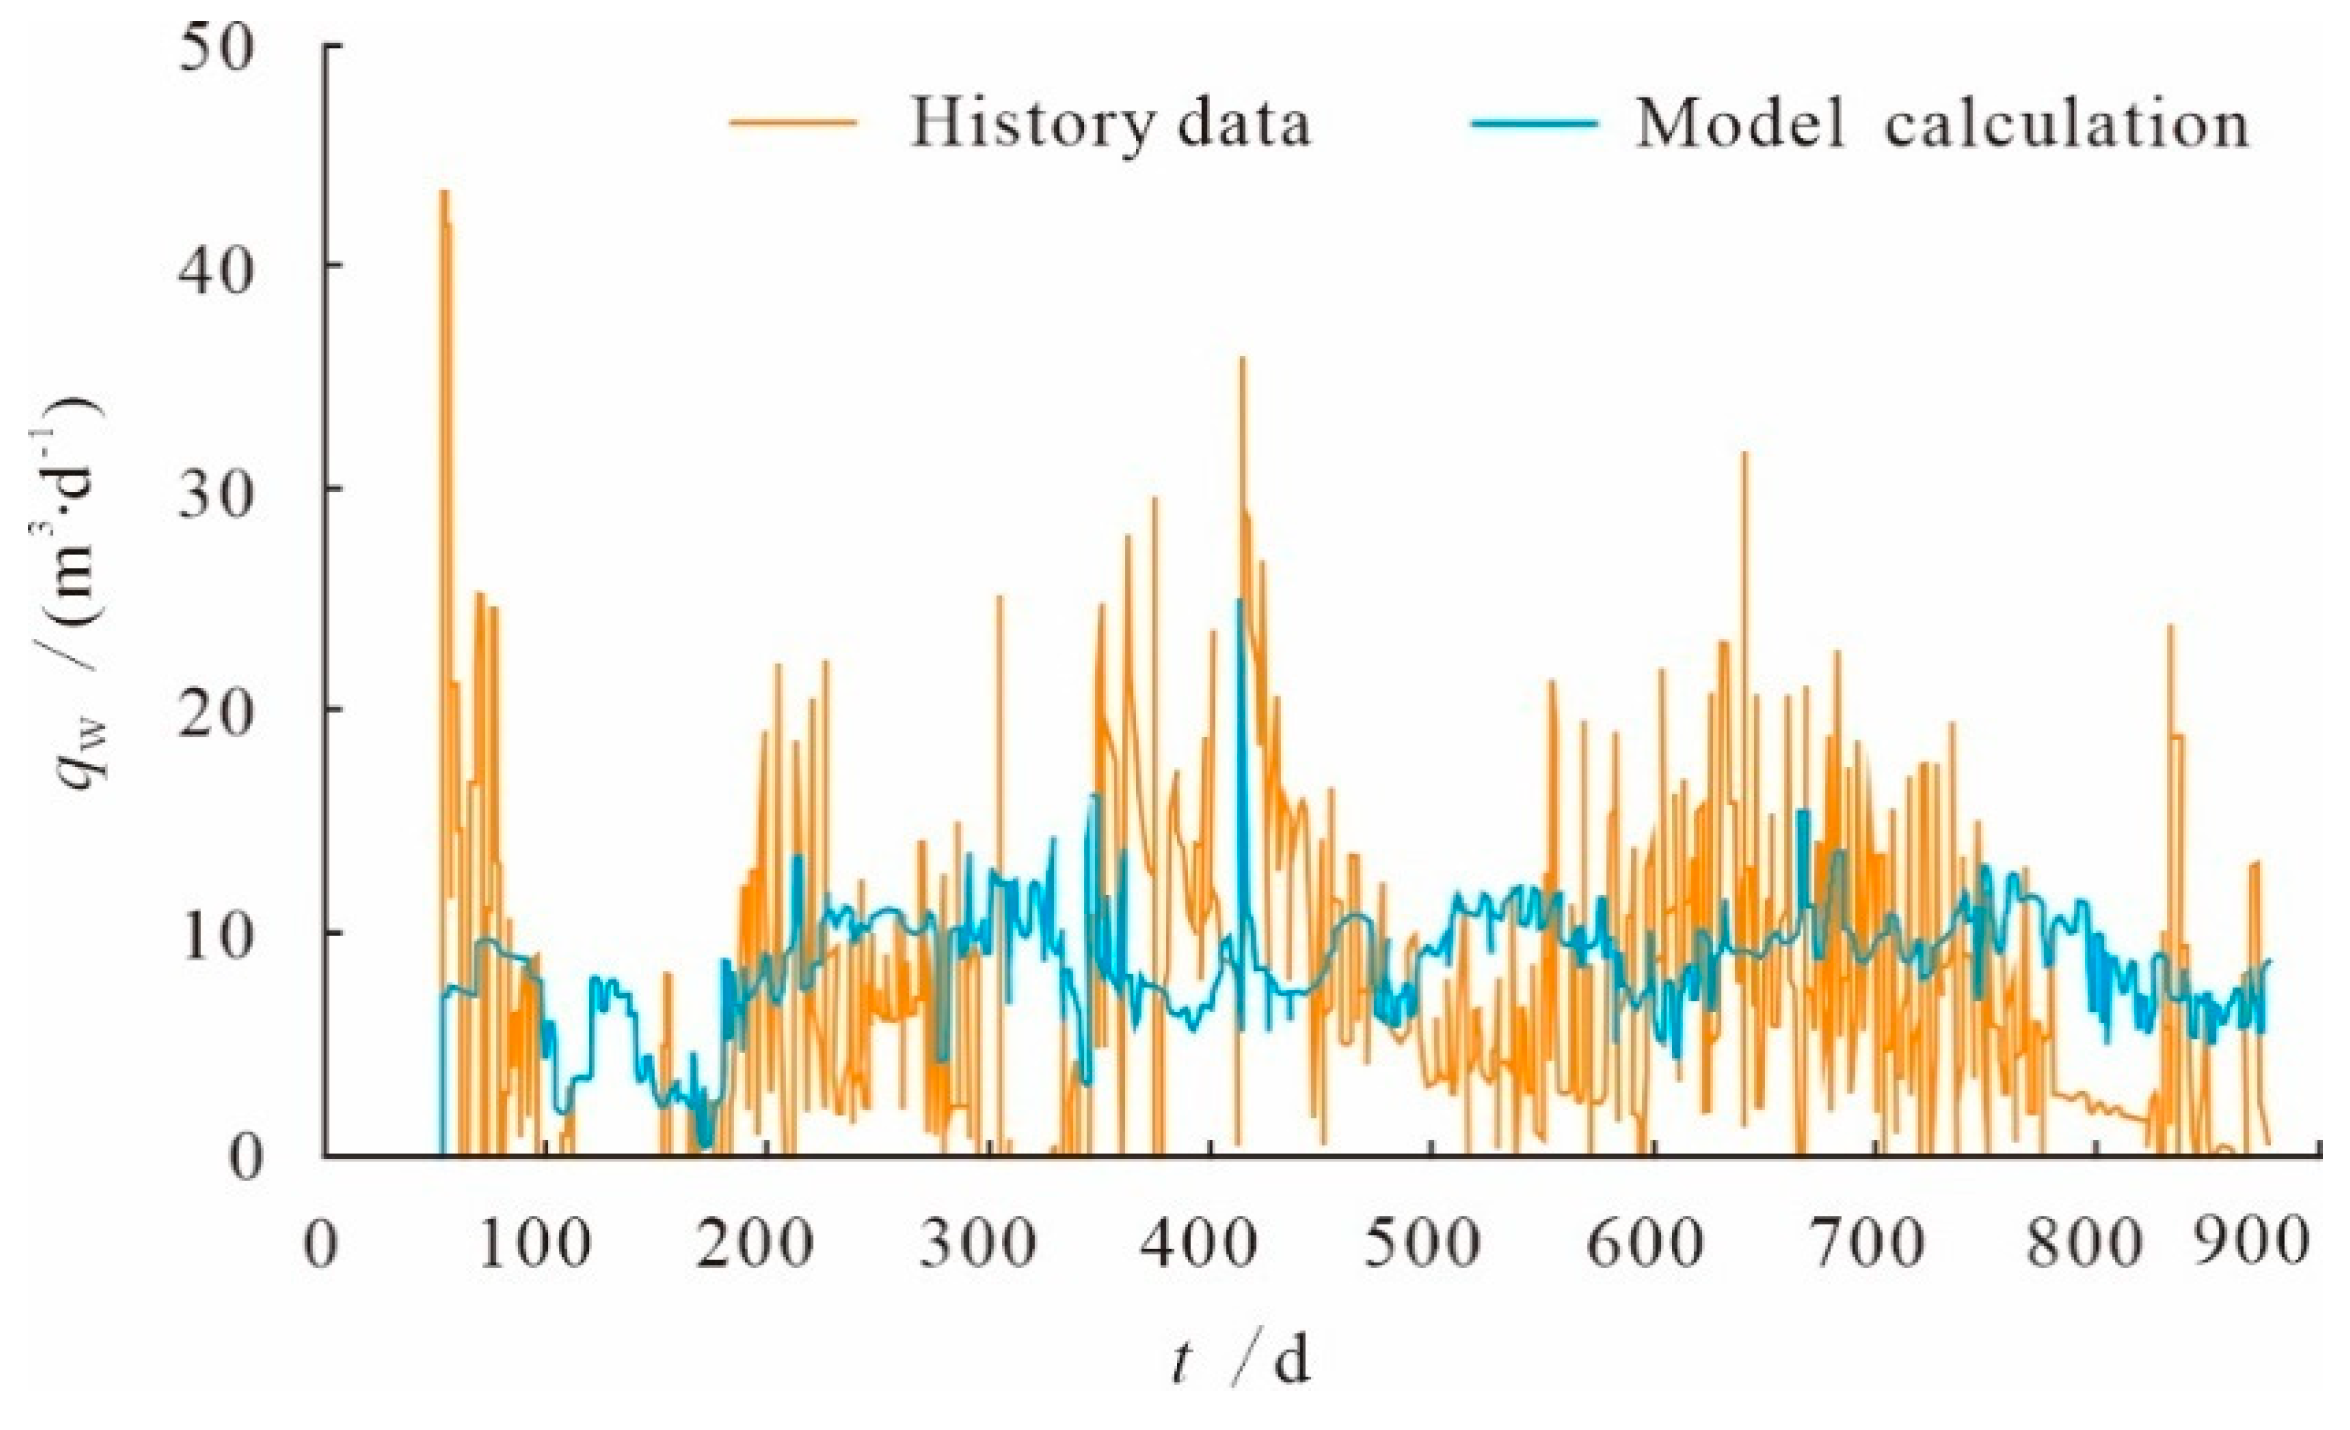
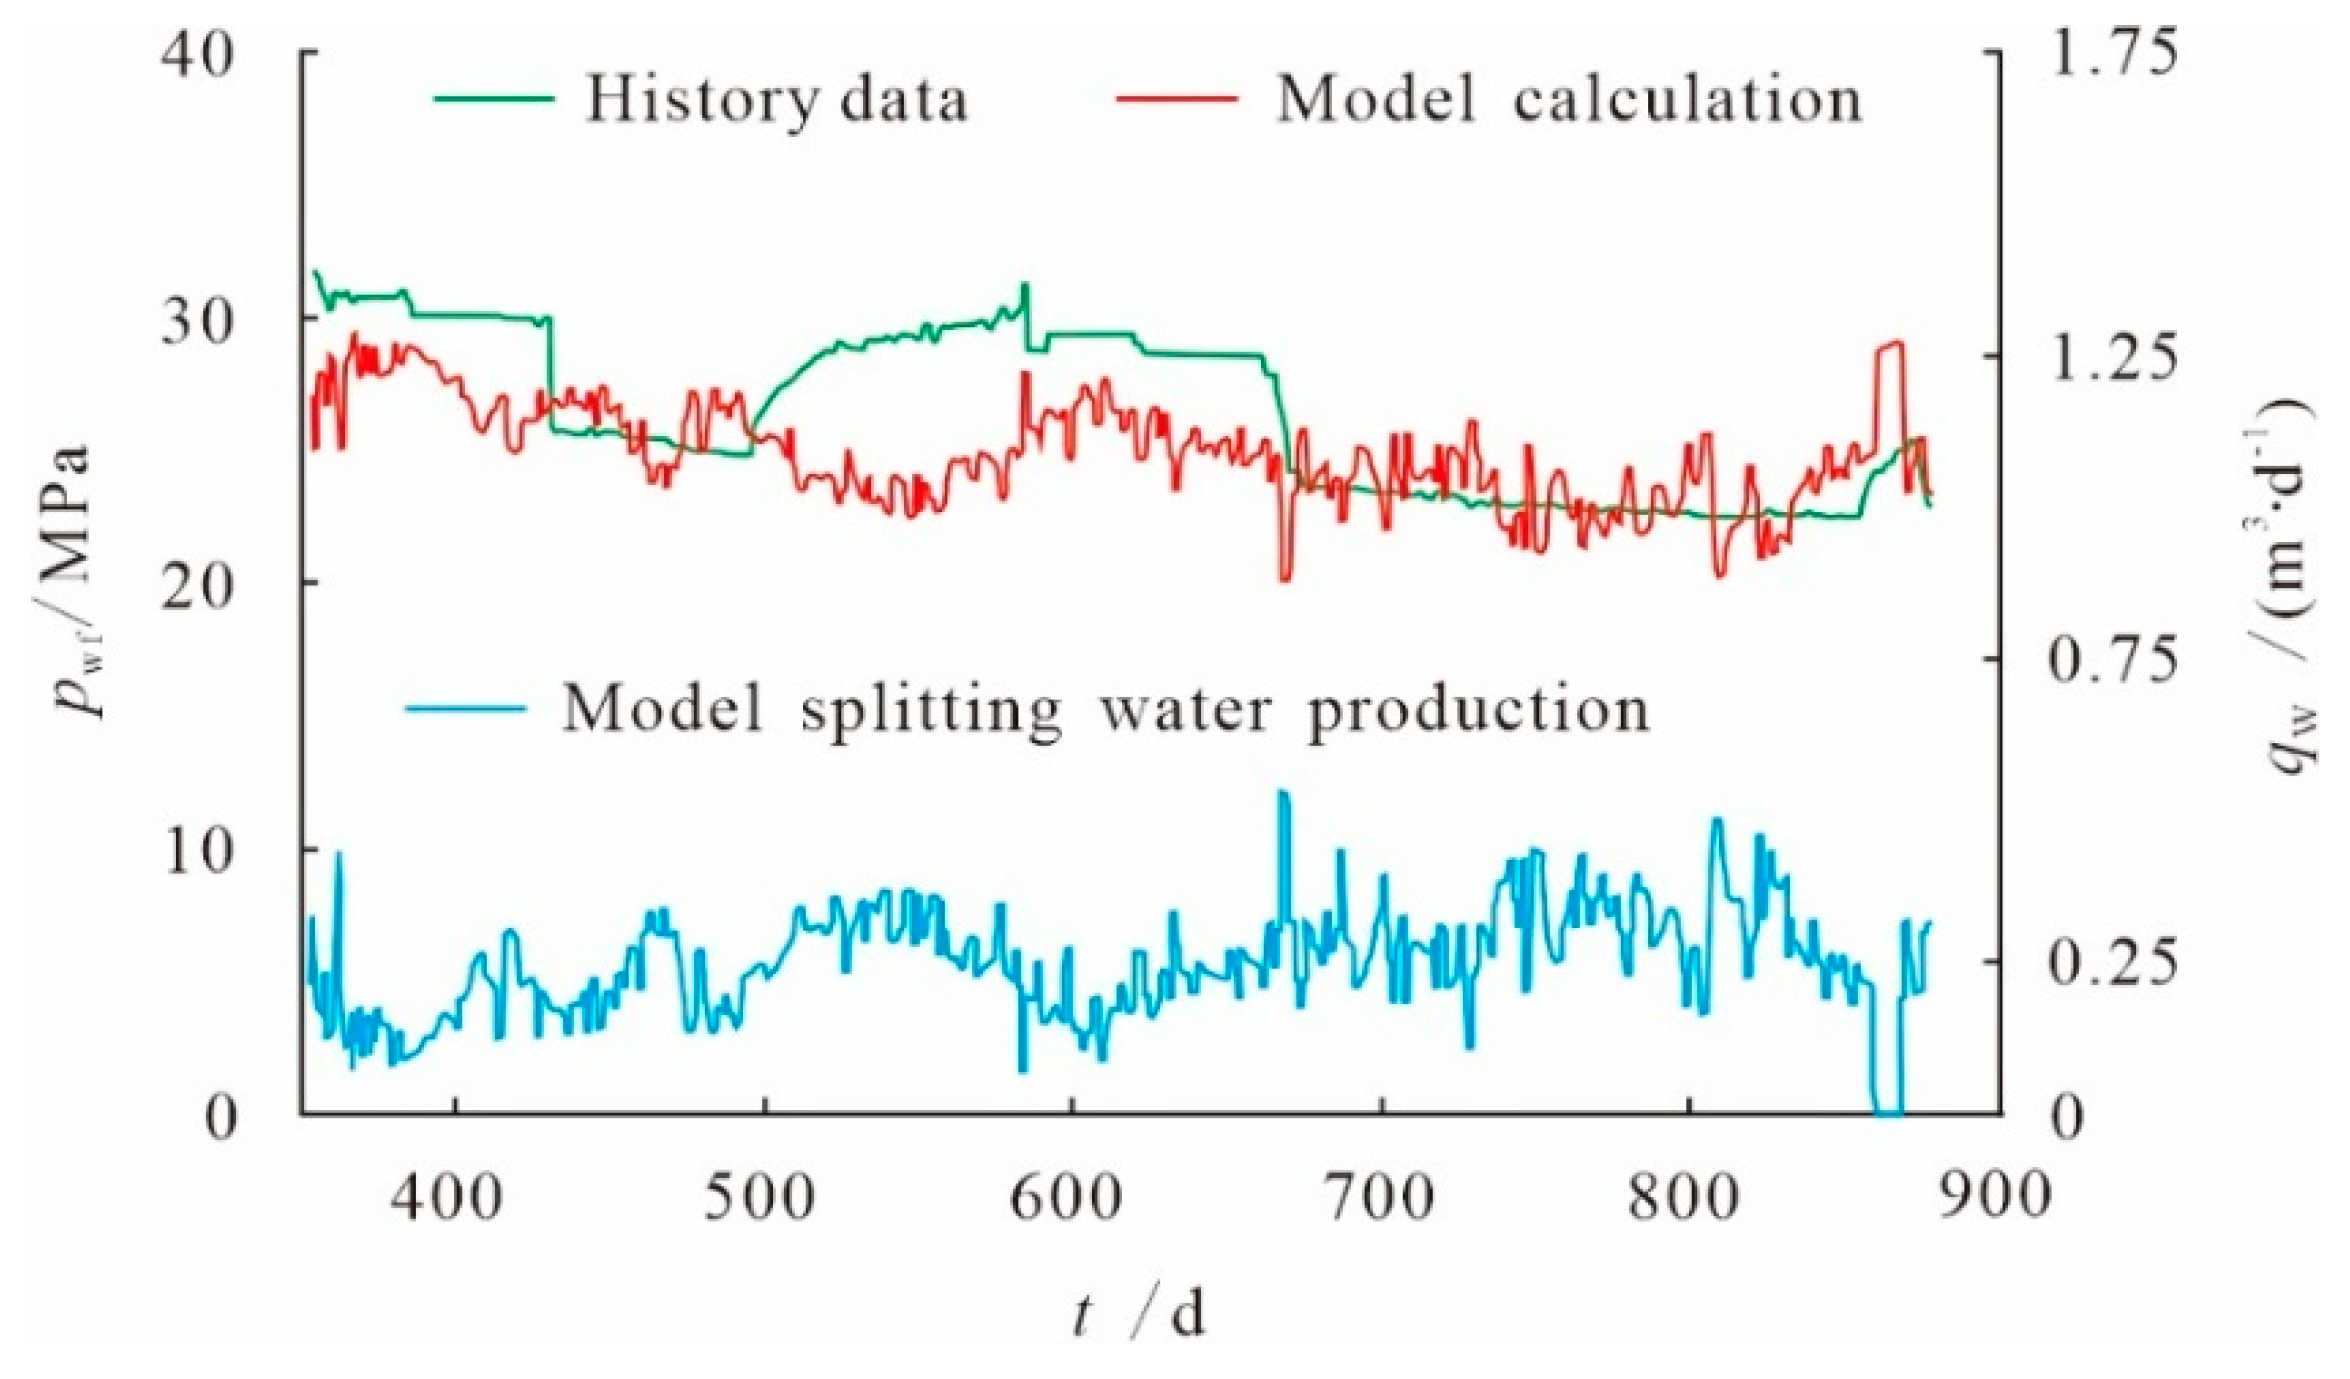
The water production splitting was performed for the S48-5 gas gathering station based on the 3-D geological model of the station and the accurate relative permeability curves obtained through dynamic calibration and numerical simulation of the small mixed well cluster model containing horizontal wells and vertical wells. The gas well dynamic reserves calculated using the production instability method were used as a benchmark for matching the single-well controlled reserves, and then, cyclic adjustments were performed for the reservoir connectivity, permeability, and gas well completion parameters to fit the gas production and bottom-hole pressure with historical data. The matching assumed that the total water production at the gas gathering station was equivalent to the historical water production of a comprehensive gas well. This historical water production was used as a reference for preferential matching. When good matching results and little errors were obtained for the total water production at the gas gathering station, the gas production of the gas wells, and the bottom-hole pressure, the numerical simulation was completed and the water production splitting was performed (
Figure 11 and
Figure 12). The splitting results were found to have a good matching effect. For example, the error of the matching between the overall water production at the gas gathering station and the WGR was only 8.1% and the matching rate of the single-well gas production and pressure was greater than 90%. The WGR obtained through the water production splitting for most gas wells was greater than 1 m
3/10
4 m
3 (
Table 4). These results are consistent with those reported during the production process: a gradual decrease in gas production, an increase in the tubing and casing pressure, and an increase in production through intermittent shut-in for pressure buildup or foam drainage. To verify the reliability of the water production splitting results through numerical simulation (
Table 5), the results of the two-phase gas–water metering test for the only two gas wells in the gas gathering station were compared with the calculation result. The relative water production error of both results was less than 10%, demonstrating that the splitting method is feasible.
4. Results and Application
The 3-D geological model, after being dynamically verified through history matching and water production splitting, can better reflect the real geology, functioning as a forecasting model that forecasts the gas and water productivity and guides the production scheduling of the gas wells. This model provides more accurate and practical results than traditional methods of calculating the open-flow capacity of water-producing gas wells based on the single-phase productivity equation, and it is favorable for allocating scientific and reasonable daily production. This calculation method provides water production data as an important index for evaluating gas wells by category and determining the deliquification period of gas wells. Using the proposed method, deliquification measures can be implemented in a scientific and reasonable manner with a lower operation frequency, higher efficiency, and lower workload and costs, ensuring and guiding stable gas well production.
4.1. Calculation of gas and water productivity
Different from a conventional gas well, a water-producing gas well has gas and water flows that are more complicated than a single-phase gas flow in a formation. The water flow may gradually hinder the gas flow, and the more water is produced, the greater the impact is, resulting in a decline in the gas production capacity of the gas wells. In this case, the single-phase productivity equation based on the pseudo pressure of single-phase gas is still used to evaluate the inflow performance, and to calculate the productivity of gas wells is no longer applicable. Instead, water production from the gas well must be considered. The two-phase gas–water pseudo-pressure function must be used to analyze the inflow performance and to evaluate the productivity of the gas well [
36,
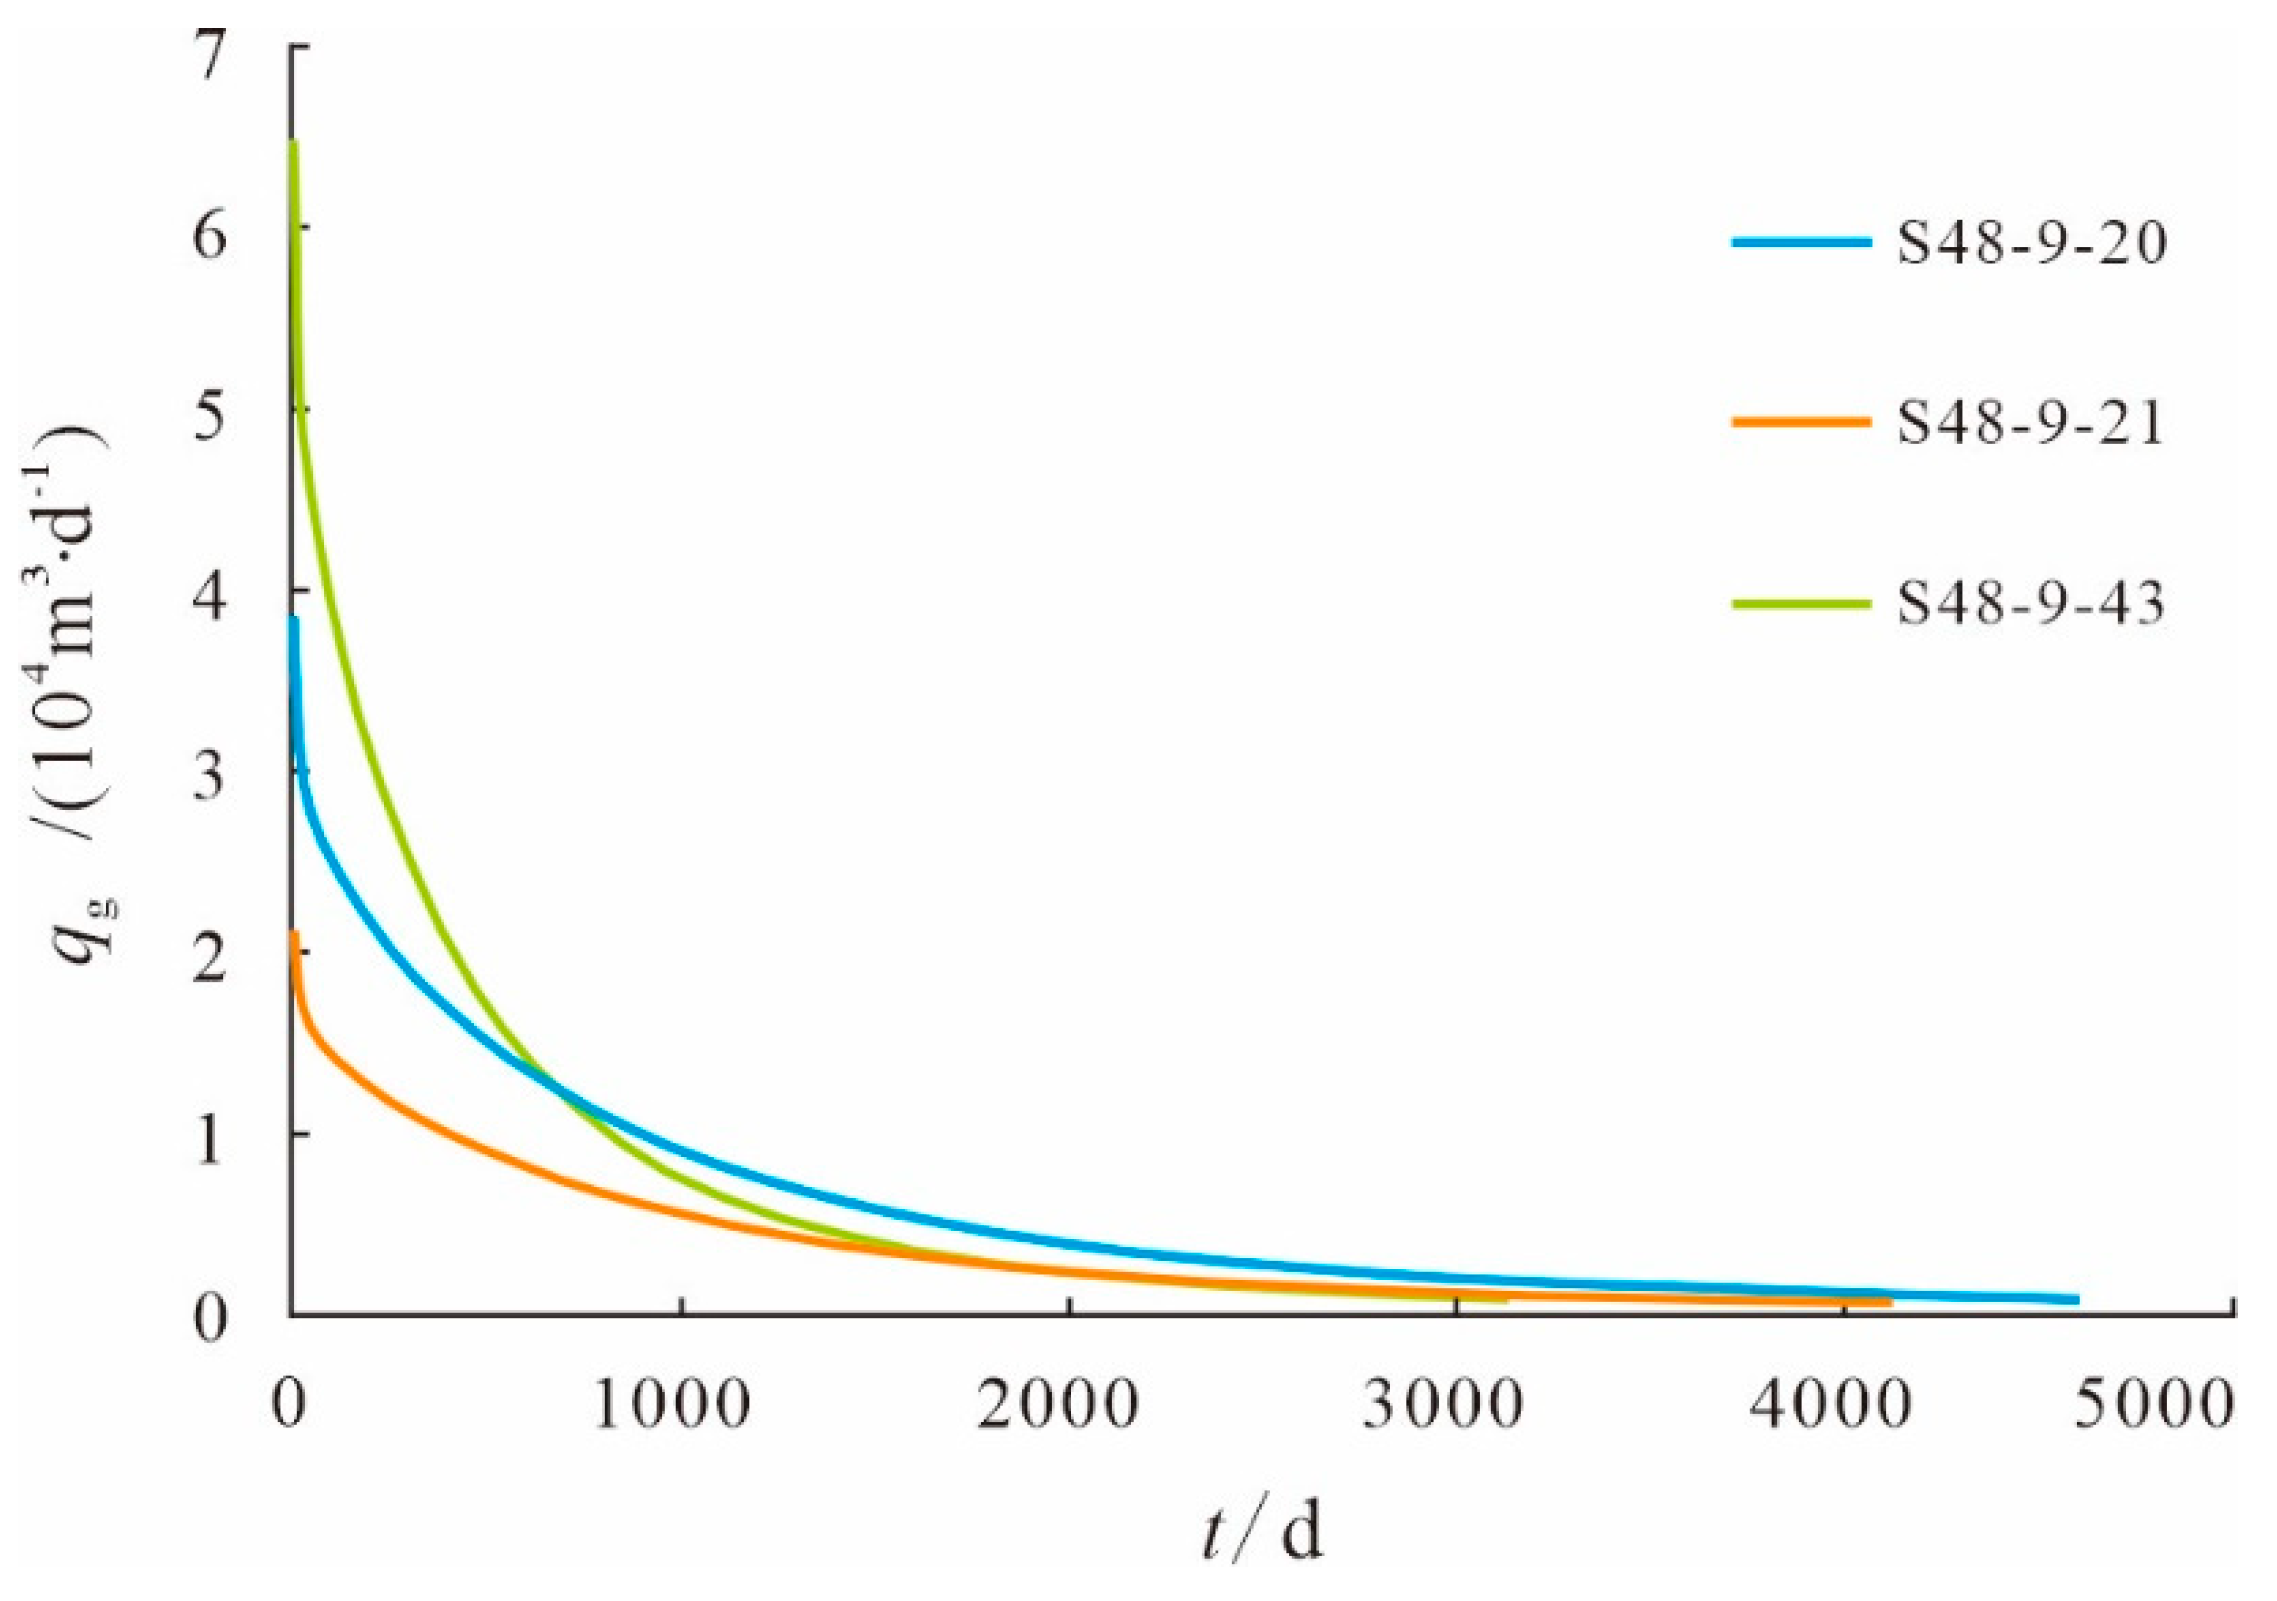
37]. After being dynamically verified through the water production splitting, the geological model can be directly used to forecast the productivity of the gas well. Based on the above discussion, the open-flow capacities of three wells (S48-9-20, S48-9-21, and S48-9-43) were calculated using two methods: open-flow forecasting through numerical calculation (
Figure 13), and the gas–water two-phase productivity equation (Equation (4)) [
38]. The obtained open-flow capacities were compared with the open-flow capacity calculated using the single-phase gas productivity equation from the modified isochronal well test interpretation (Equation (5)) [
39], and then, the difference between the gas well productivities with and without water production considered was analyzed together with the influence. The analysis results show that similar open-flow capacity values were obtained using the two methods, and these results are smaller than the value obtained using the single-phase gas productivity equation without water production considered. The relative error exceeds 10% (
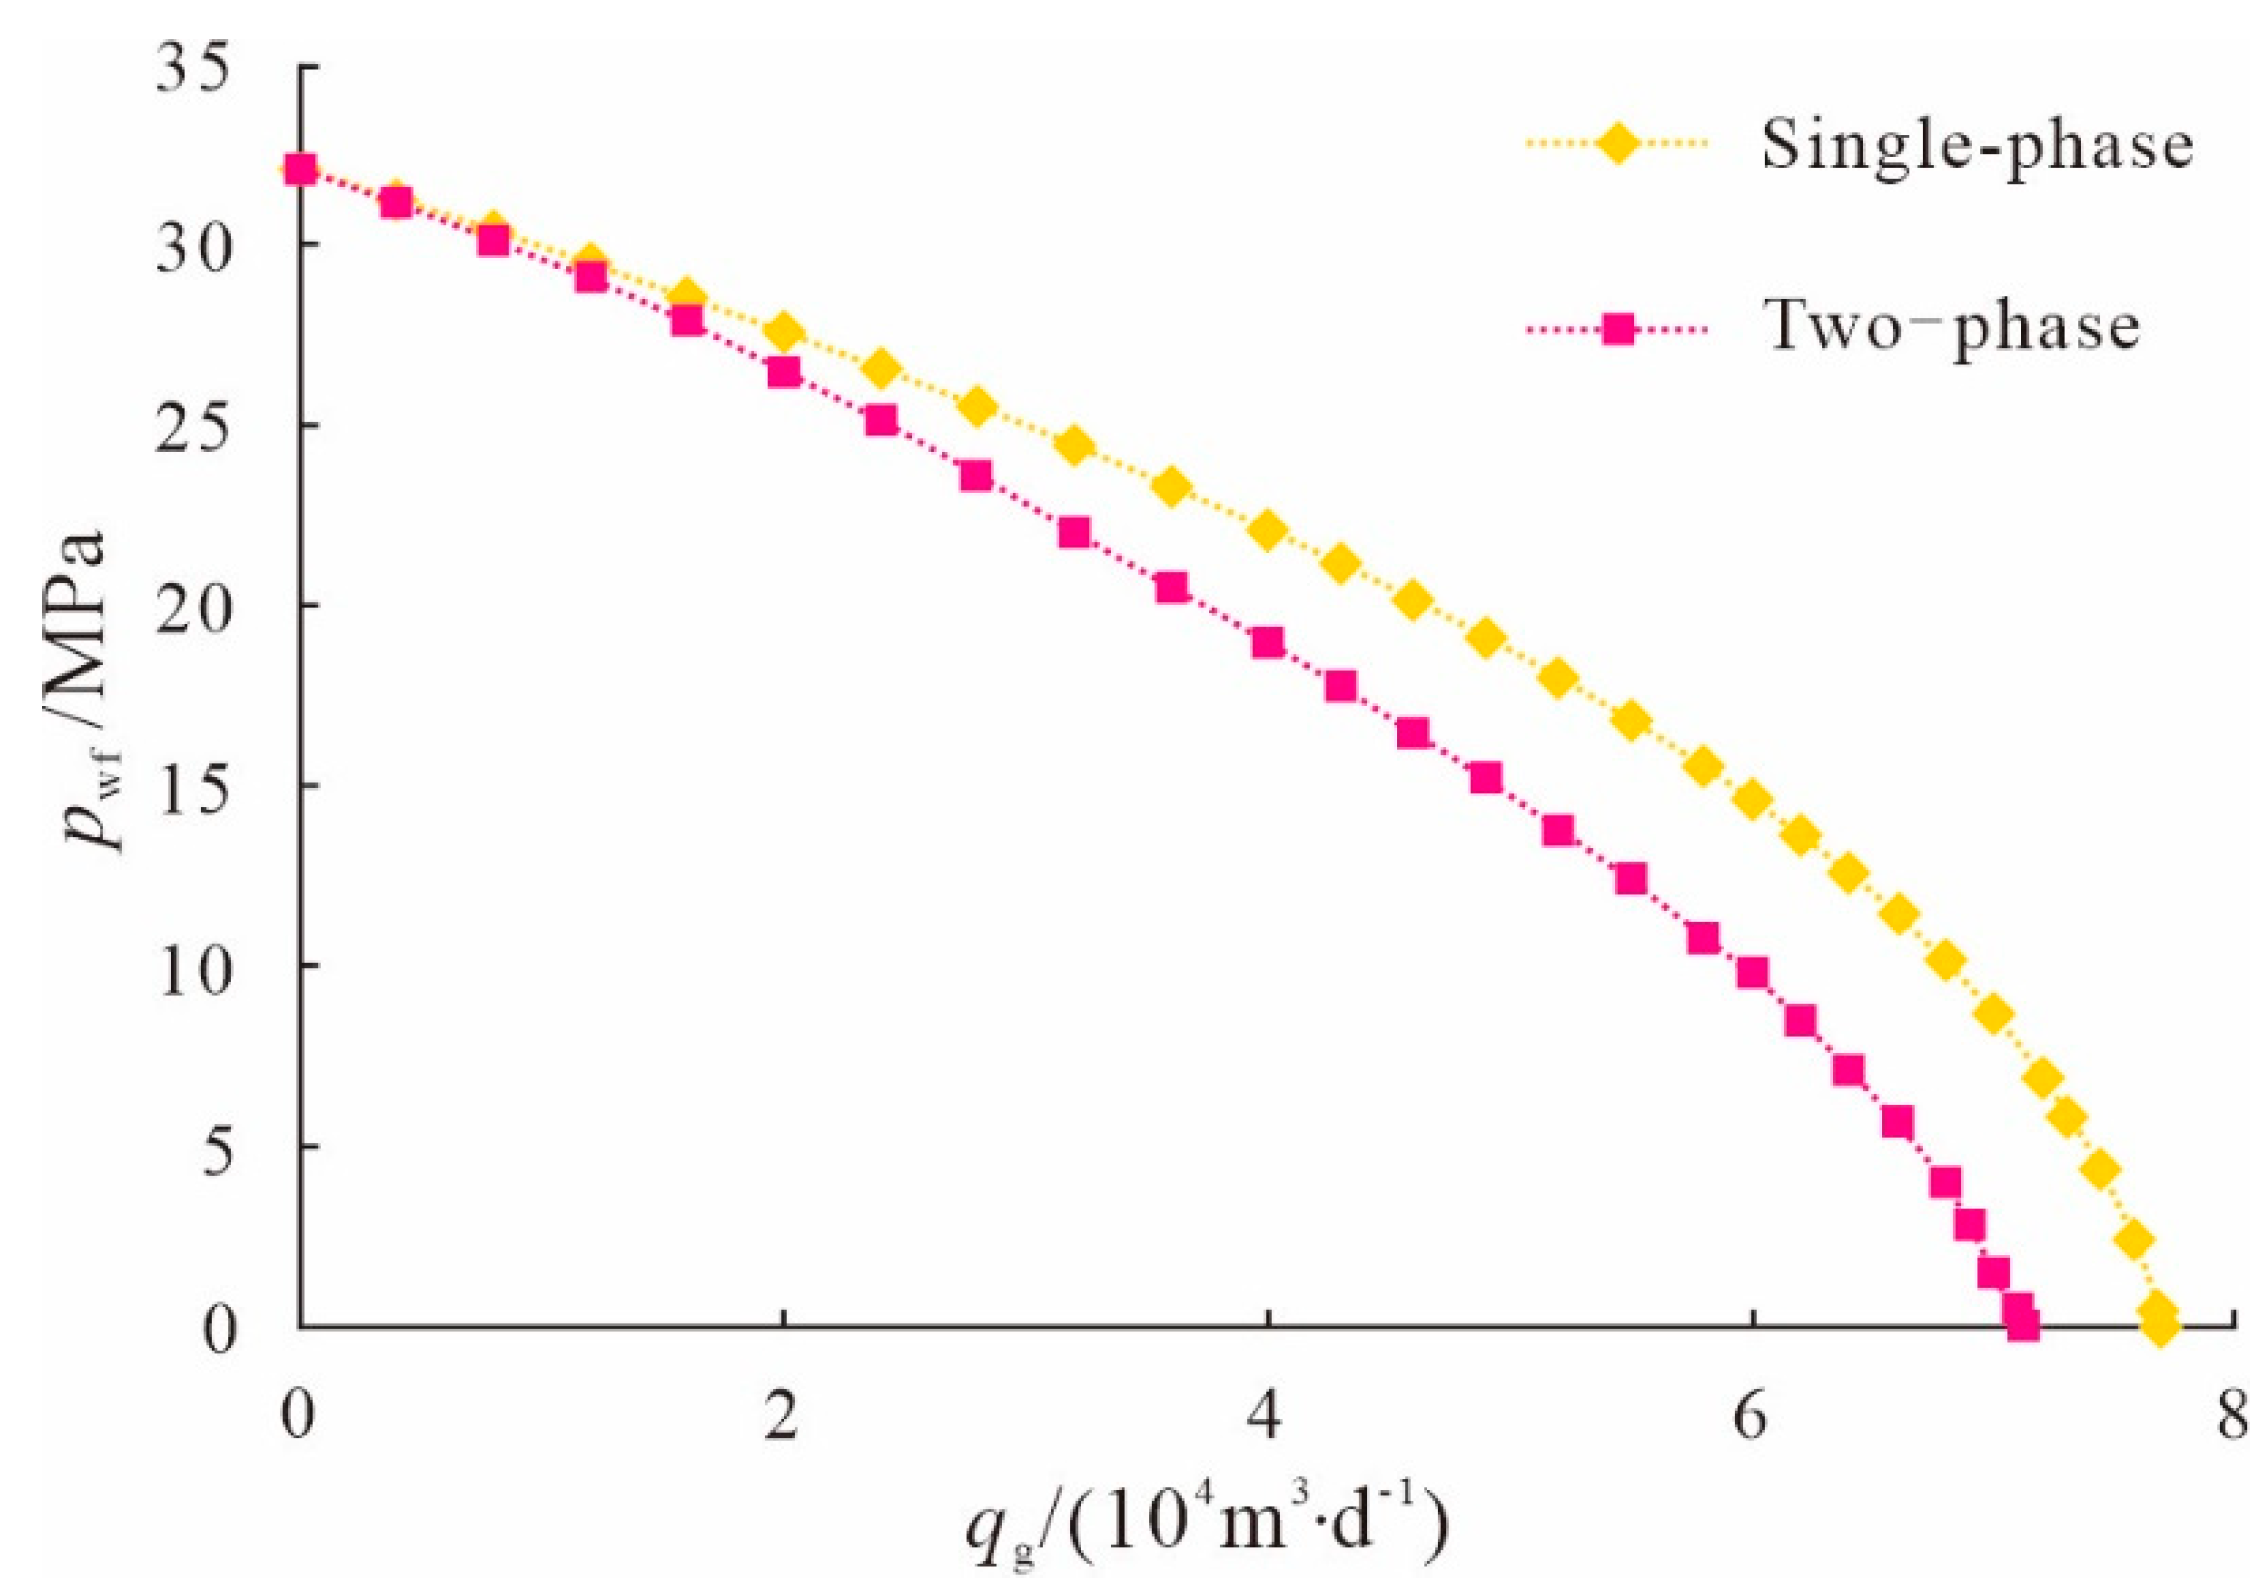
Table 6). In addition, the inflow performance curve obtained using the two-phase productivity equation with water production considered is located closer to the lower left part of the single-phase inflow performance curve, and the obtained open-flow capacity is low (
Figure 14). As the WGR of the gas well increases, the inflow performance curve gradually shifts towards the lower left and the open-flow capacity gradually decreases. Therefore, higher productivity may be estimated if water production is not considered, which would adversely affect the determination of a reasonable daily production for the gas well and may shorten the lifetime of a gas well, especially for tight gas reservoirs.
4.2. Determination of deliquification period
When the gas production of a gas well is lower than the critical liquid-carrying flow rate, the liquid cannot be carried out of the hole during gas production. In this case, more liquid is loaded in the wellbore, causing lower well productivity. According to the standard for determining water production in liquid level detection tests, a liquid level above 2000 m in the tubing would negatively affects the steady production of the gas well. Deliquification measures are required to improve the well productivity. The liquid loading speed varies in water-producing wells to different degrees. Based on the WGRs of hundreds of gas wells in the study area and traced studies of the production dynamics of gas wells, the gas wells were classified into the following three types: wells with small water production, wells with moderate water production, and wells with serious water production. Each of these types has different production characteristics (
Table 7).
To identify whether liquids are loaded in the gas wells and when deliquification is required (when the wellbore liquid level was above 2000 m; Equation (6)), the gas wells for which water production splitting were performed were evaluated by category and the volume of the retained water in the wellbore was calculated based on the percentage of the average daily gas production to the critical liquid-carrying flow rate, as well as the split water production. According to the evaluation results, the best deliquification period was determined to be 125 days for wells with small water production, 20 days for wells with moderate water production, and 3 days for wells with serious water production (
Table 7). Deliquification has been implemented for hundreds of liquid-loaded gas wells in the Sulige gas field and good performance has been obtained, ensuring stable gas well production (
Table 8).
5. Conclusions
Static and dynamic studies on the impact of reservoir physical properties on gas and water production of gas wells in the western Sulige gas field revealed that the physical property parameters are well correlated with the test gas production and are not clearly correlated with the test water production. Therefore, the test gas production of a new well can be predicted based on the static physical property parameters, but the test water production cannot yet be effectively prejudged for gas wells.
According to the gas well evaluation results using the critical liquid-carrying flow rate within the full life cycle of the gas wells calculated using an ellipsoidal droplet model, liquid loading can be classified into three types: continuous liquid carrying, slight liquid loading, and liquid loading. Up to 96% of the wells were loaded with liquids. Based on the production performance of the gas wells in the different production stages, five methods for diagnosing water production were proposed (gas production testing, pilot production, gas-liquid two-phase metering test, liquid level detection, and production performance analysis), and a standard for diagnosing liquid-loaded gas wells was formulated.
A splitting method was established from the perspective of the inverse problem of the water-gas relative permeability. Specifically, the geological model of a horizontal-vertical well cluster was used to calibrate the relative permeability curves, which were then used in the regional geological model of the gas gathering station to match the gas production and pressure history of the gas wells. Finally, the water production of the gas wells were divided with the total water production measured at the gas gathering station as the basic target constraint. These splitting results could be used to evaluate the productivity of the gas wells and to determine the best deliquification period. Since the productivity of the gas wells with water production considered was above 10% lower than that without water production considered, the best deliquification periods were determined to be 125 days for the wells with small water production, 20 days for the wells with moderate water production, and 3 days for the wells with serious water production. The water production splitting method plays an important role in supporting the scientific production of gas wells.
Funding
This research was funded by Science and Technology Major Project of PetroChina, No. 2021DJ1704 & Science and Technology Major Project of PetroChina, No. 2021DJ2104.
Nomenclature
| K |
Permeability, μm2
|
| h |
Reservoir thickness, m |
| Kh |
Formation coefficient, μm2·m |
| φ |
Porosity, % |
|
Sg
|
Gas saturation, % |
|
φSg
|
Storage capacity coefficient, 0.1‰ |
|
Qg
|
Daily gas production during well testing, 104 m3·d−1
|
|
Qw
|
Daily water production during well testing, m3·d−1
|
| vt |
Critical flow rate, m·s−1
|
| ρL |
Liquid density, kg/m3
|
| ρg |
Gas density, kg/m3
|
| σ |
Gas–liquid surface tension, N·m−1
|
| A |
Tubing sectional area, m2
|
| p |
Tubing pressure, MPa |
| T |
Temperature, K |
| z |
Gas compressibility factor, dimensionless |
| γg |
Relative density of natural gas, dimensionless |
| qc |
Critical liquid-carrying flow rate of gas wells, 104 m3·d−1
|
| qw |
Daily water production, m3·d−1
|
| Wp |
Daily water production at gas gathering stations, m3·d−1
|
|
RWGi (i = 1, 2, …n) |
WGR obtained in gas–water two-phase test, m3·(104 m3)−1
|
| GR |
Gamma ray, API |
| t |
Time, day |
| qg |
Daily gas production, 104 m3·d−1
|
| pwf |
Bottom-hole pressure, MPa |
| φ |
Pseudo-pressure, MPa |
| pe |
Formation pressure, MPa |
| r |
Distance from wellbore, m |
| re |
Drainage radius, m |
| rw |
Borehole caliper, m |
| s |
Skin factor, dimensionless |
| α |
Liquid gas quality ratio, dimensionless |
| ρgsc |
Standard gas density, kg/m3
|
| β |
Integral coefficient, dimensionless |
| krg, krw |
Gas and water relative permeability, dimensionless |
| Sw |
Water saturation, % |
| μg |
Gas viscosity, mPa·s |
| λ |
Laminar flow coefficient, MPa2·(104 m3·d−1)−1
|
| ξ |
Turbulence coefficient, MPa2·(104 m3·d−1)−2
|
| TP |
Deliquification time, day |
|
V2000
|
Wellbore liquid volume when loaded liquid level is 2000 m, m3
|
| QPW |
Split water production, m3·d−1
|
References
- Wang, J.P.; Zhang, C.W.; Li, J.Y.; Li, Y.; Li, X.F.; Liu, P.; Lu, J.C. Tight sandstone gas reservoirs in the Sulige Gas Field: Development understandings and stable-production proposals, Ordos Basin. Nature Gas Industry. 2021, 41, 100–110. [Google Scholar] [CrossRef]
- He, D.B.; Ji, G.; Jiang, Q.F.; Cheng, L.H.; Meng, D.W.; Wang, G.T.; Guo, Z.; Cheng, M.H.; Han, J.C. Differential development technological measures for high-water-cut tight sandstone gas reservoirs in western area of Sulige Gas Field. Nature Gas Industry. 2022, 42, 73–82. [Google Scholar] [CrossRef]
- Guang, Y.H.; Zhang, Z.W.; Peng, S.X.; Zheng, L.J. Multidisciplinary integrated gas-water interpretation and evaluation technology for low resistance tight gas reservoirs. Fault-block Oil and Gas Field. 2022, 29, 508–513. [Google Scholar] [CrossRef]
- Wang, R.; Wei, M.J.; Hu, G.X.; Jiang, D.X.; Ju, Y.J.; Zhang, N.S. The distribution law of critical liquid—carrying parameters along the depth of the gas wells with restrictor in Sulige gas field. Special Oil and Gas Reservoirs. 2020, 27, 162–166. [Google Scholar] [CrossRef]
- Li, X.Z.; Lu, D.T.; Luo, R.L.; Sun, Y.P.; Shen, W.J.; Hu, Y.; Liu, X.H.; Qi, Y.D.; Guan, C.X.; Guo, H. Quantitative criteria for identifying main flow channels in complex porous media. Petroleum Exploration and Development. 2019, 46, 998–1005. [Google Scholar] [CrossRef]
- Hu, Y.; Li, X.Z.; Shen, W.J.; Guo, C.M.; Jiao, C.Y.; Xu, X.; Jia, Y.Z. Study on the Water Invasion and Its Effect on the Production from Multilayer Unconsolidated Sandstone Gas Reservoirs. Geofluids 2021. [Google Scholar] [CrossRef]
- Dai, J.Y.; He, S.L. Discovery and significance of faults in the Mid Gas field, Ordos Basin. Petroleum Exploration and Development. 2010, 37, 188–195. [Google Scholar]
- Xu, H.; Zhang, J.F.; Tang, D.Z.; Li, M.; Zhang, W.Z.; Lin, W.J. Controlling factors of underpressure reservoir in the Sulige gas field, Ordos Basin. Petroleum Exploration and Development. 2012, 39, 64–68. [Google Scholar] [CrossRef]
- Dai, J.Y.; Li, J.T.; Wang, B.G.; Pan, R. Distribution regularity and formation mechanism of gas and water in the western area of Sulige gas field, NW China. Petroleum Exploration and Development. 2012, 39, 524–529. [Google Scholar] [CrossRef]
- Yang, R.C.; Dong, L.; Zhang, J.; Wang, Y.; Fan, A.P. Origin, distribution and controlling factors of stratigraphic water in the western Sulige gas field. Acta Sedimentologica Sinica. 2022, 40, 267–280. [Google Scholar] [CrossRef]
- Meng, D.W.; Jia, A.L.; Ji, G.; He, D.B. Water and gas distribution and its controlling factors for large scale tight sand gas fields: A case study of western Sulige gas field, Ordos Basin, NW China. Petroleum Exploration and Development. 2016, 43, 607–614. [Google Scholar] [CrossRef]
- Dou, W.T.; Liu, X.S.; Wang, T. The origin of formation water and the regularity of gas and water distribution for the Sulige gas field, Ordos Basin. Acta Petrolei Sinica. 2010, 31, 767–773. [Google Scholar]
- Fang, J.L.; Meng, D.W.; He, D.B.; Ji, G.; Wei, Y.S. Gas and water formation recognition and water producing well investigation in the western Sulige Gas Field, Ordos Basin. Nature Gas Geoscience. 2015, 26, 2343–2351. [Google Scholar] [CrossRef]
- Fu, J.H.; Dong, G.D.; Zhou, X.P.; Hui, X.; Dan, W.D.; Fan, L.Y.; Wang, Y.G.; Zhang, H.T.; Gu, Y.H.; Zhou, G.X. Research progress of petroleum geology and exploration technology in Ordos Basin. China Petroleum Exploration. 2021, 26, 19–40. [Google Scholar] [CrossRef]
- Wei, Q.S.; Wei, K.Y.; Li, Z.L.; Yang, S.G.; Hao, J.H.; Pang, Q.; Dong, X.X.; Zhu, Y.S. Diagenesis and porosity evolution of tight sandstone gas reservoirs in the western Sulige area, Ordos Basin. Geology and Exploration. 2021, 57, 439–449. [Google Scholar] [CrossRef]
- Turner, R.G.; Hubbard, M.G.; Dukler, A.E. Analysis and Prediction of Mini-mum Flow Rate for the Continuous Removal of Liquids from Gas well. Journal of Petroleum Technology. 1969, 21, 1475–1482. [Google Scholar] [CrossRef]
- Li, M.; Sun, L.; Li, S.L. New view on continuous-removal liquids from gas wells. SPE70016. 2001. [Google Scholar] [CrossRef]
- Bilgesu, H.I.; Ternyik, J. A New Multi-Phase Flow Model for Horizontal, Inclined, and Vertical Pipes. SPE-29166-MS 1994. [Google Scholar] [CrossRef]
- Li, M.; Guo, P.; Zhang, M.L.; Mei, H.Y.; Liu, W.; Li, S.L. Comparative study of two models for continuous removal of liquids from gas wells. Journal of Southwest Petroleum Institute. 2002, 24, 30–32. [Google Scholar]
- Yu, S.M.; Tian, J.F. Research and application of drainage-based gas recovery technology in the Sulige Gas Field, Ordos Basin. Drilling & Production Technology. 2012, 35, 40–43. [Google Scholar] [CrossRef]
- Zhang, M.L.; Fan, Y.H.; He, G.H.; Zhang, Z.L.; Tian, J.F. Latest progress in development technologies for low-permeability gas reservoirs in the Changqing gas zone. Nature Gas Industry. 2013, 33, 1–7. [Google Scholar] [CrossRef]
- Li, S.C.; Lai, F.P.; Zhao, L.B.; Xu, D.D.; Lu, G.T. Experiment on fluid occurrence and gas-water flow in tight gas reservoir. Nature Gas Geoscience. 2021, 32, 1410–1419. [Google Scholar] [CrossRef]
- Ji, W. Gas water relative flow of tight sandstone gas reservoirs and its influencing factors: case study of member 8 of Permian Xiashihezi formation and member 1 of Permian Shanxi formation in Shaan well 234-235 area of Sulige gas field in Ordos basin. Journal of Jilin University (Earth Science Edition). 2019, 49, 1540–1551. [Google Scholar] [CrossRef]
- Zhang, G.D.; Wu, Z.; Li, Y.C.; Chen, Y.J.; Yang, Q.S.; Pan, Y. Testing device and method for unsteady gas—water relative permeability under high temperature and high pressure. Special Oil and Gas Reservoirs. 2021, 28, 78–82. [Google Scholar] [CrossRef]
- Jia, A.L.; Guo, Z.; Guo, J.L.; Yan, H.J. Research achievements on reservoir geological modeling of China in the past three decades. Acta Petrolei Sinica. 2021, 42, 1506–1515. [Google Scholar] [CrossRef]
- Pan, T.T.; Zhang, F.; Xing, K.M.; Wang, Y.Z.; Zhang, M.; Lai, L.B. Evaluation of the relative-permeability-curve normalizing method for the different reservoirs. Petroleum Geology and Oilfield Development in Daqing. 2016, 35, 78–82. [Google Scholar] [CrossRef]
- Ma, X.H.; Jia, A.L.; Tan, J.; He, D.B. Tight sand gas development technologies and practices in China. Petroleum Exploration and Development. 2012, 39, 572–579. [Google Scholar] [CrossRef]
- He, D.B.; Jia, A.L.; Ji, G.; Wei, Y.S.; Tang, H.F. Well type and pattern optimization technology for large scale tight sand gas, Sulige gas field. Petroleum Exploration and Development. 2013, 40, 79–89. [Google Scholar] [CrossRef]
- Wu, S.H.; Li, Y.P. Reservoir modeling: Current situation and development prospect. Marine Origin Petroleum Geology. 2007, 12, 53–60. [Google Scholar]
- Wu, J.; Li, F.H. Prediction of oil-bearing single sand body by 3D geological modeling combined with seismic inversion. Petroleum Exploration and Development. 2009, 36, 623–627. [Google Scholar]
- Jia, A.L.; Cheng, L.H. The technique of digital detailed reservoir characterization. Petroleum Exploration and Development. 2010, 37, 709–715. [Google Scholar] [CrossRef]
- Sun, L.D.; Sa, L.M.; Dong, S.T. New challenges for the future hydrocarbon in China and geophysical technology strategy. Oil Geophysical Prospecting. 2013, 48, 317–324. [Google Scholar] [CrossRef]
- Wang, L.X.; Yin, Y.S.; Feng, W.J.; Duan, T.Z.; Zhao, L.; Zhang, W.B. A training image optimization method in multiple-point geostatistics and its application in geological modeling. Petroleum Exploration and Development. 2019, 46, 703–709. [Google Scholar] [CrossRef]
- Wang, M.C.; Duan, T.Z.; Ji, B.Y. Research progress and application of multipoint statistics geological modeling technology. Petroleum Exploration and Development. 2017, 19, 557–566. [Google Scholar] [CrossRef]
- Guo, Z.; Sun, L.D.; Jia, A.L.; Lu, T. 3D geological modeling for tight sand gas reservoir of braided river facies. Petroleum Exploration and Development. 2015, 42, 76–83. [Google Scholar] [CrossRef]
- Sun, E.H.; Li, X.P.; Wang, W.D. Production analysis method and gas two-phase flow well in low permeability gas reservoirs. Lithologic Reservoirs. 2012, 24, 121–124. [Google Scholar]
- Wang, F.P.; Huang, Q.H. A single point deliverability forecasting formula for water-producing gas well. Xinjiang Petroleum Geology. 2009, 30, 85–86. [Google Scholar]
- Huang, Q.H.; Wang, F.P.; Chen, Y. Productivity evaluation of water-producing gas wells in low-permeability gas reservoirs. Petroleum geology and oilfield development in Daqing. 2010, 29, 73–76. [Google Scholar] [CrossRef]
- Wang, B.; Yang, H.Y.; Wang, H.; Zhong, X.Y. A new method for analyzing modified isochronal test data in tight gas wells. Journal of Yangtze university (Natural science edition). 2016, 13, 54–59. [Google Scholar] [CrossRef]
Figure 1.
Tectonic deposits and location of the western Sulige gas field, Ordos Basin.
Figure 1.
Tectonic deposits and location of the western Sulige gas field, Ordos Basin.
Figure 2.
Intersection analysis of the physical property parameters and test results for the western Sulige gas field.
Figure 2.
Intersection analysis of the physical property parameters and test results for the western Sulige gas field.
Figure 3.
Analysis of liquid loading types of gas wells.
Figure 3.
Analysis of liquid loading types of gas wells.
Figure 4.
Water production splitting procedure and refined 3-D geological modeling procedure.
Figure 4.
Water production splitting procedure and refined 3-D geological modeling procedure.
Figure 5.
Cross-section of the mixed well pattern model across S6-16-1H, S6-18-4, S6-17-2, and S6-16-3.
Figure 5.
Cross-section of the mixed well pattern model across S6-16-1H, S6-18-4, S6-17-2, and S6-16-3.
Figure 6.
Six core samples from wells in the study area.
Figure 6.
Six core samples from wells in the study area.
Figure 7.
Relative permeability curves: a.) Relative permeability obtained through laboratory analysis on core samples; b.) Relative permeability obtained through normalization; and c.) Relative permeability obtained through model calibration.
Figure 7.
Relative permeability curves: a.) Relative permeability obtained through laboratory analysis on core samples; b.) Relative permeability obtained through normalization; and c.) Relative permeability obtained through model calibration.
Figure 8.
History matching of water production and pressure for well S6-16-1H.
Figure 8.
History matching of water production and pressure for well S6-16-1H.
Figure 9.
History matching of water production and pressure for well S6-16-3.
Figure 9.
History matching of water production and pressure for well S6-16-3.
Figure 10.
3-D geological model of the S48-5 gas gathering station.
Figure 10.
3-D geological model of the S48-5 gas gathering station.
Figure 11.
History matching of total water production at the S48-5 gas gathering station.
Figure 11.
History matching of total water production at the S48-5 gas gathering station.
Figure 12.
Water production splitting results for well S48-3-24.
Figure 12.
Water production splitting results for well S48-3-24.
Figure 13.
Gas well productivity curve based on open-flow forecasting through numerical simulation.
Figure 13.
Gas well productivity curve based on open-flow forecasting through numerical simulation.
Figure 14.
Inflow performance curves for well S48-9-43obtained using single-phase and two-phase productivity equations.
Figure 14.
Inflow performance curves for well S48-9-43obtained using single-phase and two-phase productivity equations.
Table 1.
Methods, standards, and proposed treatments for diagnosing water-producing gas wells in the western Sulige gas field.
Table 1.
Methods, standards, and proposed treatments for diagnosing water-producing gas wells in the western Sulige gas field.
| Method |
Applicable gas well |
Diagnosis standard |
Proposed treatments |
| Gas production testing |
Gas production testing well |
WGR > 1×m3·(104 m3)-1
|
1. Short-term shut-in for pressure buildup and foam drainage;
2. Pressure buildup in tubing and foam drainage |
| Pilot production |
Pilot production well |
| Two-phase gas-liquid metering test |
Production well |
| Liquid level detection |
Production well |
Tubing liquid level < 2000 m |
1. Repeated foam drainage;
2. Foam drainage after retrieving the flow regulator |
| Production performance analysis |
Production well |
Casing pressure drop rate > 0.02 MPa per day and gas production per unit of casing pressure drop < 30×104 m3·MPa-1
|
1. Periodic running of compressor and foam drainage;
2. Continuous tubing and foam drainage |
Table 2.
Reservoir parameters of the numerical simulation.
Table 2.
Reservoir parameters of the numerical simulation.
| Modeling area |
area (km2) |
Average porosity (%) |
Average Permeability (10-3 μm2) |
Average Water saturation (%) |
Reserves (108 m3) |
| S48-5 |
283.3 |
10.6 |
0.065 |
58 |
294.6 |
Table 3.
Information about the model grid.
Table 3.
Information about the model grid.
| Modeling area |
meshing method |
Planar mesh step (m) |
Vertical mesh step (m) |
Total cells |
| S48-5 |
Corner-point grid |
50×50 |
0.5 |
37,155,840 |
Table 4.
Water production splitting results for the S48-5 gas gathering station.
Table 4.
Water production splitting results for the S48-5 gas gathering station.
| Well |
Water production (m3·d-1) |
WGR (m3·10-4 m-3) |
Well |
Water production (m3·d-1) |
WGR (m3·10-4 m-3) |
| S48-9-20 |
0.62 |
1.50 |
S48-7-29 |
0.40 |
1.04 |
| S48-9-21 |
1.54 |
4.54 |
S48-9-36 |
0.18 |
3.60 |
| S48-9-22 |
1.22 |
4.06 |
S48-9-39 |
0.19 |
0.35 |
| S48-5-26 |
0.11 |
0.35 |
S48-9-43 |
1.38 |
2.82 |
| S48-7-21 |
1.19 |
2.63 |
S48-7-46 |
0.17 |
0.53 |
| S120-43-96 |
3.24 |
23.13 |
S48-7-39 |
0.16 |
0.60 |
| S120-43-98 |
0.21 |
1.31 |
S48-6-33 |
0.24 |
1.58 |
| S48-3-24 |
0.25 |
1.05 |
S48-8-41 |
0.20 |
0.85 |
| S48-5-25 |
0.24 |
1.06 |
S48-9-40 |
0.26 |
1.06 |
| S48-9-27 |
0.14 |
0.72 |
S48-9-48 |
0.44 |
1.53 |
Table 5.
Comparison of the water production splitting results and the two-phase gas–water metering test results.
Table 5.
Comparison of the water production splitting results and the two-phase gas–water metering test results.
| Well |
Water production (m3·d-1) |
Relative error (%) |
| Two-phase gas–water metering test |
calculation |
| S48-7-21 |
1.15 |
1.19 |
3.5 |
| S48-9-48 |
0.48 |
0.44 |
8.3 |
Table 6.
Comparison of the open-flow capacities obtained using the single-phase gas productivity equation, two-phase productivity equation, and numerical simulation.
Table 6.
Comparison of the open-flow capacities obtained using the single-phase gas productivity equation, two-phase productivity equation, and numerical simulation.
| Well |
Open-flow capacity (104 m3·d-1) |
| Single-phase equation (without water production) |
Two-phase equation |
Numerical simulation |
Average of two-phase equation and numerical simulation (with water production) |
Error (%) |
| S48-9-20 |
4.22 |
3.83 |
3.82 |
3.83 |
9.2 |
| S48-9-43 |
7.73 |
6.97 |
6.45 |
6.71 |
13.2 |
| S48-9-21 |
2.45 |
2.14 |
2.08 |
2.11 |
13.9 |
Table 7.
Determination of deliquification periods of different types of water-producing wells.
Table 7.
Determination of deliquification periods of different types of water-producing wells.
| Type of water-producing well |
WGR (m3·10-4m-3) |
Characteristics |
Retained water in wellbore (m3·d-1) |
Deliquification period (d) |
| Small water production |
< 1 |
Production is basically steady and continuous. |
0.162 |
125 |
| Medium loaded well |
1–3 |
Production is continuous within a period of time, but liquids are loaded in the bottom hole. |
0.999 |
20 |
| Severely loaded well |
> 3 |
Production is impossible. Liquids are loaded in the bottom hole for a short period of time and production is suspended. |
7.725 |
3 |
Table 8.
Deliquification effect for water-producing gas wells.
Table 8.
Deliquification effect for water-producing gas wells.
| Well |
Daily gas production before deliquification (104 m3·d-1) |
Daily gas production after deliquification (104 m3·d-1) |
Increase in production (%) |
| S48-13-45 |
0.23 |
0.35 |
52.2 |
| S48-20-72 |
0.22 |
0.84 |
281.8 |
| S48-15-63 |
0.28 |
0.74 |
164.3 |
| S48-5-71 |
0.5 |
1.01 |
102 |
| S20-16-16 |
0.39 |
1.25 |
220.5 |
| S20-12-12 |
0.6 |
1.4 |
133.3 |
| S20-13-6 |
0.87 |
2.14 |
146 |
| S20-11-11 |
0.4 |
1.1 |
175 |
| S6-21-12 |
0.63 |
0.65 |
3.2 |
| S14-8-41 |
0.21 |
0.51 |
142.8 |
|
Disclaimer/Publisher’s Note: The statements, opinions and data contained in all publications are solely those of the individual author(s) and contributor(s) and not of MDPI and/or the editor(s). MDPI and/or the editor(s) disclaim responsibility for any injury to people or property resulting from any ideas, methods, instructions or products referred to in the content. |
© 2023 by the authors. Licensee MDPI, Basel, Switzerland. This article is an open access article distributed under the terms and conditions of the Creative Commons Attribution (CC BY) license (http://creativecommons.org/licenses/by/4.0/).
