Introduction
Blood flow within the capillary vessels is essential for the ambient delivery of oxygen and nutrient supply to terminal organs. However, emboli from various sources can stop the normal flowing blood when it encounters narrowing in blood vessel. This will prevent blood flow to downstream tissues and causes ischemia. Interruption of blood vessels causes a variety of diseases depending on the location of the blockade, such diseases include stroke [
1], coronary artery disease [
2],
pulmonary embolism[
3]
, etc.. These diseases collectively result in the highest mortality in humans compared to other diseases [
2]
posing an urgent threat to human beings. A common cause of these diseases is the restriction of blood flow to the major arteries in these organs, either by rupture of atherosclerosis plaques, or by capture of emboli from different sources. Such blockade immediately shuts off local blood supply and leads to rapid immune responses or organ disorders.
In vivo models mimicking the blockade of major blood vessels have been used for many decades. Conventionally, these models often require the physical restriction of blood flow of major blood vessels, such as the MCAO (Middle Cerebral Artery Occlusion) model[
4] and ligation induced myocardial infarction mode[
5]. These models usually cause large areas of tissue ischemia which were associated with significant morbidities on animals. The application of these models has revealed many key responses and mechanisms of cerebral stroke[
6,
7,
8,
9] and myocardial infarction[
10,
11,
12,
13,
14].
In contrast to major artery blockade, microembolism was more recently proposed. Microembolism is caused by particles with much smaller size (normally <500 um) which are captured in smaller blood vessels[
15]. Naturally occurring microemboli can originate from of different sources including platelet fibrin clots, cholesterol[
16] or cancerous cells[
17] etc.. Although microemboli can arrive in any parts of the body, study of the brain is of most interest. It is known that a large number of microemboli can lead to “warning stroke”, which is sometimes referred to as a microstroke or transient ischemic attack (TIA). Its occurrence is regarded as of high risk for future large blockade. Microemboli are more commonly found in patients with cardiovascular diseases, especially arterial atherosclerosis and atrial fibrillation patients. Although microemboli are often found to be asymptotic, it is believed that these patients have a higher risk for silent strokes and cognitive damage[
18]. Transcranial Doppler Ultrasound (TCD) has been used to diagnose microemboli in the brain, especially on patients with increased risk for stroke or during cardiovascular interventions[
18].
Other than naturally occurring microemboli, new medication strategies exploiting drug-eluting microsphere is under rapid development in recent decades[
19,
20]. Microsphere based drugs were already successfully approved to the market[
20]. Comparing to the well-studied immune responses caused by major artery blockade, the physiological and immune responses caused by microemboli is less well characterized. In this study, we used fluorescently labeled polystyrene microspheres as the model to mimic microemboli, and sought to address the responses and sequelae of microvascular obstruction. By the use of intravital microscopy, we found interesting monocyte recruitment phenomenon which happens only to the brain but minimally to other organs. Centered on this discovery, this study sought to addressed what monocytes were recruited, and what are the mechanisms behind.
Materials and Methods
Animals
C57BL/6 wild type mice were purchased from Charles Rivers. Transgenic mice CX3CR1gfp/gfp (Cat# 005582) and C3-/- mice (Cat# 003641) were purchased from Jackson lab and breed in SPF level animal facility with controlled temperature (22-24oC), humidity (30-60%) and 12h light/12h dark cycle. For all experiments, we used mice aged 6-12 wk old. Both male and female mice were used. The animal study protocol was approved by the Animal Ethics Committee of Sun Yat-Sen University under protocol number [2018]08–81. Guidelines for the Ethical Review of Laboratory Animal Welfare (GB/ T35892-2018) and institutional ethical guidelines for animal experiments were established by the Fifth Affiliated Hospital of Sun Yat-sen University.
Mouse behavior scoring
Various scoring systems has been developed for evaluating the severity of neurological disorders in rodents. We chose the Bederson scoring to use in this study. The Bederson score grades rodents on a scale of 0-5 from Grade 0 (no defects) to Grade 5 (most severe). Specifically, animals with longitudinal spinning after stroke were scored Grade 4, while those with no movement were scored Grade 5.
Microsphere and treatment
Polystyrene microspheres of 6 µm and 10.00 µm were purchased from Polysciences under trademark Fluoresbrite (6 µm, Cat# 18141; 10.00 µm, Cat# 18142). In this study, we predominantly used intravenously injected polystyrene microspheres as the model to address the host responses. Microspheres were diluted in sterile PBS and injected 5x10⁶ in 200 μl PBS to each mouse. For some experiments, intracarotid injection was performed. Briefly, after anesthesia, the left common carotid artery (CCA) was exposed through a ventral midline incision in the neck. The CCA was then bluntly dissected from surrounding connective tissue. The microspheres were transferred to the cerebral circulation via the left internal carotid artery by temporary ligating the left external carotid with sutures. A small incision was made in the CCA with fine microsurgical scissors, and a special catheter was connected to a Hamilton syringe and 200 μl of total volume was given at the desired dosage. The catheter was withdrawn and the incision was resealed with cyanoacrylate glue. The surgical wound was sutured, and the mice were closely monitored until recovery after operation.
Fungal strains
In some experiments, Saccharomyces cerevisiae was injected instead of microspheres. S. cerevisiae S288c were allowed to grow to log phase in yeast growth medium at 30oC with shaking at 200 rpm and harvested by centrifugation at 500 g for 5 min and twice wash with sterile PBS. 5x10⁶ fungal cells in 200 μl PBS was injected to each mouse.
Intravital microscopy
To visualize cell movements in the brain, mice were anesthetized with avertin 300 μl per mice. the transcranial window of around 6 mm was created to allow visualization of the blood vessels on the cortex. The mice were placed on a heating pad to maintain body temperature. The head of the mice was immobilized on a customized imaging stage and placed on the imaging system built upon Nikon Ni microscope equipped with Lumencor SpectraX for fluorescence illumination and PCO EDGE 4.2 camera for detection. Alexa Fluor 647 anti-mouse CD45 antibody (Biolegend Cat#160304) was used to label circulating immune cells. Video tracks were recorded at 1 frame per second. Acquired images were processed with ImageJ software to study the behavior of
Cytokine measurement.
To measure cytokines, the kits were purchased from R&D systems (TNF-α) and eBioscience (IL-1β) following manufactures instructions.
Splenectomy
The splenectomy was performed following established protocol[
21]. Briefly, the left side of the abdomen was shaved and disinfected, a 5 mm incision was made to open skin and abdominal cavity. The spleen was carefully exposed and the afferent and efferent vessels were ligated using 4/0 suture before spleen was removed. Abdomen and skin were then surgically closed. Mice were used for experiment two weeks after the surgery.
QPCR
For detection of changes in mRNA transcription, 50 mg tissue were collected for RNA extraction by Trizol (Invitrogen) method. First strand cDNA was synthesized by first strand cDNA synthesis kit (Invitrogen, Catg# 18080051). The primers for qPCR was as below TNF-F: CATCTTCTCAAAATTCGAGTGACAA, TNF-R: TGGGAGTAGACAAGGTACAACCC, and GAPDH-F: CATCACTGCCACCCAGAAGACTG: GAPDH-R: ATGCCAGTGAGCTTCCCGTTCAG.
Immunofluorescence staining
The tissues were removed and frozen in OCT compound (Sakura). Frozen tissue blocks were cut on a cryostat microtome with a thickness set to 7 μm/section; and sections were placed on coated glass slides. Tissue sections were fixed in ice cold acetone for 10 min. After fixation, the samples were blocked by incubation with 5% goat serum for 30 min, followed by incubation with the primary antibody at 4 °C overnight. After three washes with PBS containing 0.05% Tween 20, sections were incubated for 30 min with the fluorescence conjugated second antibodies. After washing, the tissues were stained with DAPI to stain the nuclei and persevered in anti-fade buffer (Invitrogen). The tissue slides were examined under the Zeiss LSM 800 system.
Immune cell isolation and flowcytometry
Mice were euthanized by CO2, the organs were harvested and placed on ice. After collection of all groups, the organs were minced into small pieces <1 mm3 using fine surgical scissors and digestive with Collagenase IV and DNase I at 37oC for 40 min. The digest was forced through 70 um cell strainer with the help from a 5 ml syringe plunger. The filtrates were centrifuged at 400 g for 5min to remove cell debris. After removal of the supernatant, the cells pellets were resuspended in 2 ml 30% and carefully layered onto 80% Percoll (GE, USA) in 15 ml tube without perturbing the interface, and centrifuged at 1000g for 15 min at room temperature. The cells at the interface between 30% and 80% were collected and washed with flow staining buffer (1% BSA with 0.05% sodium azide). Isolated immune cells enumerated by a hemocytometer and 106 cells collected for following steps. Before staining, cells were blocked with Fc receptor blocking antibody at RT for 30 min, and strained with antibodies. All antibodies were purchased from Biolegend. Cells were analyzed by a FACS Aria III machine. 100000 events were recorded and the resulting fcs file was analyzed by Flowjo V10 software.
TNF-α treatment
To study the behavior of monocytes, we isolated spleen monocytes using magnetic isolation kit from Miltenyi (Cat# 130-100-629). Monocytes were treated with or without 10 ng/ml at 37oC for 4 hours and 2x10⁶ cells were infused into mice to evaluate monocyte recruitment.
Antibody treatment
For neutralizing TNF-α in vivo, mice were i.p. injected with 200 μg anti TNF-α antibody (Bioxcell, Cat#: BE0058) 10 min before treatment with microspheres.
Statistics
All data were expressed as mean ± SEM. Statistical significance was performed using Graph-Pad Prism 5 software. For statistics, unpaired two-sided Student’s t-test was performed for simple comparison; for comparisons of more than two groups, one-way analysis of variance (ANOVA) was performed followed by Bonferroni’s post hoc test to determine significance among groups. In both cases, p <0.05 was considered significant.
Discussion
Blood vessels can be clogged by thrombus or embolus in the lumen. Blockade or restriction of normal blood circulation is the culprit of fatal diseases like coronary artery[
23] diseases, stroke[
1,
9], etc.. These diseases often arise from the result of sudden blockade of major blood vessels. Blockade of major vessels leads to immediate shortage of local blood supply, and often triggers acute consequences including cell death[
24,
25], inflammatory cell recruitment[
10,
26] which have received extensive study in the past decades. However, the results from blockade of microcirculation are less well characterized. Here we found that microspheres of 6 um injected directly into the circulation can block microcirculation in capillary vessels. This model is in sharp contrast to previous models mimicking the occurrence of major blood vessel blockade by surgical methods[
4,
5,
27]. Although microspheres have been used to cause microembolic infarction in animal models, previous studies usually used big-sized microspheres (> 50
μm) which blocks bigger vessels.[
28].
In vivo, microemboli predominantly consisted of platelet aggregates, fibrin, cholesterol crystals, tumor cells [
15,
29]. Microemboli can happen in the brain which results in disrupt the blood-brain barrier and impairs cognition [
15,
18,
30], and also in the heart[
29], the lung[
31] etc. Mechanical stress from hemodynamic perturbations or interventional manipulation of epicardial coronary atherosclerotic plaques with inflammatory destabilization can release particulate debris and other thrombotic materials into circulation[
29]. A pathological study of COVID-19 patients revealed that microthrombi as a major cause of cardiac injury [
31]. Blocking microcirculation using our experimental dosage did not induce apparent morbidity in mice, however, it has to be admitted that we did not perform in depth and long-term study on neurological damage. Blocking microcirculation may still have profound neurological disorders in the long run. Previously, it was found that short of blood supply can lead to rapid loss of spine and dendrite structure which can be reversible[
32]. In fact, the occlusion of microvessels is able to cause sufficient hypoxia which results in transient focal dendritic spine loss[
16]. Thus, focal change in neuron is also likely to happen in our model.
Previously, Carson et al. reported an interesting and important phenomenon which showed microemboli trapped in the microvessels can be expelled out of the vessel into brain perivascular parenchyma resulting in recanalization of the circulation after 48 hours[
16]. They further showed the extravasation is dependent on metalloprotease activities[
16]. Treatment with MMP-2/9 inhibitor SB-3CT suppressed extravasation of the microemboli. The study used microemboli with different compositions including fibrin, cholesterol and microsphere and found the expel of microemboli happens regardless of the microemboli composition. The authors infer that pericyte may be involved in providing the force of extravasation[
16,
33]. It should be noted that the size they used is slightly bigger than those used in our study (10-15 μm, comparing to 6 μm). This size difference can make a big difference in following responses, because microspheres of 6 μm can allow blockade of the smallest level of capillary vessels while microspheres bigger than 10 μm may not reach that level. Our data showed that small microspheres are not expelled as efficiently as those reported. Whether different levels of capillary have different expel efficiency need further study.
The study of microsphere triggered response has further meaning. Nowadays more and more microsphere bases drugs are being developed. Among all the approaches microspheres are more convenient as the drug is slowly released from the polymeric matrix and the polymers used are mostly biodegradable and possess no side effects. Therefore, microspheres can be used in various medicinal departments such as oncology, gynecology, radiology, pulmonary, cardiology, diabetes, and vaccine therapy. Drug-eluting embolic (DEE) microspheres, or drug-eluting microspheres (DEB) which were delivered by transarterial chemoembolization (TACE) are used as a drug delivery vehicle to stop blood flow to tumors [
20]. Microspheres to enhance drug delivery to the liver dates back several decades[
34]. As carriers of drug, the distribution of microspheres significantly affects the location of the drug. The sizes of microsphere have a huge effect on the distribution of microspheres. Transcatheter arterial chemoembolization (TACE) is a minimally invasive procedure performed in interventional radiology to restrict a tumor ‘s blood supply. Small embolic particles coated with chemotherapeutic drugs are injected selectively through a catheter into an artery directly supplying the tumor. Artificial drug-eluting embolic microspheres has been utilized as therapeutic strategies to stop blood flow to tumors via transarterial chemoembolization[
20]. TACE has become one of the preferred choices for advanced liver cancer patients PVA, gelatin, and alginate microspheres[
19]. Drug-eluting embolic microspheres has already been commercialized for cancer therapy, which incorporates doxorubicin etc..[
20]. Chemoembolization therapy has been used for hepatocellular carcinoma treatment with drug eluting microspheres[
35]. Thus, characterization of the resulting responses in the local environment is important for understanding the sized effects of microsphere-based drugs.
TNF-α and VCAM-1 have been indicated to be involved in cell recruitment and disease progression. For example, TNF-α treatment of EPCs can lead to increased adhesion by increasing bond affinity[
36] and lipid-induced endothelial VCAM-1 was shown to promote nonalcoholic steatohepatitis pathogenesis[
37].
Although, inflammatory signals can trigger the expression of VCAM-1 on endothelial cells[
38]
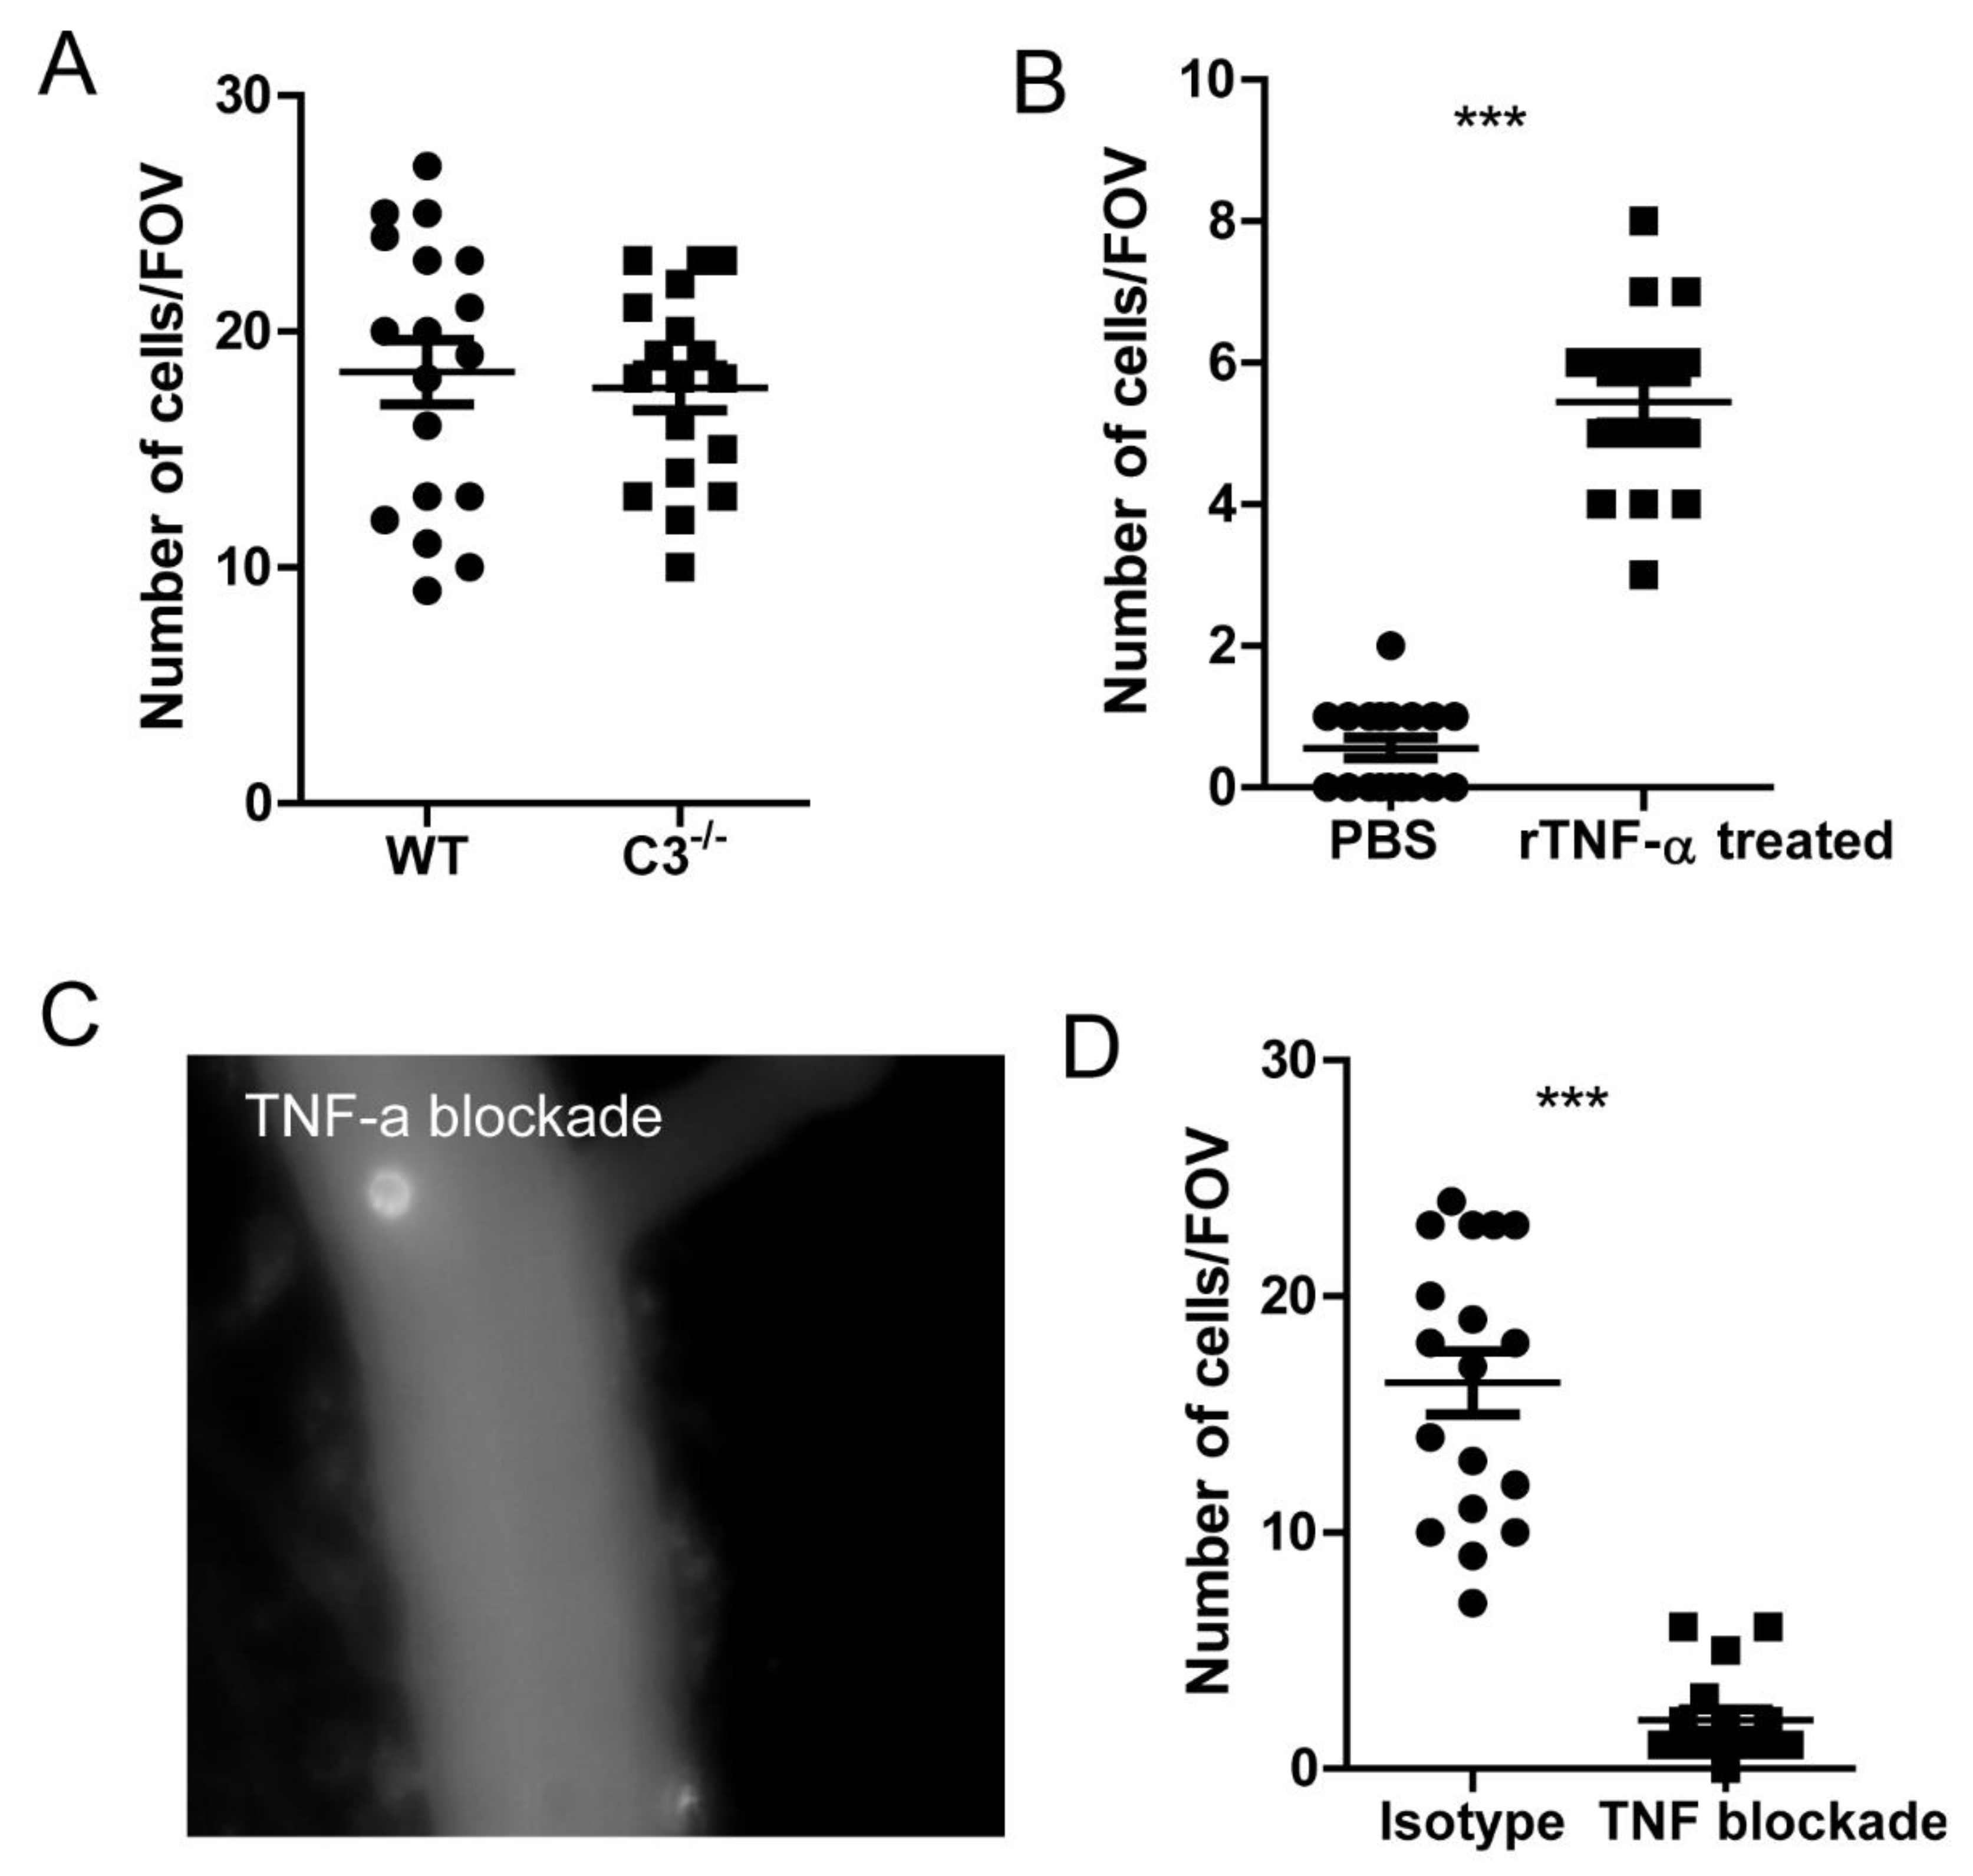
, in our model, we failed to detect systematically increased TNF-α in serum by ELISA, thus indicating the lack of systematic inflammation. VCAM-1 expression can also be regulated by shear force[
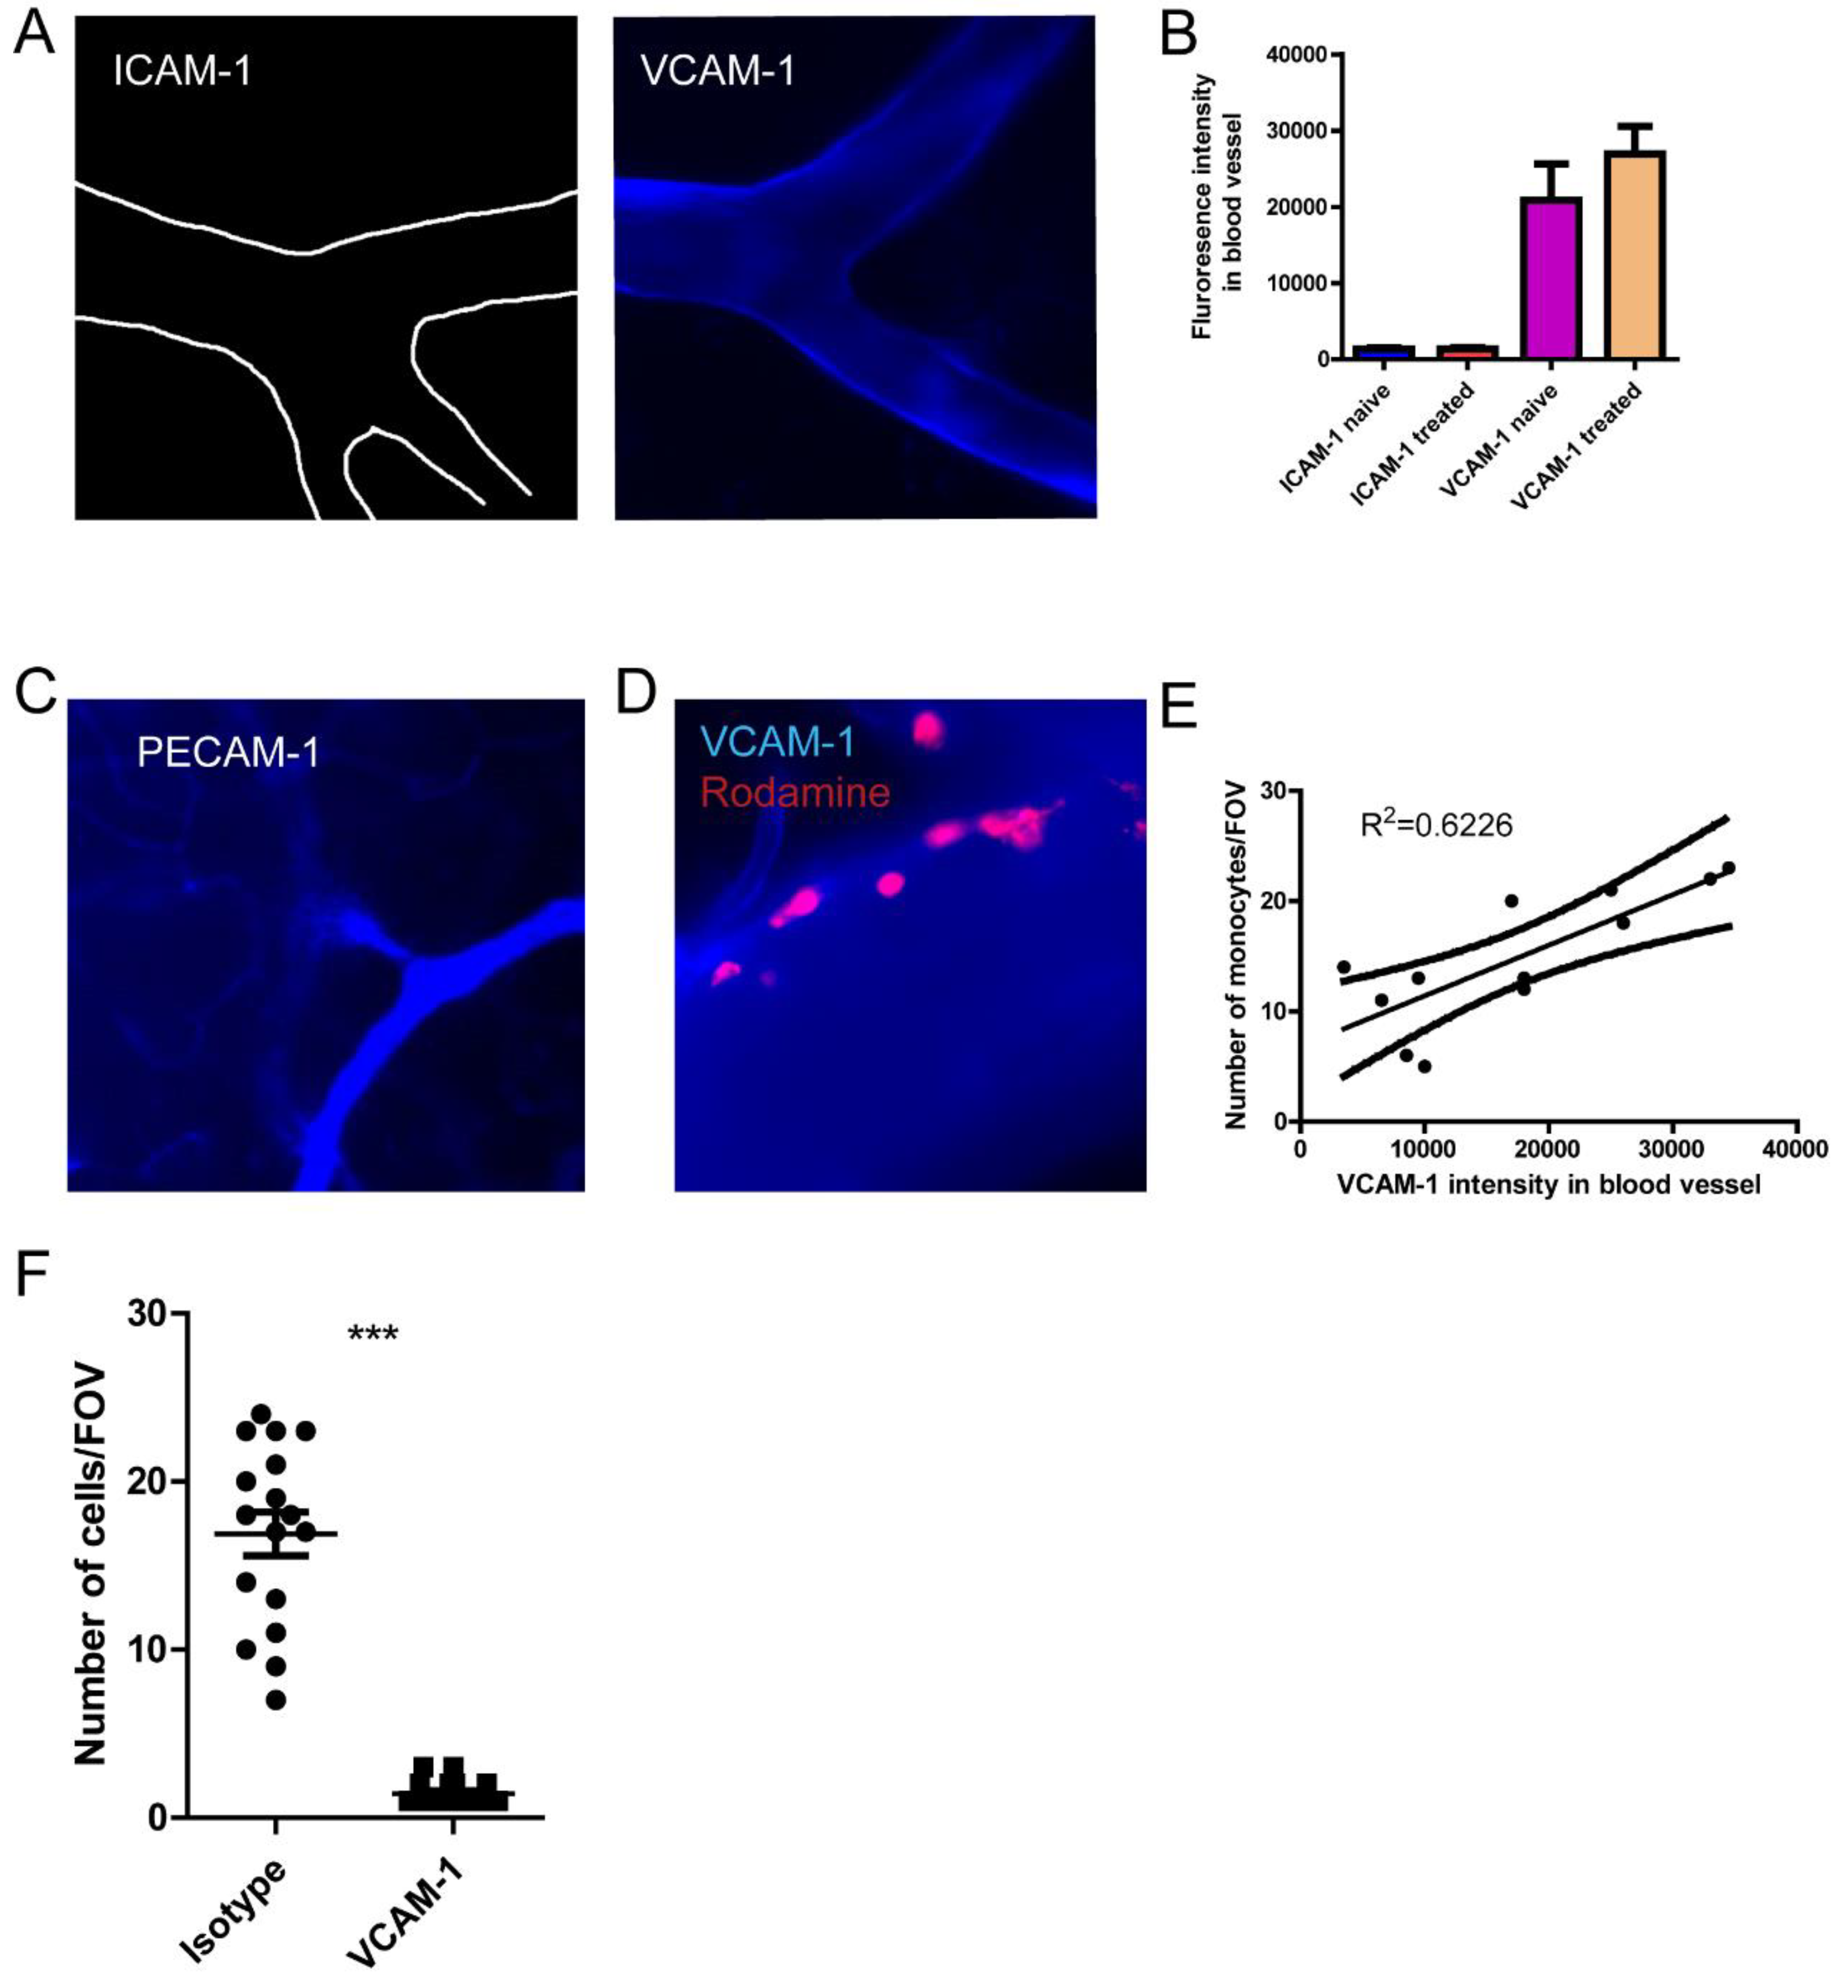
39]. However, we found that the VCAM-1 molecules are constitutively expressed on brain capillary vessels. Consistent with our report, previous studies showed that
selective targeting of VCAM-1 liposome to inflamed cerebral vasculature dramatically enhanced the blood-brain barrier targeting than ICAM-1[
40]
.The expression of VCAM-1 explains the differential recruitment of monocytes in different organs.
The spleen is a large reservoir of monocytes that outnumbers blood monocytes which can be recruited during inflammation. Splenic monocytes cluster in the subcapsular red pulp[
22]. Previous studies mostly focused on the recruitment of Ly6C
hi monocytes. One day after coronary ligation, we observed reduced numbers of monocytes in the subcapsular red pulp of the spleen. Monocytes in the spleen are very similar in phenotype to blood-derived monocytes and are mobilized to the injured heart, where they represent a large fraction of total monocytes that are recruited [
22]. The microspheres induced monocyte recruitment is in striking contrast to the LPS [
41] induced inflammation of the brain, in the later models neutrophils arrived in a much faster fashion (within 4 hours). A previous work identified the recruitment of Ly6C
lo monocytes in Alzheimer mice model that played an important role in clearance of the amyloid-β load in the brain cortex and hippocampus[
42]. Amyloid-β can be recognized by many pattern recognition receptors which may further activate TNF-α signaling [
43]. Thus, our work provided new potential mechanisms for the monocyte recruitment in this disease model.
In conclusion, we found polystyrene microspheres of 6um size can completely block the blood flow of the capillary, and result in recruitment of monocyte with intermediate levels of Ly6C to the brain. VCAM-1 is the molecule that dictates the differential recruitment of monocytes. The activation of monocytes requires the TNF-α signaling by stimulating the monocyte by polystyrene microspheres. The study model in this although seemingly artificially, helps to address the sequela of capillary blockade in different organs. Such situation can be naturally occurring during diseased conditions or happen during future medication. This study emphasized the importance of organ specific monocyte responses to stimuli which has importance the understanding of monocyte role in major diseases.
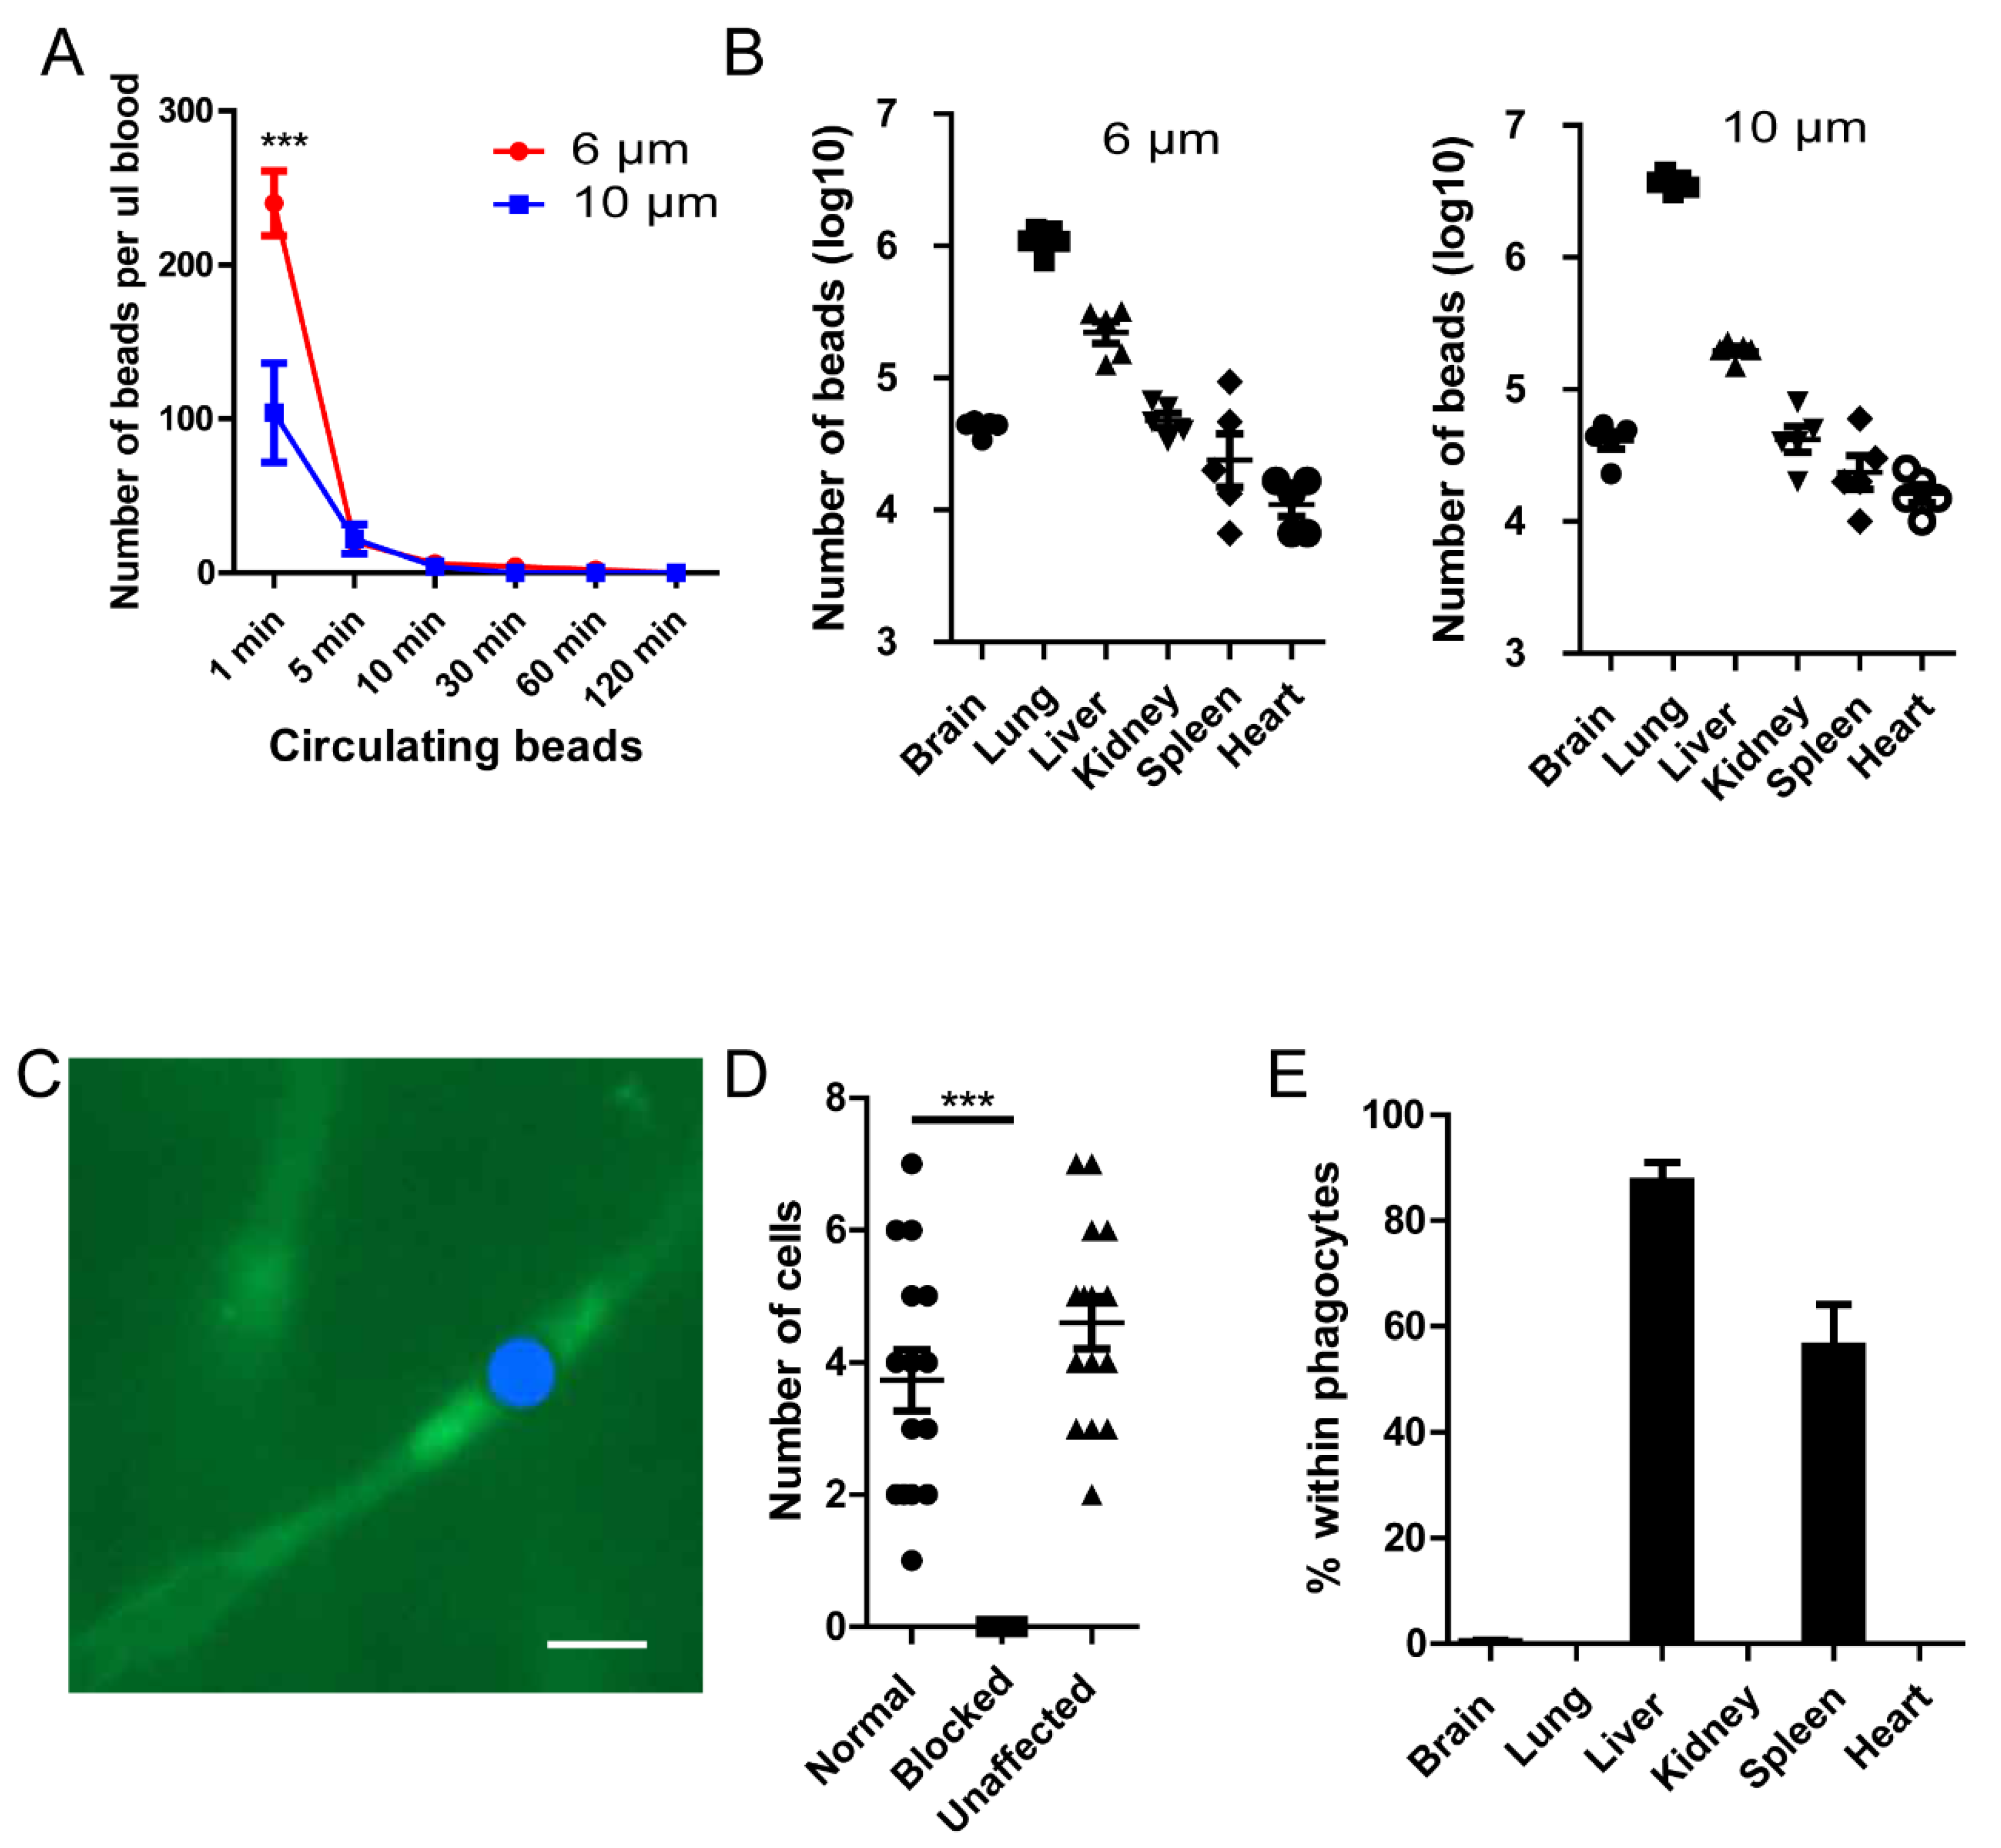
Figure 1.
Polystyrene microspheres can be mechanically trapped in capillary vessels. (A) Microspheres (5x10⁶) were injected into the tail vein of mice (n=5 in each group), at different time intervals, the microspheres remaining in circulation was evaluated by tail vein blood. (B) The distribution of beads in different organs 2 hours post injection (n=5 in each group). (C) The location of beads in capillary vessels, the FITC-Beads were artificially painted blue for better contrast. Blood vessel is labeled by 70KD FITC-Dextran. (D)The number blood cells passing through a capillary branch per second. (E) The percentage of beads within F4/80+ phagocytes (n=3 in each group). ***, p<0.001 by student’s t test.
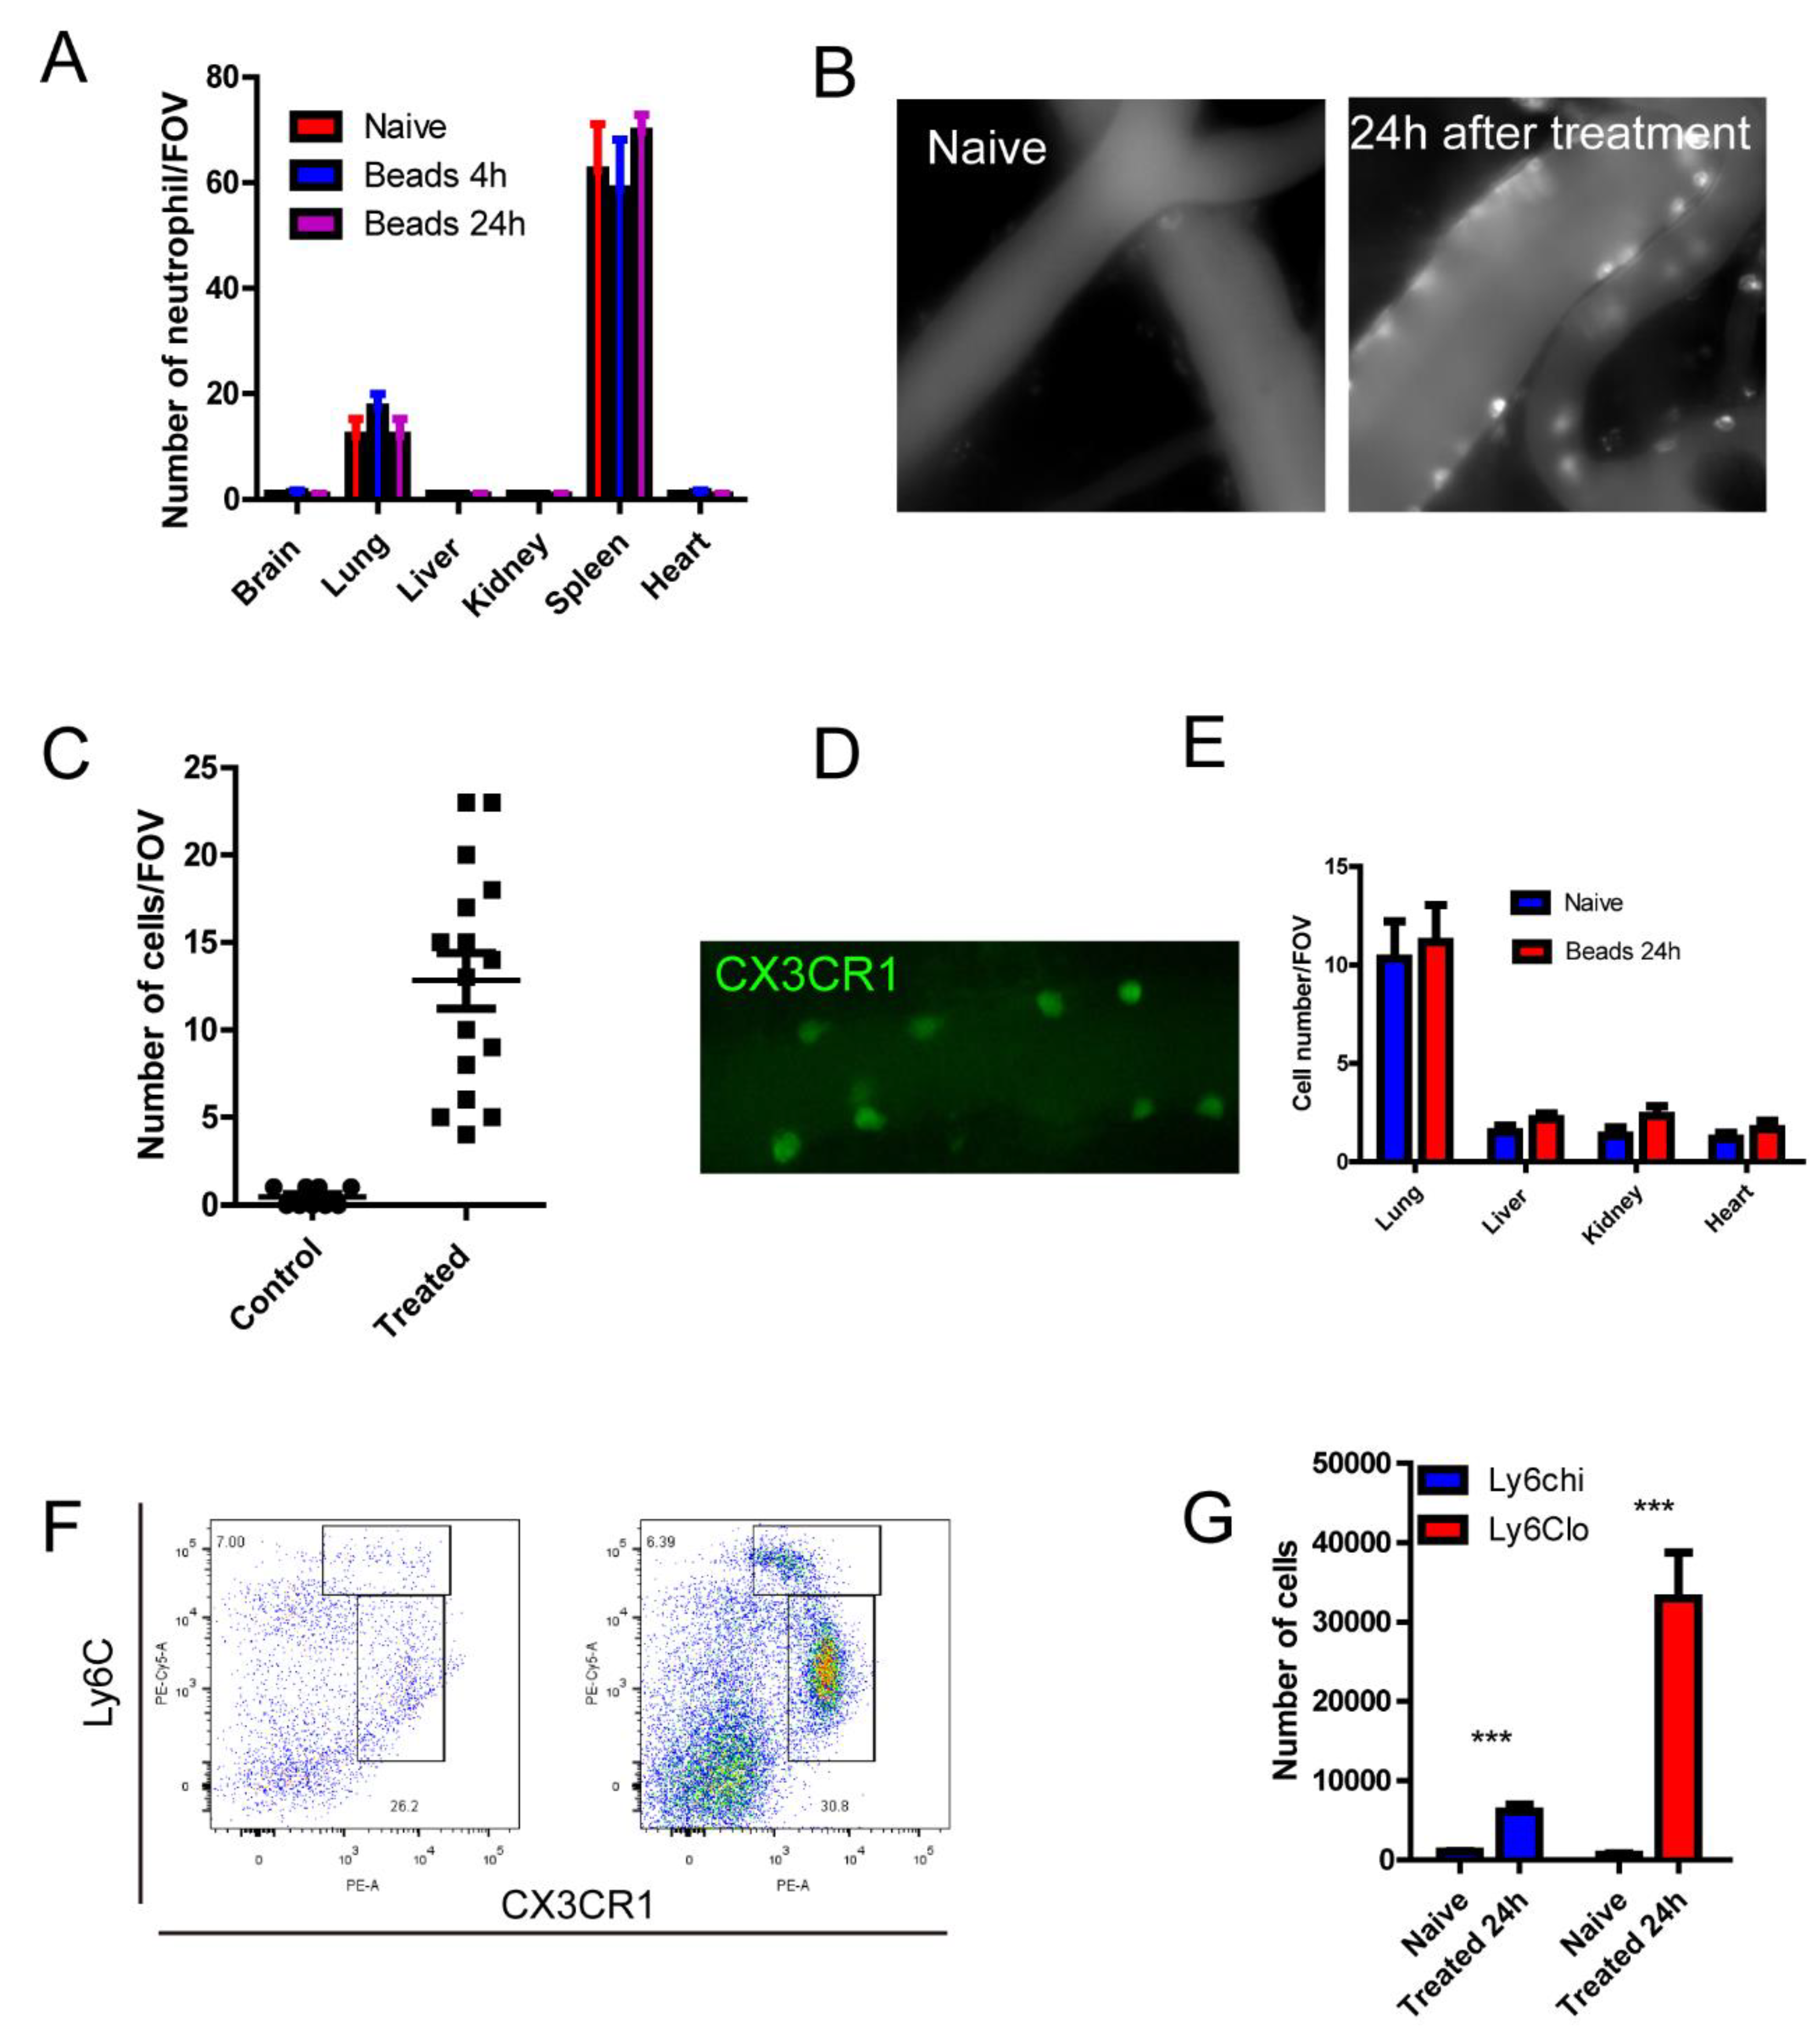
Figure 2.
Microspheres treatment induced monocyte recruitment in to the brain vasculature. (A) Number of neutrophils by immunofluorescence staining tissue sections, size of FOV = 0.2x0.2mm. (B) Recruitment of immune cells in the brain as stained by AF647 labeled CD45. (C) Number of CD45+cells in the circulation, size of FOV is 0.2x0.2 mm. (D) A blood vessel in a CX3CR1gfp/+ mice after treatment of microspheres. (E) The number of immune cells in different organs. (F) Flowcytometry analysis of recruited cells in the brain, naive on the left, 24 h after treatment on the right. (G) Absolute number of monocytes in the brain (n=3 in each group). ***, p<0.001 by student’s t test.
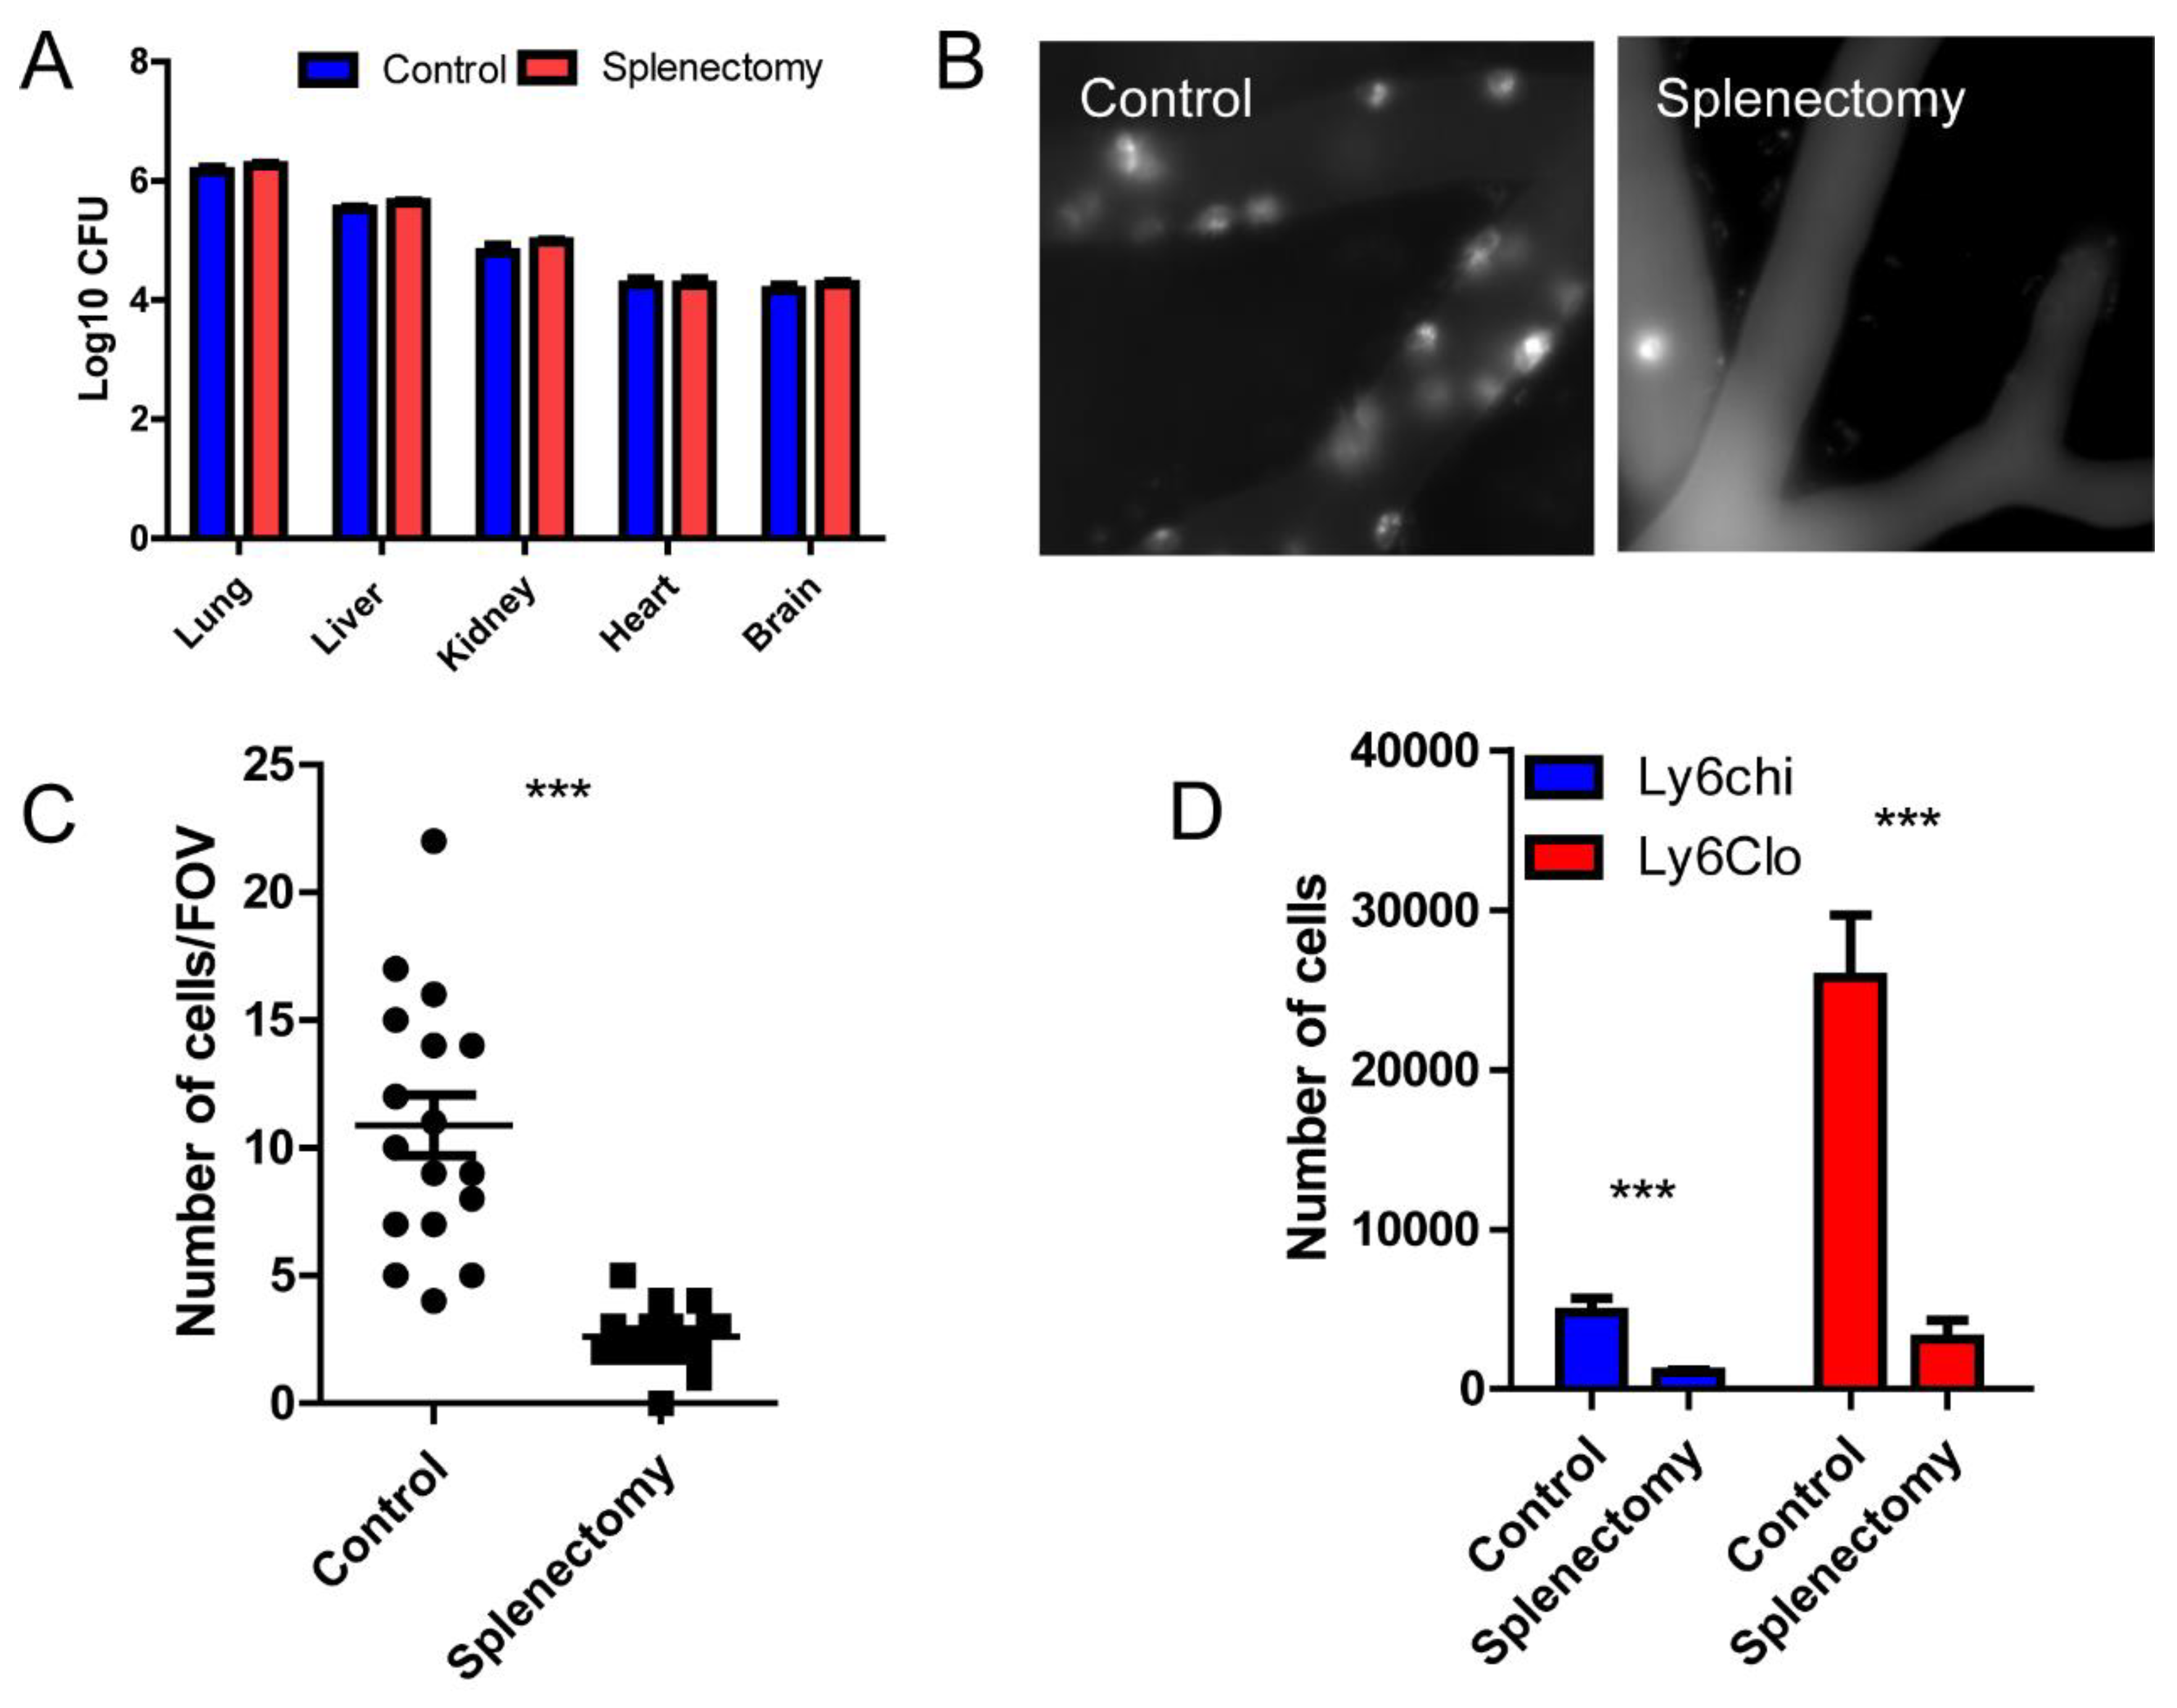
Figure 3.
Spleen is the major source of monocyte recruited to the brain. (A) The distribution of microspheres within different organs comparing control and splenectomized mice. (B) A representative intravital image of the brain vasculature stained by AF647-CD45 in control and splenectomized mice. (C) The number of CD45+ cells in the brain per field of view, size of FOV is 0.2x0.2 mm. (D) Flowcytometry analysis of recruited monocytes in the brain of control and splenectomized mice. ***, p<0.001 by student’s t test.
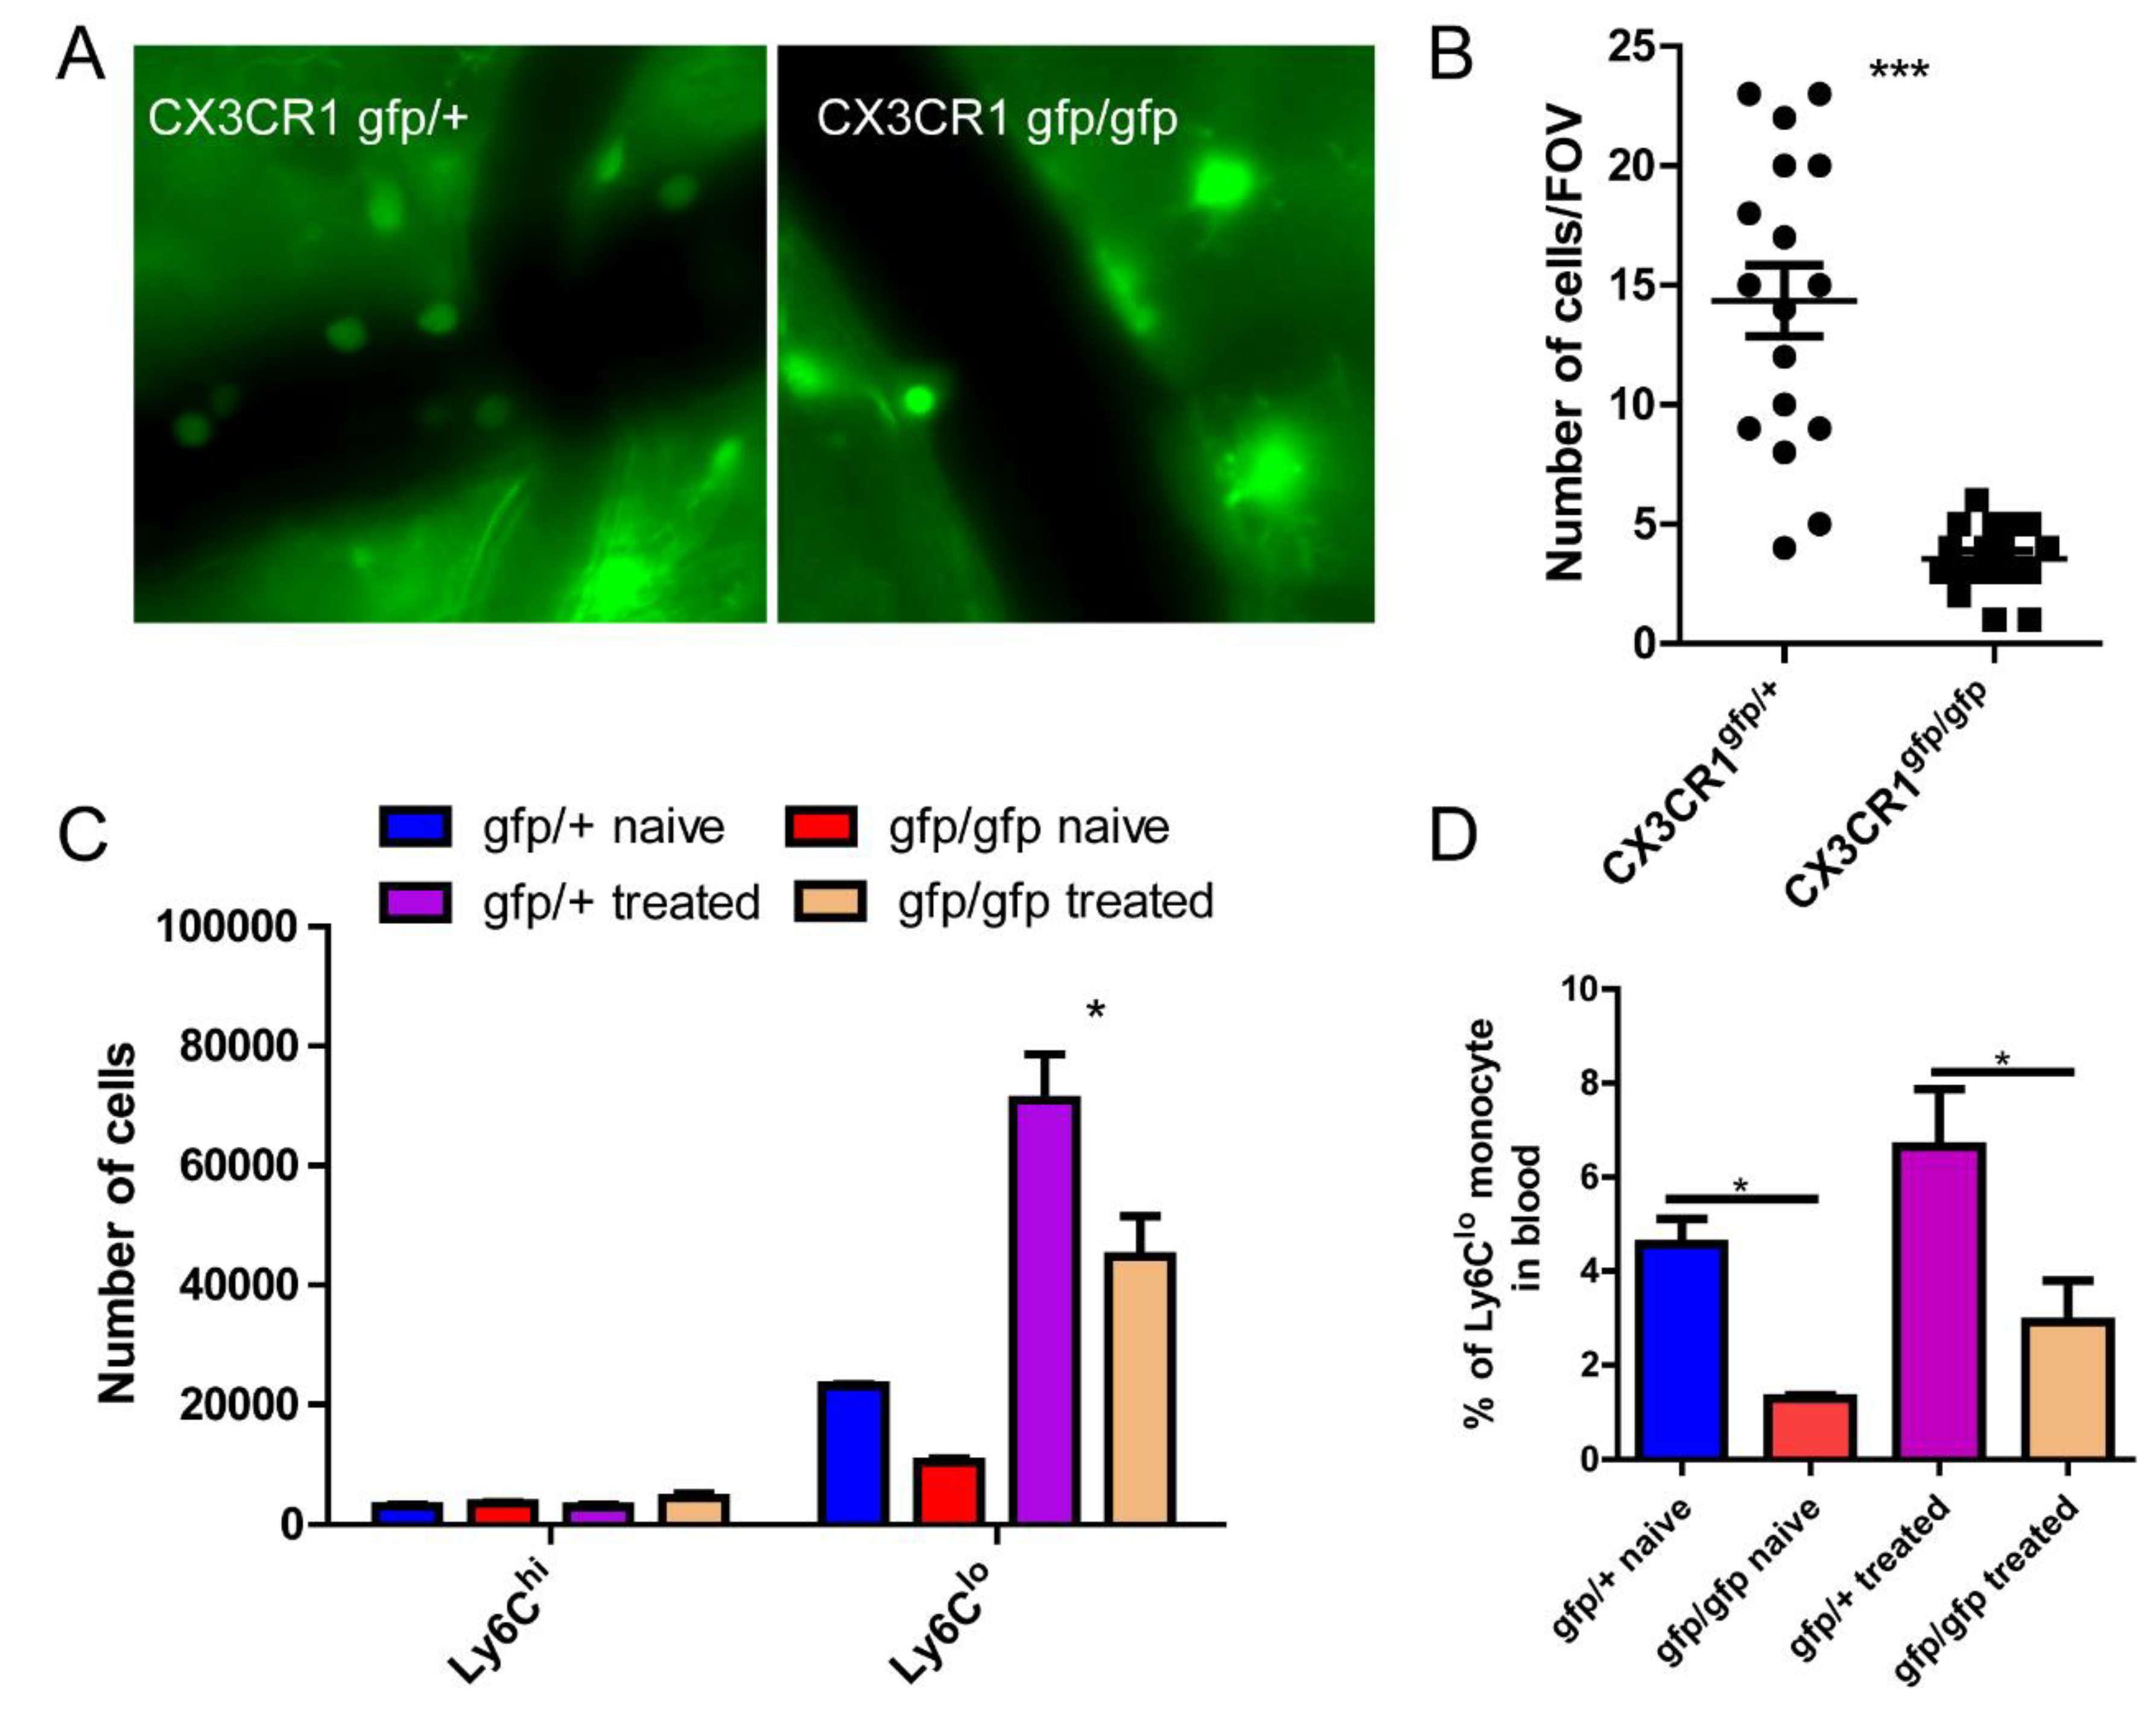
Figure 4.
CX3CR1 is involved in monocyte recruitment to the brain. (A) The representative imaging showing differential recruitment of monocyte in CX3CR1gfp/+ and CX3CR1gfp/gfp mice. (B) The number of GFP+ cells in the brain per field of view, size of FOV is 0.2x0.2 mm. (C) Flowcytometry analysis of recruited monocytes in the brain in CX3CR1gfp/+ and CX3CR1gfp/gfp mice. (D) The number of circulating monocytes in CX3CR1gfp/+ and CX3CR1gfp/gfp mice. *, p<0.05 by student’s t test.
Figure 5.
The distinct recruitment of monocyte depends on VCAM-1 expression. (A) The staining of ICAM-1 and VCAM-1 by injection of AF647 labeled antibodies, and the brain vasculature was visualized using intravital microscopy. (B) The fluorescence intensity of ICAM-1 and VCAM-1 in the different blood vessels of the brain. (C) The staining of PECAM-1by injection of AF647 labeled antibodies showing the capillary vessels. (D) VCAM-1 expression and recruitment of monocyte. (E)The association of VCAM-1 expression and the number of monocytes recruited to that blood vessel. (F) The number of monocytes after the treatment with isotype or VCAM-1 antibody. *, p<0.05 by student’s t test. Scale bar= 20 μm.
Figure 6.
TNF signaling is crucial for monocyte recruitment to the brain. (A) The recruitment of monocytes into the brain in WT and complement deficient C3-/- mice. (B) Monocytes were isolated from spleen and in vitro stimulated with recombinant mouse TNF-α and then infused back in to the mouse. The brain can immediately see the recruitment of monocytes to the brain. (C) A representative image showing the TNF-α blockade to the recruitment of monocytes. (D) The recruitment of monocytes to the brain after TNF blockade or isotype treatment. mice were treated with 200 μg anti-TNF-α antibody to neutralize its function. ***, p<0.001 by student’s t test.
Figure 7.
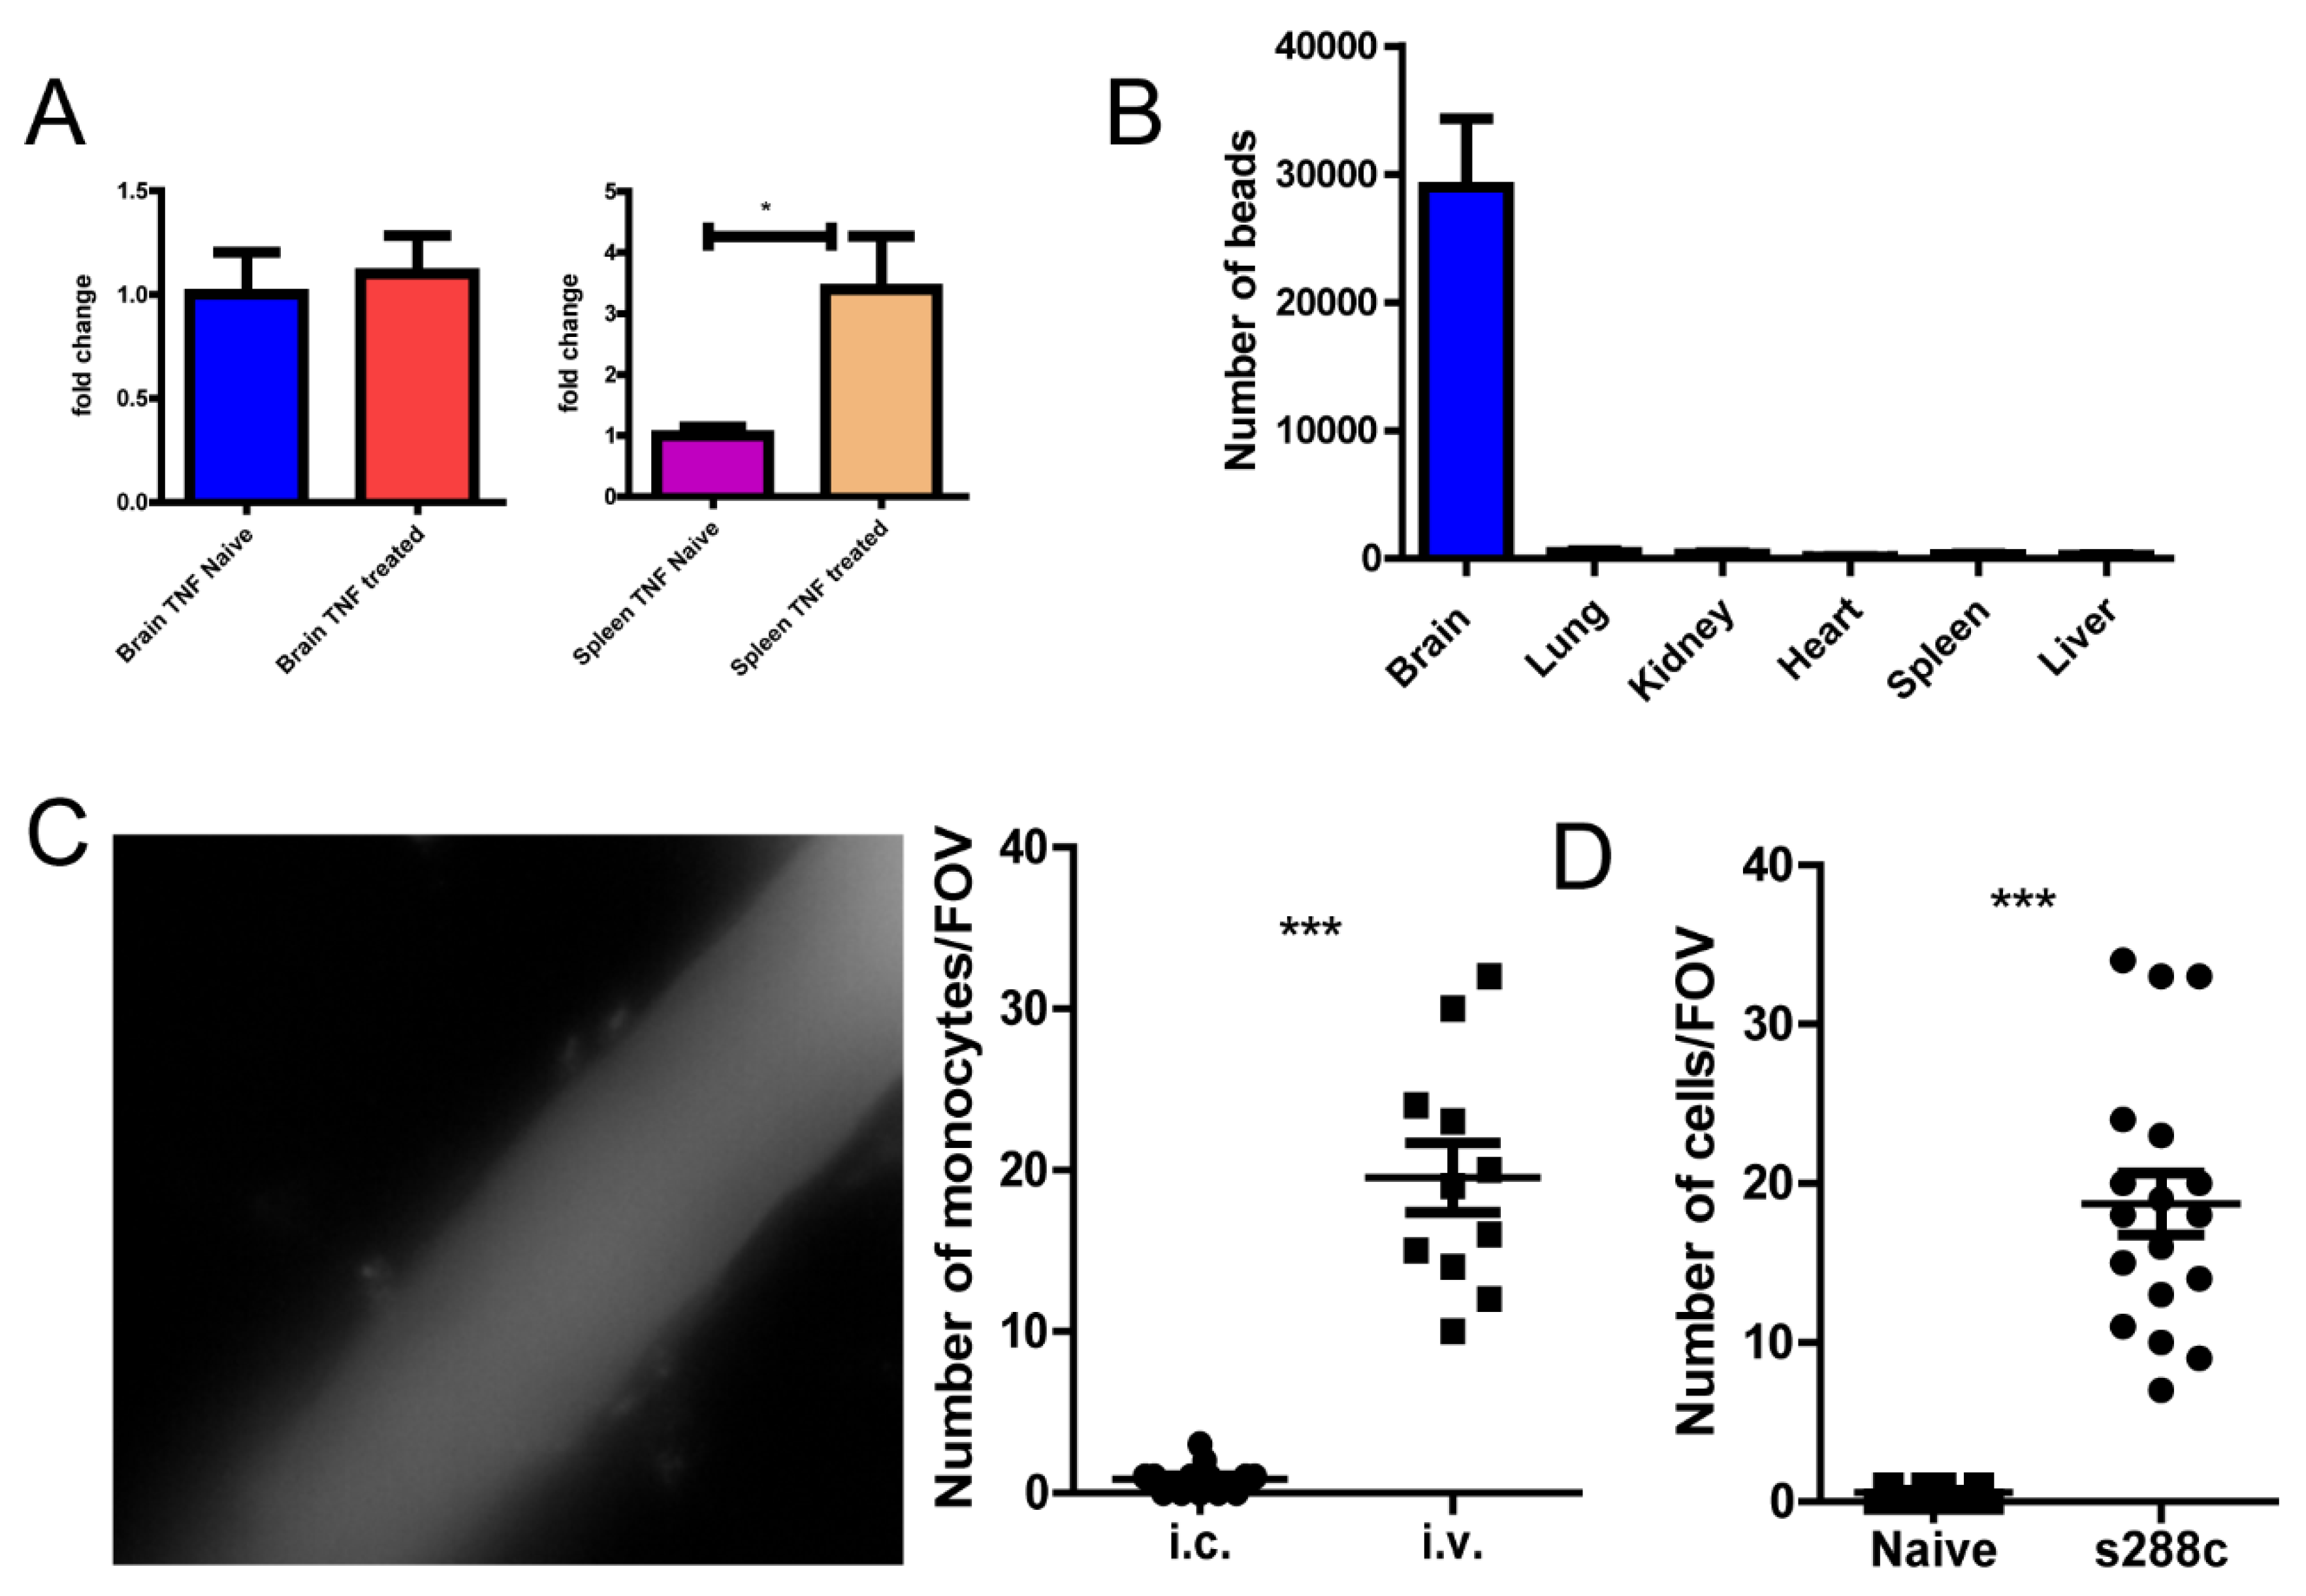
Yeast cells can induce monocyte recruitment. (A) qPCR detection of TNF-α mRNA in brain and spleen tissues. (B) The distribution of microspheres 2 h after intra carotid injection. (C) The response in mouse brain 24 h after intra carotid injection (left), enumeration on the right. (D) The treatment of mice with fungi S. cerevisiae led to recruitment of monocyte into the brain. ***, p<0.001 by student’s t test.
