Submitted:
01 June 2023
Posted:
08 June 2023
You are already at the latest version
Abstract
Keywords:
1. Introduction
2. Materials and Methods
2.1. Study Participants
2.2. Serum 25(OH)D Measurement and Related Covariates
2.3. Whole-Exome Sequencing and Bioinformatics
2.4. Exome-Wide Association Analysis
2.5. Meta-Analysis
2.6. Validation of Replicated Loci Previously Associated with 25(OH)D
2.7. Analysis of Polygenic Risk Scores
2.8. SNP Annotation and Functional Analysis
3. Results
3.1. Study Description
3.2. Exome-Wide Association Study on 25(OH)D
3.3. Evaluation of Known Loci Replication
3.4. GWAS Meta-Analysis for Vitamin D
3.5. Analysis of Functional Variant Expression and Frequency
3.6. Analysis of Polygenic Risk Score
4. Discussion
5. Conclusions
Supplementary Materials
Author Contributions
Informed Consent Statement
Data Availability Statement
Acknowledgments
Conflicts of Interest
References
- Holick, M.F. , Vitamin D deficiency. N Engl J Med, 2007. 357(3): p. 266-81.
- Rahme, M. , et al., Impact of Calcium and Two Doses of Vitamin D on Bone Metabolism in the Elderly: A Randomized Controlled Trial. J Bone Miner Res, 2017. 32(7): p. 1486-1495.
- Mitchell, B.L. , et al., Half the Genetic Variance in Vitamin D Concentration is Shared with Skin Colour and Sun Exposure Genes. Behav Genet, 2019. 49(4): p. 386-398.
- Wjst, M. , et al., A genome-wide linkage scan for 25-OH-D(3) and 1,25-(OH)2-D3 serum levels in asthma families. J Steroid Biochem Mol Biol, 2007. 103(3-5): p. 799-802.
- Manousaki, D. , et al., Genome-wide Association Study for Vitamin D Levels Reveals 69 Independent Loci. Am J Hum Genet, 2020. 106(3): p. 327-337.
- Sinnott-Armstrong, N. , et al., Author Correction: Genetics of 35 blood and urine biomarkers in the UK Biobank. Nat Genet, 2021. 53(11): p. 1622.
- Revez, J.A. , et al., Genome-wide association study identifies 143 loci associated with 25 hydroxyvitamin D concentration. Nat Commun, 2020. 11(1): p. 1647.
- Jiang, X. , et al., Genome-wide association study in 79,366 European-ancestry individuals informs the genetic architecture of 25-hydroxyvitamin D levels. Nat Commun, 2018. 9(1): p. 260.
- Autier, P. , et al., Effect of vitamin D supplementation on non-skeletal disorders: a systematic review of meta-analyses and randomised trials. Lancet Diabetes Endocrinol, 2017. 5(12): p. 986-1004.
- Lips, P. , et al., Current vitamin D status in European and Middle East countries and strategies to prevent vitamin D deficiency: a position statement of the European Calcified Tissue Society. Eur J Endocrinol, 2019. 180(4): p. P23-P54.
- Chakhtoura, M. , et al., Vitamin D in the Middle East and North Africa. Bone Rep, 2018. 8: p. 135-146.
- Salman, S. , et al., Prevalence and Predictors of Vitamin D Inadequacy: A Sample of 2,547 Patients in a Mediterranean Country. Cureus, 2021. 13(5): p. e14881.
- McMahon, A. , et al., Sequencing-based genome-wide association studies reporting standards. Cell Genom, 2021. 1(1).
- Li, H. and R. Durbin, Fast and accurate short read alignment with Burrows-Wheeler transform. Bioinformatics, 2009. 25(14): p. 1754-60.
- Cingolani, P. , et al., A program for annotating and predicting the effects of single nucleotide polymorphisms, SnpEff: SNPs in the genome of Drosophila melanogaster strain w1118; iso-2; iso-3. Fly (Austin), 2012. 6(2): p. 80-92.
- Li, H. , et al., The Sequence Alignment/Map format and SAMtools. Bioinformatics, 2009. 25(16): p. 2078-9.
- Sherry, S.T., M. Ward, and K. Sirotkin, dbSNP-database for single nucleotide polymorphisms and other classes of minor genetic variation. Genome Res, 1999. 9(8): p. 677-9.
- Landrum, M.J. , et al., ClinVar: improving access to variant interpretations and supporting evidence. Nucleic Acids Res, 2018. 46(D1): p. D1062-D1067.
- Chang, C.C. , et al., Second-generation PLINK: rising to the challenge of larger and richer datasets. Gigascience, 2015. 4: p. 7.
- Zhou, W. , et al., Efficiently controlling for case-control imbalance and sample relatedness in large-scale genetic association studies. Nat Genet, 2018. 50(9): p. 1335-1341.
- Pruim, R.J. , et al., LocusZoom: regional visualization of genome-wide association scan results. Bioinformatics, 2010. 26(18): p. 2336-7.
- Buniello, A. , et al., The NHGRI-EBI GWAS Catalog of published genome-wide association studies, targeted arrays and summary statistics 2019. Nucleic Acids Res, 2019. 47(D1): p. D1005-D1012.
- Lambert, S.A. , et al., The Polygenic Score Catalog as an open database for reproducibility and systematic evaluation. Nat Genet, 2021. 53(4): p. 420-425.
- Hunt, S.E. , et al., Annotating and prioritizing genomic variants using the Ensembl Variant Effect Predictor-A tutorial. Hum Mutat, 2022. 43(8): p. 986-997.
- Lachmann, A. , et al., Massive mining of publicly available RNA-seq data from human and mouse. Nat Commun, 2018. 9(1): p. 1366.
- Wang, T.J. , et al., Common genetic determinants of vitamin D insufficiency: a genome-wide association study. Lancet, 2010. 376(9736): p. 180-8.
- Zhang, E. , et al., Identification of subgroups along the glycolysis-cholesterol synthesis axis and the development of an associated prognostic risk model. Hum Genomics, 2021. 15(1): p. 53.
- Chiruvella, V. , et al., Sucrase-Isomaltase Deficiency Causing Persistent Bloating and Diarrhea in an Adult Female. Cureus, 2021. 13(4): p. e14349.
- Okuno, Y. , et al., Epigenetic regulation of adipogenesis by PHF2 histone demethylase. Diabetes, 2013. 62(5): p. 1426-34.
- Luo, P. , et al., HIF-1alpha-mediated augmentation of miRNA-18b-5p facilitates proliferation and metastasis in osteosarcoma through attenuation PHF2. Sci Rep, 2022. 12(1): p. 10398.
- Pereira, F. , et al., Vitamin D has wide regulatory effects on histone demethylase genes. Cell Cycle, 2012. 11(6): p. 1081-9.
- Sawatsubashi, S. , et al., The Function of the Vitamin D Receptor and a Possible Role of Enhancer RNA in Epigenomic Regulation of Target Genes: Implications for Bone Metabolism. J Bone Metab, 2019. 26(1): p. 3-12.
- Kim, H.J. , et al., Plant homeodomain finger protein 2 promotes bone formation by demethylating and activating Runx2 for osteoblast differentiation. Cell Res, 2014. 24(10): p. 1231-49.
- Tripathi, R. , et al., SLC38A10 Regulate Glutamate Homeostasis and Modulate the AKT/TSC2/mTOR Pathway in Mouse Primary Cortex Cells. Front Cell Dev Biol, 2022. 10: p. 854397.
- Patel, R.A. , et al., Genetic interactions drive heterogeneity in causal variant effect sizes for gene expression and complex traits. Am J Hum Genet, 2022. 109(7): p. 1286-1297.
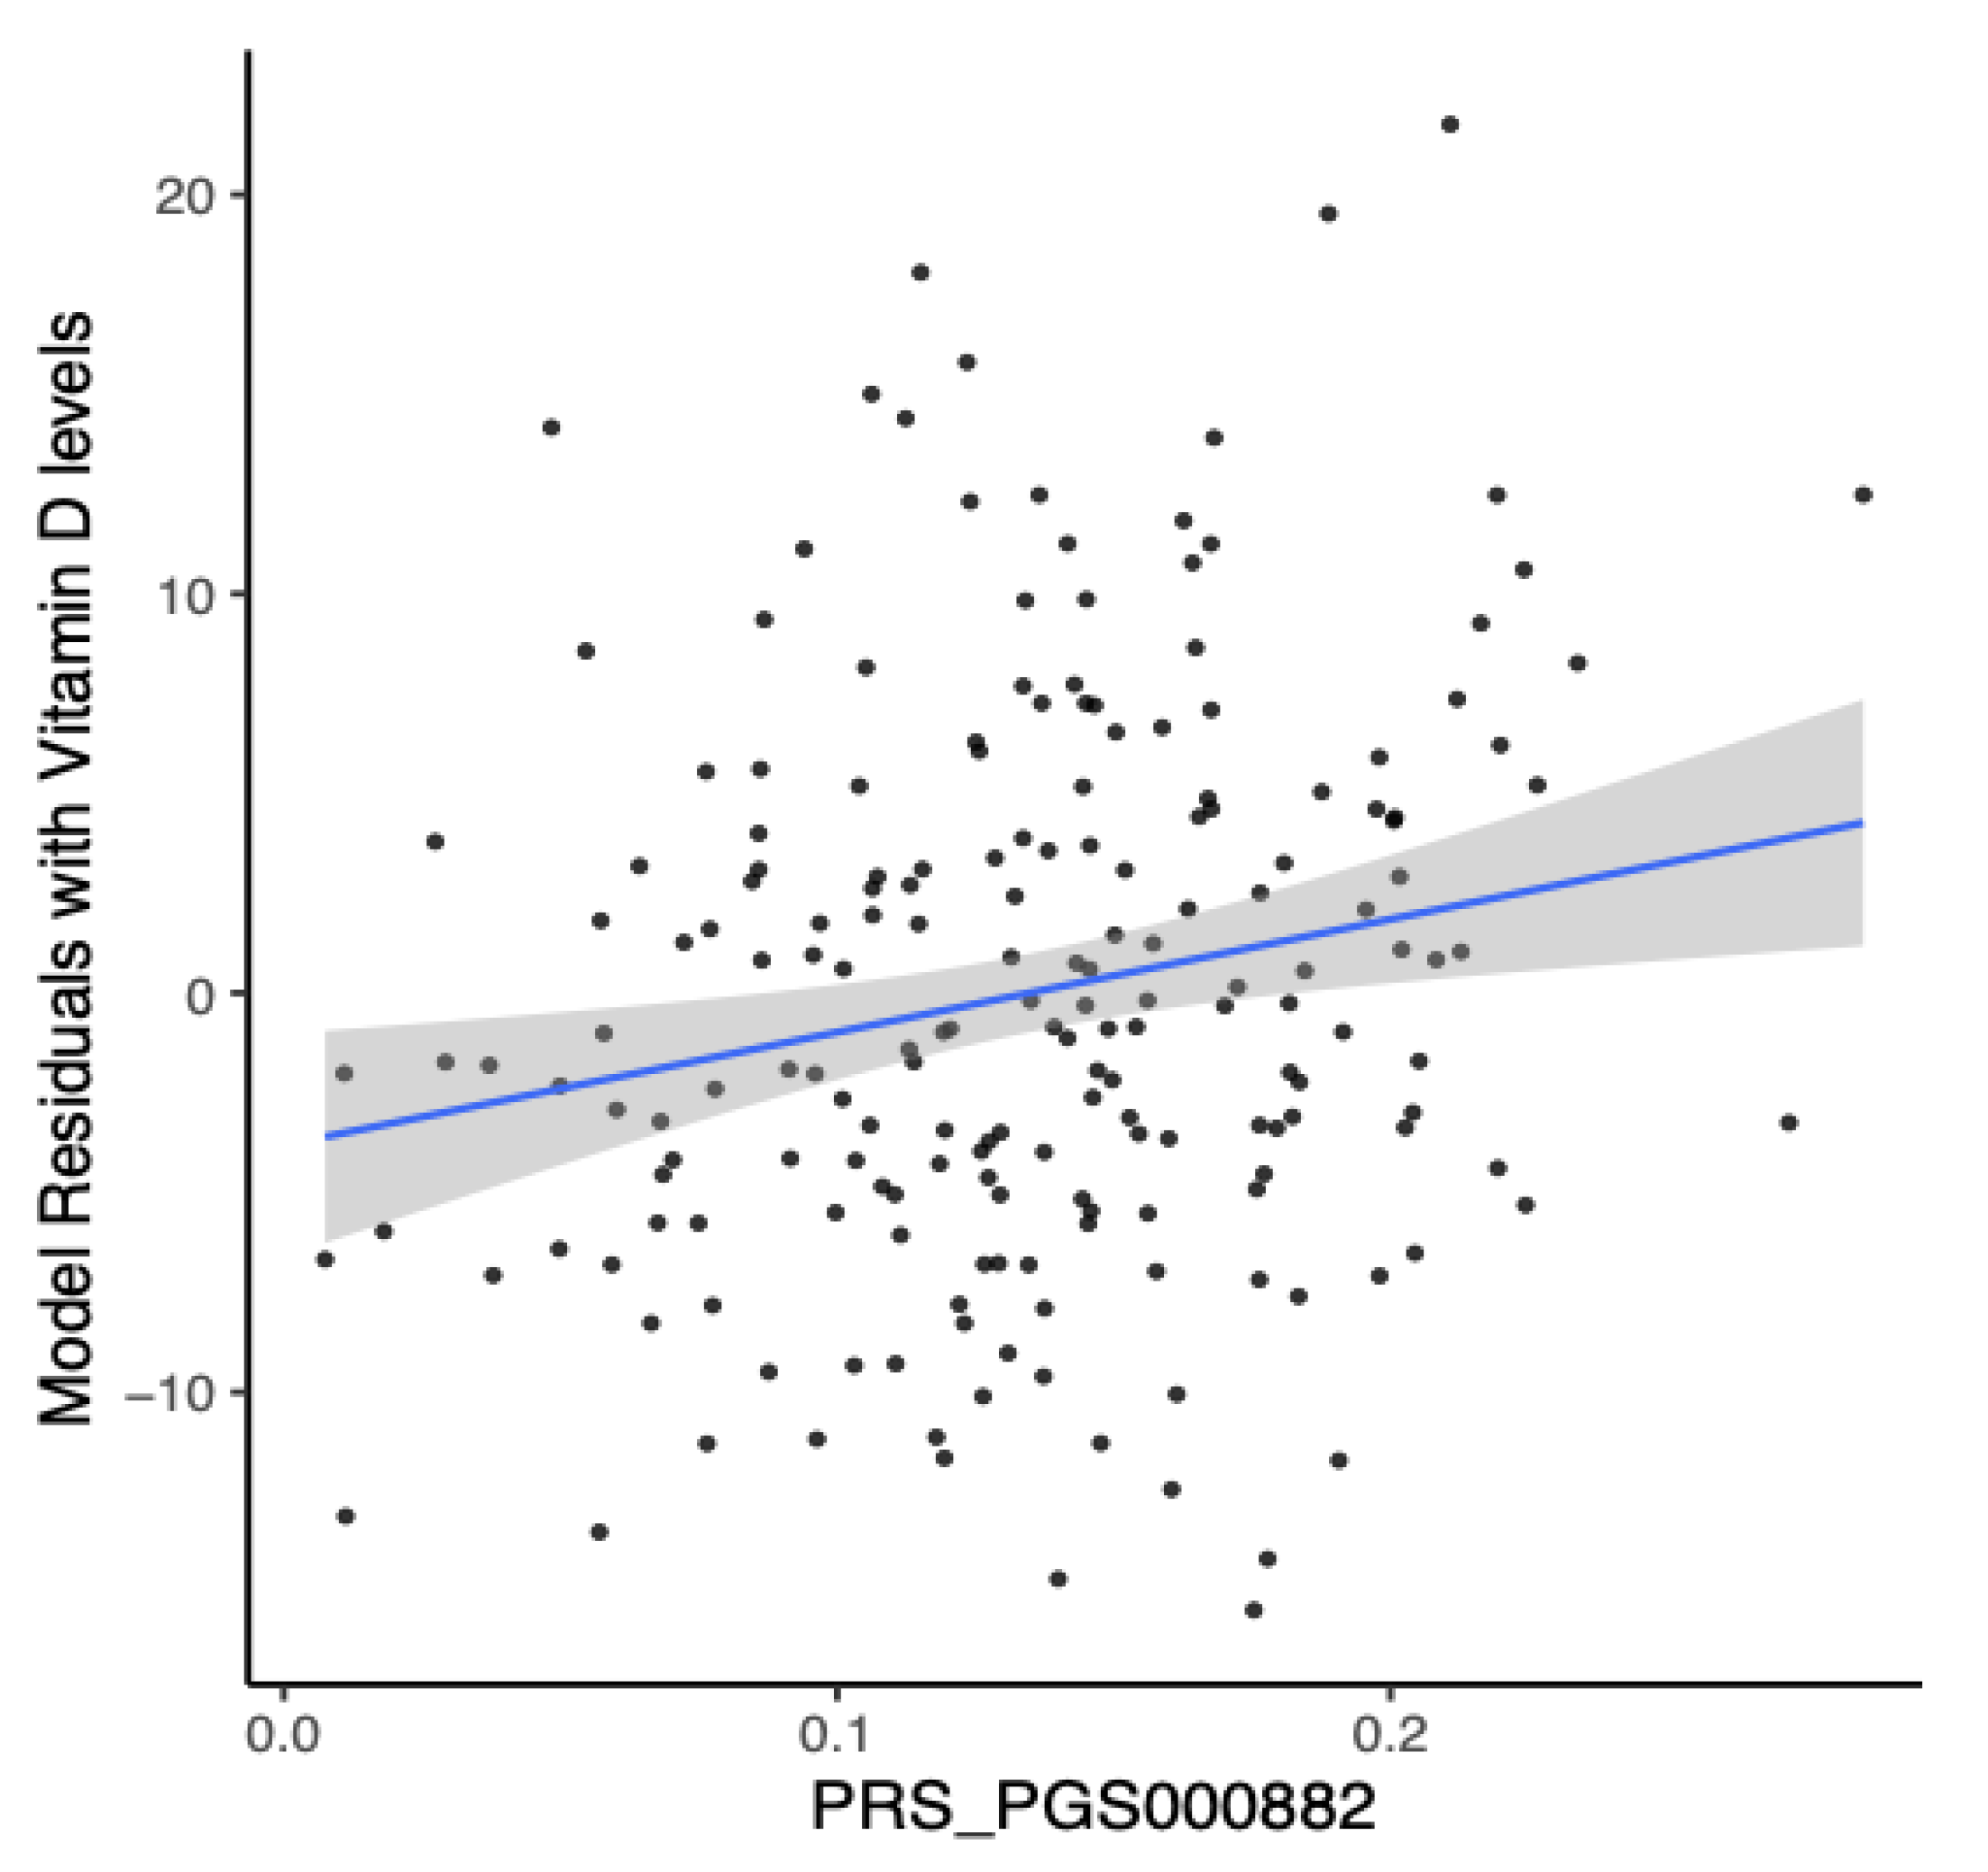
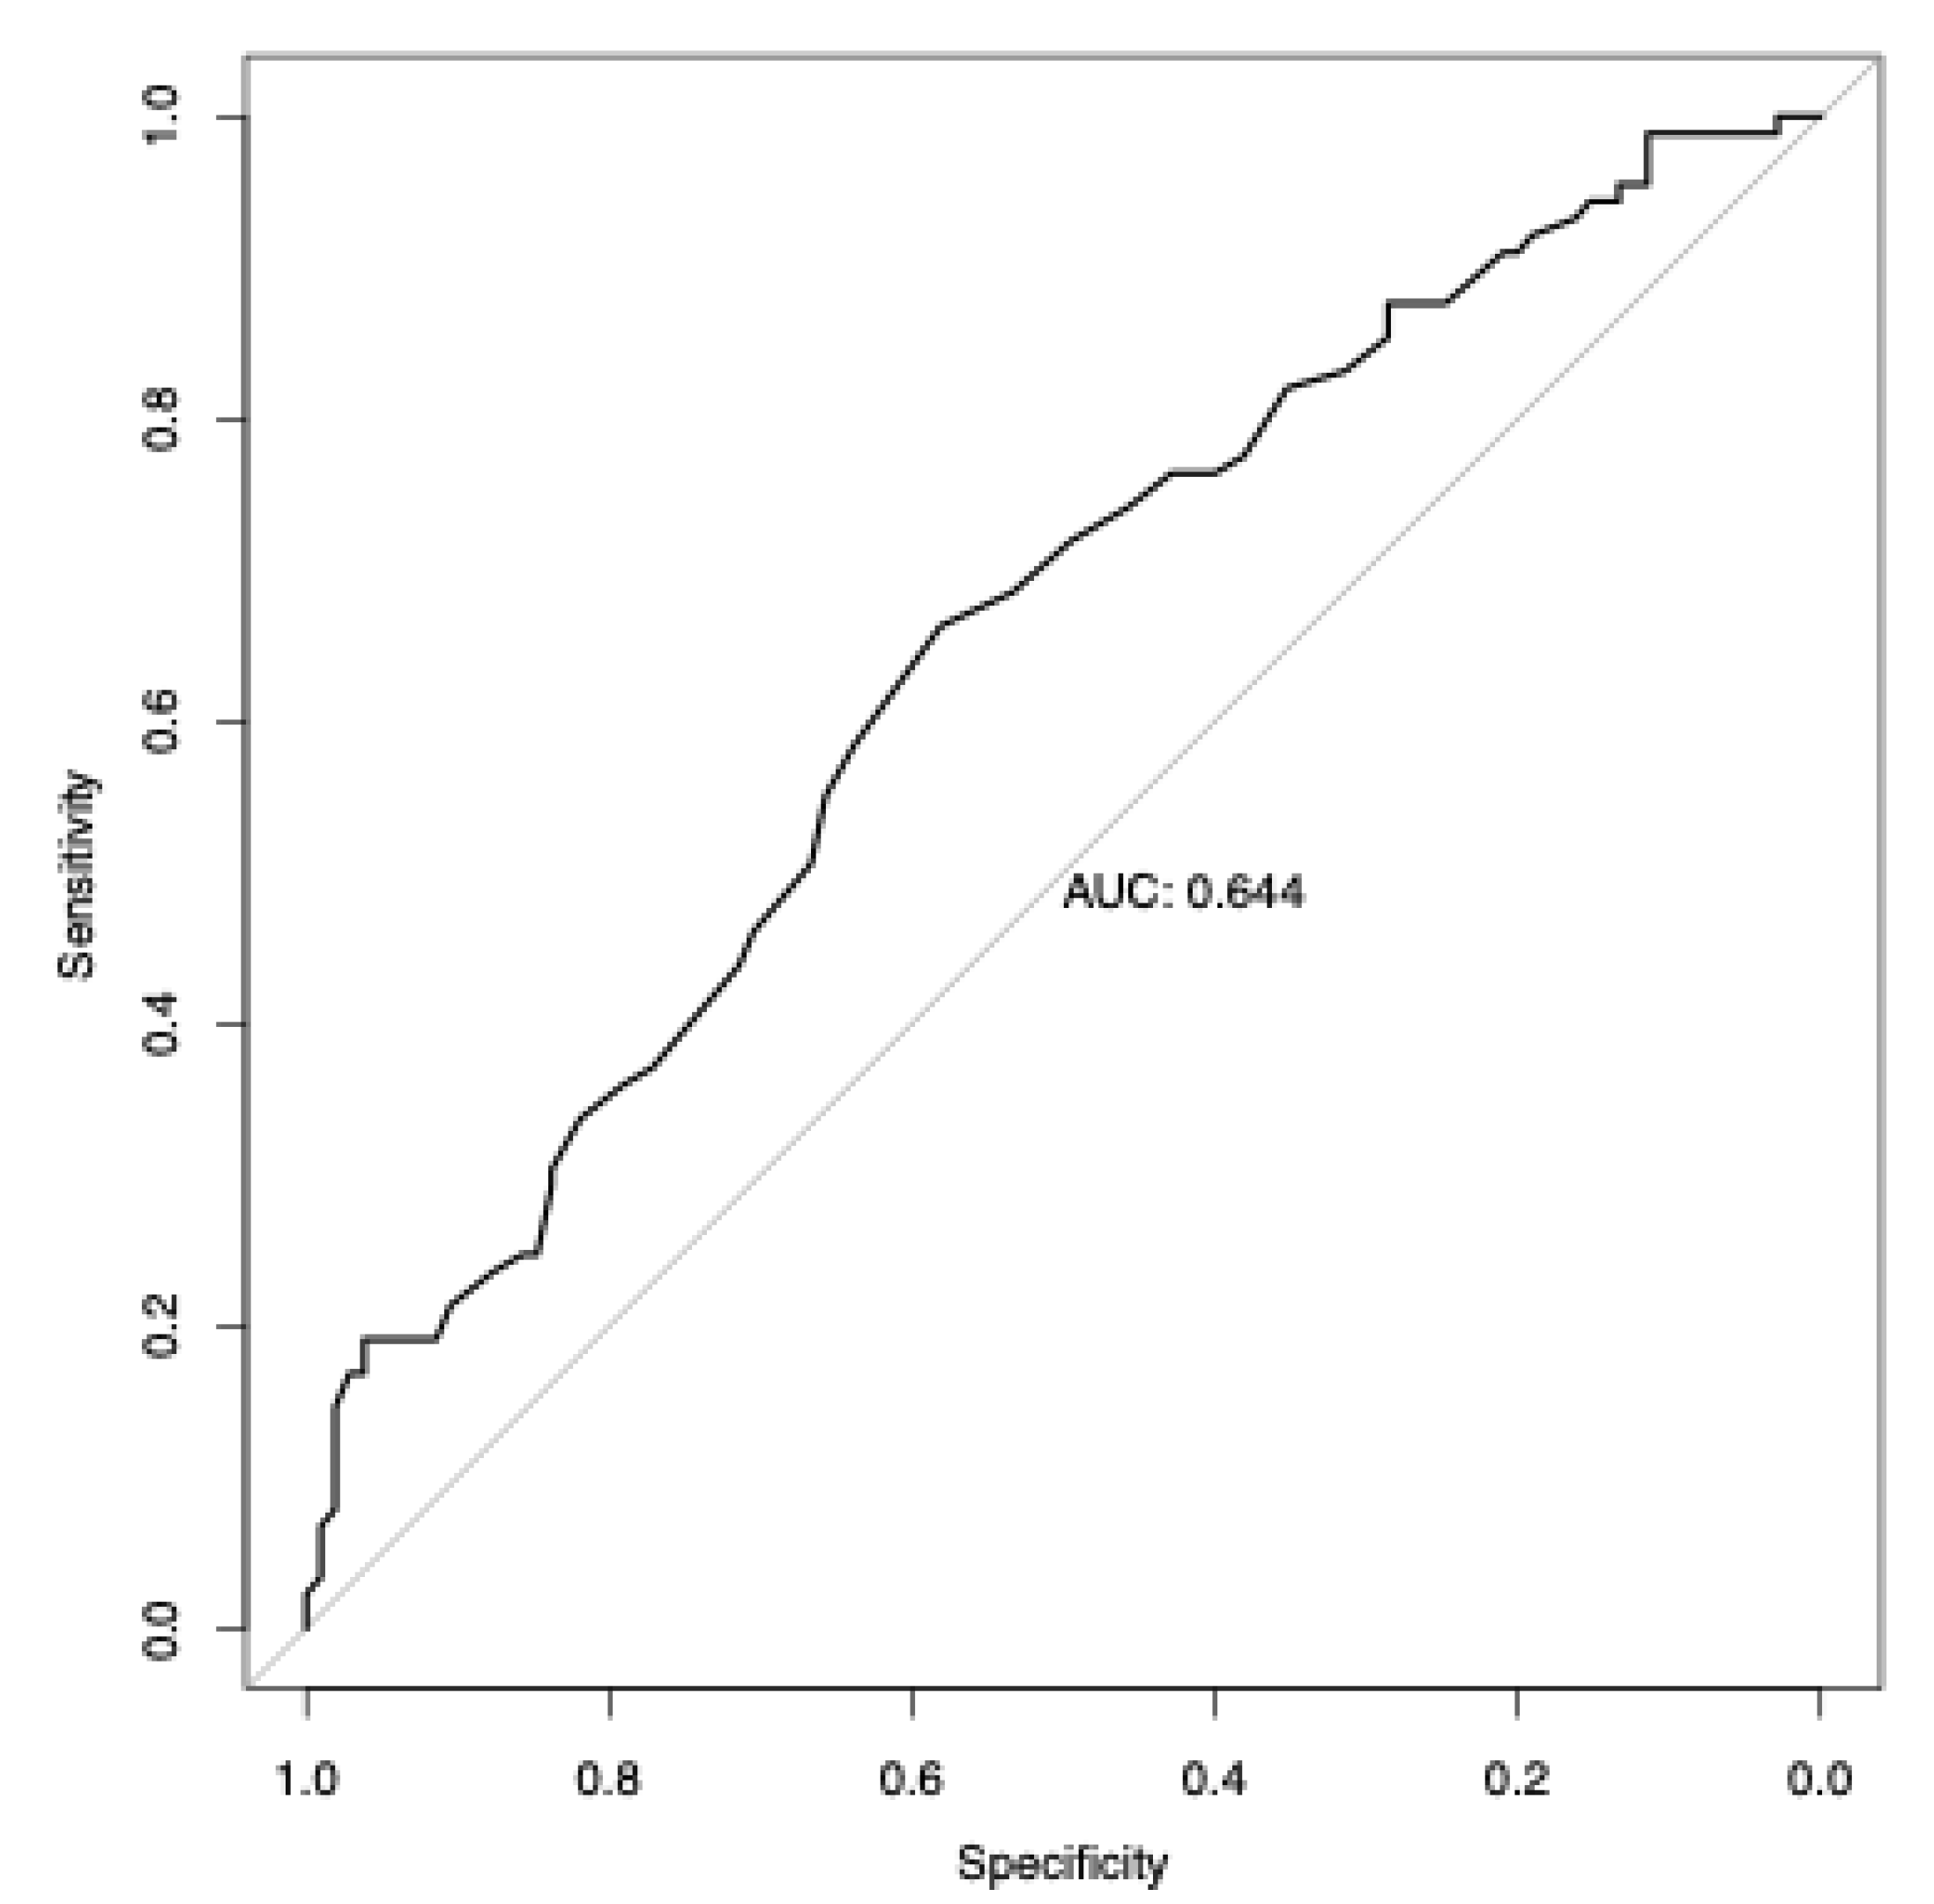
| Characteristic | Male | Female | Total |
| Age (years) | 72.7 (±5.50) | 69.77 (±3.51) | 71.13 (±4.82) |
| BMI (kg/m2) | 28.69 (±3.35) | 31.60 (±5.10) | 30.24 (±4.60) |
| Serum 25(OH)D (ng/ml) | 19.36 (±6.25) | 20.83 (±7.93) | 20.12 (±7.22) |
| Sample Size | 90 (46.4) | 104 (53.6) | 194 |
| Abbreviations: BMI, body mass index; SD, standard deviation. | |||
| SNP | Gene | HGVS ID | CHR | Position | A1 | A2 | Beta | SE (Beta) | P-value |
|---|---|---|---|---|---|---|---|---|---|
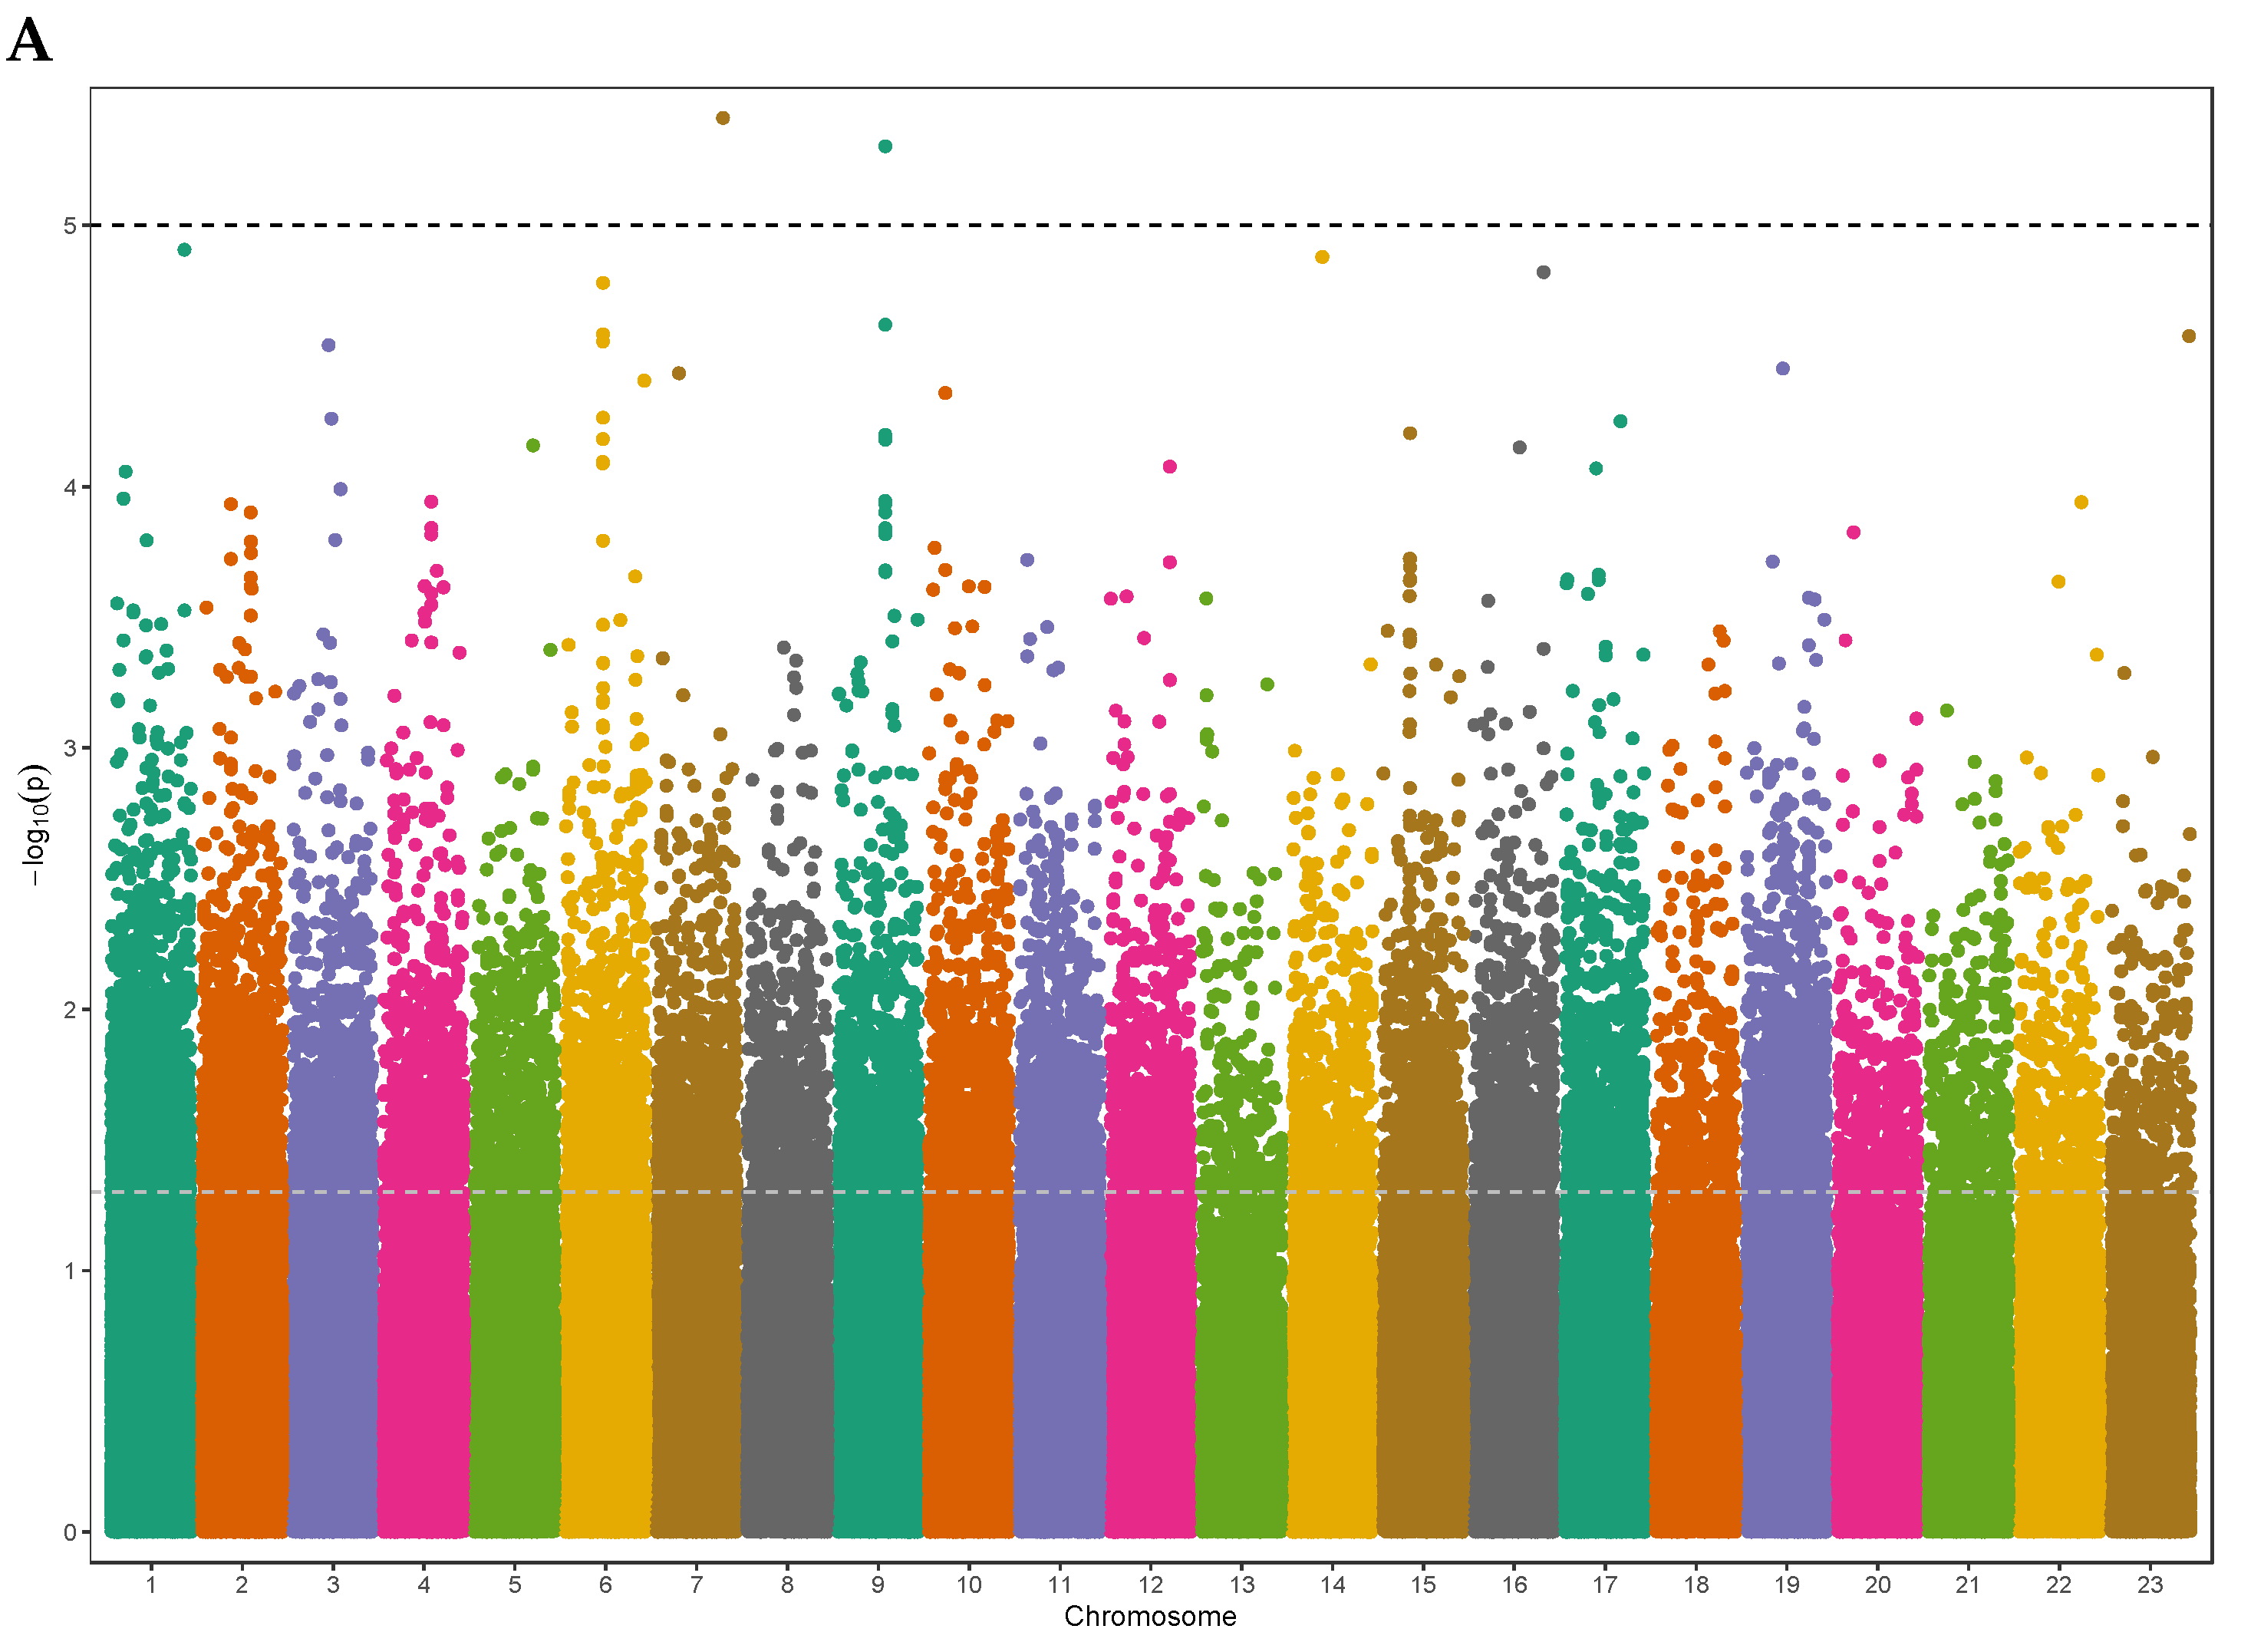
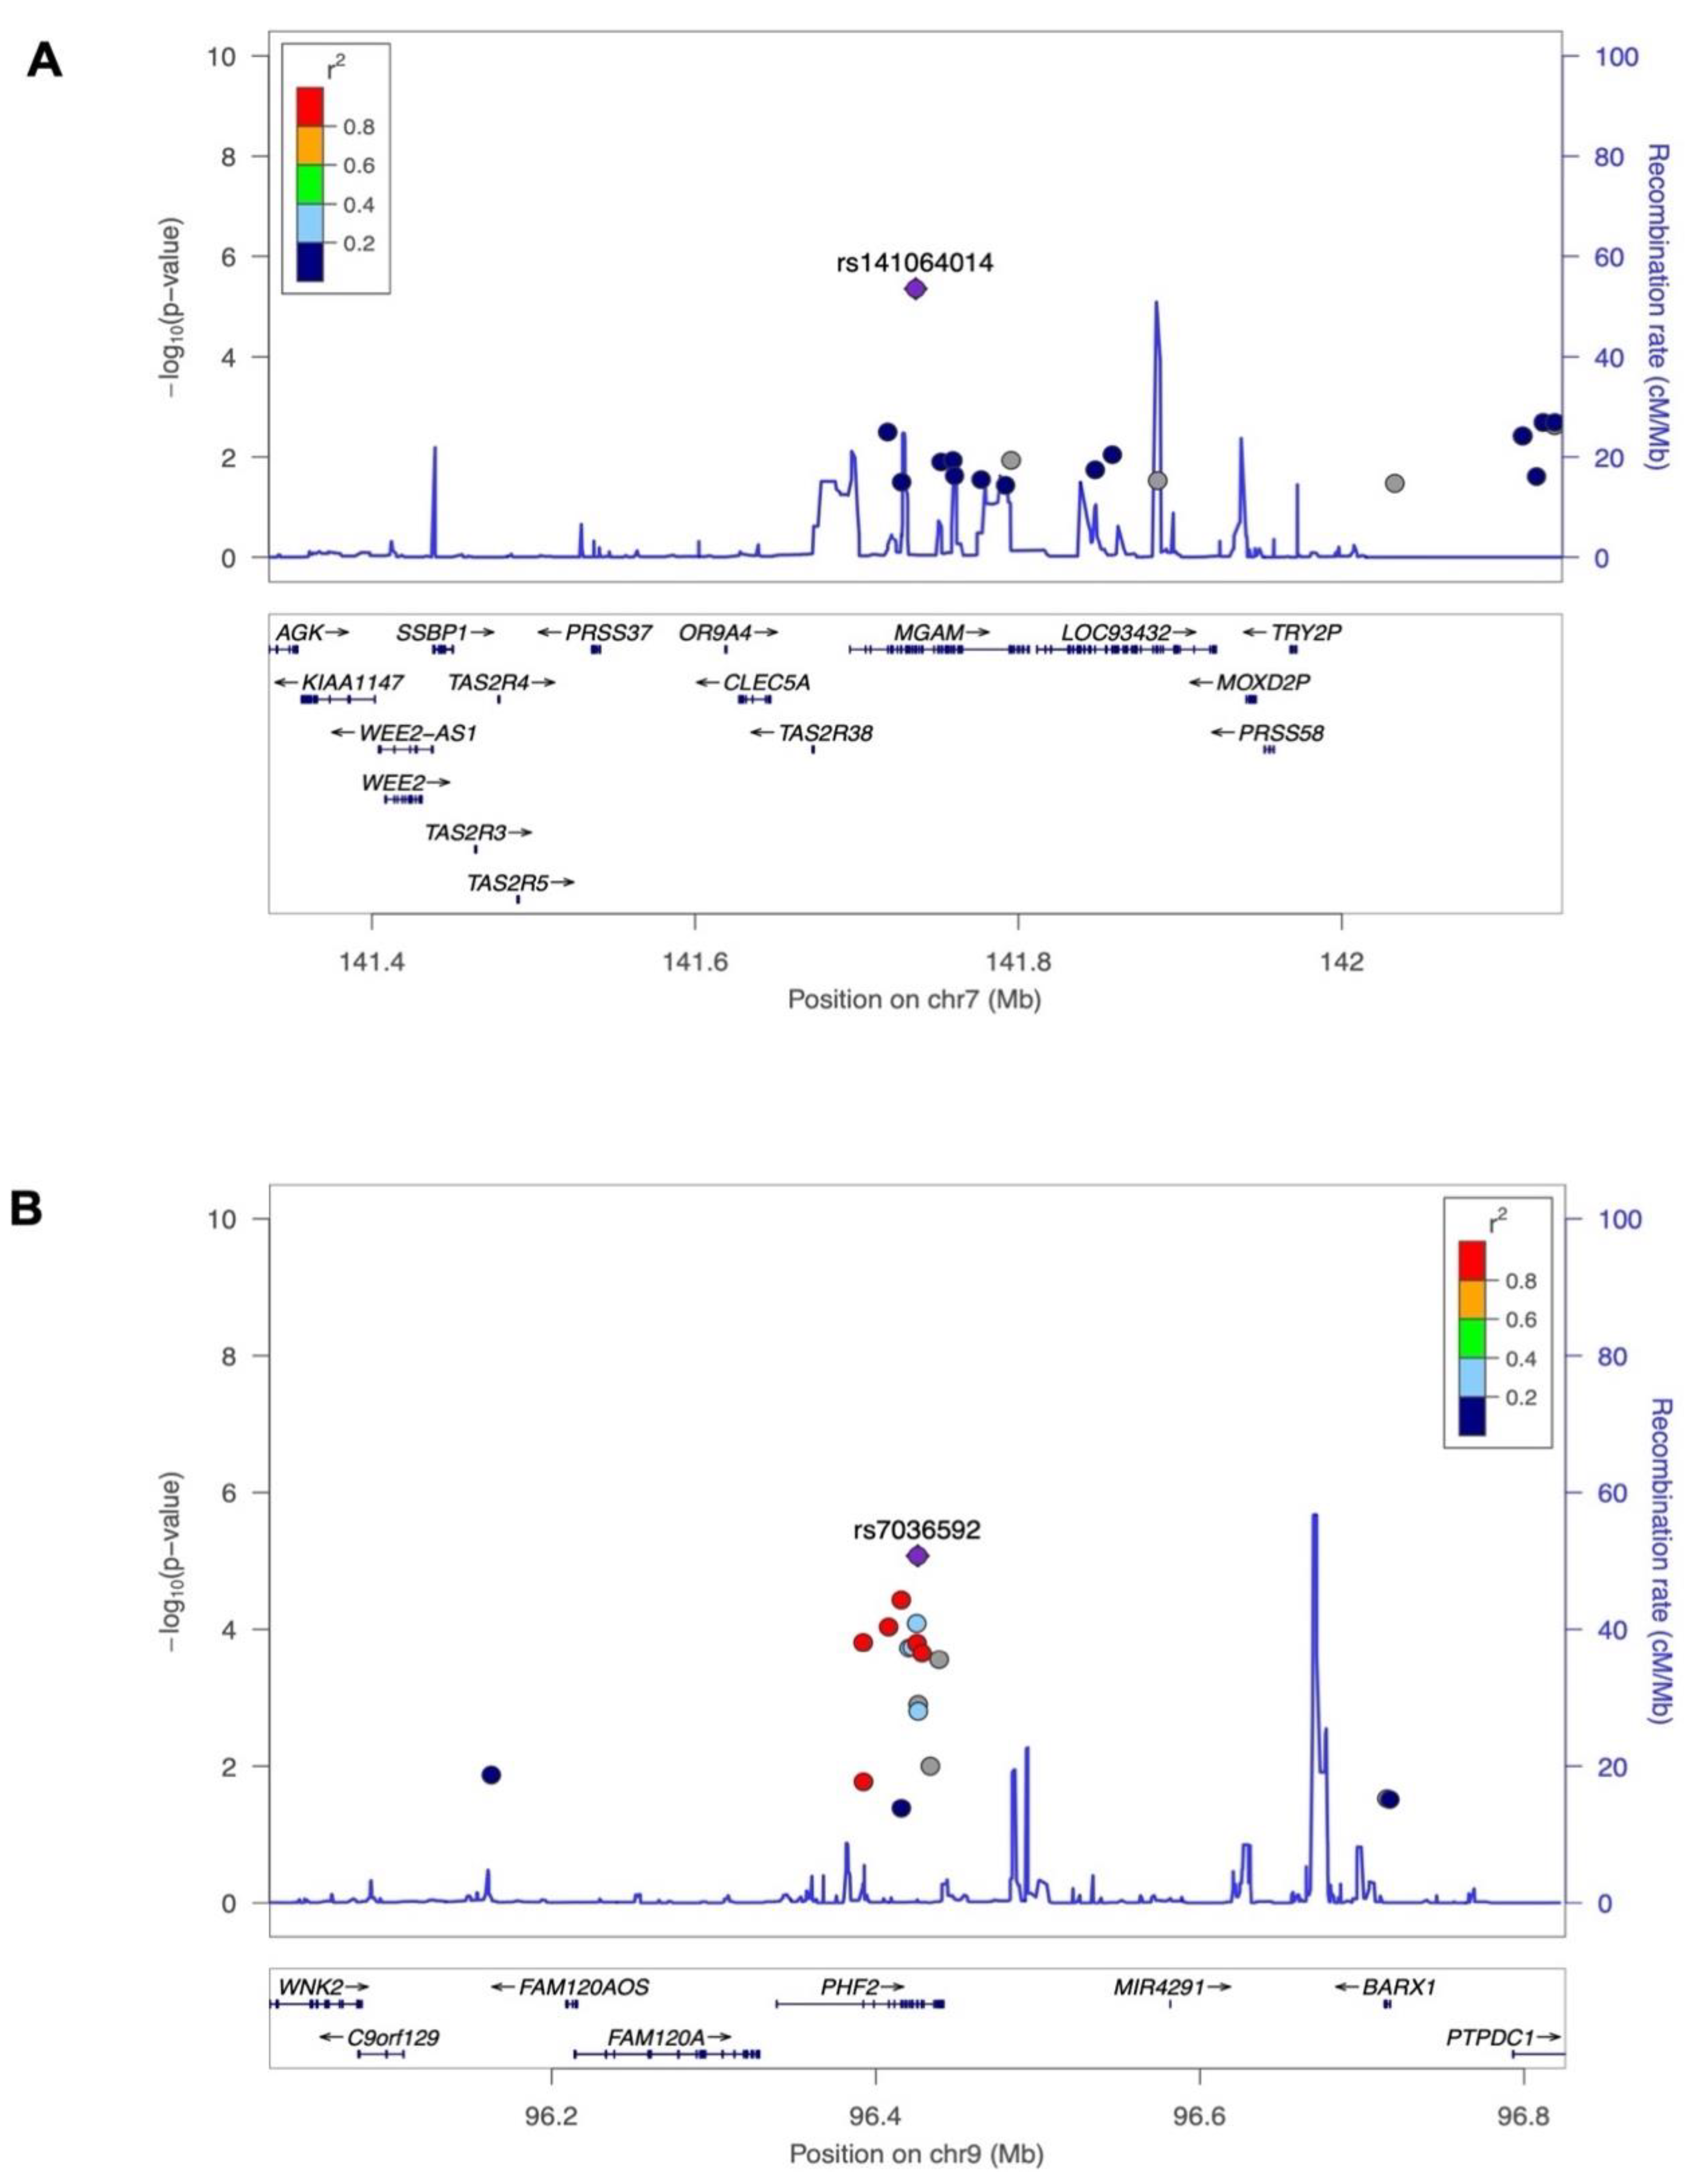
| rs141064014 | MGAM | NC_000007.13:g.141736273G>A | 7 | 141736273 | G | A | -2.38 | 0.52 | 4.4E-06 |
| rs7036592 | PHF2 | NC_000009.11:g.96425777C>T | 9 | 96425777 | C | T | -0.54 | 0.12 | 8.4E-06 |
| Populations | Frequency for rs141064014 in MGAM | Frequency for rs7036592 in PHF2 | Frequency for rs2725405 in SLC38A10 |
| Lebanese elderly population | 0.0103 | 0.2408 | 0.4845 |
| European population of ALFA | 0.00794 | 0.39533 | 0.5729 |
| Controls of gnomAD populations | |||
| European | 0.00634 | 0.3829 | 0.5468 |
| East Asian | 0.001 | 0.2136 | 0.3467 |
| African | 0.001 | 0.2783 | 0.9234 |
| All populations | 0.00553 | 0.3216 | 0.5084 |
| Abbreviations: gnomAD, Genome Aggregation Database; ALFA, Allele Frequency Aggregator. | |||
Disclaimer/Publisher’s Note: The statements, opinions and data contained in all publications are solely those of the individual author(s) and contributor(s) and not of MDPI and/or the editor(s). MDPI and/or the editor(s) disclaim responsibility for any injury to people or property resulting from any ideas, methods, instructions or products referred to in the content. |
© 2023 by the authors. Licensee MDPI, Basel, Switzerland. This article is an open access article distributed under the terms and conditions of the Creative Commons Attribution (CC BY) license (http://creativecommons.org/licenses/by/4.0/).


