Submitted:
08 June 2023
Posted:
09 June 2023
You are already at the latest version
Abstract
Keywords:
1. Introduction
2. Materials and Methods
2.1. Moiré superlattices
2.2. Samples and resistance measurements
3. Phase diagrams of Moiré superconductors and comparison with HTSc materials
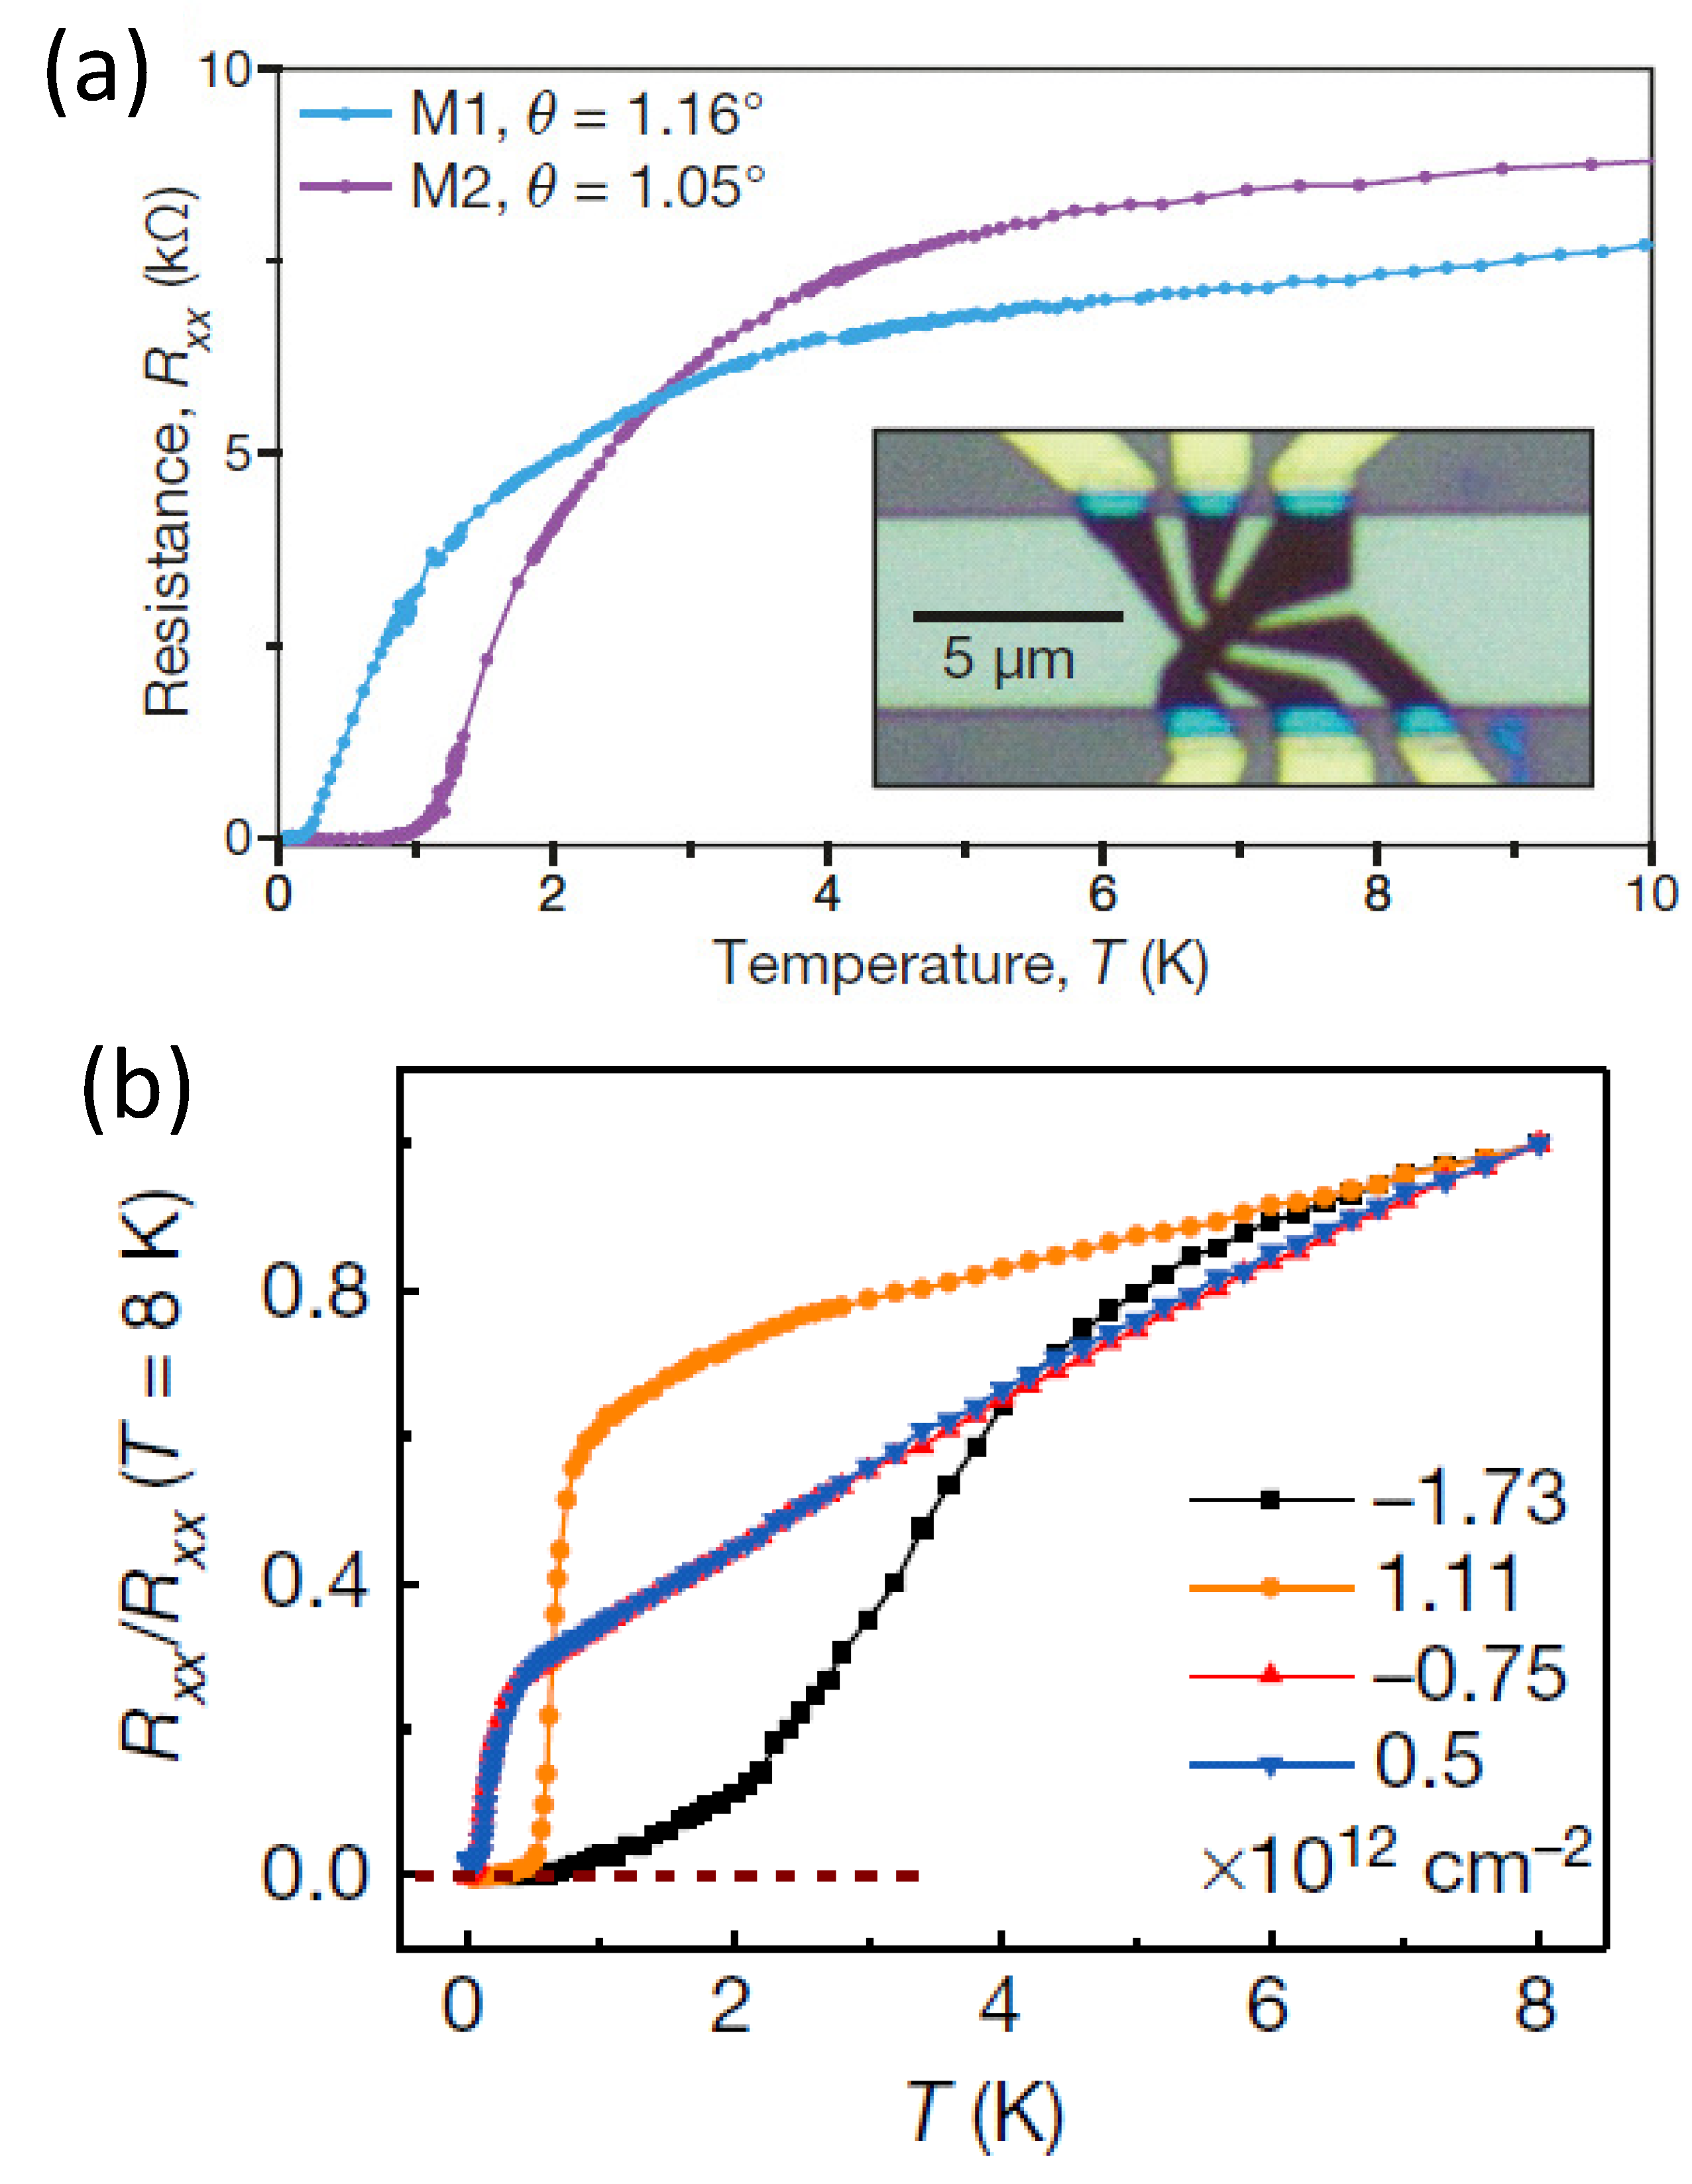
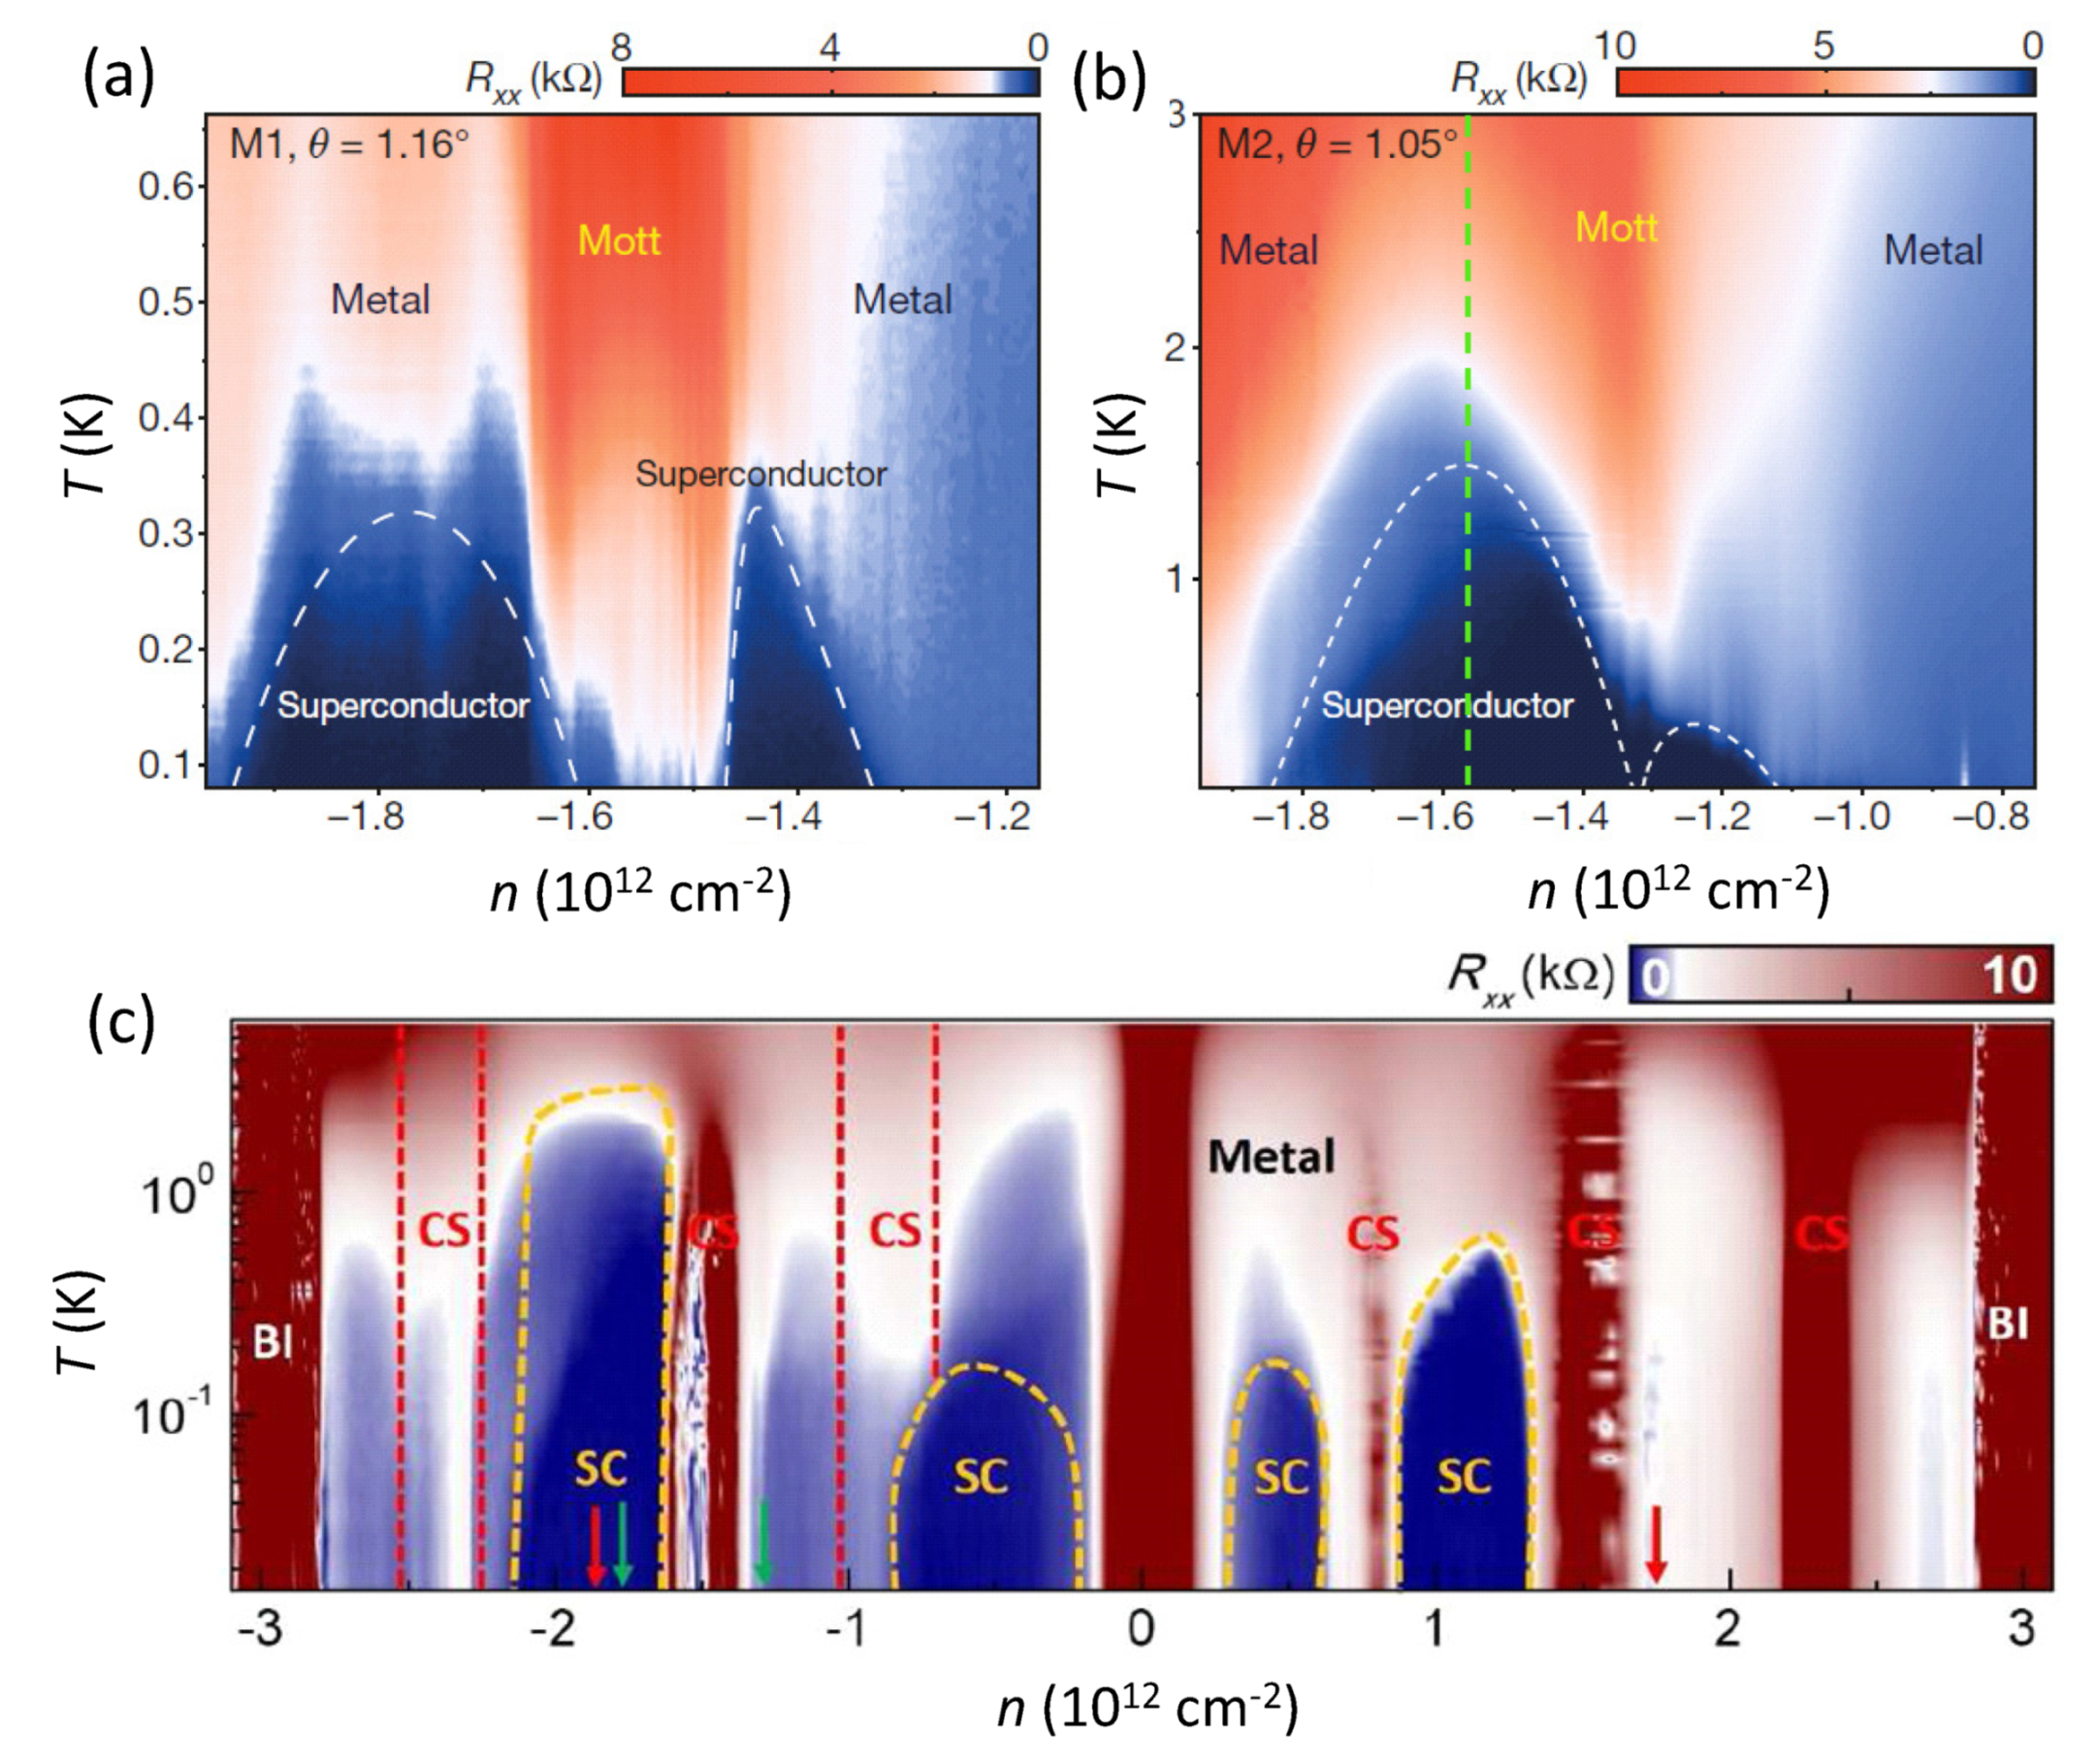
- The experiments and analyses indicated that the charge carriers in tBLG are Cooper pairs.
- Superconductivity in the Moiré superconductors shows a reduced level of superconducting charge carriers (∼1.58 × 10 cm).
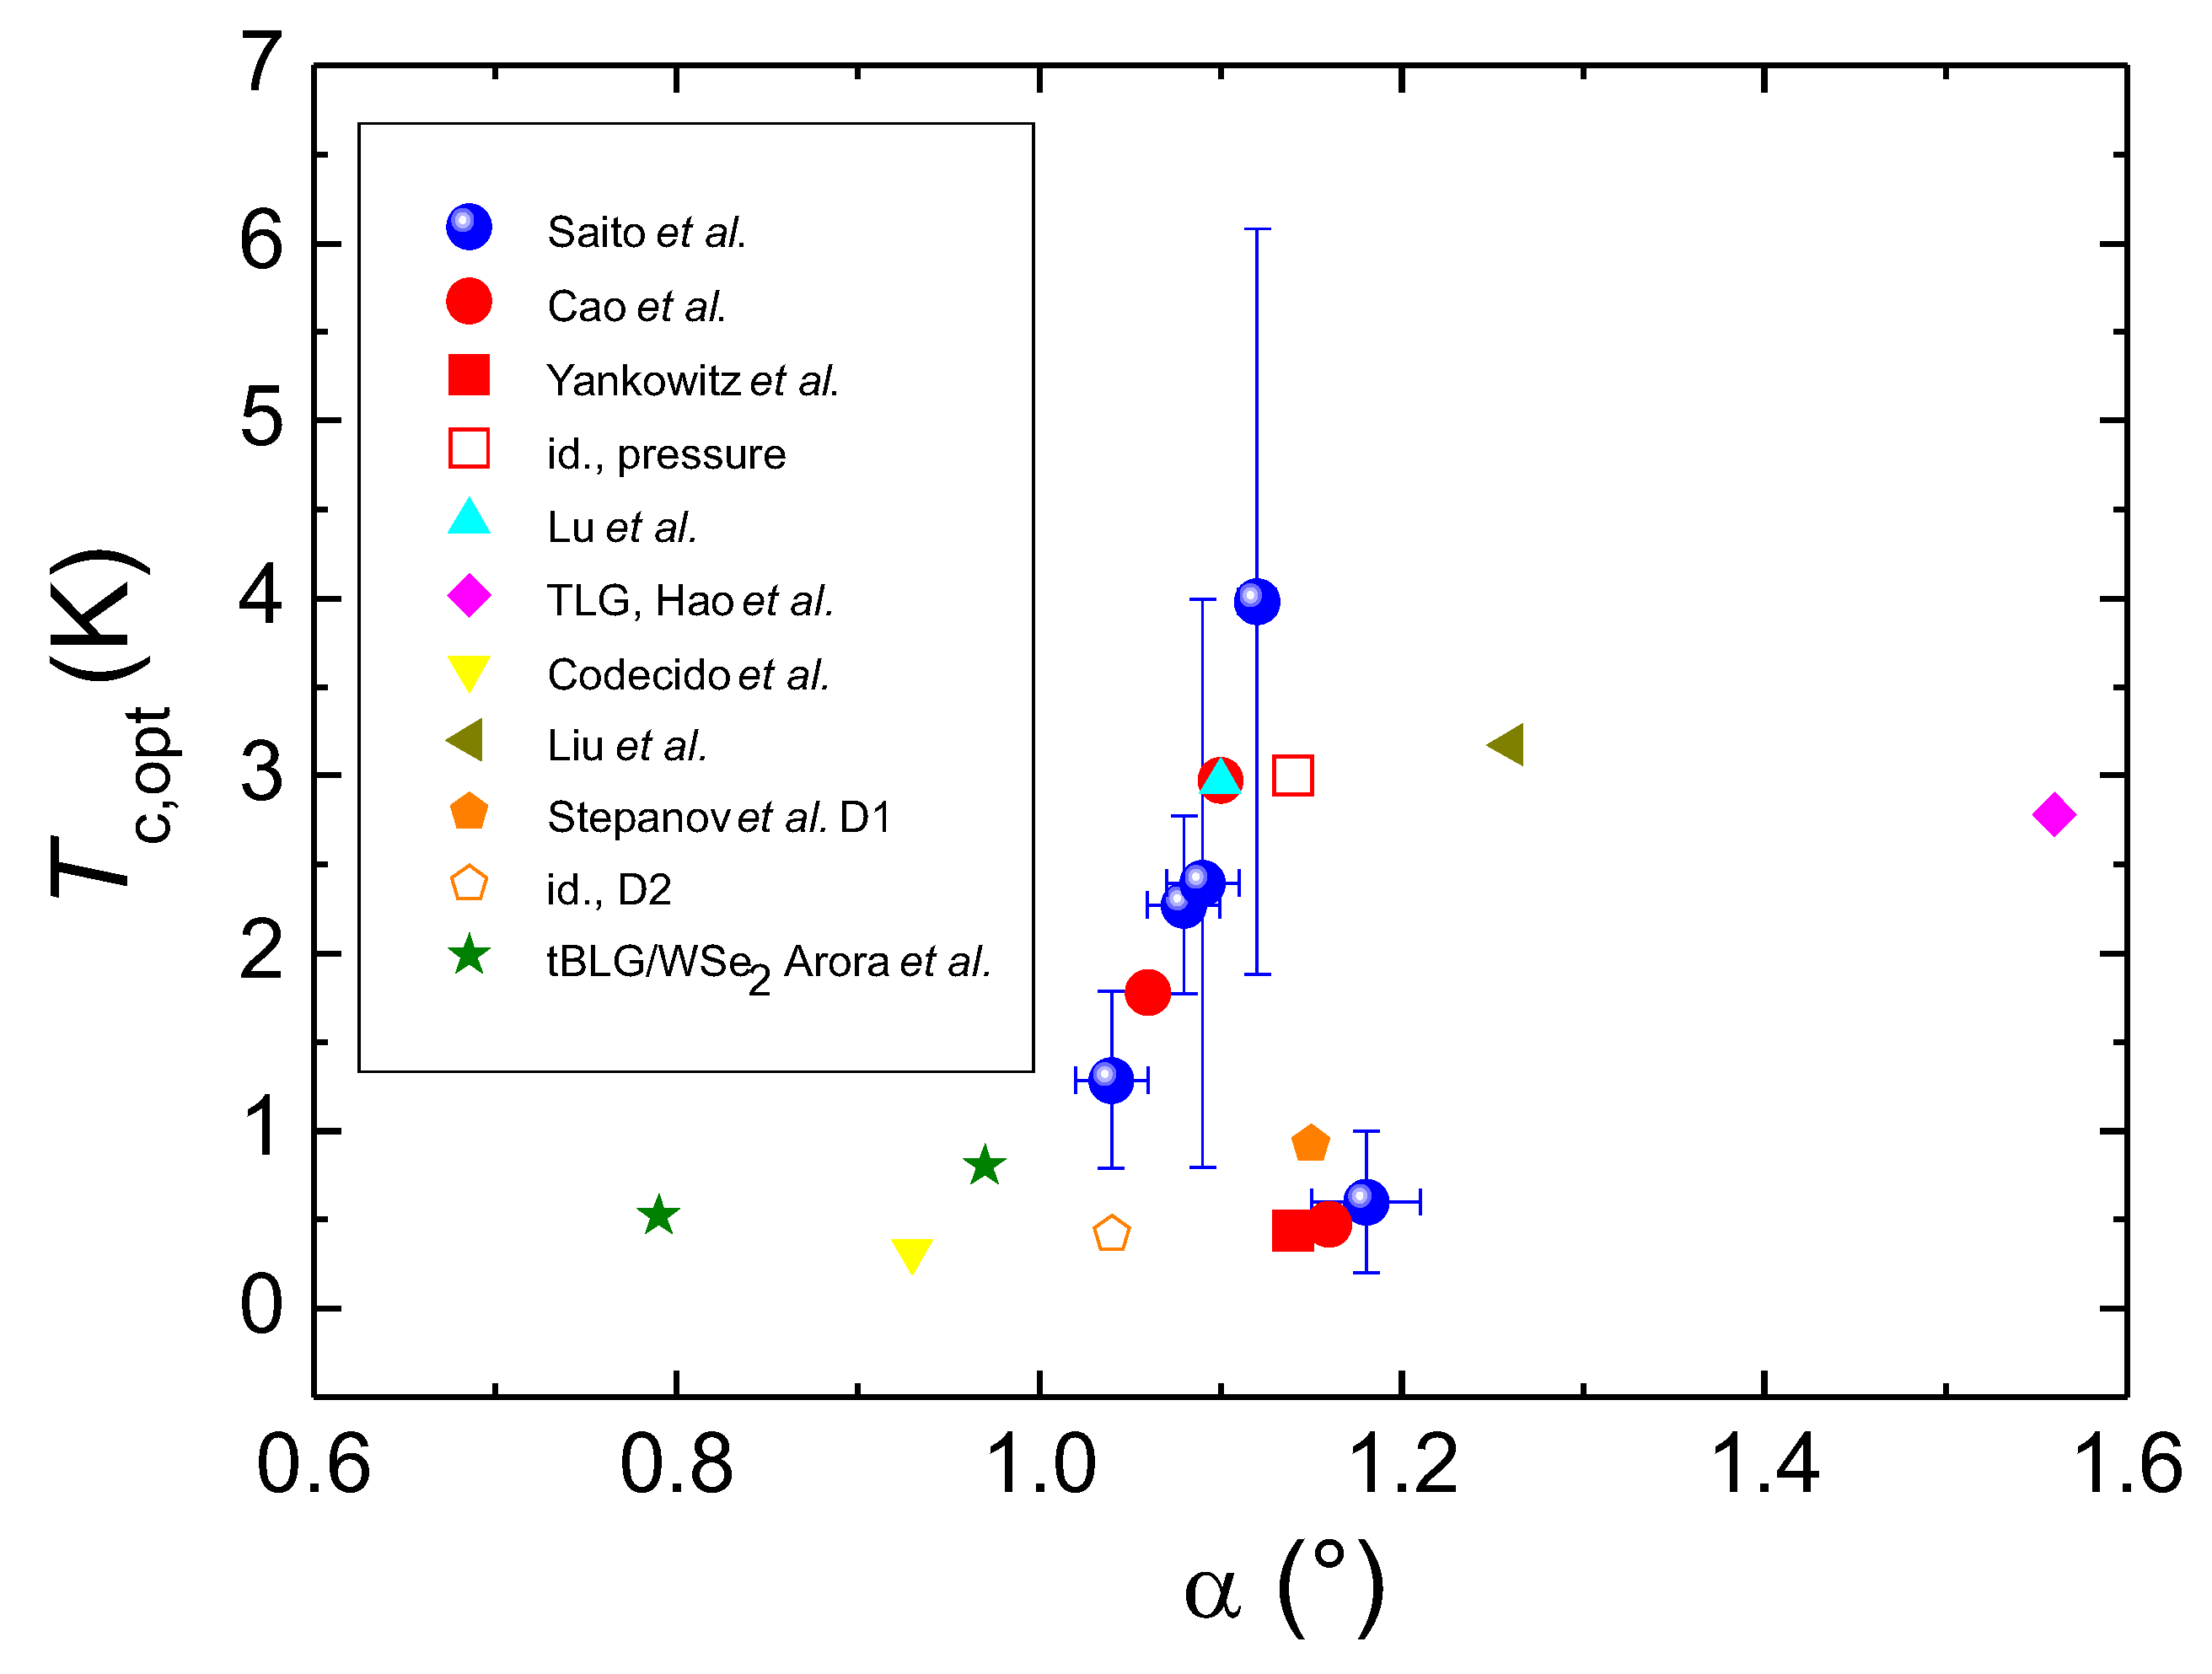
- The maximum value of is obtained close to the magic angle of 1.1° (see Figure 6).
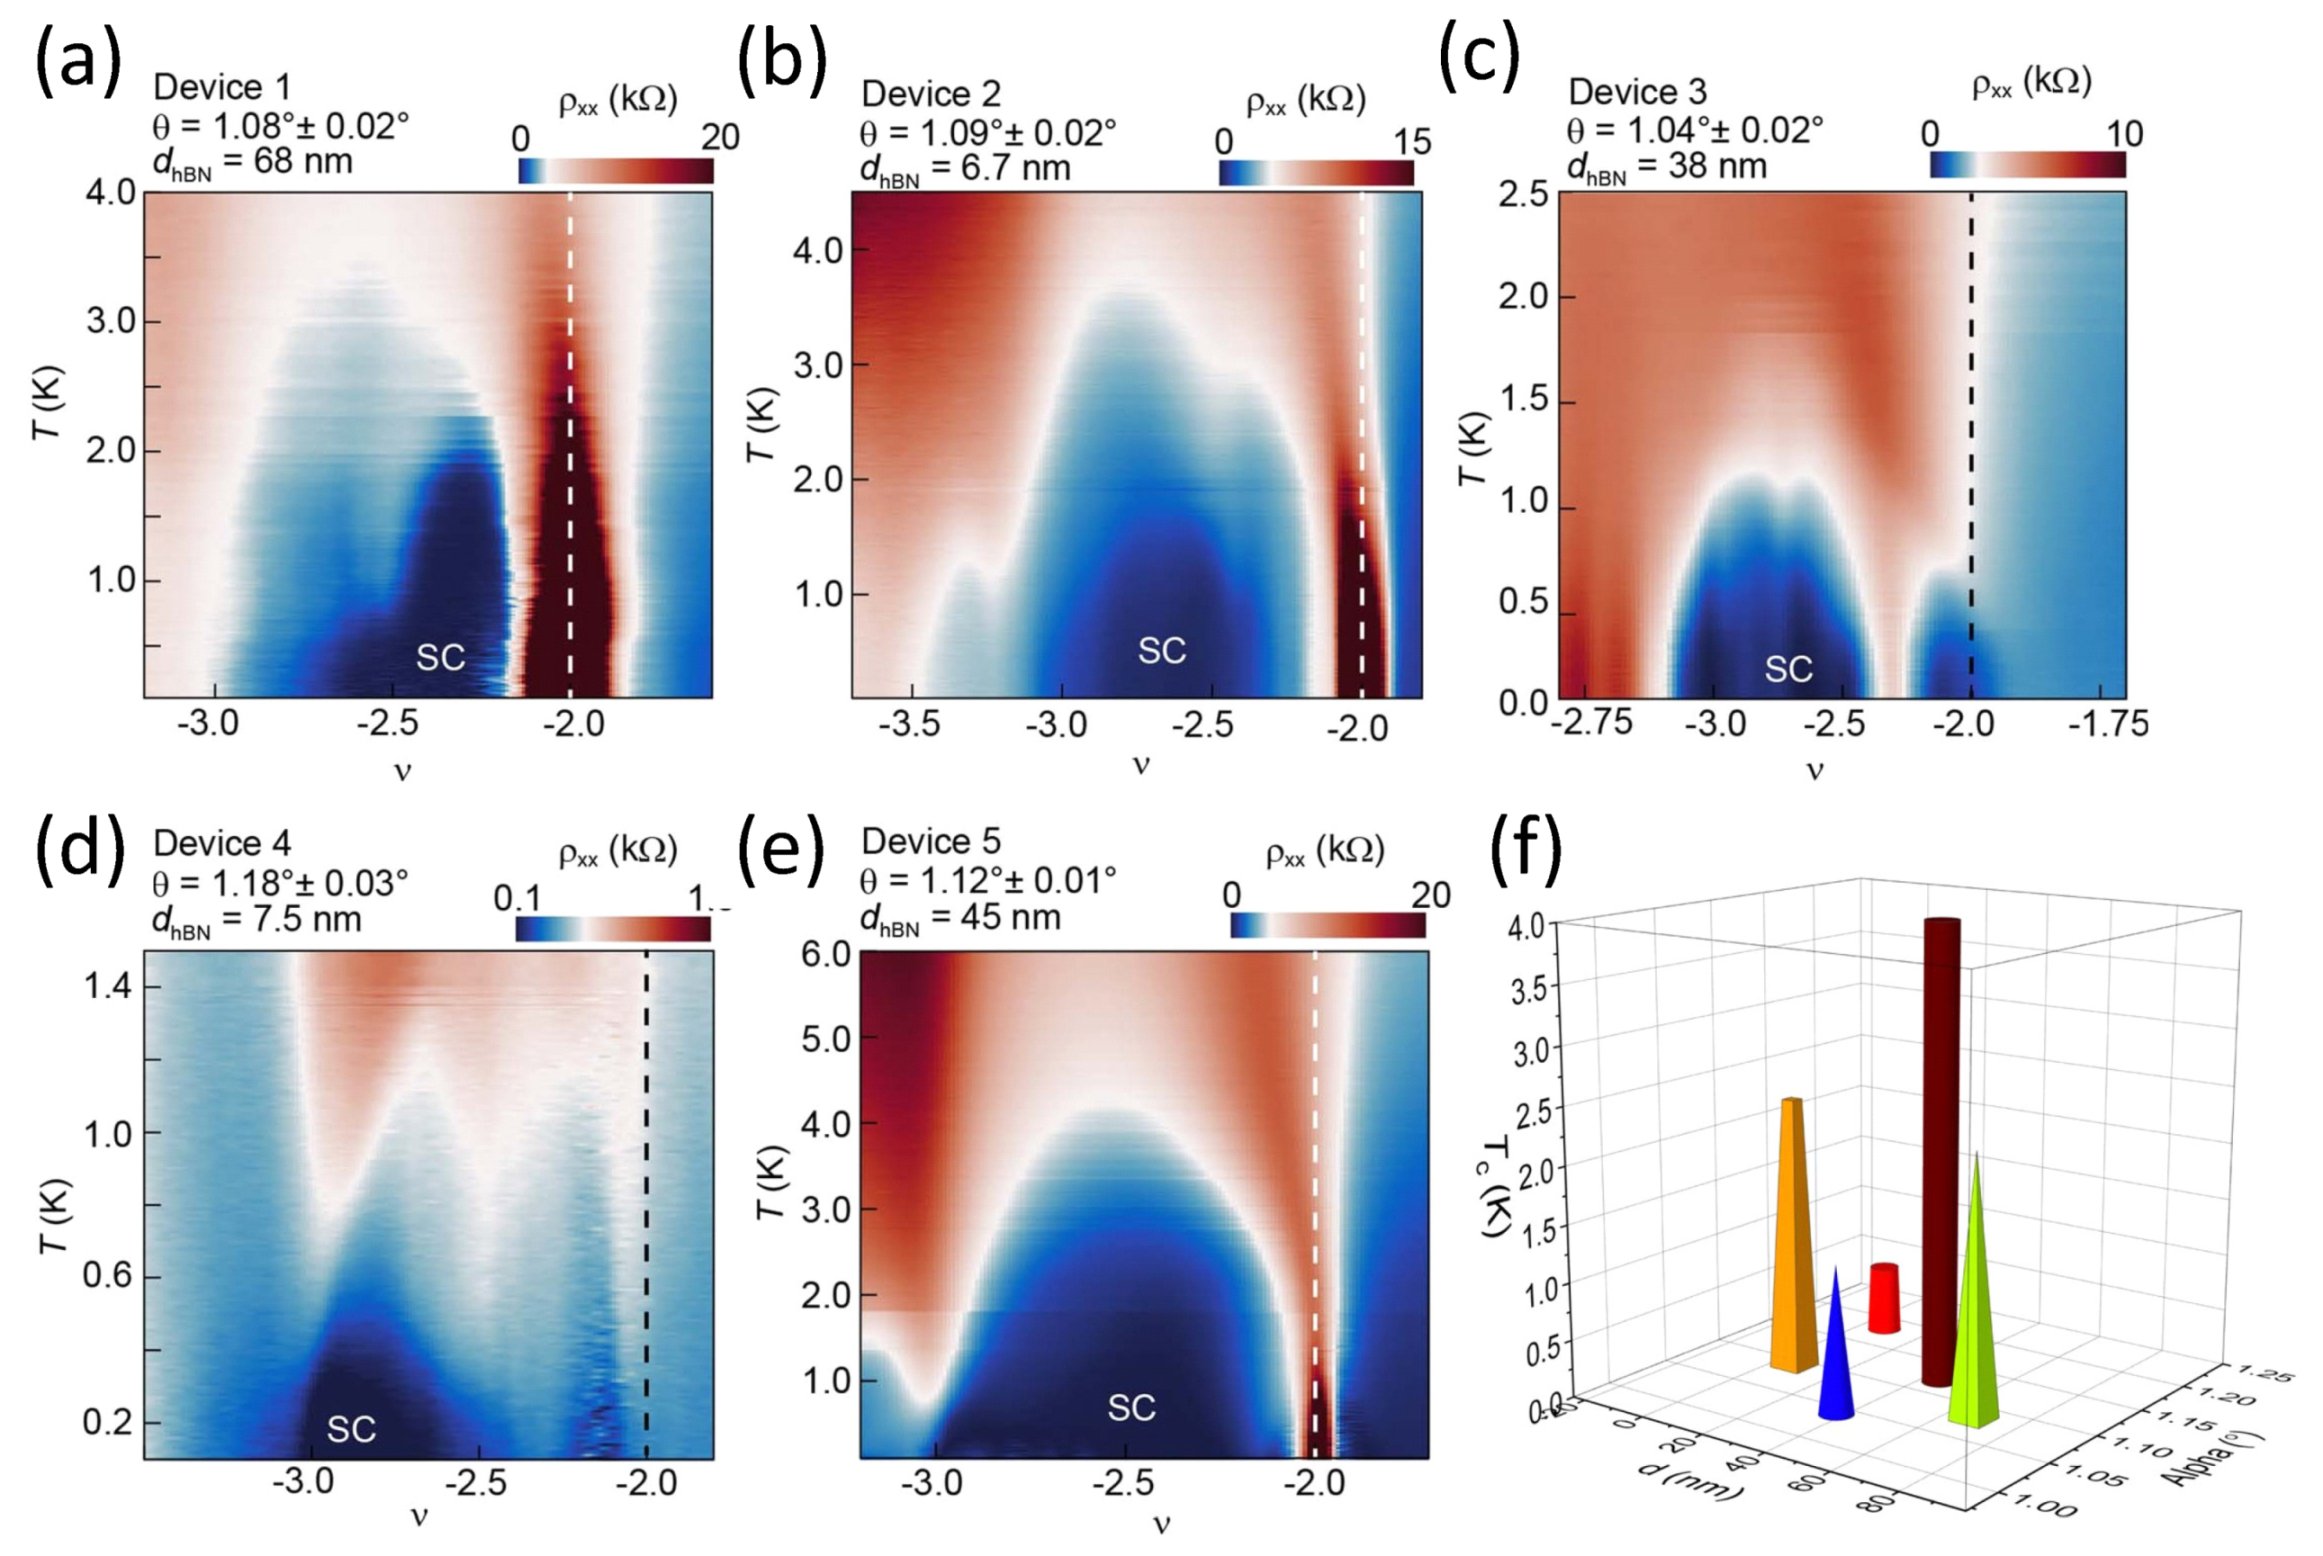
- Increasing the thickness of the h-BN layer as done in the experiments of Saito et al. [10] increases the maximum recorded values of , but does not change the superconducting electron density (−2.5).
4. Roeser-Huber formalism
5. Application of the Roeser-Huber formalism to Moiré superconductivity
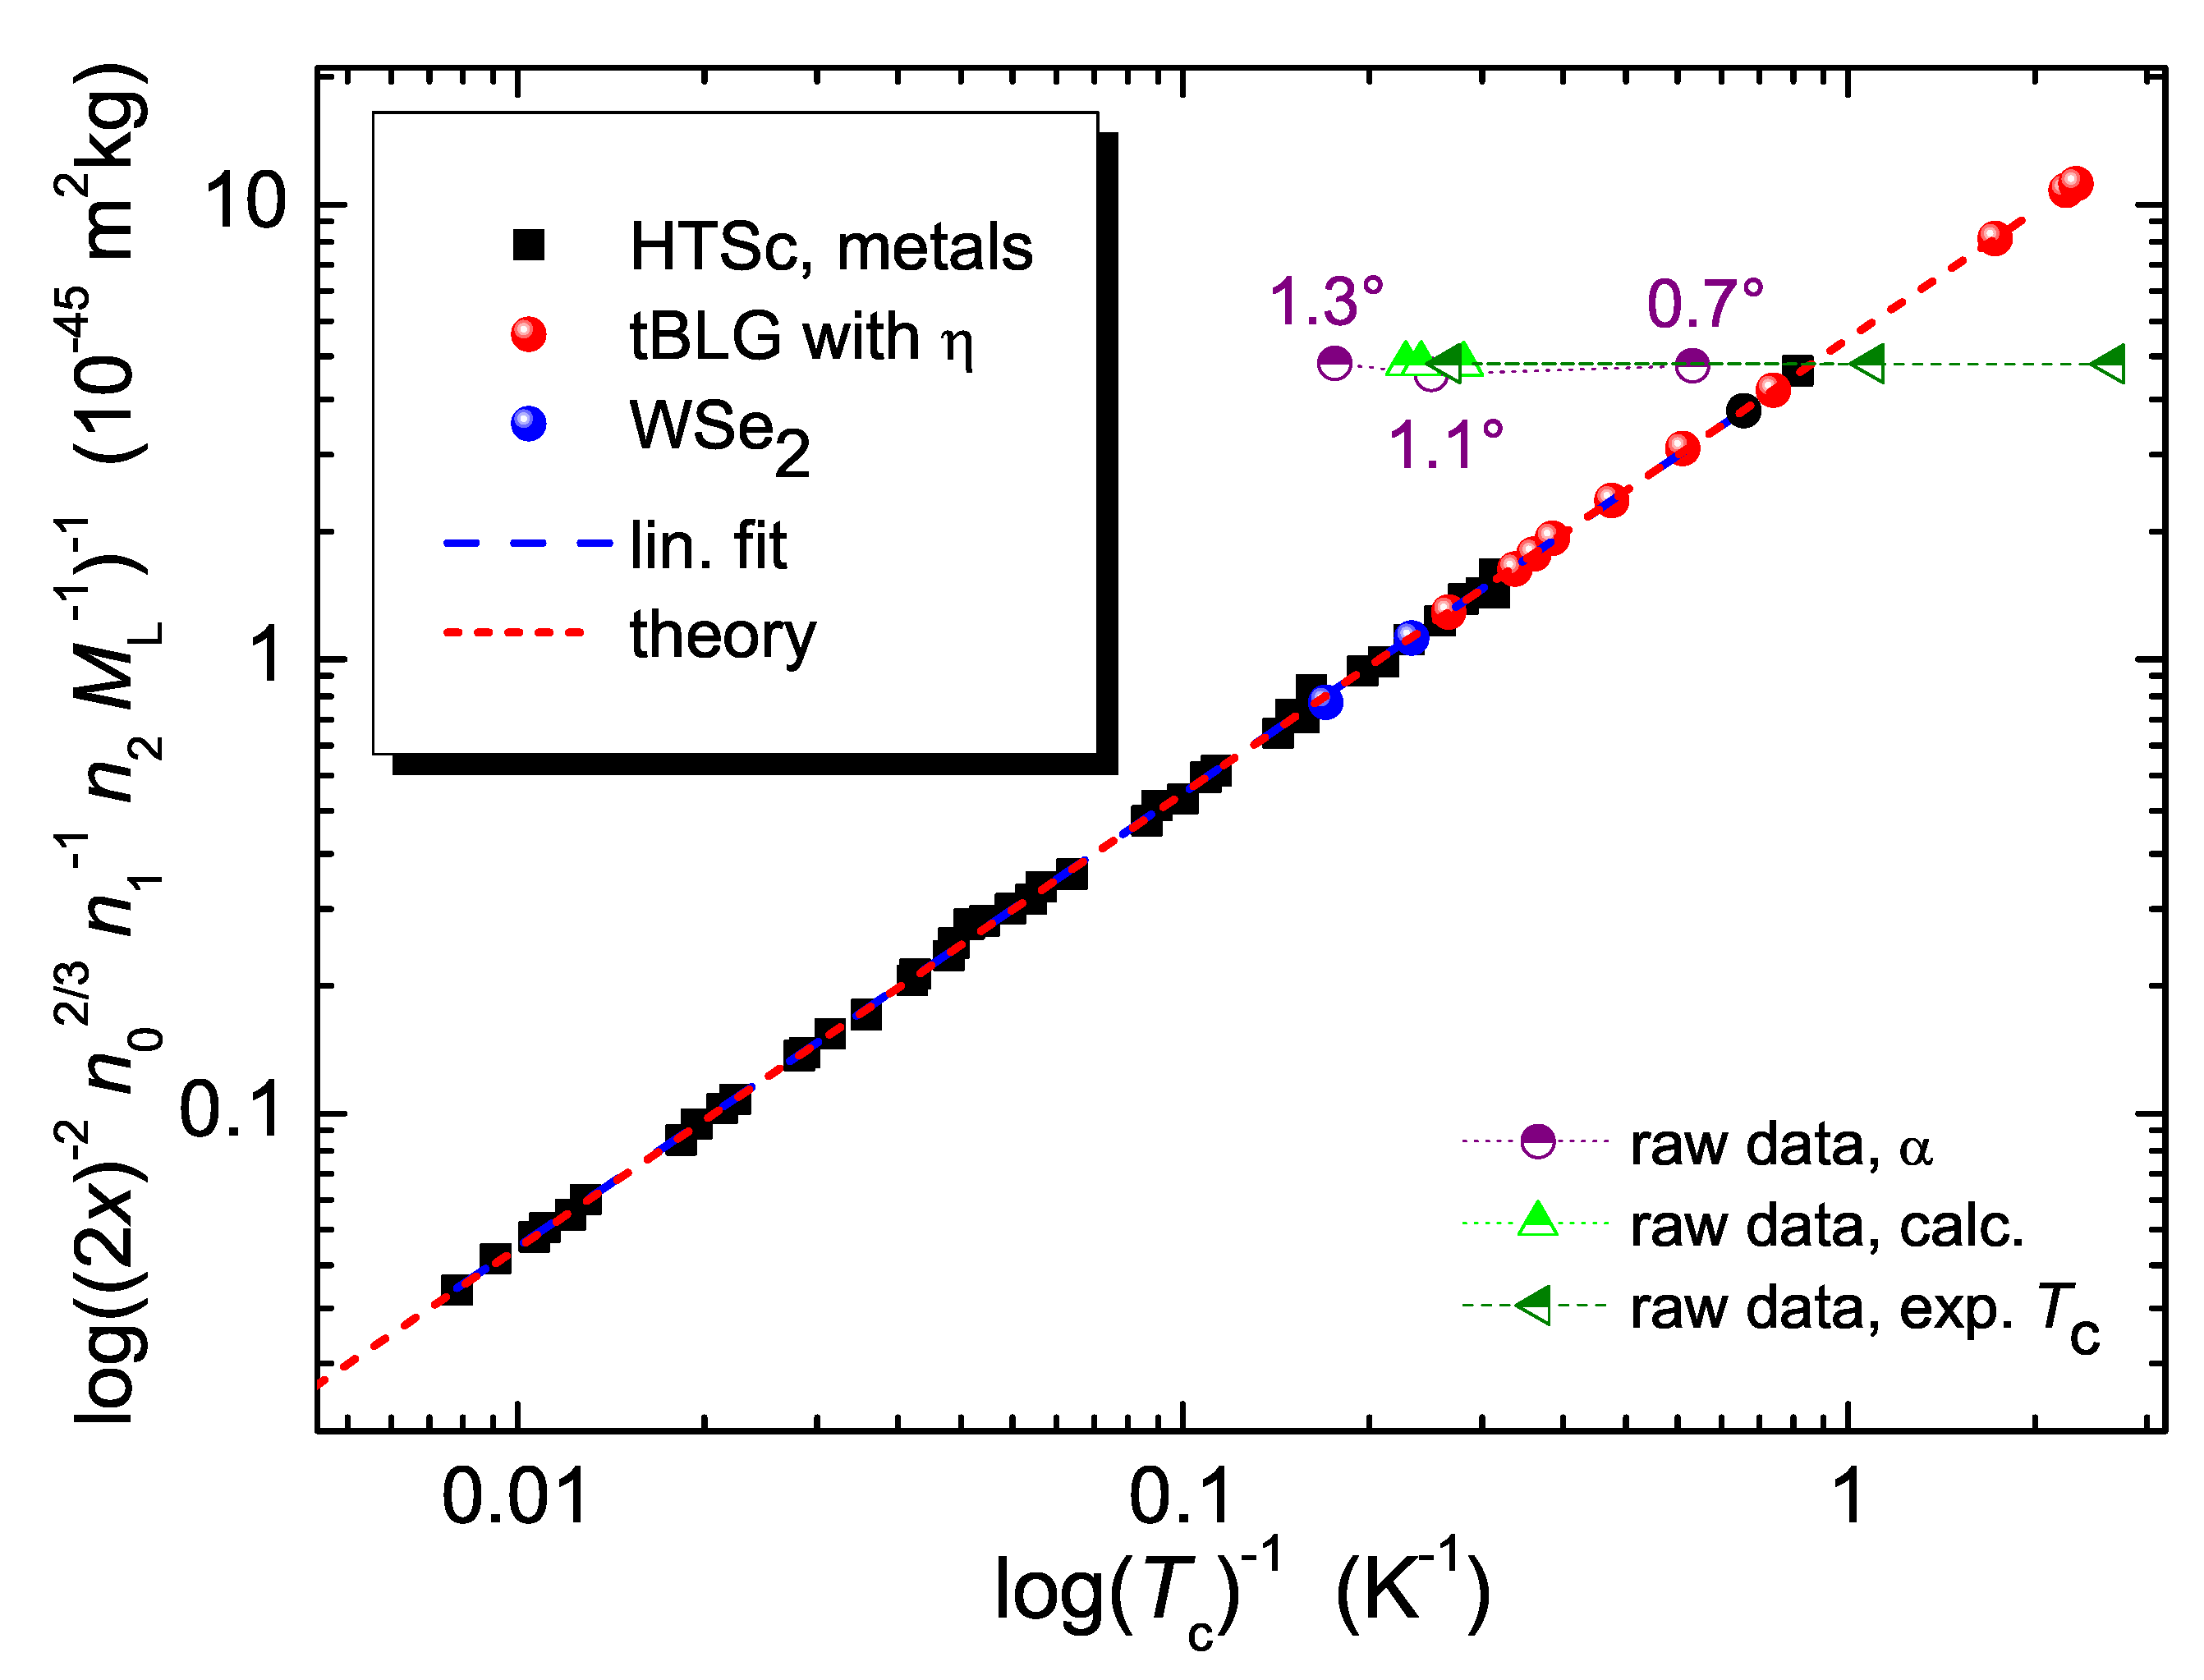
 ) in Figure 8. The black squares (
 ) correspond to the data obtained for various metals and HTSc as published in Ref. [74]. The linear fit to these data (dashed-blue line,
  ) is almost perfect (i.e., close to the dashed red line) with only a small error margin, which manifests the basic idea of the Roeser-Huber formalism.
| type | tilt angle | x | comment/ | Ref. | ||||||
|---|---|---|---|---|---|---|---|---|---|---|
| [] | [K] | [nm] | [10 J] | [K] | [10 J] | [K] | sample name | |||
| tBLG | 1.1 | – | 12.81 | 1.835 | 4.23 | — | — | — | 1 | magic angle |
| 1.1 | – | 12.81 | 2.912 | 6.714 | — | — | — | 2 | ||
| tBLG | 1.16 | 0.47 | 12.15 | 2.040 | 4.704 | 0.204 | 0.470 | 20 | M1 | Cao et al. [1,2] |
| 1.05 | 1.7 | 13.42 | 1.671 | 3.854 | 0.740 | 1.705 | 4.52 | M2 | Cao et al. [1,2] | |
| 1.14 | 0.6 | 12.36 | 1.971 | 4.542 | 0.197 | 0.454 | 20 | D1 | Yankowitz et al. [3] | |
| 1.27 | 3 | 11.10 | 2.446 | 5.638 | 1.304 | 3.007 | 3.75 | D2 | Yankowitz et al. [3] | |
| (1.33 GPa) | ||||||||||
| 1.08 | 2.27 | 13.05 | 1.768 | 4.877 | 0.982 | 2.265 | 3.6 | device 1 | Saito et al. [10] | |
| 1.09 | 2.395 | 12.93 | 1.801 | 4.153 | 1.044 | 2.408 | 3.45 | device 2 | Saito et al. [10] | |
| 1.04 | 1.29 | 13.55 | 1.639 | 3.781 | 0.561 | 1.295 | 5.84 | device 3 | Saito et al. [10] | |
| 1.12 | 3.98 | 12.58 | 1.902 | 4.385 | 2.606 | 3.986 | 2.2 | device 5 | Saito et al. [10] | |
| 1.18 | 0.6 | 11.94 | 2.111 | 4.867 | 1.792 | 0.601 | 16.2 | device 4 | Saito et al.[10] | |
| 1.1 | 0.25 | 12.81 | 1.835 | 4.23 | 1.287 | 2.968 | 2.85 | – | Lu et al. [6] | |
| 0.93 | <0.5 † | 15.16 | 1.311 | 3.024 | 0.139 | 0.32 | 18.9 | smallest | Codecido et al. [7] | |
| 1.26 | <3.5 ‡ | 11.19 | 2.407 | 5.550 | 1.376 | 3.171 | 3.5 | – | Liu et al. [8] | |
| 1.15 | 0.92 | 12.26 | 2.005 | 4.632 | 0.401 | 0.925 | 10 | D1 | Stepanov et al. [9] | |
| 1.04 | 0.4 | 13.55 | 1.640 | 3.781 | 0.786 | 0.398 | 19 | D2 | Stepanov et al. [9] | |
| TLG | 1.56 | 2.7 | 9.035 | 3.69 | 8.507 | 1.19 | 2.784 | 6.2 | – | Hao et al. [12] |
| tBLG+ | 0.97 | 0.8 | 14.53 | 1.43 | 3.289 | 0.348 | 0.802 | 8.2 | D1 | Arora et al. [14] |
| WSe | 0.79 | 0.52 | 12.73 | 0.946 | 2.182 | 0.225 | 0.520 | 8.4 | D3 | |
| bi-layer | 1 | 3.32* | 18.89 | 0.844 | 1.95 ( 1) | — | — | — | E7, -14.4 V | An et al. [15] |
| WSe | 1 | 3 | 18.89 | 1.340 | 3.09 ( 2) | — | — | — | –,– | |
| 1 | 3 | 20 | 0.753 | 1.74 ( 1) | — | — | — | –,– | ||
| 1 | 3 | 20 | 1.195 | 2.76 ( 2) | — | — | — | –,– | ||
| 2 | 4.53* | 9.45 | 3.376 | 7.78 ( 1) | 1.963 | 4.53 | 3.44 | F2, -6.65 V | ||
| 2 | 6.1* | 9.45 | 3.376 | 7.78 ( 1) | 2.648 | 6.11 | 2.55 | F2, -6.92 V | ||
| 4 | 6 (50%)** | 4.72 | 13.5 | 31.1 ( 1) | — | — | — | D11, -17.9 V |
6. Conclusions and outlook
Author Contributions
Funding
Institutional Review Board Statement
Informed Consent Statement
Data Availability Statement
Conflicts of Interest
References
- Yuan Cao, Y.; Fatemi, V.; Demir, A.; Fang, S.; Tomarken, S.L.; Luo, J.Y.; Sanchez-Yamagishi, J.D.; Watanabe, K.; Taniguchi, T.; Kaxiras, E.; Ashoori, R.C.; Jarillo-Herrero, P. Correlated insulator behaviour at half-filling in magic-angle graphene superlattices. Nature 2018, 55, 80–84. [Google Scholar] [CrossRef]
- Cao, Y.; Fatemi, V.; Fang, S.; Watanabe, K.; Taniguchi, T.; Kaxiras, E.; Jarillo-Herrero, P. Unconventional superconductivity in magic-angle graphene superlattices. Nature 2018, 2018 556, 43–50. [Google Scholar] [CrossRef]
- Yankowitz, M.; Chen, S.; Polshyn, H.; Zhang, Y.; Watanabe, K.; Taniguchi, T.; Graf, D.; Young, A. F.; Dean, C. R. Tuning superconductivity in twisted bilayer graphene. Science 2019, 2019 363, 1059–1064. [Google Scholar] [CrossRef]
- Suárez Morell, E.; Correa, J.D.; Vargas, P.; Pacheco, M.; Barticevic, Z. Flat bands in slightly twisted bilayer graphene: tight-binding calculations. Phys. Rev. B 2010, 82, 121407. [Google Scholar] [CrossRef]
- Trambly de Laissardière, G.; Mayou, D.; Magaud, L. Localization of Dirac Electrons in Rotated Graphene Bilayers. Nano Lett. 2010, 10, 804–808. [Google Scholar] [CrossRef] [PubMed]
- Lu, X.; Stepanov, P.; Yang, W.; Xie, M.; Ali Aamir, M.; Das, I.; Urgell, C.; Watanabe, K.; Taniguchi, T.; Zhang, G.; Bachtold, A.; MacDonald, A. H.; Efetov, D. K. Superconductors, orbital magnets and correlated states in magic-angle bilayer graphene. Nature 2019, 2019 574, 653–657. [Google Scholar] [CrossRef]
- Codecido, E.; Wang, Q.; Koester, R.; Che, S.; Tian, H.; Lv, R.; Tran, S.; Watanabe, K.; Taniguchi, T.; Zhang, F.; Bockrath, M.; Lau, C. N. Correlated insulating and superconducting states in twisted bilayer graphene below the magic angle. Sci. Adv. 2019, 2019 5, eaaw9770. [Google Scholar] [CrossRef]
- Liu, X.; Hao, Z.; Khalaf, E.; Lee, J.-Y.; Watanabe, K.; Taniguchi, T.; Vishwanath, A.; Kim, P. Tunable spin-polarized correlated states in twisted double bilayer graphene. Nature 2020, 2020 583, 221–225. [Google Scholar] [CrossRef]
- Stepanov, P.; Das, I.; Lu, X.; Fahimniya, A.; Watanabe, K.; Taniguchi, T.; Koppens, F. H. L.; Lischner, J.; Levitov, L.; Efetov, F. K. Untying the insulating and superconducting orders in magic-angle graphene. Nature 2020, 2020 583, 375–378. [Google Scholar] [CrossRef]
- Saito, Y.; Ge, J.; Watanabe, K.; Taniguchi, T.; Young, A. F. Independent superconductors and correlated insulators in twisted bilayer graphene. Nature Phys 2020, 16, 926–930. [Google Scholar] [CrossRef]
- Talantsev, E. F.; Mataira, R. C.; Crump, W. P. Classifying superconductivity in Moiré graphene superlattices. Sci. Rep. 2020, 10, 212. [Google Scholar] [CrossRef] [PubMed]
- Hao, Z.; Zimmerman, A. M.; Ledwith, P.; Khalaf, E.; Najafabadi, D. H.; Watanabe, K.; Taniguchi, T.; Vishwanath, A.; Kim, P. Electric field–tunable superconductivity in alternating-twist magic-angle trilayer graphene. Science 2021, 2021 371, 1133–1138. [Google Scholar] [CrossRef]
- Guorui Chen, C.; Sharpe, A.L.; Gallagher, P.; Rosen, I.T.; Fox, E.J.; Jiang, L.; Lyu, B.; Li, H.; Watanabe, K.; Taniguchi, T.; Jung, J.; Shi, Z.; Goldhaber-Gordon, D.; Zhang, Y.; Wang, F. Signatures of tunable superconductivity in a trilayer graphene moiré superlattice. Nature 2019, 572, 215–219. [Google Scholar] [CrossRef] [PubMed]
- Arora, H. S.; Polski, R.; Zhang, Y.; Thomson, A.; Choi, Y.; Kim, H.; Lin, Z.; Wilson, I. Z.; Xu, X.; Chu, J.-H.; Watanabe, K.; Taniguchi, T.; Alicea, J.; Nadj-Perge, S. Superconductivity in metallic twisted bilayer graphene stabilized by WSe2. Nature 2020, 2020 583, 379–384. [Google Scholar] [CrossRef]
- An, L.; Cai, X.; Pei, D.; Huang, M.; Wu, Z.; Zhou, Z.; Lin, J.; Ying, Z.; Ye, Z.; Feng, X.; Gao, R.; Cacho, C.; Watson, M.; Chen, Y.; and Wang, N. Interaction effects and superconductivity signatures in twisted double-bilayer WSe2. Nanoscale Horiz. 2020, 2020 5, 1309. [Google Scholar] [CrossRef]
- Balents, L.; Dean, C. R.; Efetov, D. K.; Young, A. F. Superconductivity and strong correlations in moiré flat bands. Nature Phys. 2020, 2020 16, 725–733. [Google Scholar] [CrossRef]
- Liao, M.; Zang, Y.; Guan, Z.; Li, H.; Gong, Y.; Zhu, K.; Hu, X.-P.; Zhang, D.; Xu, Y.; Wang, Y.-Y.; He, K.; Ma, X.-C.; Zhang, S.-C.; Xue, Q.-K. Superconductivity in few-layer stanene. Nature Phys. 2018, 14, 344–348. [Google Scholar] [CrossRef]
- Yan, L.; Liu, P.-F.; Li, H.; Tang, Y.; He, J.; Huang, X.; Wang, B.-T.; Zhou, L. Theoretical dissection of superconductivity in two-dimensional honeycomb borophene oxide B2O crystal with a high stability. npj Computational Materials 2020, 6, 94. [Google Scholar] [CrossRef]
- Bistritzer, R.; MacDonald, A. H. Moiré bands in twisted double-layer graphene. Proc. Natl. Acad. Sci. 2011, 2011 108, 12233–12237. [Google Scholar] [CrossRef]
- Wu, F.; Hwang, E.; Das Sarma, S. Phonon-induced giant linear-in-T resistivity in magic angle twisted bilayer graphene: Ordinary strangeness and exotic superconductivity. Phys. Rev. B 2019, 2019 99, 165112. [Google Scholar] [CrossRef]
- Schrade, C.; Fu, L. Spin-valley density wave in moiré materials. Phys. Rev. B 2019, 2019 100, 035413. [Google Scholar] [CrossRef]
- Carr, S.; Fang, S.; Po, H. C.; Vishwanath, A.; Kaxiras, E. Derivation of Wannier orbitals and minimal-basis tight-binding Hamiltonians for twisted bilayer graphene: first-principles approach. Phys. Rev. Res. 2019, 1, 033072. [Google Scholar] [CrossRef]
- Lian, B.; Wang, Z.; Bernevig, B. A. Twisted bilayer graphene: a phonon-driven superconductor. Phys. Rev. Lett. 2019, 122, 257002. [Google Scholar] [CrossRef]
- Shi, L.; Ma, J. , Song, J. C. W. Gate-tunable flat bands in van der Waals patterned dielectric superlattices. 2D Mater. 2020, 2020 7, 015208. [Google Scholar] [CrossRef]
- Kim, K.; DaSilva, A.; Huang, S.; Fallahazad, B.; Larentis, S.; Taniguchi, T.; Watanabe, K.; LeRoy, B.J.; MacDonald, A.H.; Tutuc, E. Tunable moiré bands and strong correlations in small-twist-angle bilayer graphene. Proc. Natl. Acad. Sci. USA 2017, 114, 3364–3369. [Google Scholar] [CrossRef]
- Wallbank, J.R.; Kumar, R.K.; Holwill, M.; Wang, Z.; Auton, G.H.; Birkbeck, J.; Mishchenko, A.; Ponomarenko, L.A.; Watanabe, K. Taniguchi, T.; Novoselov, K. S.; Aleiner, I. L.; Geim, A. K.; Fal’ko, V. I. Excess resistivity in graphene superlattices caused by umklapp electron–electron scattering. Nature Phys. 2018, 15, 32–36. [Google Scholar] [CrossRef]
- Choi, Y.W.; Choi, H.J. Strong electron-phonon coupling, electron-hole asymmetry, and nonadiabaticity in magic-angle twisted bilayer graphene. Phys. Rev. B 2018, 98, 241412. [Google Scholar] [CrossRef]
- Sharpe, A.L.; Fox, E.J.; Barnard, A.W.; Finney, J.; Watanabe, K.; Taniguchi, T.; Kastner, M.A.; Goldhaber-Gordon, D. Emergent ferromagnetism near three-quarters filling in twisted bilayer graphene. Science 2019, 365, 605–608. [Google Scholar] [CrossRef] [PubMed]
- Polshyn, H.; Yankowitz, M.; Chen, S.; Zhang, Y.; Watanabe, K.; Taniguchi, T.; Dean, C.R.; Young, A.F. Large linear-in-temperature resistivity in twisted bilayer graphene. Nature Phys. 2019, 15, 1011–1016. [Google Scholar] [CrossRef]
- Lian, B.; Wang, Z.; Bernevig, B.A. Twisted bilayer graphene: A phonon-driven superconductor. Phys. Rev. Lett. 2019, 122, 257002. [Google Scholar] [CrossRef] [PubMed]
- Kerelsky, A.; McGilly, L.J.; Kennes, D.M.; Xian, L.; Yankowitz, M.; Chen, S.; Watanabe, K.; Taniguchi, T.; Hone, J.; Dean, C.; et al. Maximized electron interactions at the magic angle in twisted bilayer graphene. Nature 2019, 572, 95–100. [Google Scholar] [CrossRef] [PubMed]
- Sharpe, A. L.; et al. Emergent ferromagnetism near three-quarters filling in twisted bilayer graphene. Science 2019, 365, 605–608. [Google Scholar] [CrossRef] [PubMed]
- Chu, Y.; Zhu, F.; Wen, L.; Chen, W.; Chen, Q.; Ma, T. Superconductivity in twisted multilayer graphene: A smoking gun in recent condensed matter physics. Chin. Phys. B 2020, 29, 117401. [Google Scholar] [CrossRef]
- Nimbalkar, A.; Kim, H. Opportunities and Challenges in Twisted Bilayer Graphene: A Review. Nano-Micro Lett. 2020, 12, 126. [Google Scholar] [CrossRef] [PubMed]
- Serlin, M.; et al. Intrinsic quantized anomalous Hall effect in a moiré heterostructure. Science 2020, 367, 900–903. [Google Scholar] [CrossRef] [PubMed]
- Das, I.; Lu, X.; Herzog-Arbeitman, J.; Song, Z.-D.; Watanabe, K.; Taniguchi, T.; Bernevig, B.A.; Efetov, D.K. Symmetry-broken Chern insulators and Rashba-like Landau-level crossings in magic-angle bilayer graphene. Nature Phys. 2021, 17, 1–5. [Google Scholar] [CrossRef]
- He, M.; Li, Y.; Cai, J.; Liu, Y.; Watanabe, K.; Taniguchi, T.; Xu, X.; Yankowitz, M. Symmetry breaking in twisted double bilayer graphene. Nature Phys. 2021, 17, 26–30. [Google Scholar] [CrossRef]
- He, M.; Zhang, Y.-H.; Li, Y.; Fei, Z.; Watanabe, K.; Taniguchi, T.; Xu, X.; Yankowitz, M. Competing correlated states and abundant orbital magnetism in twisted monolayer-bilayer graphene. Nature Commun. 2021, 12, 4727. [Google Scholar] [CrossRef]
- Li, W.; Reichhardt, C. J. O.; Jankó, B.; Reichhardt, C. Vortex dynamics, pinning, and angle-dependent motion on moiré patterns. Phys. Rev. B 2021, 104, 024504. [Google Scholar] [CrossRef]
- Ledwith, P.J.; Khalaf, E.; Vishwanath, A. Strong coupling theory of magic-angle graphene: A pedagogical introduction. Annals of Physics 2021, 435, 168646. [Google Scholar] [CrossRef]
- Saito, Y.; Ge, J.; Rademaker, L.; Watanabe, K.; Taniguchi, T.; Abanin, D.A.; Young, A.F. Hofstadter subband ferromagnetism and symmetry-broken Chern insulators in twisted bilayer graphene. Nature Phys. 2021, 17, 478–481. [Google Scholar] [CrossRef]
- Cao, Y.; Park, J. M.; Watanabe, K.; Taniguchi, T.; Jarillo-Herrero, P. Pauli-limit violation and re-entrant superconductivity in moiré graphene. Nature 2021, 595, 526–531. [Google Scholar] [CrossRef] [PubMed]
- Hu, C.; Wu, T.; Huang, X.; Dong, Y.; Chen, J.; Zhang, Z.; Lyu, B.; Ma, S.; Watanabe, K.; Taniguchi, T.; Xie, G.; Li, X.; Liang, Q.; Shi, Z. In-situ twistable bilayer graphene. Sci. Rep. 2022, 12, 204. [Google Scholar] [CrossRef]
- Romanova; M. ; Vlček, V. Stochastic many-body calculations of moiré states in twisted bilayer graphene at high pressures. npj Computational Materials 2022, 8, 11. [Google Scholar] [CrossRef]
- Ghawri, B.; Mahapatra, P.S.; Garg, M.; Mandal, S.; Bhowmik, S.; Jayaraman, A.; Soni, R.; Watanabe, K.; Taniguchi, T.; Krishnamurthy, H. R.; Jain, M.; Banerjee, S.; Chandni, U.; Ghosh, A. Breakdown of semiclassical description of thermoelectricity in near-magic angle twisted bilayer graphene. Nature Commun. 2022, 13, 1522. [Google Scholar] [CrossRef] [PubMed]
- Klein, D.R.; Xia, L.-Q.; MacNeill, D.; Watanabe, K.; Taniguchi, T.; Jarillo-Herrero, P. Electrical switching of a moiré ferroelectric superconductor. Nature Nanotechnology 2023. [Google Scholar] [CrossRef]
- Klebl, L.; Goodwin, Z.A.H.; Mostofi, A.A.; Kennes, D.M.; Lischner, J. Importance of long-ranged electron-electron interactions for the magnetic phase diagram of twisted bilayer graphene. Phys. Rev. B 2021, 103, 195127. [Google Scholar] [CrossRef]
- Vahedi, J.; Peters, R.; Missaoui, A.; Honecker, A.; Trambly, L.G. Magnetism of magic-angle twisted bilayer graphene. SciPost Phys. 2021, 11, 083. [Google Scholar] [CrossRef]
- Finney, J.; Sharpe, A.L.; Fox, E.J.; Hsueh, C.; Watanabe, K.; Taniguchi, T.; Kastner, M.; Goldhaber-Gordon, D. Unusual magnetotransport in twisted bilayer graphene. PNAS 2022, 119, e2118482119. [Google Scholar] [CrossRef]
- Decker, R.; Wang, Y.; Brar, V.W.; Regan, W.; Tsai, H.-Z.; Wu, Q.; Gannett, W.; Zettl, A.; Crommie, M. F. Local Electronic Properties of Graphene on a BN Substrate via Scanning Tunneling Microscopy. Nano Lett. 2011, 2011 11, 2291–2295. [Google Scholar] [CrossRef]
- Wang, L.; Zihlmann, S.; Liu, M.-H.; Makk, P.; Watanabe, K.; Taniguchi, T.; Baumgartner, A.; Schönenberger, C. New Generation of Moiré Superlattices in Doubly Aligned hBN/Graphene/hBN Heterostructures. Nano Lett. 2019, 19, 2371–2376. [Google Scholar] [CrossRef] [PubMed]
- Hermann, K. Periodic overlayers and moiré patterns: theoretical studies of geometric properties. J. Phys.: Condens. Matter 2012, 24, 314210. [Google Scholar] [CrossRef] [PubMed]
- Moon, P.; Koshino, M. Electronic properties of graphene/hexagonal-boron-nitride moiré superlattice. Phys. Rev. B 2014, 2014 90, 155406. [Google Scholar] [CrossRef]
- Anđelković, M.; Milovanovic, S. P.; Covaci, L.; Peeters, F. M. Double moiré with a twist: super-moiré in encapsulated graphene. Nano Lett. 2020, 2020 (), 9b04058. [Google Scholar] [CrossRef]
- Tang, K.; Qi, W. Moiré-Pattern-Tuned Electronic Structures of van der Waals Heterostructures. Adv. Funct. Mater. 2020, 2002672. [Google Scholar] [CrossRef]
- Martin, I. Moiré superconductivity. Annals of Physics 2020, 2020 417, 116118. [Google Scholar] [CrossRef]
- Xi Zhang, X.; Tsai, K.-T.; Zhu, Z.; Ren, W.; Luo, Y.; Carr, S.; Luskin, M.; Kaxiras, E.; Wang, K. Correlated Insulating States and Transport Signature of Superconductivity in Twisted Trilayer Graphene Superlattices. Phys. Rev. Lett. 2021, 127, 166802. [Google Scholar] [CrossRef]
- Sharpe, A.L. Stacks on stacks on stacks. Nature Mater. 2022, 21, 838–847. [Google Scholar] [CrossRef]
- Park, J.M.; Cao, Y.; Xia, L.; Sun, S.; Watanabe, K.; Taniguchi, T.; Jarillo-Herrero, P. Magic-Angle Multilayer Graphene: A Robust Family of Moiré Superconductors. Nature Mater. 2022, 21, 877–883. [Google Scholar] [CrossRef]
- Burg, G.W.; Khalaf, E.; Wang, Y.; Watanabe, K.; Taniguchi, T.; Tutuc, E. Emergence of correlations in alternating twist quadrilayer graphene. Nature Mater. 2022, 21, 884–889. [Google Scholar] [CrossRef] [PubMed]
- Xie, S.; Faeth, B.D.; Tang, Y.; Li, L.; Gerber, E.; Parzyck, C.T.; Chowdhury, D.; Zhang, Y.-H.; Jozwiak, C.; Bostwick, A.; Rotenberg, E.; Kim, E.-A.; Shan, J.; Mak, K.F.; Shen, K.M. Strong interlayer interactions in bilayer and trilayer moiré superlattices. Sci. Adv. 2022, 8, eabk1911. [Google Scholar] [CrossRef] [PubMed]
- Stanev, V. , Oses, C., Kusne, A. G., Rodriguez, E., Paglione, J., Curtarolo, S., Takeuchi, I. Machine learning modeling of superconducting critical temperature. npj Computational Materials 2018, 2018 4, 29. [Google Scholar] [CrossRef]
- Matsumoto, K. , Horide, T. An acceleration search method of higher Tc superconductors by a machine learning algorithm. Appl. Phys. Express 2019, 2019 12, 073003. [Google Scholar] [CrossRef]
- Zeng, S.; Zhao, Y.; Li, G.; Wang, R.; Wang, X.; Ni, J. Atom table convolutional neural networks for an accurate prediction of compounds properties. npj Computational Materials 2019, 2019 5, 84. [Google Scholar] [CrossRef]
- Hutcheon, M.J.; Alice, M.; Shipley, A.M.; Richard, J.. Needs, R.J. Predicting novel superconducting hydrides using machine learning approaches. Phys. Rev. B 2020, 2020 101, 144505. [Google Scholar] [CrossRef]
- Lee, D.; You, D.; Lee, D.; Li, X.; Kim, S. Machine-Learning-Guided Prediction Models of Critical Temperature of Cuprates. J. Phys. Chem. Lett. 2021, 2021 12, 6211–6217. [Google Scholar] [CrossRef]
- Stanev, V.; Choudhary, K.; Kusne, A.G.; Paglione, J.; Takeuchi, I. Artificial intelligence for search and discovery of quantum materials. Commun. Mater. 2021, 2, 105. [Google Scholar] [CrossRef]
- Roeser, H. P.; Hetfleisch, F.; Huber, F. M.; Von Schoenermark, M. F.; Stepper, M.; Moritz, A.; Nikoghosyan, A. S. A link between critical transition temperature and the structure of superconducting YBa2Cu3O7-δ. Acta Astronautica 2008, 62, 733–736. [Google Scholar] [CrossRef]
- Roeser, H. P.; Hetfleisch, F.; Huber, F. M.; Von Schoenermark, M. F.; Stepper, M.; Moritz, A.; Nikoghosyan, A. S. Correlation between oxygen excess density and critical temperature in superconducting Bi-2201, Bi-2212 and Bi-2223. Acta Astronautica 2008, 63, 1372–1375. [Google Scholar] [CrossRef]
- Roeser, H. P.; Huber, F. M.; von Schoenermark, M. F.; Nikoghosyan, A. S. High temperature superconducting with two doping atoms in La-doped Bi-2201 and Y-doped Bi-2212. Acta Astronautica 2009, 65, 489–494. [Google Scholar] [CrossRef]
- Roeser, H. P. , Haslam, D. T., Hetfleisch, F., Lopez , J. S., von Schoenermark, M. F., Stepper, M., Huber, F. M., Nikoghosyan, A. S. Electron transport in nanostructures: A key to high temperature superconductivity? Acta Astronautica 2010, 2010 67, 546–552. [Google Scholar] [CrossRef]
- Roeser, H.P.; Bohr, A.; Haslam, D.T.; López, J.S.; Stepper, M.; Nikoghosyan, A.S. Size quantization in high-temperature superconducting cuprates and a link to Einstein’s diffusion law. Acta Astronaut. 2012, 76, 37–41. [Google Scholar] [CrossRef]
- Huber, F.; Roeser, H. P.; von Schoenermark, M. A correlation between Tc of Fe-based HT Superconductors and the crystal super lattice constants of the doping element positions. J. Phys. Soc. Jpn. 2008, 77, 142–144. [Google Scholar] [CrossRef]
- Koblischka, M. R.; Roth, S.; Koblischka-Veneva, A.; Karwoth, T.; Wiederhold, A.; Zeng, X. L.; Fasoulas, S.; Murakami, M. Relation between Crystal Structure and Transition Temperature of Superconducting Metals and Alloys. Metals 2020, 10, 158. [Google Scholar] [CrossRef]
- Koblischka-Veneva, A.; Koblischka, M. R. (RE)BCO and the Roeser-Huber formula. Materials 2021, 14, 6068. [Google Scholar] [CrossRef] [PubMed]
- Koblischka, M. R.; Koblischka-Veneva, A. Calculation of Tc of superconducting elements with the Roeser-Huber formalism. Metals 2022, 12, 337. [Google Scholar] [CrossRef]
- Ghosh, K. J. B.; Kais, S.; Herschbach, D. R. Dimensional interpolation for metallic hydrogen. Phys. Chem. Chem. Phys. 2021, 2021 23, 7841–7848. [Google Scholar] [CrossRef]
- Mathew, S.; Abraham, A. R.; Chintalapati, S.; Sarkar, S.; Joseph, B.; Venkatesan, T. Temperature Dependent Structural Evolution of WSe2: A Synchrotron X-ray Diffraction Study. Condens. Matter 2020, 5, 76. [Google Scholar] [CrossRef]
- Talantsev, E.F. Quantifying the Charge Carrier Interaction in Metallic Twisted Bilayer Graphene Superlattices. Nanomaterials 2021, 11, 1306. [Google Scholar] [CrossRef]
- Meissner, W.; Ochsenfeld, R. Ein neuer Effekt bei Eintritt der Supraleitfähigkeit. Naturwissenschaften 1933, 21, 787–788. [Google Scholar] [CrossRef]
- Buckel, W.; Kleiner, R. Supraleitung. Grundlagen und Anwendungen, 7th edition,; Wiley-VCH: Weinheim, 2013. [Google Scholar]
- Koblischka, M. R.; and Wijngaarden, R. J. Magneto-optical investigations of superconductors. Supercond. Sci. Technol. 1995, 1995 8, 199–213. [Google Scholar] [CrossRef]
- Bending, S.J. Local magnetic probes of superconductors. Adv. Phys. 1999, 48, 449–535. [Google Scholar] [CrossRef]
- Koblischka, M.R.; Hartmann, U. Recent advances in magnetic force microscopy. Ultramicroscopy 2003, 97, 103–112. [Google Scholar] [CrossRef] [PubMed]
- Oral, A.; Bending, S.J.; Henini, M. Real-time scanning Hall probe microscopy. Appl. Phys. Lett. 1996, 69(9), 1324–1326. [Google Scholar] [CrossRef]
- Sonusen, S.; Karci, O.; Dede, M.; Aksoy, S.; Oral, A. Single layer graphene Hall sensors for scanning Hall probe microscopy (SHPM) in 3–300 K temperature range. Appl. Surf. Sci. 2014, 308, 414–418. [Google Scholar] [CrossRef]
- Anahory, Y.; Naren, H. R.; Lachman, E. O.; Buhbut Sinai, S.; Uri, A.; Embon, L.; Yaakobi, E.; Myasoedov, Y.; Huber, M. E.; Klajn, R.; Zeldov, E. SQUID-on-tip with single-electron spin sensitivity for high-field and ultra-low temperature nanomagnetic imaging. Nanoscale 2020, 12, 3174. [Google Scholar] [CrossRef]
- Levine, E.V.; Turner, M.J.; Kehayias, P.; Hart, C.A.; Langellier, N.; Trubko, R.; Glenn, D. R.; Fu, R.R.; Walsworth, R.L. Principles and techniques of the quantum diamond microscope. Nanophotonics 2019, 8(11), 1945–1973. [Google Scholar] [CrossRef]
- Hong, S.; Grinolds, M.S.; Pham, L.M.; Le Sage, D.; Luan, L.; Walsworth, R.L.; Yacoby, A. Nanoscale magnetometry with NV centers in diamond. MRS Bull. 2013, 38, 155–161. [Google Scholar] [CrossRef]
- Wenzhao Li, W.; Reichhardt, C. J. O.; Jankó, B.; Reichhardt, C. Vortex dynamics, pinning, and angle-dependent motion on moiré patterns. Phys. Rev. B 2021, 104, 024504. [Google Scholar] [CrossRef]
- Gorter, C. J.; Casimir, H. On supraconductivity I. Physica 1934, 1934 1, 306–320. [Google Scholar] [CrossRef]
- Poole, C. P. Jr.; Creswick, R. J.; Farach, H. A.; Prozorov, R. Superconductivity. (Elsevier, UK, Second edition, 2007).
- Talantsev, E. F.; Crump, W. P.; Island, J. O.; Xing, Y.; Sun, Y.; Wang, J.; Tallon, J. L. On the origin of critical temperature enhancement in atomically thin superconductors. 2D Materials 2017, 4, 025072. [Google Scholar] [CrossRef]
- Pal, B.; Joshi, B.P.; Chakraborti, H.; Jain, A.K.; Barick, B.K.; Ghosh, K.; Bhunia, S.; Laha, A.; Dhar, S.; Gupta, K.D. Experimental evidence of a very thin superconducting layer in epitaxial indium nitride. Supercond. Sci. Technol. 2018, 32, 015009. [Google Scholar] [CrossRef]
- Helfand, E.; Werthamer, N. R. Temperature and purity dependence of the superconducting critical field, Hc2. II. Phys. Rev. 1966, 147, 288–294. [Google Scholar] [CrossRef]
- Werthamer, N. R. , Helfand, E.; Hohenberg, P. C. Temperature and purity dependence of the superconducting critical field, Hc2. III. Electron spin and spin-orbit effects. Phys. Rev. 1966, 147, 295–302. [Google Scholar] [CrossRef]
- Baumgartner, T.; Eisterer, M.; Weber, H. W.; Flükiger, R.; Scheuerlein, C.; Bottura, L. Effects of neutron irradiation on pinning force scaling in state-of-the-art Nb3Sn wires. Supercond. Sci. Technol. 2014, 27, 015005. [Google Scholar] [CrossRef]
- Jones, C. K. , Hulm, J. K.; Chandrasekhar, B. S. Upper critical field of solid solution alloys of the transition elements. Rev. Mod. Phys. 1964, 36, 74–76. [Google Scholar] [CrossRef]
- Talantsev, E. F. DC self-field critical current in superconductor/Dirac-cone material/superconductor junctions. Nanomaterials 2019, 9, 1554. [Google Scholar] [CrossRef]
- Koblischka-Veneva, A.; Koblischka, M. R. High-Tc Cuprate Superconductors: Materials, Structures and Properties. In: Superconducting Materials. Fundamentals, Synthesis and Applications; Slimani, Y.; Hannachi, E.; Springer-Nature, Singapore, 2022, Chap. 7, pp. 181-210.
- Talantsev, E.F. Critical de Broglie wavelength in superconductors. Mod. Phys. Lett. B 2018, 32, 1850114. [Google Scholar] [CrossRef]
- Rohlf, J. W.: Modern Physics from α to Z0. Wiley, New York (1994).
- Mori, N.; Wilson, J. A.; Ozaki, H. Fluctuation conductivity in the 110-K phase of Ni-doped (Bi,Pb)-Sr-Ca-Cu-O superconductors. Phys. Rev. B 1992, 1992 45, 10633–10638. [Google Scholar] [CrossRef]
- Larkin, A.; Varlamov, A. Fluctuation Phenomena in Superconductors; Oxford University Press: Oxford, U.K., 2005. [Google Scholar]
- Koblischka, M. R.; Koblischka-Veneva, A.; Zeng, X. L.; Hannachi, E.; Slimani, Y. Microstructure and Fluctuation-Induced Conductivity Analysis of Bi2Sr2CaCu2O8+δ (Bi-2212) Nanowire Fabrics. Crystals 2020, 2020 10, 986. [Google Scholar] [CrossRef]
- Uemura, Y. J.; Le, L. P.; Luke, G. M.; Sternlieb, B. J.; Wu, W. D.; Brewer, J. H.; Riseman, T. M.; Seaman, C. L.; Maple, M. B.; Ishikawa, M.; Hinks, D. G.; Jorgensen, J. D.; Saito, G.; Yamochi, H. Basic Similarities among Cuprate, Bismuthate, Organic, Chevrel-Phase, and Heavy-Fermion Superconductors Shown by Penetration Depth Measurements. Phys. Rev. Lett. 1991, 1991 66, 2665–2668. [Google Scholar] [CrossRef]
- Uemura, Y. J. Condensation, excitation, pairing, and superfluid density in high-Tc superconductors: the magnetic resonance mode as a roton analogue and a possible spin-mediated pairing. J. Phys.: Condens. Matter 2004, 16, S4515–S4540. [Google Scholar] [CrossRef]
- Harshman, D. R.; Fiory, A. T. High-Tc Superconductivity Originating from Interlayer Coulomb Coupling in Gate-Charged Twisted Bilayer Graphene Moiré Superlattices. J. Supercond. 2020, 2020 33, 367–378. [Google Scholar] [CrossRef]
- Xiao, Y.; Liu, J.; Fu, L. Moiré is More: Access to New Properties of Two-Dimensional Layered Materials. Matter 2020, 3, 1142–1161. [Google Scholar] [CrossRef]
- Boochani, A.; Jamal, M.; Shahrokhi, M.; Nowrozi, B.; Gholivand, M.B.; Khodadadi, J.; Amiri, M.; Asshabia, M.; Yaria, A. Ti2VGe Heuslerene: theoretical prediction of a novel 2D material. J. Mater. Chem. C 2019, 7, 13559. [Google Scholar] [CrossRef]
- Wang, T.; Noah, F.; Yuan, Q.; Fu, L. Moiré Surface States and Enhanced Superconductivity in Topological Insulators. Phys. Rev. X 2021, 11, 021024. [Google Scholar] [CrossRef]
- Kezilebieke, S.; Vano, V.; Huda, Md N. ; Aapro, M.; Ganguli, S.C.; Liljeroth, P.; Lado, J.L. Moiré-Enabled Topological Superconductivity. Nano Lett. 2022, 22, 328–333. [Google Scholar] [CrossRef]
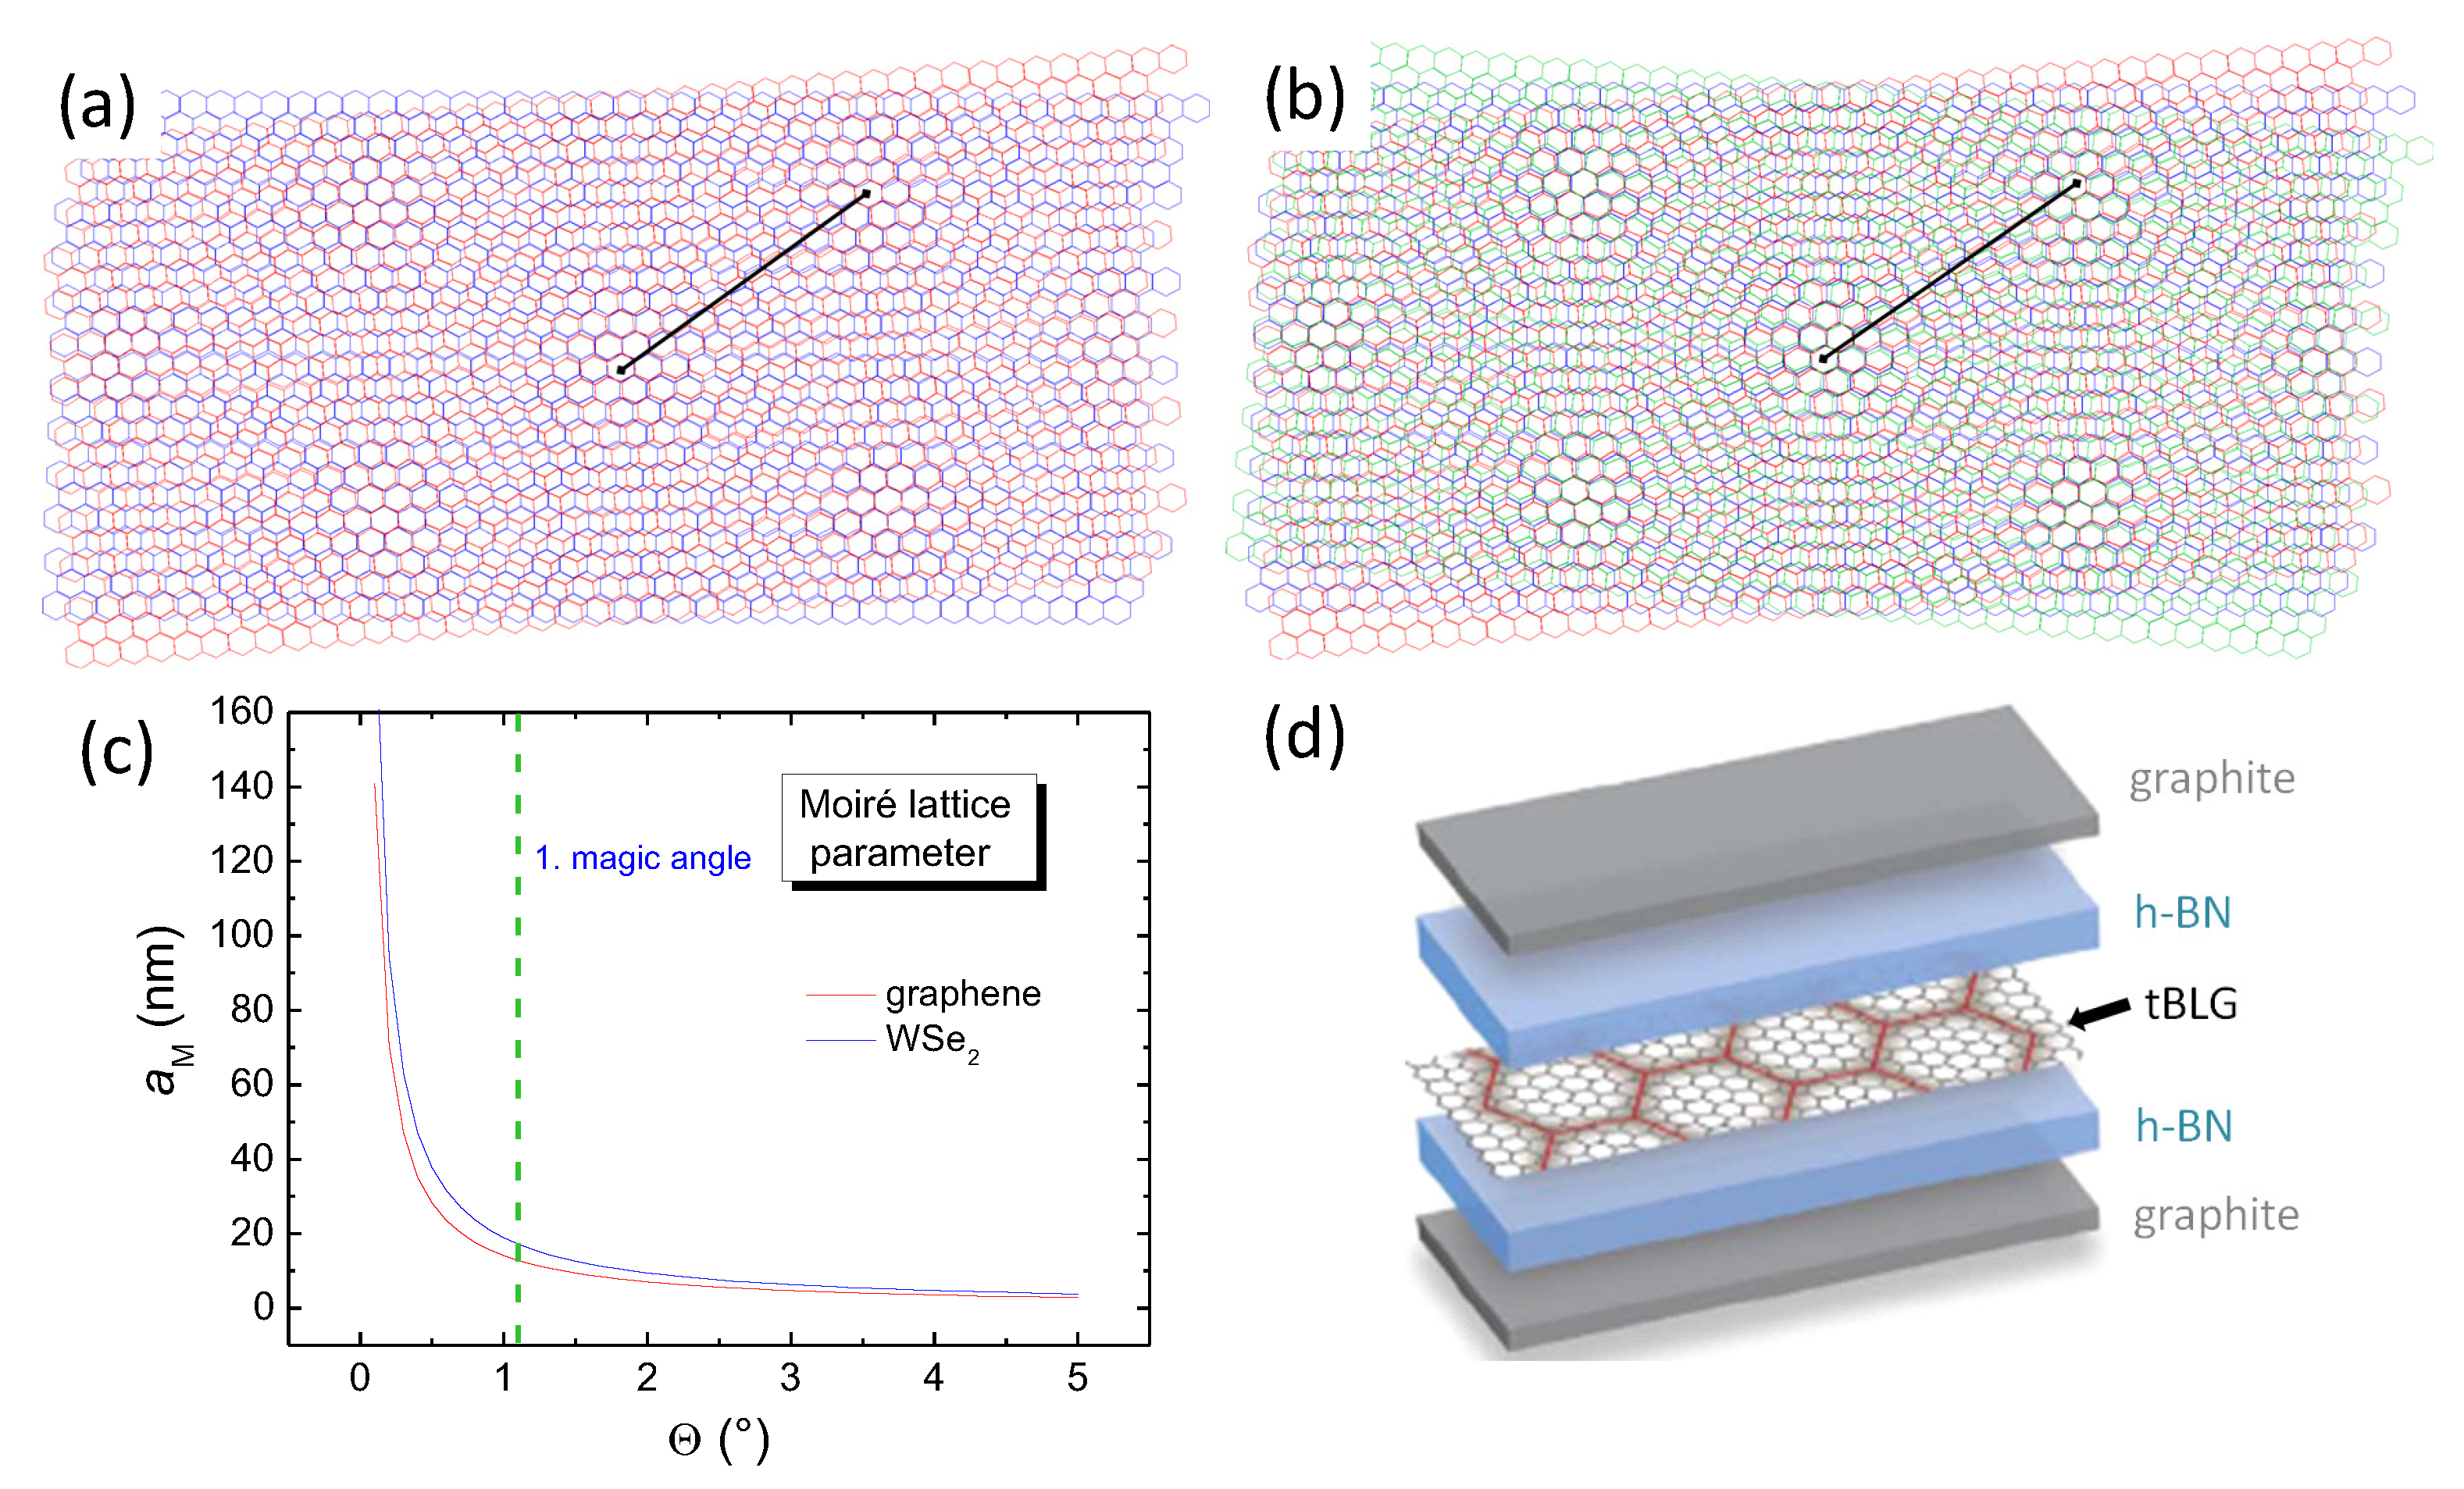
 ). (d) Schematic view of the various layers in a device for resistance measurement. Figure adapted from Ref. [3].
 ). (d) Schematic view of the various layers in a device for resistance measurement. Figure adapted from Ref. [3].
 ). (b) Device 2 ( 1.09, 6.7 nm,
  ). (c) Device 3 ( 1.04, 38 nm,
  ). The superconducting phase is divided by a weak resistive state around , which does not match the density of the state at , being estimated from the strong resistive states at . (d) Device 4 ( 1.18, 7.5 nm,
  ). (e) Device 5 ( 1.12, 45 nm,
  ). (f) 3D-bar diagram showing the highest values of recorded in [10] as function of d and . It is obvious from images (a), (c), (e) and (f) that thicker h-BN layers stabilize a strong and robust superconducting state with the highest value of 3.98 K recorded in (e). Reproduced with permission from Ref. [10].
 ). (b) Device 2 ( 1.09, 6.7 nm,
  ). (c) Device 3 ( 1.04, 38 nm,
  ). The superconducting phase is divided by a weak resistive state around , which does not match the density of the state at , being estimated from the strong resistive states at . (d) Device 4 ( 1.18, 7.5 nm,
  ). (e) Device 5 ( 1.12, 45 nm,
  ). (f) 3D-bar diagram showing the highest values of recorded in [10] as function of d and . It is obvious from images (a), (c), (e) and (f) that thicker h-BN layers stabilize a strong and robust superconducting state with the highest value of 3.98 K recorded in (e). Reproduced with permission from Ref. [10].
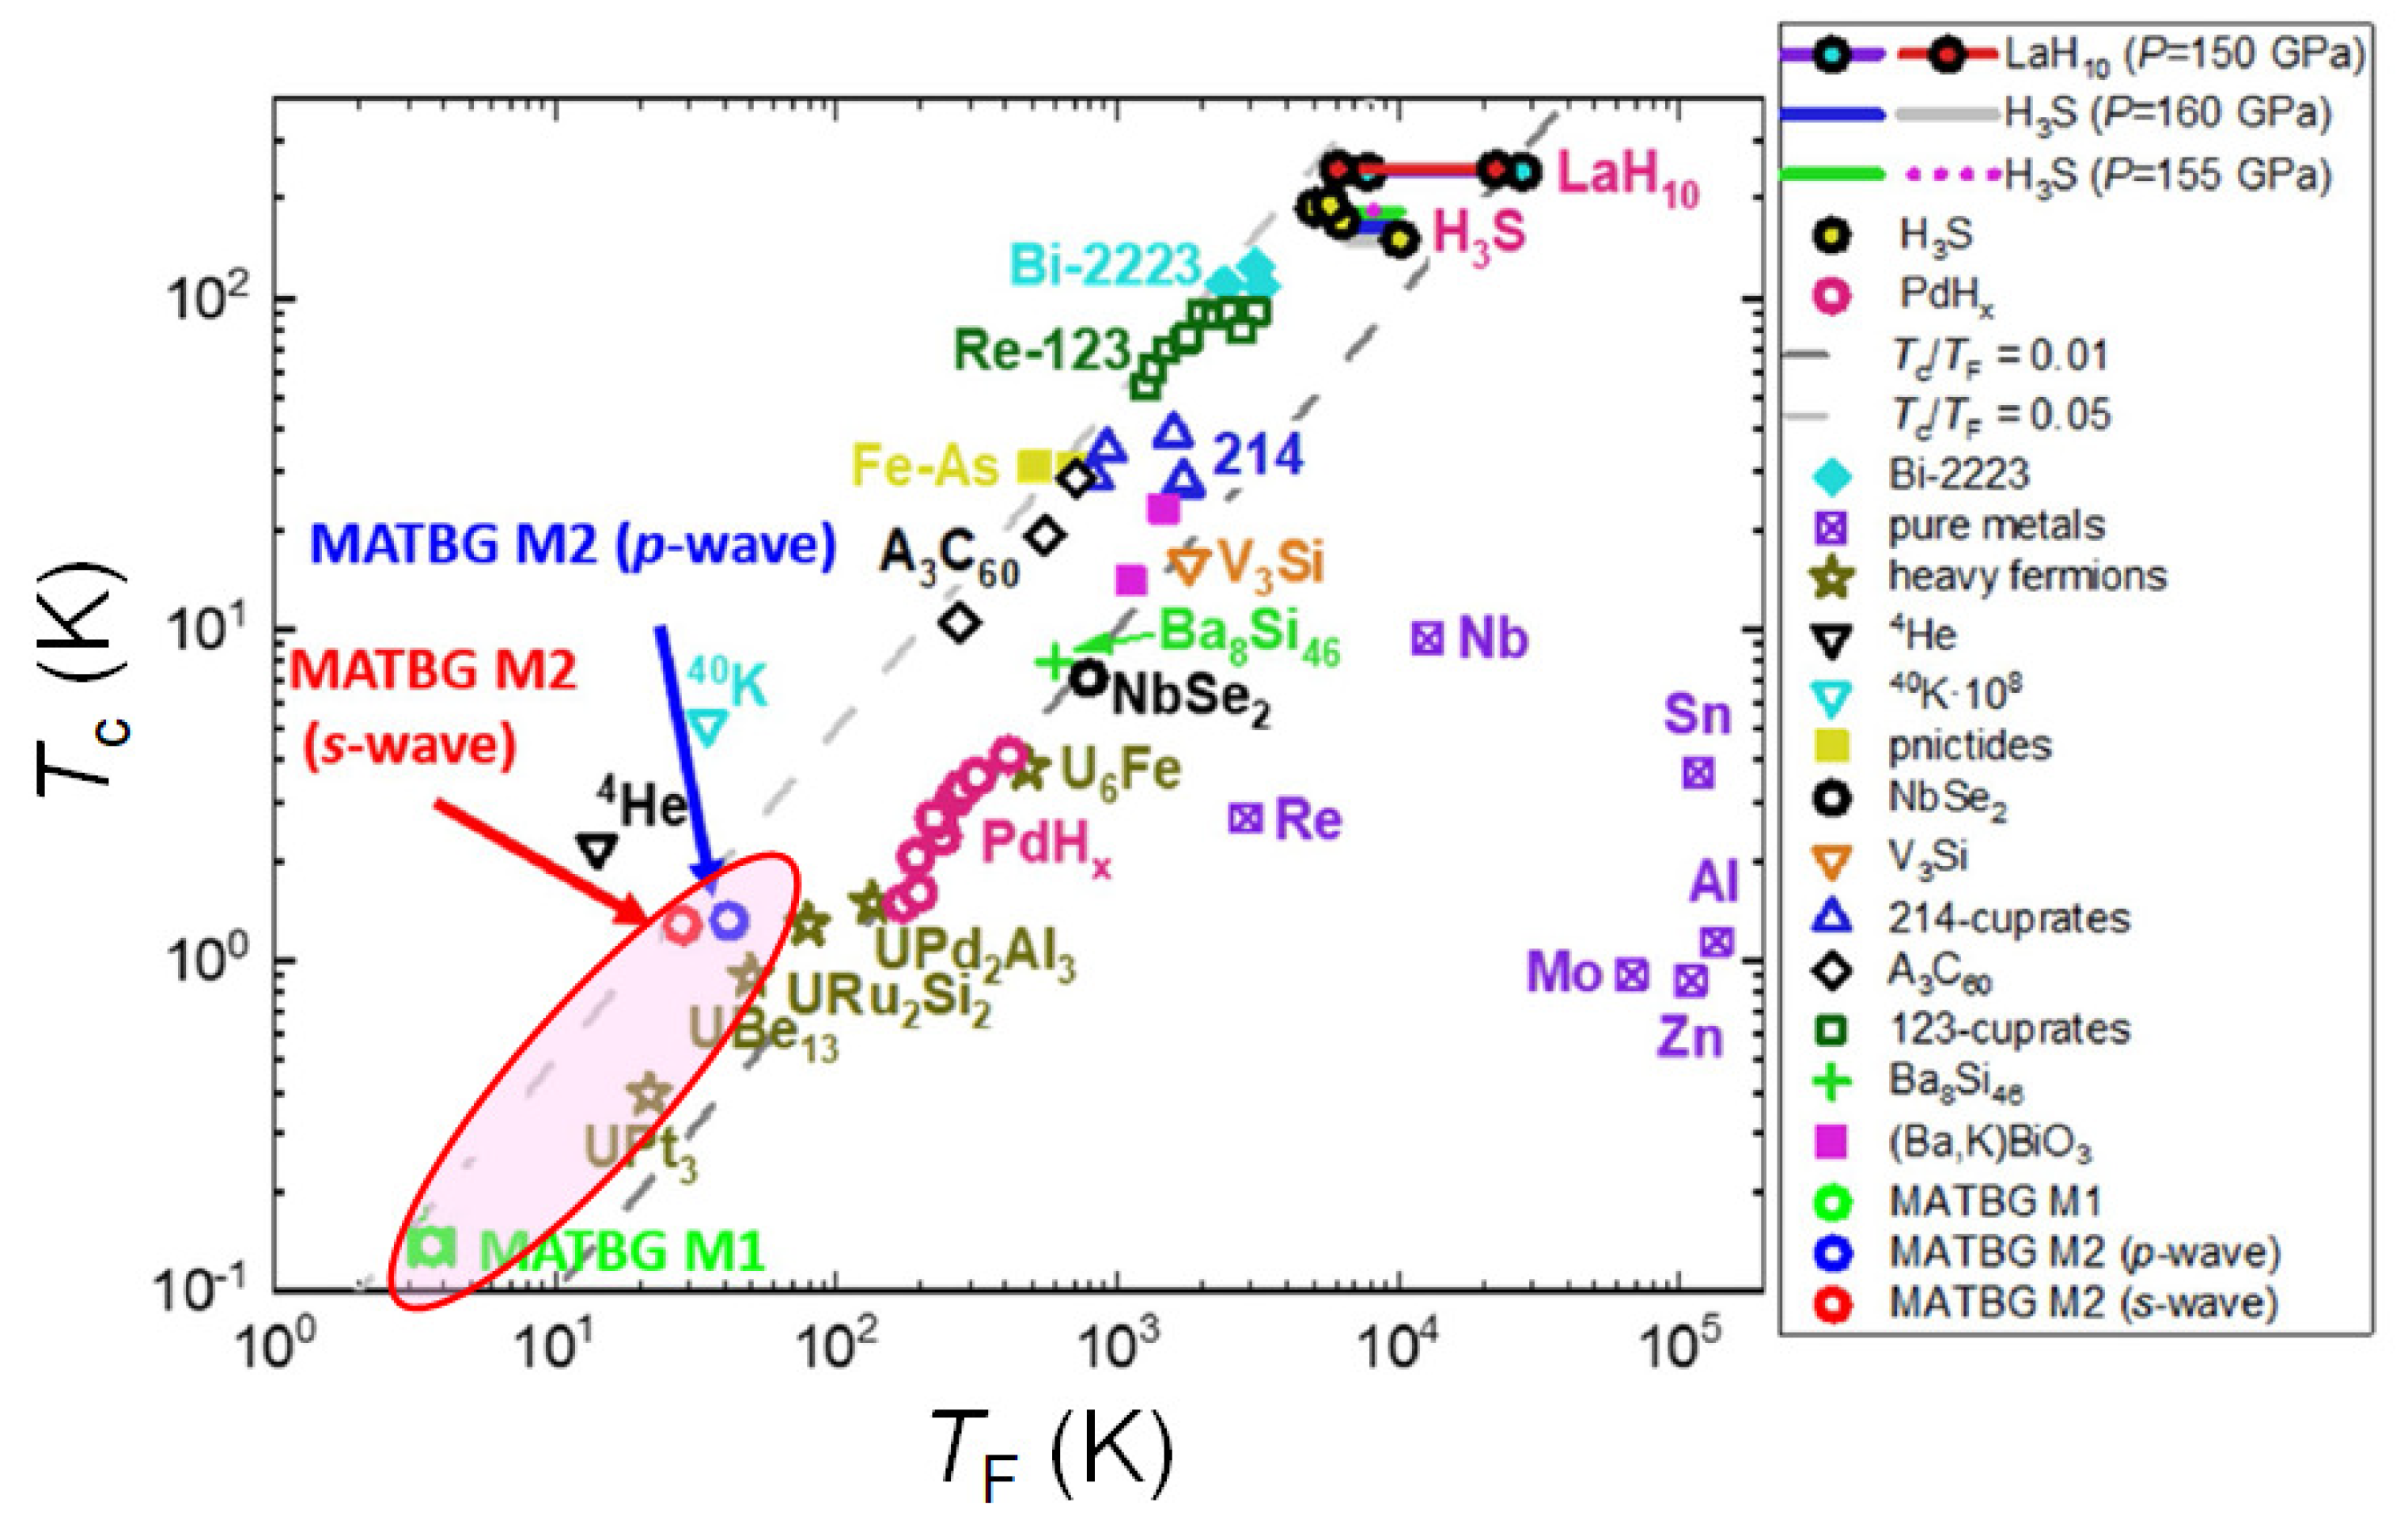
 ). The straight red-dotted line follows the equation for a particle in a box [102] and the blue dashed line gives the linear fit to the data (see text).
 ). The straight red-dotted line follows the equation for a particle in a box [102] and the blue dashed line gives the linear fit to the data (see text).
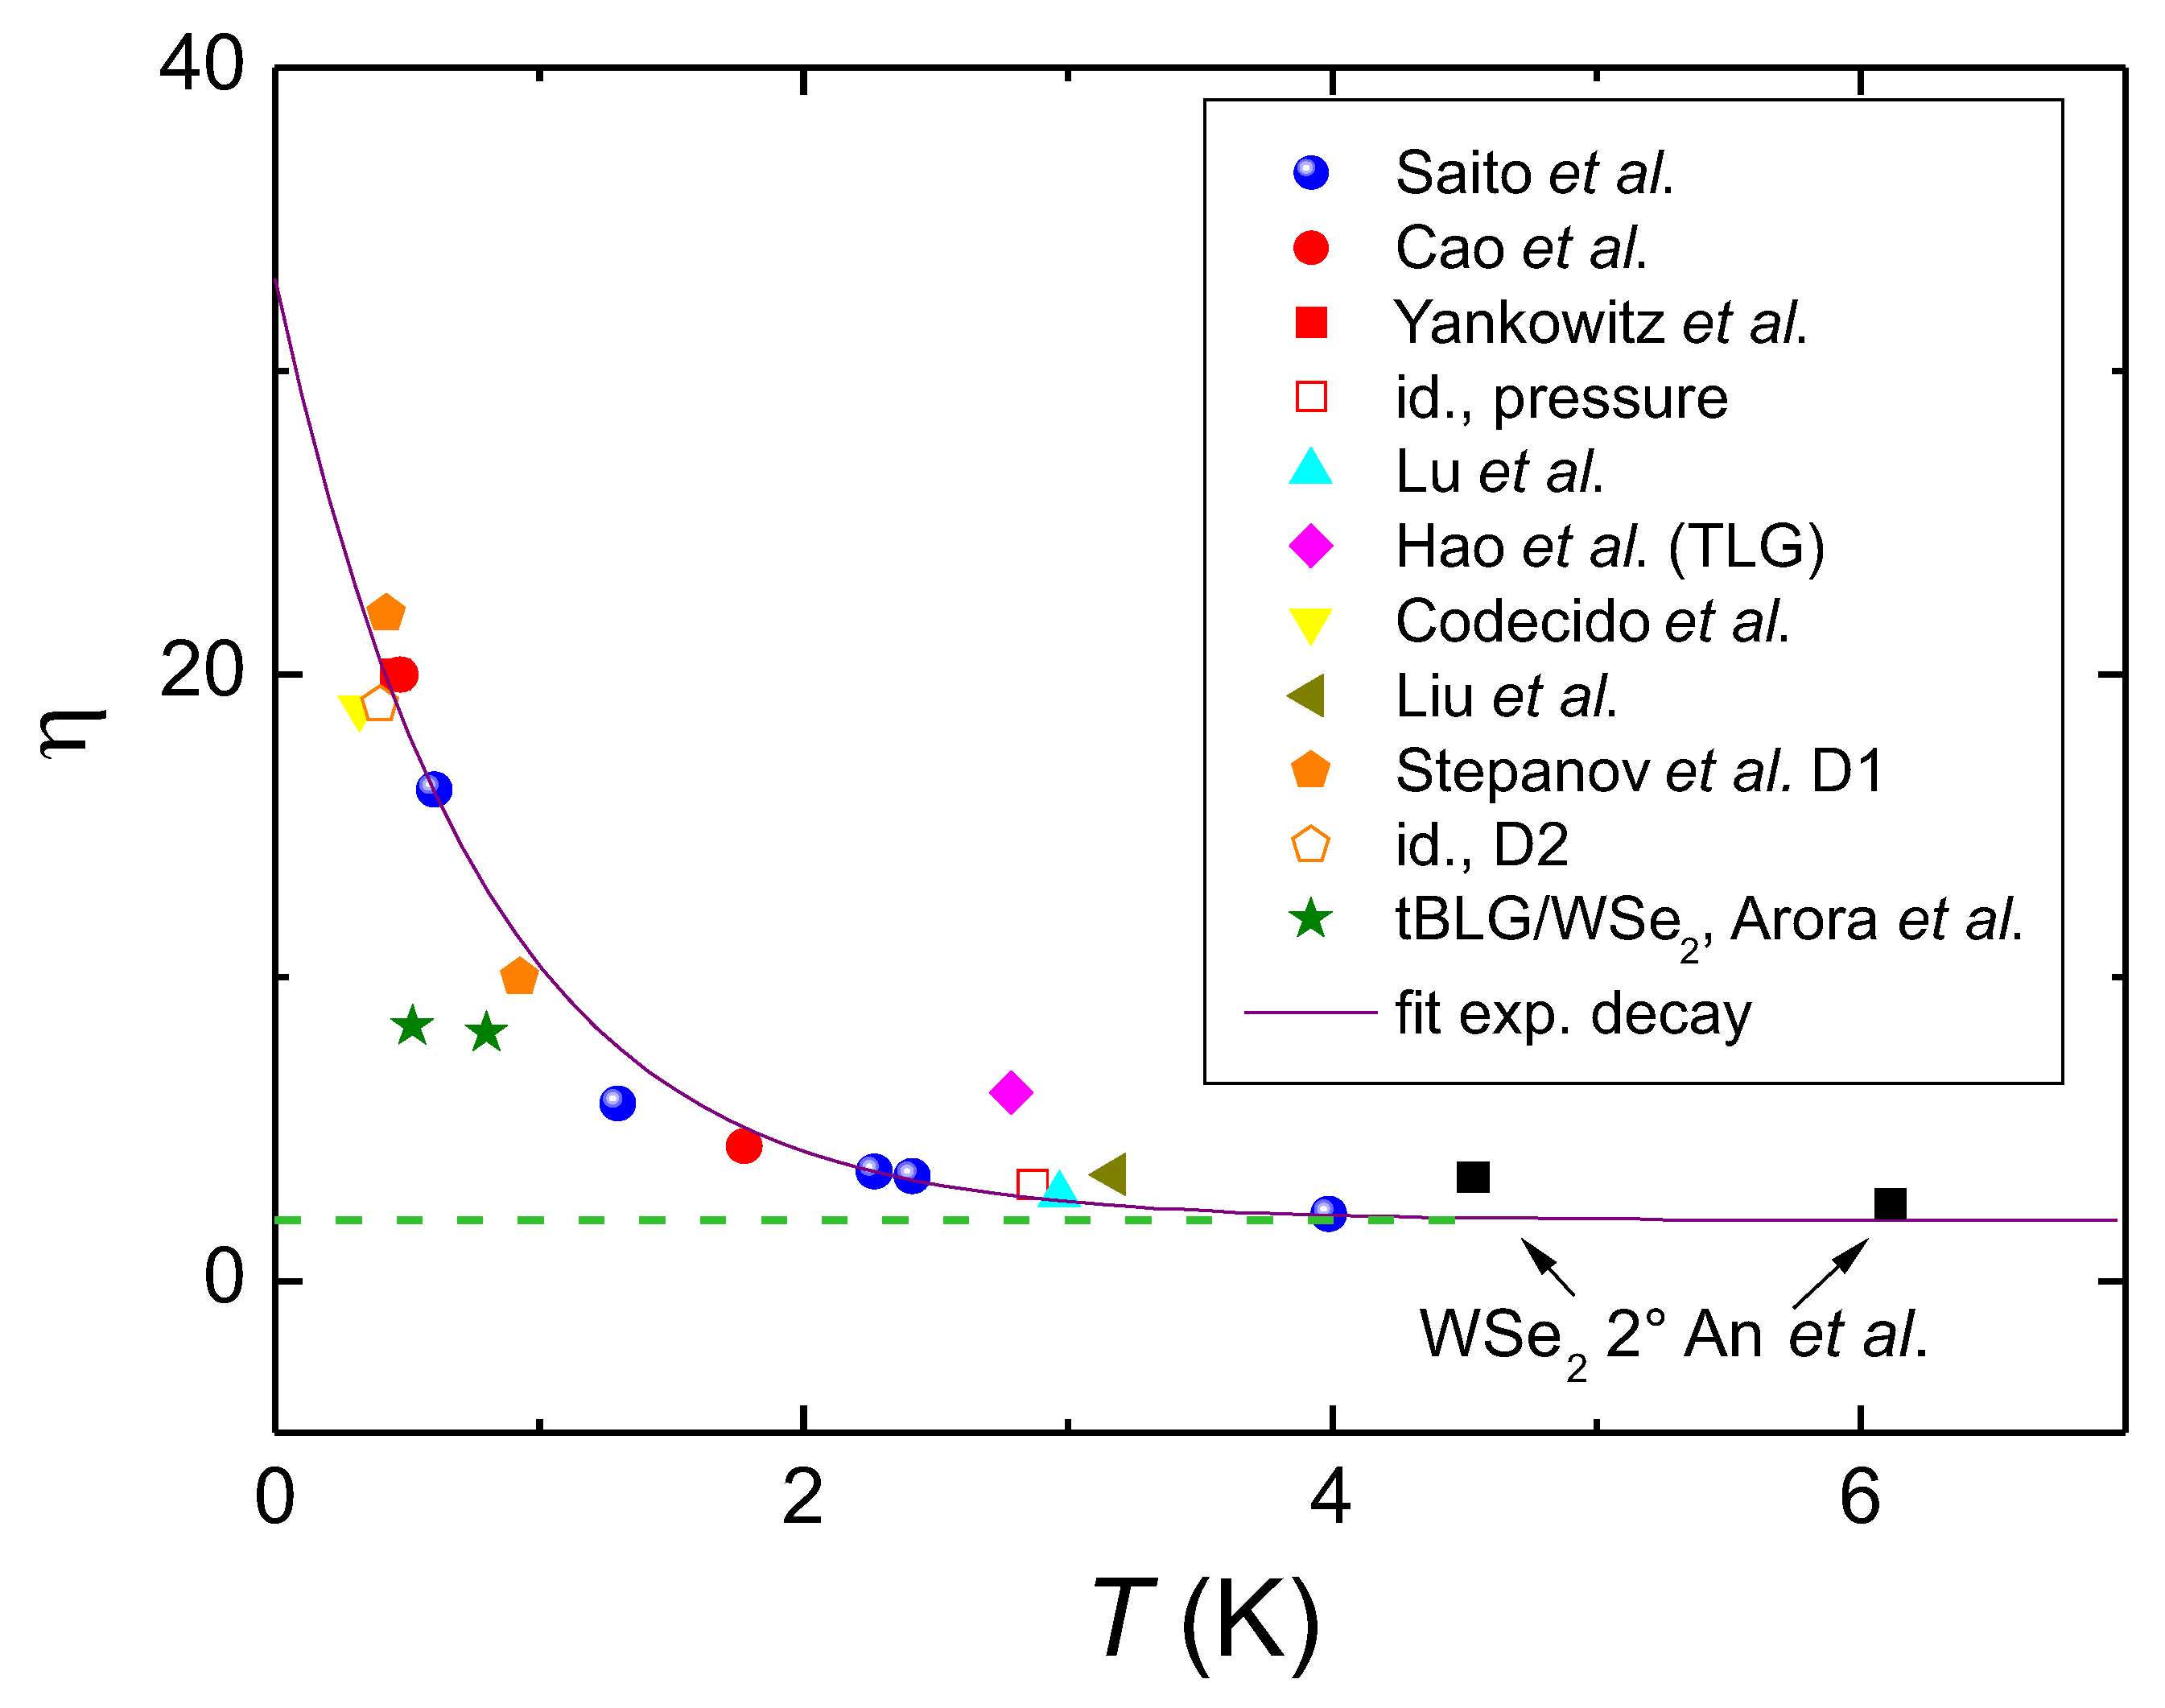
 , [12]), the tBLG/WSe of Arora et al. (
 , [14]) and the 2 WSe data of An et al. (
 , [15]). The violet line (
 ) is a fit to all data using eq. (8).
 , [12]), the tBLG/WSe of Arora et al. (
 , [14]) and the 2 WSe data of An et al. (
 , [15]). The violet line (
 ) is a fit to all data using eq. (8).
| Moiré superconductors | HTSc | |
| layered material | min. 2 layers graphene, WSe | Cu-O-planes |
| superconducting electron density, | 1.58 × 10 cm | ∼1 × 10 cm |
| superconducting charge carriers | Cooper pairs | Cooper pairs |
| charge carrier mass | 0.2 | |
| Fermi temperature | ∼ 10 K | ∼1100 K |
| tunability of | yes, via gate voltage | yes, via oxygenation or ion doping |
| Meissner effect | not observable (Fraunhofer pattern) | yes (magnetic measurements) |
Disclaimer/Publisher’s Note: The statements, opinions and data contained in all publications are solely those of the individual author(s) and contributor(s) and not of MDPI and/or the editor(s). MDPI and/or the editor(s) disclaim responsibility for any injury to people or property resulting from any ideas, methods, instructions or products referred to in the content. |
© 2023 by the authors. Licensee MDPI, Basel, Switzerland. This article is an open access article distributed under the terms and conditions of the Creative Commons Attribution (CC BY) license (http://creativecommons.org/licenses/by/4.0/).


