Submitted:
09 June 2023
Posted:
09 June 2023
You are already at the latest version
Abstract
Keywords:
1. Introduction
2. Materials and Methods
2.1. Study area
2.2. Data acquisition
2.3. Image classification using Random Forest
2.4. Plant Phenology
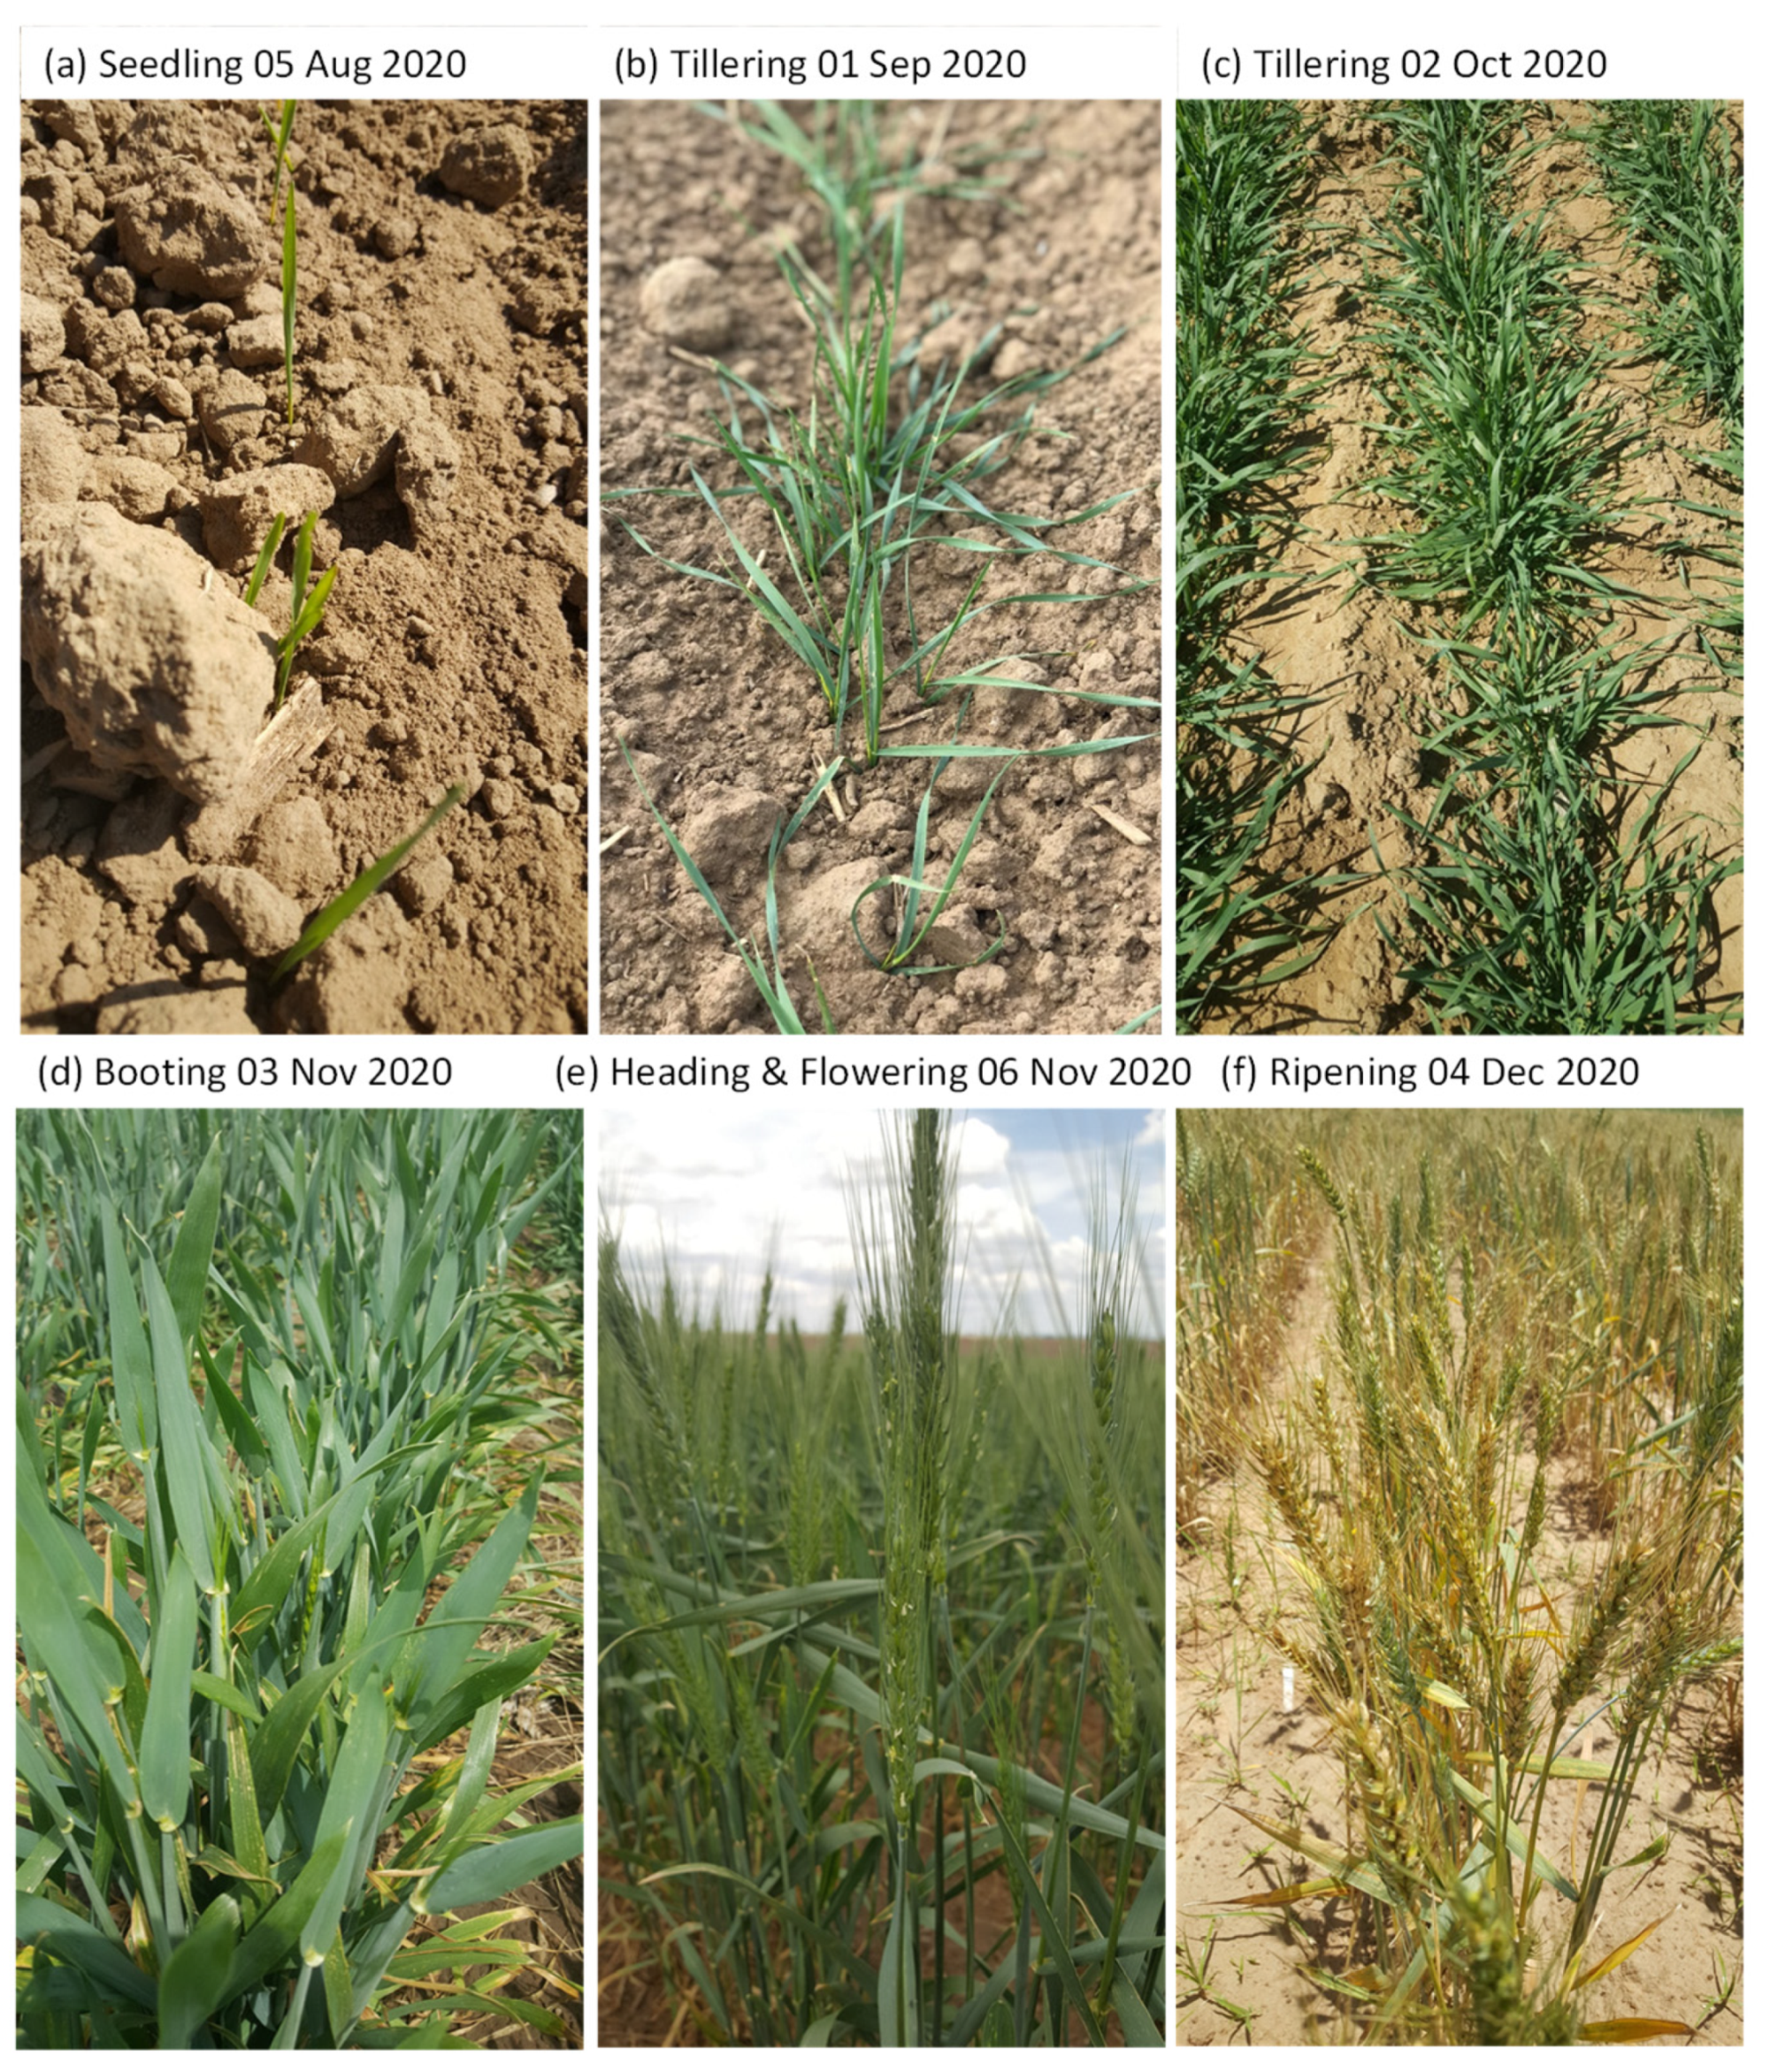
3. Results
4. Discussion
5. Conclusions
Author Contributions
Funding
Data Availability Statement
Acknowledgments
Conflicts of Interest
References
- Curtis, T.; Halford, N.G. Food security: the challenge of increasing wheat yield and the importance of not compromising food safety. Annals of applied biology 2014, 164, 354–372. [Google Scholar] [CrossRef] [PubMed]
- Li, X.; Zheng, C.; Cao, C.; Dang, H.; Sun, J.; Li, K.; Ma, J. Analysis of Climatic Potential Productivity and Wheat Production in Different Producing Areas of the Northern Hemisphere. IOP Conf. Ser. Earth Environ. Sci. 2020, 427, 012010. [Google Scholar] [CrossRef]
- Chang, Y.F.; Wong, J.R. Regeneration of Plants from Protoplasts of Triticum aestivum L. (Wheat). In Plant Protoplasts and Genetic Engineering; Bajaj, Y.P.S., Ed.; Springer: Berlin/Heidelberg, Germany, 1994; Volume 29, pp. 161–171. [Google Scholar]
- Porsche, W. Weizen, Triticum aestivum L. Qualitaet fuer das taegliche Brot—von der Mangelware zum Exportgut. In: Roebbelen G (ed) Die Entwicklung der Pflanzenzuechtung in Deutschland (1908–2008). Goettingen, Gesellschaft fuer Pflanzenzuechtungen eV, 2008; pp 289–297.
- Stat, J. Statistisches Jahrbuch ueber Ernaehrung, Landwirtschaft und Forsten der Bundesrepublik Deutschland (2015). Landwirtschaftsverlag GmbH, Muenster-Hiltrup, 2015.
- Laidig, F.; Piepho, H.P.; Rentel, D.; Drobek, T.; Meyer, U.; Huesken, A. Breeding progress, environmental variation and correlation of winter wheat yield and quality traits in German official variety trials and on-farm during 1983–2014. Theoretical and Applied Genetics 2017, 130, 223–245. [Google Scholar] [CrossRef] [PubMed]
- Oleksiak, T.; Spyroglou, I.; Pacoń, D.; Matysik, P.; Pernisová, M.; Rybka, K. Effect of drought on wheat production in Poland between 1961 and 2019. Crop Science 2022, 62, 728–743. [Google Scholar] [CrossRef]
- Iwańska, M.; Paderewski, J.; Stępień, M.; Rodrigues, P.C. Adaptation of winter wheat cultivars to different environments: A case study in Poland. Agronomy 2020, 10, 632. [Google Scholar] [CrossRef]
- Shew, A.M.; Tack, J.B.; Nalley, L.L.; Chaminuka, P. Yield reduction under climate warming varies among wheat cultivars in South Africa. Nature communications 2020, 11, 1–9. [Google Scholar] [CrossRef] [PubMed]
- Nhemachena, C.R.; Kirsten, J. A historical assessment of sources and uses of wheat varietal innovations in South Africa. S Afr J Sci. 2017, 113, 20160008. [Google Scholar] [CrossRef] [PubMed]
- Department of Agriculture, Forestry and Fisheries (DAFF) of South Africa. Agricultural statistics; Pretoria: DAFF, 2014. [Google Scholar]
- Purchase, J.L.; Van Lill, D. Directions in breeding for winter wheat yield and quality in South Africa from 1930 to 1990. Euphytica 1995, 82, 79–87. [Google Scholar] [CrossRef]
- Department of Agriculture, Forestry and Fisheries (DAFF) of South Africa. Wheat production guideline; Pretoria: Directorate Plant Production, DAFF, 2010. [Google Scholar]
- Sosibo, N.Z.; Muchaonyerwa, P.; Visser, L.; Barnard, A.; Dube, E.; Tsilo, T.J. Soil fertility constraints and yield gaps of irrigation wheat in South Africa. S Afr J Sci. 2017, 113, 20160141. [Google Scholar] [CrossRef] [PubMed]
- SADC. Over 41.4 million people in Southern Africa are food insecure. 2016. https://www.sadc.int/news-events/news/over-414-million-people-southern-africaare-food-insecure/.
- U.S. Census Bureau. 2011. International database [Online]. Available online: http://www.census.gov/ipc/www/idb/worldpopinfo.php (accessed on 28 March 2011).
- FAO. How to feed the world: 2050 [Online]. High Expert Forum, 12-13 Oct. 2009. Food and Agriculture Organization of the United Nations. Rome. 2009. Available online: http://www.fao.org/fileadmin/templates/wsfs/docs/Issues_papers/HLEF2050_Global_Agriculture.pdf (accessed on 31 March 2011).
- Stewart, W.M.; Roberts, T.L. Food security and the role of fertilizer in supporting it. Procedia Engineering 2012, 46, 76–82. [Google Scholar] [CrossRef]
- Jaiswal, S.; Sheoran, S.; Arora, V.; Angadi, U.B.; Iquebal, M.A.; Raghav, N.; Aneja, B.; Kumar, D.; Singh, R.; Sharma, P.; Singh, G.P. Putative microsatellite DNA marker-based wheat genomic resource for varietal improvement and management. Frontiers in plant science 2017, 8, 2009. [Google Scholar] [CrossRef] [PubMed]
- Vogel, F.A.; Bange, G.A. Understanding crop statistics. Miscellaneous Publication No. 1554, NASS and World Agricultural Outlook Board, Office of the Chief Economist, US Department of Agriculture. 2004.
- Zhong, L.; Hawkins, T.; Biging, G.; Gong, P. A phenology-based approach to map crop types in the San Joaquin Valley, California. International Journal of Remote Sensing 2011, 32, 7777–7804. [Google Scholar] [CrossRef]
- Craig, M.; Atkinson, D. A literature review of crop area estimation. Accessed July 2013, 2, 2018. [Google Scholar]
- Pan, L.; Xia, H.; Zhao, X.; Guo, Y.; Qin, Y. Mapping winter crops using a phenology algorithm, time-series Sentinel-2 and Landsat-7/8 images, and Google Earth Engine. Remote sensing 2021, 13, 2510. [Google Scholar] [CrossRef]
- Gao, F.; Zhang, X. Mapping crop phenology in near real-time using satellite remote sensing: Challenges and opportunities. Journal of Remote Sensing 2021, 2021. [Google Scholar] [CrossRef]
- Moeletsi, M.E. Agroclimatological risk assessment of rainfed maize production for the Free State Province of South Africa. Doctoral dissertation, University of the Free State, 2010. [Google Scholar]
- Knott, C.A. Identifying Wheat Growth Stages; University of Kentucky College of Agriculture, Food and Environment, Cooperative Extension, Lexington, and Kentucky State University: Frankfort, 2016. [Google Scholar]
- Nkuna, B.L. Mapping and monitoring winter wheat crop using biophysical parameters and multi-temporal sentinel-2 imageries. MSc dissertation, University of Free State, Bloemfontein, South Africa, 2021. [Google Scholar]
- Song, Y.; Wang, J. Mapping winter wheat planting area and monitoring its phenology using Sentinel-1 backscatter time series. Remote Sensing 2019, 11, 449. [Google Scholar] [CrossRef]
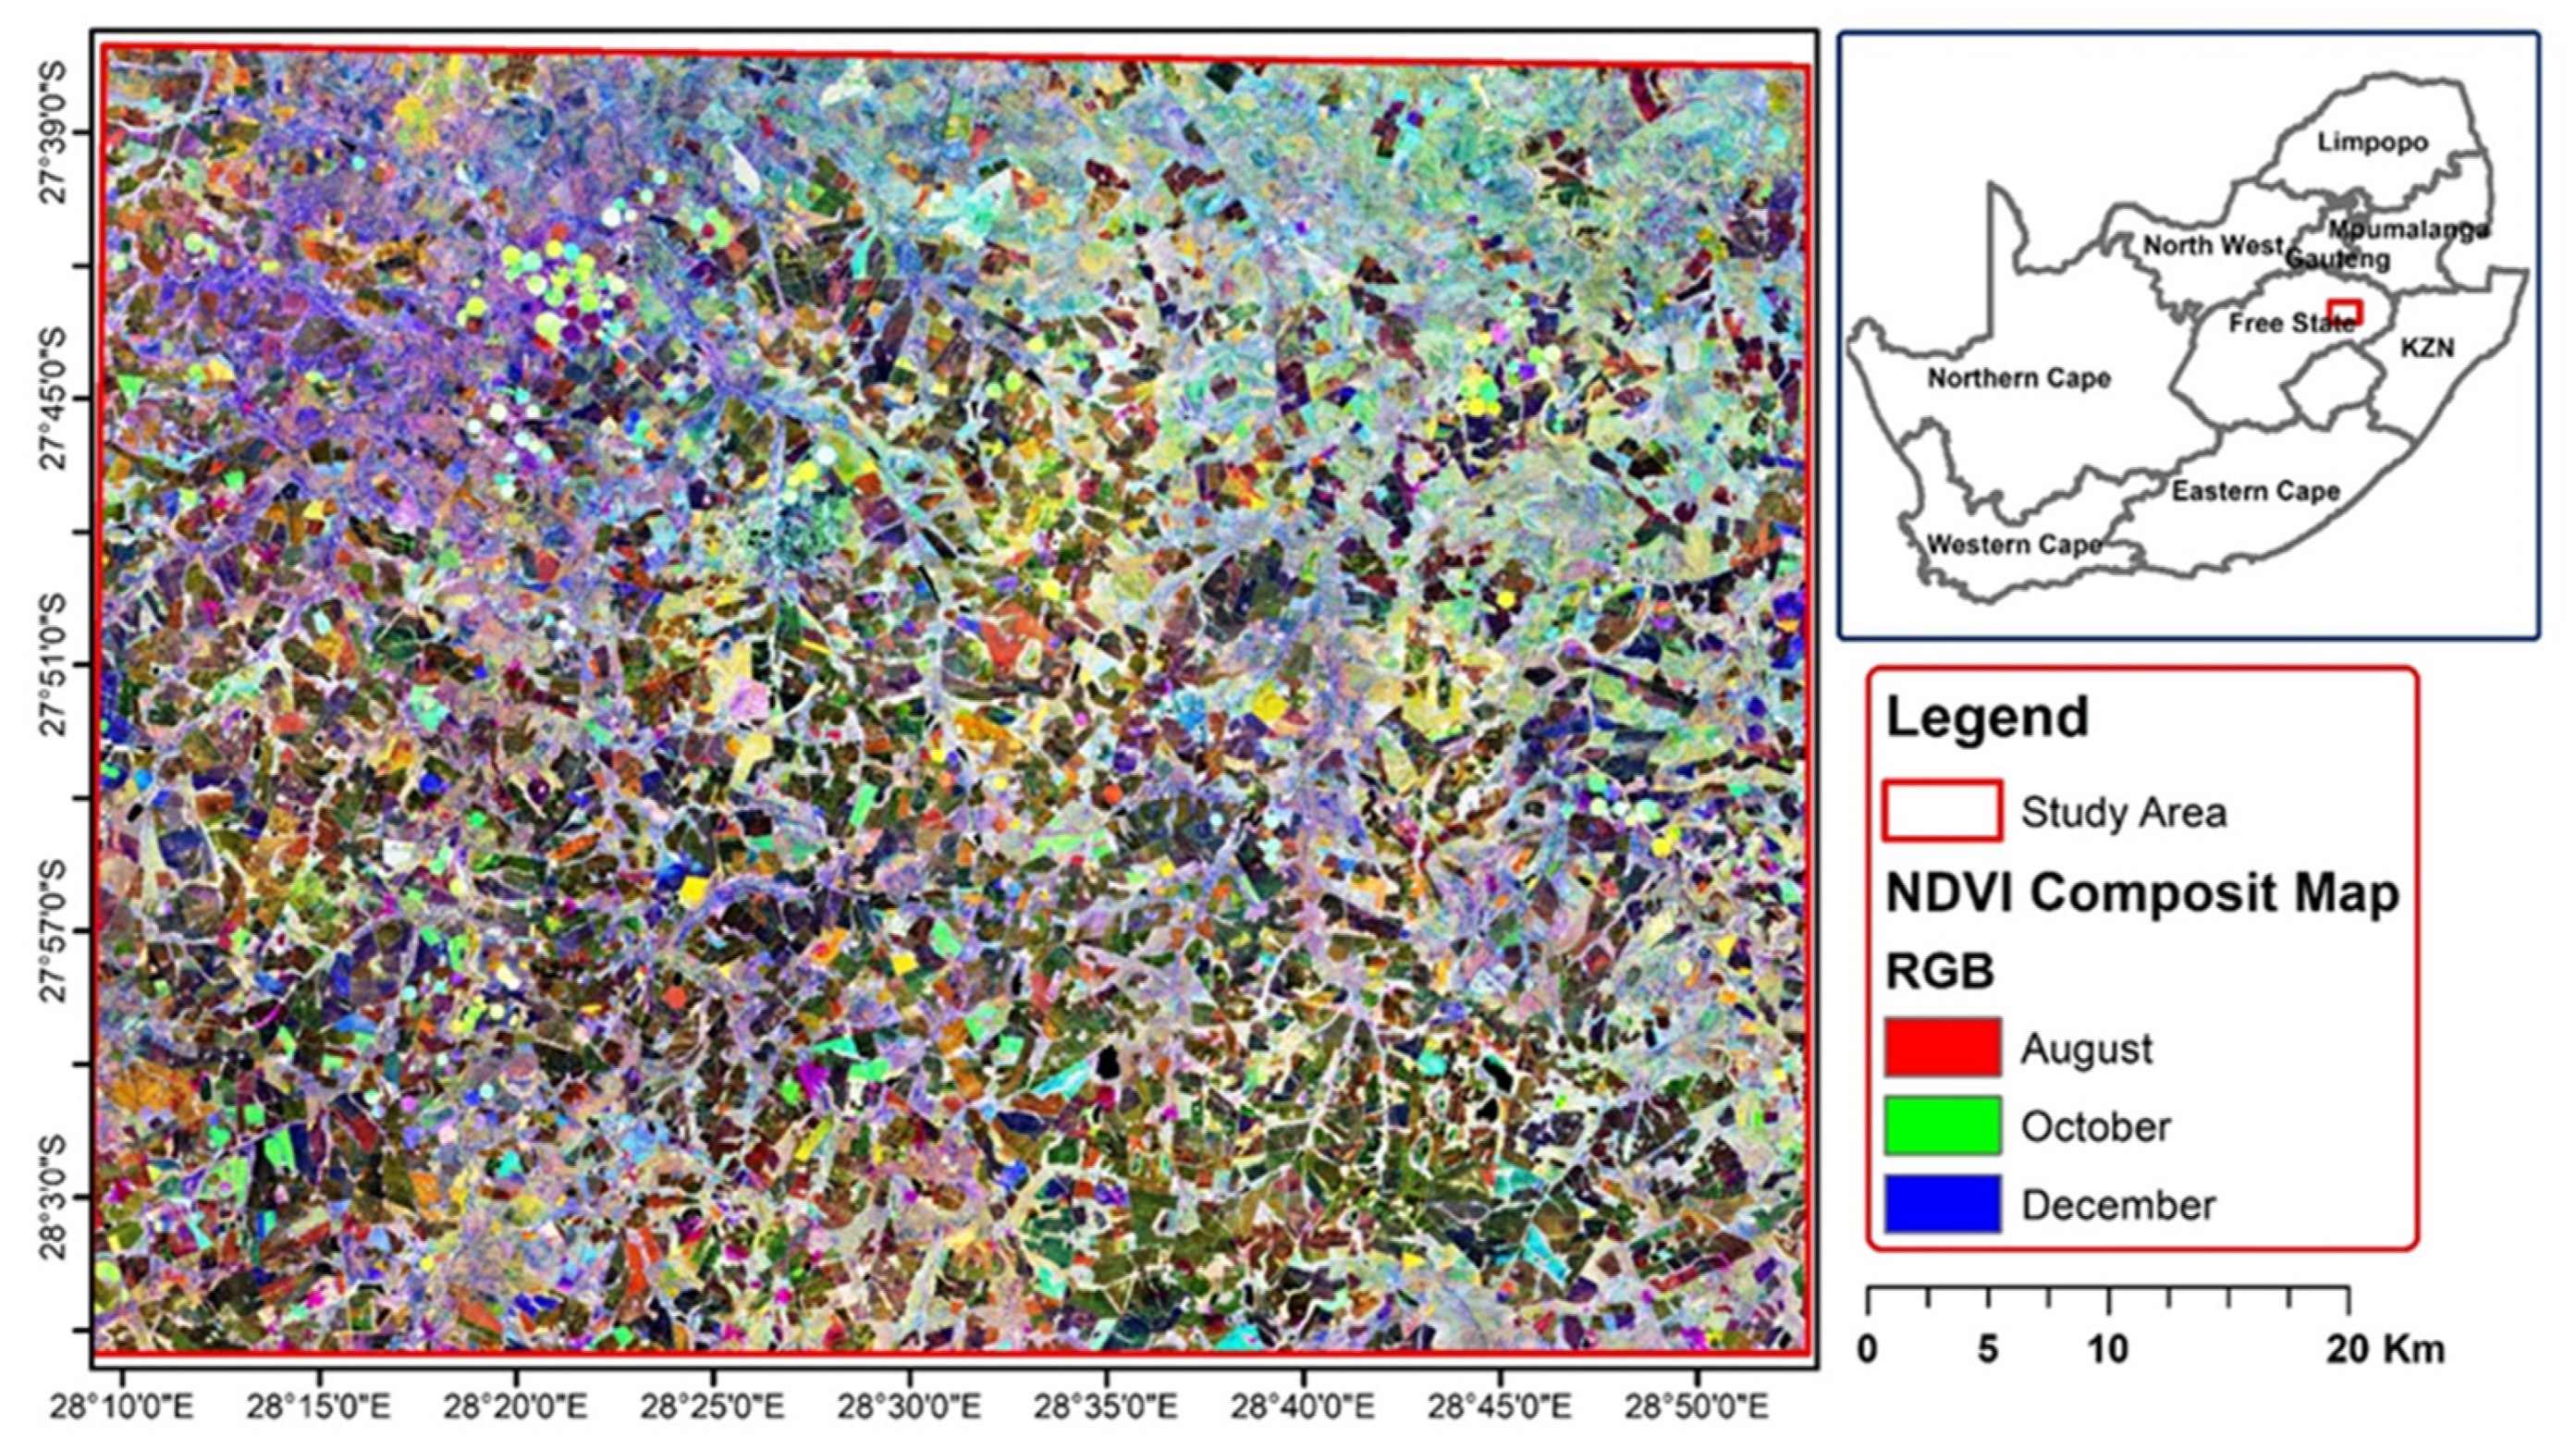
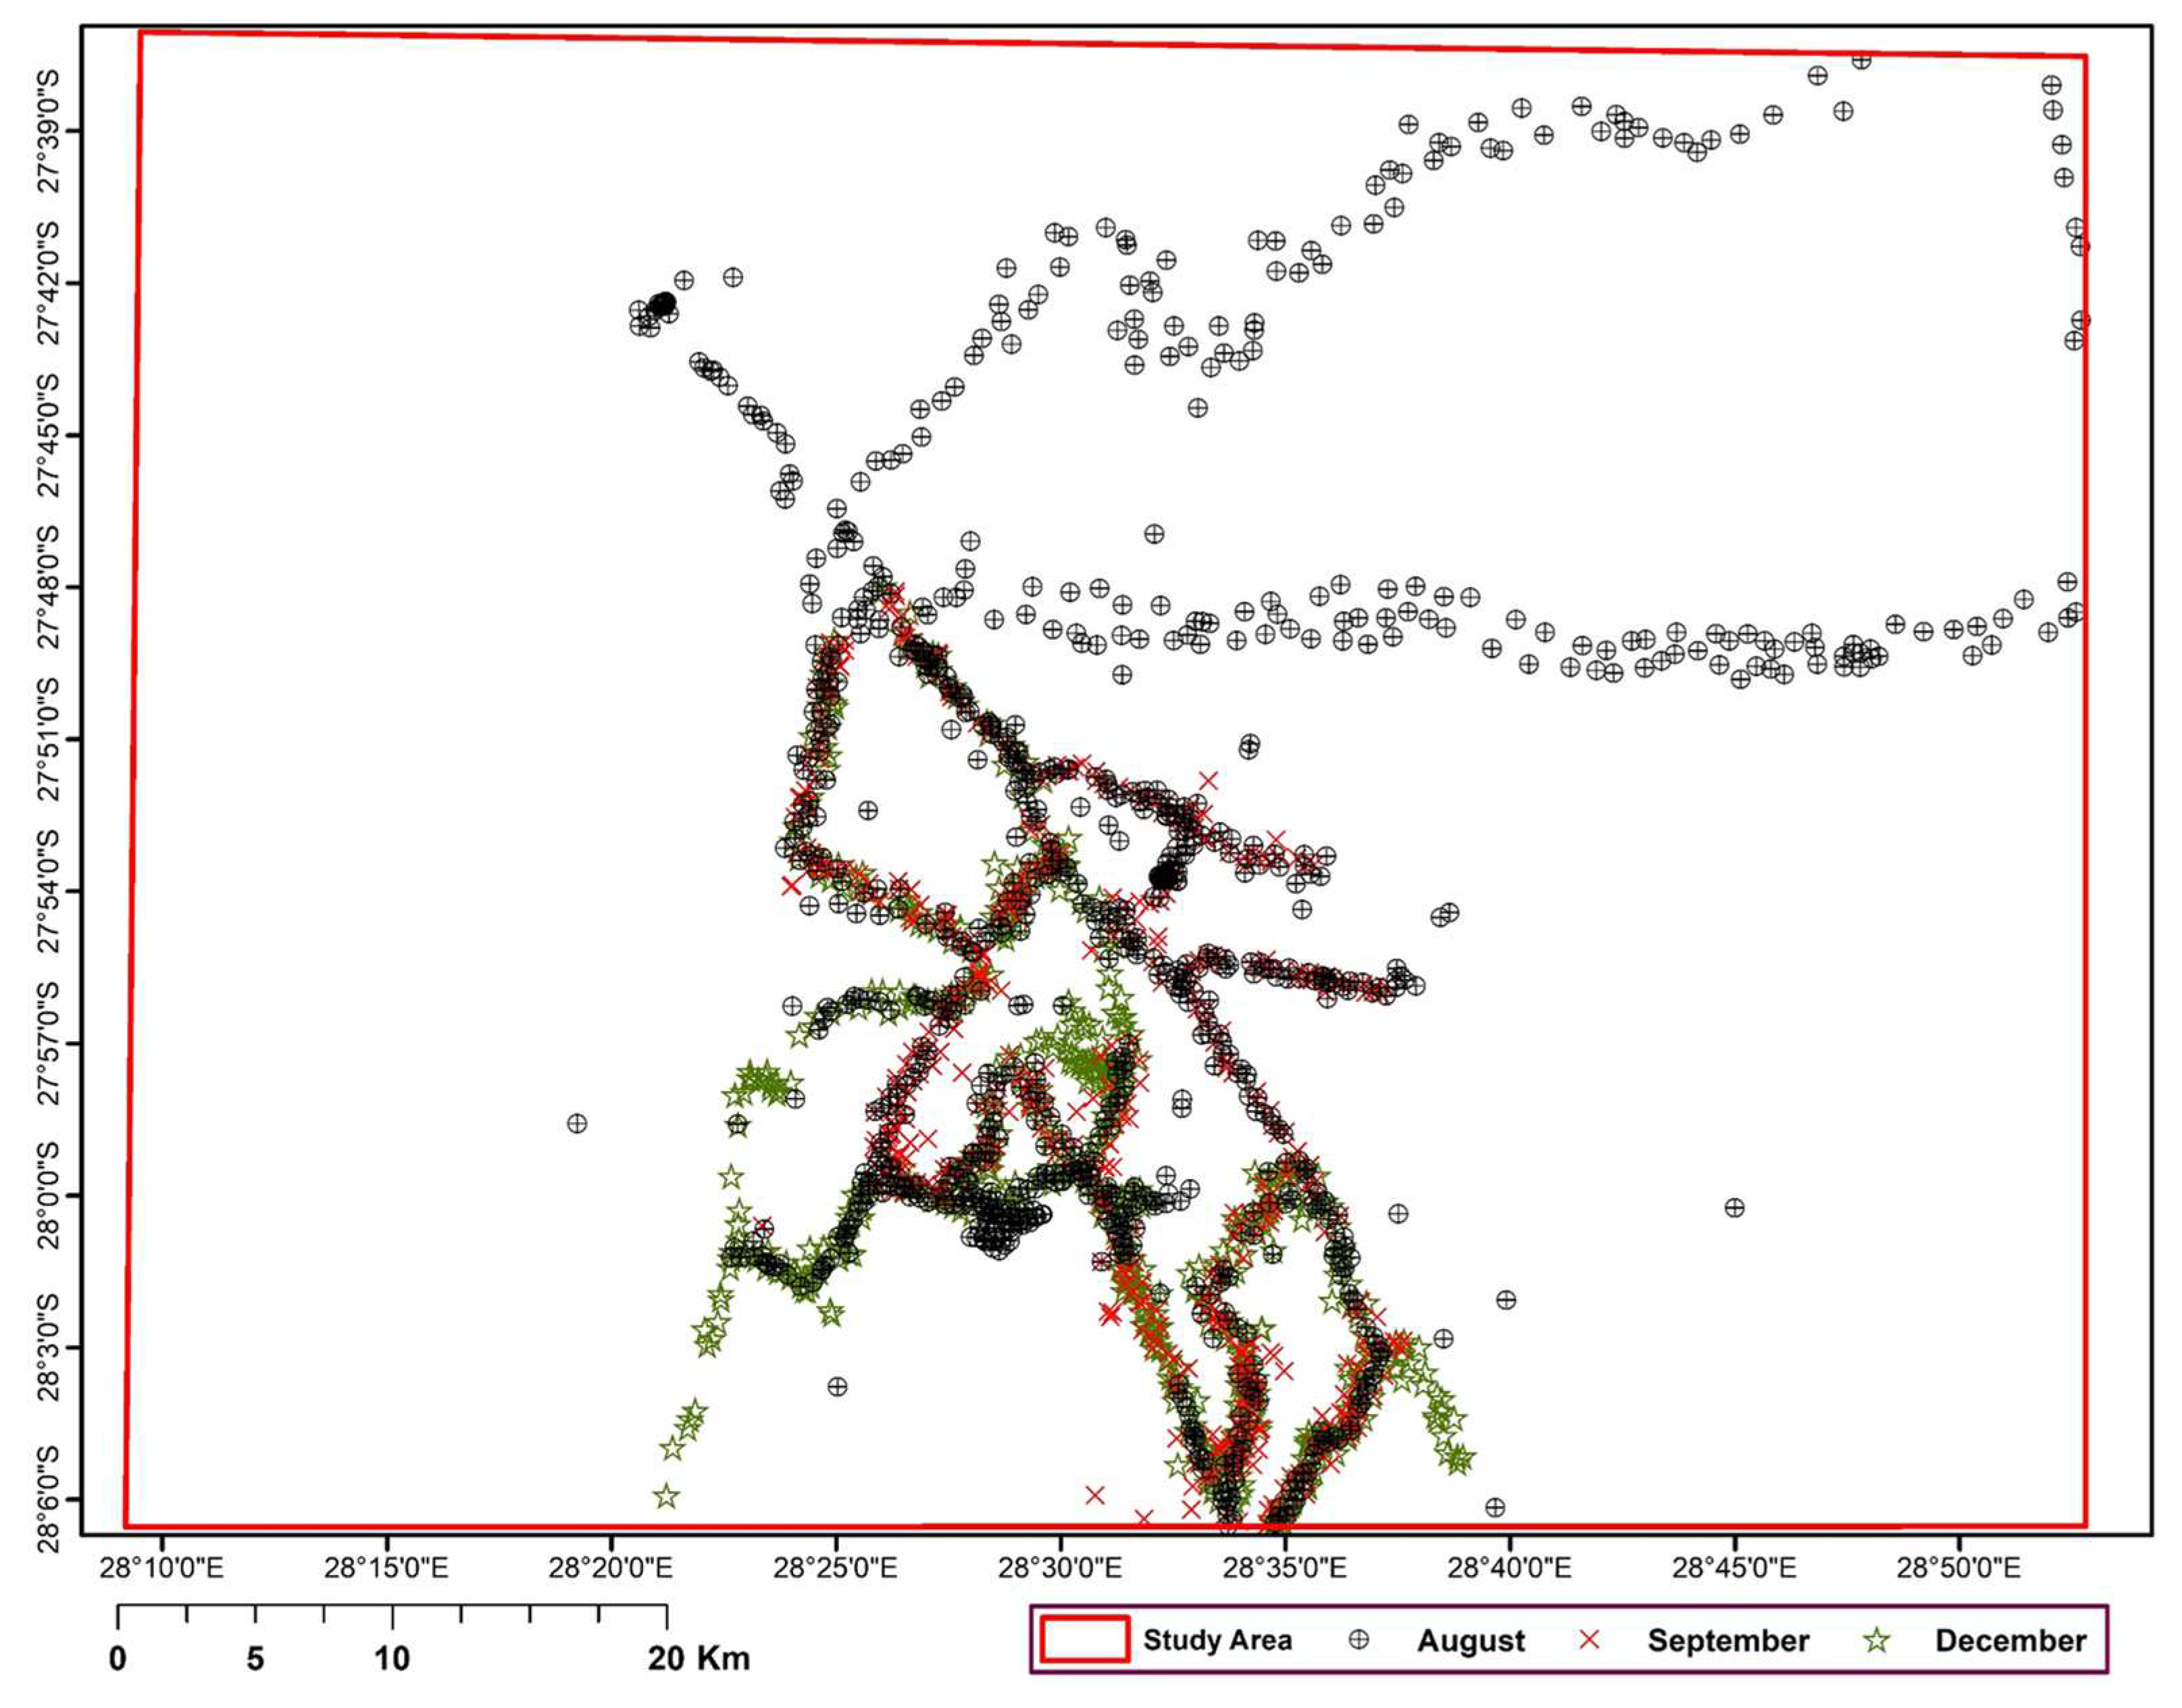
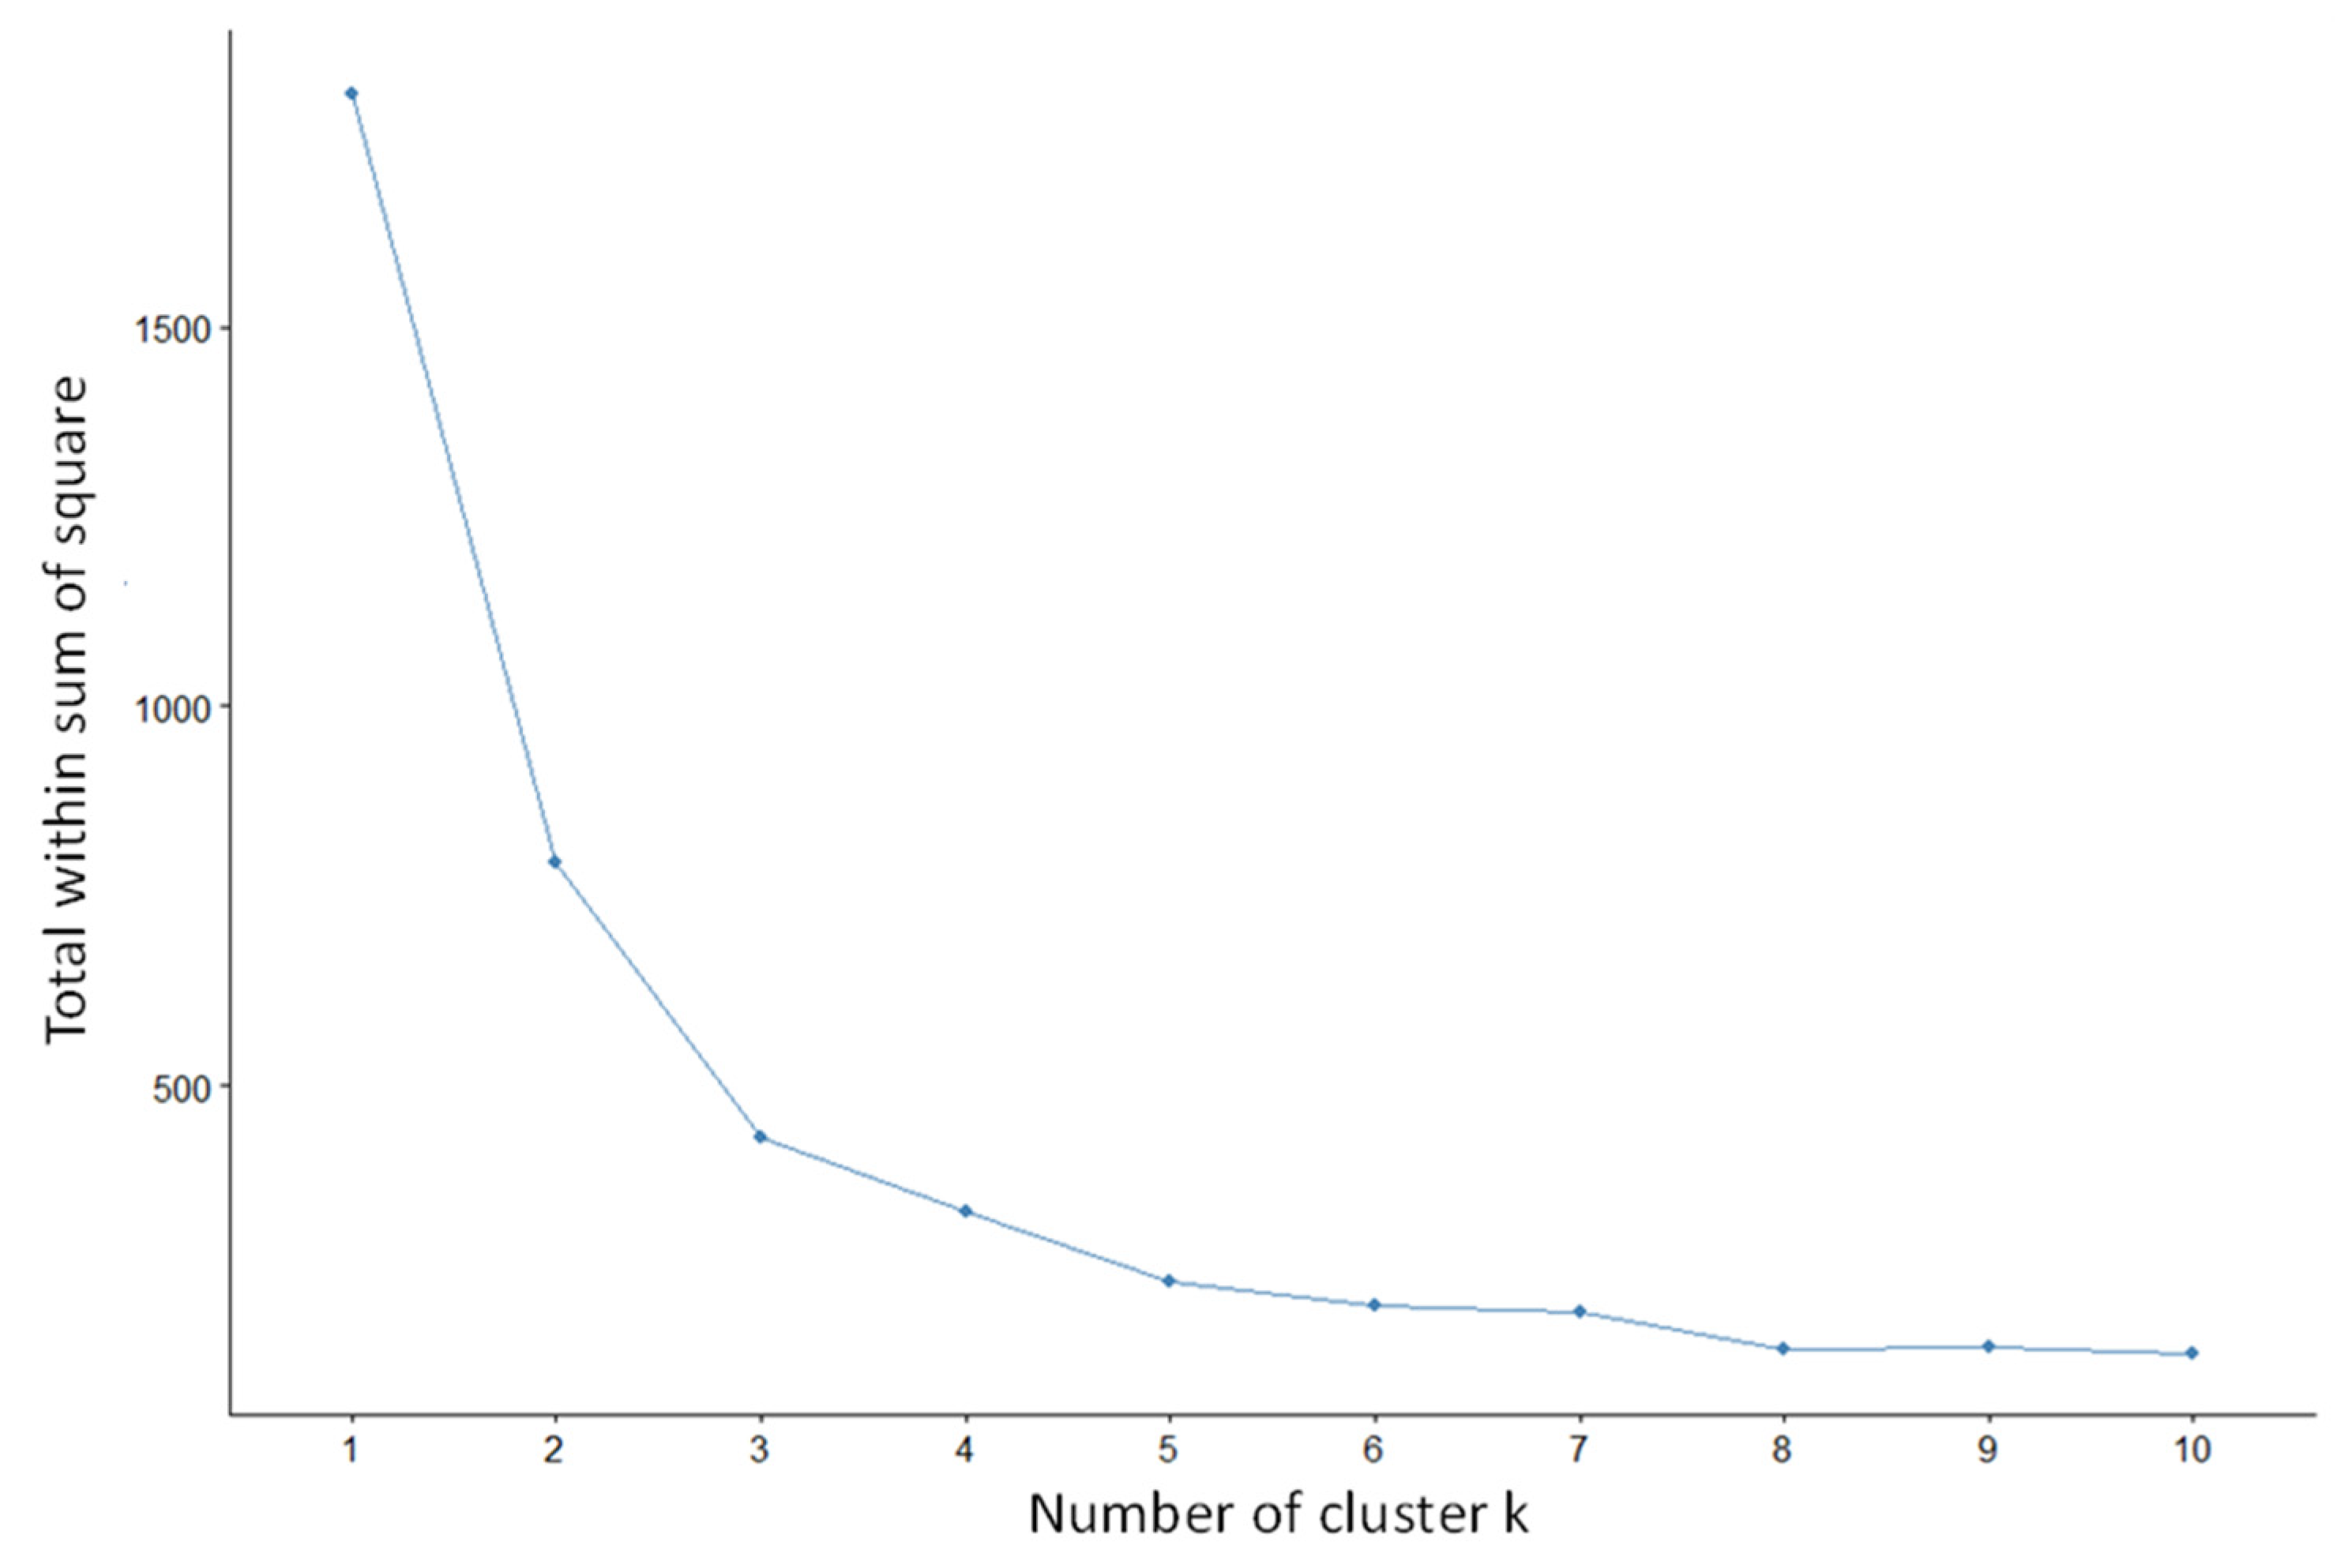
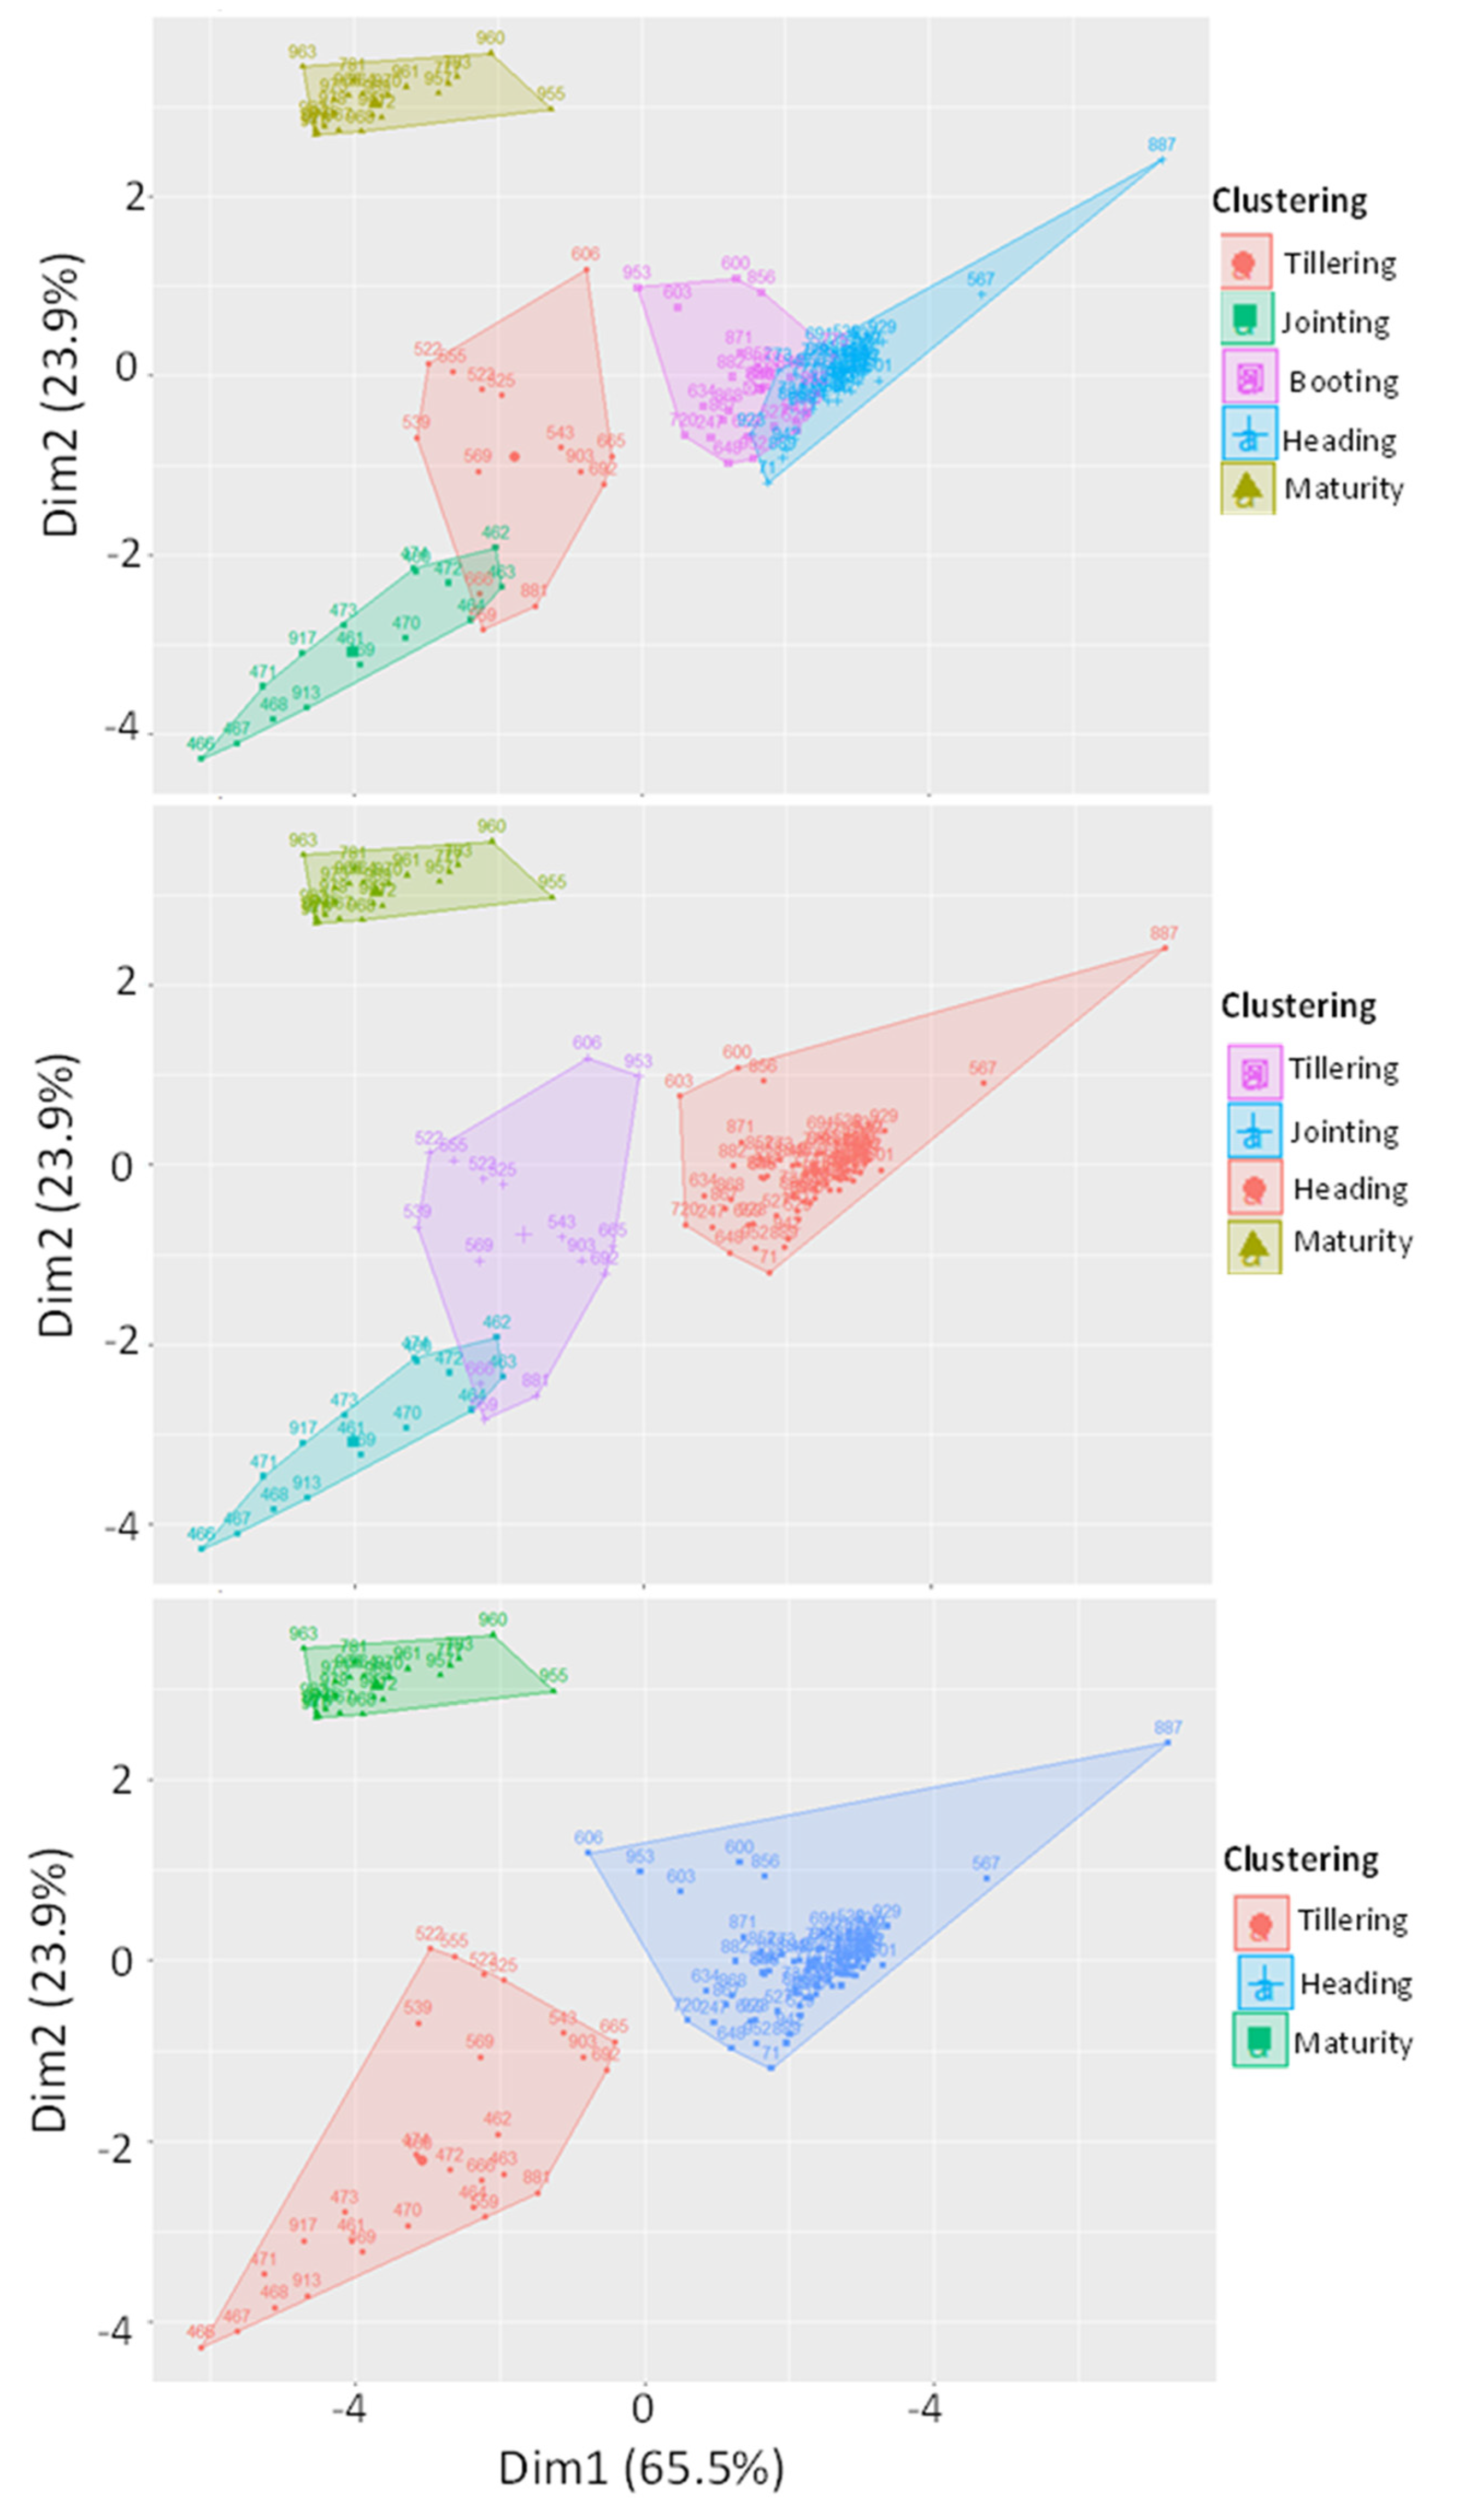
| a. The classification accuracy of dataset grouped into five clusters using the K-means clustering | |||||||
|---|---|---|---|---|---|---|---|
| Growth stages | Tillering | Jointing | Booting | Heading | Maturity | Total | UA |
| Tillering | 582 | 291 | 73 | 72 | 0 | 1018 | 57.17% |
| Jointing | 710 | 1065 | 118 | 118 | 0 | 2011 | 52.96% |
| Booting | 31 | 64 | 958 | 542 | 0 | 1595 | 60.06% |
| Heading | 0 | 225 | 561 | 1685 | 112 | 2583 | 65.23% |
| Maturity | 0 | 0 | 41 | 81 | 937 | 1059 | 88.48% |
| Total | 1323 | 1645 | 1751 | 2498 | 1049 | 8266 | |
| PA | 43.99% | 64.74% | 54.71% | 67.45% | 89.32% | OA = 63.23% | |
| b. The classification accuracy of dataset grouped into four clusters using the K-means clustering | |||||||
| Growth stages | Tillering | Jointing | Heading | Maturity | Total | UA | |
| Tillering | 582 | 363 | 73 | 0 | 1018 | 57.11% | |
| Jointing | 710 | 946 | 355 | 0 | 2011 | 47.04% | |
| Heading | 57 | 114 | 3835 | 172 | 4178 | 91.79% | |
| Maturity | 0 | 41 | 163 | 855 | 1059 | 80.74% | |
| Total | 1349 | 1465 | 4426 | 1027 | 8267 | ||
| PA | 43.14% | 64.57% | 86.65% | 83.25% | OA = 75.21% | ||
| c. The classification accuracy of dataset grouped into three clusters using the K-means clustering | |||||||
| Growth stages | Tillering | Heading | Maturity | Total | UA | ||
| Tillering | 2834 | 195 | 0 | 3029 | 93.56% | ||
| Heading | 114 | 3778 | 286 | 4178 | 90.43% | ||
| Maturity | 41 | 203 | 815 | 1059 | 76.96% | ||
| Total | 2989 | 4176 | 1101 | 8266 | |||
| PA | 94.81% | 90.47% | 74.02% | OA = 89.33% | |||
| a. Accuracy assessment for winter wheat classification map in August 2020 | |||||||||||
|---|---|---|---|---|---|---|---|---|---|---|---|
| Class | Built up | Furrow | Grass | N. veg | Water | Wheat | Total | UA | |||
| Built up | 25 | 6 | 0 | 0 | 4 | 0 | 35 | 71.43% | |||
| Furrow | 1 | 63 | 28 | 0 | 1 | 10 | 103 | 61.17% | |||
| Grass | 1 | 23 | 187 | 4 | 3 | 4 | 222 | 84.23% | |||
| N.V | 2 | 5 | 3 | 42 | 1 | 3 | 56 | 75.00% | |||
| Water | 1 | 0 | 0 | 0 | 58 | 1 | 60 | 96.67% | |||
| Wheat | 2 | 26 | 13 | 7 | 4 | 88 | 140 | 62.86% | |||
| Total | 32 | 123 | 231 | 53 | 72 | 106 | 616 | ||||
| PA | 78.13% | 51.22% | 80.95% | 79.25% | 80.56% | 83.02% | OA = 75.16% | ||||
| b. Accuracy assessment for winter wheat classification map in October 2020 | |||||||||||
| Class | Built up | Furrow | Grass | Maize | NV | Water | WT | WH | Total | UA | |
| Built up | 30 | 2 | 3 | 0 | 1 | 6 | 0 | 0 | 42 | 71.43% | |
| Furrow | 1 | 79 | 3 | 38 | 0 | 3 | 4 | 0 | 128 | 61.72% | |
| Grass | 1 | 3 | 184 | 20 | 6 | 2 | 3 | 4 | 223 | 82.51% | |
| Maize | 0 | 37 | 7 | 189 | 0 | 2 | 5 | 0 | 240 | 78.75% | |
| NV | 6 | 1 | 12 | 4 | 189 | 9 | 1 | 1 | 223 | 84.75% | |
| Water | 1 | 0 | 0 | 0 | 0 | 60 | 0 | 1 | 62 | 96.77% | |
| WT | 0 | 11 | 15 | 12 | 2 | 7 | 145 | 5 | 197 | 73.60% | |
| WH | 0 | 0 | 15 | 4 | 14 | 7 | 4 | 136 | 180 | 75.56% | |
| Total | 39 | 133 | 239 | 267 | 212 | 96 | 162 | 147 | 1295 | ||
| PA | 76.92% | 59.40% | 76.99% | 70.79% | 89.15% | 62.50% | 89.51% | 92.52% | OA = 78.14% | ||
| c. Accuracy assessment for winter wheat classification map in December 2020 | |||||||||||
| Class | Beans | Built up | Furrow | Grass | Maize | N. veg | Water | WM | Total | UA | |
| Beans | 27 | 0 | 3 | 3 | 0 | 0 | 1 | 0 | 34 | 79.41% | |
| Built up | 0 | 20 | 3 | 5 | 0 | 0 | 0 | 0 | 28 | 71.43% | |
| Furrow | 5 | 1 | 67 | 3 | 2 | 0 | 0 | 16 | 94 | 71.28% | |
| Grass | 1 | 0 | 11 | 210 | 13 | 0 | 0 | 9 | 244 | 86.07% | |
| Maize | 0 | 0 | 1 | 41 | 210 | 2 | 0 | 3 | 257 | 81.71% | |
| NV | 1 | 0 | 0 | 0 | 16 | 109 | 0 | 3 | 129 | 84.50% | |
| Water | 0 | 5 | 0 | 0 | 0 | 0 | 58 | 1 | 64 | 90.63% | |
| WM | 0 | 2 | 7 | 3 | 23 | 1 | 2 | 78 | 116 | 67.24% | |
| Total | 34 | 28 | 92 | 265 | 264 | 112 | 61 | 110 | 932 | ||
| PA | 79.41% | 71.43% | 72.83% | 79.25% | 79.55% | 97.32% | 95.08% | 70.91% | OA = 83.58% | ||
Disclaimer/Publisher’s Note: The statements, opinions and data contained in all publications are solely those of the individual author(s) and contributor(s) and not of MDPI and/or the editor(s). MDPI and/or the editor(s) disclaim responsibility for any injury to people or property resulting from any ideas, methods, instructions or products referred to in the content. |
© 2023 by the authors. Licensee MDPI, Basel, Switzerland. This article is an open access article distributed under the terms and conditions of the Creative Commons Attribution (CC BY) license (http://creativecommons.org/licenses/by/4.0/).


