Submitted:
09 June 2023
Posted:
09 June 2023
You are already at the latest version
Abstract
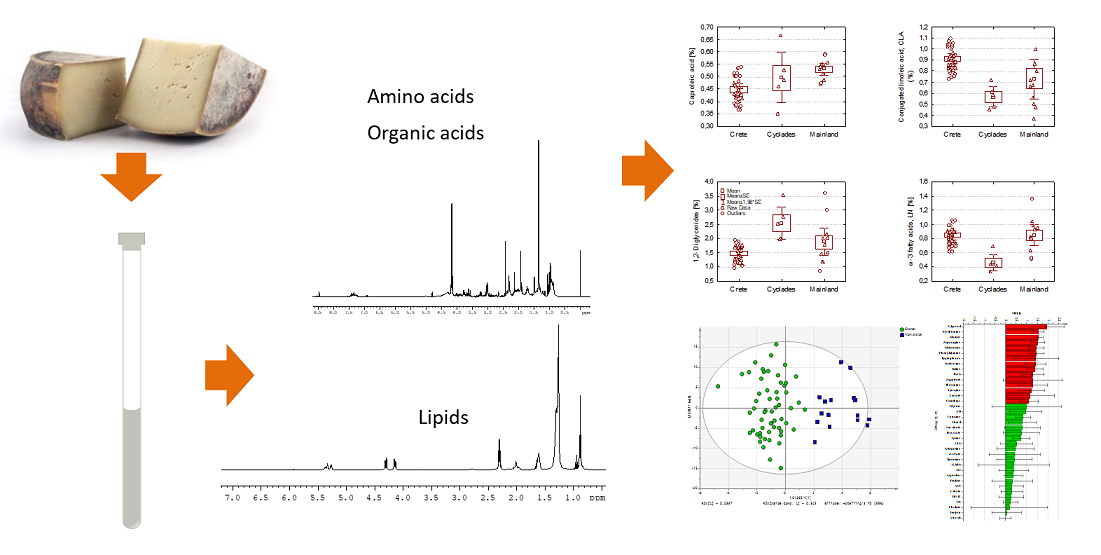
Keywords:
1. Introduction
2. Results and Discussion
2.1. Analysis of 1H NMR spectra
2.1.1. Polar fraction
2.1.2. Lipid fraction
2.2. Analysis of Variance (Anova) of graviera composition
2.3. Discriminant Analysis
3. Materials and Methods
3.1. Chemicals
3.2. Samples
3.3. Sample Preparation-NMR analysis
3.4. Spectra integration and multivariate statistical analysis
Supplementary Materials
Funding
Data Availability Statement
Conflicts of Interest
References
- EC. Commission of the European Communities. Commission Regulation (EC) No 1107/96 of 12 June 1996 on the registration of geographical indications and designations of origin under the procedure laid down in Article 17 of Council Regulation (EEC) No 2081/92. Off J Eur Commun 1996, 39, 1–10. [Google Scholar]
- McSweeney, P.L.H.; Fox, P.F.; Ciocia, F. Chapter 16 - Metabolism of Residual Lactose and of Lactate and Citrate. In Cheese (Fourth Edition); McSweeney, P.L.H., Fox, P.F., Cotter, P.D., Everett, D.W., Eds.; Academic Press: San Diego, 2017; pp. 411–421. [Google Scholar]
- Fox, P.F. Proteolysis during cheese manufacture and ripening. J Dairy Sci 1989, 72, 1379–1400. [Google Scholar] [CrossRef]
- Collins, Y.F.; McSweeney, P.L.H.; Wilkinson, M.G. Lipolysis and free fatty acid catabolism in cheese: a review of current knowledge. Int Dairy J 2003, 13, 841–866. [Google Scholar] [CrossRef]
- Tzora, A.; Nelli, A.; Voidarou, C.; Fotou, K.; Bonos, E.; Rozos, G.; Grigoriadou, K.; Papadopoulos, P.; Basdagianni, Z.; Giannenas, I.; et al. Impact of an Omega-3-Enriched Sheep Diet on the Microbiota and Chemical Composition of Kefalograviera Cheese. Foods 2022, 11, 843. [Google Scholar] [CrossRef] [PubMed]
- Segato, S.; Caligiani, A.; Contiero, B.; Galaverna, G.; Bisutti, V.; Cozzi, G. 1H NMR metabolic profile to discriminate pasture based alpine asiago PDO cheeses. Animals 2019, 9. [Google Scholar] [CrossRef] [PubMed]
- Danezis, G.; Theodorou, C.; Massouras, T.; Zoidis, E.; Hadjigeorgiou, I.; Georgiou, C.A. Greek graviera cheese assessment through elemental metabolomics-implications for authentication, safety and nutrition. Molecules 2019, 24, 670. [Google Scholar] [CrossRef]
- Bozoudi, D.; Pavlidou, S.; Kotzamanidis, C.; Georgakopoulos, P.; Torriani, S.; Kondyli, E.; Claps, S.; Belibasaki, S.; Litopoulou-Tzanetaki, E. “Graviera Naxou and Graviera Kritis Greek PDO cheeses: Discrimination based on microbiological and physicochemical criteria and volatile organic compounds profile”. Small Ruminant Res 2016, 136, 161–172. [Google Scholar] [CrossRef]
- EC. Commission of the European Communities. Council Regulation (EC) No 510/2006 of 20 March 2006 on the protection of geographical indications and designations of origin for agricultural products and foodstuffs. Off J Eur Commun 2006, 93, 12–25. [Google Scholar]
- Vatavali, K.A.; Kosma, I.S.; Louppis, A.P.; Badeka, A.V.; Kontominas, M.G. Physicochemical, spectroscopic, and chromatographic analyses in combination with chemometrics for the discrimination of the geographical origin of Greek Graviera Cheeses. Molecules 2020, 25. [Google Scholar] [CrossRef]
- Danezis, G.P.; Tsiplakou, E.; Pappa, E.C.; Pappas, A.C.; Mavrommatis, A.; Sotirakoglou, K.; Georgiou, C.A.; Zervas, G. Fatty acid profile and physicochemical properties of Greek protected designation of origin cheeses, implications for authentication. Eur Food Res Technol 2020, 246, 1741–1753. [Google Scholar] [CrossRef]
- Georgala, A.; Kaminarides, S.; Anifantakis, E.M. Free fatty acid content of some traditional Greek cheese varieties. Aust J Dairy Technol 2006, 61, 26–31. [Google Scholar]
- Gianferri, R.; Maioli, M.; Delfini, M.; Brosio, E. A low-resolution and high-resolution nuclear magnetic resonance integrated approach to investigate the physical structure and metabolic profile of Mozzarella di Bufala Campana cheese. Int Dairy J 2007, 17, 167–176. [Google Scholar] [CrossRef]
- Scano, P.; Anedda, R.; Melis, M.P.; Dessi, M.A.; Lai, A.; Roggio, T. 1H- and 13C-NMR characterization of the molecular components of the lipid fraction of Pecorino Sardo cheese. J Am Oil Chem Soc 2011, 88, 1305–1316. [Google Scholar] [CrossRef]
- Scano, P.; Cagliani, L.R.; Consonni, R. 1H NMR characterisation of the lipid fraction and the metabolite profiles of Fossa (pit) cheese. Int Dairy J 2019, 90, 39–44. [Google Scholar] [CrossRef]
- De Angelis Curtis, S.; Curini, R.; Delfini, M.; Brosio, E.; D'Ascenzo, F.; Bocca, B. Amino acid profile in the ripening of Grana Padano cheese: A NMR study. Food Chem 2000, 71, 495–502. [Google Scholar] [CrossRef]
- Piras, C.; Marincola, F.C.; Savorani, F.; Engelsen, S.B.; Cosentino, S.; Viale, S.; Pisano, M.B. A NMR metabolomics study of the ripening process of the Fiore Sardo cheese produced with autochthonous adjunct cultures. Food Chem 2013, 141, 2137–2147. [Google Scholar] [CrossRef]
- Consonni, R.; Cagliani, L.R. Ripening and geographical characterization of Parmigiano Reggiano cheese by 1H NMR spectroscopy. Talanta 2008, 76, 200–205. [Google Scholar] [CrossRef]
- Brescia, M.A.; Monfreda, M.; Buccolieri, A.; Carrino, C. Characterisation of the geographical origin of buffalo milk and mozzarella cheese by means of analytical and spectroscopic determinations. Food Chem 2005, 89, 139–147. [Google Scholar] [CrossRef]
- Schievano, E.; Pasini, G.; Cozzi, G.; Mammi, S. Identification of the production chain of Asiago d'Allevo cheese by nuclear magnetic resonance spectroscopy and principal component analysis. J Agr Food Chem 2008, 56, 7208–7214. [Google Scholar] [CrossRef] [PubMed]
- Shintu, L.; Caldarelli, S. Toward the determination of the geographical origin of emmental(er) cheese via high resolution MAS NMR: A preliminary investigation. J Agr Food Chem 2006, 54, 4148–4154. [Google Scholar] [CrossRef] [PubMed]
- Mazzei, P.; Piccolo, A. 1H HRMAS-NMR metabolomic to assess quality and traceability of mozzarella cheese from Campania buffalo milk. Food Chem 2012, 132, 1620–1627. [Google Scholar] [CrossRef] [PubMed]
- Rodrigues, D.; Santos, C.H.; Rocha-Santos, T.A.P.; Gomes, A.M.; Goodfellow, B.J.; Freitas, A.C. Metabolic profiling of potential probiotic or synbiotic cheeses by Nuclear Magnetic Resonance (NMR) spectroscopy. J Agr Food Chem 2011, 59, 4955–4961. [Google Scholar] [CrossRef]
- Georgala, A.K.; Kaminarides, S.E.; Anifantakis, E.M. Free fatty acid content of some traditional Greek cheese varieties. Aust J Dairy Technol 2006, 61, 26–31. [Google Scholar]
- Dudley, E.G.; Steele, J.L. Succinate production and citrate catabolism by Cheddar cheese nonstarter lactobacilli. J Appl Microbiol 2005, 98, 14–23. [Google Scholar] [CrossRef]
- Warmke, R.; Belitz, H.D.; Grosch, W. Evaluation of taste compounds of Swiss cheese (Emmentaler). Zeitschrift für Lebensmittel-Untersuchung und Forschung 1996, 203, 230–235. [Google Scholar] [CrossRef]
- Fox, P.F.; Lucey, J.A.; Cogan, T.M. Glycolysis and related reactions during cheese manufacture and ripening. Crit Rev Food Sci Nutr 1990, 29, 237–253. [Google Scholar] [CrossRef] [PubMed]
- Yerlikaya, O.; Gucer, L.; Akan, E.; Meric, S.; Aydin, E.; Kinik, O. Benzoic acid formation and its relationship with microbial properties in traditional Turkish cheese varieties. Food Bioscience 2021, 41, 101040. [Google Scholar] [CrossRef]
- Bütikofer, U.; Fuchs, D. Development of free amino acids in Appenzeller, Emmentaler, Gruyère, Raclette, Sbrinz and Tilsiter cheese. Lait 1997, 77, 91–100. [Google Scholar] [CrossRef]
- Ochi, H.; Naito, H.; Iwatsuki, K.; Bamba, T.; Fukusaki, E. Metabolomics-based component profiling of hard and semi-hard natural cheeses with gas chromatography/time-of-flight-mass spectrometry, and its application to sensory predictive modeling. Journal of Bioscience and Bioengineering 2012, 113, 751–758. [Google Scholar] [CrossRef]
- Carafa, I.; Stocco, G.; Nardin, T.; Larcher, R.; Bittante, G.; Tuohy, K.; Franciosi, E. Production of Naturally γ-Aminobutyric Acid-Enriched Cheese Using the Dairy Strains Streptococcus thermophilus 84C and Lactobacillus brevis DSM 32386. Frontiers in microbiology 2019, 10, 93. [Google Scholar] [CrossRef]
- Diana, M.; Rafecas, M.; Arco, C.; Quílez, J. Free amino acid profile of Spanish artisanal cheeses: Importance of gamma-aminobutyric acid (GABA) and ornithine content. Journal of Food Composition and Analysis 2014, 35, 94–100. [Google Scholar] [CrossRef]
- ten Brink, B.; Damink, C.; Joosten, H.M.L.J.; Huis in 't Veld, J.H.J. Occurrence and formation of biologically active amines in foods. Int J Food Microbiol 1990, 11, 73–84. [Google Scholar] [CrossRef] [PubMed]
- Dhiman, T.R.; Anand, G.R.; Satter, L.D.; Pariza, M.W. Conjugated Linoleic Acid Content of Milk from Cows Fed Different Diets1. J Dairy Sci 1999, 82, 2146–2156. [Google Scholar] [CrossRef] [PubMed]
- Tsiafoulis, C.G.; Papaemmanouil, C.; Alivertis, D.; Tzamaloukas, O.; Miltiadou, D.; Balayssac, S.; Malet-Martino, M.; Gerothanassis, I.P. NMR-Based Μetabolomics of the Lipid Fraction of Organic and Conventional Bovine Milk. Molecules 2019, 24, 1067. [Google Scholar] [CrossRef] [PubMed]
- Vatavali, K.; Kosma, I.; Louppis, A.; Gatzias, I.; Badeka, A.V.; Kontominas, M.G. Characterisation and differentiation of geographical origin of Graviera cheeses produced in Greece based on physico-chemical, chromatographic and spectroscopic analyses, in combination with chemometrics. Int Dairy J 2020, 110, 104799. [Google Scholar] [CrossRef]
- Zlatanos, S.; Laskaridis, K. Variation in the conjugated linoleic acid content of three traditional greek cheeses during a 1-year period. Journal of Food Quality 2009, 32, 84–95. [Google Scholar] [CrossRef]
- Zlatanos, S.; Laskaridis, K.; Feist, C.; Sagredos, A. CLA content and fatty acid composition of Greek Feta and hard cheeses. Food Chem 2002, 78, 471–477. [Google Scholar] [CrossRef]
- Jensen, R.G. Lipolysis. J Dairy Sci 1964, 47, 210–215. [Google Scholar] [CrossRef]
- Vigli, G.; Philippidis, A.; Spyros, A.; Dais, P. Classification of edible oils by employing 31P and 1H NMR spectroscopy in combination with multivariate statistical analysis. A proposal for the detection of seed oil adulteration in virgin olive oils. J Agr Food Chem 2003, 51, 5715–5722. [Google Scholar] [CrossRef]
- Tsafrakidou, P.; Bozoudi, D.; Pavlidou, S.; Kotzamanidis, C.; Hatzikamari, M.; Zdragas, A.; Litopoulou-Tzanetaki, E. Technological, phenotypic and genotypic characterization of lactobacilli from Graviera Kritis PDO Greek cheese, manufactured at two traditional dairies. Food Sci Technol-Leb 2016, 68, 681–689. [Google Scholar] [CrossRef]
- Abd El-Salam, M.H.; El-Shibiny, S. Conjugated linoleic acid and vaccenic acid contents in cheeses: An overview from the literature. Journal of Food Composition and Analysis 2014, 33, 117–126. [Google Scholar] [CrossRef]
- Ralli, E.; Amargianitaki, M.; Manolopoulou, E.; Misiak, M.; Markakis, G.; Tachtalidou, S.; Kolesnikova, A.; Dais, P.; Spyros, A. NMR Spectroscopy Protocols for Food Metabolomics Applications. Methods in molecular biology (Clifton, N.J.) 2018, 1738, 203–211. [Google Scholar] [CrossRef] [PubMed]
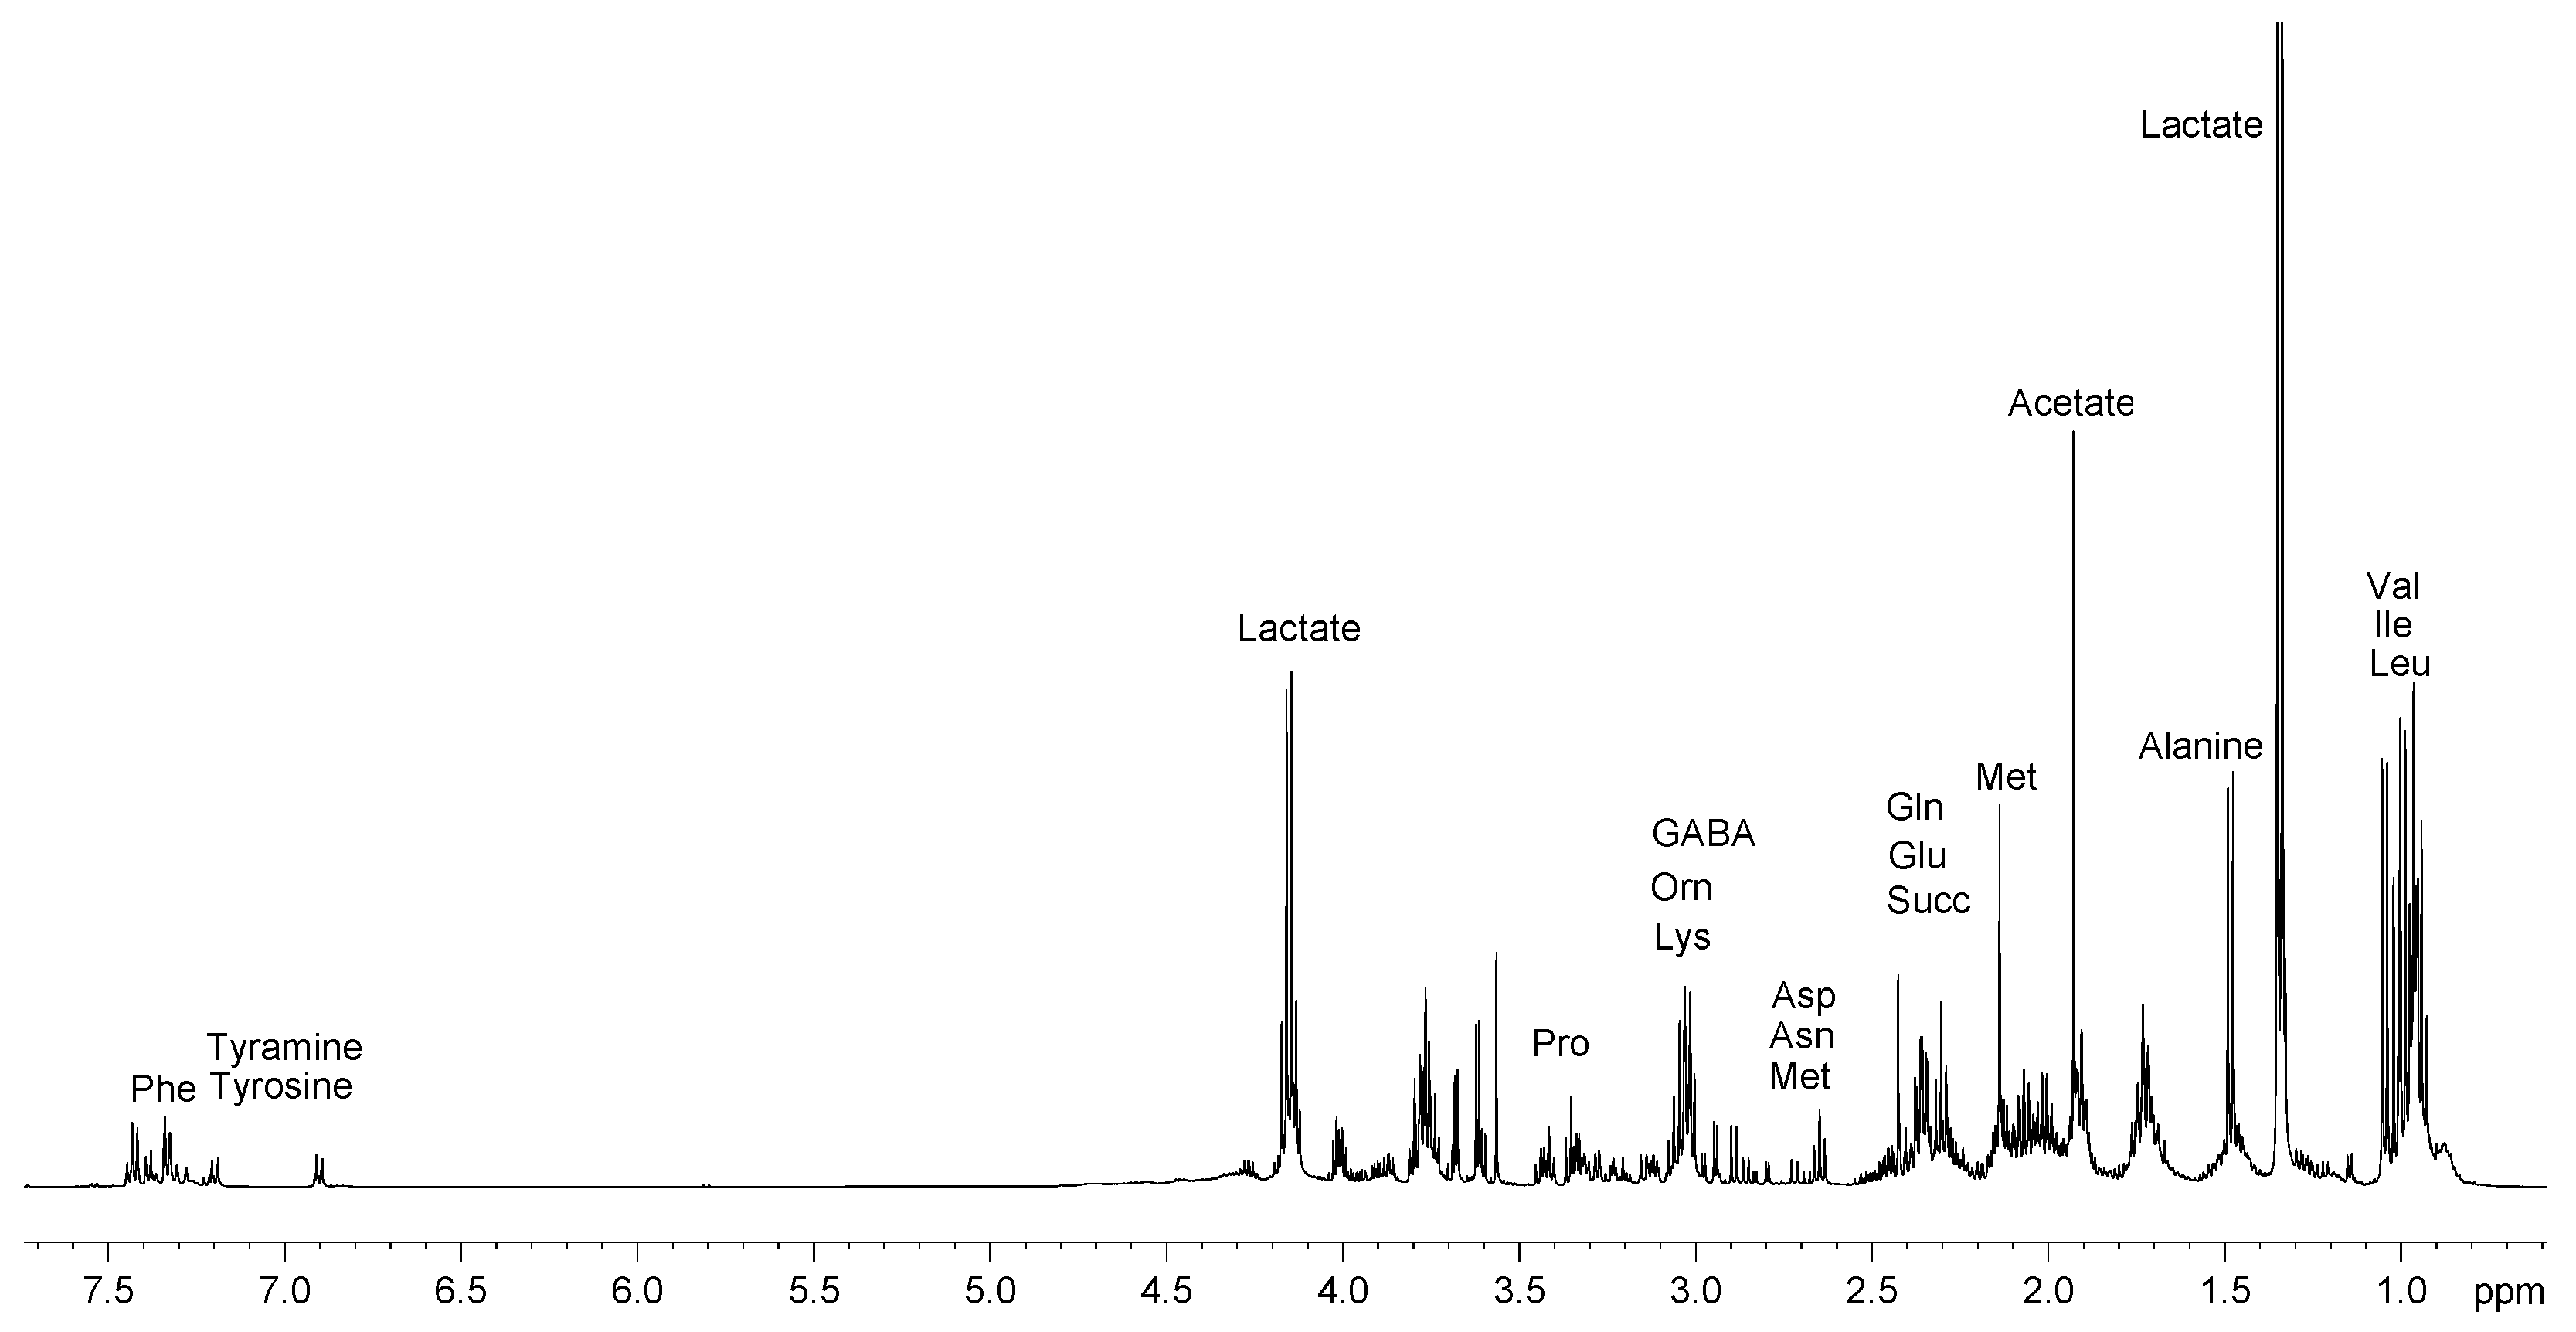
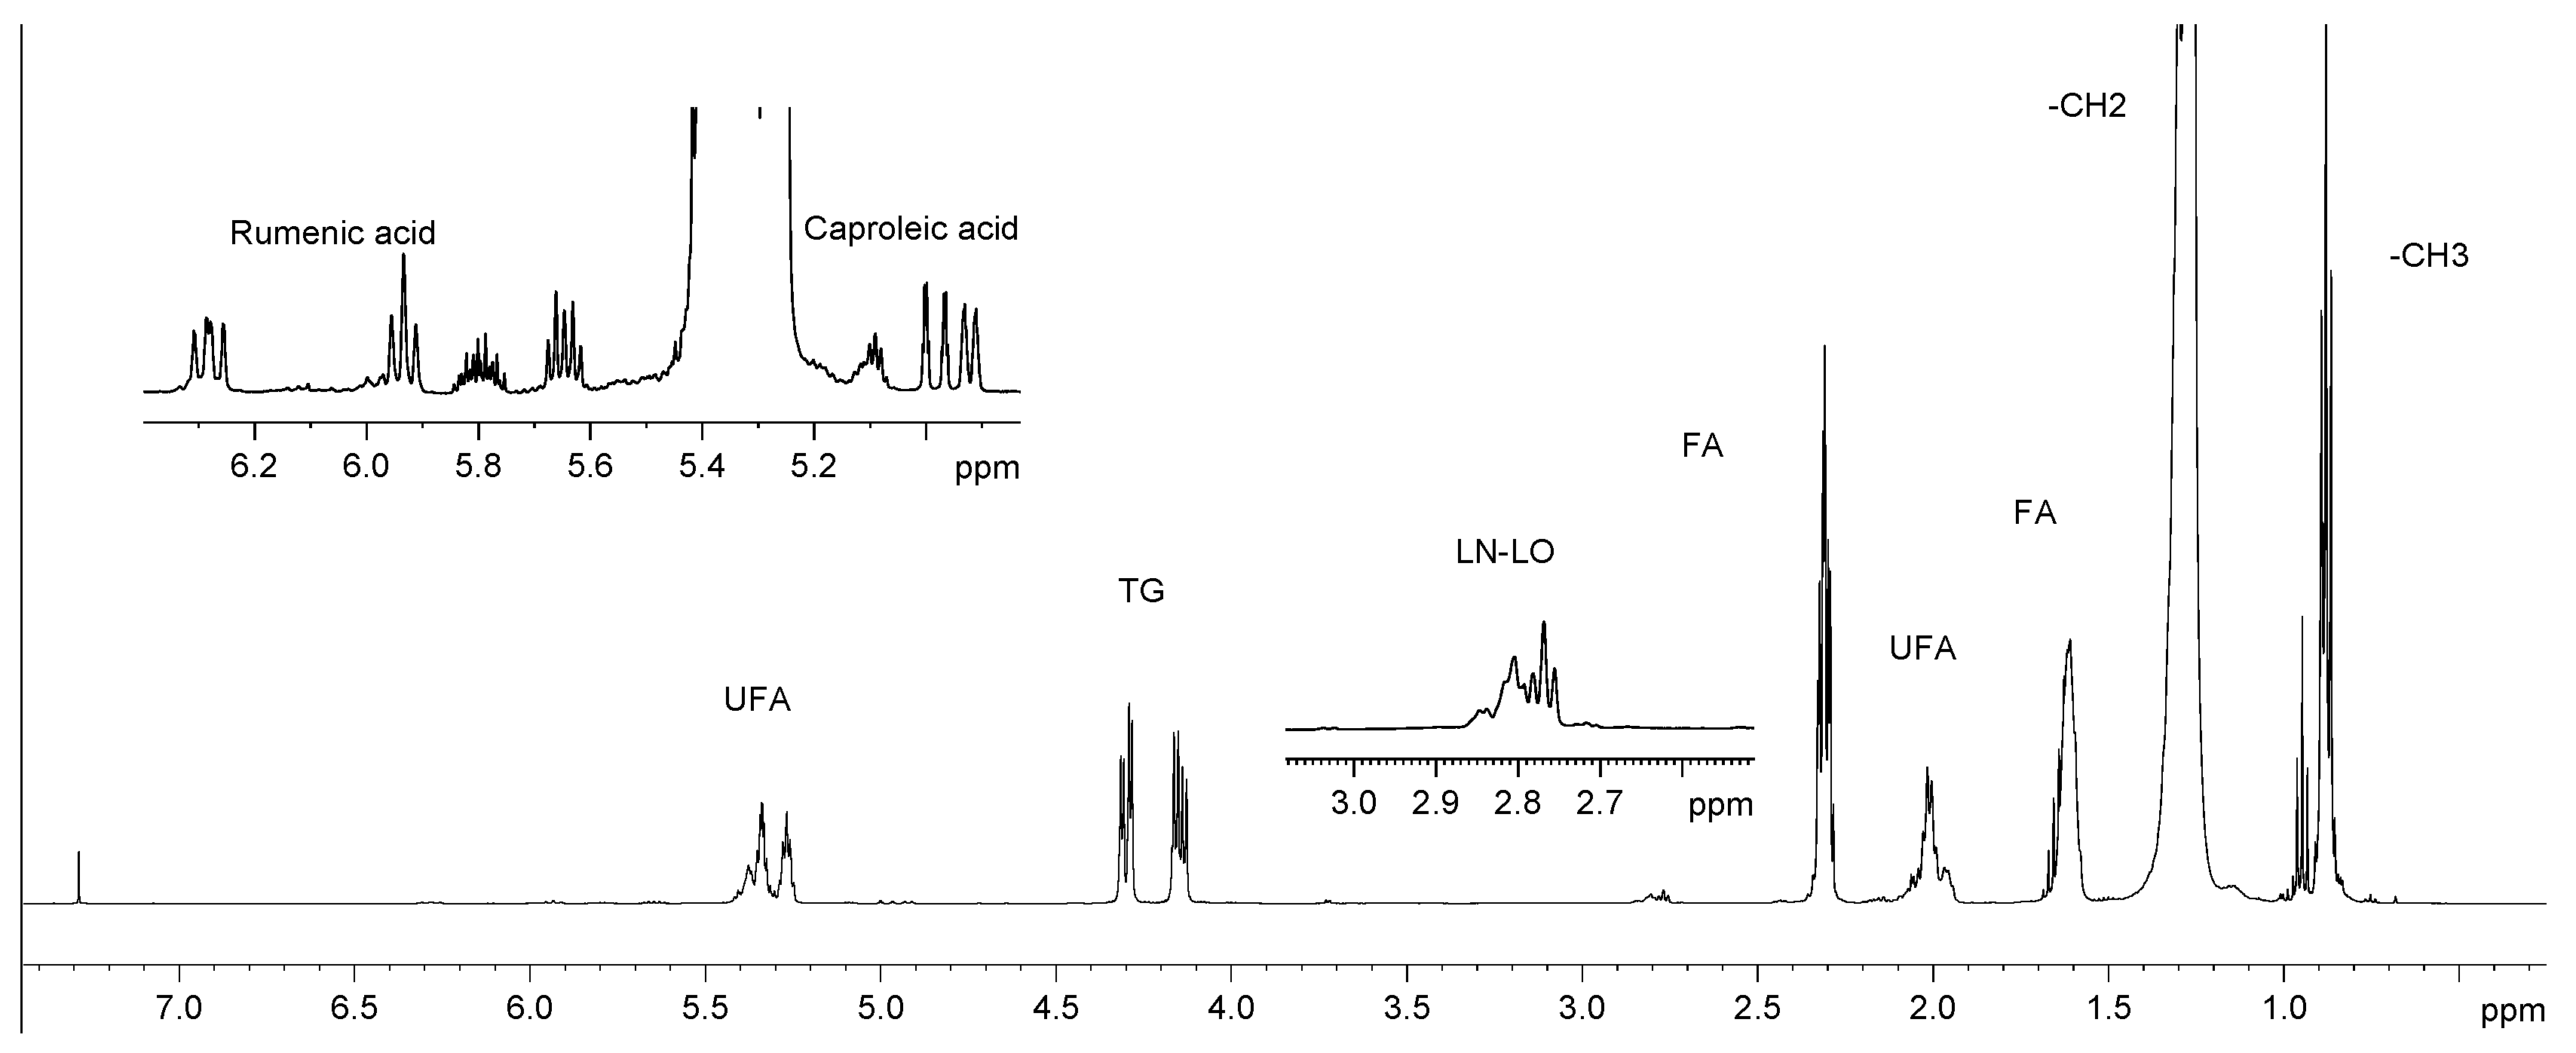
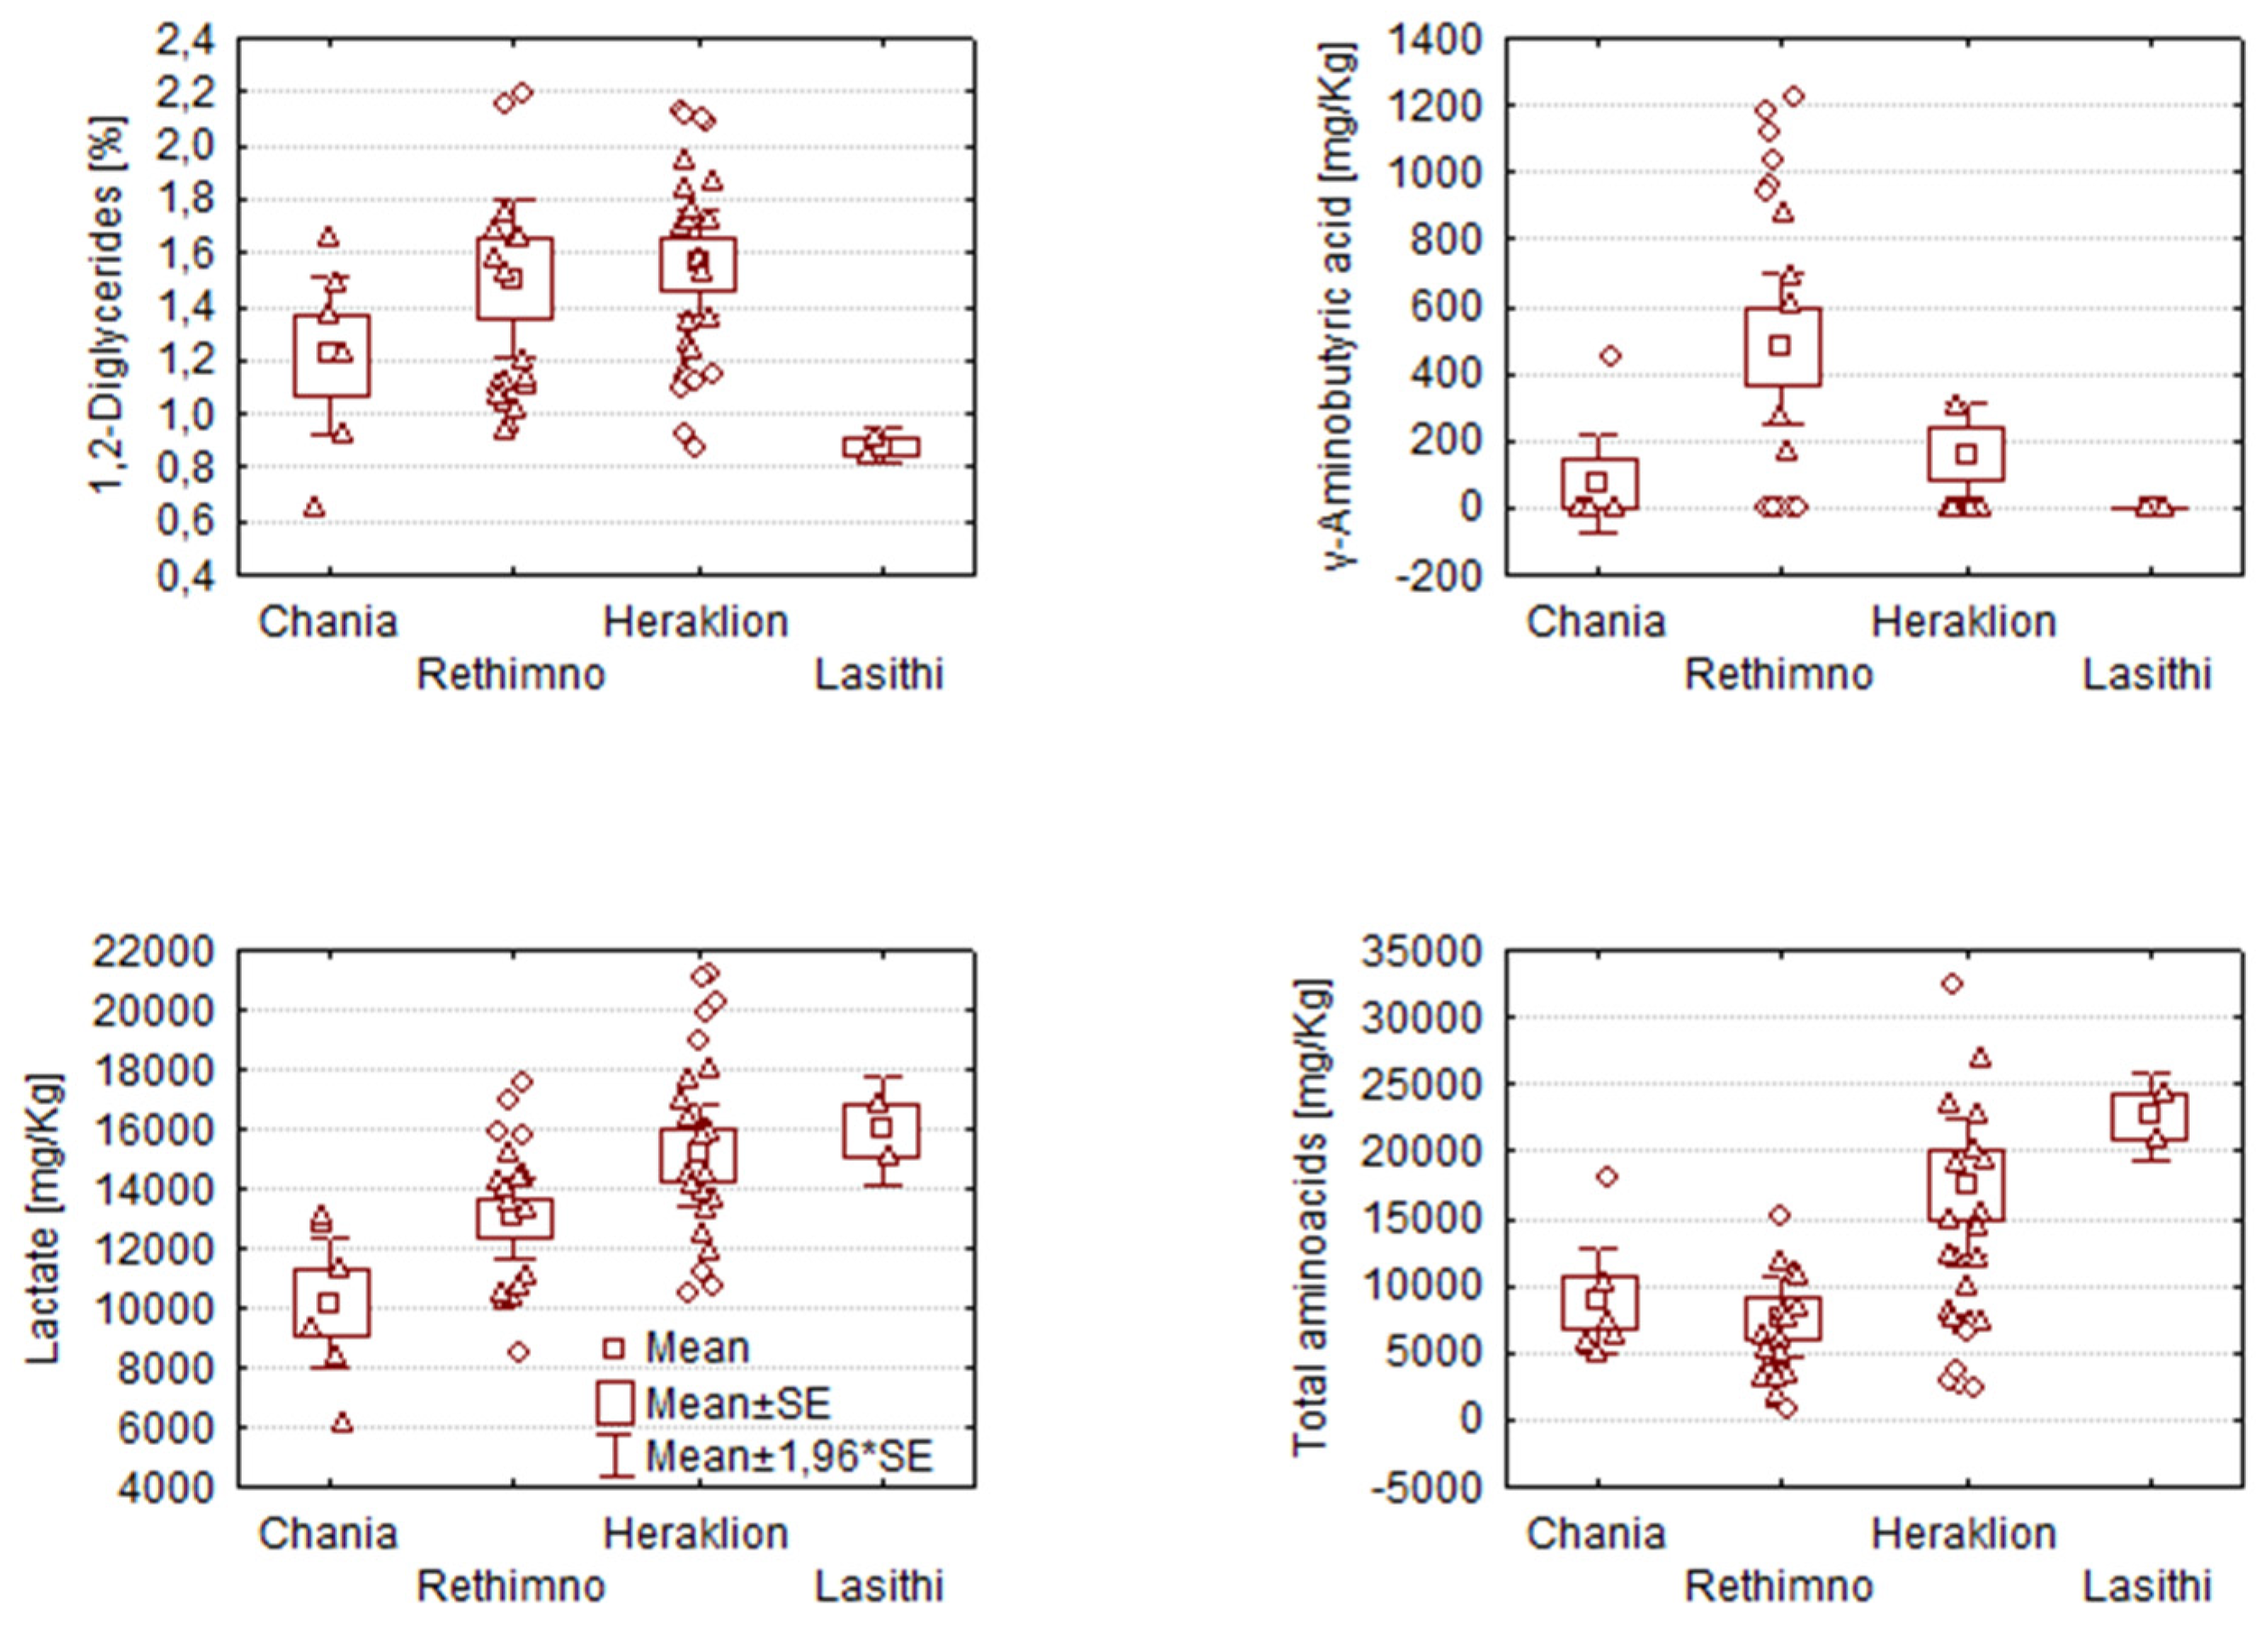
| Compound | Assignment | 1H ppm | 13C ppm | |
|---|---|---|---|---|
| 1 | Acetate | α-CH3 | 1.92 | 26.1 |
| 2 | Alanine | β-CH3 | 1.48 | 18.9 |
| α-CH | 3.78 | 53.7 | ||
| 3 | Arginine | γ-CH2 | 1.68 | 26.83 |
| β,β′-CH2 | 1.9 | 30.12 | ||
| δ,δ′-CH2 | 3.23 | 43.12 | ||
| α-CH | 3.74 | 57.1 | ||
| 4 | Asparagine | β-CH2 | 2.89 | 37.4 |
| α-CH | 4 | 51.5 | ||
| 5 | Aspartate | β′-CH2 | 2.8 | 39.0 |
| α-CH | 3.9 | 53.55 | ||
| 6 | Benzoate | 2,6-CH | 7.87 | 131.85 |
| 7 | Choline | α-CH | 3.21 | 56.67 |
| 8 | Citrate | 2,4 -CH2 | 2.72/2.54 | 47.63 |
| 9 | Cytosine | 2-CH2 | 6.00 | - |
| 10 | Formate | HCOO | 8.5 | 173.55 |
| 11 | GABA | β-CH2 | 1.91 | 26.44 |
| α-CH2 | 2.30 | 36.43 | ||
| γ-CH2 | 3.02 | 42 | ||
| 12 | Glutamate | β,β′-CH2 | 2.09 | 30.1 |
| γ,γ′-CH2 | 2.36 | 36.3 | ||
| α-CH | 3.76 | 56.6 | ||
| 13 | Glutamine | β-CH2 | 2.14 | 28.95 |
| γ-CH2 | 2.46 | 33.62 | ||
| 14 | Glycerol | 2-CH | 3.79 | 74.9 |
| 1,3-CH2 | 3.648 /3.56 | 65.4 | ||
| 15 | Glycine | α-CH2 | 3.56 | 41.5 |
| 16 | Isoleucine | δ-CH3 | 0.94 | 13.8 |
| β'-CH3 | 1.015 | 17.62 | ||
| γ'-CH | 1.27 | 27.6 | ||
| γ-CH | 1.46 | 27.6 | ||
| β-CH | 1.99 | 38.55 | ||
| α-CH | 3.68 | 62.4 | ||
| 17 | Lactate | β-CH3 | 1.34 | 23.04 |
| α-CH | 4.12 | 71.47 | ||
| 18 | Leucine | δ,δ′-CH3 | 0.96 | 20.95/24.6 |
| β-CH2 | 1.72 | 42.5 | ||
| γ-CH | 1.72 | 27.1 | ||
| α-CH | 3.74 | 62.6 | ||
| 20 | Lysine | γ-CH2 | 1,49 | 24.4 |
| δ-CH2 | 1.89 | 33.1 | ||
| ε-CH2 | 3.03 | 41.9 | ||
| α-CH | 3.75 | 56.85 | ||
| 21 | Methionine | δ-CH3/β-CH2 | 2.14 | 16.7 |
| γ-CH2 | 2.65 | 31.5 | ||
| α-CH | 3.85 | 56.7 | ||
| 22 | Ornithine | δ-CH2 | 3.06 | 39.26 |
| γ-CH2 | 1.77 | 25.49 | ||
| β-CH2 | 1.95 | 30.25 | ||
| α-CH | 3.79 | 57.3 | ||
| 23 | Phenylalanine | β-CH2 | 3.14/3.29 | 39.17 |
| α-CH2 | 4 | 58.95 | ||
| 2,6-CH | 7.33 | 131.76 | ||
| 4-CH | 7.37 | 131.9 | ||
| 3,5-CH | 7.429 | 132.09 | ||
| 24 | Proline | 3-CH2 | 2.01 | 27.28 |
| 2-CH2 | 2.35 | 32 | ||
| 4-CH | 3.35 | 48.9 | ||
| 4′-CH | 3.41 | 48.9 | ||
| 1-CH | 4.14 | 64.14 | ||
| 25 | Serine | α-CH | 3.86 | 56.05 |
| β,β′-CH2 | 3.97 | 63.08 | ||
| 26 | Succinate | 2,3 CH2 | 2.412 | 36.22 |
| 27 | Threonine | γ-CH3 | 1.33 | 19.5 |
| α-CH | 3.616 | 62.22 | ||
| β-CH | 4.27 | 65.96 | ||
| 28 | Tryptophan | 4-CH | 7.73 | 118 |
| 29 | Tyramine | α,β-CH2 | 2.931/3.27 | 34.78 |
| 3,5-H | 6.9 | 118.81 | ||
| 2,6-H | 7.22 | 133.69 | ||
| 30 | Tyrosine | 3,5-H | 6.9 | 118.81 |
| 2,6-H | 7.19 | 133.69 | ||
| 31 | Uracil | 2-CH | 5.8 | 103.8 |
| 1-CH | 7.54 | 146.34 | ||
| 32 | Valine | γ-CH3 | 0.996 | 19.49 |
| γ′-CH3 | 1.049 | 20.7 | ||
| β-CH | 2.28 | 31.88 | ||
| α-CH | 3.625 | 63.22 |
| Compound | Assignment | 1H ppm | 13C ppm | Letter code | ||
|---|---|---|---|---|---|---|
| 1 | Sterols | -CH3 | 0.68 | 11.65 | ||
| 2 | FA except n-3/Butyric | ω1 | -CH3 | 0.88 | 14.14 | F |
| 3 | Butyric acid | H4 | -CH3 | 0.94 | 13.75 | I |
| 4 | ω-3 Fatty acids | ω1 | -CH3 | 0.97 | 14.12 | Ε |
| 5 | All Fatty acids | -(CH2)n- | 1.26 | 29.4 | ||
| 6 | All Fatty acids | H3 | -O-CO-CH2-CH2- | 1.61 | 24.9 | D |
| 7 | UFA -cis | -CH2-CH=CH- | 1.97 | 32.4 | C | |
| 8 | UFA -trans | -CH2-CH=CH- | 2.02 | 27.1 | C | |
| 9 | All Fatty acids | H2 | -O-CO-CH2-CH2 | 2.3 | 34.0 | B |
| 10 | PUFA ( Linoleic) | H11 | =CH-CH2-CH= | 2.77 | 25.56 | A |
| 11 | PUFA ( Linolenic) | H11 H14 | =CH-CH2-CH= | 2.80 | 25.56 | A |
| 12 | 1,2-Diglycerides | HO-CH2-CH- | 3.72 | 61.6 | ||
| 13 | 1,3-Diglycerides | -CH2- O-CO- | 3.98 | 64.33 | ||
| 14 | Triglycerides | -CH2- O-CO- | 4.14 | 62.1 | ||
| 15 | Triglycerides | -CH2-O-OC- | 4.30 | 62.1 | ||
| 16 | Caproleic acid | H10a | =CH | 4.91 | 114.3 | H |
| 17 | Caproleic acid | H10b | =CH | 4.97 | 114.3 | H |
| 18 | 1,2-Diglycerides | -CH-O-CO- | 5.09 | 72.0 | ||
| 19 | Triglycerides | -CH-O-CO | 5.26 | 68.72 | ||
| 20 | UFA -cis | -CH=CH- | 5.33 | 129.8 | ||
| 21 | UFA -trans | -CH=CH- | 5.37 | 130.3 | ||
| 22 | CLA | H12 | -CH= | 5.63 | 134.6 | |
| 23 | Caproleic acid | H9 | -CH=CH2 | 5.78 | 139 | |
| 24 | CLA | H10 | -CH= | 5.92 | 128.8 | |
| 25 | CLA | H11 | -CH= | 6.27 | 125.6 | G |
Disclaimer/Publisher’s Note: The statements, opinions and data contained in all publications are solely those of the individual author(s) and contributor(s) and not of MDPI and/or the editor(s). MDPI and/or the editor(s) disclaim responsibility for any injury to people or property resulting from any ideas, methods, instructions or products referred to in the content. |
© 2023 by the authors. Licensee MDPI, Basel, Switzerland. This article is an open access article distributed under the terms and conditions of the Creative Commons Attribution (CC BY) license (http://creativecommons.org/licenses/by/4.0/).


