Preprint
Article

Livestock Disease Data Management for E-Surveillance and Disease Mapping Using Cluster Analysis

Altmetrics

Downloads

174

Views

84

Comments

0

Submitted:

10 June 2023

Posted:

12 June 2023

You are already at the latest version

Alerts
Abstract
This study investigates how Electronic Livestock Health Recording Systems (ELHRs) facilitates the detection of disease burden and make cluster analysis by applying data analytics tools and techniques. A sample size of 18333 livestock disease cases reported from 2007-2015 by the Ministry of Agriculture of the Federal Democratic of Ethiopia was used for data collection. The results showed that ELHRs are important as livestock disease data preservers, saving costs, and facilitating the extraction of up-to-date and complete information. Euclidean and Manhattan distance performed well at 98%, while cosine distance measurement metrics performed poorly. Finally, with the application of the selected clustering techniques, metrics, tools, and dataset, it has been attempted to successfully detect an optimal number of disease clusters and meet the objectives of the study.
Keywords: 
Subject: Computer Science and Mathematics  -   Artificial Intelligence and Machine Learning

1. Introduction

1.1. Background

The livestock disease burden in Ethiopia is a critical concern for both the society and the governance systems. Upon rigorous review of published research articles, recognizing the advantage of using machine learning and artificial intelligence in business in general and medicine, in particular, is increasing at an exponential rate. This indicates that adopting machine learning and artificial intelligence to develop models for human disease mapping and prediction gets recognition. In reality, 70% of human diseases are food-borne diseases that are transmitted from animal to human (Pieracci, E et al, 2016), (Solomon, Gizaw, et. al., 2020). Hence, controlling animal diseases means indirectly minimizing the transmission of infectious diseases among the communities. However, limited research studies indicate that the applications of machine learning and artificial intelligence in livestock disease mapping and predicting systems are in their early stage.
The report of the Central Statistics Agency, 2020 indicates that Ethiopia is the first by keeping a large livestock population in Africa having 65 million cattle, 40 million sheep, 51 million goats, 8 million camels, 11.0 million equines, and 49 million chickens (Central Statistics Agency FDRE, 2020)
Even though most Ethiopians depend on this diverse range of livestock for their survival, the sector's potential contribution to household incomes and the nation's economy is lower than anticipated because the productivity of livestock is severely hindered by several endemic animal diseases caused by bacteria, viruses, protozoa, and parasites(Erkyihun; et al., 2022).
According to numerous academics, livestock diseases jeopardize local and national food security in addition to decreasing income and impacting the livelihood of livestock keepers. As noted by Gebremedhin et al, 2017 from the interviewed 1295 households, the mortality rate of Oxen is 49%, the local cow is 50%, the crossbreed is 81%, the local calve is 52% and the cross-breed is 60%, similarly during 12 months in Oromia region Contagious Caprine Pleuropneumonia (CCPP) was the causes of death for 835. Equally, it was reported that 784 cattle died because of the disease Contagious Bovine Pleuropneumonia (CBPP) followed by FMD which was the cause of death for 563 cattle (Gebremedhin et al., 2017). Imagine that such several animals were lost from the sample taken from 1295 households, therefore it is not difficult to estimate the total cost the country loses per year. The study by Solomon et al 2020 indicates that, due to animal diseases from the export market, the country has lost an estimated amount of 1.5-2.5 billion Birr annually.
Even if there are other causes for such economic losses, in areas where there is a lack of knowledge about the epidemiology of the disease and seasonal variation, the problem of diseases accounted for the majority of them. However, understanding disease epidemiological information makes it easier to build disease control measures. As an illustration, the frequency of the top five diseases listed, anthrax is high from September to November and March to May, Blackleg is high from March to May and June to August, Pasteurellosis is high from December to February and March to May, Foot and Mouth Disease (FMD) is high from September to November and March to May whereas Lumpy Skin disease (LSD) from September to November and June to August.
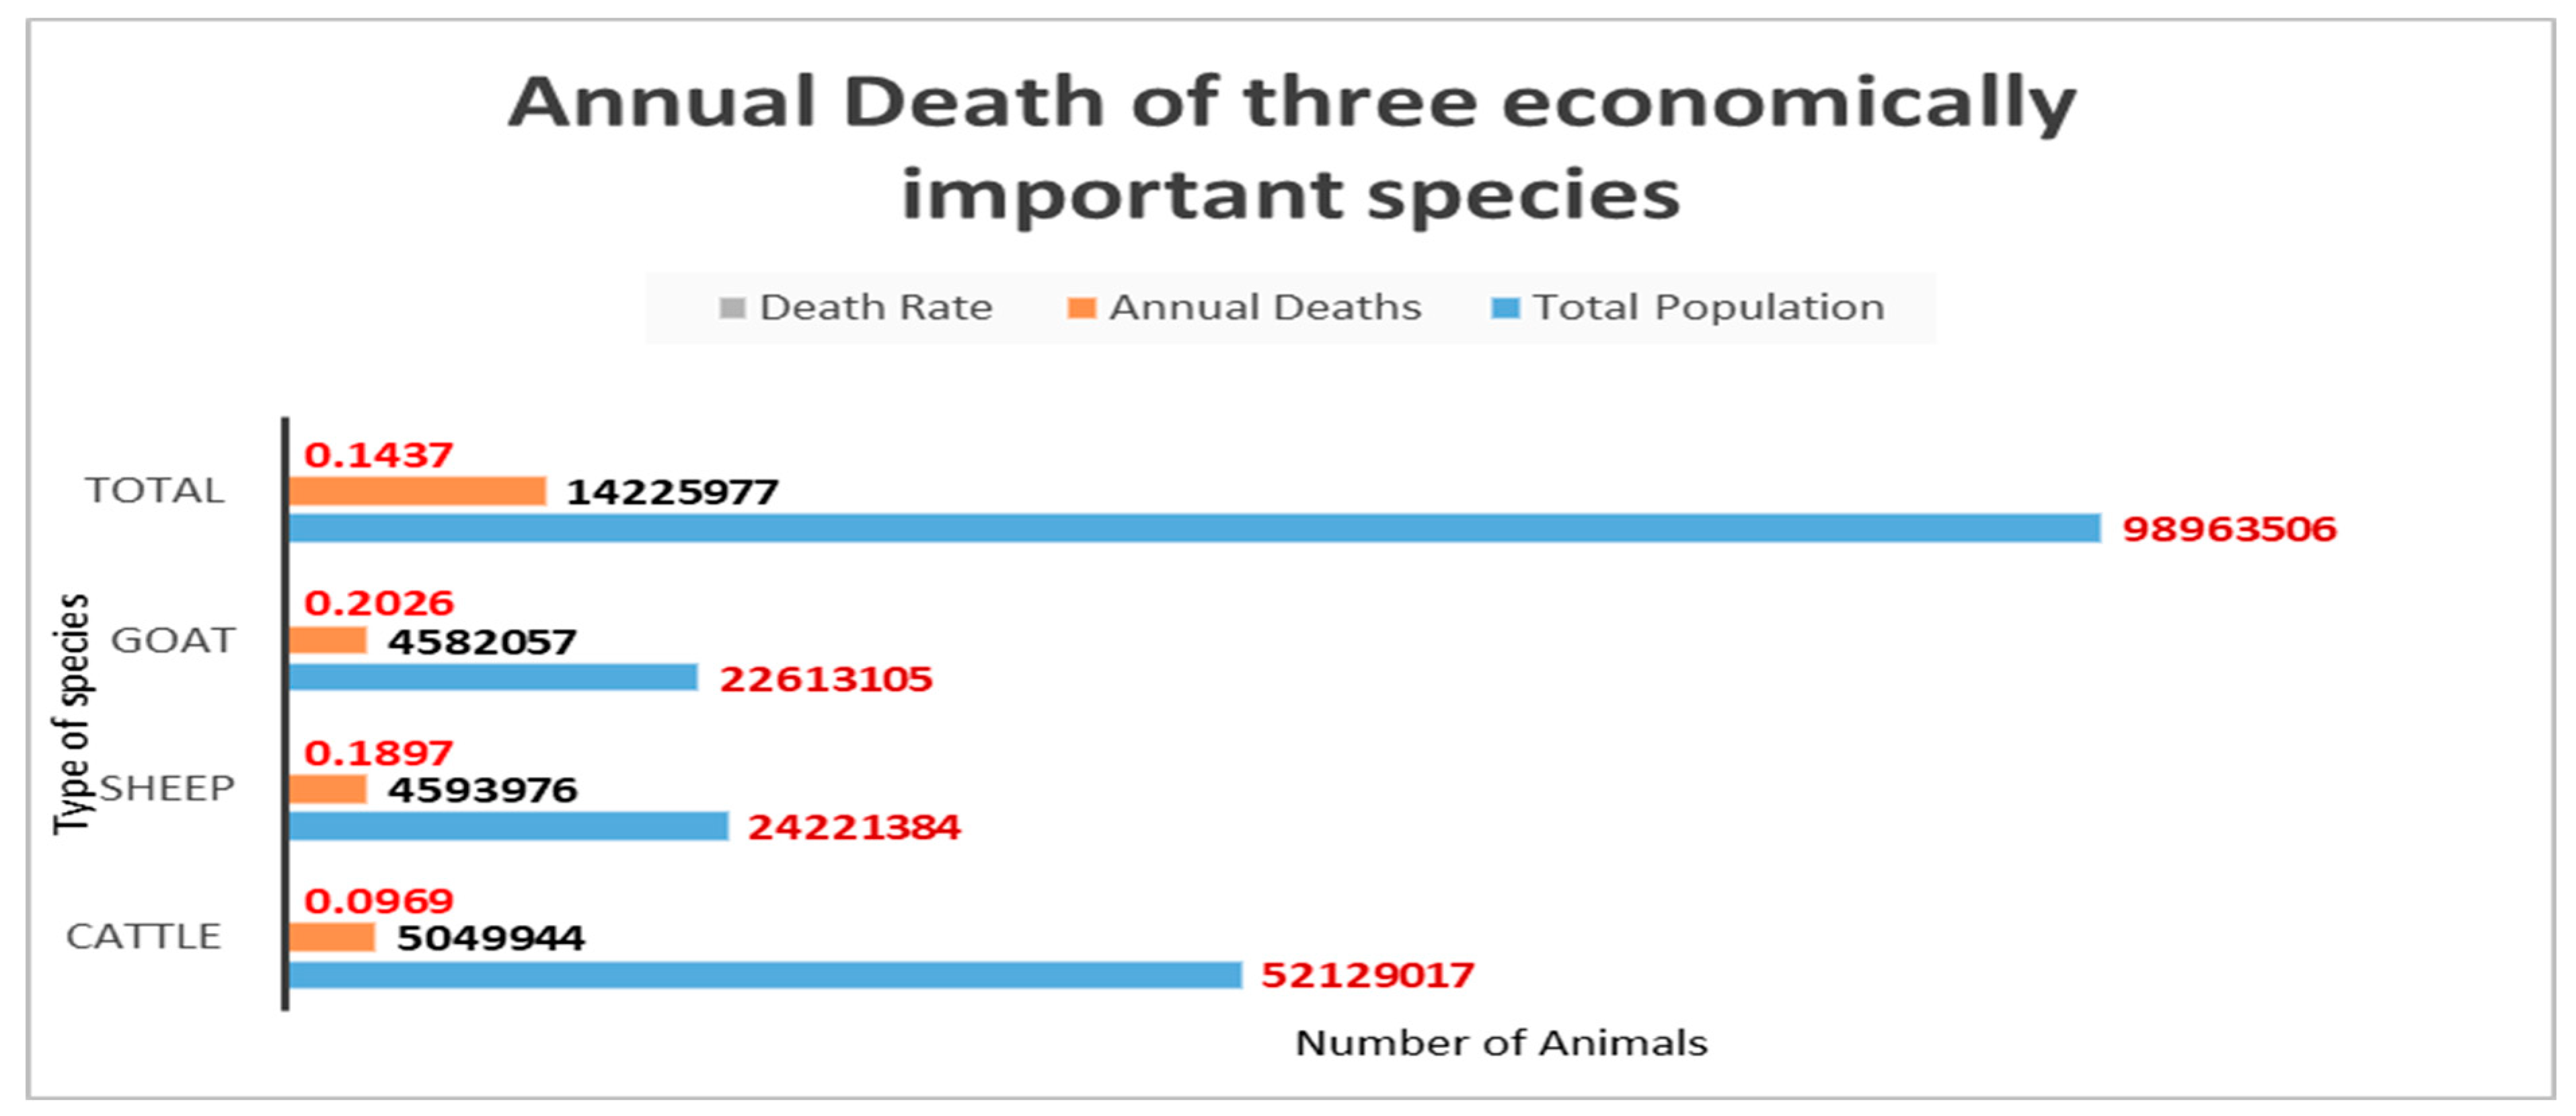
Although Ethiopia's annual animal mortality rate is twice that of the rest of Africa, as shown in Figure 1. The research efforts can significantly reduce this incidence through early prediction and prevention. Therefore, effective electronic livestock disease management is crucial to quickly identify disease prevalence and, as a result, reduce the risk of disease and significant economic loss.
To control the adverse effect of these diseases there should be an effective livestock disease prediction, and prevention using a data management system. Such systems can use technology-supported tools, to control the risk of spreading such diseases. Applications of Information Communication Technologies (ICT) and its techniques are not only critical for solutions to respond to effective livestock disease management but also an effective platform to address challenges, the constraint of getting appropriate data for data analytics to make data-driven decisions in the context of the country’s livestock livelihood.
Currently, Ethiopia has been adopting the One Health approach to reduce the transmission of zoonotic diseases (diseases transmitted from animals to humans and vice versa). The concept of One Health is a worldwide policy for expanding collaborative work and communications in all aspects of health care for humans, animals, and the environment. By recognizing the importance of Machine learning-based ICT support systems in the health sector the country organized a digital health week exhibition which was celebrated from October 10-14 with the motto of “Digital health to achieve health for all” (Ministry of Health, EFDR, 2022). Therefore, data sharing among intrinsic partnerships, particularly between the animal and human health sectors, is facilitated by electronic livestock disease data management. This, in turn, significantly contributes to the successful implementation of the One Health framework. As a result, it is possible to improve the overall health of populations and contribute to the reduction of poverty (Erkyihun; et al., 2022). Although there are numerous machine learning techniques currently being used for illness burden identification and prediction. This paper chose to use clustering algorithms. This is because the clustering algorithm is one of the suitable data analysis techniques in unsupervised machine learning algorithms to accurately evaluate the huge amount of healthcare data from electronic health records and be able to reveal the hidden pattern in it for decision making.

Livestock disease cluster detection

Cluster analysis is an unsupervised machine learning algorithm used for grouping individual or objects which has homogeneity will be in the same cluster whereas those which has heterogeneity across the cluster can group in another cluster. In other words, cluster analysis is the process of minimizing distance between similar objects or instances, and maximizing the distance between different objects. Generally, clusters help in identifying and explaining patterns between objects or instances upon patterns among data points. Thus, it is possible to differentiate and summarize structures that might not have been apparent before, but that give important information for decision-makers to make the decision much easier (Webster, A.J; et al, 2021).
The following different conditions are there in which the statistical analysis of disease clustering is important
  • To investigate the etiology of the disease in the epidemiological research
  • To use Livestock health as part of geographical disease surveillance
  • To associate the risk factor of the diseases (through capturing and visualizing similarities between the risk factors for the disease )
  • To react to disease cluster alarms to evaluate whether epidemiological investigations are warranted

1.2. Electronic livestock disease record data analytics

Livestock health information created through various activities can help to predict disease etiology, monitor disease priority, and prevention, and utilize the scarce resource appropriately. However, in Ethiopia, the absence of a well-organized electronic livestock disease data management system at the region, zone, and district level makes the immediate response to disease-associated risks difficult. Digital technologies have the potential to strengthen prevention, productivity, and overall animal care. Electronic livestock disease data analytics are essential for salient stakeholders to tailor their services toward the livestock owners and turn data into actionable information. Appropriate use of analytics in the livestock sector can improve disease prediction, prevention, and control systems. The research paper focuses on the following research questions to be answered at the end of the study and analysis.
  • How is the Electronic Livestock Disease Recording (ELDR) system in veterinary practices commonly used?
  • Which data analytics approaches, methods, and tools are most effective for use with ELDR to identify disease burden?
  • Which distance metrics perform well and given the ELDR dataset and cluster analysis techniques, what are the optimal detection of disease clusters?
Based on the mentioned research questions in mind this paper focused on the detection of livestock disease burden and make cluster analysis by applying data analytics on ELDR. The optimization of the clustering quality based on empirical metrics was also done to evaluate the results.

2. Review of Related works

A study (Idriss et al, 2021) revealed that the proliferation of innovative technologies has led to a significant increase in digital livestock disease data in past decay. In the past few years, it observed that the pace of digital disruption has been spectacular, transforming every sector of the economy, including animal production, health, and welfare The potential benefits of incorporating new digital technologies in animal health are convincing and can likely reveal new models that make national veterinary services more competent for meeting the required standards for animal welfare and health practice (Idriss et al, 2021). However, gaining the full potential advantages and anticipated results of the digital revolution is challenging in all sectors in general veterinary services in particular
In another research study (Bernard, 2012) the capability of easily capturing massive volumes of diagnostic data and health information has created the opportunity to identify patterns and risk factors not only for individual animals but across herds, regions, and species. These insights have renovated the field of diagnostics into a tool of prevention, supporting animal health professionals to take immediate action with confidence. Because the early notification of disease events or outbreaks determines the effective containment and prediction of epidemic diseases
Some of the important reports reported that the Livestock disease data sources can have different types of data that we collect for the aim of analysis. These include routine surveillance such as Disease Outbreak and Vaccination Activity Report (DOVAR), Animal Disease Notification and Investigation System (ADNIS), and the World Animal Health Information System (WAHIS). WAHIS is a web application platform for World Organization for Animal Health (OIE) Member to fulfill their obligation by supplying information on any relevant domestic animal or wildlife disease, including zoonosis, identified or detected within their territory (World Organization For Animal Health, 2014). Though these data are found in the form of electronic data as aggregate data.
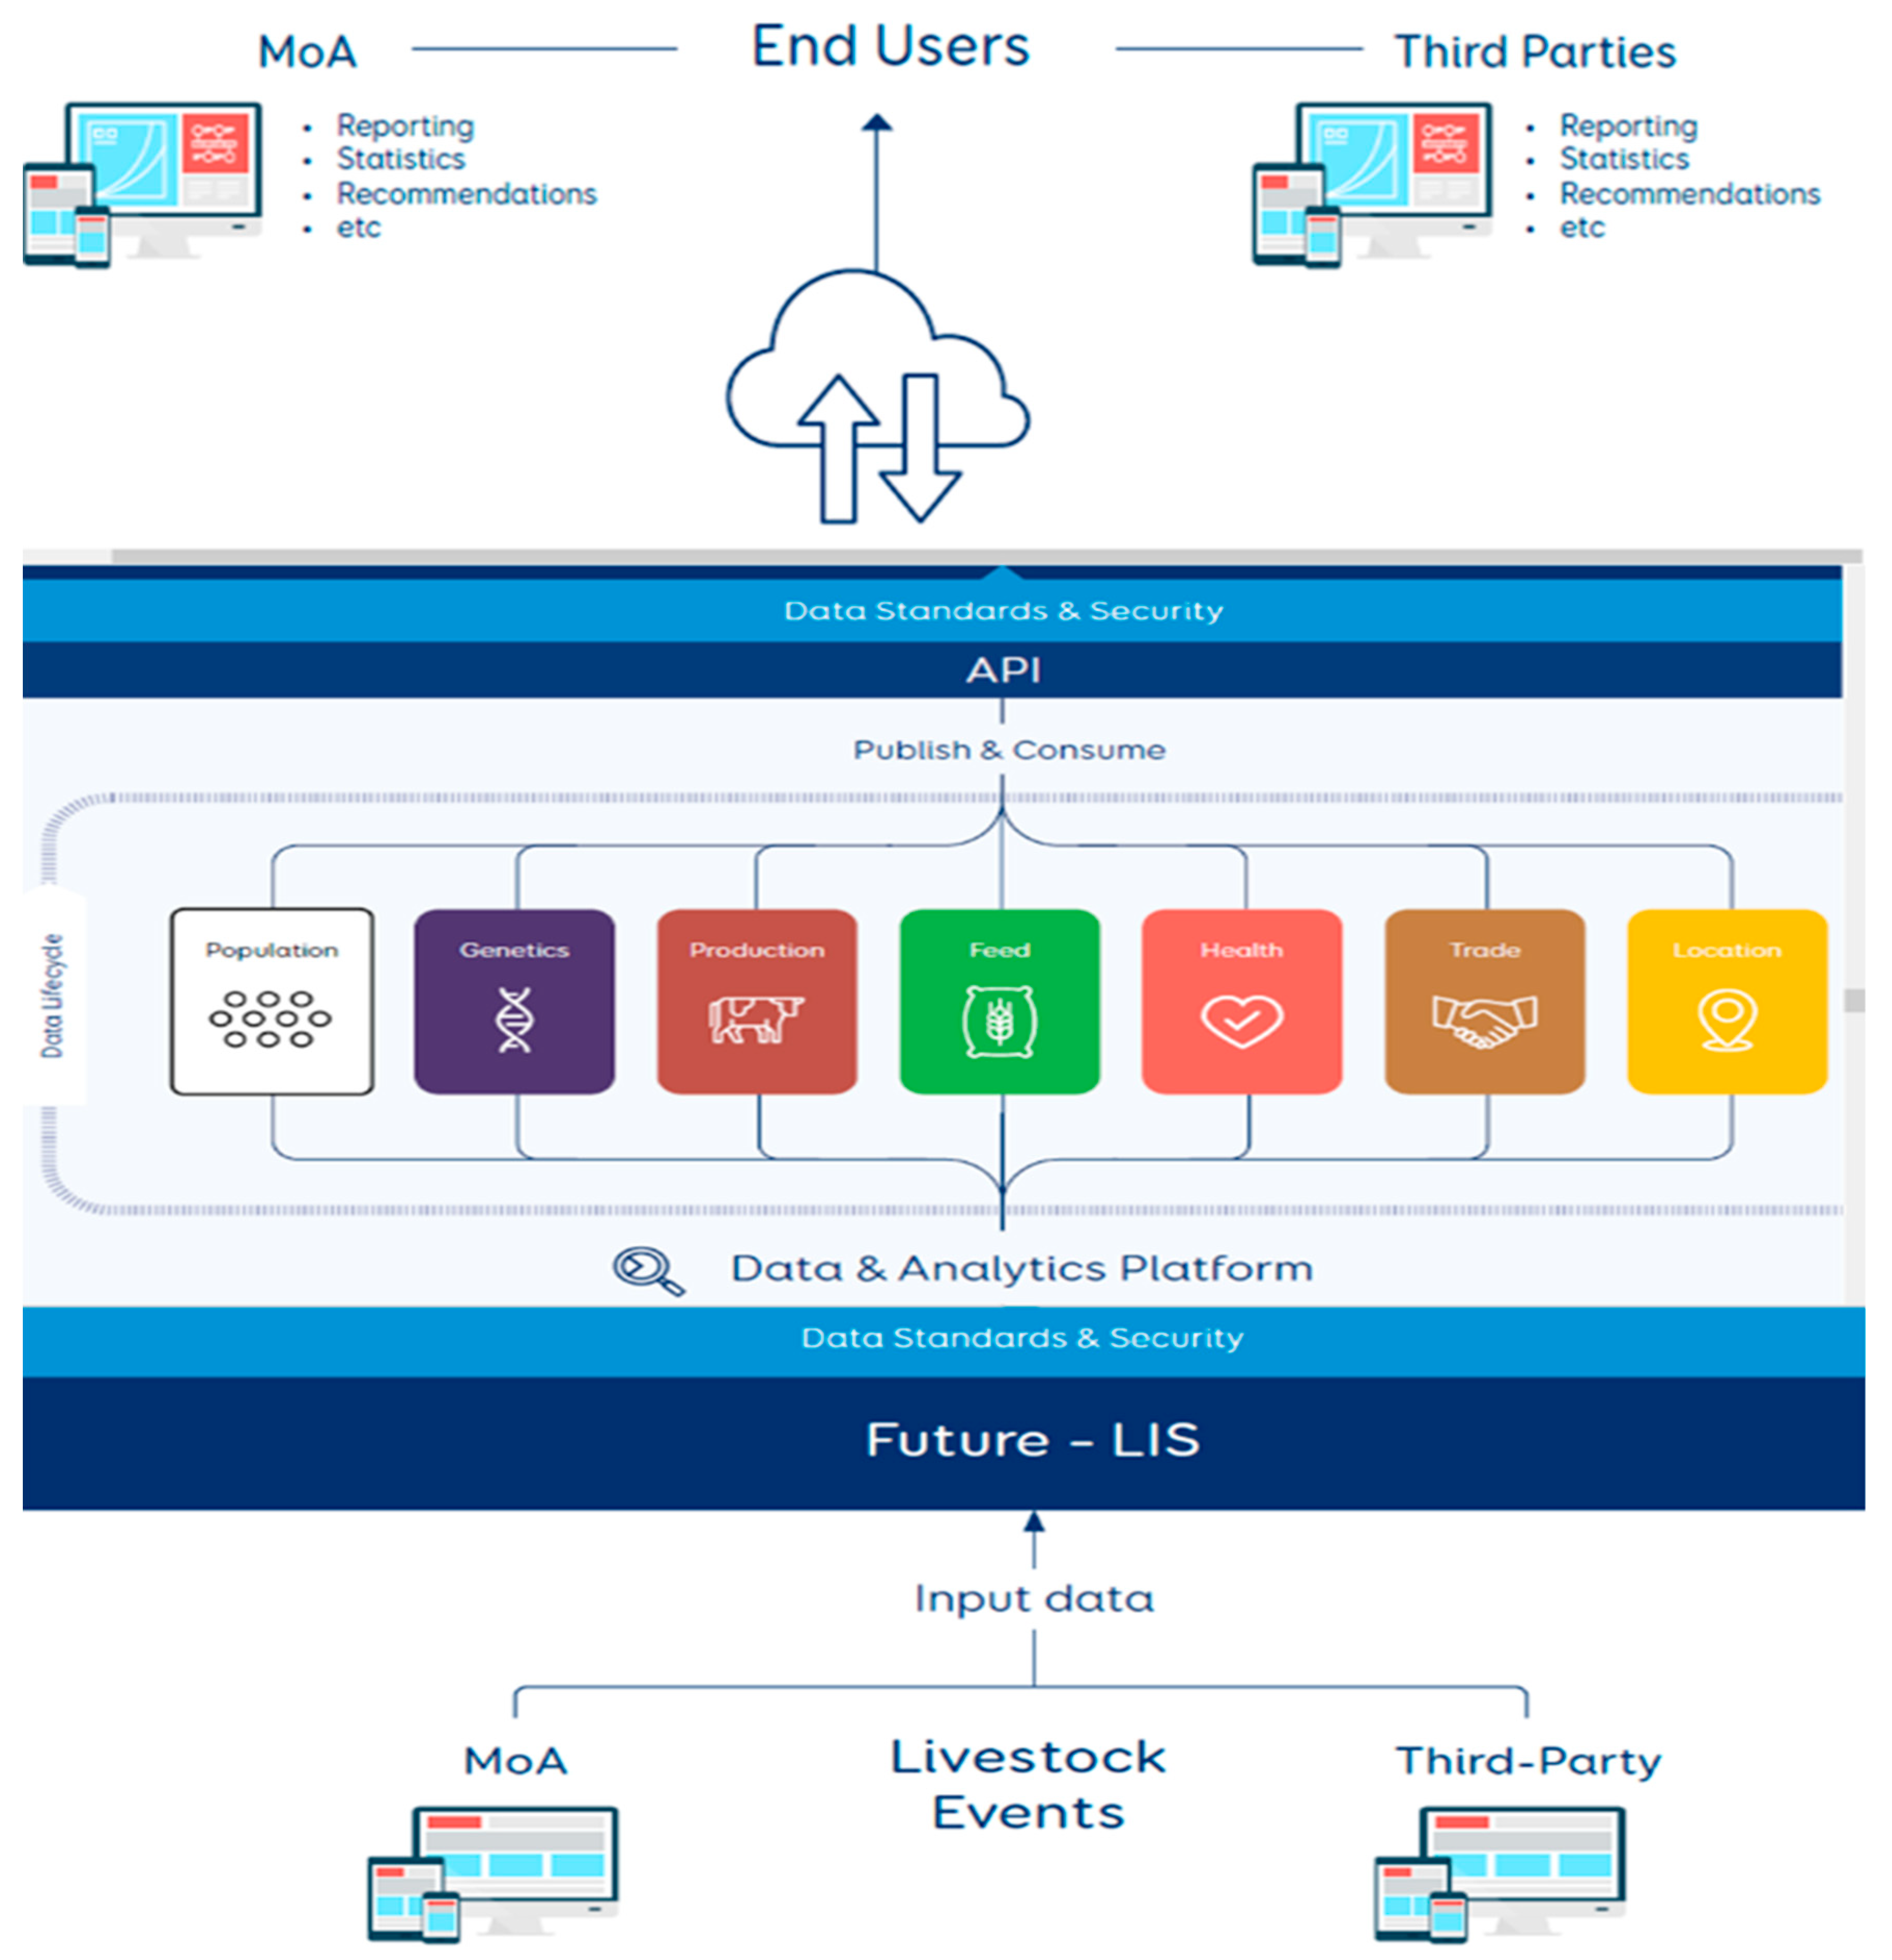
As depicted in Figure 2 and presented by the Ministry of Agriculture (MoA, Ethiopia, 2021), the future livestock information system will facilitate the storage of data in the Ministry of Agriculture data center or it will be integrated with the National Datacenter as well for the study, analysis, and research purposes. This facilitates a centralized storage capacity that supports storage and gives space to data sourcing from various livestock sectors. Hence, the responsible bodies can access the data to make data-driven decisions.
Despite various advantages allied with the adoption of the electronic livestock disease recording (ELDR) system, there are different concerns raised by Animal Health Professionals (AHPs) during this study and survey on research findings while we engaged in investigating the current status and challenges of the veterinary service provision system in Ethiopia. The survey result revealed that many of the AHPs have no awareness of electronic-based disease diagnosing and treatment of animals, however, few of them think that ELDR systems take more time than paper-based. This survey revealed that Lack of understanding, insufficient training, insufficient funding, lack of awareness, lack of commitment, weak ICT infrastructure, and failure of sustainability of Electronic livestock Health Recording implementation are the major hindrances in adopting the ELDR systems. In enhancing Ethiopia’s agricultural sectors, livestock health has a significant role (MoA, Ethiopia, 2021). Modern livestock healthcare generates and stores vast amounts of detailed livestock disease-associated data. Very few real-world livestock disease data have been utilized to enhance the sector.
One of the bottlenecks revealed by a study (Naemi A et al, 2021) for the utilization of these data is unreachability to researchers. However, making these resources easier to access as well as integrating the data enable more researchers to react to problems of clinical care (Naemi A et al, 2021).
As a benefit of Electronic livestock health Records, a study (Mwanga et al, 2020) argued that the availability of quality and sufficiency of data determine the worthiness of your decision. The ELHR improves evidence-based decisions and policymakers and researchers in the area can easily access the data. A study (Global animal health association, 2020) also explained that it facilitates the data analytics process and building of veterinary intelligence systems to predict a particular disease before the onset of the disease. Similarly (Laura, Falzon C; et al., 2021) noted that ELHR is a means to facilitate the extraction of useful information in a timely fashion.
In contrast to the traditional recording system(paper-based) while reporting the aggregated data from daily to monthly reports there is a chance of losing resolution while also suspending detection of any notable events and, therefore, delaying response time furthermore it makes the reporting labor-intensive and prone to error. Data is an asset for organizations to make fact-based decisions. Hence, salient stakeholders can access comprehensive information to make decisions on disease, control measures, and their consequences.
Likewise, ELHR support generating models or trends for monitoring disease occurrence and control programs (World Organization for Animal Health, 2017). Useful and important results from information systems are obtained if we implement a good surveillance system and comprehensive, accurate data is collected and integrated into an animal health information system.
Digital technologies create the most exhilarating chances in analytics not only using data to understand past performance but also using information to generate insight into what is likely to happen in the future. “Data Analytics refers to the set of quantitative and qualitative approaches for deriving valuable insights from data. It involves many processes that include extracting data and categorizing it in data science, to derive various patterns, relations, connections, and other valuable insights from it” (Mantas, 2022). Today data analytics has become an engineering tool in predictive analysis.
Despite the rapid expansion and application of digital technologies in healthcare are increasing at an astonishing rate. However, in general, the livestock sector has not deployed this technology to the level of data management and analysis necessary to make use of the data in developing countries like Ethiopia. As a result, getting organized and appropriate livestock health records is a bottleneck for researchers and policymakers to execute fact-based decisions.
In Ethiopia, one of the strategic objectives of the livestock Information system roadmap is to improve access to livestock health information by using technological innovative tools. For the achievement of this initiatives and deliverables are designed. From these initiatives enhancing livestock and public healthcare information systems with the currently existing and new information technology is the one which includes the proper use of ELHR.
A report (MoA, Ethiopia, 2021) reveals that ensuring access to consistent reliable, timely, and useful information by salient stakeholders through Web or mobile-based livestock health-related information systems is anticipated to be a deliverable of this initiative. In this way, it is possible to enhance the use of technology and innovation (United Nations, 2021)
A study (Laio et al, 2016) states that Cluster analysis is part of unsupervised machine learning that deals with the practice of segregating a set of data objects (or instances) into meaningful subclasses. Each subclass is a cluster, such that objects in a cluster are similar to one another, yet dissimilar to objects in other clusters. In the process of data clustering they have given unlabeled data and grouped similar samples in one category, called a cluster, and the dissimilar sample in another category.
Clustering is useful in several machine learning and data mining tasks, in medicine to identify different disease categories, for biology Clustering used to find genetic information (Zhao et al, 2014), pattern recognition (Fu-Ru Lin et al, 2017), (Rajib S et al, 2019). Similarly, scholars (Hloušková & Lekešová, 2020) applied clustering to identify the farm outcome in the compound. Cluster analysis was also used by (Ishikawa et al, 2020) to evaluate disease risk in periparturient dairy cattle. Researchers (Zhao et al, 2014) also applied cluster analysis to group breast cancer and Alzheimer's lung cancer from a large biological and medical dataset.
Types of cluster analysis: Though there are various categories of cluster analysis method existed, the selection of the type for analytics purpose depend on the nature of the dataset, the computational complexity, and the specific need of the user are some of the criteria to select cluster analysis (Simon & Suresh, 2022). For instance (Koh, Ahmad, & Lee, 2022) applied hierarchical clustering to detect clusters of highly pathogenic avian influenza, (Komaru, Teruhiko, Yoshifumi, & Nangaku, 2020) to predict 1-Year Mortality After Starting Hemodialysis. Similarly (Cao K, 2022) identified and validated subtypes of Parkinson’s disease based on multimodal MRI data, (Rios, Tatiane, & Mello, 2022) to predict next COVID-19 waves. However, recent trends indicate that hierarchical clustering draws the attention of scholars to apply for grouping, predicting, and validating different disease categories.
Hierarchical cluster analysis (HCA) is an investigative tool intended to reveal natural grouping within a data set that would otherwise not be apparent. The detail of cluster categorization check-in was done by (Teng, Amin, & ElSayed, 2022), and (Praveen P et al, 2020). It is the most suitable unsupervised machine learning algorithm to cluster objects from small to large datasets. Clustering is performed either through Agglomerative or Divisive ways. Agglomerative starts from the dissimilarities between the objects and then step-by-step grouping. As it treats each entity as a cluster 1 (Praveen, Ranjith, Mohammed, R, & R, 2020). (Mahmoud & Zulaiha, 2016), applied agglomerative hierarchical clustering to cluster ground-level ozone in Malaysia. Similarly (Ana, Junshi, Milanović, Nina, & Riccardo, 2020) were used for Clustering Time Series Data. In other way Divisive hierarchical clustering starts from the whole document as a single cluster step by step the algorithm is going to split until it reaches its own cluster. This is exactly the inverse of agglomerative hierarchical clustering.
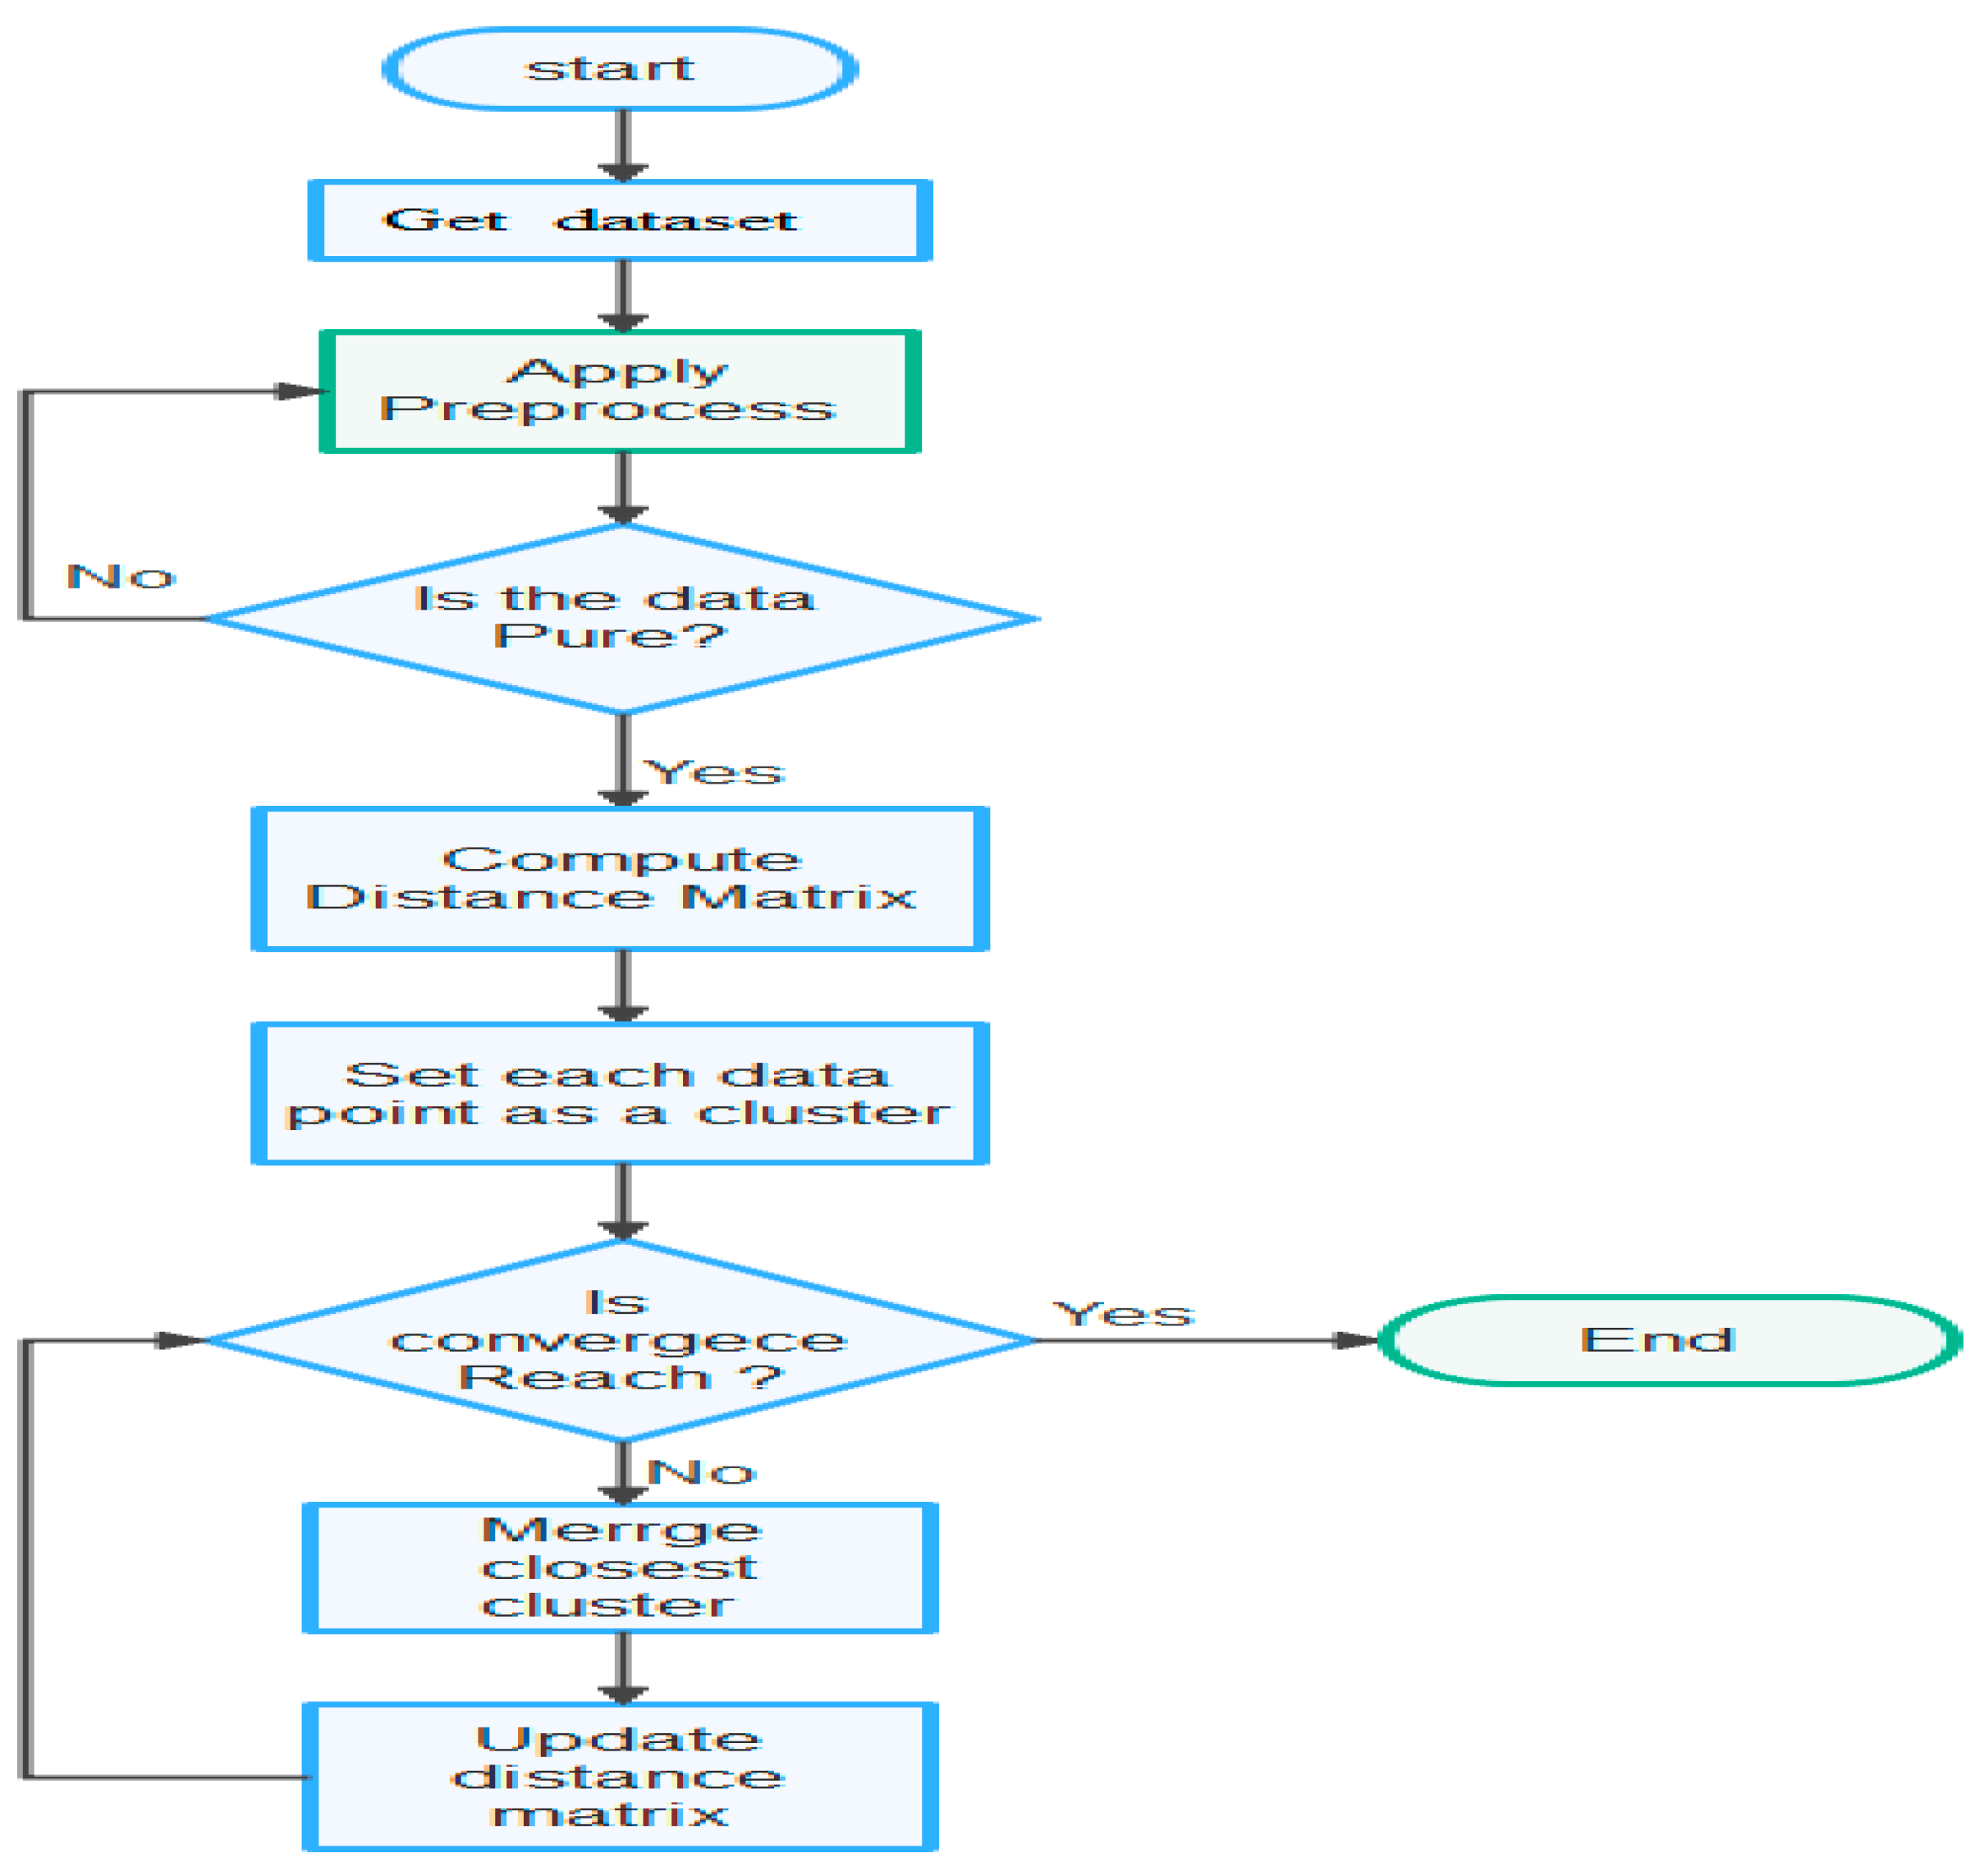
The basic principle of Agglomerative Hierarchical clustering: 1) Get dataset, 2) Apply to preprocess, 3) Check the purity of the dataset, 4) Compute the proximity matrix, 5) Consider each data point to be a cluster, 6) Repeat: Combine the two neighboring clusters and update the proximity matrix, 7) Do the process until it remains with a single cluster.
After this, it is possible to represent a dendrogram-like structure by defining distance similarity and merging approach as indicated in Figure 3. To get useful output (information) out of the clustering, the distance matrix we use should be realistic.
Though there are several commonly used metrics for characterizing distance or its inverse, similarity. In this study, Euclidean distance(ED) was selected. As noted by (Alfred & Jörn, 2022), as it corresponds to the everyday perception of distances, the Euclidean distance is the most intuitive distance metric. The Euclidean distance d of two data cases (x1, x2) is defined as the square root of the sum of squared differences. It is a continuous metric that can be thought of in geometric terms as the'' straight –line” distance between two points.
In general, the formula for Euclidean distance between points X and Y in dataset D is calculated as follows,
The following are points on the X and Y coordinate,
X = ( x 1 ,   x 2 x 3 , . . ,   x n )   a n d   Y = ( y 1   , y 2 ,   y 3 ,   . . . . ,   y n )
Hence, Euclidean Distance
  D 2 = ( x 1 y 1 ) 2 + ( x 2 y 2 ) 2   . . ( x n y n ) 2   + ) .
D =   (   x 1 y 1 ) + ( x 2 y 2 )   . . . . . . + ( x n   y n )  
Manhattan and Cosine distance metrics can also be used.
Manhattan distance: is important to compute the absolute differences between coordinates of a pair of objects. Manhattan distance is relatively efficient and easily understandable straightforward forward and gives the best results when the data set has a high dimension.
  D i s t a n c e   A B = A i k A j k
This equation helps to generate the proximity matrix describing the closeness among objects to be clustered. Moreover, the mathematical notations taken from (Thomas, Jan, & Christoph, 2021) are also important to perform Hierarchical cluster analysis (HCA). Assume n objects to be clustered represented by the set of O where o i is the ith object
O = { o 1 ,   o 2 , o 3 , . . . . . . . . . o n }
A partition T of X divides X into subsets c 1 ,   C 2 . . , C 3 . . . . . . C m provided that
c i c j = Ø
i j   f r o m   1 t o   m   i j, where Ø is the empty set
C 1 C 2   C 3 . . . . . . . . . . . . C m = X
As indicated above, all the total n objects resulted from the union of all clusters (Thomas, Jan, & Christoph, 2021). Consequently, a sequence of partitions in which each partition is nested into the next partition in the sequence can be performed through a hierarchical clustering algorithm. The process can continue until a single cluster having all n objects remains.
K-means clustering is the most commonly used unsupervised machine learning algorithm for partitioning a data set into k groups without a predefined target class. It defines the total within-cluster variation as the sum of squared distances between and the corresponding centroid. (Silitonga, 2017) mathematically computed as
W ( C k ) = x i c k ( k i μ k ) 2
Where:
xi is a data point belonging to the cluster C k
μk is the mean value of the points assigned to the cluster C k
Each observation (xi) is assigned to the given cluster such that the sum of squares (SS) distance of the observation to their assigned cluster centres μ k is a minimum. We can define the total within-cluster variation as follow : The total within a cluster is represented by
i = 1 k W ( C k ) = k = 1 k x i C k x i μ k x i C k x i μ k 2
The total within the cluster sum of squares measures the compactness (i.e. goodness) of the clustering and it should be as small as possible.
Method of cluster optimization: The optimal number of clusters is one way or another, it is subjective and depends on the method for measuring similarities and the parameters used for grouping objects. For instance (Dimitris, Agni, & Holly, 2021) applied a pairwise distance matrix of the observation to determine the quality of a given cluster assignment in a mixed variable (categorical and numerical variable.
Similarly, (Quan, Fei, Zhongheng, & Nie, 2021) proposed the coordinate descent method to enhance the clustering performance in complex data. According to (Alboukadel, 2017), the direct method, consists of optimizing a criterion, such as the within-cluster sums of squares or average silhouette. The corresponding methods are named elbow and silhouette methods respectively. Since the K-means cluster algorithm depends on the initial selection of centroid thus, this weakness can be overcome by the know cluster optimization techniques called elbow and silhouette (Edy, Jatmiko Endro, & Vincensius, 2020).
3. Research Methodology

This section includes sources of the data, methods of data collection, techniques, and tools of analysis.

3.1. Sources and Descriptions of the Data

Based on the plan disease mapping on cluster analysis is conducted on livestock disease statistics data taken from different regions, zones, and woredas. As depicted in Table 1, the analysis is carried out on selected reportable diseases from 2007 to 2015 in the livestock sector of the Ministry of Agriculture of Ethiopia using census sampling.
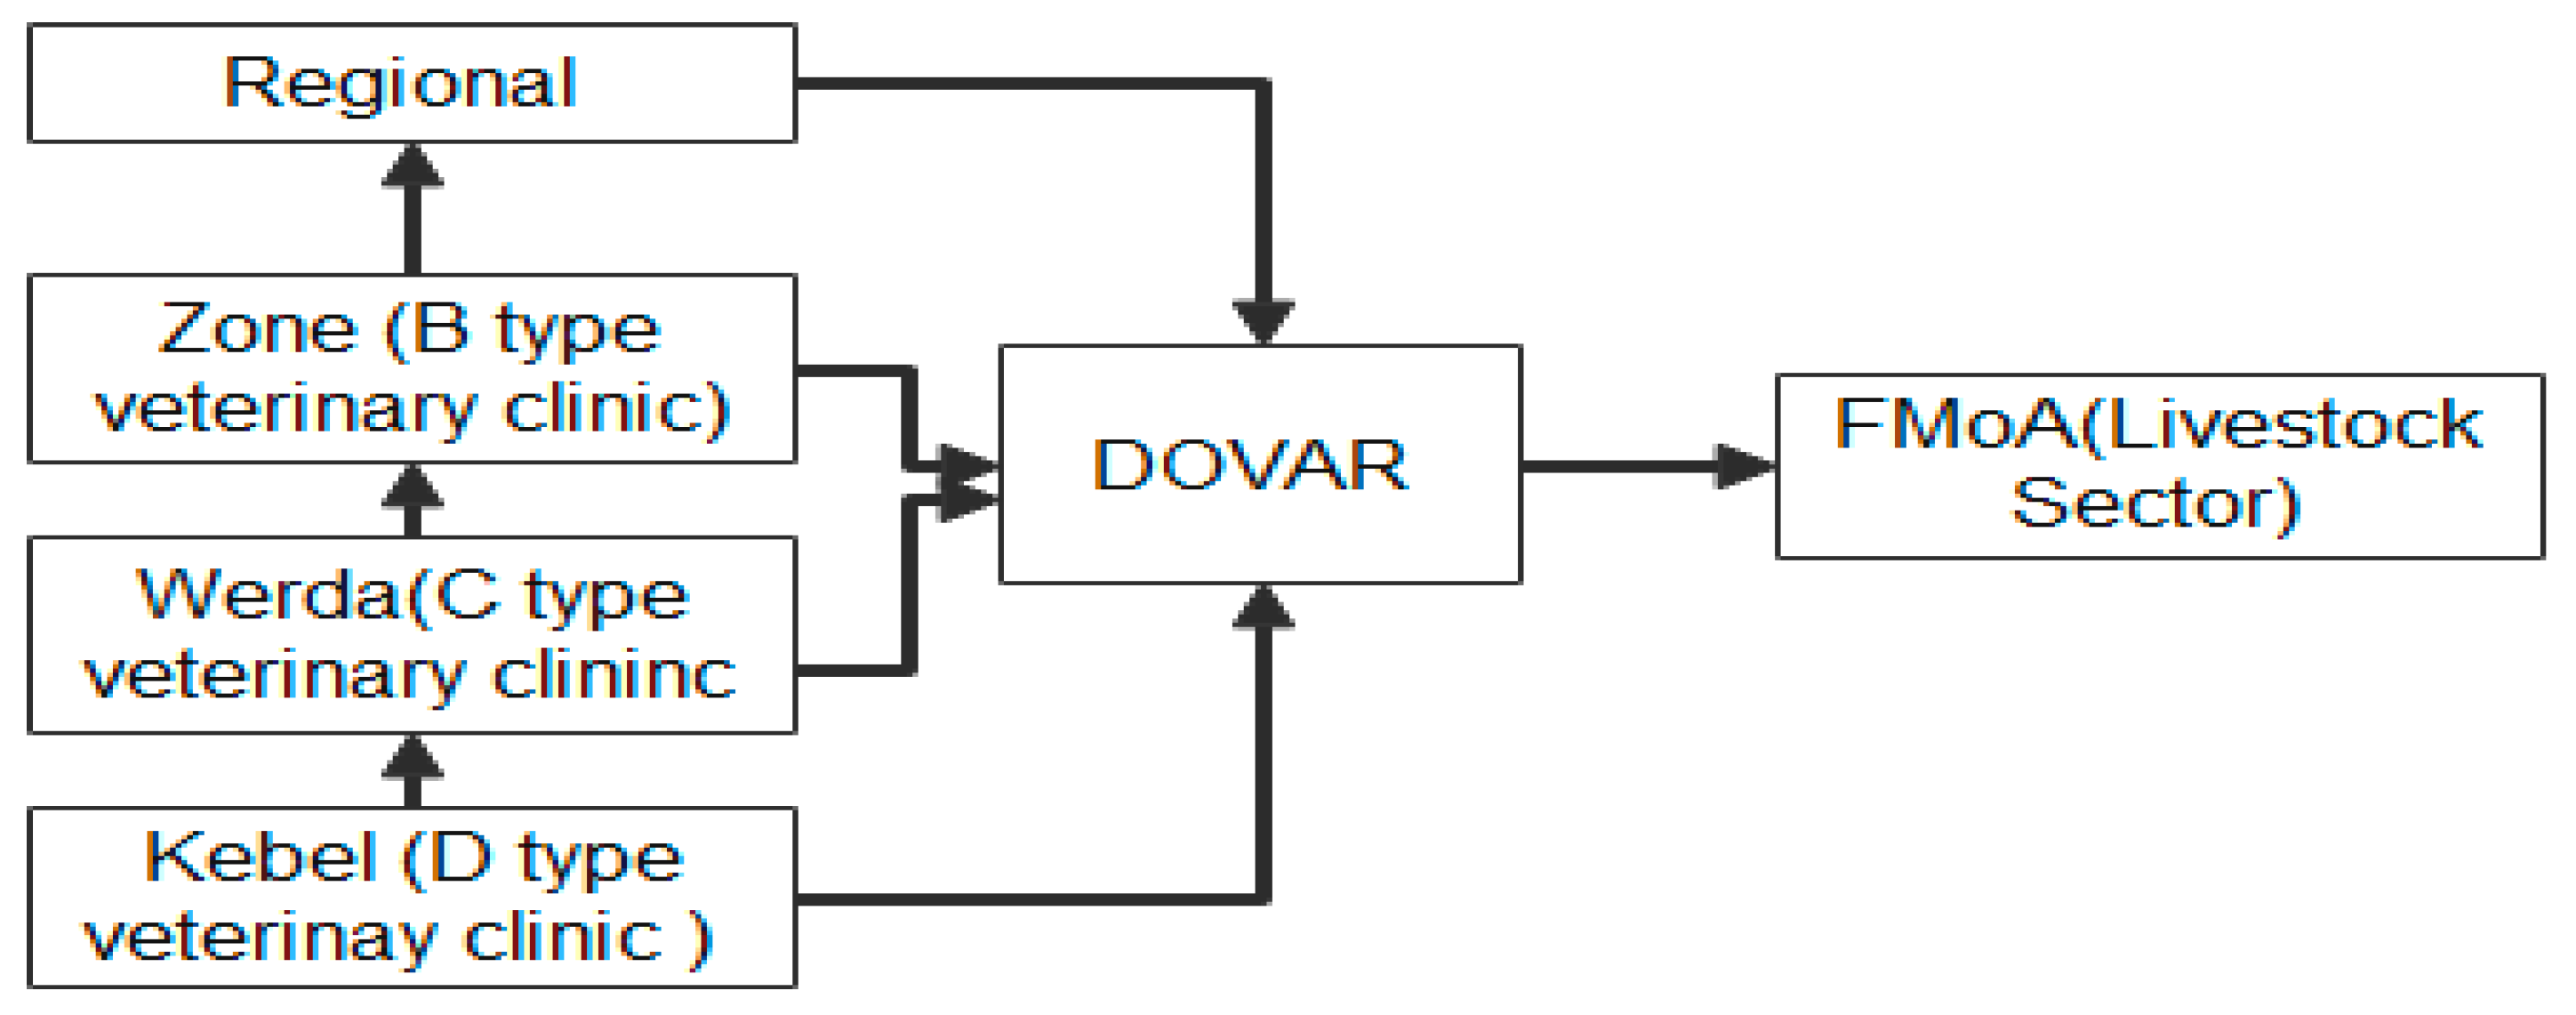
The DOVAR is a Disease outbreak and vaccination activity reporting system that enables veterinary offices; Werda, Zone, and regional veterinary offices electronically compile monthly and immediately reportable diseases, outbreaks, and vaccination activities electronic data receive and submit them to the next level.

3.2. Methods of Data Collection

Secondary data: using the DOVAR dataset and document analysis. For this study as depicted in Figure 4, disease data was directly taken from the Livestock sector of MoA of Ethiopia
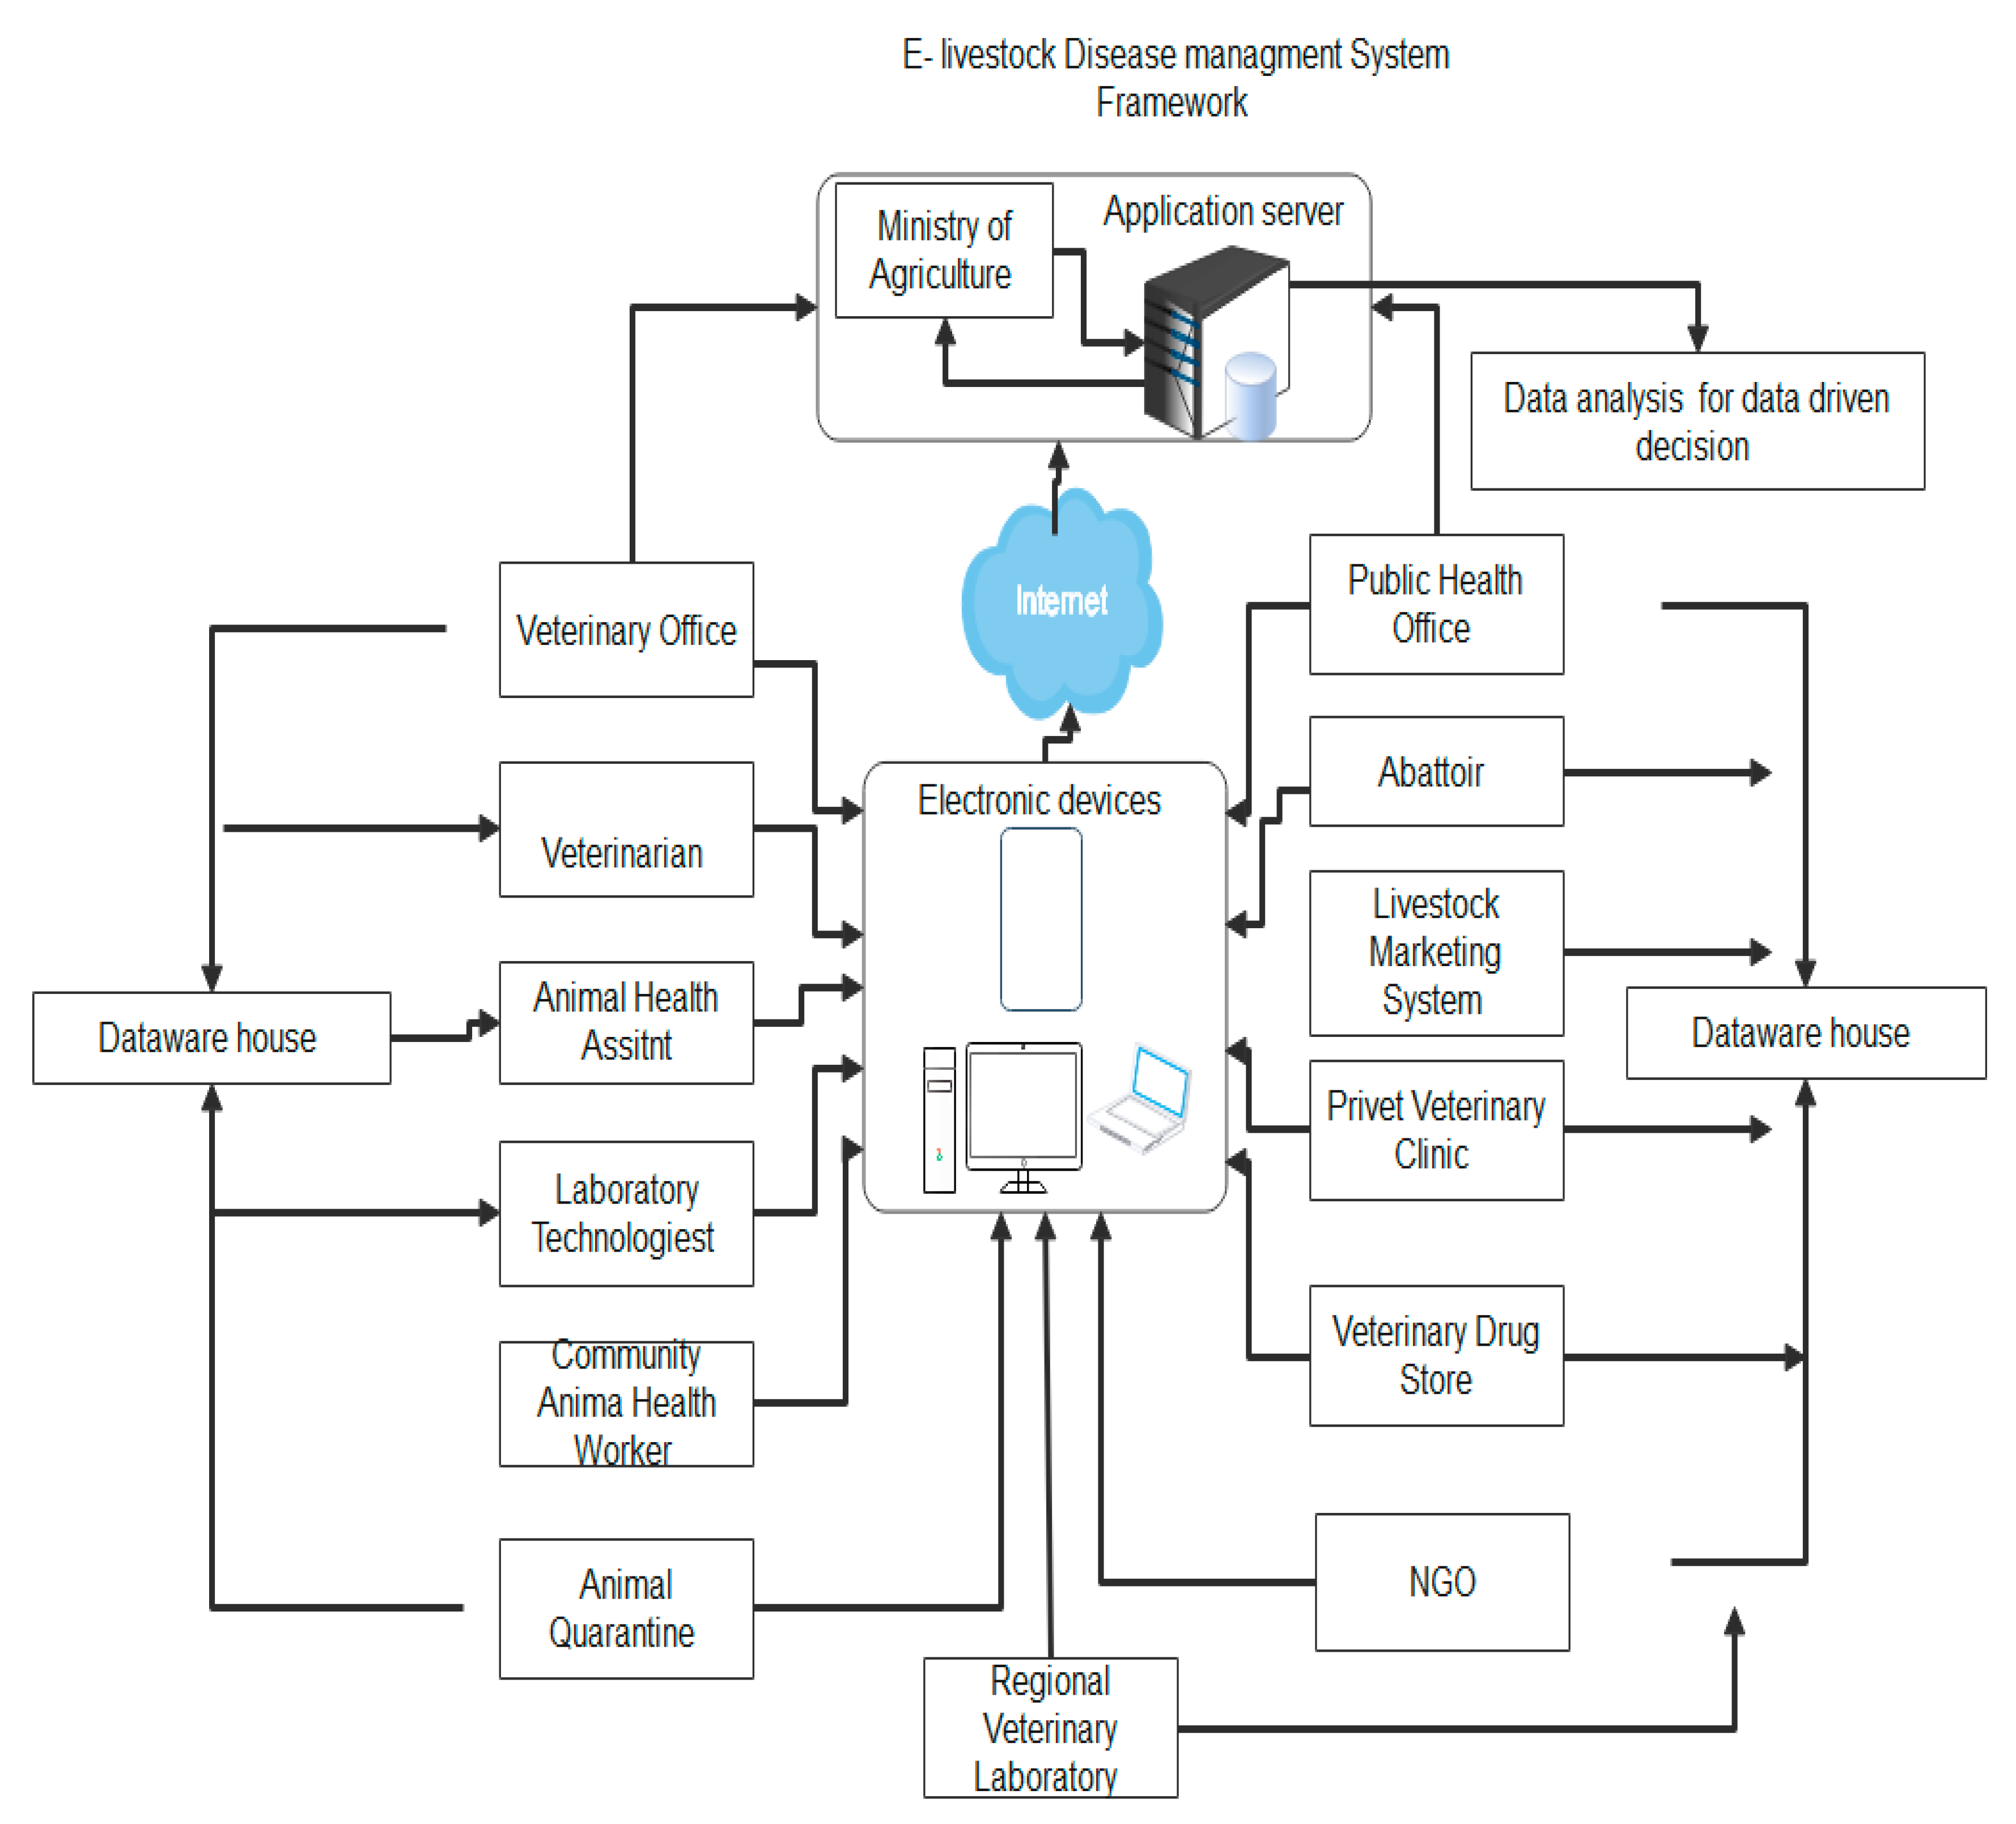
The regional veterinary office gets the data from different veterinary clinics every month. Regional veterinary offices also report to the federal government on a monthly and quarterly basis. Besides this the electronic form was prepared to fill in the aggregated data as noted by (Pollet et al.2015) there can be the possibility of a loss of information. Hence, such a reporting system has its own adverse effect on executing the right decision at the right time. In other ways, if the report is not complete and correct; it is difficult to make apt and reactive animal and zoonotic disease surveillance (World Organization For Animal Health, 2016). Thus, the proposed framework as depicted in Figure 5 can alleviate the bottleneck of appropriate livestock disease data management. The proposed Livestock Disease data Management for E-Surveillance refers to the description of each element in a published paper by us (Mohammed K et al 2023).
Using the data collected from 2007 to 2015 the following discussion and analysis was made in order to identify a good cluster analysis algorithms and distance metrics for disease mapping
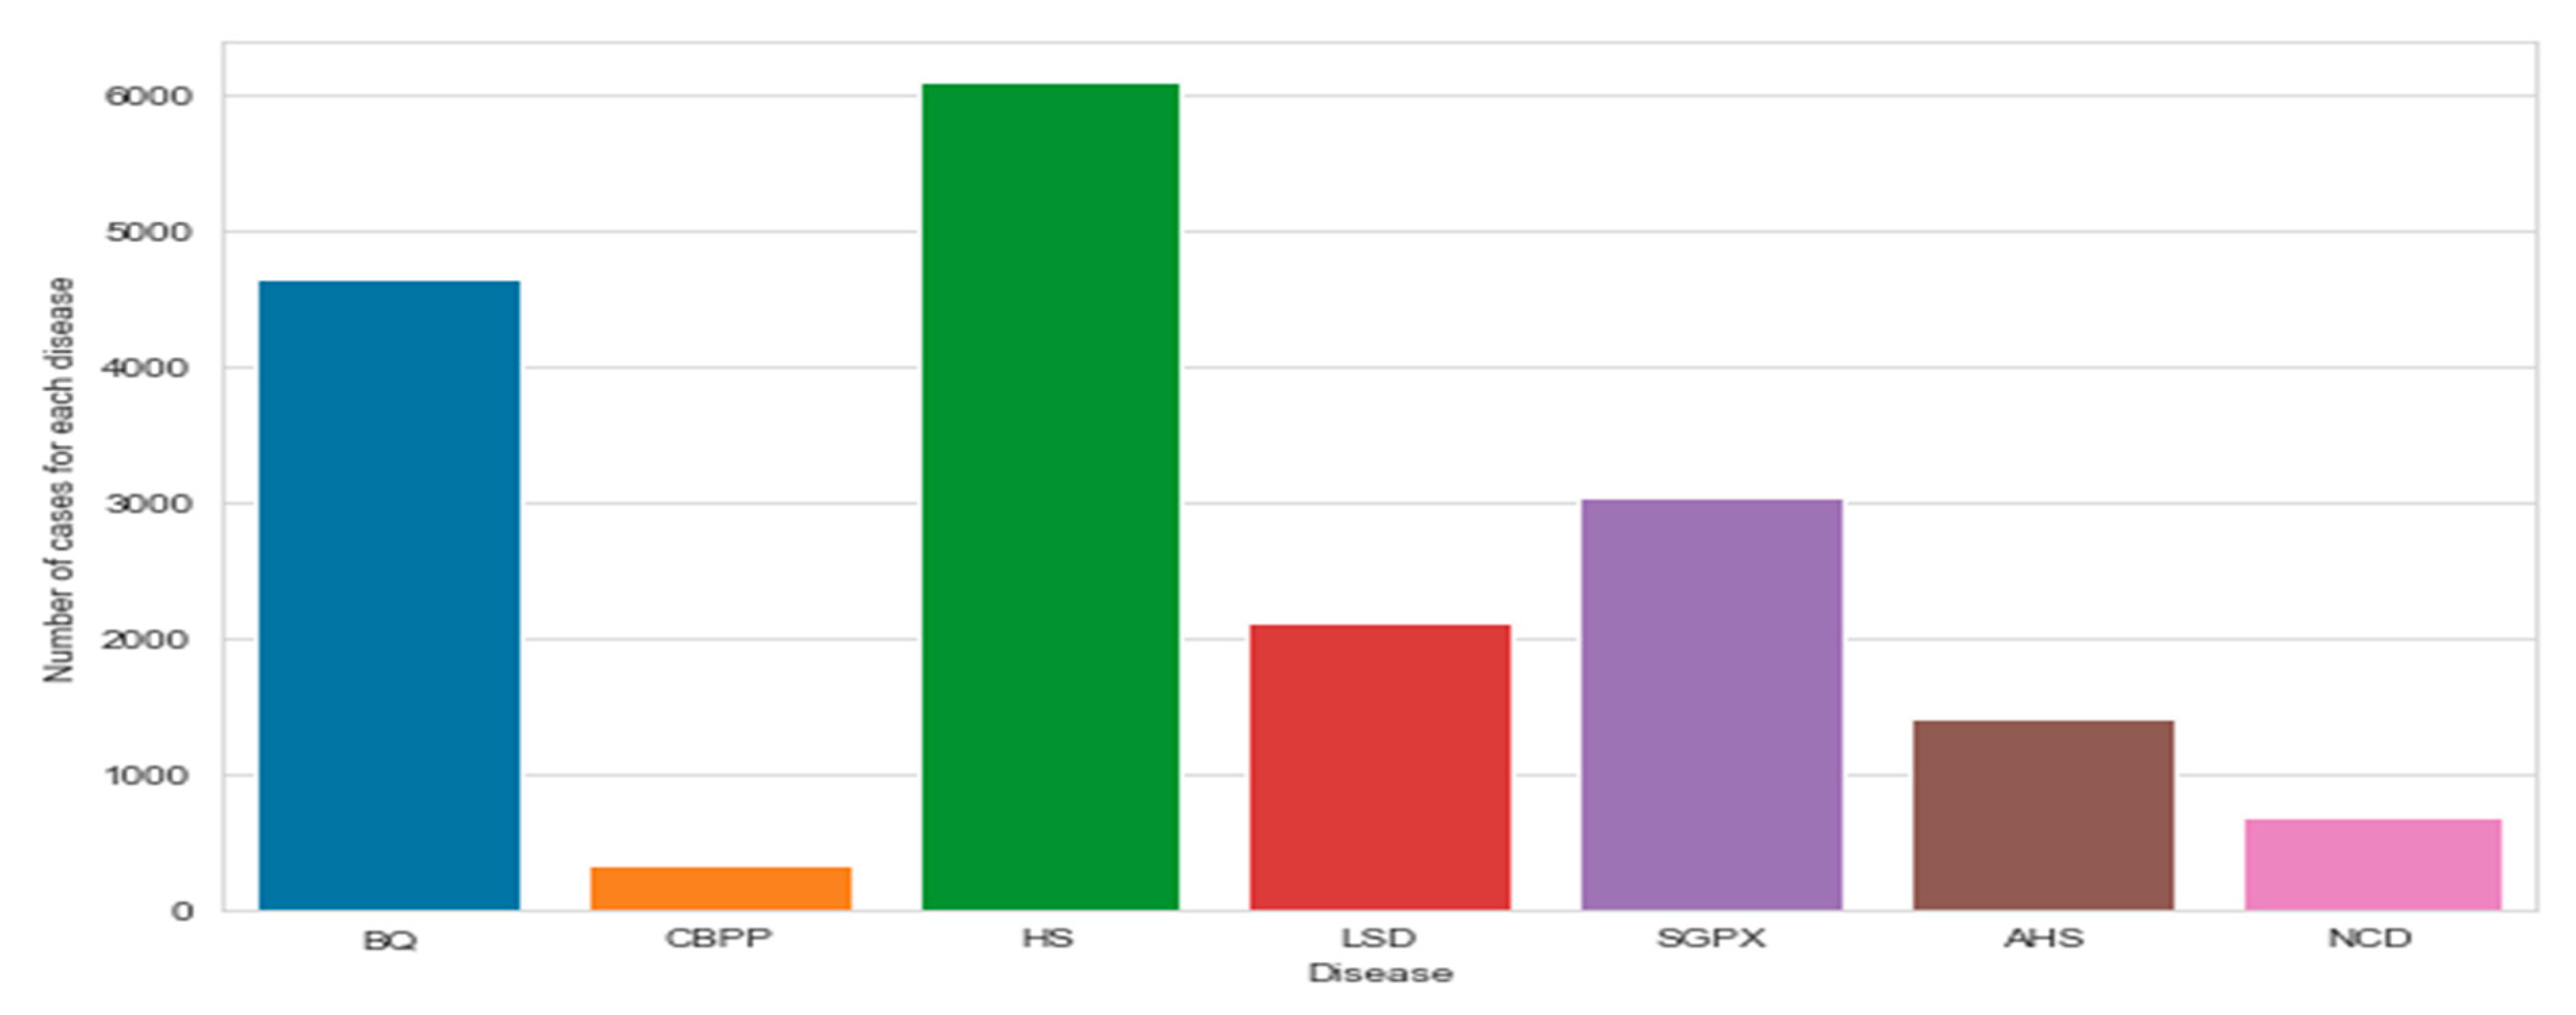
Figure 6 indicates that of diseases that affect livestock severely in the form of disease outbreaks, as described in Table 1, the data was collected from 2007 to 2015, during the years, the diseases occurred in the form of the outbreak. As revealed in Figure 6 the most frequent diseases that occurred were HS followed by BQ, SGPX, and LSD respectively.
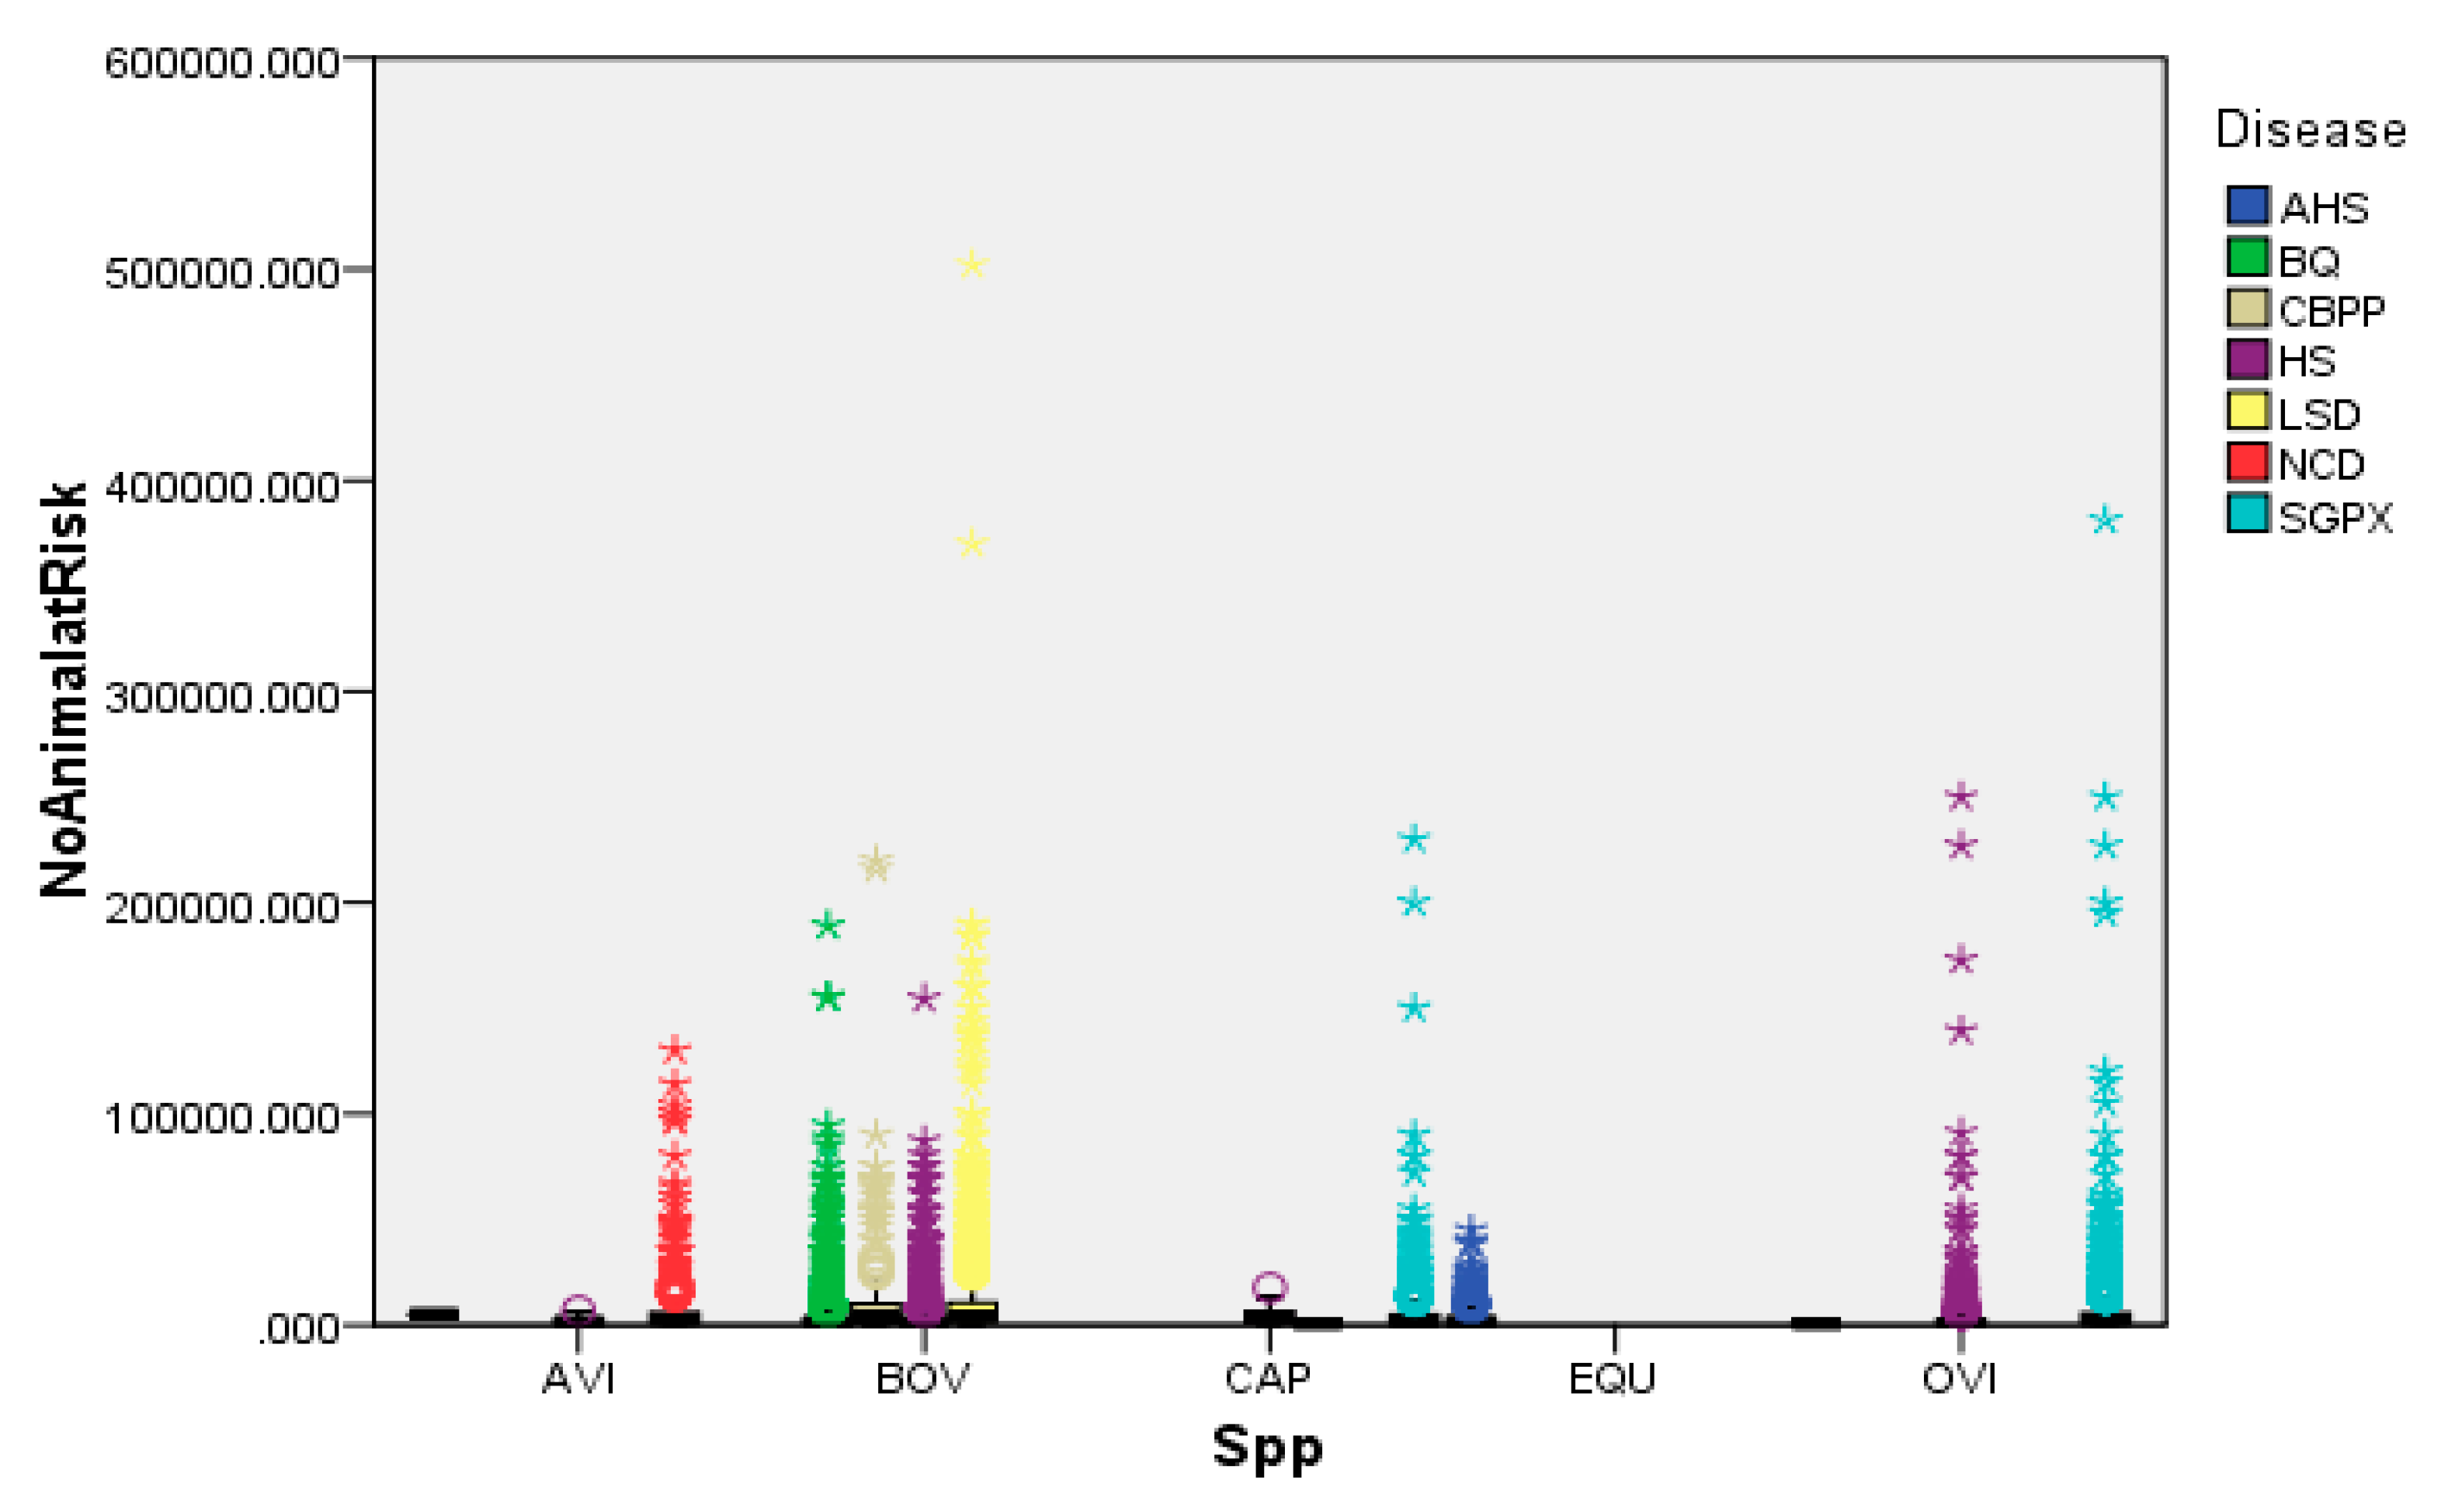
As revealed in Figure 7 the diseases mapped on bovine species indicates that this species is more likely affected by the diseases called BQ, HS, LSD, and CBPP similarly OVI species are affected by the disease HS and SGPX whereas species like CAP are affected by the disease called SGPX. However, all the occurrences of the above diseases can be prevented through early vaccination before the onset of the incidence. Thus appropriate e-livestock disease recording system is the prerequisite for appropriate data analytics.
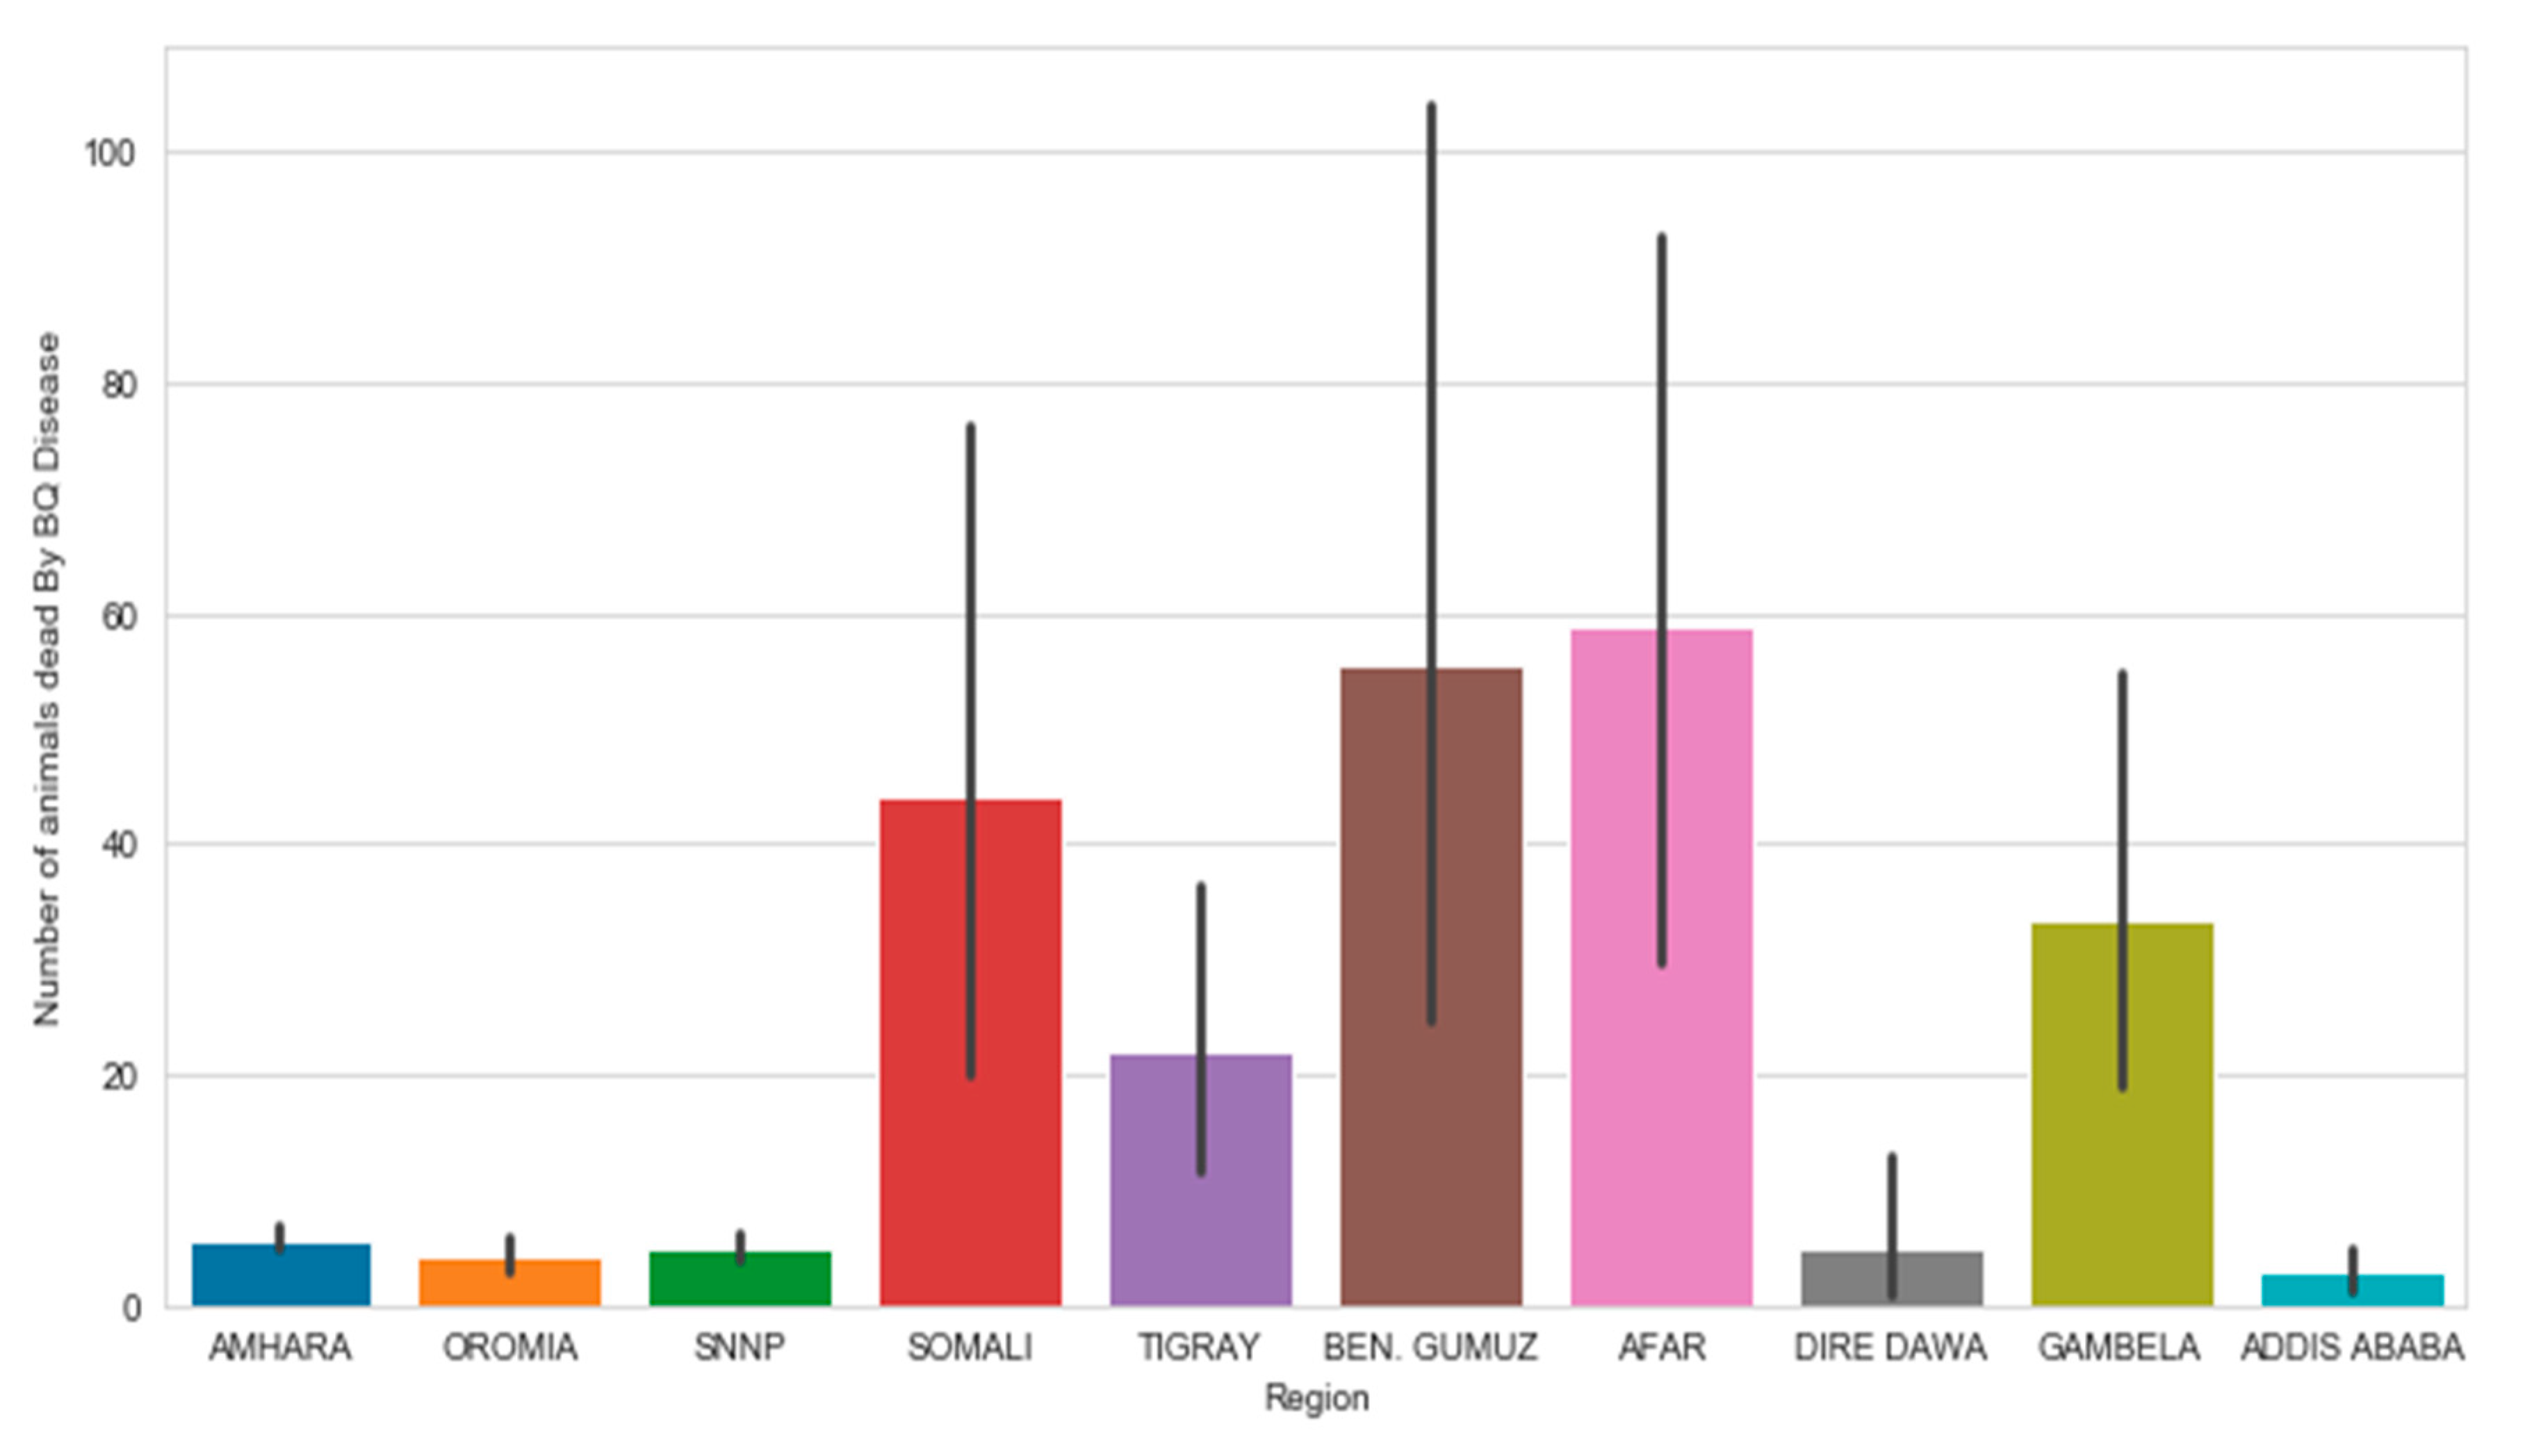
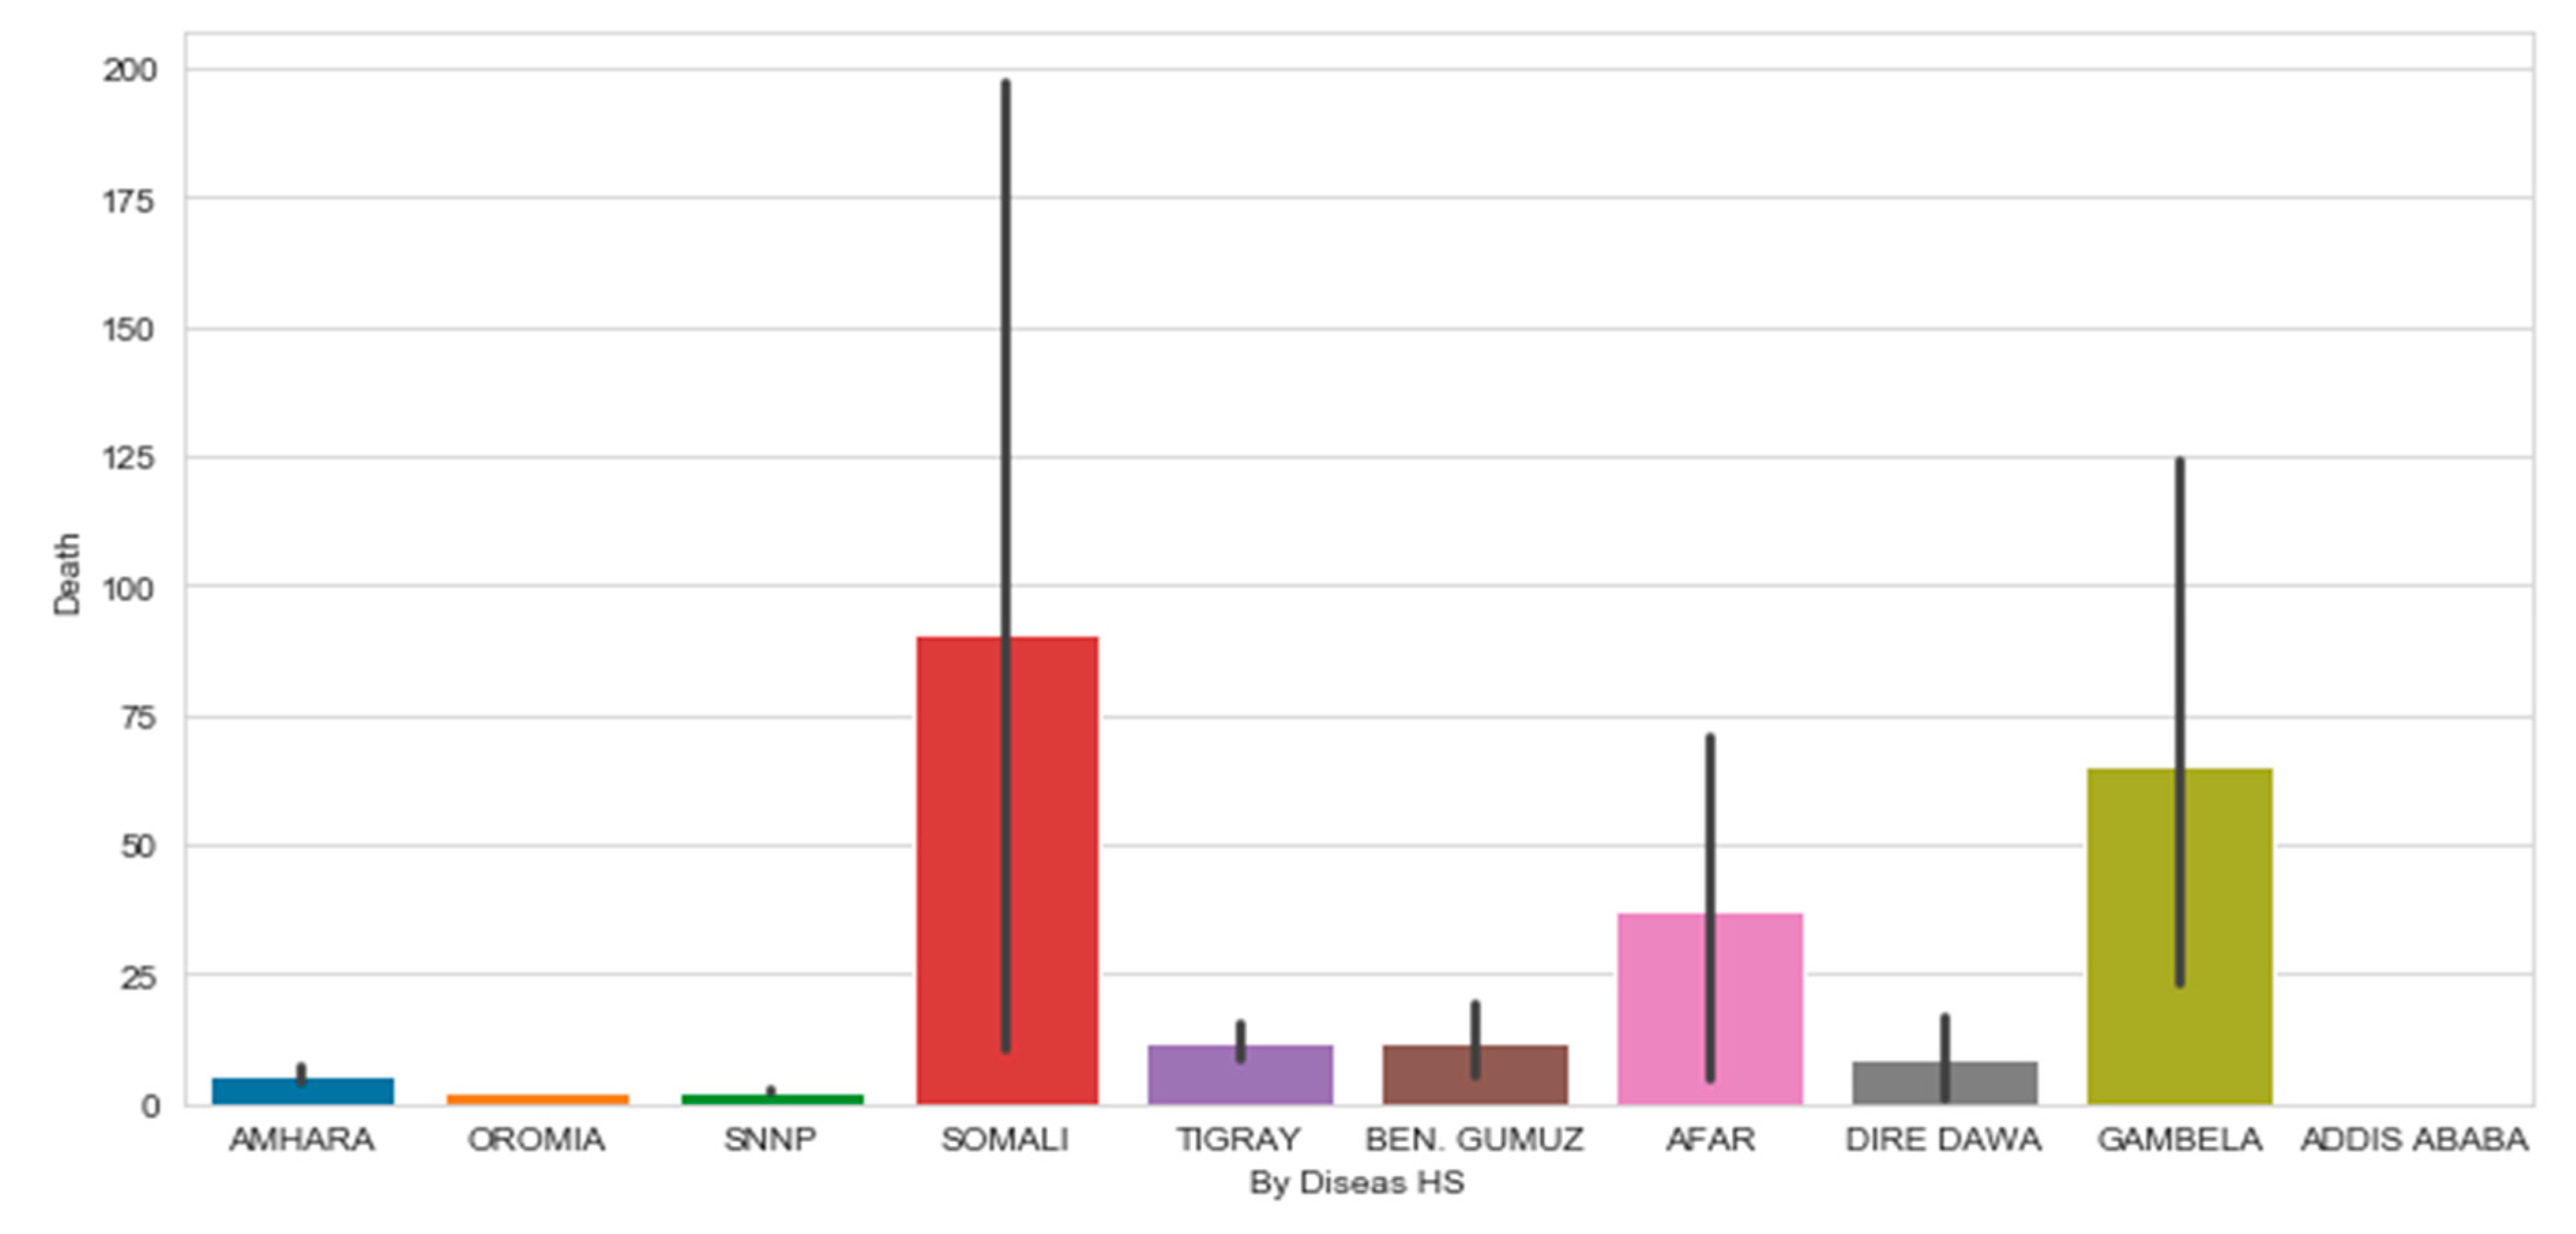
As depicted in Figure 8, the number of animals who died due to the disease BQ was high at Afar, Benishangul Gumuz Somalia, Gambela, and Tigray. The survey revealed that the disease BQ occurs most likely in hot areas. Thus, the analysis results give direction to the sector to design how to minimize the risk associated with the disease.
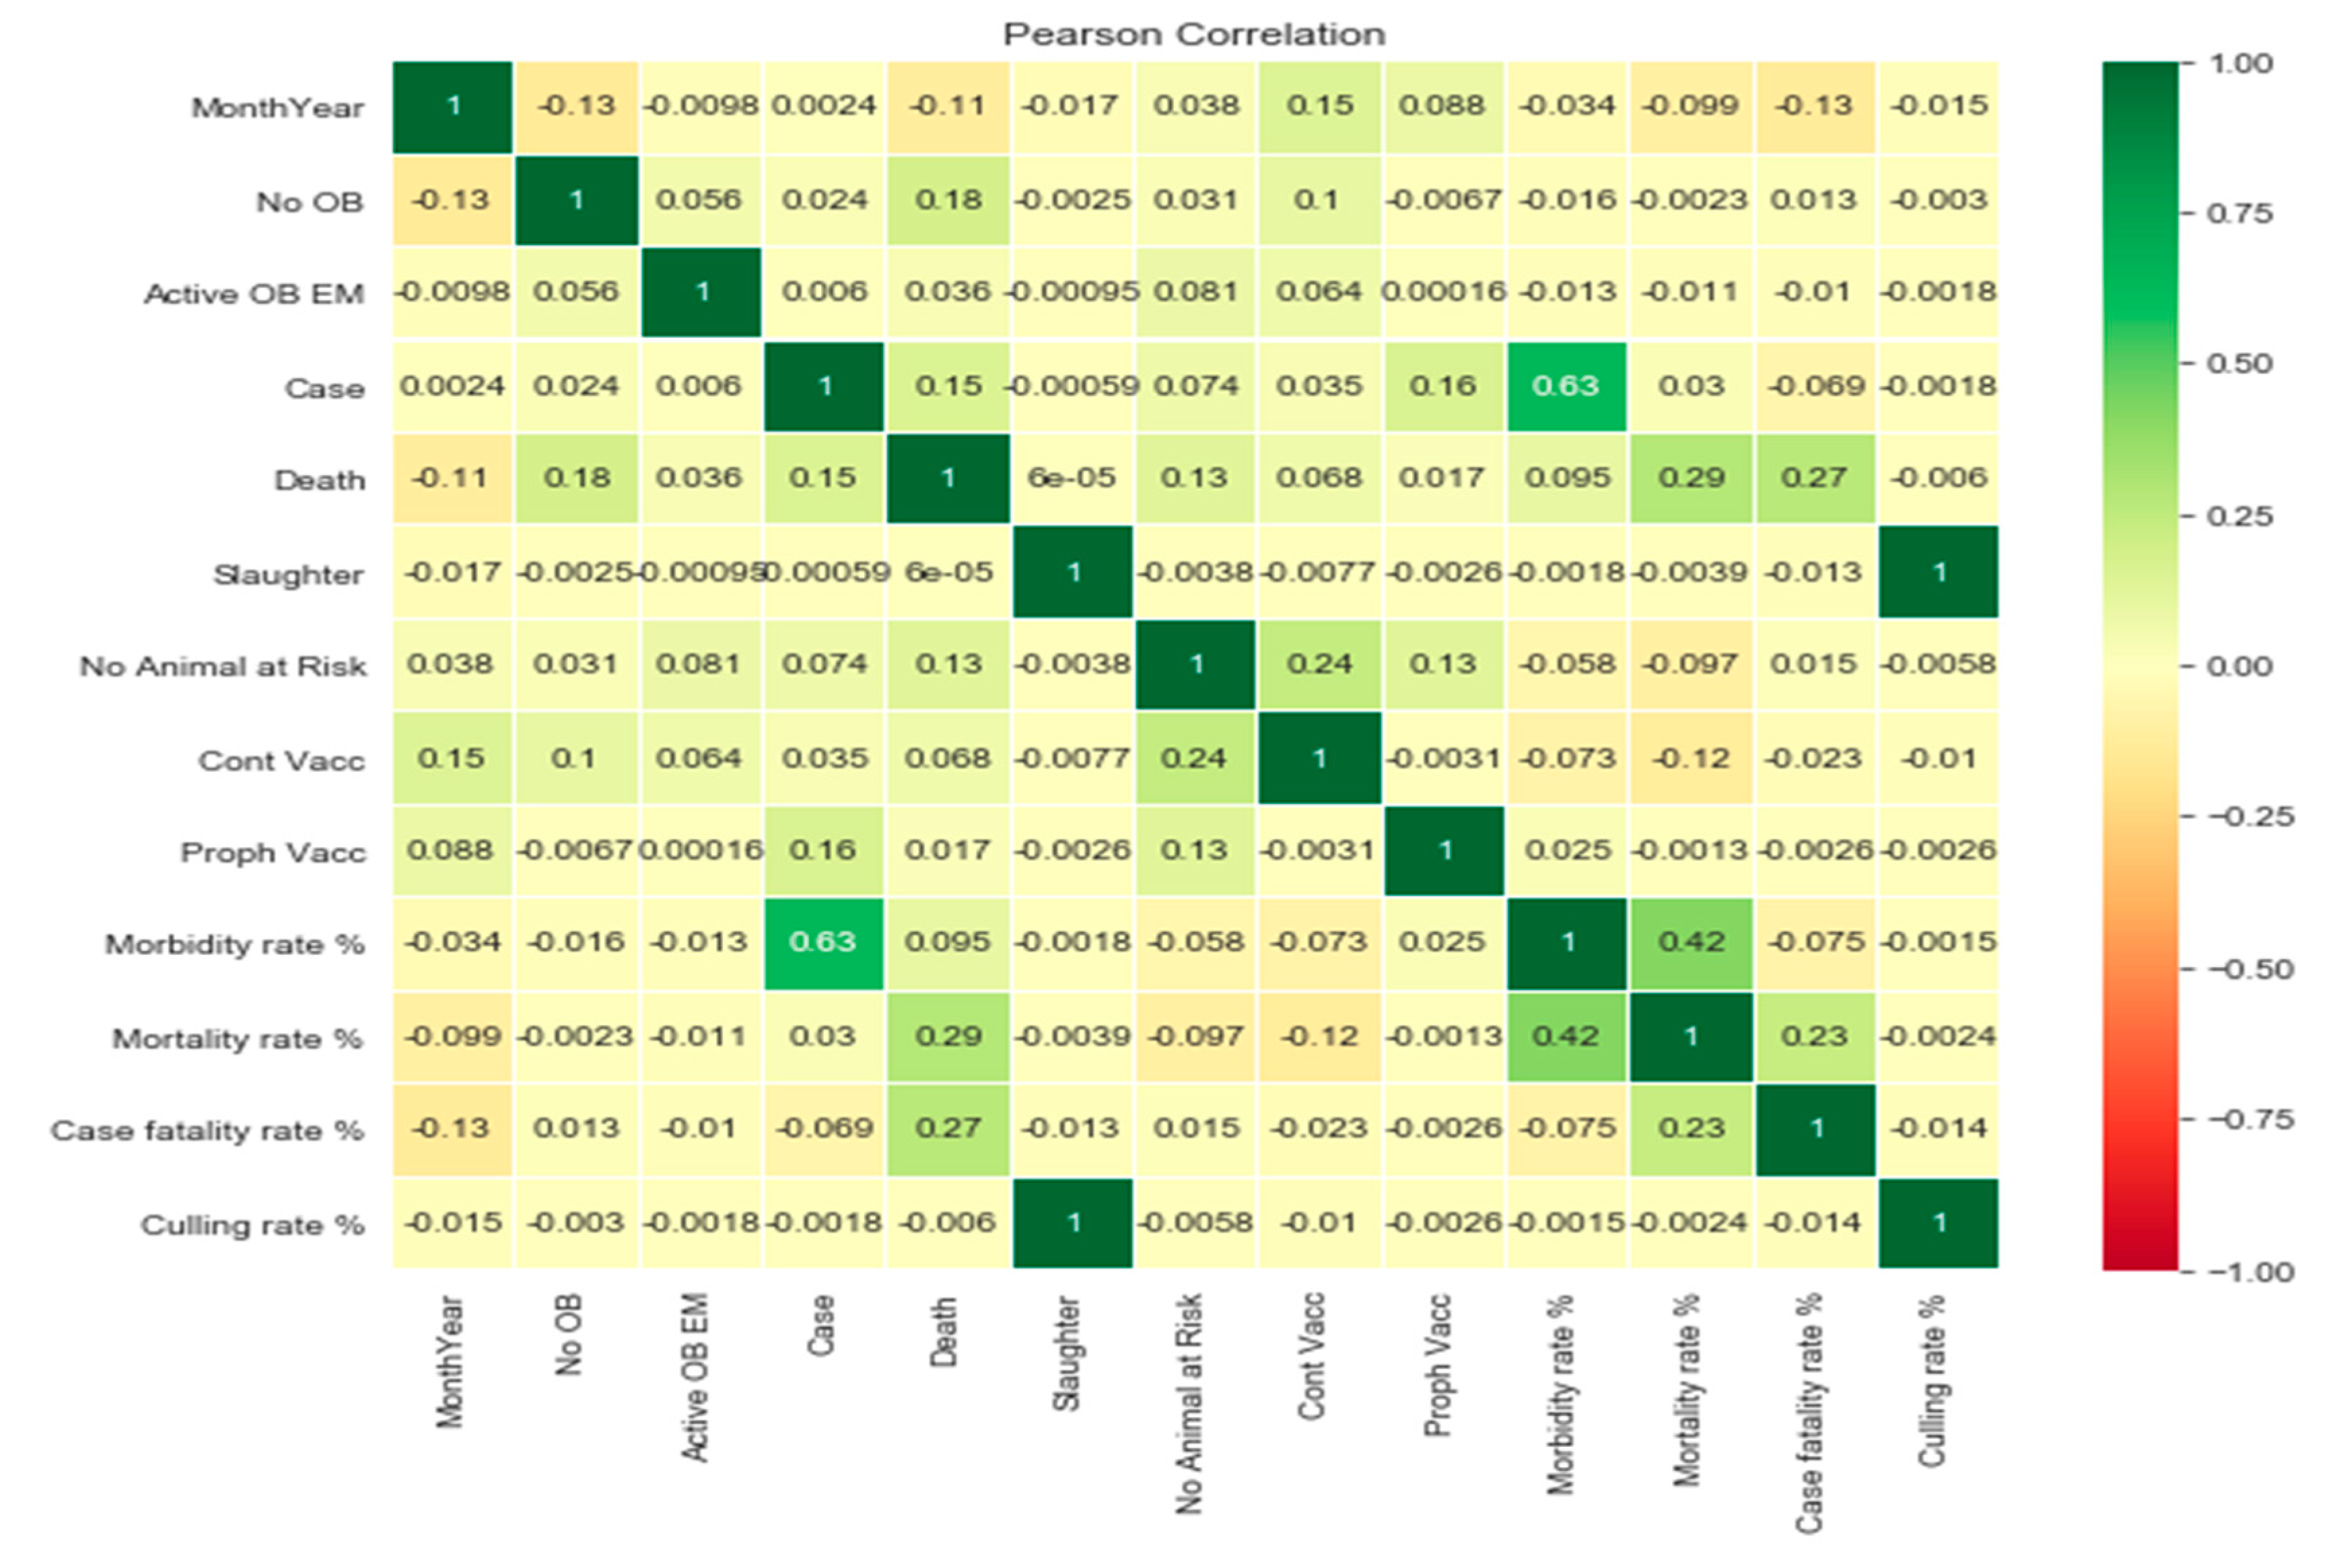
To see the similarity and dissimilarity between the variables in the collected data, the following correlation result as depicted in Figure 9 using Python programming was obtained.
Figure 9 shows that, among all variables, variable slaughter and culling rates are more related to each other i.e. whenever there is slaughter the probability of culling is high i.e. the culling may be either complete or partial of discarding necessary organs due to infectious diseases. Hence, the outcome of the analysis helps the sector to identify the epidemiology of the diseases to design mechanisms to minimize the risks. The number of animals that died due to HS in each region is depicted in Figure 10.
Hierarchical cluster analysis: As described above the source of data is the livestock sector of the Ministry of Agriculture (MoA), Ethiopia. The number of clusters indicated by the dendrogram with the red broken line in the cluster analysis, which is five, demonstrates that k=5 is the ideal cluster size. Each leaf of the dendrogram shown corresponds to an observation of a particular disease type that was recorded from 2007 to 2015 in various regions of Ethiopia for the seven most severe diseases, which are listed in Table 1.
As we move up the tree in any dendrogram, observations that are similar to each other are combined into branches, which are themselves fused at a higher height. The height of the fusion, provided on the vertical axis, indicates the (dis)similarity between the two observations. The higher the height of the fusion, the less similar the observations are. The proximity of two observations can be drawn only based on the height where branches containing those two observations first are fused. The height of the cut to the dendrogram determines the number of clusters obtained. It plays the same role as the number of clusters in k-means clustering.
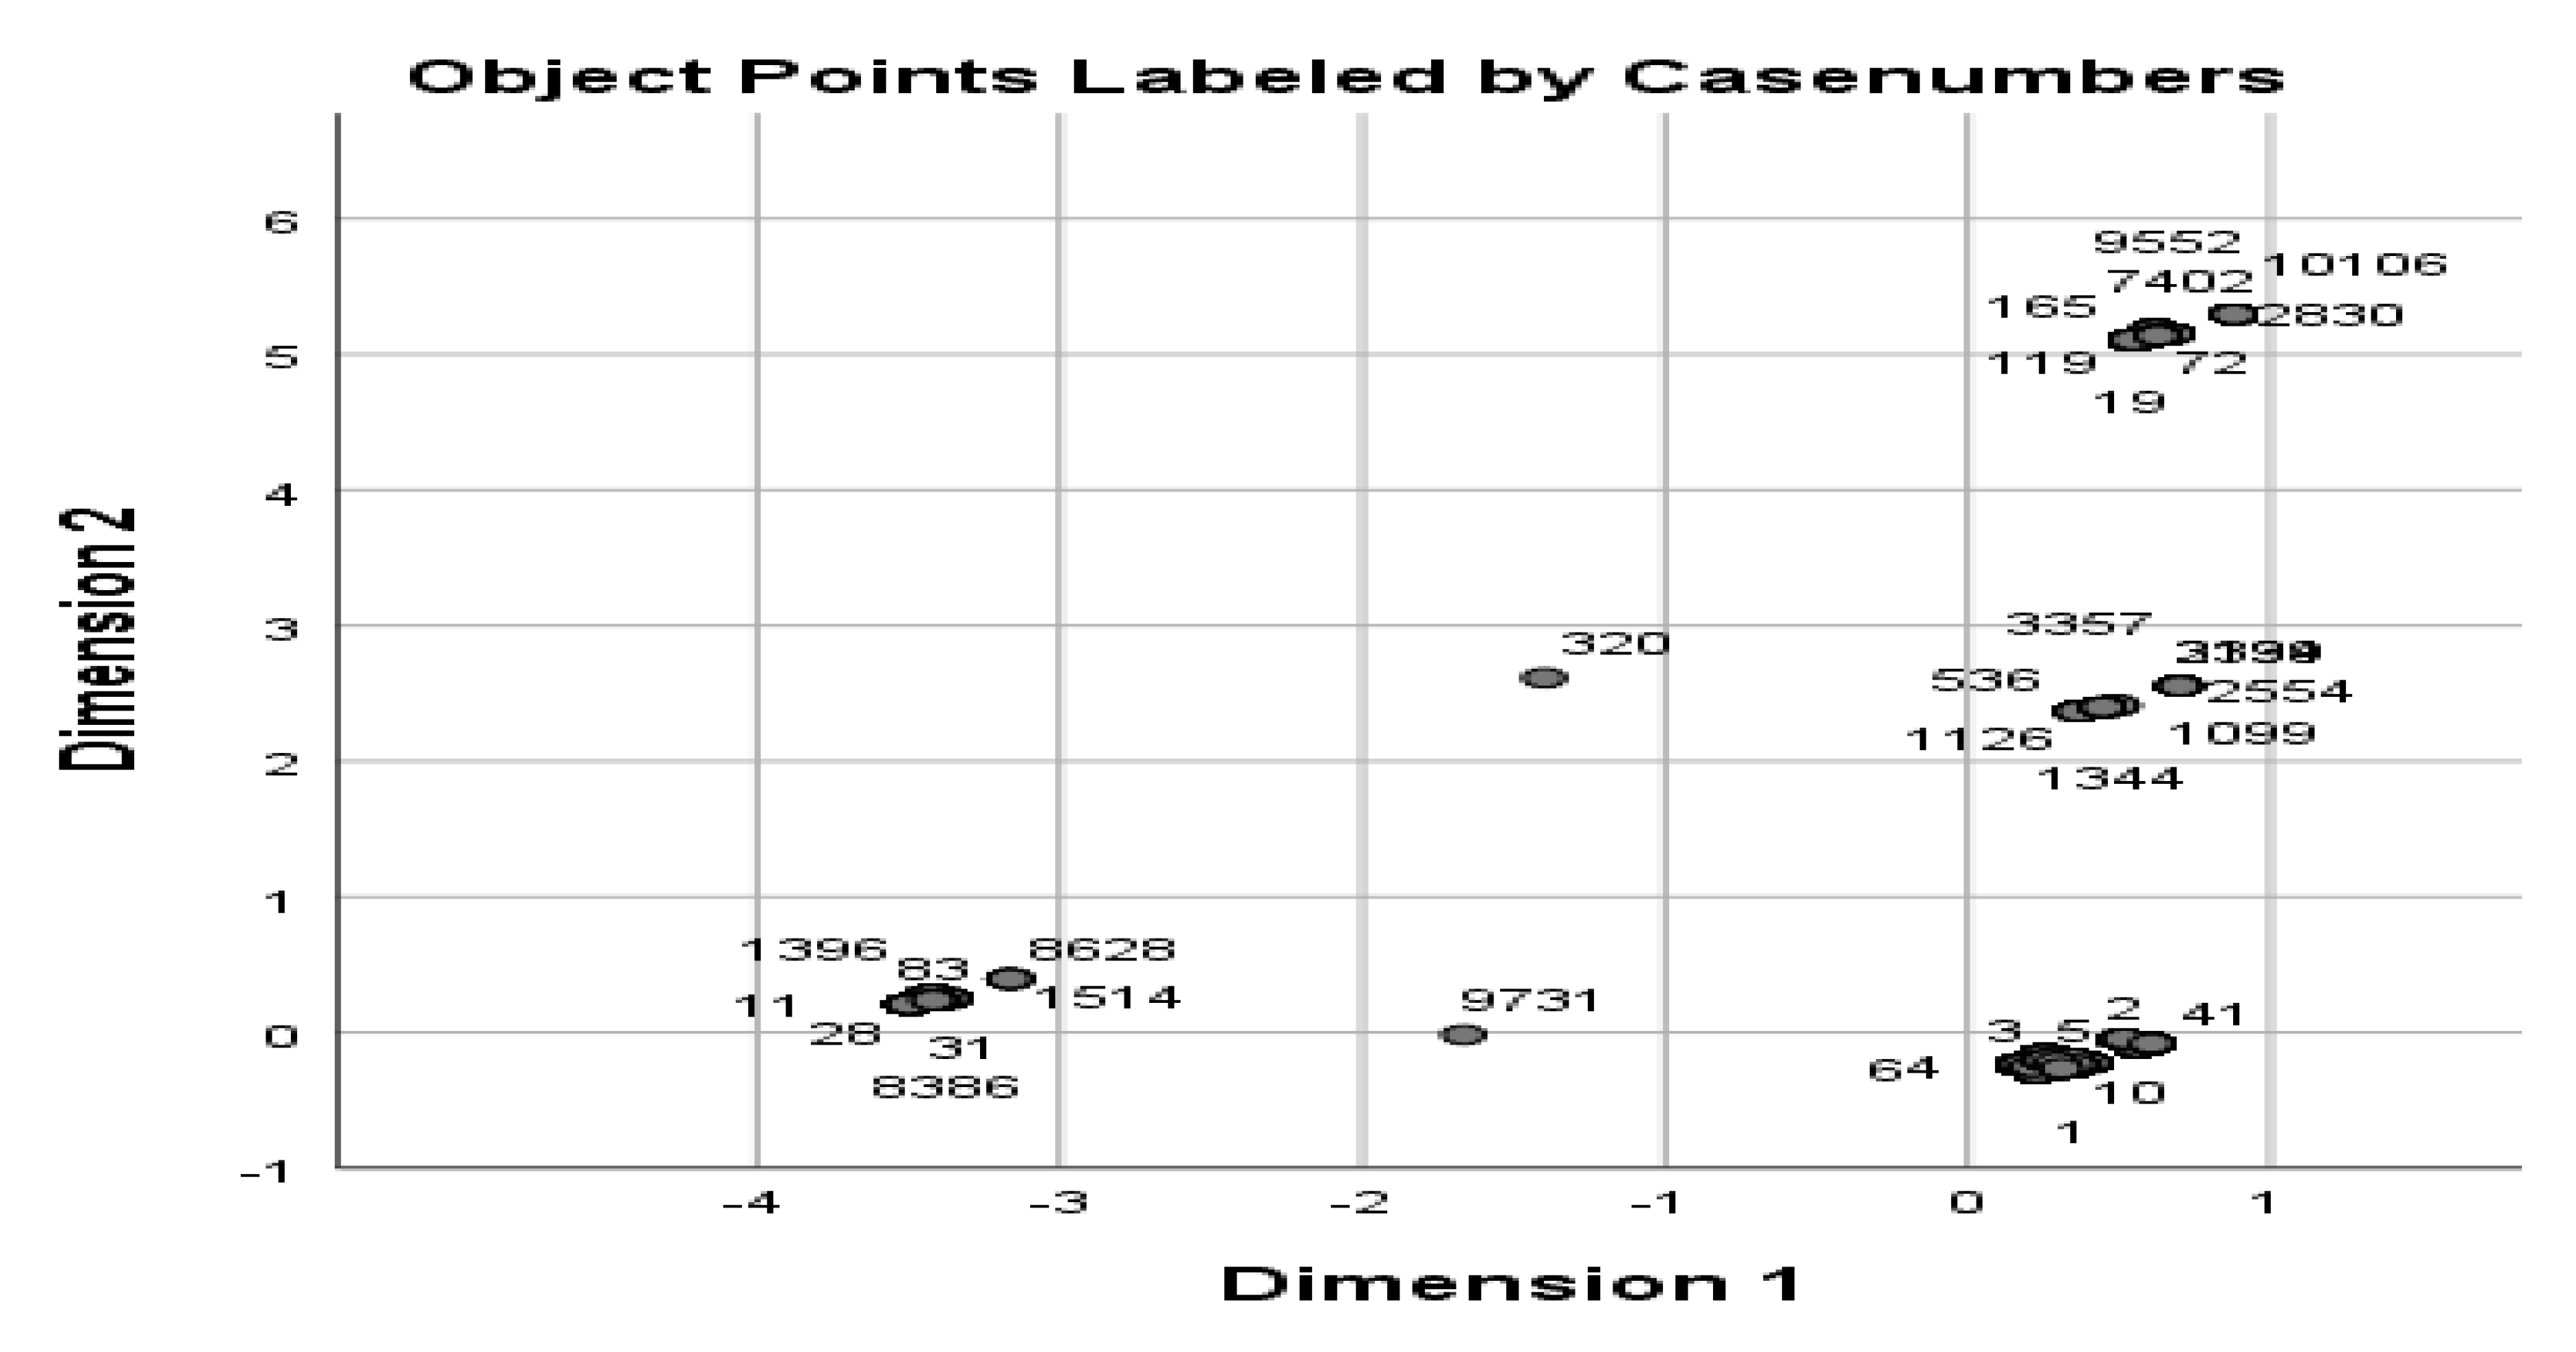
Moreover, for replication of the study, we performed the same techniques on other datasets obtained from different regions. In doing so, it has been checked the applicability of similar algorithms on the different datasets and an optimal number of clusters was also identified. Accordingly, the following results are obtained. As we observed in Figure 11, almost all the diseases are populated in dimension one.
Agglomerative Clustering using complete linkage with different distance metrics
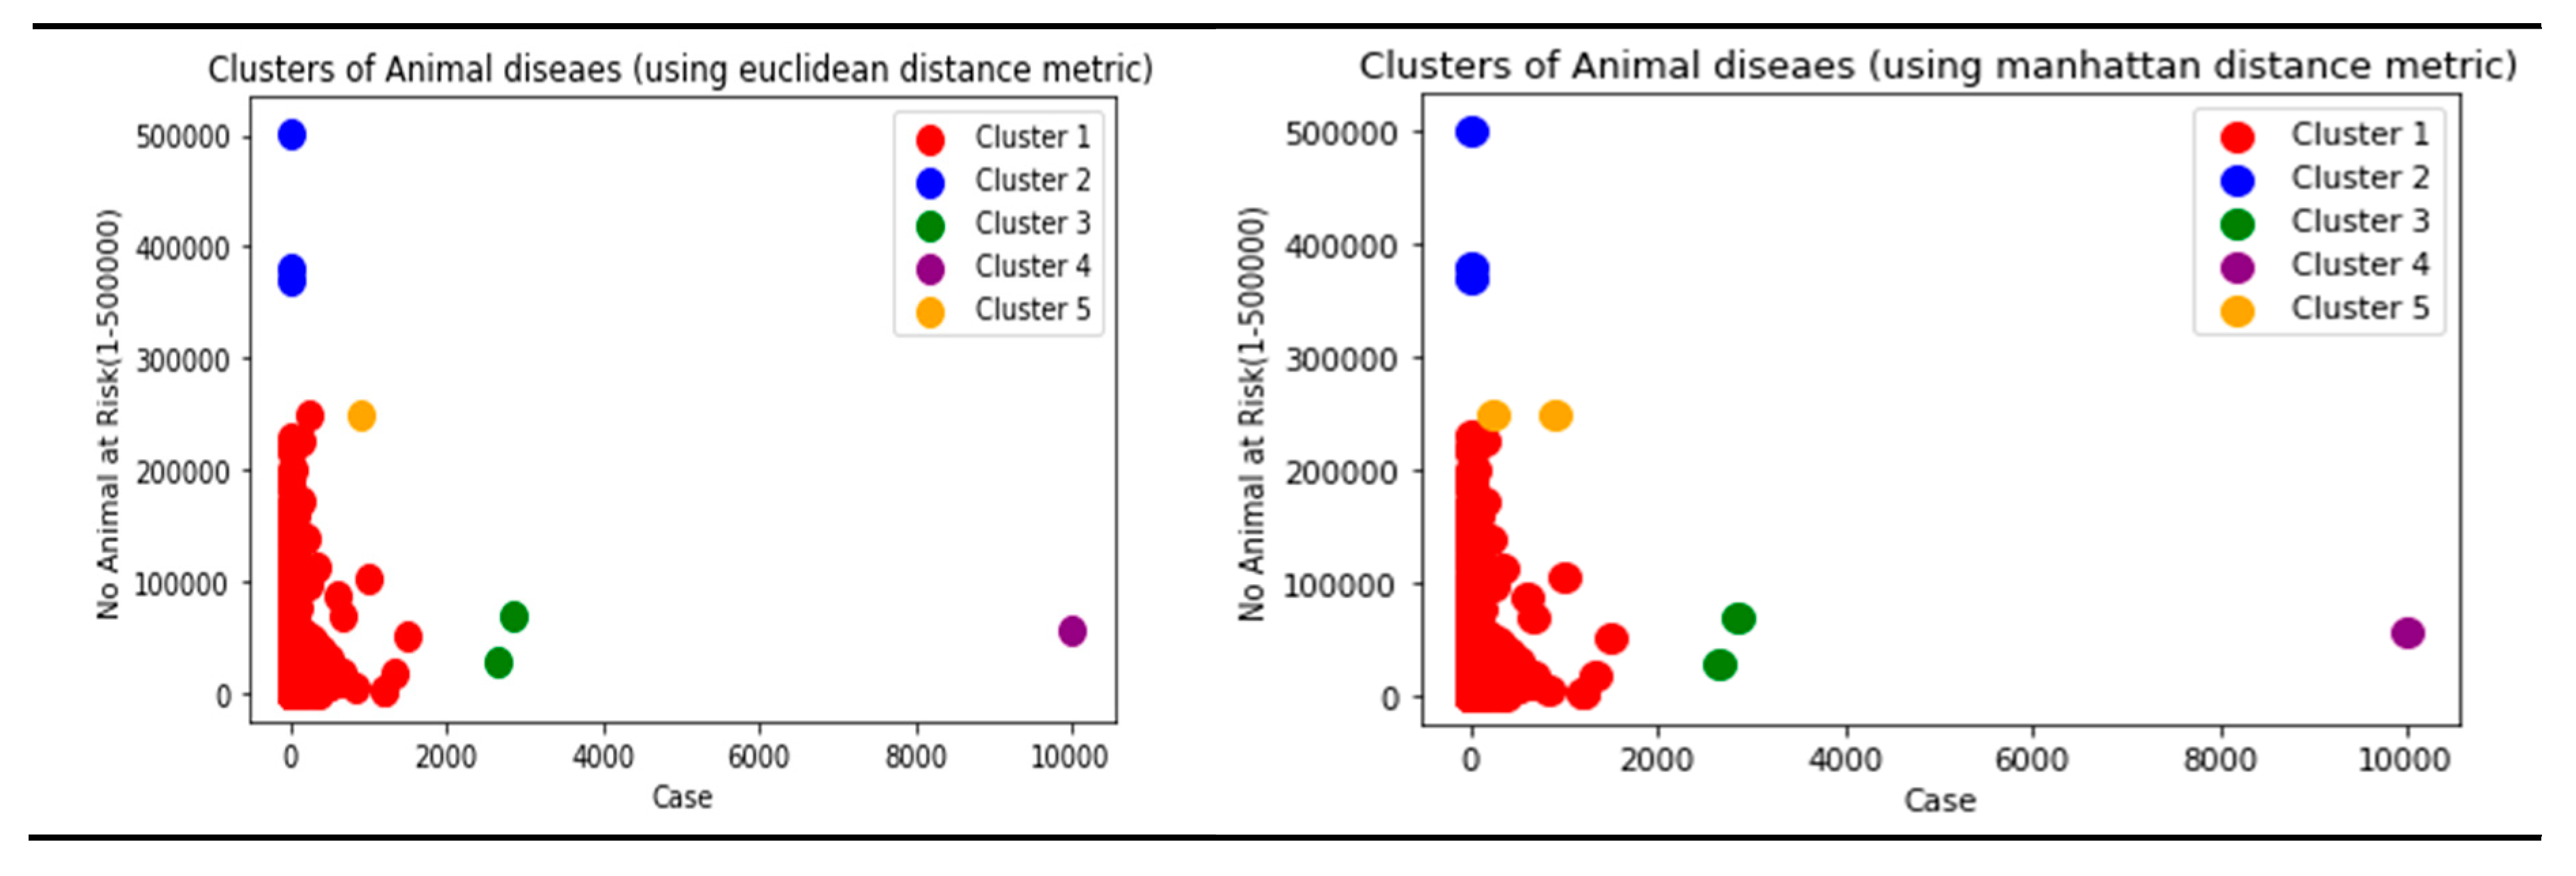
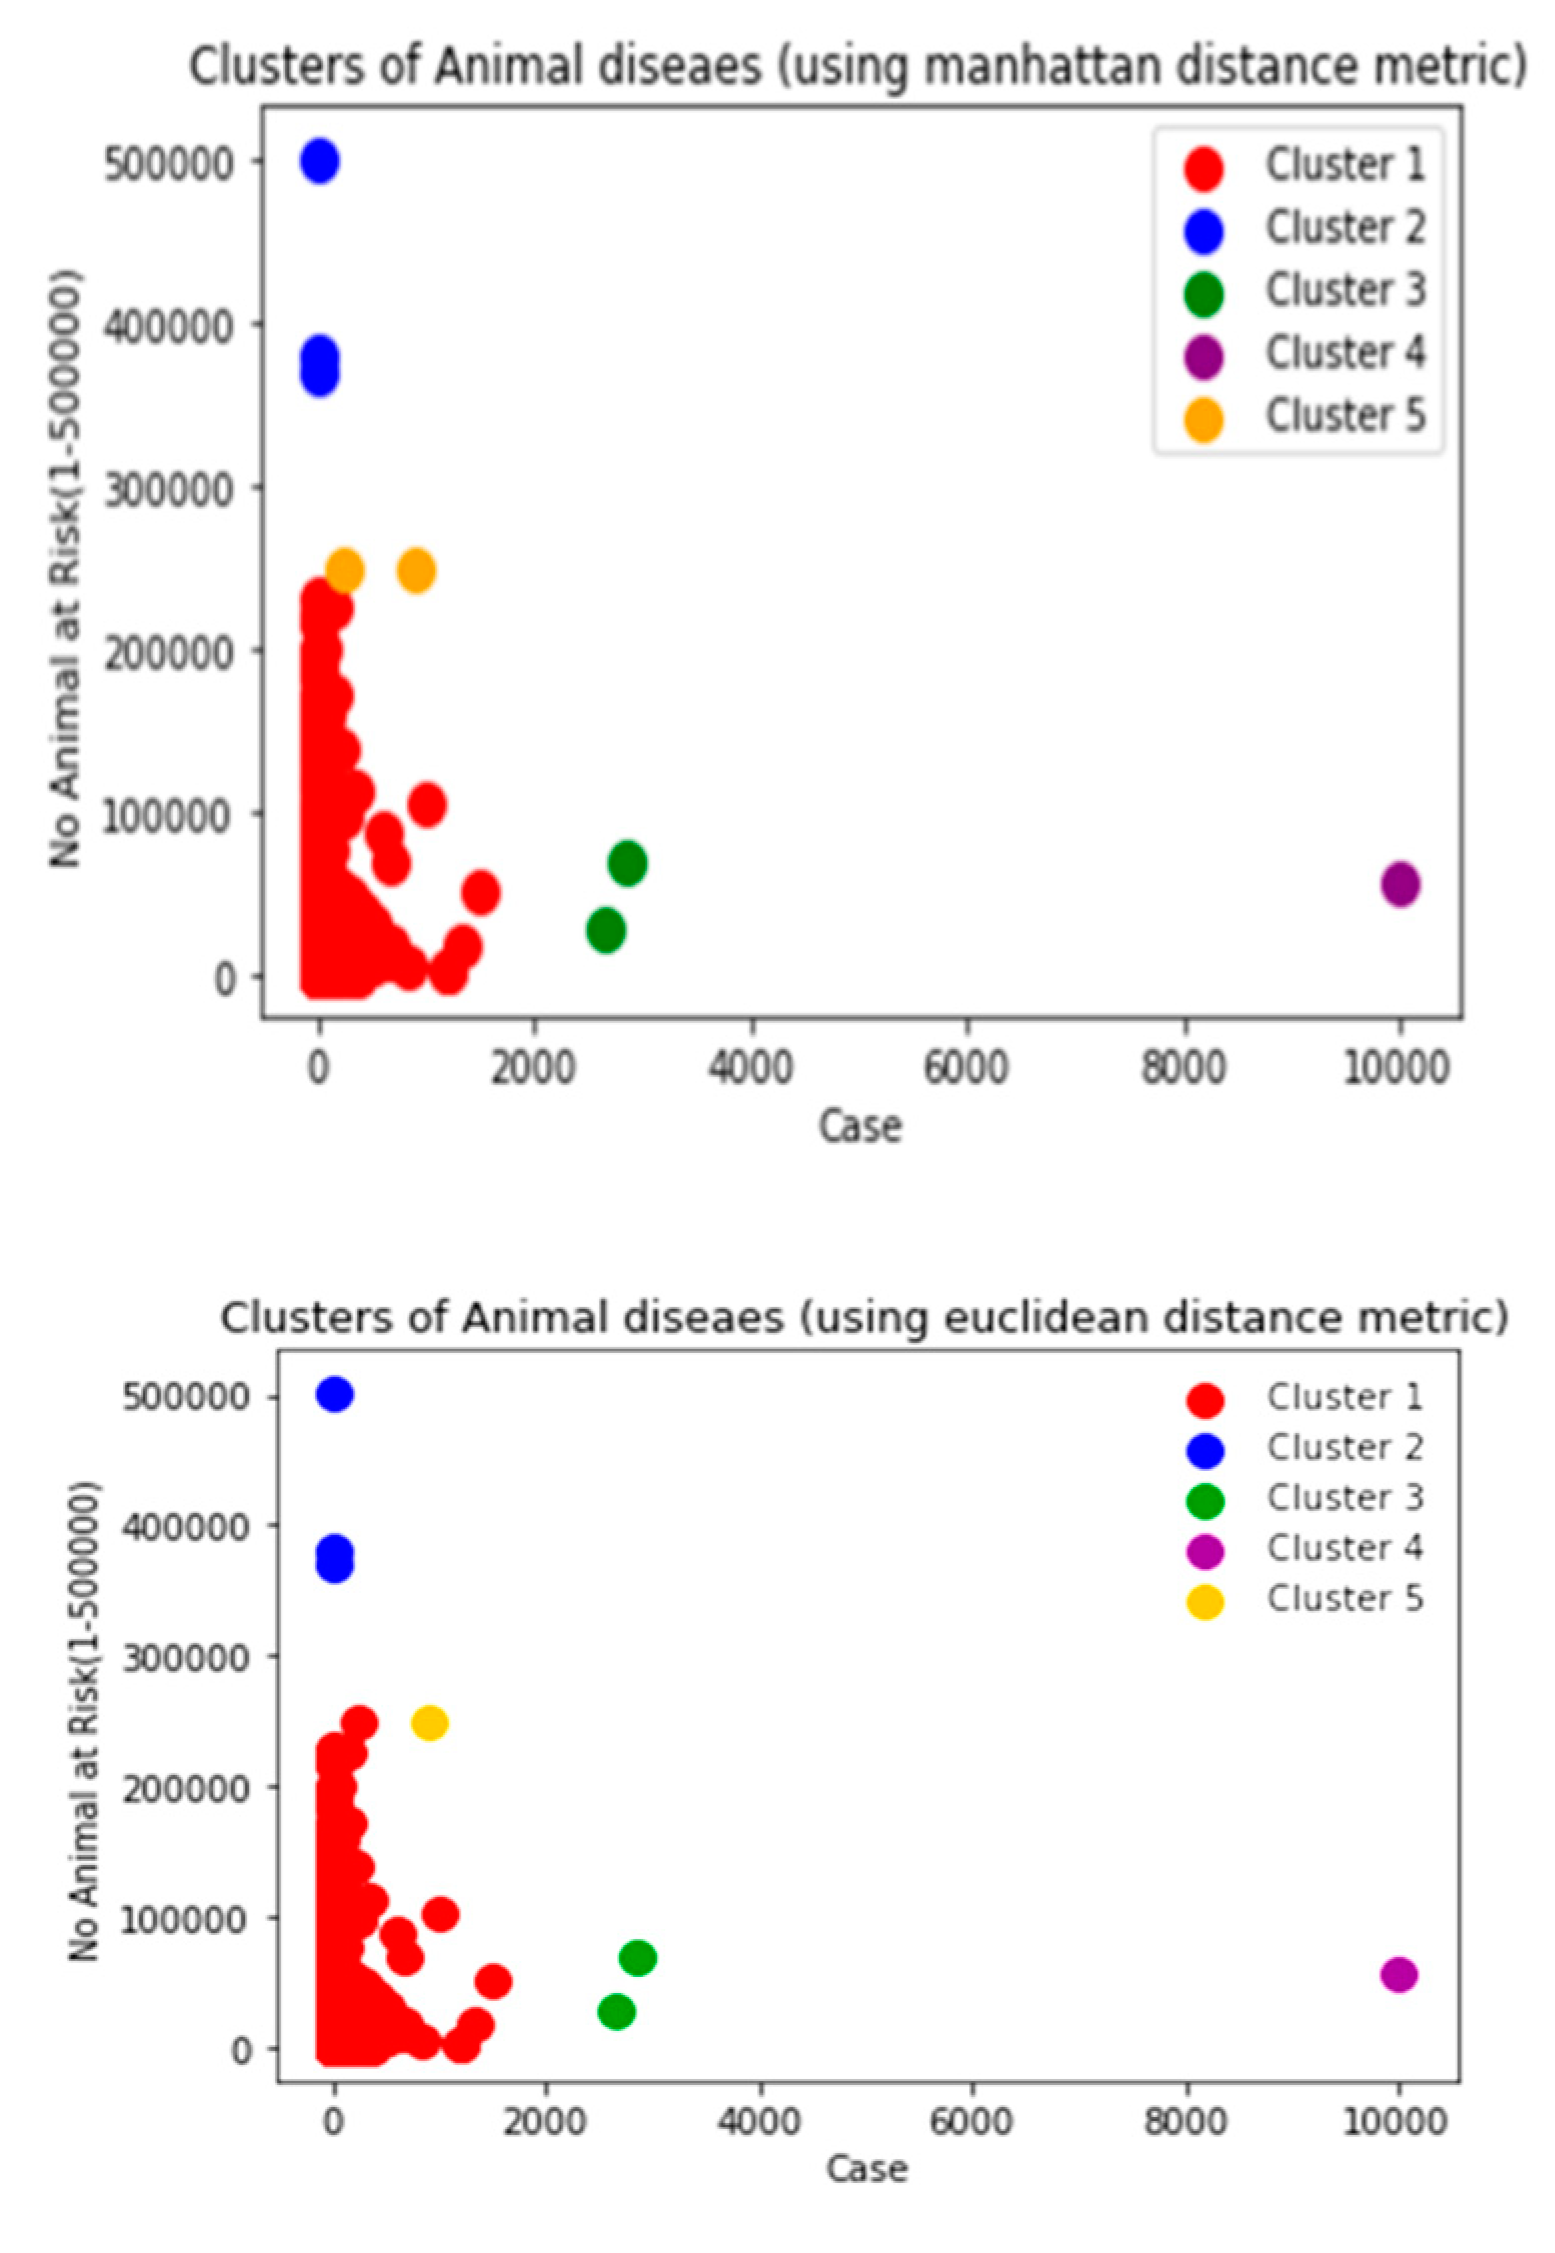
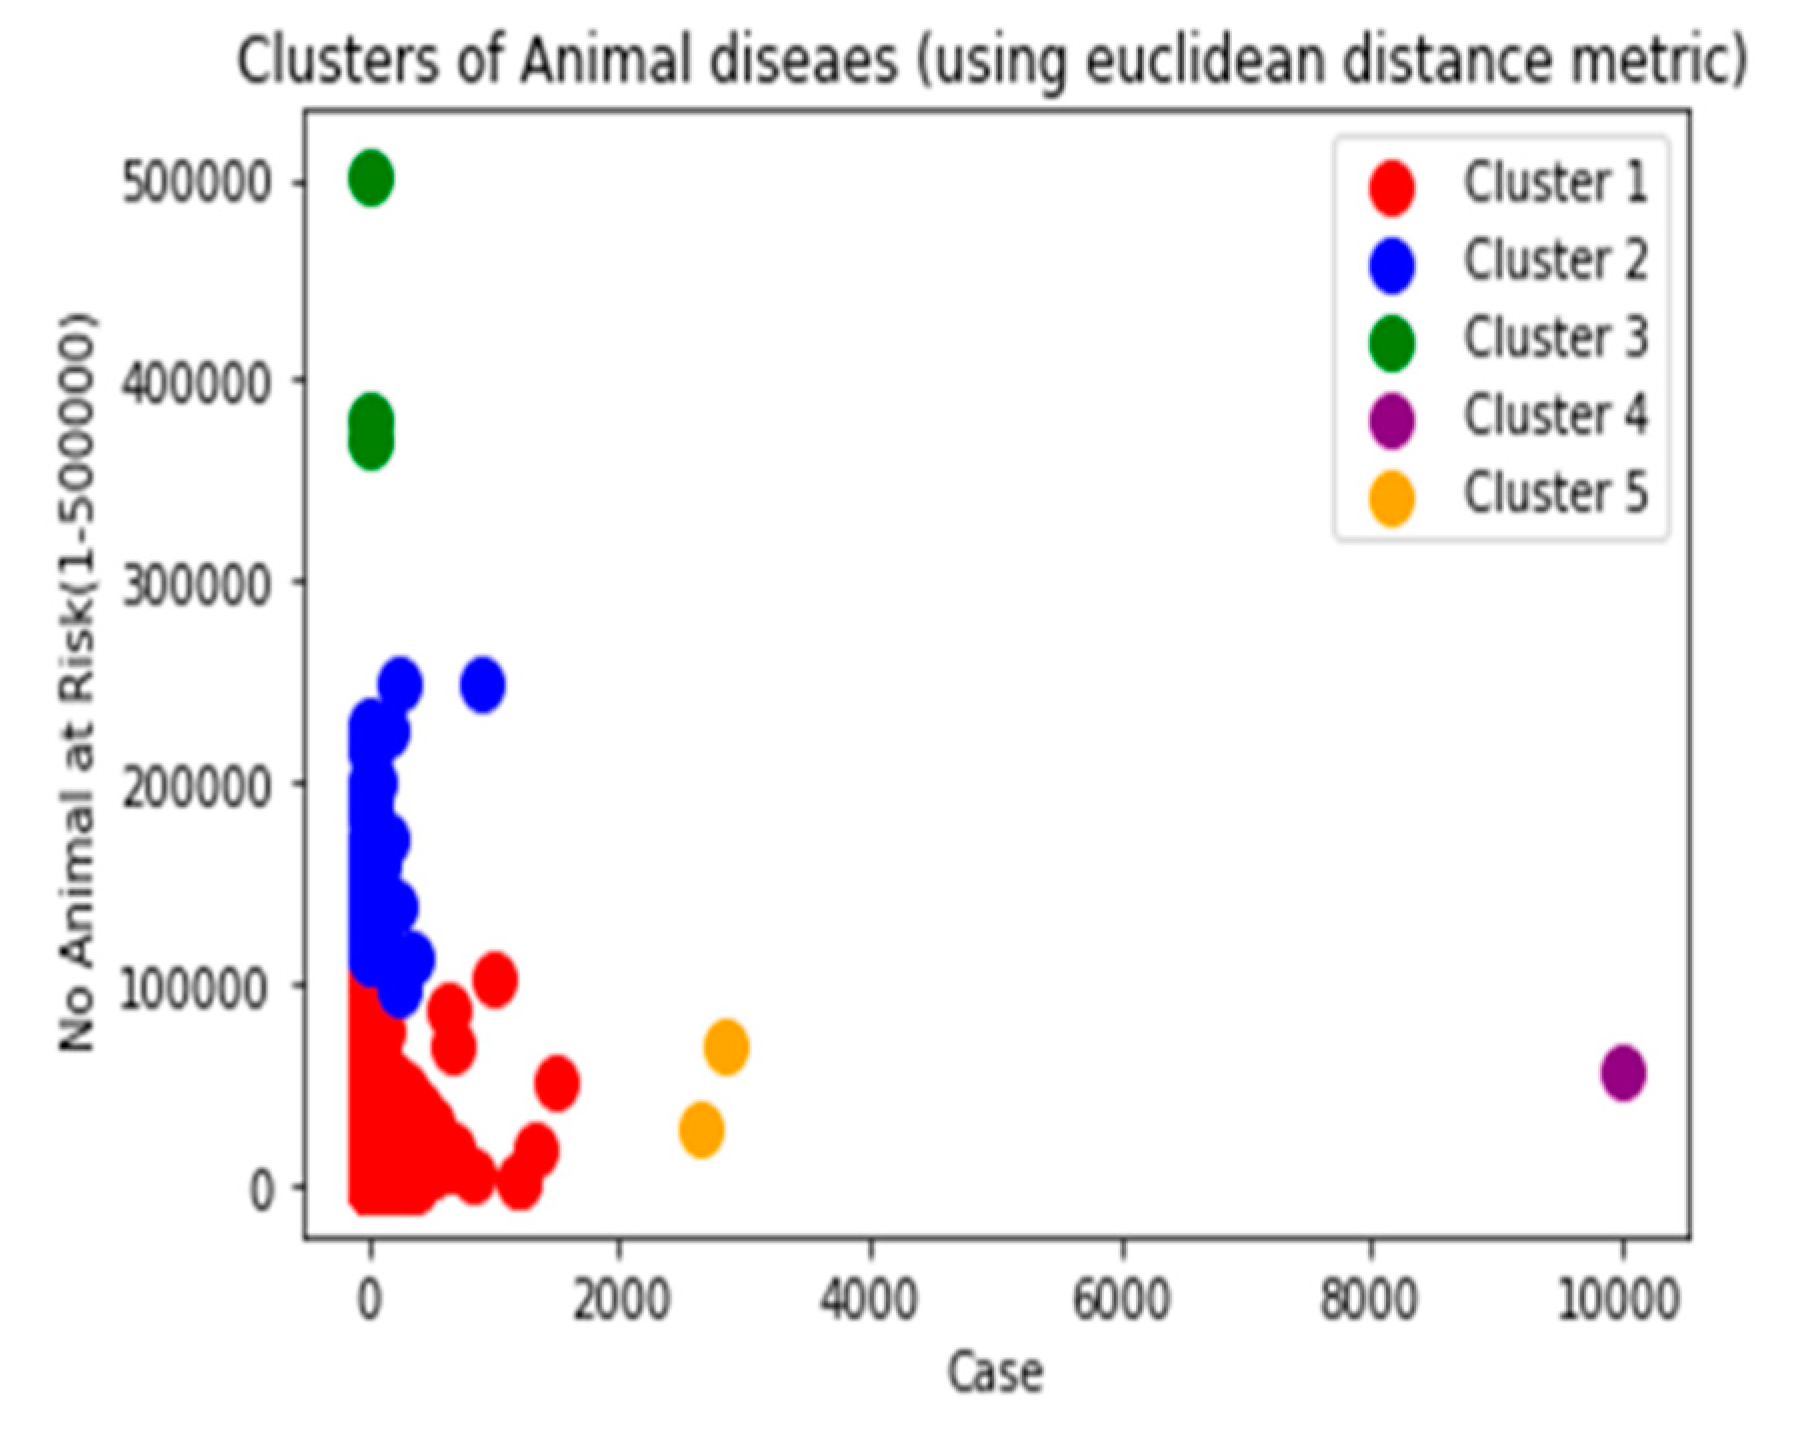
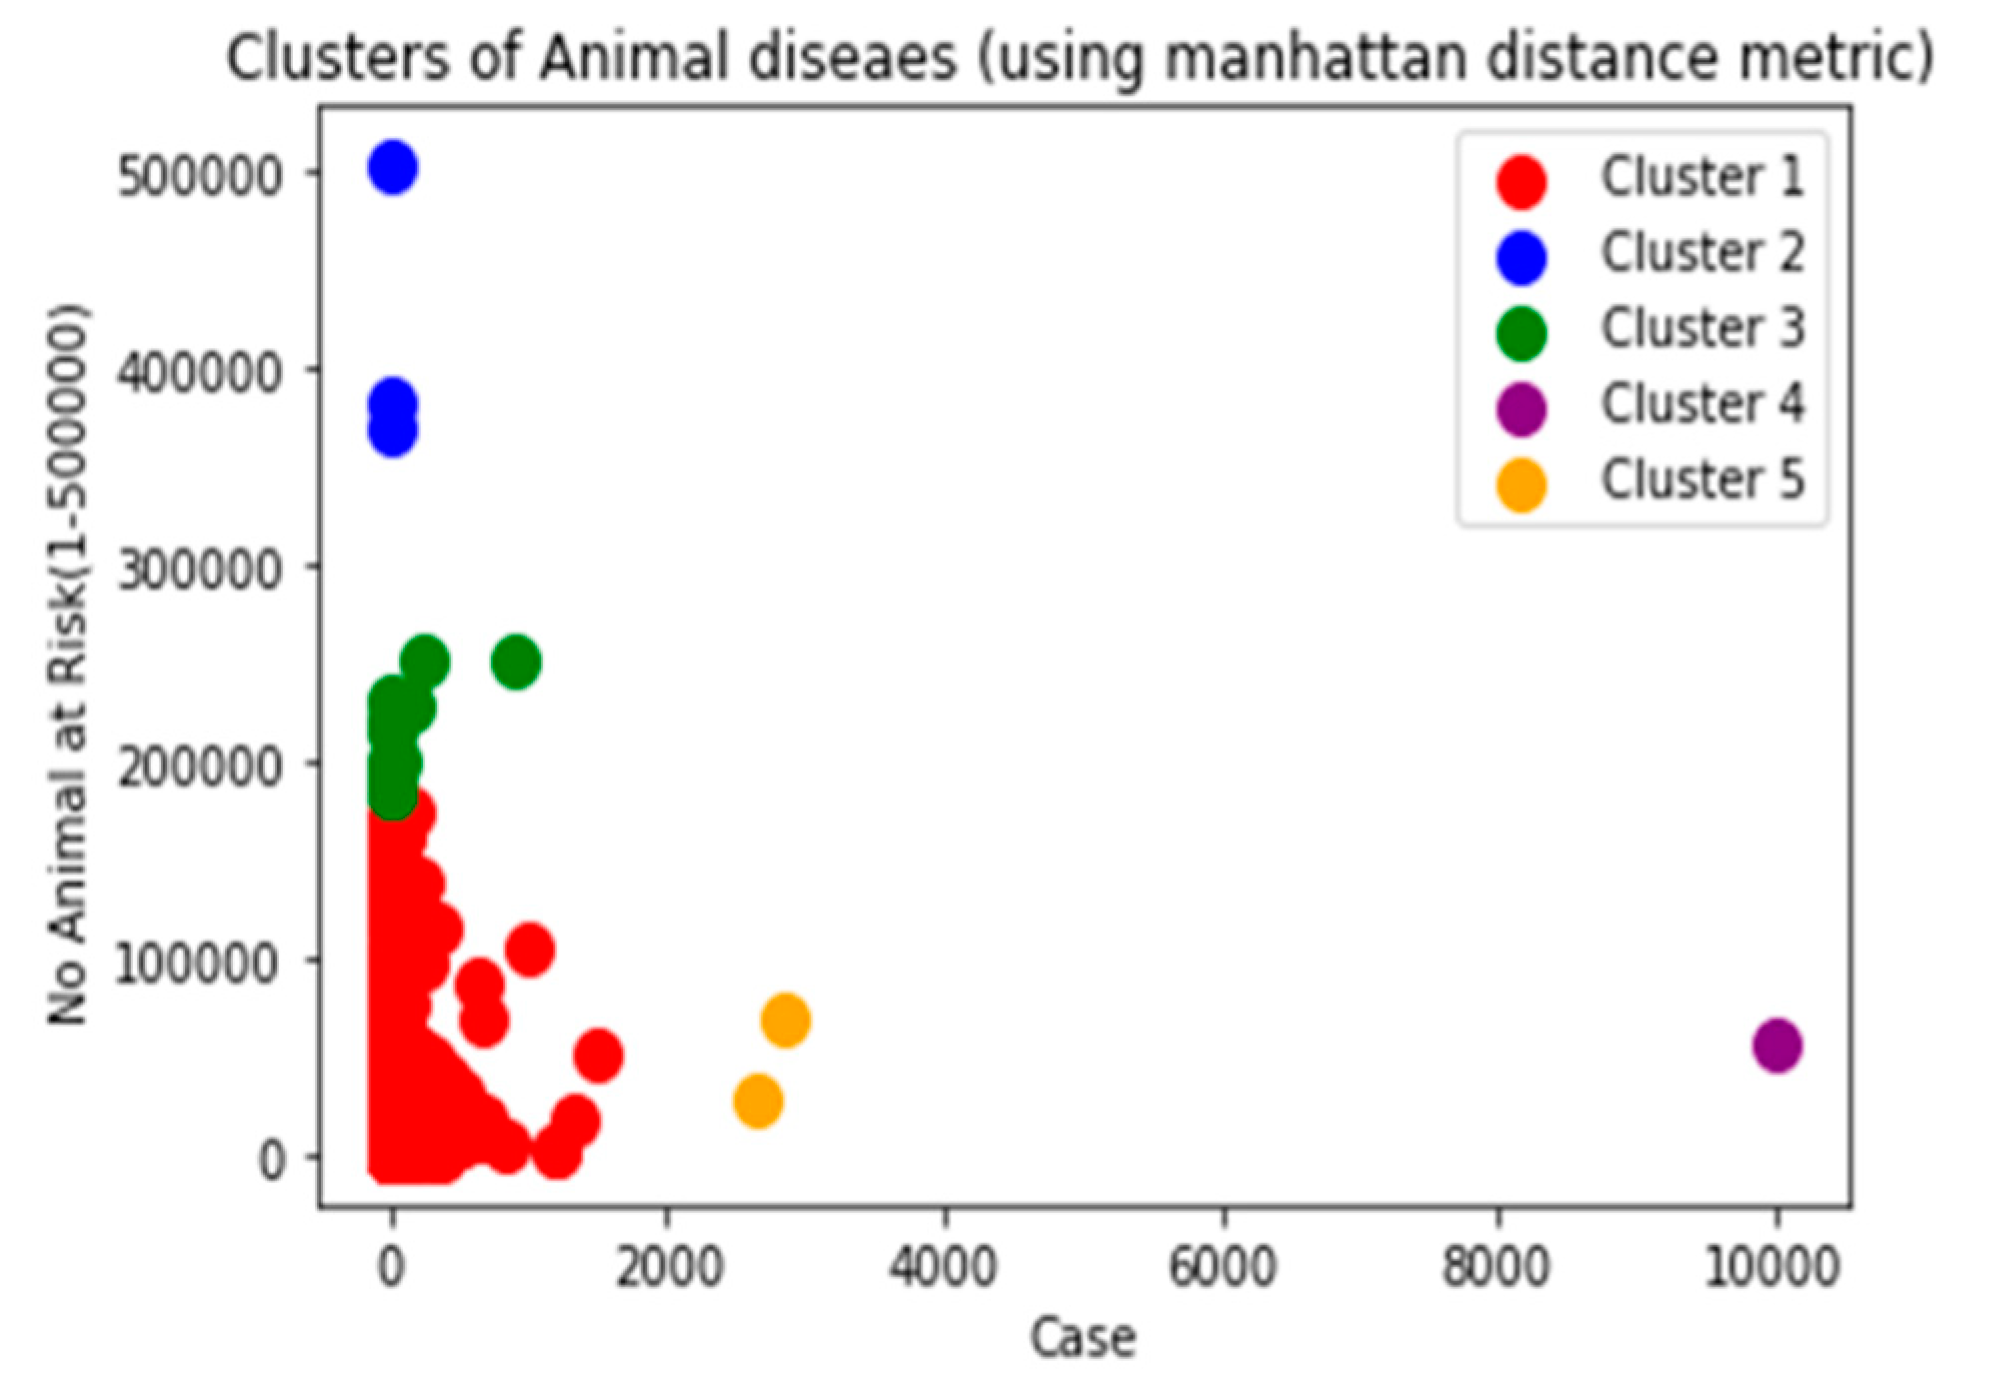
Figure 12. a Clustering of livestock disease burden using Euclidean distance metrics with Average linkage Figure 12b Clustering of livestock disease burden using Manhattan distance metrics with average linkage.
Preprints 76262 g012Preprints 76262 g013
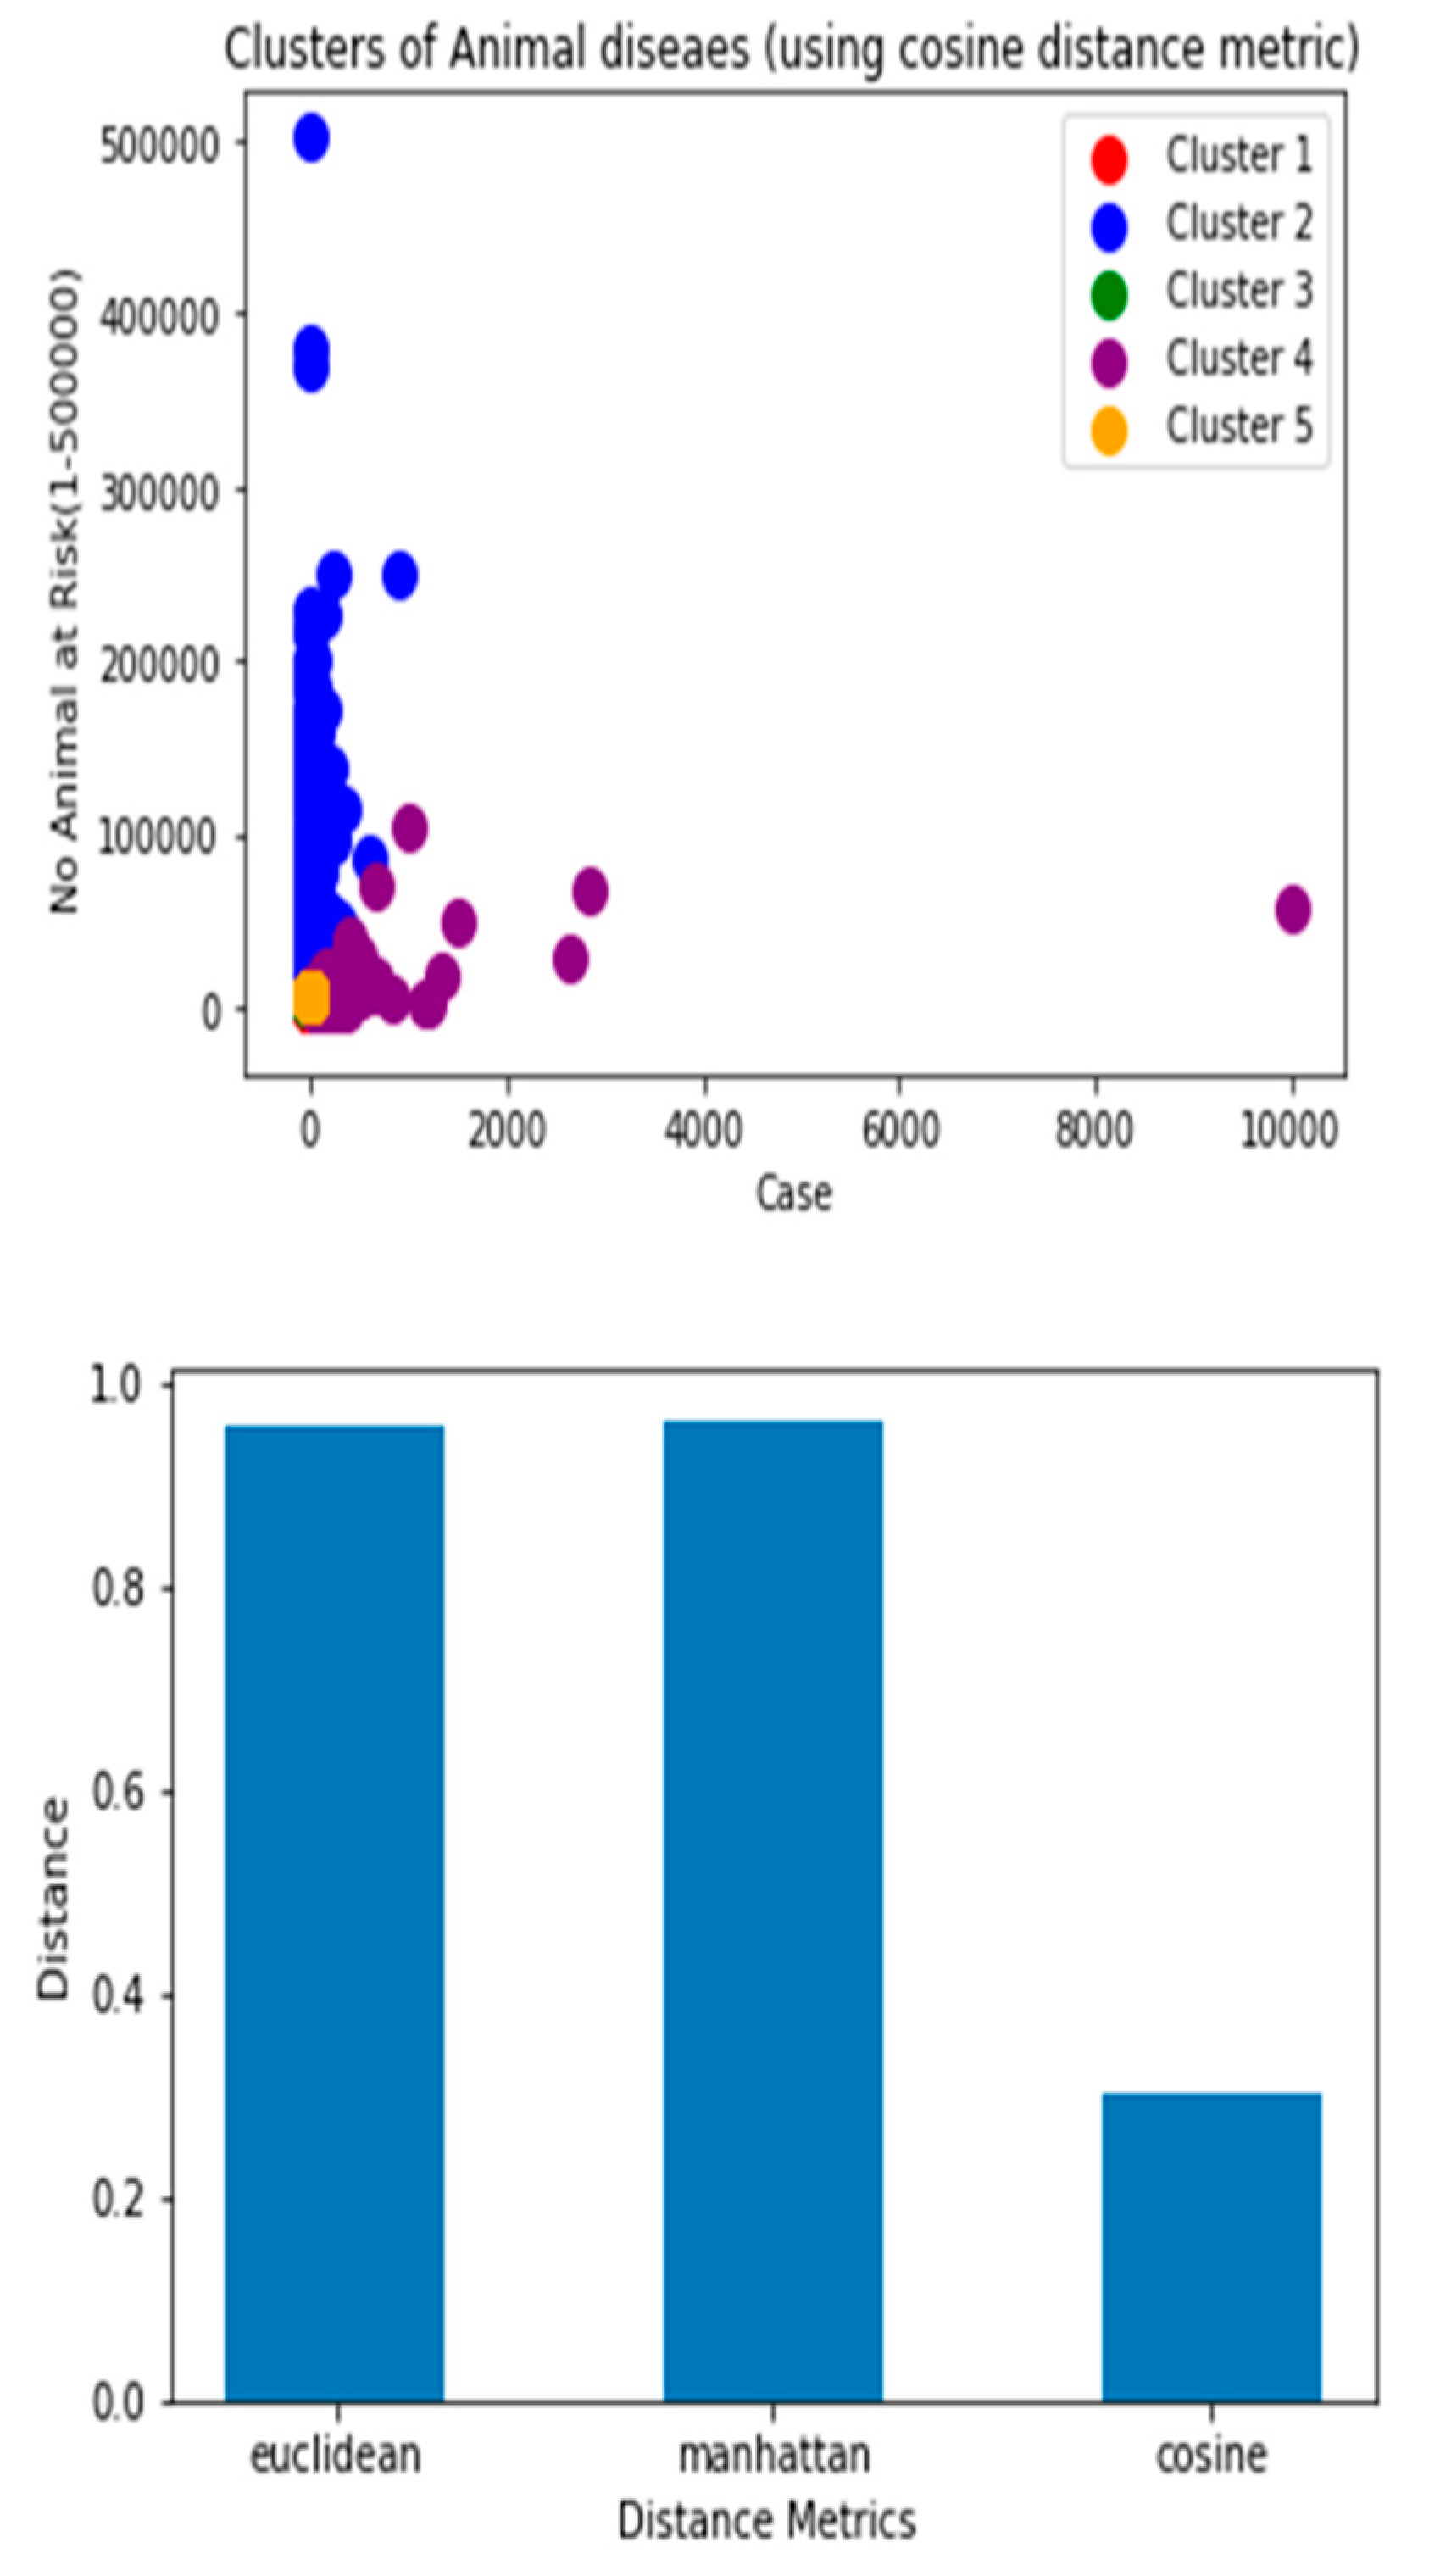
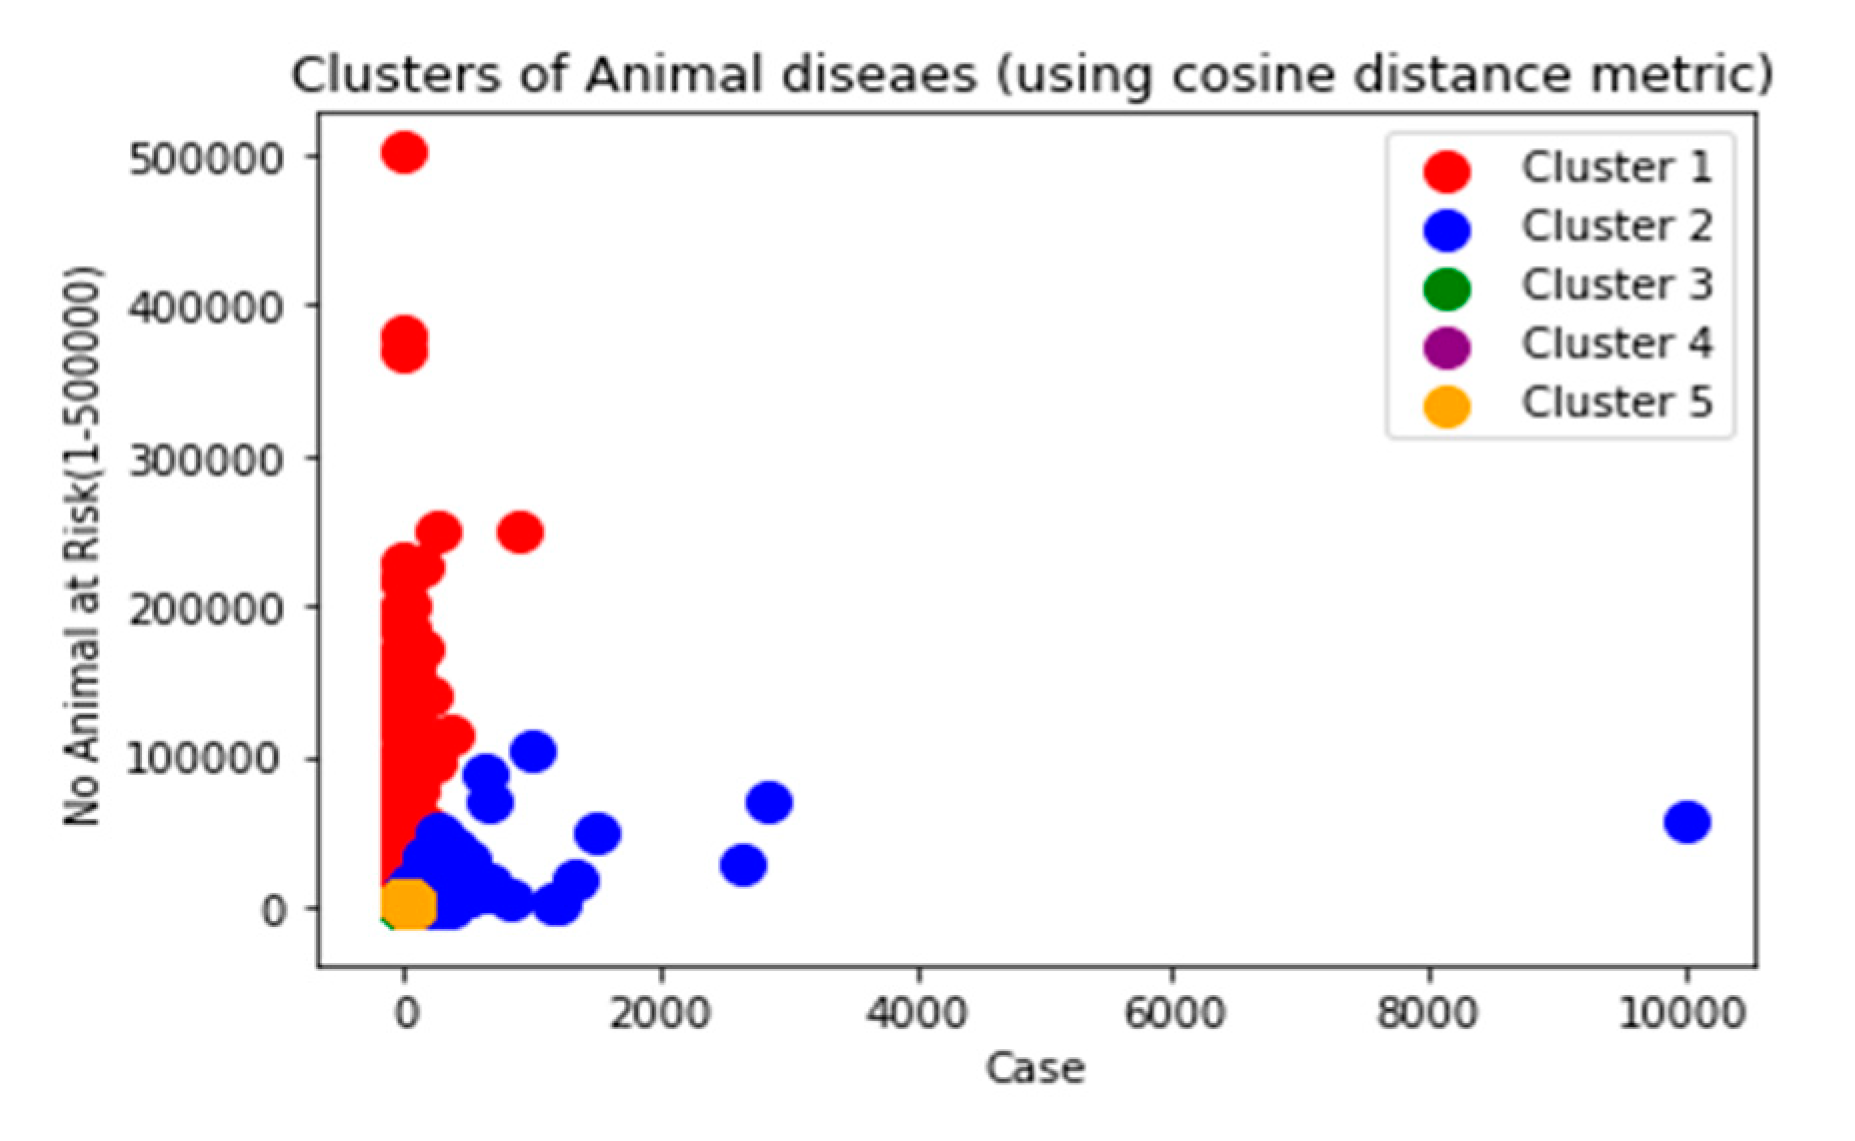
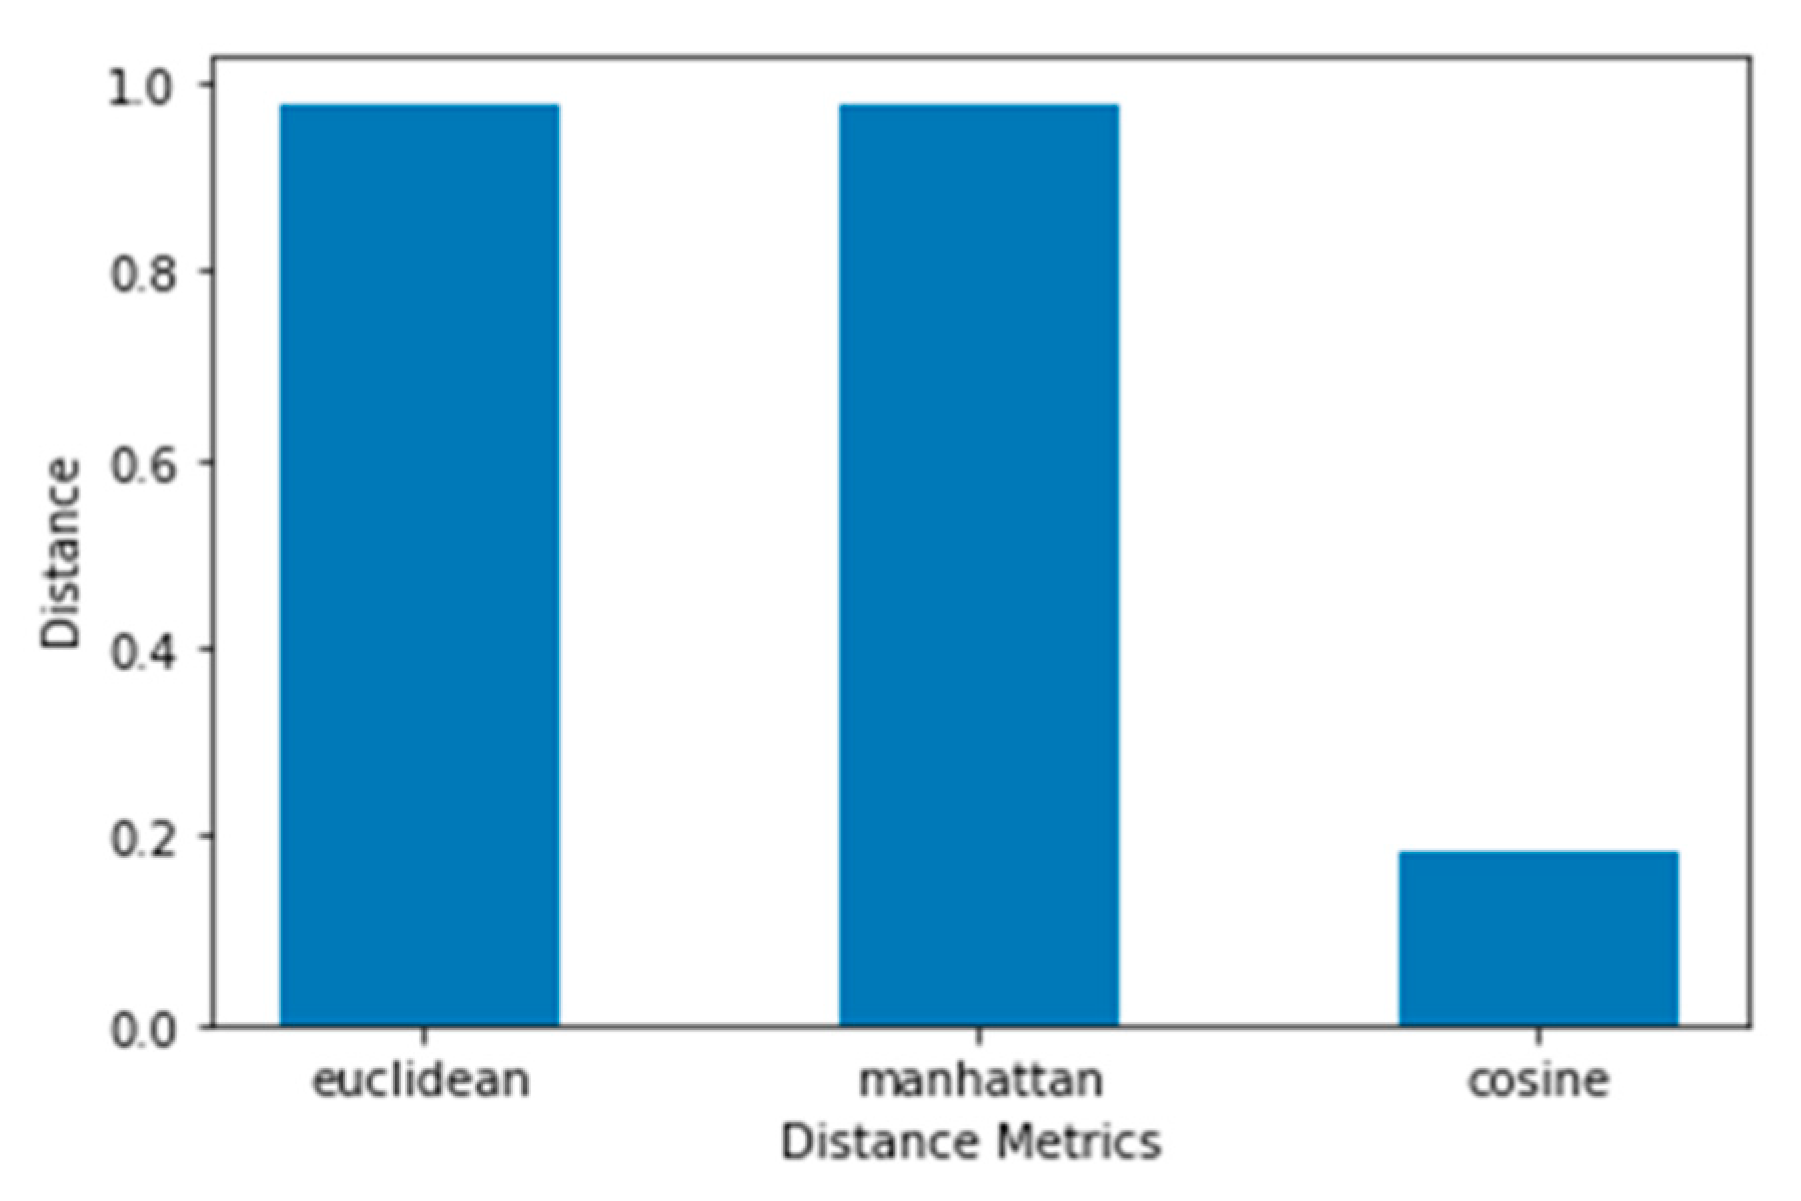
Figure 13. b Clustering of livestock disease burden using cosine distance metrics with average linkage Figure 14 Performance measure of distance metrics with Average linkage.
Preprints 76262 g014
As observed in Figure 14, both Euclidean and Manhattan distance with average linkage performed well (98%), whereas cosine perform poorly when we compared with others (30%) for this particular dataset. Similarly, Agglomerative Clustering using complete linkage with different distance metrics is also computed as follows-
Figure 15b. clustering of livestock disease burden using Manhattan distance metrics with complete linkage
Figure 17 Performance measure of distance metrics with complete linkage As indicated in Figure 17, the performance of both average and complete linkage is the same in complete linkage.
Equally, Agglomerative Clustering using a single linkage with different distance metrics is also computed.
Figure 18. a. Clustering of livestock disease burden using Euclidean distance metrics with single linkage
Preprints 76262 g017
Figure 18. b. Clustering of livestock disease burden using Manhattan distance metrics with single linkage.
Preprints 76262 g018
Figure 19. a Clustering of livestock disease burden using cosine distance metrics with single linkage.
Preprints 76262 g019
Figure 20. Performance measure of distance metrics with single linkage.
As is observed in Figure 20, both Euclidean and Manhattan distance metrics performed very well (98%) in single linkage however, cosine distance metrics perform very low(20%), the result revealed us both Euclidean and Manhattan preferable to compute distances of objects for grouping objects based up on similarities whereas cosine distance metrics more applicable for measuring of the relatedness of words in the document (Isa, Apallius, Ghislaine, Adriana, & Mara, 2021).

4. Conclusion

This paper analyzed the importance of Electronic Livestock Disease Recording (ELDR) systems for E-Surveillance and Disease Mapping. It found that Euclidean and Manhattan metrics performed well, while cosine distance metrics were low. ELDR systems facilitate the investigation of the prevalence and distribution of animal diseases in each region and can be integrated into the national surveillance system to investigate the incidence of widespread diseases. The ELDR dataset and cluster analysis technique has been used to identify the ideal disease clusters in Ethiopia, which can help reduce the risk linked with animal diseases. The analysis showed that each region is more prone to certain diseases, and the findings should help sectors create systems to reduce the risk linked with animal diseases.
For going deeper into the study, academics should have access to more cattle disease data, but this data is not reachable. ELHRs have shown promise in helping stakeholders gain insights about the distribution of livestock disease prevalence. However, there are limitations to the practice use of ELHRs, such as lack of data availability and lack of well-organized information. Hierarchical and k-means clustering algorithms were used to detect disease clusters, and the results showed that Euclidean and Manhattan distance metrics performed well. More funding and partnerships are needed for ELHR research to help the sector with higher precision and accuracy.

4.1. Recommendation

Despite the challenges, availability of aggregate data, and limited utilization of algorithms, the results were found encouraging. The prime objective of the study was to show how an appropriate livestock disease data management system facilitates e-surveillance and disease mapping using data analytics. The study lacks an exhaustive usage of parameters in selecting algorithms and conducting experiments, hence, we recommend interested researchers to investigate more in the area of disease prevalence with more data having more parameters.

Author Contributions

Conceptualization, investigation, data curation and formal analysis and writing original draft preparation Mohammed K, Reviewing Editing and Supervision Professor Druga Prasad Sharma and Doctor Hussein Seid W and technical support Amir Ibrahim. All authors have read and agreed to the published version of the manuscript. 35.

Funding

Currently: I am PhD scholars in software engineering at Addis Ababa Science & Technology University it is my PhD research work hence, no fund.

Ethical clearance

To accomplish the research, the necessary data was collected with the permission of Ministry of Agriculture of Ethiopia through official letter, upon requested by the University Ref No:A/A/S/T./U/C/E /14/21 accordingly, the researcher visited different selected veterinary clinics in the country.

Acknowledgments

We would appreciate and forward our gratitude to our collaborating organization specially Faculty of veterinary medicine of Addis Ababa University and East Showa Zone veterinary office administrators allowing us to conduct field observation in their vet clinic, and for facilitating to conduct different workshop. Thanks to Ethiopian Emerging biotechnology for sponsoring purchased Smartphones for field testing and organizing workshop.

Conflicts of Interest

This research work is my part of PhD research work there is no conflicts of interest among authors.

References

  1. FAO, UN. (2018). World Livestock: Transforming the livestock sector through the Sustainable Development Goals. Rome.
  2. Mwanga et al. (2020). How Information Communication Technology Can Enhance Evidence-Based Decisions and Farm-to-Fork Animal Traceability for Livestock Farmers. Hindawi, 2020, 12. [CrossRef]
  3. World Organization for Animal Health. (2017). Manual 6: Animal health information systems. Paris, France: OIE/Paloma Blandín.
  4. AGP-Livestock Market Development Project. (2013). Agricultural Growth Project - Livestock Market Development: Value Chain Analysis for Ethiopia.
  5. Central Statistics Agency FDRE. (2020). Report on livestock and livestock characteristics (private peasant holdings), Agricultural sample survey. Addis Ababa: Central Statistical Agency.
  6. Erkyihun ; et al. (2022). A review on One Health approach in Ethiopia. One Health Outlook, 4(8), 13. [CrossRef]
  7. FAO. (2021). Animal health services at work in Ethiopia -Evidence from Ada'a and Sululta district.Africa Sustainable Livestock 2050. Rome: FAO.
  8. Fu-Ru Lin et al. (2017). Applications of Cluster Analysis and Pattern Recognition for Typhoon Hourly Rainfall Forecast. Hindawi, Advances in Meteorology, 17. [CrossRef]
  9. Gebremedhin et al. (2017). Baseline survey report for the Regional Pastoral Livelihoods Resilience Project in Ethiopia. Addis Ababa: ILRI.
  10. Global animal health association. (2020). Digital Revolution in Animal Health: How Predict, Monitoring and Diagnostics Technologies are Enabling Tailored Care and better welfare for Animals. Global animal association.
  11. Hloušková, Z., & Lekešová, M. (2020). Farm outcomes based on cluster analysis of compound farm evaluation. Agric.Econ., 10.
  12. Idris A et al. (2021). Distal technologies and implications for veterinary services. Rome, Italy.
  13. Ishikawa et al. (2020). Cluster analysis to evaluate disease risk in periparturient dairy cattle. Animal Science, WILEY, 10. [CrossRef]
  14. Liao et al. (2016). Cluster Analysis and its Application to healthcare claims data: a study of end-stage renal disease patients who initiated hemodialysis. BMC Nephrology, 14. [CrossRef]
  15. Laura, Falzon C; et al. (2021). Electronic Data collection to enhance disease surveillance at slaughterhouses in smallholder production. Scientific Report, 11(19447), 13. [CrossRef]
  16. Ministry of Health, EFDR. (2022, October 14). info@moh.gov.et. Retrieved October Nov 7, 2022, from https://www.moh.gov.et/site/node/393.
  17. MoA, Ethiopia. (2021). A Livestock Information System Roadmap. Addis Ababa, Ethiopia: Ethiopian Ministry of Agriculture.
  18. Pieracci, E et al. (2016). Prioritizing zoonotic diseases in Ethiopia using a one health approach. Elsevier, 2, 5. [CrossRef]
  19. Rajib S et al. (2019). Pattern Recognition Using Clustering Analysis to Support Transportation System Management, Operations, and Modelling. Hindawi, Journal of Advanced Transportation, 12. [CrossRef]
  20. Solomon, Gizaw et al. (2020). Importance of livestock diseases identified using participatory epidemiology in the highlands of Ethiopia. Tropical Animal Health and Production, 52, 13. [CrossRef]
  21. United Nations. (2021). Technology and Innovation Report. United States of America: New York, United Nations Publications.
  22. Webster, A.J; et al. (2021). Characterization, identification, clustering, and classification of diseases. UK: University of Oxford.
  23. World Organization for Animals (OIE). (2015). World information. World Organization for Animals (OIE).
  24. Zhao et al. (2014). Topic modeling for cluster analysis of large biological and medical datasets. 11th Annual MCBIOS Conference, (p. 11). Stillwater, OK, USA. [CrossRef]
  25. Simon, C., & Suresh, N. (2022). Analysis framework for clustering algorithm selection with spectroscopy applications. PLOS ONE, 24. [CrossRef]
  26. Cao K, P. H. (2022). Identifying and validating subtypes of Parkinson's disease based on multimodal MRI data via hierarchical clustering analysis. Frontiers in Human Neuroscience, 13. [CrossRef]
  27. Koh, K.-Y., Ahmad, S., & Lee. (2022). Hierarchical Clustering on Principal Components Analysis to Detect Clusters of Highly Pathogenic Avian Influenza Subtype H5N6 Epidemic across South Korean Poultry Farms. Symmetry, 18. [CrossRef]
  28. Komaru, Y., Teruhiko, Y., Yoshifumi, H. M., & Nangaku. (2020). Hierarchical Clustering Analysis for Predicting 1-Year Mortality After Starting Hemodialysis. International Society of Nephrology. Published by Elsevier Inc, 8. [CrossRef]
  29. Rios, R., Tatiane, N. D., & Mello, A. R. (2022). Country transition index based on hierarchical clustering to predict the next COVID-19 waves. Scientific Reports, 13. [CrossRef]
Figure 1. Death Rate among Ethiopian Animals is Double the African Average (AGP-Livestock Market Development Project, 2013).
Preprints 76262 g001
Figure 2. Future Livestock Information System Roadmap for Ethiopia (MoA, Ethiopia, 2021).
Preprints 76262 g002
Figure 3. Process of constructing Agglomerative Hierarchical clustering.
Preprints 76262 g003
Figure 4. Current E- Livestock Disease Reporting System.
Preprints 76262 g004
Figure 5. The proposed Livestock Disease Data Management Framework for E-Surveillance.
Preprints 76262 g005
Figure 6. Seven top diseases reported during the year 2007-2015.
Preprints 76262 g006
Figure 7. Number of species at risk due to the diseases.
Preprints 76262 g007
Figure 8. Number of Species that died at each region due to BQ disease.
Preprints 76262 g008
Figure 9. Similarity and Dissimilarity Matrix using Pearson correlation using Python.
Preprints 76262 g009
Figure 10. Number of animals that died due to HS in each region.
Preprints 76262 g010
Figure 11. Clustering disease by case number.
Preprints 76262 g011
Figure 15. a. clustering of livestock disease burden using Euclidean distance metrics with complete linkage.
Preprints 76262 g015
Figure 16. b. Clustering of livestock disease burden using cosine distance metrics with complete linkage.
Preprints 76262 g016
Table 1. Description of sources of livestock data.
Sources of livestock disease data Ministry of Agriculture (MoA)
Selected Sources Livestock Sector
Data Management tool DOVAR (aggregated data)
Selected time from 2007 to 2015
Selected Species Five (Avian, Bovine, Caprine, Equine, and Ovine)
Selected Diseases Seven(African Horse Sickness (AHS), Black Quarter/leg (BQ) ,Contagious Bovine pleuroPneumonia (CBPP), Hemorrhagic Septicemia (HS), Lumpy Skin Disease (LSD), NewCastle Disease (NCD) and Sheep and Goat Pox (SGPX))
Number of animals affected 18333
Number of Animals at Risk 15570839
Disclaimer/Publisher’s Note: The statements, opinions and data contained in all publications are solely those of the individual author(s) and contributor(s) and not of MDPI and/or the editor(s). MDPI and/or the editor(s) disclaim responsibility for any injury to people or property resulting from any ideas, methods, instructions or products referred to in the content.
Copyright: This open access article is published under a Creative Commons CC BY 4.0 license, which permit the free download, distribution, and reuse, provided that the author and preprint are cited in any reuse.
Prerpints.org logo

Preprints.org is a free preprint server supported by MDPI in Basel, Switzerland.

Subscribe

© 2024 MDPI (Basel, Switzerland) unless otherwise stated